BUSINESS & POLITICS IN THE
MUSLIM WORLD
GLOBAL OPINION
REPORT NO. 518
Week:
January 01 - 06, 2018
Presentation:
January 11, 2018
Contents
........... Majority
of French now favor allowing surrogate motherhood: poll
........... What
would it take to get Brits to send their food back?
........... Which
newspaper websites get the most crossover readership?
........... Public
hugely overestimate how much land in the UK is densely built up
........... Most
Americans see value in steering children toward toys, activities associated
with opposite gender
........... Six in
10 Americans Took a Vacation in 2017
........... 2018 US
Politics - President Trump's Approval Rating Rose to 41% this Week (January 3)
........... Crossing
the Line: What Counts as Online Harassment?
........... ‘Particularly
good days’ are common in Africa, Latin America and the U.S.
INTRODUCTORY NOTE
This week report consists of ten surveys. One of these is a
multi-country study while the rest are national surveys from different states
across the globe.
518-43-11/COMMENTARY: ‘Particularly good days’ are
common in Africa, Latin America and the U.S.
‘Particularly good days’ are common
in Africa, Latin America and the U.S.
 If you
live in sub-Saharan Africa, Latin America or the United States, you are more
likely than people in other regions of the world to say you’re having a
particularly good day.
If you
live in sub-Saharan Africa, Latin America or the United States, you are more
likely than people in other regions of the world to say you’re having a
particularly good day.
For the past several years, Pew Research Center’s annual Global Attitudes Survey has started with the following question: “How would you describe your day today – has it been a typical day, a particularly good day or a particularly bad day?” In 2017, we asked this question of nearly 42,000 people in 38 countries around the globe.
Although most people worldwide described their day as typical (median of 62%) and relatively few described it as particularly good (median of 30%), people in sub-Saharan Africa and Latin America were more likely to view their day positively. Roughly half of Africans (median of 49%) and Latin Americans (48%) surveyed said their day was particularly good. Other regions – especially Europe (73%) – overwhelmingly described their day as typical; only 22% of Europeans said their day was good.
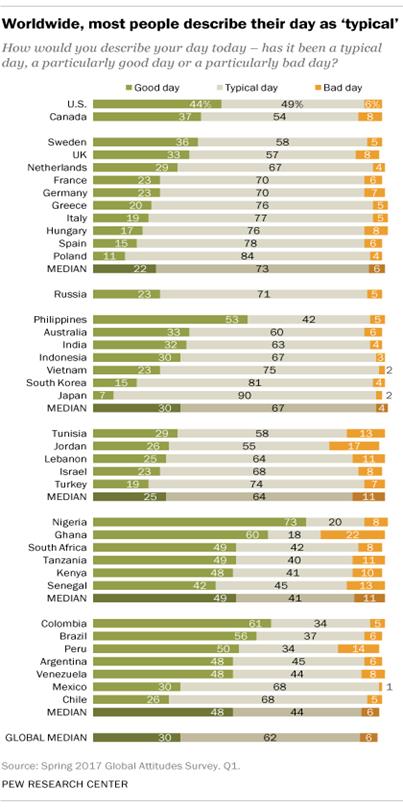
The share of upbeat people was notably higher in several countries surveyed. Half or more responded that their day was good in Nigeria (73%), Colombia (61%), Ghana (60%), Brazil (56%), the Philippines (53%) and Peru (50%).
The U.S. stands out for its positivity among Western countries, with 44% saying their day was particularly good. American conservatives (48%) and moderates (47%) were significantly more likely than liberals (34%) to describe their day as good.
Why would we ask such a conversational question as part of an in-depth research project? As survey researchers, we spend a lot of time thinking about how best to write and organize our questionnaires. We kick off the Global Attitudes Survey with this type of question for a couple of reasons: First, asking people about their day is a pleasant way to start an interview, and it helps build rapport between the interviewer and respondent. Second, starting with an easy-to-answer question helps respondents get comfortable with the format of the survey. As the survey continues, we introduce more difficult questions – but still make an effort to intersperse easier or more interesting questions among the harder ones.
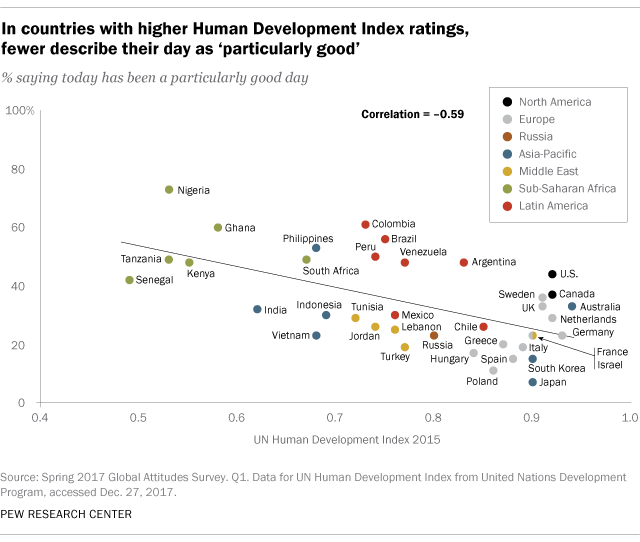
Perhaps surprisingly, responses to this question were negatively correlated with one measure of national well-being, the United Nations’ Human Development Index (HDI). Countries with higher HDI scores have, on average, higher gross national income per capita, longer expected lifespans and higher educational expectations and attainment. Yet people in countries with higher HDI scores are less likely to say their day has been particularly good. In 2014, we similarly found that a country’s GDP per capita was negatively correlated with the percentage of people who said their day was good.
SUMMARY OF POLLS
West Europe
Majority
of French now favor allowing surrogate motherhood
PARIS
(Reuters) - A majority of French people would favor allowing surrogate
motherhood, though primarily only for medical reasons, a poll showed on
Wednesday, highlighting a shift in attitudes as France prepares to review laws
relating to assisted reproduction. (Reuters)
January 3, 2018
What would it take to get Brits to send their food back?
Four in ten Brits say they are uncomfortable with sending food back
if there is a problem with it when eating out (YouGov)
January
5, 2018
Which newspaper websites get the most crossover readership?
YouGov Profiles looks
at daily visitors to newspaper websites and which other publications’ sites
they frequently visit (YouGov)
January
3, 2018
41% of homeowners say they would support action to bring local
house prices down a moderate amount
New YouGov results could offer hope for
those who are priced out of the housing market, with a significant number of
homeowners saying they are willing to see house prices fall locally. (YouGov)
January 2, 2018
Public
hugely overestimate how much land in the UK is densely built up
In December 2017
the Royal Statistical Society (RSS) released their ‘UK
Statistic of the Year’.
The statistic was 0.1%, the proportion of land area in the UK which is densely
built up. Following on from this, Ipsos MORI asked
the British public what percentage of land in the UK they think is densely
built up. The findings show the public hugely overestimate the figure with a
mean guess of 47%. (Ipsos)
January 3, 2018
North America
Most
Americans see value in steering children toward toys, activities associated
with opposite gender
Parents
navigating the toy aisle this holiday season may notice that some retailers and
manufacturers have moved away from
marketing toys specifically toward boys or girls. While this recent trend
has drawn some
criticism,
most Americans say it’s good for parents of young boys and girls to encourage
their children to play with toys and participate in activities that are
typically associated with the opposite gender. (Pew Research Centre)
December 19, 2017
Six
in 10 Americans Took a Vacation in 2017
WASHINGTON, D.C.
-- Sixty-two percent of Americans reported taking a vacation away from home in
the past year, lower than what Gallup measured in 2001 but similar to what was
recorded in 2005. (Gallup USA)
January 3, 2017
2018
US Politics - President Trump's Approval Rating Rose to 41% this Week
With the
holidays and President Trump's first major legislative win with Tax Reform,
President Trump's approval rating rose to 41% this week, a 6-point increase
from last week. Despite the passage of tax reform, just 41% of Americans
approve of President Trump's handling of taxation and just a quarter of
Americans (25%) approve of Congress as a whole. Americans are much more
generous with their individual representatives, with 44% approving of their
Congressperson (Ipsos).
January 03, 2018
Crossing
the Line: What Counts as Online Harassment?
Pew Research
Center surveys have found that online harassment is a common
phenomenon
in the digital lives of many Americans, and that a majority of Americans feel
harassment online is a major problem. Even so, there is considerable debate
over what online harassment actually means in practice (Pew Research Center).
January 04, 2018
Multi-Country
‘Particularly
good days’ are common in Africa, Latin America and the U.S.
If you live in
sub-Saharan Africa, Latin America or the United States, you are more likely
than people in other regions of the world to say you’re having a particularly good
day (Pew Research Center).
January 02, 2018
518-43-1/POLL
WEST EUROPE
Majority of French now favor allowing surrogate motherhood: poll
PARIS (Reuters) - A majority of French people
would favor allowing surrogate motherhood, though primarily only for medical
reasons, a poll showed on Wednesday, highlighting a shift in attitudes as
France prepares to review laws relating to assisted reproduction.
All forms of surrogacy, where a woman gives birth to a child on
behalf of someone else, are banned in France, as in several other European
countries such as Germany. Some countries like the United Kingdom allow for
altruistic surrogacies, not commercial ones.
The French government will launch a debate on a new bioethics
legislative pact this year, which could see medically assisted reproduction
extended to female gay couples and single women, a stance favored by President
Emmanuel Macron.
He opposes introducing
surrogate motherhood, however.
Until recently public opinion was also against surrogacy, but
the poll by Ifop, published in La Croix, a Catholic
newspaper, found that 62 percent of French people were now in favor of it.
Of those, 46 percent would only back surrogate motherhood if
there were medical reasons to do so, while 18 percent said they supported it in
all circumstances.
In a similar poll last September, 52 percent of French people
rejected surrogacy under any form, versus 36 percent now.
France’s previous Socialist government legalized same-sex
marriage in 2013, drawing a strong unexpectedly show of opposition in the
run-up to the law from conservatives, especially Roman Catholics, and large
street protests.
France’s highest court has since made it easier for children born
through surrogacy abroad to a same-sex couple to be recognized as citizens and
adopted by the partner of the child’s biological father.
Reporting by Sarah
White Editing by Jeremy Gaunt
518-43-2/POLL
What would it take to get Brits to send their food back?
Four in ten Brits say they are uncomfortable with sending food back
if there is a problem with it when eating out
Listen closely enough in any British eaterie
and sooner or later you will doubtless overhear someone quietly complaining
about their food to their dining companions, only for them to declare
everything is fine to any serving staff who ask how
their meal is.
Now new research from YouGov
Omnibus reveals how reluctant many Brits are to complain about problems with
their dining experience.
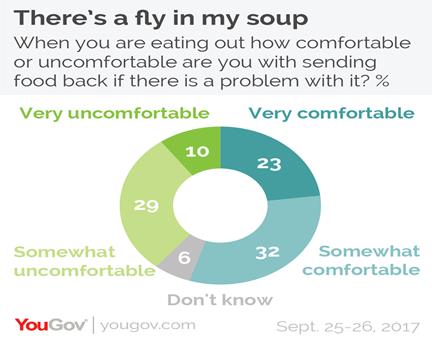
The results uncover that as many as four in ten Brits
(39%) say they would feel uncomfortable sending food back if there was a
problem with it (including 10% who would feel very uncomfortable).
Nevertheless, the majority of Brits (55%) say they would not be phased by having to complain about their food.
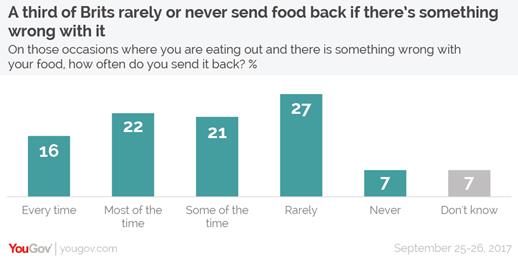
On those occasions where people are confronted with a
problem with their meal, 38% of Brits are generally assertive about the issue,
saying they send food back every time or most of the time. A further 21% send
it back some of the time, while 34% say they only
rarely or even never complain. Among those who are uncomfortable with sending
food back, this final figure rises to 49%.
That isn’t to say that those who feel uncomfortable
sending food back are pushovers, however. YouGov put
11 imperfect-food scenarios to people and asked whether they would or would not
send the food back in each instance, and in five the majority of those who
don’t generally feel comfortable returning food to the kitchen would be willing
to speak up for themselves.
Brits are most likely to send food back if they had
received the wrong meal (92%, including 94% of those who are uncomfortable
sending food back) or their food was undercooked (90%, including an identical
proportion of those uncomfortable sending food back).
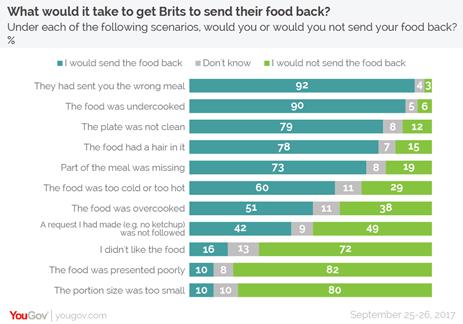
At the other end of the scale, Brits are least likely to
kick up a fuss if their portion size was too small (10%), their food was poorly
presented (also 10%) or they didn’t like the food (16%). Among those who are
uncomfortable sending food back these figures were 3%, 4% and 6% respectively.
The biggest differences between those who are
comfortable/uncomfortable sending food back are over overcooked food and food
being too hot or cold. Two thirds (66%) of people who say they are comfortable
with sending food back would send back overcooked food, compared to just 34% of
those who find sending food back discomfiting (a difference of 32%).
Likewise, three quarters (75%) of people who aren’t put
out by returning food would send back food for being too hot or cold, compared
to 45% of those who find it uncomfortable (a difference of 30%).

518-43-3/POLL
Which newspaper websites get the most crossover readership?
YouGov Profiles looks at daily visitors to newspaper websites and which
other publications’ sites they frequently visit
Follow
@YouGov on twitter and stay up to date with the
latest news and results Follow
The national newspaper market in the UK has always been a
crowded one, and with the advent of the internet newspapers must fight harder
than ever to attract eyeballs.
Using data from the YouGov
Profiles tool, we looked at how many people who are daily visitors to specific
newspaper websites are also frequent (at least weekly) visitors to other
newspaper websites.
The results show that the Daily Mail and the Guardian
receive the highest levels of crossover visitors from other titles in general –
unsurprising given they are two of the world’s most visited newspaper websites
– while the Star, FT and the i receive the lowest levels.
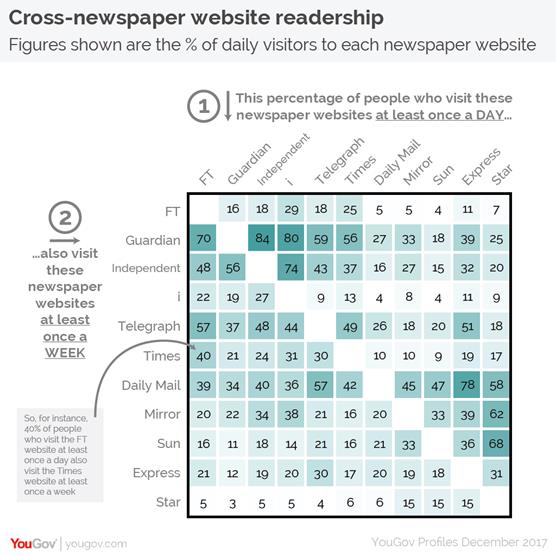
Daily visitors to the Independent website are the most
likely to be frequent visitors to another newspaper website, with 84% heading
over to the Guardian website at least once a week.
At the other end of the spectrum, Daily Mail website
visitors are the least likely to stray. Among those who do, The Guardian is
again the most popular destination, but only 27% visit the publication at least
once a week.
Crossover traffic is a one way street
for some newspaper websites
There is a noticeable trend whereby readers of smaller
publications also visit similar, larger, titles – possibly because of the
relative scarcity of content on their preferred sites. Aside from the
Independent readers heading to the Guardian, the results show 74% of i readers
also looking in on the Independent, 78% of Express readers additionally visiting
the Daily Mail website and 68% of Star readers frequently browsing the Sun
website.
These relationships are not reciprocal, however. Only 15%
of Sun readers check in on the Star website, and likewise only 20% of Daily
Mail readers visit the Express website. The majority (56%) of
Guardian readers do also visit the Independent website frequently, but
this is still far below the 84% of Indy readers going the other way.
And while the i may have been
spun out of the Independent, the younger publication does not appear to have
taken a significant level of the older paper’s readers with it: only 27% of
daily Independent readers check out the i at least once a week. Nevertheless,
daily Independent readers are still the most likely to make at least a weekly
visit to the i website.
The hard paywall at the Times
looks like it may well be impacting crossover readership, attracting
significantly fewer crossover visitors from broadsheet rivals the Guardian,
Independent and Telegraph than vice versa.
In fact, it is daily Financial Times readers who are the
most likely to crossover to the Times, at 40%. The FT has its own paywall (albeit a soft one), suggesting that many visitors
are subscribers to more than one news website.
There are instances, however, where the lack of crossover
readership might be seen in favourable terms. The
data reveals the savvy behind behind Trinity
Mirror's current bid for Northern & Shell (who own the Express and the
Star): with only 18% and 15% of frequent Mirror visitors also checking in on
the Express and the Star websites respectively, the acquisition would create a
much more diverse news portfolio.
518-43-4/POLL
41% of homeowners say they would support action to bring local house prices down a moderate amount
New YouGov results could
offer hope for those who are priced out of the housing market, with a
significant number of homeowners saying they are willing to see house prices
fall locally
In recent months, the government has made several pledges
to get to grips with Britain's housing problems. In mid-November Theresa May
pledged to take “personal charge” of fixing the housing crisis, and at the
Budget in November Philip Hammond announced a raft of new measures
designed to stimulate new housebuilding and improving
affordability.
With the need for large numbers of new homes after 30-40
years of underdevelopment widely acknowledged, YouGov
examines the levels of support among the British public for the government
attempting to build more homes and bringing house prices down.
Please note: a long-observed phenomenon surrounding housebuilding is “NIMBY”ism (or
“Not In My Back Yard”) – the attitude many people have that building new things
like houses or railways is a good thing, so long as it doesn’t happen anywhere
near them. While YouGov has examined attitudes towards changes in house
prices and house building at both a local and a national level, to try and take
into account the likely impact of NIMBYism this
article only discusses the local level results.
Reducing
house prices
Overall, around half (49%) of Britons say they would back
the government attempting to bring house prices down a lot in their local area,
compared to over a third (36%) who would reject such a move. Unsurprisingly,
homeowners and non-homeowners feel very differently about the prospect, with
homeowners opposing by 51% to 35% while non-homeowners would support such a
move by 68% to 14%.
There is marginally higher support for attempting to
bring down house prices by a moderate amount (52% versus 31%). Again, 68% of
non-homeowners would be in favour of it, but support among homeowners rises to
41% (although a plurality of 45% still don't want it
to happen).
Conversely, there is strong opposition to house prices
increasing. While just a quarter (24%) of homeowners back prices going up
a little in their local area, six in ten (60%) oppose. Similarly, while
only 17% support prices increasing by a moderate amount, two thirds (68%)
are against it. Only 9% would support pushing them up a lot.
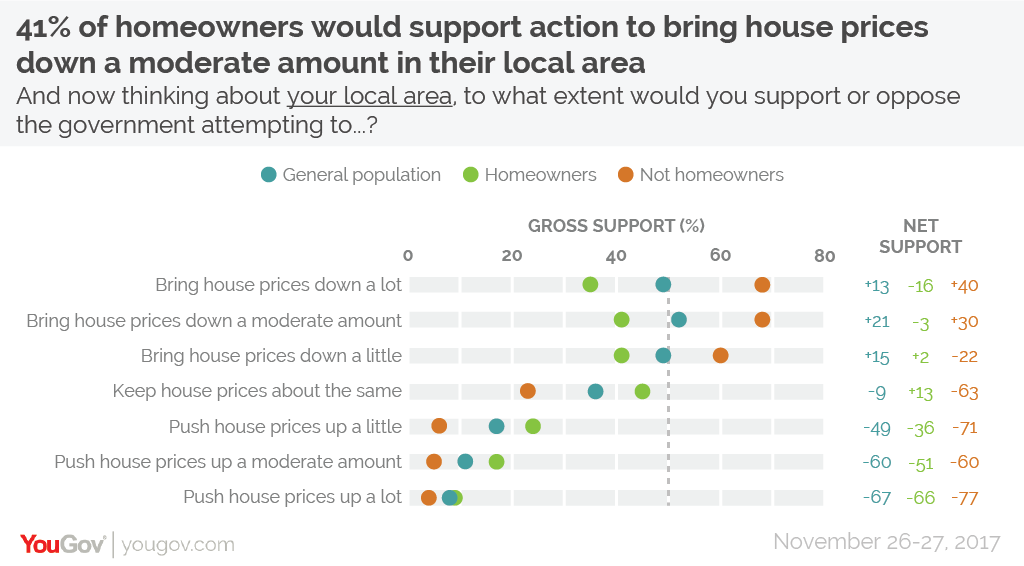
The policy homeowners are most likely to support
would be maintaining house prices at their current level (45% in favour
versus 38% against). However, this is offset by the fact that non-homeowners
are opposed to it by 54% to 23%. Similarly, the population
as a whole are against keeping house prices the same by 45% to 36%.
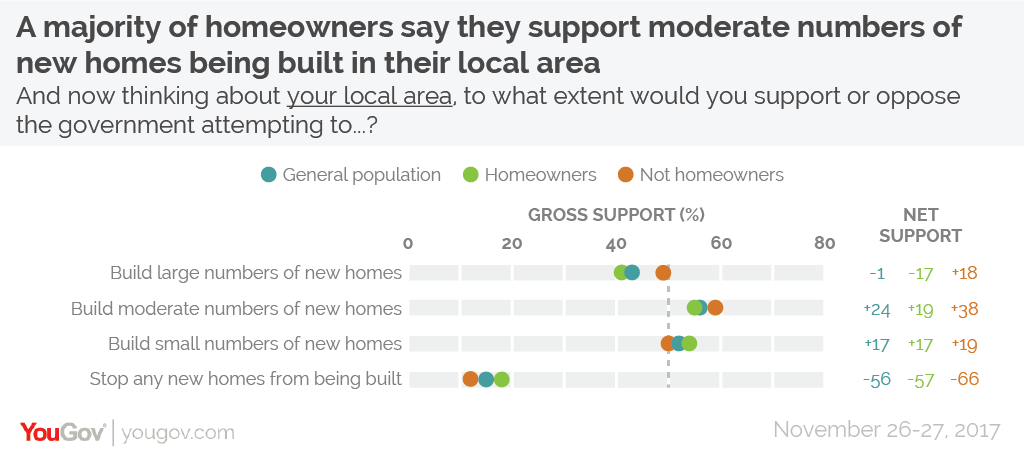
Building new homes
Among the population at large there is a higher level of
support for building a moderate number of new homes (56%) in their local area
than a large number (43%). Unlike with attitudes towards house price changes,
there is far less of a difference between homeowners' and non-homeowners'
opinions when it comes to the prospect of new homes being built in their local
area (for instance, 55% of homeowners support moderate numbers of new homes,
compared to 59% of non-homeowners). However, it is worth pointing out that
homeowners are more likely than non-homeowners to specifically oppose new homes
being built, whereas non-homeowners are more likely to give a “don’t know”
answer.
518-43-5/POLL
Public
hugely overestimate how much land in the UK is densely built up
New Ipsos MORI
research shows the public are very wrong about the ‘UK Statistic of the Year’.
2 January 2018
In December 2017 the Royal Statistical
Society (RSS) released their ‘UK Statistic of the Year’. The statistic was 0.1%, the proportion of land area in
the UK which is densely built up.
Following on from this, Ipsos MORI asked the British public what percentage of land
in the UK they think is densely built up. The findings show the public hugely
overestimate the figure with a mean guess of 47%.
Bobby Duffy,
Managing Director of Ipsos MORI Social Research
Institute, London, said:
People are way out
in their estimate of how much of the country is densely built up, thinking
around half the country is when actually on 0.1% is. This will partly
reflect the way we live – the majority of people live and spend their time in
built-up areas and this will make up most of their mental image of the country.
Technical Note
Ipsos interviewed 1,125 adults aged 16-75 in the UK using the Ipsos Online panel system. Interviews were conducted online between 19-22 December 2017.
Data have been weighted by age, gender, region, working
status, social grade and highest education level to the known offline
population profile.
Download
Source: https://www.ipsos.com/ipsos-mori/en-uk/public-hugely-overestimate-how-much-land-uk-densely-built
518-43-6/POLL
North America
Most
Americans see value in steering children toward toys, activities associated
with opposite gender
(FGorgun/Getty Images)
Parents navigating
the toy aisle this holiday season may notice that some retailers and
manufacturers have moved away from
marketing toys specifically toward boys or girls. While this recent trend
has drawn some criticism,
most Americans say it’s good for parents of young boys and girls to encourage
their children to play with toys and participate in activities that are
typically associated with the opposite gender.
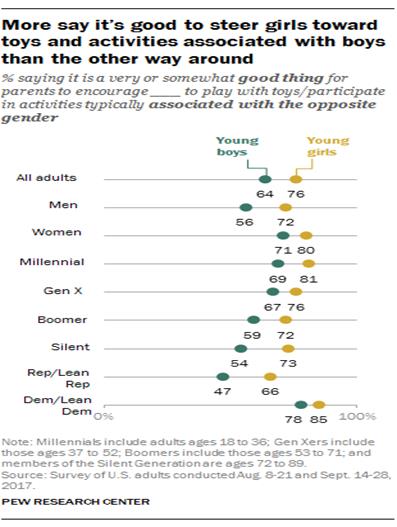
About
three-quarters of the public (76%) says it is a somewhat or very good thing for
parents to steer girls toward boy-oriented toys and activities, according to
a Pew Research Center survey conducted in August and September. A smaller share,
but still a majority (64%), says parents should encourage boys to play with
toys and participate in activities usually associated with girls. Across
genders, generations and political groups, more say girls should be encouraged
to play with toys and participate in activities that break with gender norms
than say the same about boys, and this is particularly the case among men,
older adults and Republicans.
Solid
majorities of women say it’s a good thing for parents to encourage girls (80%)
and boys (71%) to play with toys or participate in activities that are
typically associated with the other gender. Among men, however, there is a
16-percentage-point gap between those who say this is a good thing when raising
girls (72%) and those who say the same about raising boys (56%).
When
it comes to raising girls, Millennials are somewhat
more likely than Gen Xers, Baby Boomers and those in
the Silent Generation to say parents should encourage their daughters to play
with toys and participate in activities that are typically associated with
boys. But majorities of seven-in-ten or more across all four groups see this as
a good thing. Smaller shares across generations see value
in encouraging boys to
play with toys and participate in activities that are typically associated with
girls, although Millennials (69%) and Gen Xers (67%) are
more likely than those in the Baby Boom (59%) and Silent (54%) generations to
see this as a good thing.
Democrats
and Republicans are more likely to say it’s good for girls than to say it’s
good for boys to be encouraged to play with toys or participate in activities
typically associated with the opposite gender. But Republicans and
Republican-leaning independents make more of a distinction between what’s good
for girls compared with boys. While 66% of Republicans say it’s a good thing to
encourage girls to engage in boy-oriented activities, only 47% say it’s good to
take a gender-neutral approach with boys. About half (52%) of Republicans say
it’s a very or somewhat bad thing for parents to steer young boys toward toys
and activities typically associated with girls.
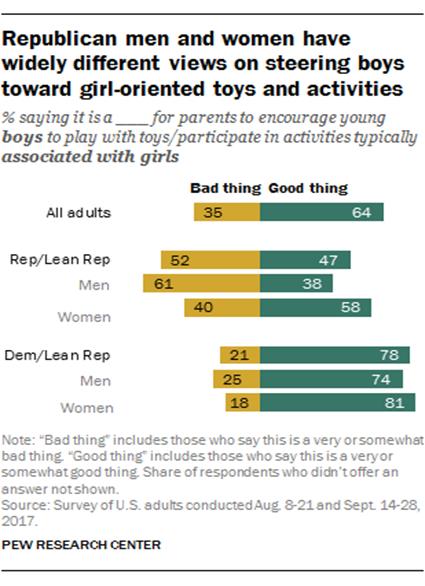
Republican
men are particularly resistant to the idea of boys playing with toys and
participating in activities that are typically associated with girls. About
six-in-ten Republican men (61%) say it’s a bad thing for
parents to encourage young boys to do this, while just 38% say this is a good
thing. In contrast, a majority of Republican women (58%) see this as a good
approach for raising boys.
Among
Democrats and those who lean Democratic, 85% say it’s a good thing for parents
to encourage young girls to play with toys or take part in activities that are
normally associated with boys, and 78% say it’s good to encourage young boys to
engage in girl-oriented activities.
518-43-7/POLL
Six in 10 Americans Took a Vacation in 2017
by Justin McCarthy
STORY
HIGHLIGHTS
·
62% report having taken a vacation away
from home in past year
·
Down from the 70% who said they took a
vacation in 2001
·
Income, employment status related to
vacation taking
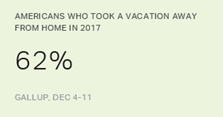
WASHINGTON, D.C. -- Sixty-two percent of Americans
reported taking a vacation away from home in the past year, lower than what
Gallup measured in 2001 but similar to what was recorded in 2005.
U.S. Adults Who Took a Vacation Away From Home in Past Year, by
Employment Status
In the past year, have you taken a vacation away from home or
not?
|
National
adults |
Employed |
Not
employed |
|
|
% Yes |
% Yes |
% Yes |
|
|
2017 Dec 4-11 |
62 |
69 |
55 |
|
2005 Dec 5-8 |
64 |
71 |
53 |
|
2001 Dec 6-9 |
70 |
74 |
64 |
|
GALLUP |
|||
Gallup first asked Americans about their past year's
travels using this question format in 2001, when seven in 10 reported having
taken a vacation that year. When the question was next asked, in 2005, the
figures were similar to what they are today.
Separately, about one in five Americans (21%) report
having traveled internationally over the past year, a figure that has been
stable compared with the 19% recorded in the prior two polls.
The latest figures are from a Dec. 4-11 Gallup poll,
which also asked about Americans' intentions to take vacation time over the
holidays. In contrast to the decline in the percentage of Americans who say
they took a vacation in the past year, Americans were more likely this past
December than in 2000 to say they planned to take
vacation time over the holidays. The dissimilar
trends may be due to the difference in question wording -- with one question
asking Americans about their future vacation plans and the other asking them to
report on their past vacations. It is also possible that holiday vacationing
may have become more common even while people are vacationing less overall.
Employment status is a major factor in Americans'
vacation habits. Nearly seven in 10 employed Americans (69%) reported having
taken a vacation, while slightly more than half of those who are not employed
(55%) reported having taken such trips. The percentage of employed adults who
took a vacation in the past year is down slightly from the 74% recorded in
2001. Additionally, the U.S. employment-population ratios is
about is lower than it was in 2001, according to the Bureau of Labor
Statistics.
The decline in vacation-taking since 2001 recorded by
Gallup aligns with research conducted by Oxford Economics, which found a sharp
decline since 2000 in the average number of vacation days American workers were
taking each year. The study has, however, found a slight uptick in vacation
days taken between 2014 and 2016, so the trend could be changing course if this
continues.
Income,
Education, Marital Status and Age Also Factor In Travel
Taking
a vacation is clearly related to Americans' socioeconomic
status. More than four in five adults with
annual household incomes of $75,000 or more say they took a vacation away from
home over the past year (82%) -- a much greater percentage than Americans in
the lower two income brackets took. Among Americans whose household income was
less than $30,000, slightly more than a third (37%) reported having taken a
vacation.
Four in five Americans who have college degrees reported
having taken a vacation in the past year, compared with slightly more than half
of those who are not college graduates (54%).
Americans Who Took a Vacation Away From Home in 2017, by Group
In the past year, have you taken a vacation away from home or
not?
|
%
Yes |
%
No |
|
|
National adults |
62 |
38 |
|
$75,000+ |
82 |
18 |
|
$30,000-$74,999 |
57 |
43 |
|
Less than $30,000 |
37 |
63 |
|
College graduate |
80 |
20 |
|
Not a college
graduate |
54 |
46 |
|
Married |
70 |
30 |
|
Unmarried |
54 |
46 |
|
Has children
under 18 |
65 |
35 |
|
Does not have
children under 18 |
60 |
40 |
|
18-29 |
65 |
35 |
|
30-49 |
65 |
35 |
|
50-64 |
61 |
39 |
|
65+ |
51 |
49 |
|
GALLUP, DEC. 4-11, 2017 |
||
There is also a marked difference in vacation habits by
marital status: while seven in 10 married adults (70%) took a vacation this
past year, only 54% of unmarried adults did the same. Americans with children
under 18 (65%) were slightly more likely than those without children under 18
(60%) to report having taken a vacation.
Bottom Line
Though U.S. spending and sentiments about the economy
improved in 2017, that didn't translate into more Americans taking vacations
than in the past. This trend could be cause for concern given that Gallup has
previously noted that Americans who take time for regular trips or vacations
with family and friends have significantly greater well-being than those who do
not - and the difference exists across all income groups. Additionally, Gallup
has found that engaged employees report having taken slightly more vacation
time in the past year than employees who are not engaged or who are actively
disengaged.
The decline in vacation taking is in part due to the
decrease in the percentage of Americans who are employed -- a group that is
more likely to take trips away from home -- but vacation taking has waned among
both employed and unemployed subgroups since 2001.
Some
researchers detect a change in the trend of declining vacation time. This could
be related to more options to work remotely during vacation, which, for many,
allows them more vacation time overall.
About
three in 10 U.S. workers report having not taken a vacation away from home in
the past year. Employers might do well to examine how to encourage vacation
time in a way that benefits their workforce's engagement as well as their
employees' overall well-being, including such radical policies as having no
vacation policies at all.
518-43-8/POLL
2018 US Politics - President Trump's Approval Rating Rose to 41% this Week (January 3)
President Trump’s approval rating is now 41%.
With the holidays and President Trump's first major legislative win with Tax Reform, President Trump's approval rating rose to 41% this week, a 6-point increase from last week. Despite the passage of tax reform, just 41% of Americans approve of President Trump's handling of taxation and just a quarter of Americans (25%) approve of Congress as a whole. Americans are much more generous with their individual representatives, with 44% approving of their Congressperson.
Looking ahead to the 2018 midterm elections, a plurality of Americans (38%) report that if the election for U.S. Congress were held today they would vote for the Democratic candidate compared to those who would vote Republican (31%). Independents are split between a Democratic (15%), a Republican (14%) and third-party candidate (18%). Currently, just one-in-ten (11%) Americans report they would not vote.
Healthcare (18%) continues to top the charts of the most important problem facing America today, followed by terrorism (14%) and the economy (13%). Democrats are much more likely to view healthcare (25%) as a major concern, followed distantly by the economy (13%). Republicans view terrorism (22%) as the most important problem, followed by healthcare (13%). Independents are equally concerned with healthcare (16%) and the economy (16%).
These are
findings from an Ipsos poll conducted for Thomson
Reuters November December 29-January 2, 2017. For the survey, a sample of
1,770 Americans, including 749 Democrats, 624
Republicans, 229 Independents ages 18+ were interviewed online.
Source: https://www.ipsos.com/en/2018-us-politics-president-trumps-approval-rating-rose-41-week-january-3
518-43-9/POLL
Crossing the Line: What Counts as Online
Harassment?
Americans agree that certain behaviors constitute online
harassment, but they are more divided on others
Pew Research Center surveys have found that online harassment is a common phenomenon in the digital lives of many Americans, and that a majority of Americans feel harassment online is a major problem. Even so, there is considerable debate over what online harassment actually means in practice.
In an effort to examine more deeply where people “draw the line” when it comes to online harassment, the Center conducted a survey in which respondents were presented with fictional scenarios depicting different types of escalating online interactions. The survey then asked them to indicate which specific elements of the story they considered to be harassment.
Their answers indicate that Americans broadly agree that certain behaviors are beyond the pale. For instance, in various contexts most agree that online harassment occurs when people make direct personal threats against others. At the same time, the public is much more divided over whether or not other behaviors – such as sending unkind messages or publicly sharing a private conversation – constitute online harassment.
In two vignettes, respondents were asked if and when the social media platforms where the incidents were occurring should have stepped in and addressed the unfolding events. Again, majorities agree that the platforms should step in to address behaviors such as threatening messages. But public views are more split when it comes to the responsibilities of the platforms at other points in these incidents.
Scenario 1: A private disagreement between friends
that becomes public and escalates in severity
People’s perceptions of online harassment incidents can often depend on who is involved in the conflict, as well as whether that conflict plays out publicly or in private. The first scenario in the survey presented respondents with an example of a private disagreement between a fictional character named “David” and his friend over a sensitive political issue. The conversation begins in a private messaging thread but then becomes public and escalates in severity:
“David and his friend are messaging privately about a sensitive
political issue on which they disagree. David says something that offends his
friend, who forwards the conversation to some people they know. One of those
people shares the conversation publicly on a social media account, and David
receives unkind messages from strangers. The original conversation is then
reposted on an account with thousands of followers, and David receives messages
that are vulgar. Eventually someone posts David’s phone number and home address
online, and David starts to receive threatening messages.”
The vast majority of Americans (89%) agree that David does experience online harassment at some point in this conflict. Just 4% feel that he does not experience online harassment at least somewhere during the episode, and 7% say they are not sure if he was harassed or not. Although there are some modest demographic differences on this question, sizable majorities of Americans across a wide range of groups agree that this scenario as a whole does in fact involve online harassment.
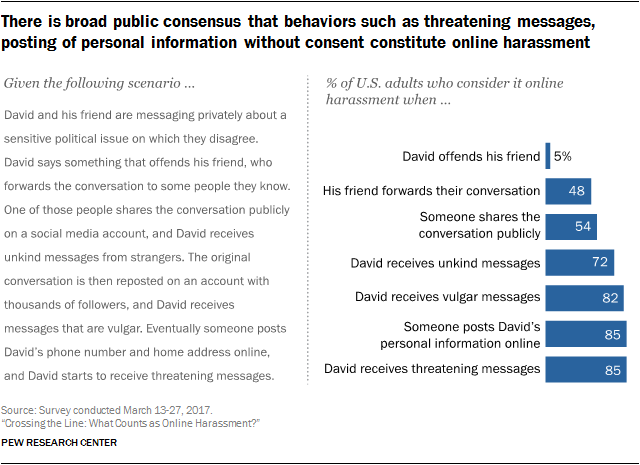
When asked to identify which specific elements of the scenario they consider online harassment, only a small share of Americans (5%) think the initial disagreement when David offends his friend qualifies. The public is more evenly divided on the next two elements of the scenario: 48% think it constitutes online harassment when David’s friend forwards their private conversation to other people, while 52% do not deem it harassment. Similarly, 54% say it counts as harassment when someone then shares the conversation publicly on social media, while 46% think it does not.
There is relatively broad consensus on the remaining elements of the scenario. Substantial shares of Americans think David experiences online harassment when he begins to receive unkind messages from strangers (72%), when those messages become vulgar (82%), when his personal information is posted online (85%), and when he starts to receive threatening messages (85%).
Views of this scenario differ little
based on the gender of the main character
The gender of the scenario’s lead character has little impact on Americans’ perceptions of whether online harassment did or did not occur in this situation. A separate group of respondents was given an identical scenario to consider but with a woman as the lead character instead of a man. Some 91% of Americans feel that the scenario involving a female protagonist qualifies as online harassment, compared with 89% in the scenario involving a man. And their responses to the specific elements of the story are also nearly identical in each version.
Scenario 2: Harassment involving
sexism
The second scenario in the survey used a story involving a character named Julie to explore how Americans view online harassment issues involving sexism and sexual harassment:
“Julie posts on her social media account, defending one side of a controversial political issue. A few people reply to her, with some supporting and some opposing her. As more people see her post, Julie receives unkind messages. Eventually her post is shared by a popular blogger with thousands of followers, and Julie receives vulgar messages that insult her looks and sexual behavior. She also notices people posting pictures of her that have been edited to include sexual images. Eventually, she receives threatening messages.”
As was true in the preceding scenario, the vast majority of Americans (89%) agree that Julie does indeed experience online harassment at some point in this scenario. Another 6% feel that Julie was not harassed at any point in the encounter, while 5% say they are unsure if this scenario involves harassment or not.
And as was the case in the preceding scenario, the public has differing views on which aspects of this story represent online harassment. A very small share of Americans (3%) think Julie’s initial disagreement with her friends counts as online harassment. Some 43% consider it harassment when she begins to receive unkind messages, while around one-in-five (17%) consider it harassment when her post is shared by the popular blogger with thousands of followers. Meanwhile, substantial majorities of Americans think Julie is being harassed when she receives vulgar messages about her looks and sexual behavior (85%), when her picture is edited to include sexual images (84%), and when she receives threatening messages (85%).
Along with asking respondents to identify which specific elements of this scenario count as online harassment, this scenario included a second set of questions about when – if it all – people think the social media service where this incident was occurring should have stepped in to address the behaviors in question. These findings indicate that the public has a somewhat different standard for behaviors that constitute online harassment, as opposed to behaviors that necessitate a response from online platforms.
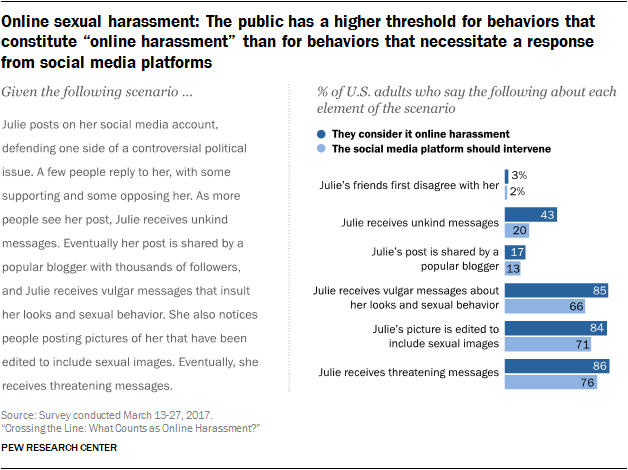
For example, some 43% of Americans consider it to be online harassment when Julie receives unkind messages from the people reading her post – but just 20% think that the platform should have stepped in to address that behavior when it occurred. The public’s attitudes diverge in similar ways on some of the more severe behaviors in the scenario. Most prominently, 85% of Americans think that Julie experiences online harassment when she begins to receive vulgar messages about her looks and sexual behavior. But substantially fewer (although still a majority at 66%) think that the social media platform has an obligation to step in and address that behavior.
Women are more likely
than men to view certain behaviors in this scenario as harassing
The vast majority of both men and women feel that Julie does in fact experience online harassment in this scenario. But at the same time, men and women respond somewhat differently to some of the specific elements of the scenario. Most notably, women are roughly three times as likely as men to consider it online harassment when Julie’s post is shared on social media by the blogger (24% vs. 9%), and they are also substantially more likely to consider it harassment when Julie first begins to receive unkind messages (50% vs. 35%). And although roughly eight-in-ten men consider it harassment when Julie receives vulgar messages, when she sees people editing her picture to include sexual imagery, and when she receives threatening messages, in each case that point of view is shared by roughly nine-in-ten women.
Scenario 3: Harassment involving
racism
The final scenario in the survey used a story involving a character named John to explore how Americans view online harassment issues in the context of racially motivated content. This scenario is nearly identical to the preceding one involving “Julie” and sexual harassment but with racial rather than sexual overtones:
“John posts on his social media account,
defending one side of a controversial political issue. A few people reply to
him, with some supporting and some opposing him. As more people see his post,
John receives unkind messages. Eventually his post is shared by a popular
blogger with thousands of followers, and John receives vulgar messages that
make racial insults and use a common racial slur. He also notices people
posting pictures of him that have been edited to include racially insensitive
images. Eventually, he receives threatening messages.”
In many ways, Americans’ views on this scenario mirror those in the previous scenario involving sexual harassment. Fully 85% of adults believe John experiences online harassment in this scenario, while 6% feel he does not face harassment, and 10% are unsure if this scenario involves online harassment or not.
They also respond in largely similar ways when asked which specific elements of the story constitute harassment. Very few Americans think that John’s initial social media argument constitutes online harassment, but sizable majorities agree that John experiences harassment when he receives vulgar messages with racially insulting language (82%), when his picture is edited to include racially insensitive images (80%), and when he receives personal threats (82%).
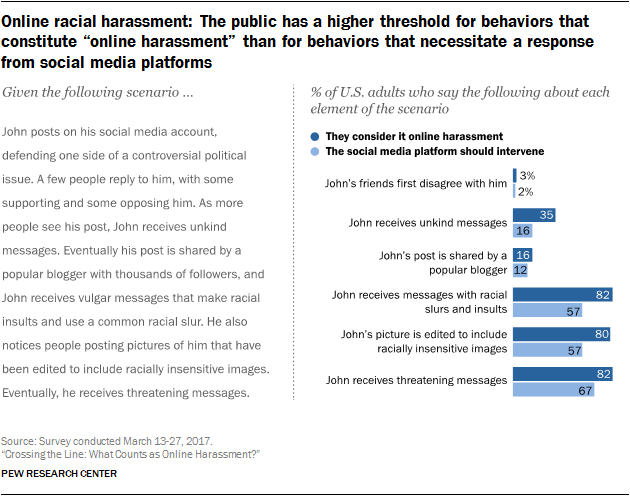
And as with the case of the scenario involving sexual content, Americans have a somewhat different threshold for behavior that constitutes online harassment as opposed to behavior that deserves a response by the social media platform hosting that behavior. For instance, 80% of Americans think it constitutes online harassment when people begin posting pictures of John that include racially insensitive imagery, but 57% think that the social media service should have stepped in to address that behavior.
Slightly larger share of the public
thinks social media platforms should step in for behaviors involving sexual
harassment than for behaviors involving racial harassment
The scenarios involving “John” and “Julie” are generally identical in content, with the former involving explicitly racial content and the latter involving sexual content. Overall, similar shares of Americans view these scenarios as involving online harassment at some point. But slightly larger shares of the public – although a majority of Americans in each instance – think the social media platform should have stepped in at various times during the scenario involving Julie, as opposed to the scenario involving John:
66% of Americans
think the social media service should have stepped in when Julie receives
vulgar messages that insult her looks and sexual behavior, but that share falls
to 57% for the scenario where John receives vulgar messages involving racial
slurs and insults.
71% think the
platform should have stepped in when people post pictures of Julie online that
included sexual images, but 57% feel that intervention is required when
pictures of David are posted that include racially insensitive images.
76% think
intervention is required when Julie begins to receive threatening messages, but
that share falls to 67% in the scenario involving David.
518-43-10/MULTI-COUNTRY
Multi-Country
‘Particularly good days’ are common in
Africa, Latin America and the U.S.
If you live in sub-Saharan Africa, Latin America or the United States, you are more likely than people in other regions of the world to say you’re having a particularly good day.
For the past several years, Pew Research Center’s annual Global Attitudes Survey has started with the following question: “How would you describe your day today – has it been a typical day, a particularly good day or a particularly bad day?” In 2017, we asked this question of nearly 42,000 people in 38 countries around the globe.
Although most people worldwide described their day as typical (median of 62%) and relatively few described it as particularly good (median of 30%), people in sub-Saharan Africa and Latin America were more likely to view their day positively. Roughly half of Africans (median of 49%) and Latin Americans (48%) surveyed said their day was particularly good. Other regions – especially Europe (73%) – overwhelmingly described their day as typical; only 22% of Europeans said their day was good.
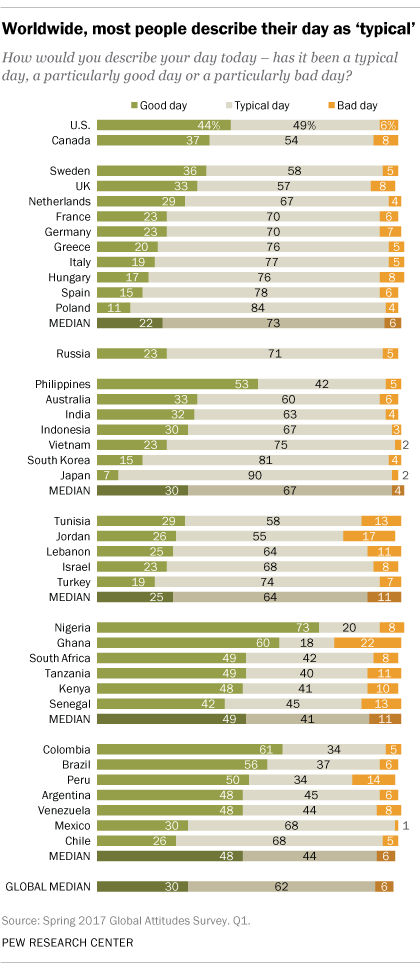
The share of upbeat people was notably higher in several countries surveyed. Half or more responded that their day was good in Nigeria (73%), Colombia (61%), Ghana (60%), Brazil (56%), the Philippines (53%) and Peru (50%).
The U.S. stands out for its positivity among Western countries, with 44% saying their day was particularly good. American conservatives (48%) and moderates (47%) were significantly more likely than liberals (34%) to describe their day as good.
Why would we ask such a conversational question as part of an in-depth research project? As survey researchers, we spend a lot of time thinking about how best to write and organize our questionnaires. We kick off the Global Attitudes Survey with this type of question for a couple of reasons: First, asking people about their day is a pleasant way to start an interview, and it helps build rapport between the interviewer and respondent. Second, starting with an easy-to-answer question helps respondents get comfortable with the format of the survey. As the survey continues, we introduce more difficult questions – but still make an effort to intersperse easier or more interesting questions among the harder ones.
Perhaps surprisingly, responses to this question were negatively correlated with one measure of national well-being, the United Nations’ Human Development Index (HDI). Countries with higher HDI scores have, on average, higher gross national income per capita, longer expected lifespans and higher educational expectations and attainment. Yet people in countries with higher HDI scores are less likely to say their day has been particularly good. In 2014, we similarly found that a country’s GDP per capita was negatively correlated with the percentage of people who said their day was good.