BUSINESS
& POLITICS IN THE WORLD
GLOBAL
OPINION REPORT NO. 647
Week: July 13 – July 19,
2020
Presentation: July 24, 2020
A
third of urban Indians are likely to dine in at a fast food restaurant in the
near future
Half
of Hong Kong people have considered immigration
Optimism
about personal finances is on the rise among UAE residents
Kenyans
support presidential term limits, age restrictions for presidential candidates
Two
out of five Germans expect China to take precedence over the USA in the future
The
French face the latest news from social networks
Two
thirds of Brits would feel unsafe on a plane
Why
won’t Britons wear face masks?
Pandemic
improves finances for a third of first-time home buyers
Majority
of Britons say that transgender people face discrimination in Britain
Fox
News Poll: Biden holds lead over Trump as coronavirus concerns grip nation
How
Trump compares with other recent presidents in appointing federal judges
Most
Americans support gender equality, even if they don’t identify as feminists
Activism
on social media varies by race and ethnicity, age, political party
Black
Adults Disproportionately Experience Microaggressions
The
Degree of Urbanisation's Effect on Happiness
NSW
ski resorts the 'main game' in town as Victorian border closes
INTRODUCTORY NOTE
647-43-20/Commentary:
As fear of
Corona recedes A third of urban Indians are likely to dine in at a fast food
restaurant in the near future:(450 MILLION OF INDIA'S
1380 MILLION LIVE IN URBAN INDIA)
A new YouGov survey reveals consumers’ intent to purchase from fast-food restaurants and lists measures that would boost their confidence in dining out
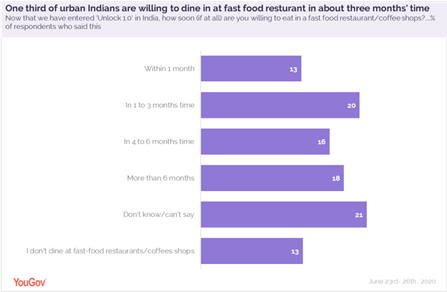
According to a new YouGov survey of more than 1,000 urban Indians conducted in June, a third of the respondents are willing to dine in at a fast food restaurant in the near future- within the next 30 days (13%) or in the next one to three months (20%).
The rest are likely to take longer, between 4-6 months (18%) or more than six months (18%) to head inside their favourite fast-food restaurant.

GenZ respondents are most likely to make a return to restaurants sooner (43%) as compared to millennials (32%) and GenX respondents (28%).
When asked which fast-food chains are they most likely to order from once the country is completely unlocked, Dominos emerged as the top choice (with 41% saying this), followed by Mc Donald’s (34%), KFC (32%) and Pizza Hut (30%).
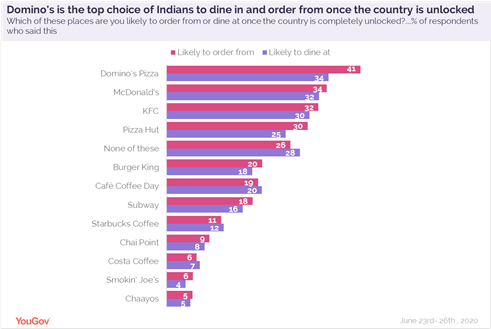
We see a similar preference when it comes to eating out in a fast-food chain once things go back to normal- Dominos is the top choice (with 34% saying this), followed by McDonalds’s (32%) and KFC (30%).
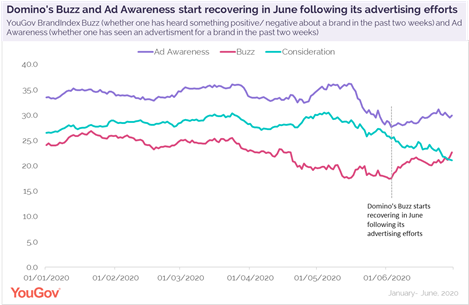
YouGov BrandIndex added another layer to the story with a deeper dive into Domino’s brand metrics. Domino’s was the first few brands to start contactless delivery in response to the pandemic. Since then the brand has invested heavily in advertising trying to communicate about its safety practices and hygiene standards.
However, in mid-April the news of a Pizza delivery agent testing positive in Delhi for the Coronavirus spread around, leading to a negative perception of some of the popular fast-food chains, including Domino’s. The brand’s Buzz score (whether one has heard something positive/ negative about a brand in the past two weeks) declined by 4 points from 23.2 in mid-April to 19.2 towards the end of the month, and further to 18.0 in May end.

Domino’s continued its advertising efforts- releasing advertisments in regional languages as well, emphasising the safety precaution taken by the delivery agents. In June, the brand came out with its latest campaign #OrderKarnaSafeHai highlighting the stringent safety norms adopted by the brand right from the kitchen to the customer’s doorstep.
It appears the brand finally seems to have struck a chord with consumers as Ad Awareness sees a slight rise in June after suffering a decline in the previous month. Around the same time Domino’s Buzz score also started recovering through June.
Even though Domino’s has managed to draw some attention, these efforts have not translated into purchases yet. Consideration (whether one would consider buying from a brand) for Domino’s has declined in line with the increasing number of Coronavirus positive cases in the country since May. However, Quality (whether a brand represents good/ poor quality) and Value score (whether a brand represents good value for money) haven’t seen any dramatic changes amidst the pandemic. This suggests the lack of intent to purchase from Domino’s is likely to be driven by the fear among the masses of contracting the virus than their absence of trust in the brand itself.
The Omnibus data shows a similar view where concern for safety is primary- the willing to purchase is there but only once the country is completely unlocked and Coronavirus is less of a threat.
YouGov also asked Indians what measures would help them feel more comfortable dining-in at a fast-food restaurant and nearly two in five (38%) said sanitization of tables and chairs in-between customers would help. Other measures that would put patrons at ease include free hand sanitizer or hand-washing station for customers before entering the place (30%), as well as maintaining social distance while placing orders (29%), and thermal screenings at the entrance (27%).
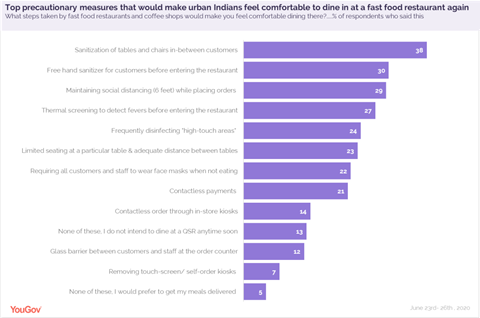
More than a fifth would be at ease if restaurants disinfected high touch areas (23%) and put a limit to the seating capacity with adequate distance between two tables (23%).
Restaurants may also want to consider facemask polices, as close to one-fourth (22%) said requiring all customers and staff to wear facemasks when not eating would help them feel more relaxed dining-in.
Contactless payments (21%), contactless order through in-store kiosks (14%), glass barrier between customers & staff at the order counter (12%) and removal of touch-screen kiosks at stores (7%) were some other methods that can be adopted by restaurants to make customers’ dining experience comfortable.
(YouGov)
July 20, 2020
Source: https://in.yougov.com/en-hi/news/2020/07/20/third-urban-indians-are-likely-dine-fast-food-rest/
647-43-21/Country Profile: United Kingdom

SUMMARY
OF POLLS
ASIA
(India)
A third of urban Indians are likely to dine in at a fast food
restaurant in the near future
According to a new YouGov survey of more than 1,000 urban Indians
conducted in June, a third of the respondents are willing to dine in at a fast
food restaurant in the near future- within the next 30 days (13%) or in the next
one to three months (20%). The rest are likely to take longer, between 4-6
months (18%) or more than six months (18%) to head inside their favourite fast-food restaurant. GenZ
respondents are most likely to make a return to restaurants sooner (43%) as
compared to millennials (32%) and GenX respondents
(28%). (YouGov)
July 20, 2020
(Hong Kong)
Half of Hong Kong people have considered immigration
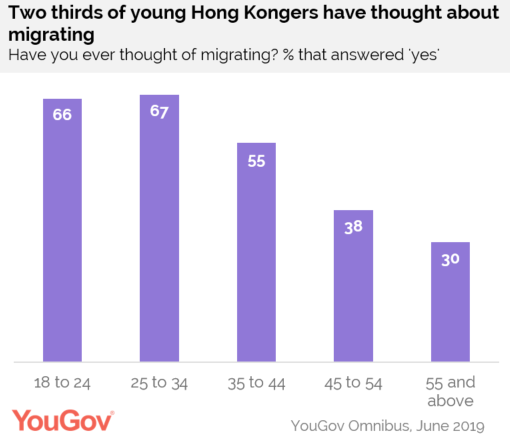
A new study by YouGov found that nearly half (47%) of Hong Kong
people have considered immigration. The most prone to immigrants are young
people in Hong Kong, two-thirds of whom have considered emigrating overseas
(66% among 18-24 year-olds and 67% among 25-34 year-olds) compared with no
university degree People with a bachelor's degree or higher are more inclined
to immigrate (55% vs. 38%). Similarly, unmarried people are more inclined to
immigrate than married people (52% vs. 42%). (YouGov)
July 08, 2020
MENA
(UAE)
Optimism about personal finances is on the rise among UAE residents
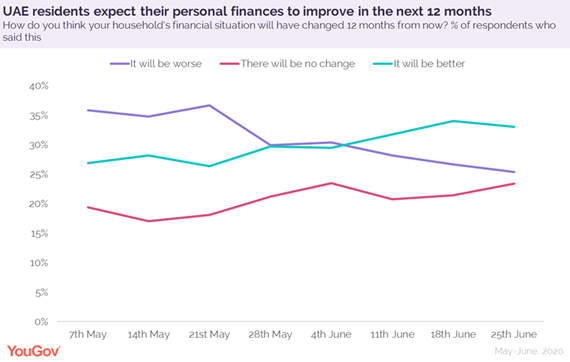
The appearance of the Covid-19 pandemic has turned our familiar
world upside down within a span of few months. YouGov’s economic recovery
tracker run between 7th May and 2nd July reveals how the crisis has affected
the nation’s finances. With the economy gradually reopening, UAE residents are
hopeful about their personal monetary situation and a third (33%) think their
finances will get better in twelve months’ time while 23% expect them to remain
in the same state. The number who think they will get worse stands at 25%. (YouGov)
July 22, 2020
AFRICA
(Kenya)
Kenyans support presidential term limits, age restrictions for
presidential candidates
Kenyans overwhelmingly favor limiting their president to two terms
in office and placing age restrictions on presidential candidates, according to
the most recent Afrobarometer survey. More than
three-fourths of citizens endorse presidential term limits, which have been
enshrined in the Constitution since 1992. While some African leaders have tried
to get around term limits in order to stay in office, Kenya has remained
committed to this democratic principle. (Afrobarometer)
July 13, 2020
EUROPE
(Germany)
Two out of five Germans expect China to take precedence over the USA in
the future
Today, more than 2 in 5 Germans (42 percent) and almost half of the
British (48 percent) think that China will be the more powerful state over the
next 50 years. This contrasts with only 18 percent of the British and 14
percent of Germans who say this about the USA. 23 percent of Germans do not see
a supremacy in any of these countries and 22 percent do not state anything.
Among the British, 10 percent believe that neither the United States nor China
will assume supremacy, and just under a quarter (24 percent) do not say
anything. These are the results of current YouGov surveys. (YouGov)
July 15, 2020
(France)
The French face the latest news from social networks
The Facebook Shops e-commerce platform is the most famous novelty
of the French: 22% of them have already heard of this new feature. Facebook
Shops is also the novelty that the French plan to use the most (19%). Snapchat
novelties come second among the new features that the French plan to use in the
coming weeks (18%). The social network created by Mark Zuckerberg seems to
benefit from its notoriety: nine out of ten French people (90%) know this
social network , thus placing it first of the most
famous social networks. (YouGov)
July 16, 2020
(UK)
Two thirds of Brits would feel unsafe on a plane
The number of people who would not feel safe travelling by plane
has increased significantly since early June, despite COVID-19 lockdown
beginning to ease, signalling that it could be some
time before travel rebounds to previous levels. Nearly two thirds of the public
(64%) would not feel safe travelling by plane currently, up from 40% on 8 June.
There is a similar unease about other types of international transport. Over
half of Brits (55%) say they’d feel unsafe travelling by train, while 48% would
not feel comfortable on a ferry. In both cases, this is a substantial jump from
31% on June 8th. (YouGov)
July 14, 2020
(UK)
Why won’t Britons wear face masks?
The proportion of Britons wearing face masks during the coronavirus
crisis has remained stubbornly low, compared to other countries. This is
despite the fact that Britain has been one of the hardest-hit nations by the
pandemic (indeed, it could be the reason for it). It is vital to public health
that we understand why. So a new YouGov survey has asked Britons who have not
been donning face coverings their reasons for not doing so. Adapting the face
mask question we use as part of our coronavirus partnership with Imperial
College, the results showed that 37% of Britons hadn’t worn a face mask outside
their home in the preceding seven days. (YouGov)
July 15, 2020
(UK)
Pandemic improves finances for a third of first-time home buyers
First-time buyers are over twice as likely as the average Brit to
have benefitted financially from the coronavirus crisis – but getting a
mortgage has become harder. A third of people who plan to buy their first home
within the next year (32%) say the COVID-19 pandemic has been positive for
their finances. In contrast, this is only the case for 14% of all Brits. And
while 34% of the public have felt a negative financial impact, this figure is
slightly lower among first-time buyers (30%). (YouGov)
July 17, 2020
(UK)
Majority of Britons say that transgender people face discrimination in
Britain
7 in 10 Britons believe transgender people face discrimination, a
quarter say they face a great deal. New research from Ipsos MORI carried out
online among British adults aged 18-75 finds that 70% of Britons believe that
transgender people face discrimination, with a quarter (26%) saying they face a
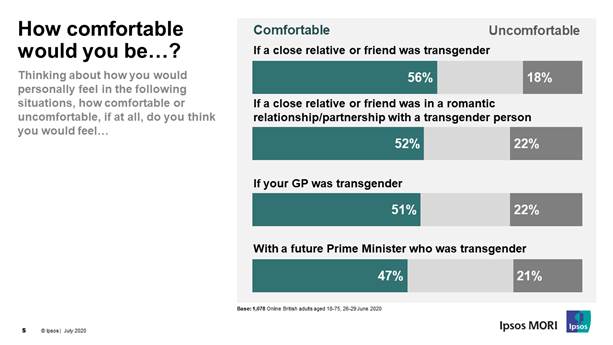
great deal. Most would feel comfortable
with transgender people in different settings, but still one in five say they
would feel uncomfortable. Around half of Britons say they would be comfortable
if a close friend or relative was transgender (56%), if their GP was
transgender (51%) and if a future Prime Minister was transgender (47%), with
around one in five saying they would be uncomfortable (18%, 22% and 21%
respectively). (Ipsos MORI)
July 15, 2020
(UK)
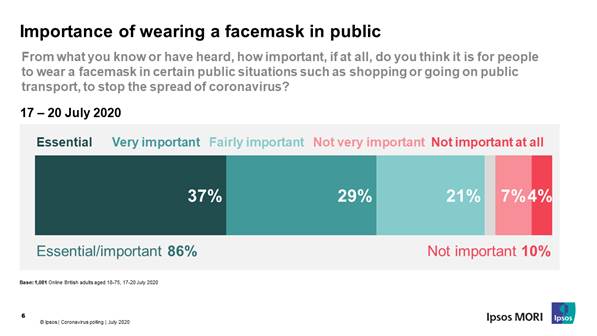
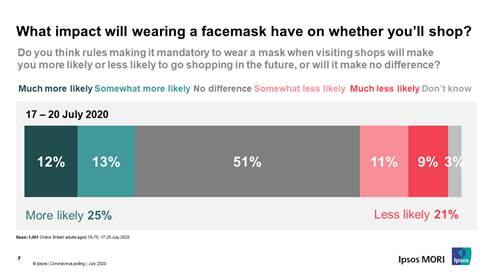
Nearly 9 in 10 Britons say it is either essential or important to wear
a facemask in public to stop the spread of coronavirus
While a large majority agree that it is important to wear a
facemask in various situations, there is also strong support for government
rules making it mandatory to wear one in shops. In a new survey by Ipsos MORI,
almost 9 in 10 (86%) Britons say it is either essential or important for people
to wear a facemask in certain public situations, such as shopping or using
public transport, to stop the spread of coronavirus. More than 1 in 3 (37%) say
it is essential. Just 1 in 10 say it is
not important. (Ipsos MORI)
July 13, 2020
NORTH AMERICA
(USA)
Fox News Poll: Biden holds lead over Trump as
coronavirus concerns grip nation
Coronavirus infected the election.The virus is the top issue to voters, over half of
them disapprove of how President Trump’s handling it, and they increasingly
trust Joe Biden to do a better job on it.
That keeps Biden ahead in the presidential race, according to a Fox News
survey of registered voters. That advantage is outside the margin of
error. However, neither candidate receives 50 percent support and 10 percent
are undecided/back someone else -- and the race has narrowed since June, when
the former vice president was up by 12 points (50-38 percent). (Fox News)
July 19, 2020
How Trump compares with other recent presidents in
appointing federal judges
President Donald Trump has made big
changes to the federal judiciary since taking office in 2017. Trump has
appointed two Supreme Court justices – Neil Gorsuch and Brett Kavanaugh – as
well as nearly 200 other judges with lifetime appointments to lower federal
courts. So how does Trump compare with other presidents in the number and
personal characteristics of the judges he has appointed to the federal bench so
far? Below are four charts that compare Trump’s record on judicial appointments
to those of his recent White House predecessors, going back to Jimmy Carter. (PEW)
July 15, 2020
Most Americans support gender equality, even if
they don’t identify as feminists
feminist movement have been accepted
across the political spectrum in the United States, even among Americans who
don’t personally identify as feminists, according to a Pew Research Center
survey about gender equality that comes 100 years after the ratification of the
19th Amendment. For example, a majority of Democrats and Republicans – whether
they identify as feminists or not – say it is very important for women to have
equal rights with men. Similarly, majorities in both partisan coalitions support
adding the Equal Rights Amendment to the U.S. Constitution. (PEW)
July 14, 2020
Activism on social media varies by race and
ethnicity, age, political party
From global protests against racial
injustice to the 2020 election, some Americans who use social media are taking
to these platforms to mobilize others and show their support for causes or
issues. But experiences and attitudes related to political activities on social
media vary by race and ethnicity, age, and party, according to a Pew Research
Center survey of U.S. adults conducted June 16-22, 2020. People can be
politically active on social media in many ways. This survey asked Americans
about four different types of activities that they may have engaged in on these
platforms. (PEW)
July 13, 2020
Black Adults Disproportionately Experience
Microaggressions
More than any other racial group, Black
Americans report experiencing negative treatment by others that falls under the
broad category of microaggressions. About one in three Black adults (32%) say
that, in the past year, people have acted as if they were "better than
you," while one in four (25%) say people have acted as if "you were
not smart." Roughly one in five Black Americans say they have experienced
people treating them with less courtesy (22%) and respect (20%) than others.
Similar percentages of Black adults say people have acted as if they were
dishonest (19%) or as if they were afraid of them (18%). (Gallup USA)
July 15, 2020
The Degree of Urbanisation's
Effect on Happiness
Are people happier living in the
countryside or in a city? The European Commission and Gallup collaborated on a
study to find out, analyzing the opinions of 360,000 people across 117
countries and territories* based on whether they live in a city, town and semi-dense
area, or a rural area. People were asked to rate their lives on a scale from 0
to 10, with 0 being the worst possible life and 10 being the best possible
life. On average, the percentage of people in any given country who gave their
lives a score between 8 and 10 is two to four percentage points higher in
cities than in rural areas. The urban/rural gap is present regardless of
country income level. (Gallup USA)
July 16, 2020
AUSTRALIA
NSW ski resorts the 'main game' in town as
Victorian border closes
The latest Roy Morgan data shows 322,000
Australians plan on visiting one of the NSW Snowfields in the next two years.
Over three-quarters of these prospective skiers and snowboarders (249,000) are
from NSW/ACT including 180,000 from Sydney and a further 69,000 from Country
NSW/ACT. There are a further 60,000 Australians from the rest of Australia
(Queensland, WA, SA, NT or Tasmania) who plan on visiting one of the NSW
Snowfields in the next two years. NSW borders remain open to residents of all
these locations although the return home might require a period of quarantine. (Roy
Morgan)
July 14, 2020
MULTICOUNTRY STUDIES
The Global God Divide
People’s thoughts on whether
belief in God is necessary to be moral vary by economic development, education
and age. What is the connection between belief in God and morality? And how
important are God and prayer in people’s lives? Pew Research Center posed these
questions to 38,426 people in 34 countries in 2019. Across the 34 countries, which span six continents, a median of 45%
say it is necessary to believe in God to be moral and have good values. But
there are large regional variations in answers to this question. (PEW)
July 20, 2020
ASIA
647-43-01/Poll
A third of urban Indians are likely to dine in at a fast food restaurant in the near future
A new YouGov survey reveals consumers’ intent to purchase from fast-food restaurants and lists measures that would boost their confidence in dining out
According to a new YouGov survey of more than 1,000 urban Indians conducted in June, a third of the respondents are willing to dine in at a fast food restaurant in the near future- within the next 30 days (13%) or in the next one to three months (20%).
The rest are likely to take longer, between 4-6 months (18%) or more than six months (18%) to head inside their favourite fast-food restaurant.
GenZ respondents are most likely to make a return to restaurants sooner (43%) as compared to millennials (32%) and GenX respondents (28%).
When asked which fast-food chains are they most likely to order from once the country is completely unlocked, Dominos emerged as the top choice (with 41% saying this), followed by Mc Donald’s (34%), KFC (32%) and Pizza Hut (30%).
We see a similar preference when it comes to eating out in a fast-food chain once things go back to normal- Dominos is the top choice (with 34% saying this), followed by McDonalds’s (32%) and KFC (30%).
YouGov BrandIndex added another layer to the story with a deeper dive into Domino’s brand metrics. Domino’s was the first few brands to start contactless delivery in response to the pandemic. Since then the brand has invested heavily in advertising trying to communicate about its safety practices and hygiene standards.
However, in mid-April the news of a Pizza delivery agent testing positive in Delhi for the Coronavirus spread around, leading to a negative perception of some of the popular fast-food chains, including Domino’s. The brand’s Buzz score (whether one has heard something positive/ negative about a brand in the past two weeks) declined by 4 points from 23.2 in mid-April to 19.2 towards the end of the month, and further to 18.0 in May end.
Domino’s continued its advertising efforts- releasing advertisments in regional languages as well, emphasising the safety precaution taken by the delivery agents. In June, the brand came out with its latest campaign #OrderKarnaSafeHai highlighting the stringent safety norms adopted by the brand right from the kitchen to the customer’s doorstep.
It appears the brand finally seems to have struck a chord with consumers as Ad Awareness sees a slight rise in June after suffering a decline in the previous month. Around the same time Domino’s Buzz score also started recovering through June.
Even though Domino’s has managed to draw some attention, these efforts have not translated into purchases yet. Consideration (whether one would consider buying from a brand) for Domino’s has declined in line with the increasing number of Coronavirus positive cases in the country since May. However, Quality (whether a brand represents good/ poor quality) and Value score (whether a brand represents good value for money) haven’t seen any dramatic changes amidst the pandemic. This suggests the lack of intent to purchase from Domino’s is likely to be driven by the fear among the masses of contracting the virus than their absence of trust in the brand itself.
The Omnibus data shows a similar view where concern for safety is primary- the willing to purchase is there but only once the country is completely unlocked and Coronavirus is less of a threat.
YouGov also asked Indians what measures would help them feel more comfortable dining-in at a fast-food restaurant and nearly two in five (38%) said sanitization of tables and chairs in-between customers would help. Other measures that would put patrons at ease include free hand sanitizer or hand-washing station for customers before entering the place (30%), as well as maintaining social distance while placing orders (29%), and thermal screenings at the entrance (27%).

More than a fifth would be at ease if restaurants disinfected high touch areas (23%) and put a limit to the seating capacity with adequate distance between two tables (23%).
Restaurants may also want to consider facemask polices, as close to one-fourth (22%) said requiring all customers and staff to wear facemasks when not eating would help them feel more relaxed dining-in.
Contactless payments (21%), contactless order through in-store kiosks (14%), glass barrier between customers & staff at the order counter (12%) and removal of touch-screen kiosks at stores (7%) were some other methods that can be adopted by restaurants to make customers’ dining experience comfortable.
(YouGov)
July 20, 2020
Source: https://in.yougov.com/en-hi/news/2020/07/20/third-urban-indians-are-likely-dine-fast-food-rest/
647-43-02/Poll
Half of Hong Kong people have considered immigration
A new study by YouGov found that nearly half (47%) of Hong Kong people have considered immigration.
The most prone to immigrants are young people in Hong Kong, two-thirds of whom have considered emigrating overseas (66% among 18-24 year-olds and 67% among 25-34 year-olds) compared with no university degree People with a bachelor's degree or higher are more inclined to immigrate (55% vs. 38%). Similarly, unmarried people are more inclined to immigrate than married people (52% vs. 42%).
Among those considering immigration, a quarter (24%) said they might immigrate in the next three years, two-fifths (43%) said they were unlikely to leave Hong Kong within this period, and one-third (32%) ) The time has not yet been determined. People between the ages of 45 and 54 are most likely to immigrate, with three-tenths (30%) planning to immigrate in the next three years.
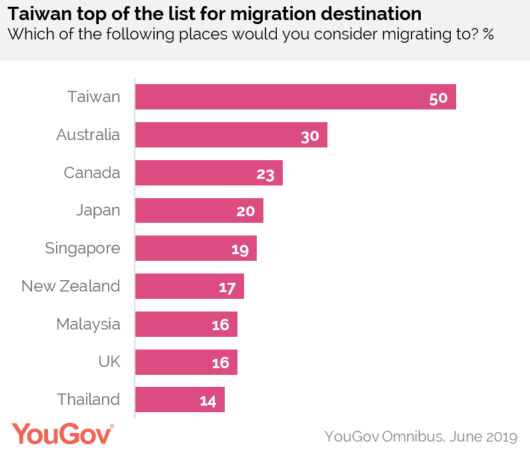
For those considering immigration, they most want to immigrate to Taiwan (50%), followed by Australia (30%), Canada (23%) and Japan (20%).
Investment is the most popular immigration method for Hong Kong people (37%). Other immigration methods include: skilled immigration (28%), marriage immigration (17%) or business immigration (14%). Compared with marriage immigrants, female immigrants are twice as much as male immigrants (22% vs. 11%).
Cindy Chan, General Manager of YouGov Omnibus Greater China, commented: "It is not new that a large number of Hong Kong people are considering immigration recently. What's interesting is that Taiwan is now ahead of Australia, Canada, and the United States as the top destination for immigration. We need to continue to observe this trend to see how many Hong Kong people turn their ideas into action."
(YouGov)
July 08, 2020
Source: https://tw.yougov.com/zh-tw/news/2019/07/08/hongkong-migration/
MENA
647-43-03/Poll
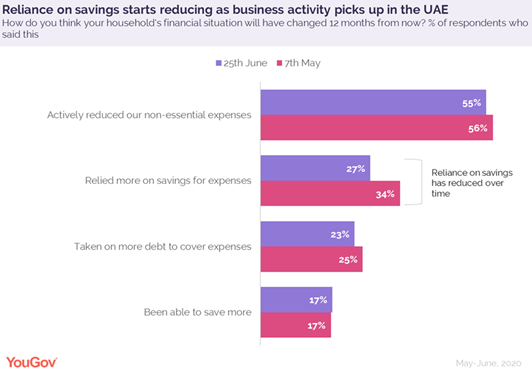
Optimism about personal finances is on the rise among UAE residents
As economic activity gradually picks up in the country, residents seem positive about the future of their finances
The appearance of the Covid-19 pandemic has turned our familiar world upside down within a span of few months. YouGov’s economic recovery tracker run between 7th May and 2nd July reveals how the crisis has affected the nation’s finances.
With the economy gradually reopening, UAE residents are hopeful about their personal monetary situation and a third (33%) think their finances will get better in twelve months’ time while 23% expect them to remain in the same state. The number who think they will get worse stands at 25%.
The proportion of residents who said their financial condition has deteriorated (compared to a month ago) during the crisis has reduced from 56% in May to 42% at the end of June. On the contrary, claims of their monetary situation improving or remaining unchanged has gone up from 6% to 11% and 33% to 41%, respectively.
In order to deal with the financial implications of the virus, a majority of residents were actively reducing their non-essential expenses, and still seem to be doing so. A third (34%) were relying on their savings to take care of their expenses but this number has come down from 34% to 27% since the initial wave of the survey.
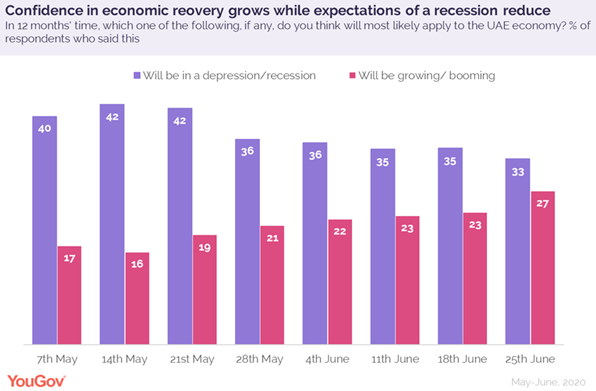
At an overall level, the proportion of residents who said the Covid situation in their country is becoming better has increased since May, and by the end of June, the majority feels UAE has made progress in this regard. The figures seem to align with the reopening of businesses in June and we see a gradual increase throughout the month.
Confidence in the recovery of the economy also seems to be growing. When asked about UAE’s economic situation in the future, 27% residents believe in the next twelve months the country’s economy will be growing or booming. This is up from 17% who said this in early May. However, 33% still believe the economy will be in a recession or depression, even though the number is down from 40% who said this in early May.
A similar trend is evident when it comes to job security where although a large proportion of public are still insecure about their jobs, the number seems to be declining week-on-week. 57% admitted to feeling less secure about their jobs when we first ran the survey in May. However, with the reopening of businesses, this figure has decreased and now (June-end) 47% said they are insecure about their jobs. A parallel movement is clear in the level of business activity, where the number of respondents saying they have experienced decreased level of business activity has fallen down (from 67% to 48%) while those saying it has increased (from 7% to 17% saying this) has trended upward between May and June.
(YouGov)
July 22, 2020
Source:
https://mena.yougov.com/en/results/
AFRICA
647-43-04/Poll
Kenyans support presidential term limits, age restrictions for presidential candidates
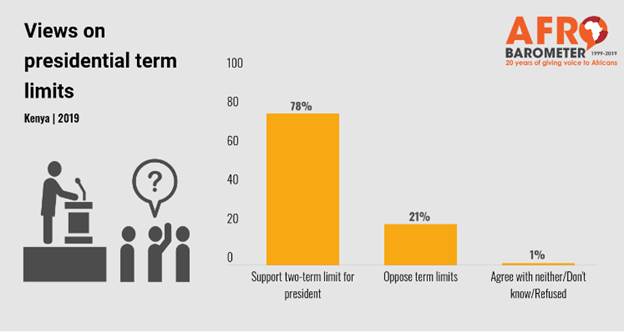
Kenyans overwhelmingly favor limiting their president to two terms in office and placing age restrictions on presidential candidates, according to the most recent Afrobarometer survey.
More than three-fourths of citizens endorse presidential term limits, which have been enshrined in the Constitution since 1992. While some African leaders have tried to get around term limits in order to stay in office, Kenya has remained committed to this democratic principle.
In addition to supporting term limits, most Kenyans say the country should determine minimum and maximum ages for presidential candidates.
(Afrobarometer)
July 13, 2020
EUROPE
647-43-05/Poll
Two out of five Germans expect China to take precedence over the USA in the future
The United States or
China? West or east?
Today, more than 2 in 5 Germans (42 percent) and almost half of the British (48 percent) think that China will be the more powerful state over the next 50 years. This contrasts with only 18 percent of the British and 14 percent of Germans who say this about the USA. 23 percent of Germans do not see a supremacy in any of these countries and 22 percent do not state anything. Among the British, 10 percent believe that neither the United States nor China will assume supremacy, and just under a quarter (24 percent) do not say anything. These are the results of current YouGov surveys.
LEFT-WING VOTERS MOST OFTEN
SEE CHINA IN SUPREMACY
Among the German respondents, the most frequent voters of the left (54 percent), the FDP and the Greens (52 percent each) think that China will be the more powerful state over the next 50 years. AfD voters (17 percent) say most often that the US will be more powerful. A look at the age groups is also interesting: the 18-24 year olds most often believe in the supremacy of the United States over China (24 percent compared to 10 percent of those over 55 years of age.
Based on the YouGov question of the day, 4,054 people in Germany from the age of 18 were July 2020 and 1,889 people in the UK aged 18 and over on July 9, 2020. The results were weighted and are representative of the respective population aged 18 and over. The results can be analyzed with a click for subgroups. All you have to do is click on the corresponding symbols below / above the survey. The questions are updated daily. You can find a general overview of YouGov Germany on the questions of the last few weeks and months from the various subject areas here .
(YouGov)
July 15, 2020
Source: https://yougov.de/news/2020/07/15/2-von-5-deutschen-erwarten-der-zukunft-die-vormach/
647-43-06/Poll
The French face the latest news from social networks
Social networks are constantly innovating: in recent weeks, many of them have made major updates to their applications: Facebook, Snapchat, LinkedIn, Instagram, Twitter and Google have offered new features for their users. .
The Facebook Shops e-commerce platform is the most famous novelty of the French: 22% of them have already heard of this new feature. Facebook Shops is also the novelty that the French plan to use the most (19%).
Snapchat novelties come second among the new features that the French plan to use in the coming weeks (18%).
The social network created by Mark Zuckerberg seems to benefit from its notoriety: nine out of ten French people (90%) know this social network , thus placing it first of the most famous social networks.
Let's take a closer look at the reasons that push the French to use Facebook, the most famous social network of the population:
How often do the French use social networks?
79% of French people say they use social networks at least once a day - a habit more observed among women (85% vs. 73% of men). There are also differences between the generations on this subject (90% of 18-24 year-olds vs. 70% of 55-year-olds and over).
In detail, 20% of French people say they use social networks more than 10 times a day.
The smartphone is the most popular medium for the French when it comes to going on social networks: 74% of the population uses it - a figure that rises to 91% among 18-24 year olds (vs. 58 % of 55 and over). The computer comes in second position (50%) and is appreciated by those 55 and over (64%).
(YouGov)
July 16, 2020
Source: https://fr.yougov.com/news/2020/07/16/les-francais-face-aux-dernieres-nouveautes-des-rs/
647-43-07/Poll
Two thirds of Brits would feel unsafe on a plane
The number of people who would not feel safe travelling by plane has increased significantly since early June, despite COVID-19 lockdown beginning to ease, signalling that it could be some time before travel rebounds to previous levels
Nearly two thirds of the public (64%) would not feel safe travelling by plane currently, up from 40% on 8 June. There is a similar unease about other types of international transport. Over half of Brits (55%) say they’d feel unsafe travelling by train, while 48% would not feel comfortable on a ferry. In both cases, this is a substantial jump from 31% on June 8th.
The figures suggest that even as the Government has released a list of destinations which travellers can return from without quarantining, the pandemic is still putting people off travelling.
Brits aged 65 and older are the most worried about international travel. Three quarters now say they feel uneasy about flying (75%), which is an increase from 47% on June 8th.
Similarly, two thirds feel uncomfortable about using trains abroad (64% - up from 34% on June 8th) and 58% would not feel safe travelling by ferry, up from 30%.
While younger people are less anxious, most still feel apprehensive about going abroad. A plurality of 18- to 24-year-olds say they would not feel safe on a plane (44%), while a third are uncertain and a quarter would feel okay (23%).
However, they are more relaxed about travelling internationally by train and ferry, with 41% feeling safe in both instances.
Domestic holidays much more popular than travelling abroad
About one in six people (17%) plan to travel abroad in the next six months. The number has not changed since June 8th (16%) despite the announcement that travel restrictions will ease.
The figure is in line with a snap poll by YouGov, which found that 11% of Brits expect to go on a summer holiday this year.
Brits are keener on domestic holidays. A plurality (45%) expect to travel in the UK in the next six months, while 17% are unsure.
Younger people aged 18 to 24 are the most likely to plan a domestic holiday (55%), while 25- to 49-year-olds are most up for going abroad (20%).
The number of Brits aged 65 and over who plan to travel in the UK is in line with the wider population (43%), but international travel has less appeal than average at 12%.
(YouGov)
July 14, 2020
647-43-08/Poll
Why won’t Britons wear face masks?
YouGov data shows that the
public may simply be waiting for the Government to tell them they have to
The proportion of Britons wearing face masks during the coronavirus crisis has remained stubbornly low, compared to other countries. This is despite the fact that Britain has been one of the hardest-hit nations by the pandemic (indeed, it could be the reason for it).
It is vital to public health that we understand why. So a new YouGov survey has asked Britons who have not been donning face coverings their reasons for not doing so.
Adapting the face mask question we use as part of our coronavirus partnership with Imperial College, the results showed that 37% of Britons hadn’t worn a face mask outside their home in the preceding seven days.
Four in ten told us they haven’t done so because they don’t feel like they’ve needed to – often for reasons like they’ve been keeping away from crowded areas (11%), are abiding by social distancing rules (8%), or are only going outdoors or to non-enclosed areas (7%).
One in five (22%) said it’s because masks aren’t mandatory, either in general or in the situations in which they have found themselves.
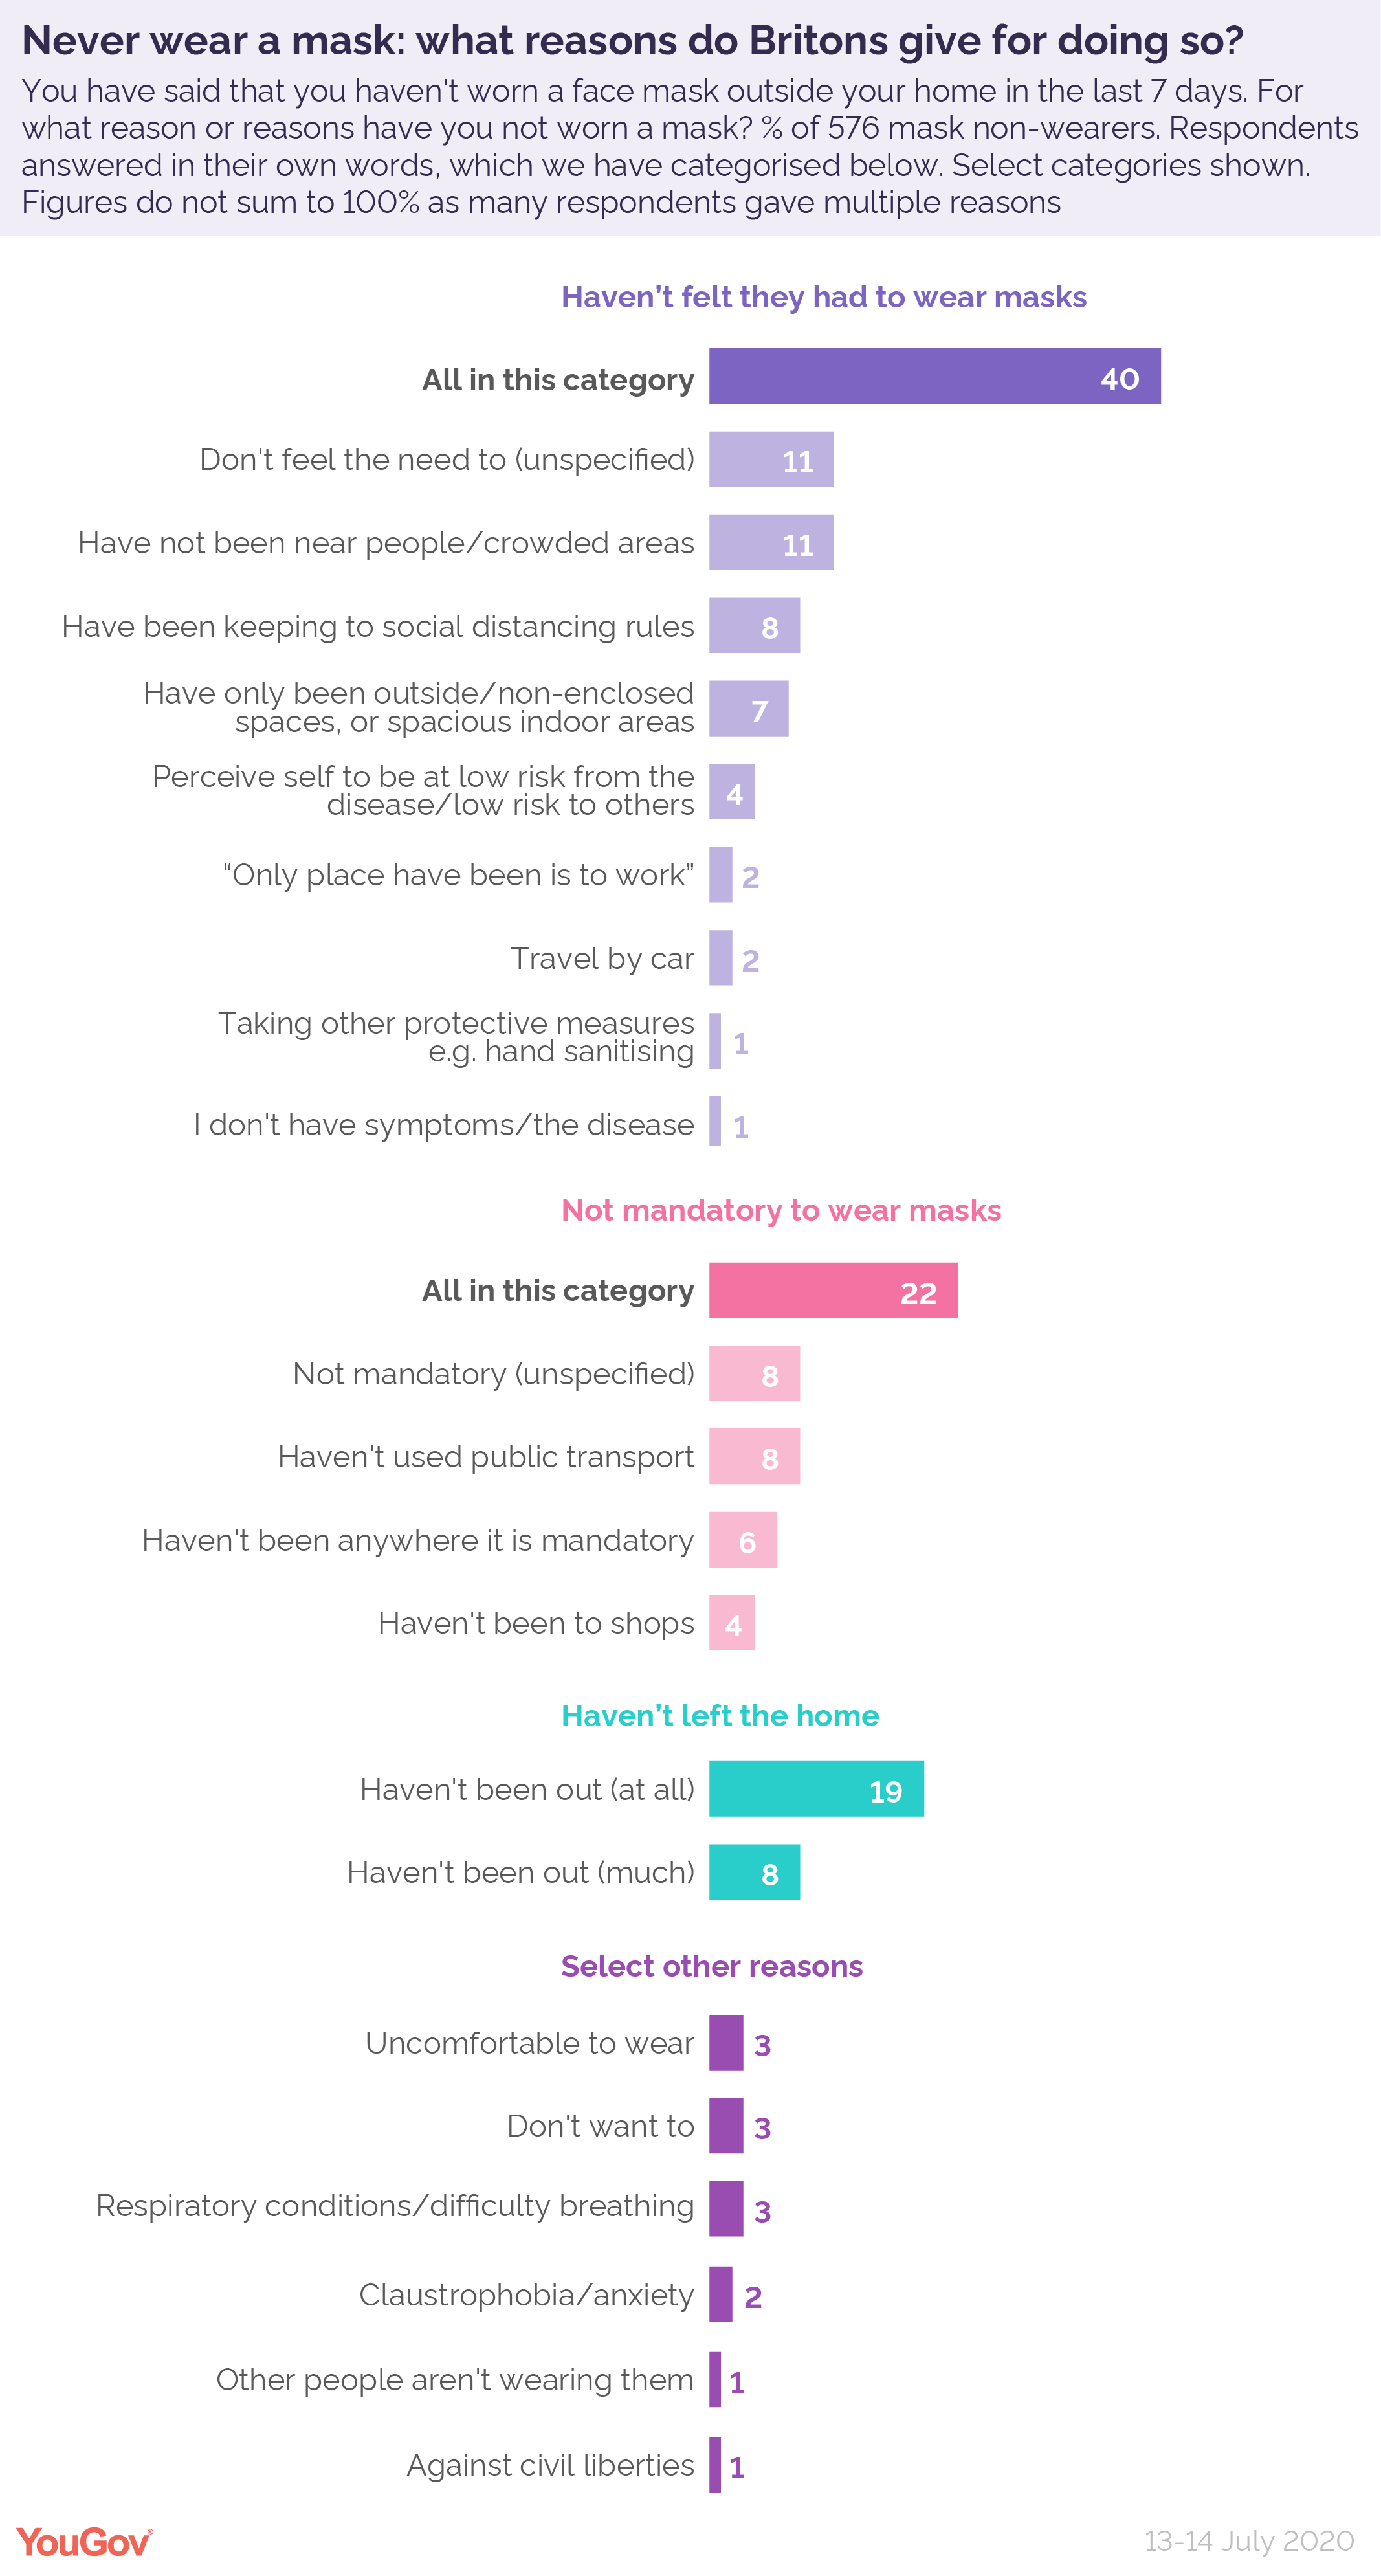
Another common response, at 19%, was simply that mask non-wearers hadn’t left their home in the past week e.g. because they are shielding. A further 8% said they had only rarely ventured outside in the preceding seven days.
Complaints about discomfort and inconvenience were only raised by a tiny fraction of non-wearers.
Most Britons – including
non-wearers – believe masks have health benefits, and want to see their use
enforced
What seems to be clear is that many Britons see face masks as an inherent good, even among those not wearing them, but that many will not do so until the Government tells them they have to.
Overall seven in ten Britons think wearing a face mask helps public health, with those who wear face masks more frequently being more likely to think this. Nevertheless, fully half (51%) of those who never wear a face mask say they think such covering are good for public health.
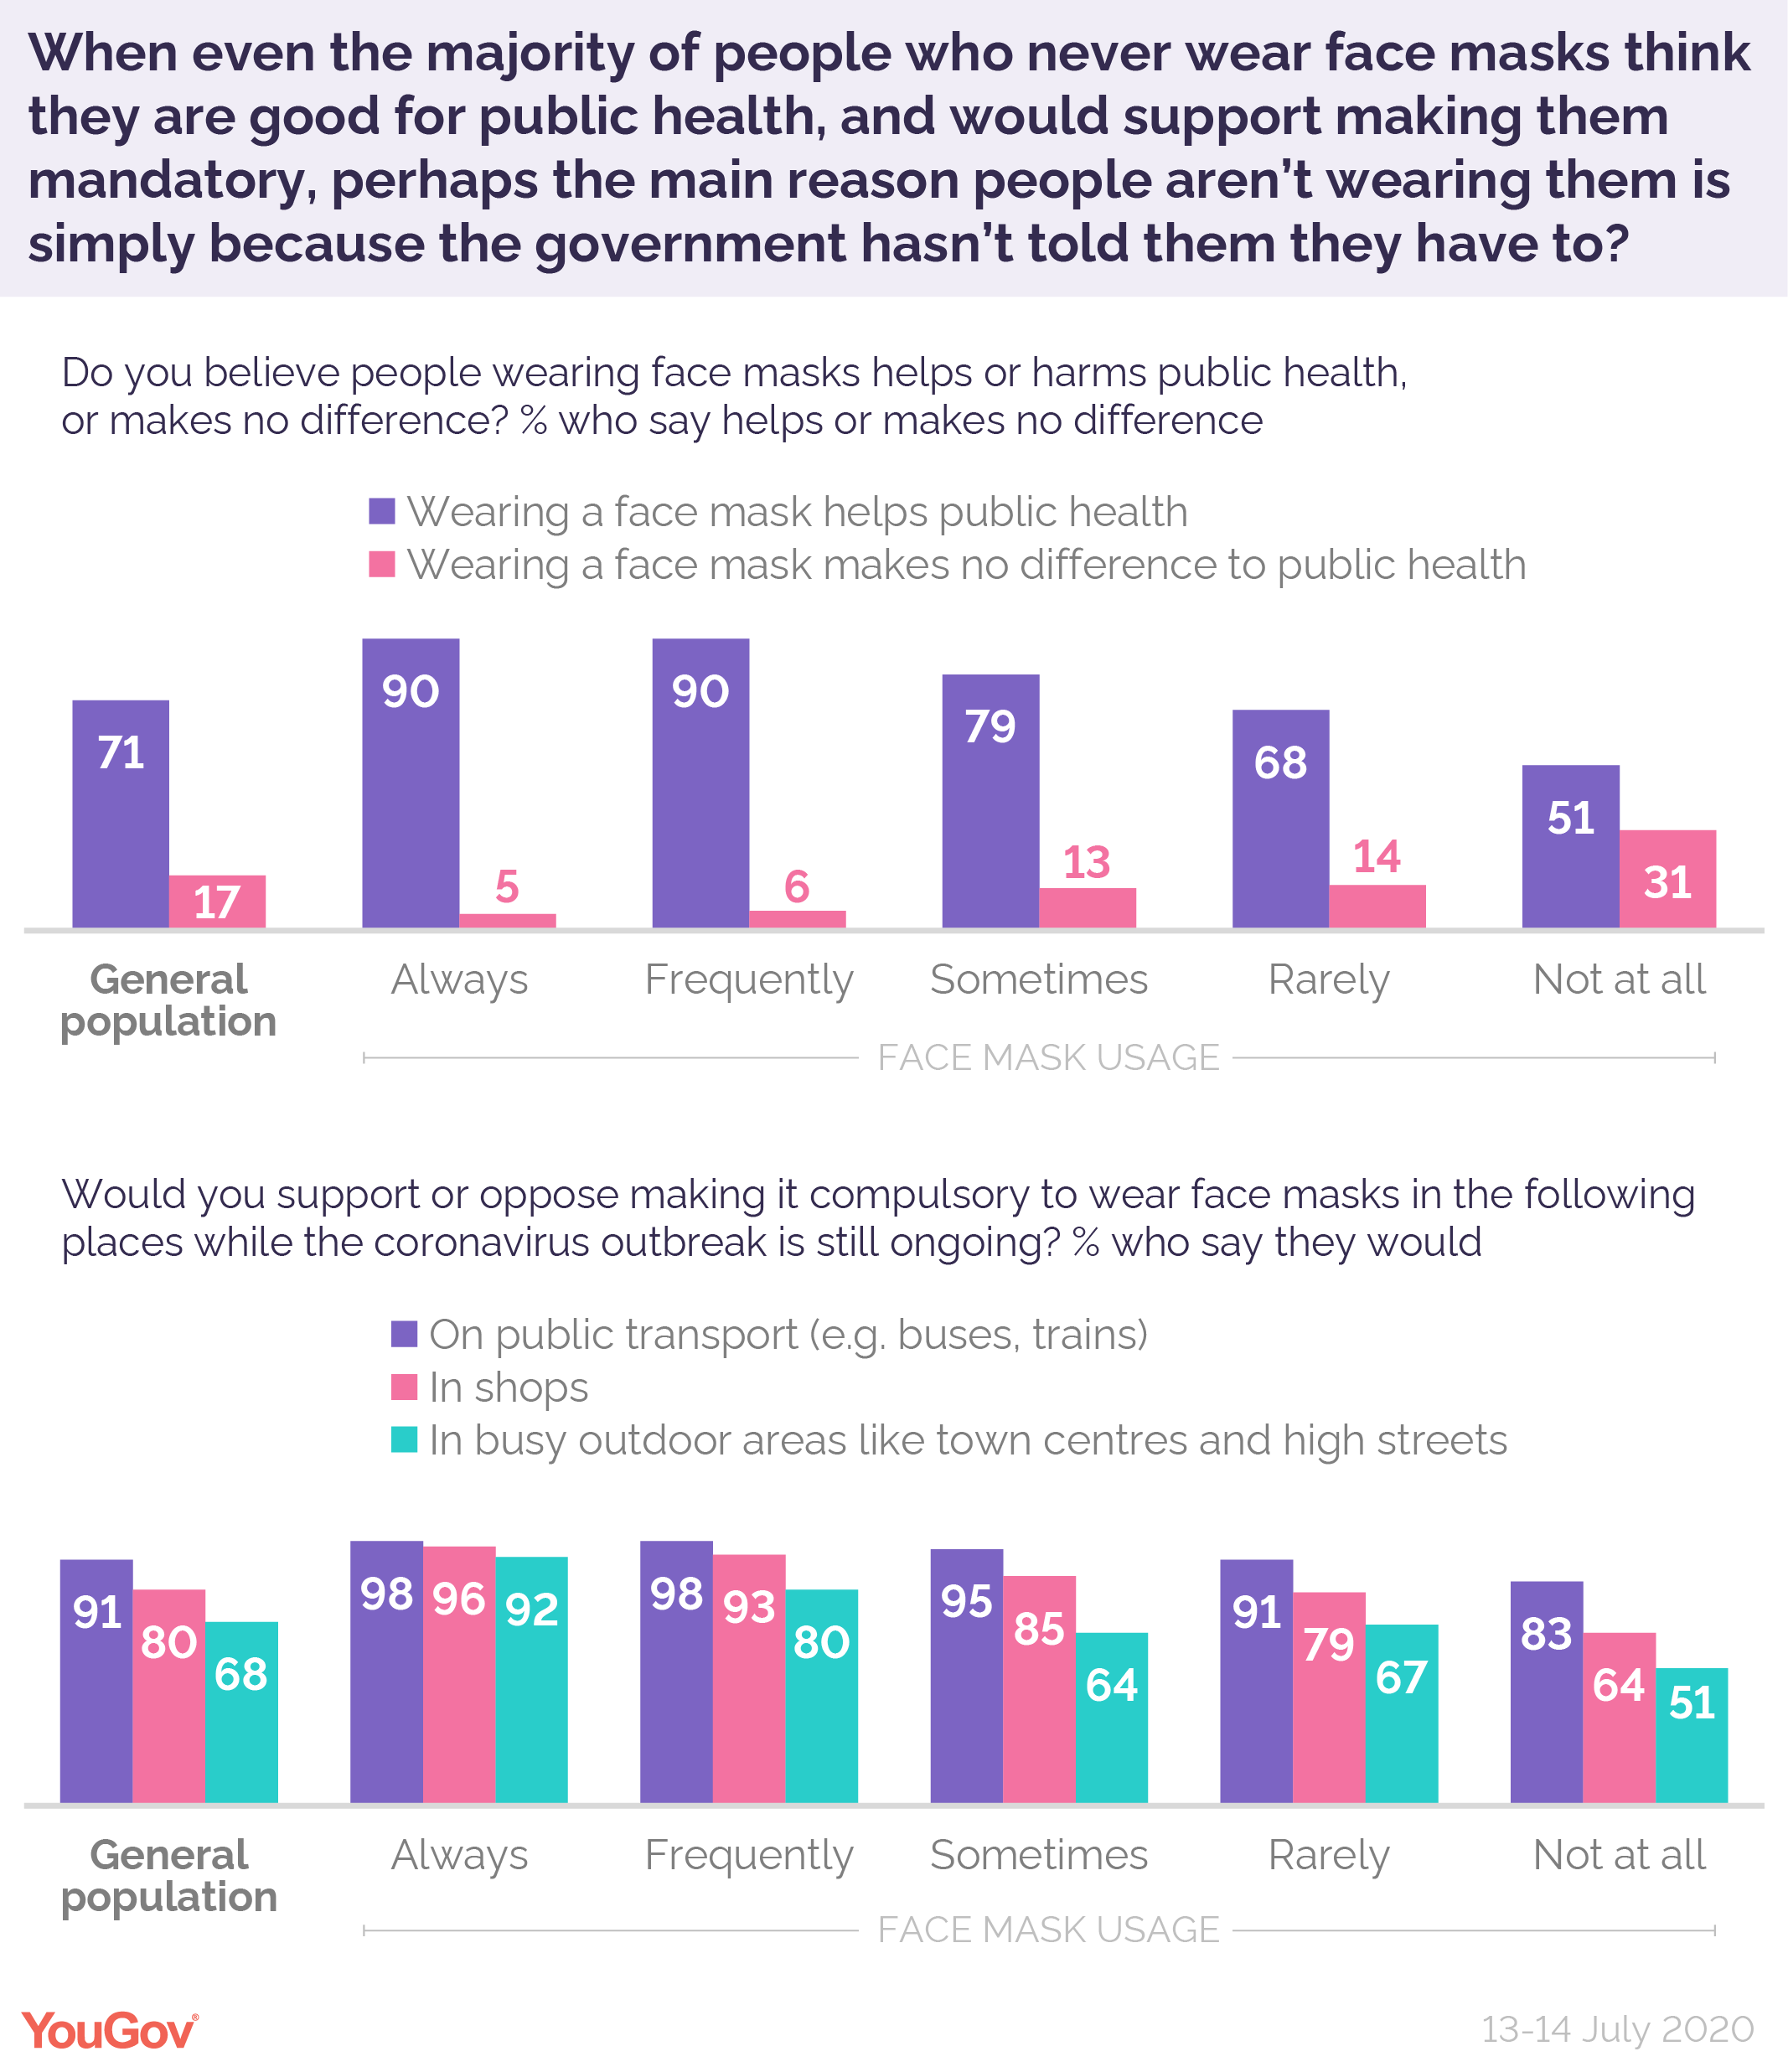
And Britons overwhelmingly support making their usage compulsory. On public transport 91% of Brits say that covering the face should be required; 80% think the same when in shops, and 68% want to see it made mandatory in busy outdoor areas like town centres and high streets. In all three cases this includes a majority of those who haven’t been wearing face masks themselves.
What do Britons think the
rules on wearing face masks are?
The survey – conducted prior to the Government’s announcement that face masks will be compulsory in England from July 24th – found 58% saying face mask usage in shops is recommended, although optional. A further one in five (20%) believed it was already compulsory, while another 18% thought there was no Government guidance in this area.
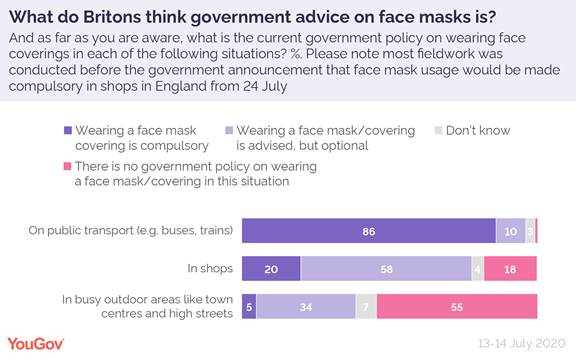
Most Britons (55%) don’t think the Government has a policy on wearing a face mask in settings like town centres and high streets. A further third (34%) think official advice has been to wear masks but compliance remains optional, and 5% think masks are mandatory in such spaces already.
Britons are, however, well aware that face masks are currently compulsory on public transport (86%).
Brits haven’t seen
politicians leading by example on face masks
Face mask usage in Britain has been low compared to other countries, and this is true among our politicians as well. This weekend marked the first time that Boris Johnson had been seen in public wearing a face mask.
This did not go unnoticed by the general public, with 70% of Britons saying they had seen the Prime Minister wearing his facial covering, although it is not clear how many thought they had seen him protecting his face prior to the weekend’s publicity.
The facial covering trend had not yet caught on with other politicians at the time the survey was conducted, and this is reflected in the results. The only other political figure a sizeable proportion of the population have seen sporting a face covering is Nicola Sturgeon, at 38%.
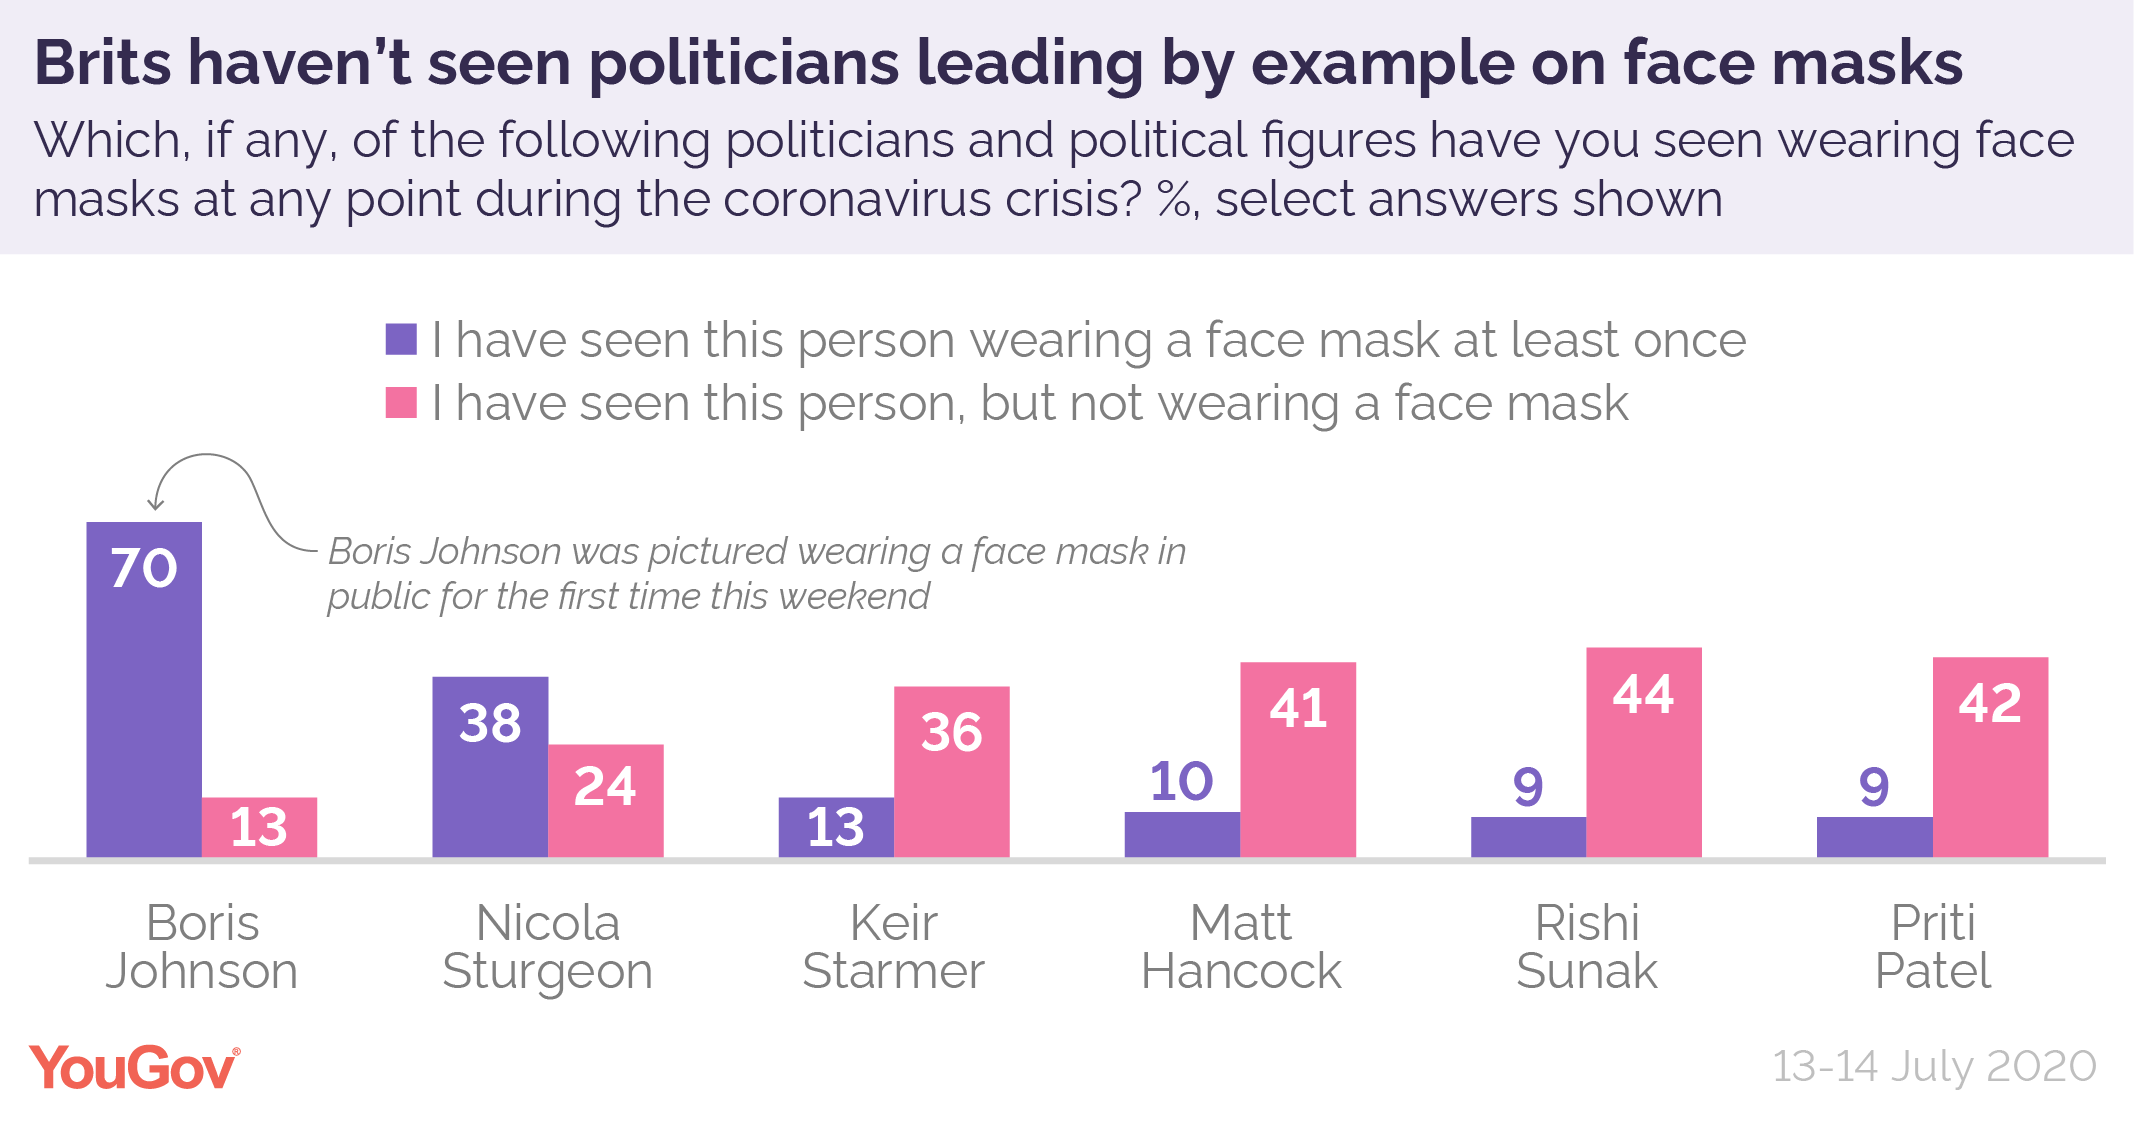
Just 13% reported having seen Keir Starmer donning a mask, 10% for Matt Hancock and 9% for Rishi Sunak and Priti Patel. While obviously these latter politicians receive far less media attention than the Prime Minister, the number of Britons who don’t think they seen these people wearing a mask far outnumber those that think they have.
(YouGov)
July 15, 2020
Source: https://yougov.co.uk/topics/health/articles-reports/2020/07/15/why-wont-britons-wear-face-masks
647-43-09/Poll
Pandemic improves finances for a third of first-time home buyers
First-time buyers are over twice as likely as the average Brit to have benefitted financially from the coronavirus crisis – but getting a mortgage has become harder
A third of people who plan to buy their first home within the next year (32%) say the COVID-19 pandemic has been positive for their finances. In contrast, this is only the case for 14% of all Brits. And while 34% of the public have felt a negative financial impact, this figure is slightly lower among first-time buyers (30%).
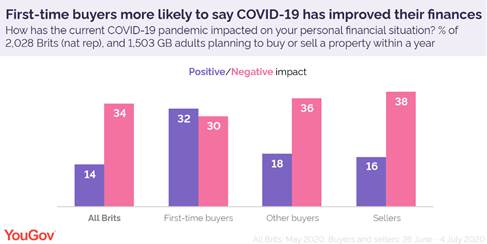
Other buyers, who have previously purchased a property, have not benefitted in the same way. But they have fared a tad better than the average person, with 18% reporting the pandemic has improved their finances. Just over a third (36%) say the opposite, which is similar to the wider public.
People planning to sell a property within a year are more likely than average to have been negatively affected by the coronavirus crisis. Two in five (38%) say it has made their finances worse, while one in six have seen their financial situation improve (16%).
These figures are from before the Government announced a temporary stamp duty holiday last week. Sellers, who are trying to shift expensive properties, may be able to increase their asking prices and could see a slight change of fortune – although prices have been falling for four consecutive months.
First-time buyers struggle to access mortgages as choice remains limited
The cut in stamp duty means the tax only kicks in after £500,000 instead of at £125,000 for existing homeowners or £300,000 for first-time buyers. Buyers can save thousands of pounds – if asking prices don’t increase as a result.
But getting a mortgage may be the bigger hurdle for many, especially first-time buyers. Among all buyers planning to buy within a year, one in six (17%) have already applied for a mortgage – and the verdict is mixed.
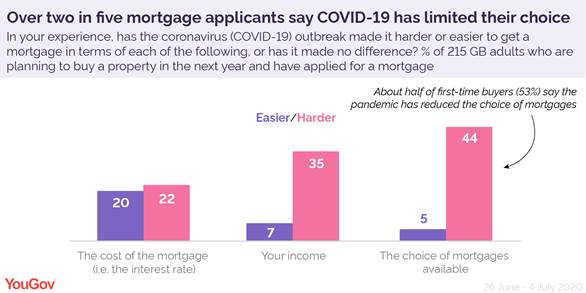
The most common issue is that there are simply fewer mortgages available, with over two in five buyers who have applied for one (44%) saying the limited choice has made it harder to get approved. This figure is much higher among applicants who are first-time buyers (53%), but even over a third of those who have previously bought (36%) have struggled as a result.
Many banks scrapped their higher loan-to-value deals when the coronavirus outbreak hit and have been slow to re-introduce them, leaving those who can only pay 5-10% of their deposit with few options.
A third of buyers who have applied for a mortgage (35%) also say the pandemic has made it harder in terms of income. This could be either be from banks increasing their requirements or as a result of reduced earnings.
In this instance, there’s no real difference between applicants who are first-timers (36%) and those who have previously bought a property (34%) - possibly because the former are more likely to have benefitted financially from the pandemic.
A fifth of buyers who have applied for a mortgage (20%) say the pandemic has made it easier in terms of cost while 22% say the contrary. This is despite the Bank of England slashing interest rates to their lowest ever at 0.1% in March.
(YouGov)
July 17, 2020
647-43-10/Poll
Majority of Britons say that transgender people face discrimination in Britain
7 in 10 Britons believe transgender people face discrimination, a quarter say they face a great deal.
New research from Ipsos MORI carried out online among British adults aged 18-75 finds that 70% of Britons believe that transgender people face discrimination, with a quarter (26%) saying they face a great deal.
Most would feel comfortable with transgender people in different settings, but still one in five say they would feel uncomfortable. Around half of Britons say they would be comfortable if a close friend or relative was transgender (56%), if their GP was transgender (51%) and if a future Prime Minister was transgender (47%), with around one in five saying they would be uncomfortable (18%, 22% and 21% respectively).
 However,
acceptance differs significantly by political orientation, gender identity and
age – with Labour voters, women and Gen Z more likely
to feel comfortable with transgender people in different scenarios. For
example, about two-thirds (68%) of Gen Z say they would be comfortable if a
close friend or relative was transgender compared with 62% of Millennials, 55%
of Gen X and just half (49%) of Baby Boomers.
However,
acceptance differs significantly by political orientation, gender identity and
age – with Labour voters, women and Gen Z more likely
to feel comfortable with transgender people in different scenarios. For
example, about two-thirds (68%) of Gen Z say they would be comfortable if a
close friend or relative was transgender compared with 62% of Millennials, 55%
of Gen X and just half (49%) of Baby Boomers.
Biological sex and gender
identity
Regarding the question often at the centre of trans rights debates, public opinion falls more on the side of gender identity as separate from biological sex. Just over half (54%) of the public think gender identity doesn’t have to be directly linked to biological sex. This is compares with three in 10 (30%) who think gender and biological sex are always linked, while 14% don’t know. Women are more likely to think that gender can be separate from biological sex – with 59% thinking this compared with just 49% of men.
Opinion is split regarding
the progression of transgender rights.
A third (33%) believe transgender rights haven’t gone far enough. Yet,
one in five think transgender rights have gone too far in Britain (19%), and
another one in five say they have gone as far as they should (21%) (a quarter
say they don’t know).
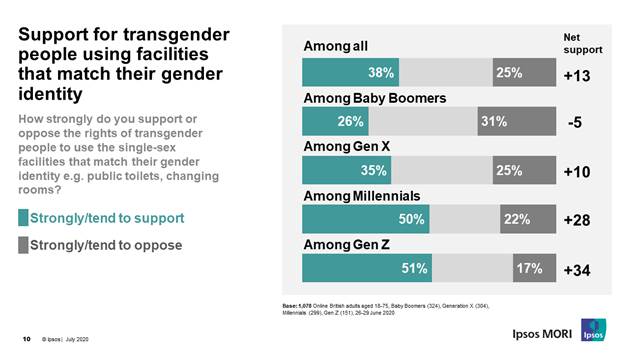
Four in ten (38%) support the rights of transgender people to use public
facilities that match their gender identity (e.g. toilets or changing rooms),
while a quarter oppose this (25%). Women are more supportive of transgender rights
to use public facilities that match their gender identity compared with men
(43% vs 33%) ).
Younger people are more accepting, familiar with, and supportive of transgender people
Support for transgender rights differs significantly with age – over half of Gen Z (56%) say transgender rights have not gone far enough compared with 39% of Millennials, 33% of Gen X and just one in five (20%) of Baby Boomers. In addition, half of Gen Z (51%) and Millennials (50%) support transgender people using public facilities that match their gender identity compared with a third of Gen X (35%) and just a quarter of Baby Boomers (26%).
 Younger people are also far more
likely to say they are familiar with people who use gender neutral terms (such
as “they/them” or “xe”). Seven in ten (69%) of Gen Z
have heard of, met or know someone who uses gender neural terms, compared with
just a quarter of Baby Boomers (25%).
Younger people are also far more
likely to say they are familiar with people who use gender neutral terms (such
as “they/them” or “xe”). Seven in ten (69%) of Gen Z
have heard of, met or know someone who uses gender neural terms, compared with
just a quarter of Baby Boomers (25%).
Commenting on the findings, Hannah Shrimpton, Associate Director at Ipsos MORI, said:
These findings show a
divided public on transgender rights and varying levels of acceptance of
transgender issues. Although the majority feel transgender people face
discrimination, only a minority (a third) feel that transgender rights should
go further. Generally, people feel that gender identity is not intrinsically
lined to biological sex, but on a topic that is coming under increasingly
heated and contentious debate – only four in ten support transgender people’s
rights to access public facilities that match their gender identity. However,
this is a changing landscape – the wider societal trend has been one of growing
liberality on a number of issues including gender, gender identity and LGBTQ+.
These shifts are partly driven by generational differences and we can see in this
survey that there is greater support and acceptance of transgender people among
the young.
(Ipsos MORI)
July 15, 2020
647-43-11/Poll
Nearly 9 in 10 Britons say it is either essential or important to wear a facemask in public to stop the spread of coronavirus
While a large majority agree that it is important to wear a facemask in various situations, there is also strong support for government rules making it mandatory to wear one in shops.
In a new survey by Ipsos MORI, almost 9 in 10 (86%) Britons say it is either essential or important for people to wear a facemask in certain public situations, such as shopping or using public transport, to stop the spread of coronavirus. More than 1 in 3 (37%) say it is essential. Just 1 in 10 say it is not important.
 Two-thirds
(67%) of Britons support making it the law to wear a face mask in shops. Just
16% oppose. 13% neither support nor oppose and 3% say they don’t know.
Two-thirds
(67%) of Britons support making it the law to wear a face mask in shops. Just
16% oppose. 13% neither support nor oppose and 3% say they don’t know.
One in four (25%) say that having rules in place making it mandatory to wear a mask while visiting shops will make them more likely to go shopping, 21% say less likely and half (51%) say it will make no difference. 42% of 18-24s say these new rules will make the more likely to go shopping but 64% of those aged 65-75 say it will make no difference.
 Three
in ten (28%) say they already wear a mask, up from 7% at the end of April.
Whilst 55% say they are likely to wear one in the near future, an increase from
34%. 15% say it is unlikely they will wear a mask in the near future (down from
51%).
Three
in ten (28%) say they already wear a mask, up from 7% at the end of April.
Whilst 55% say they are likely to wear one in the near future, an increase from
34%. 15% say it is unlikely they will wear a mask in the near future (down from
51%).
Those that either wear a mask now or plan to do so cite the following as the main reasons:
- Want to stop the spread of coronavirus to others 59%
- I want to protect myself 52%
- The government has said we should 47%
- The scientific advice says we should 42%
Those that say it is unlikely they will wear a mask tend to give the following reasons:
- I don’t believe facemasks prevent the spread of coronavirus 39%
- It would be uncomfortable 35%
- It goes against my personal freedoms 28%
A full list of reasons given can be found in the accompanying slide pack.
Commenting on the findings Ipsos MORI Research Director, Keiran Pedley said:
These numbers show strong
public support for the principle of wearing a mask in certain public situations
to combat the spread of coronavirus. Two-thirds support rules making it
mandatory to wear a mask in shops. However, we should be careful about reading
too much into the impact such rules will have on behaviour
in the short term. Although there is no net negative impact on the likelihood
of Britons to go shopping as a result of these rules, half currently say it
will make no difference rising to almost two-thirds among those aged 65-75.
(Ipsos MORI)
July 13, 2020
NORTH AMERICA
647-43-12/Poll
Fox News Poll: Biden holds lead over Trump as coronavirus concerns grip nation
Coronavirus infected the election.
The virus is the top issue to voters, over half of them disapprove of how President Trump’s handling it, and they increasingly trust Joe Biden to do a better job on it. That keeps Biden ahead in the presidential race, according to a Fox News survey of registered voters.
Biden leads by 8 points over Trump, 49-41 percent.
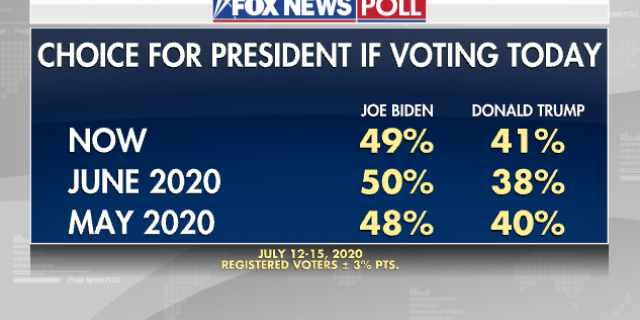
That advantage is outside the margin of error. However, neither candidate receives 50 percent support and 10 percent are undecided/back someone else -- and the race has narrowed since June, when the former vice president was up by 12 points (50-38 percent).
There’s a large gender gap, as Trump is ahead by 5 points among men, while Biden is up 19 among women. Biden also leads among Blacks (+64), Hispanics (+30), millennials (+22), suburban voters (+11) and independents (+11).
Seven percent of those approving of Trump’s job performance back Biden.
CLICK HERE TO READ THE POLL RESULTS
Whites with a college degree (+3) and without a degree go for Trump (+9). He’s also the choice among White evangelical Christians (+43), rural voters (+9) and seniors (+1). Last month, seniors went for Biden by 10.
Biden is preferred over Trump among extremely motivated voters (+8 points), those extremely likely to vote (+9) and those who feel it is extremely important their candidate wins (+13).
However, the number of Biden supporters who are extremely likely to vote drops 25 points if the virus is hitting so hard in November as to, for instance, close restaurants. Because the drop-off would just be 16 points among Trump supporters, that puts Biden’s lead at just 3 points over the president in that still-raging coronavirus scenario.
The virus is a campaign issue -- but it could also be a factor, like bad weather, that reduces turnout.
Meanwhile, in contrast to 2016 when voters viewed both candidates as unlikable, Biden garners a net +11 favorable rating: 54 percent view him favorably vs. 43 percent unfavorably.
For Trump, it’s 43 percent favorable vs. 56 percent unfavorable. That gives him a net -13 points. Indeed, nearly half, 47 percent, have a “strongly” unfavorable opinion compared to 31 percent for Biden.
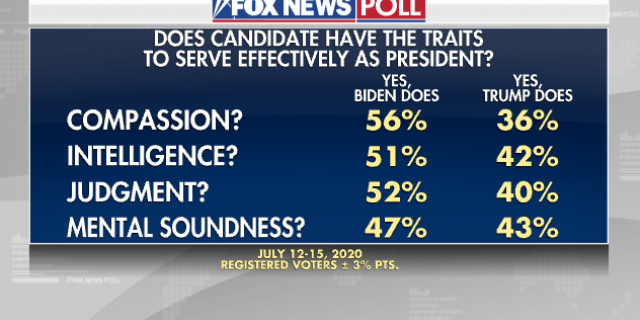
Voters believe Trump lacks the key traits for the Oval Office: less than half think he has the mental soundness (43 percent), intelligence (42 percent), and judgment (40 percent) to serve effectively as president. For reference, 36 percent felt he had the necessary judgment in October 2016, less than a month before his election victory.
Biden bests Trump on each measure: 47 percent are confident in his mental soundness, 51 percent believe he has the intelligence and 52 percent say he has the judgment.
Notably, 50 percent eludes both candidates on mental soundness. Those ages 65+ think Trump has it by a 1-point margin and that Biden lacks it by 3 points.
The biggest trait difference is on compassion: 56 percent believe Biden has it compared to 36 percent for Trump.
CLICK HERE TO GET THE FOX NEWS APP
All that helps explain why more trust Biden to do a better job than Trump on race relations (+21) and coronavirus (+17 points). Last month, more trusted Biden on the virus by 9 points. The two are trusted about equally on the economy (Biden +1). It was a 3-point Trump edge in May.
Twenty-nine percent rank coronavirus the No. 1 problem facing the country. That tops the 15 percent who cite the economy and 10 percent who say race relations.
Eighty-six percent are concerned about coronavirus spreading, and the number saying the virus is “not at all” under control jumped 18 points since last month, from 33 percent to 51 percent.

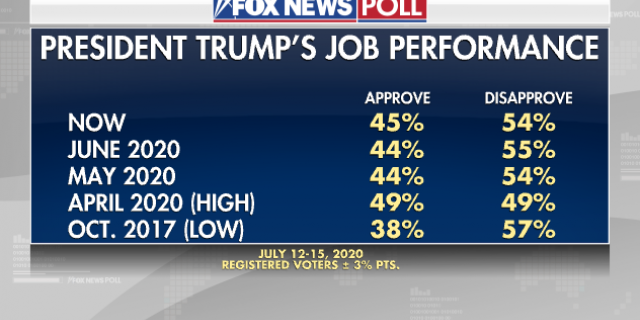
The president’s ratings are underwater by 13 points on the pandemic (43 percent approve, 56 percent disapprove) and by 21 points on race relations (35-56 percent).
![]()
His ratings on the economy split 47-47. That’s down from a high 56 percent approval in January and is only the fourth time he hasn’t received positive marks on the issue. Currently, just 26 percent say they are better off than four years ago and most, 69 percent, rate the economy negatively.
Trump’s overall job rating is upside-down by 9 points: 45 percent approve and 54 percent disapprove. Last month, it was 44-55 percent. His best ratings, 49-49 percent, came in April.
Voters favor a more aggressive response to the virus than the president.
Majorities favor a national stay-in-place order for everyone except essential workers (59 percent) and a national mask-wearing order for indoor spaces (71 percent).
Sixty-three percent favor letting Americans vote by mail during the pandemic. Democrats (82 percent) and independents (60 percent) like the idea, while Republicans split (43 favor, 47 oppose).
Two-thirds want children to attend public schools this fall in person, to some extent. That includes 15 percent who think their public schools should fully reopen as usual, 21 percent who prefer opening with social distancing and masks, and 31 percent who want a mix of in-person and remote. Twenty-five percent would prefer schools be fully remote.
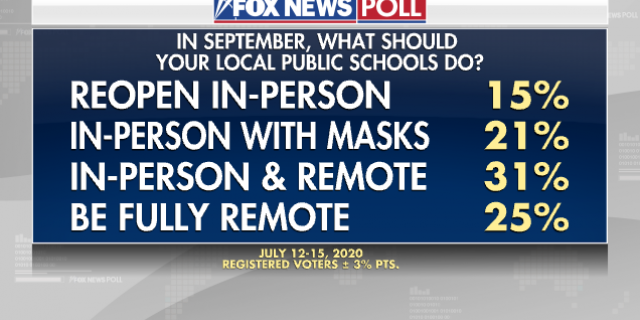
Parents and nonparents hold similar views, but moms and dads with kids at home see things differently. Dads are more likely than moms to favor some kind of reopening (80 vs. 54 percent). Moms are more inclined than dads to support being fully remote (37 vs. 15 percent).
![]()
There’s also a partisan gap. More Republicans (84 percent) than Democrats (55 percent) say schools should reopen to some extent, while nearly four times as many Democrats (38 percent) as Republicans (10 percent) prefer fully remote.
By a 62-32 percent margin, voters favor continuing the extra $600/week unemployment benefit Congress passed in response to the pandemic. Most Democrats (78 percent) and a large minority of Republicans (46 percent) favor extending it.
More than twice as many voters think candidates should only hold virtual events right now (62 percent) as say it is okay to campaign in front of crowds (28 percent).
Pollpourri
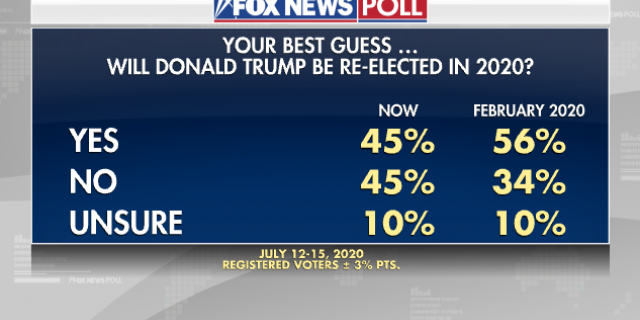
The number predicting Trump will be reelected has dropped 11 points since February. At that time, 56 percent thought he would win. Now, 45 percent think so. The decline in reelection expectations comes from both Democrats (-13 points) and Republicans (-9).
Overall, 61 percent are satisfied with their candidate choices, but 33 percent think the ballot should include a “none of the above” option. More Trump supporters (73 percent) than Biden supporters (62 percent) are happy with their choices.
The largest portion of those backing both Biden (49 percent) and Trump (47 percent) say there is “no chance at all” they will change their vote. However, more of those supporting Trump (15 percent) than Biden (9 percent) say there is a “strong” chance they could change their mind.
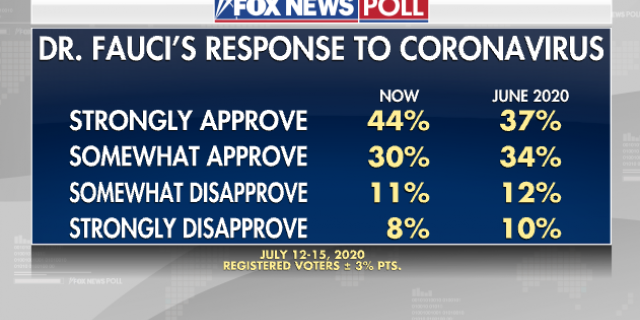
Far more approve of the job infectious disease expert Dr. Anthony Fauci (74 percent) is doing on coronavirus than Trump’s performance (43 percent). Moreover, 44 percent “strongly” approve of Fauci, up from 37 percent in June.
Trump first wore a mask in public July 11. Eighty-one percent of voters report wearing a mask all or most of the time when in public, up from 72 percent in May. Ninety percent of Democrats and 71 percent of Republicans wear a mask. Six percent of Republicans never wear one, down from 14 percent in May. Among Democrats, 1 percent say never, down from 3 percent.
Generally, 80 percent have a favorable opinion of people who wear masks (June 13-16, 2020).
Conducted July 12-15, 2020, under the joint direction of Beacon Research (D) and Shaw & Company (R), this Fox News Poll includes interviews with 1,104 randomly chosen registered voters nationwide who spoke with live interviewers on both landlines and cellphones. The poll has a margin of sampling error of plus or minus 3 percentage points for all registered voters.
(Fox News)
July 19, 2020
647-43-13/Poll
How Trump compares with other recent presidents in appointing federal judges
President Donald Trump has made big changes to the federal judiciary since taking office in 2017. Trump has appointed two Supreme Court justices – Neil Gorsuch and Brett Kavanaugh – as well as nearly 200 other judges with lifetime appointments to lower federal courts.
So how does Trump compare with other presidents in the number and personal characteristics of the judges he has appointed to the federal bench so far? Below are four charts that compare Trump’s record on judicial appointments to those of his recent White House predecessors, going back to Jimmy Carter.
All findings are based on a Pew Research Center analysis of data from the Federal Judicial Center, the research and education arm of the federal judiciary. The analysis focuses on judges already confirmed to their positions by the U.S. Senate – not nominees who are still awaiting votes.
How
we did this
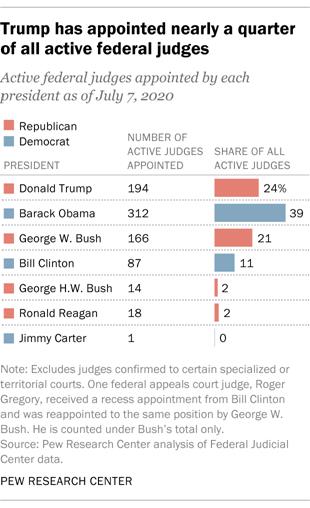
Trump has now appointed almost a quarter of all active federal judges in the United States. As of July 7, there were 792 active judges serving across the three main tiers of the federal court system: the Supreme Court, 13 regional appeals courts and 91 district courts governed by Article III of the U.S. Constitution. In his first term, Trump has appointed 194 of those judges, or 24% of the total. (This analysis excludes appointees to certain specialized courts, such as the U.S. Court of International Trade, as well as appointees to non-Article III territorial courts in Guam, the Northern Mariana Islands and the Virgin Islands.)
During his eight years in office, Barack Obama appointed the largest share of currently active federal judges, at 39%. Another two-term president, George W. Bush, appointed 21%. Around one-in-ten active judges (11%) were appointed by Bill Clinton, while much smaller shares were appointed by George H.W. Bush (2%) and Ronald Reagan (2%). One active federal judge, Carmen Consuelo Cerezo of the District of Puerto Rico, was appointed by Jimmy Carter.
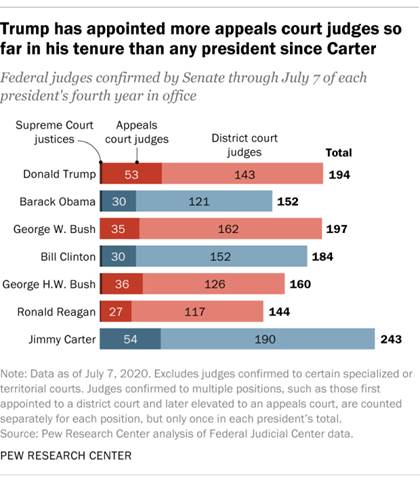
Trump has appointed more federal appeals court judges to date than any recent president at the same point in their presidency. The overall number of federal judges Trump has appointed to date (194) is similar to the number appointed by George W. Bush at the same juncture in his presidency (197). Trump, however, stands out for his unusually large number of appeals court judges — the powerful regional jurists who have the final word on most appeals that do not end up in the Supreme Court and who frequently end up becoming Supreme Court justices themselves. Eight of the nine current high court justices, including both of Trump’s appointees, previously served as appeals court judges.
Trump has appointed 53 appeals court judges to date, far higher than the number appointed by nearly every other recent president at the same point in their tenure. The exception is Carter, who successfully appointed 54 appeals court judges by July 7 of his fourth (and final) year in office.
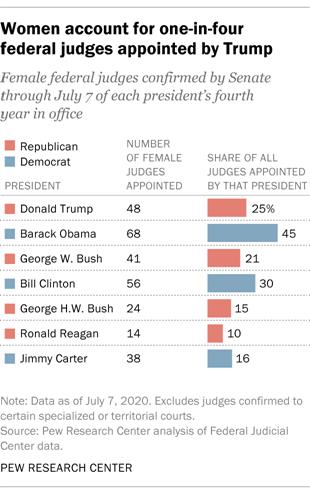
Trump has appointed a larger share of female judges than other recent Republican presidents but a smaller share than recent Democratic presidents. As of July 7, a quarter of the federal judges Trump has appointed are women. That’s higher than the share of women judges appointed by George W. Bush (21%) and George H.W. Bush (15%) at the same point in their presidencies, but lower than the share appointed by Obama (45%) and Clinton (30%) at the same point in theirs.
Recent Democratic presidents have been more likely than recent Republican presidents to appoint women as judges, but chief executives in both parties have become more likely over time to do so.
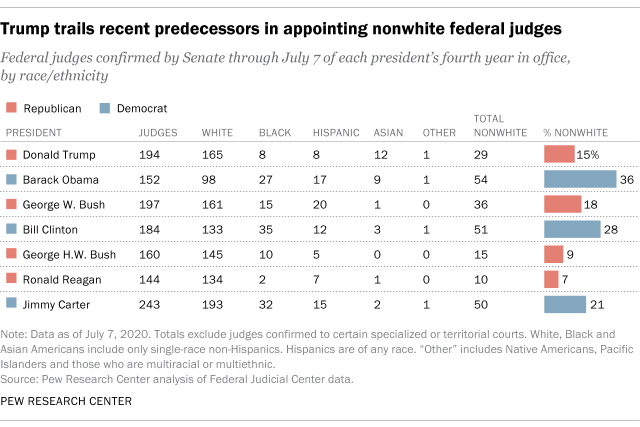
So far, Trump has been more likely than other recent presidents to appoint judges who are white. More than eight-in-ten (85%) of the federal judges appointed by Trump through July 7 are white, while 15% are of a different race or ethnicity. The last president to appoint such a high share of white jurists through July 7 of his fourth year in office was George H.W. Bush; 91% of his judicial appointees at the time were white. Obama, meanwhile, stands out as the president who appointed the highest share of nonwhite judges by the same point in his tenure: More than a third of Obama’s appointed judges (36%) were nonwhite.
(PEW)
July 15, 2020
647-43-14/Poll
Most Americans support gender equality, even if they don’t identify as feminists
feminist movement have been accepted across the political spectrum in the United States, even among Americans who don’t personally identify as feminists, according to a Pew Research Center survey about gender equality that comes 100 years after the ratification of the 19th Amendment.
For example, a majority of Democrats and Republicans – whether they identify as feminists or not – say it is very important for women to have equal rights with men. Similarly, majorities in both partisan coalitions support adding the Equal Rights Amendment to the U.S. Constitution.
The survey comes as scholars and commentators debate the impact of feminism on women’s rights and broader American culture. Some argue that feminism has become universal and that the values and principles of women’s equality and empowerment have already been adopted to a large extent by society, no longer requiring identification with the label of feminist.
How
we did this
While the Center’s survey finds broad agreement on some aspects of gender equality, it also finds differences between self-identified feminists and non-feminists on other measures.
Feminists, for instance, are much more likely than non-feminists to say the country has not gone far enough when it comes to giving women equal rights with men (74% vs. 39%). Feminists are also more likely to say the bigger problem is people not seeing discrimination against women where it really does exist, rather than people seeing discrimination against women where it really does not exist. About eight-in-ten adults who identify as feminist (81%) say not seeing discrimination is the bigger problem, compared with 53% of non-feminists.
To some extent, these differences can be explained by partisanship: Feminists are far more likely than non-feminists to identify with or lean toward the Democratic Party. Overall, Democrats and those who lean Democratic are more likely than Republicans and Republican leaners to say gender equality is very important, and they are more than twice as likely to say the country has not gone far enough in giving women equal rights (76% vs. 33%). And while most Democrats (85%) say the bigger problem is people not seeing discrimination against women where it really does exist, a much smaller share of Republicans (46%) say the same.
But even when taking partisanship into account, differences exist between feminists and non-feminists. In both parties, for example, there are gaps of around 25 percentage points between feminists and non-feminists in the shares saying the country has not gone far enough in giving women equal rights with men. About half of Republican feminists (49%) say this, compared with a quarter of Republican non-feminists. While 85% of Democratic feminists say the country has not gone far enough, the share falls to 60% among Democratic non-feminists.
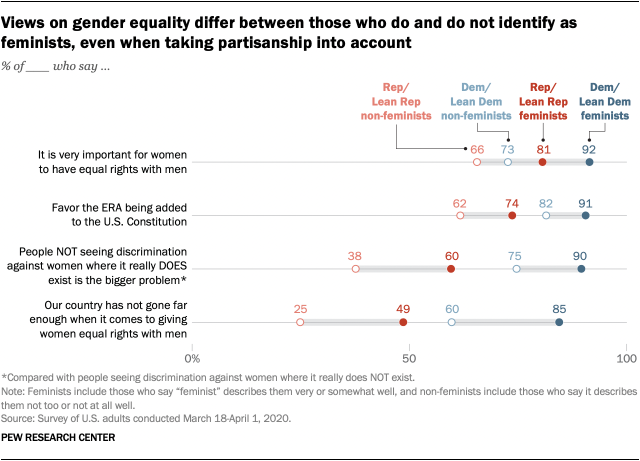
The same pattern appears on other questions. Six-in-ten Republican feminists say the bigger problem is people not seeing discrimination against women where it really does exist, compared with 38% of Republican non-feminists. Nine-in-ten Democratic feminists say this, compared with 75% of Democratic non-feminists.
Despite these differences, Democrats – including those who don’t identify as feminists – are more likely than both Republican feminists and non-feminists to say the country hasn’t gone far enough in giving women equal rights and that the bigger problem is people not seeing gender discrimination where it really exists. They’re also more likely to favor adding the Equal Rights Amendment to the Constitution – a view held by a majority of Americans overall, including 62% of non-feminist Republicans.
(PEW)
July 14, 2020
647-43-15/Poll
Activism on social media varies by race and ethnicity, age, political party
From global protests against racial injustice to the 2020 election, some Americans who use social media are taking to these platforms to mobilize others and show their support for causes or issues. But experiences and attitudes related to political activities on social media vary by race and ethnicity, age, and party, according to a Pew Research Center survey of U.S. adults conducted June 16-22, 2020.
People can be politically active on social media in many ways. This survey asked Americans about four different types of activities that they may have engaged in on these platforms. Overall, about one-third of social media users (36%) say they have used sites like Facebook, Twitter and others in the past month to post a picture to show their support for a cause, look up information about rallies or protests happening in their area (35%) or encourage others to take action on issues they regard as important (32%). A smaller share (18%) reports using a hashtag related to a political or social issue on social media during this time.
How
we did this
Hispanic and Black social media users (46% and 45%, respectively) are more likely than white users (29%) to say they have looked up information about protests and rallies in their area on social media in the past month.
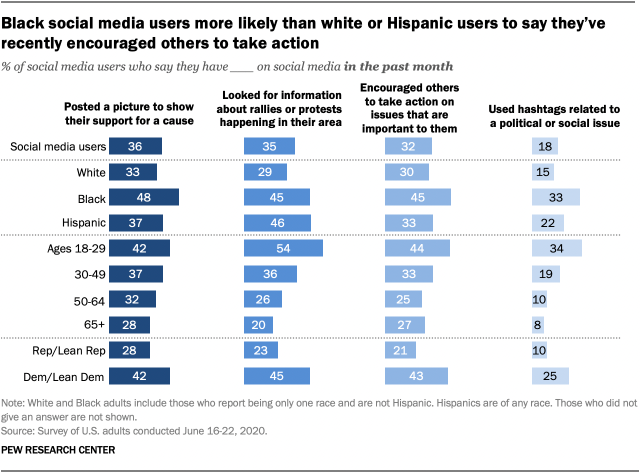
But in certain activities, Black users stand out: 48% of Black social media users say they have posted a picture on social media to show their support for a cause in the past month, compared with 37% of Hispanic users and 33% of white users. Black adults who use social media (45%) are also more likely than their Hispanic (33%) or white (30%) counterparts to say that in the past month they’ve taken to social media to encourage others to take action on issues that are important to them.
Black users are also more than twice as likely as white users to say they have used a hashtag related to a political or social issue on these platforms in the past month (33% vs. 15%), while Hispanic users fall in between these two groups (22%).
Social media engagement for causes or issues also varies by age. Just over half of social media users ages 18 to 29 (54%) say they have used these sites in the past month to look for information about rallies or protests happening in their area, compared with 36% of those ages 30 to 49, 26% of those 50 to 64 and 20% of those 65 and older. Social media users under the age of 30 are also more likely than those 30 and older to say they have used a hashtag related to a political or social issue and encouraged others to take action on issues that they see as important, while there are smaller age gaps when it comes to posting a picture to show support for a cause.
Racial differences are also present within younger groups, with younger Black social media users being particularly likely to post hashtags or encourage others to be politically engaged. For example, 55% of Black social media users ages 18 to 49 say they posted a picture to show support for a cause in the past month, compared with fewer than four-in-ten Hispanic (37%) or white users (36%) in the same age range. Among adults under the age of 50, Black users (44%) are about twice as likely as their white (22%) or Hispanic (23%) counterparts to say they have used a hashtag in the past month related to a political or social issue.
Partisanship is also a factor. About four-in-ten or more Democrats and those who lean Democratic say that in the past month they have posted a picture to show support for a cause, used social media to look for information about rallies or protests happening near them, or encouraged others to take action on an issue that is important to them. This compares with only about three-in-ten or fewer Republicans and Republican leaners who say they have done this. Democrats are also more than twice as likely as Republicans to say they have used a hashtag related to a political or social issue in the past month (25% vs. 10%).
Although the survey did not specifically ask respondents the kind of topics they were posting or looking up, these findings come at a time when a majority of Americans are having conversations about race and racial inequality, according to a separate Center survey conducted in June 2020, following the killing of George Floyd in police custody at the end of May.
A separate Pew Research Center analysis of tweets found an unprecedented use of the #BlackLivesMatter hashtag on Twitter. The hashtag had been used roughly 47.8 million times between May 26 and June 7. And a 2018 Center report found that people take to social media to discuss a variety of political and social issues, ranging from #MeToo to #MAGA to #LoveWins.
Racial
and ethnic differences on importance of these platforms for finding like-minded
people, getting involved with issues
Social media users were also asked in three distinct ways how important these sites were to them personally as a venue for their political activities. Black and Hispanic users were found to be particularly likely to value social media for these activities.
Overall, 45% of users say that social media is very or somewhat important to them personally when it comes to finding other people who share their views about important issues, while similar shares say the same for getting involved with political or social issues (44%) or giving them a venue to express their political opinions (40%).
Black and Hispanic social media users see more personal benefits than white users when it comes to these types of civically minded activities.
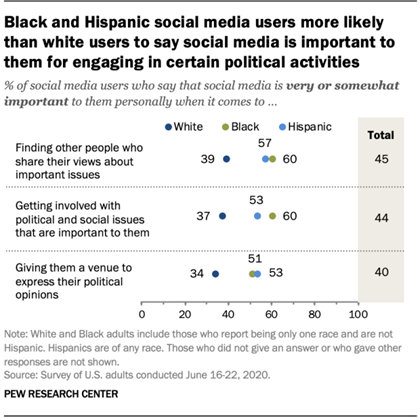
Black and Hispanic social media users (60% and 57%, respectively) are more likely than white users (39%) to say that social media is very or somewhat important to them personally for finding other people who share their views about important issues. There are similar racial gaps when asked about these sites’ personal importance for getting involved with issues they care about or giving them a venue to express their political opinions.
Users who are Democrats are also more likely than Republicans to say these sites are important to them personally for engaging in certain types of civic activities. Some 55% of Democrats say that social media is very or somewhat important to them for getting involved with political or social issues that are important to them, compared with 32% of Republicans who say the same (including those who lean to each party). Similar partisan gaps are evident when the issue is the importance of social media in finding others who share users’ views (54% vs. 36%) and in giving users a venue to express their political opinions (47% vs. 33%).
Younger social media users also are more likely than older users to say social media is important to them in these ways. About six-in-ten (58%) of those ages 18 to 29 say that social media is very or somewhat important for them when getting involved with political and social issues that are important to them. Among older adults, 43% of those 30 to 49 say this, while a smaller share (36%) of those 50 or older say this.
A majority of social media users ages 18 to 29 (59%) say social media is at least somewhat important to them for finding others who share their views on important issues, compared with smaller shares of those 30 to 49 (45%). Users 50 and older (37%) are the least likely to say social media is personally important to them in these ways.
Overall, the levels of personal importance that social media users place on these platforms for political engagement are fairly consistent with the last time the Center asked these questions, in a 2018 survey. For example, 43% of social media users said then that these sites were somewhat or very important to them personally for finding others who share their views about important topics, about on par with the 45% of social media users today who say the same. There is also little or no difference in the level of importance that users place on getting involved with social and political issues that are important to them and using social media as a venue to share their political opinions.
There
have been shifts in how much some users – particularly younger ones – view
social media platforms as important for certain forms of online activism
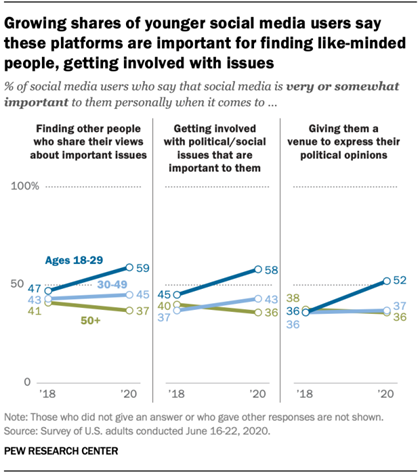
The share of 18- to 29-year-old social media users who say that these platforms are at least somewhat important to them for finding other people who share their views about important topics has risen from 47% in 2018 to 59% today. There have also been double-digit increases among younger users when it comes to getting involved with political or social issues and having a venue to express their opinions. By comparison, there has been little to no change on these questions for social media users ages 30 or older.
Democrats are more likely to describe these platforms as important to them personally than in the past. Some 44% of Democrats said in 2018 they found social media to be at least somewhat important to them personally for getting involved with political or social issues, compared with 55% today. There have also been increases among Democrats when it comes to the importance of finding others on social media who share their views and giving them a place to express political opinion. However, there has been little or no change on these questions for Republican social media users.
And while these shares for both Black and white users are largely unchanged, the share of Hispanic social media users who say these sites are at least somewhat personally important to them for finding other people who share their views has grown from 47% to 57% over the past two years. Hispanic users are also more likely today than in 2018 to describe social media as very or somewhat important to them personally for getting involved in social or political issues they care about.
(PEW)
July 13, 2020
647-43-16/Poll
Black Adults Disproportionately Experience Microaggressions
More than any other racial group, Black Americans report experiencing negative treatment by others that falls under the broad category of microaggressions. About one in three Black adults (32%) say that, in the past year, people have acted as if they were "better than you," while one in four (25%) say people have acted as if "you were not smart."
- Roughly one in five Black Americans say they have experienced people treating them with less courtesy (22%) and respect (20%) than others. Similar percentages of Black adults say people have acted as if they were dishonest (19%) or as if they were afraid of them (18%).
- Fourteen percent of Black adults report that they have received worse service than other people at restaurants or stores. This compares with 4% of Asian adults, 4% of Hispanic adults and 2% of White adults who report having the same experiences.
Experiences With Microaggressions, by Racial Group
In your day-to-day life over the past 12 months, how often did any of the following things happen to you?
|
Black adults |
Hispanic adults |
Asian adults |
White adults |
|
|
% Very often/Often |
% Very often/Often |
% Very often/Often |
% Very often/Often |
|
|
People acted as if they were better than you |
32 |
21 |
17 |
10 |
|
People acted as if they thought you were not smart |
25 |
12 |
9 |
5 |
|
You were treated with less courtesy than other people |
22 |
8 |
7 |
4 |
|
You were treated with less respect than other people |
20 |
7 |
5 |
4 |
|
People acted as if they thought you were dishonest |
19 |
4 |
4 |
1 |
|
People acted as if they were afraid of you |
18 |
3 |
4 |
2 |
|
You received worse service than other people at restaurants or stores |
14 |
4 |
4 |
2 |
|
GALLUP PANEL, JUNE 23-JULY 6, 2020 |
||||
The latest results are based on a June 23-July 6 survey conducted by web using the Gallup Panel, a probability-based panel of U.S. adults, in English. Learn more about the findings from this survey and others at the Gallup Center on Black Voices.
Across all microaggressions Gallup measured, Black Americans were much more likely than White, Hispanic and Asian Americans to report having these experiences. On most measures, Asian and Hispanic adults were slightly more likely than White adults to report these experiences with microaggressions.
Gallup also asked about overt aggressions experienced in the past year. Nine percent of Black adults report having been called a name or insulted, and 5% say they had been threatened or harassed. Two percent of Black Americans report having been the victim of physical violence, compared with less than 1% of each other racial group.
Being Feared, Mistrusted Even More Common for Black Men
On some measures, Black men and women report similar experiences with microaggressions -- including people treating them as if they are better than them, people acting as if they are not smart, being treated with less respect than others and receiving worse service than other customers at restaurants or stores.
Some experiences, however, are reported at higher rates by Black men than by Black women.
Black men (27%) are more than twice as likely as Black women (11%) to say people have acted as if they were afraid of them. Higher rates of Black men than women also report having been treated with less courtesy and having people act as if they are dishonest.
Experiences With Microaggressions, by Race and Gender
In your day-to-day life over the past 12 months, how often did any of the following things happen to you?
|
Black men |
Black women |
|
|
% Very often/Often |
% Very often/Often |
|
|
People acted as if they were better than you |
33 |
32 |
|
People acted as if they were afraid of you |
27 |
11 |
|
You were treated with less courtesy than other people |
26 |
18 |
|
People acted as if they thought you were not smart |
26 |
25 |
|
People acted as if they thought you were dishonest |
23 |
14 |
|
You were treated with less respect than other people |
21 |
18 |
|
You received worse service than other people at restaurants or stores |
16 |
13 |
|
GALLUP PANEL, JUNE 23-JULY 6, 2020 |
||
Gender differences on these three measures are not as pronounced among other racial groups.
Higher Reports of Microaggressions Among Young and Middle-Aged Black Adults
Young Black adults, aged 18 to 39, and middle-aged Black adults, aged 40 to 55, are more likely than older Black adults to report having been on the receiving end of almost all types of microaggressions in the past year. For example, young Black adults, aged 18 to 39, are three times as likely as older Black adults, aged 56 and older, to report having been treated with disrespect.
Four in 10 young (40%) and middle-aged Black adults (40%) say people have acted as if they were better than them, while older Black adults (16%) are less than half as likely to have reported that experience.
Experiences With Microaggressions/Abuse Among Black Americans, by Age Group
In your day-to-day life over the past 12 months, how often did any of the following things happen to you?
|
18-39 |
40-55 |
56+ |
|
|
% Very often/Often |
% Very often/Often |
% Very often/Often |
|
|
People acted as if they were better than you |
40 |
40 |
16 |
|
People acted as if they thought you were not smart |
33 |
31 |
11 |
|
You were treated with less courtesy than other people |
31 |
20 |
12 |
|
You were treated with less respect than other people |
27 |
21 |
9 |
|
People acted as if they thought you were dishonest |
20 |
28 |
10 |
|
People acted as if they were afraid of you |
20 |
25 |
11 |
|
You received worse service than other people at restaurants or stores |
16 |
17 |
11 |
|
You were called a name or insulted |
12 |
10 |
5 |
|
You were threatened or harassed |
6 |
7 |
3 |
|
You were hit, beaten, physically attacked or assaulted |
1 |
5 |
0 |
|
GALLUP PANEL, JUNE 23-JULY 6, 2020 |
|||
While on most measures, Black adults aged 56 and older are less likely than younger Black adults to have these negative experiences, they are more likely than their same-aged peers in other racial groups to experience microaggressions.
Bottom Line
The flashpoints that spark national conversations on racism are often instances of violence, but for many Black Americans, their experiences with mistreatment and discrimination are much subtler and are woven into the routines of their normal, daily lives. Sizable percentages of Black people in the U.S. recall incidents in the past year when they felt they were treated as inferior, with reports of these experiences more prevalent among young Black adults.
Small percentages of other racial groups report having experienced someone being scared of them. Meanwhile, among Black adults, being feared is something that nearly one in five say they have experienced in the past year alone. This figure is even higher among younger Black adults. Microaggressions are reported at an even higher rate among Black men. Indeed, many of the victims of notable events of racism throughout U.S. history have had a similar profile: young, black and male.
These findings give greater context to larger conversations taking place about racism in the U.S. now, as the death of George Floyd at the hands of Minneapolis police officers has spurred wide-ranging conversations about how Black people are treated, not just by law enforcement but in general American life.
(Gallup USA)
July 15, 2020
Source: https://news.gallup.com/poll/315695/black-adults-disproportionately-experience-microaggressions.aspx
647-43-17/Poll
The Degree of Urbanisation's Effect on Happiness
Are people happier living in the countryside or in a city? The European Commission and Gallup collaborated on a study to find out, analyzing the opinions of 360,000 people across 117 countries and territories* based on whether they live in a city, town and semi-dense area, or a rural area.
People were asked to rate their lives on a scale from 0 to 10, with 0 being the worst possible life and 10 being the best possible life. On average, the percentage of people in any given country who gave their lives a score between 8 and 10 is two to four percentage points higher in cities than in rural areas. The urban/rural gap is present regardless of country income level (based on World Bank classifications). People living in towns and semi-dense areas tend to rate their lives at levels that fall in between those living in cities and rural areas.
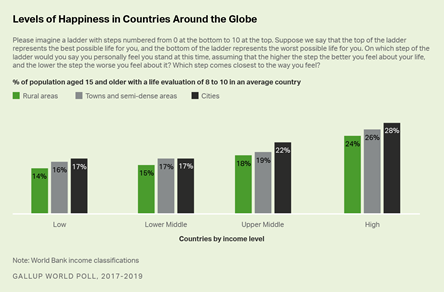
Bar graphs. The average levels of happiness in countries by income and degree of urbanisation. Regardless of country income level, individuals who live in cities tend to have higher levels of happiness.
These results are based on people interviewed via the Gallup World Poll. To define their degree of urbanisation, people's household locations were mapped against a geospatial layer from the European Commission, which identifies cities, towns and semi-dense area, and rural areas around the world using a consistent classification. This classification is called the Degree of Urbanisation and was endorsed by the U.N. Statistical Commission this year.
This analysis represents a novel approach to understanding the living conditions of different populations and a useful tool for policymakers. World Poll data subscribers can download the degree of urbanisation variable for their datasets.
Access to Resources
Potentially contributing to the divides in life ratings, individuals living in cities were more likely to report access to financial resources, the ability to afford food, and having people they can rely on when they are in trouble. For example, people living in rural areas were less likely to report that they have a bank account than those in cities. This is most pronounced in low-income economies, where 18% of rural residents reported having a bank account, as opposed to 30% in cities.
Lack of access to bank accounts can substantially affect peoples' lives. World Bank and Gallup research suggests that bank accounts offer people a pathway out of poverty by helping them invest in education and business opportunities.
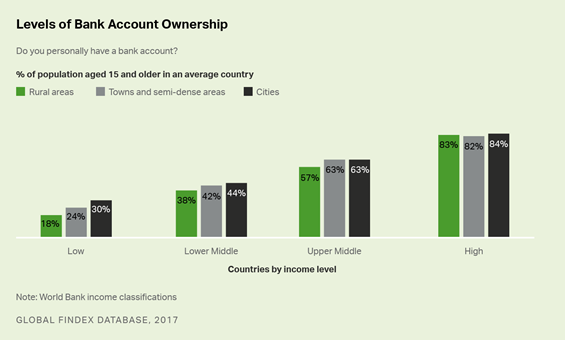
Bar graphs. Average levels of bank account ownership in countries by income and degree of urbanisation. Individuals residing in upper-middle- and high-income economies are substantially more likely than those in low- or lower-middle-income level economies to have bank accounts.
People residing in rural areas in low- and middle-income economies were more likely than city dwellers to report lacking enough money to buy food at times in the past 12 months, despite often living close to the source of food production. Individuals living in towns and semi-dense areas, which include suburbs, were the least likely to lack money to buy food in middle-income and high-income economies.
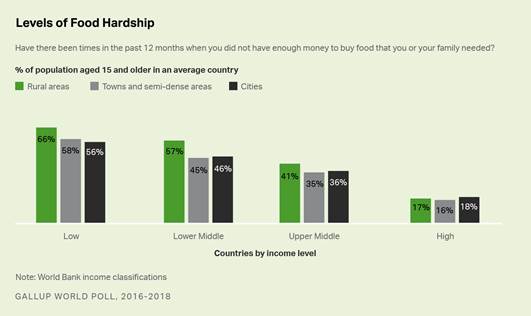
Bar graph. Average levels of food hardship in countries by level of income and degree of urbanisation. Not surprisingly, individuals residing in high-income countries are substantially less likely to report having lacked enough money for food in the past 12 months than those in countries with lower levels of income.
People living in rural areas are often depicted as living in closely knit communities, however, fewer individuals in rural areas than in cities say they have relatives or friends they can count on to help them when they are in trouble. This gap is the biggest in the low-income countries, with 62% of the people in rural areas saying they have family or friends they can count on in times of trouble compared with 69% in cities. This may be in part because in rural economies tend to be less diversified, which means that if one person's income shrinks or disappears, many of their neighbors will be in the same situation, making it harder to help each other.
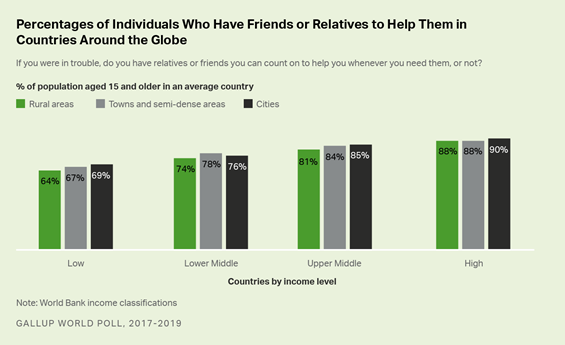
Bar graph. Average percentages of individuals who have friends or relatives to help them by levels of income and degree of urbanisation. Individuals residing in upper-middle- or high-income level economies were more likely to report having friends or family to help them than those in low-middle- or low-income economies.
Implications
While many countries have made terrific progress in reducing poverty in recent decades, these results show that there are still substantial differences between rural areas, towns and semi-dense areas, and cities, especially in low-income countries. In the past, this has primarily been viewed as an urban-rural dichotomy. However, including in-between "towns and semi-dense areas" classification reveals that these areas tend to occupy an intermediate position between cities and rural areas.
People living in towns and semi-dense areas tend to be more likely to have bank accounts, lower levels of food hardship, and more social support than those living in rural areas. Still, they are less likely than those living in cities. This gradient between the three areas reflects that cities tend to produce higher-paying jobs and that governments and the private sector can provide services more efficiently when people are clustered together. In addition, towns can play an important role in providing access to services for the surrounding rural areas. As a result, policymakers may want to differentiate between these three areas, not just because the scale of the problems differs, but also because the appropriate policy response may differ.
(Gallup USA)
July 16, 2020
Source: https://news.gallup.com/opinion/gallup/315857/degree-urbanisation-effect-happiness.aspx
AUSTRALIA
647-43-18/Poll
NSW ski resorts the 'main game' in town as Victorian border closes
For Australians (outside Victoria) wanting to enjoy some skiing this year the NSW ski resorts of Thredbo, Perisher/Smiggins and smaller resorts in the NSW Snowy Mountains are the only game in town with travel to Victoria closed until at least late August.
The latest Roy Morgan data shows 322,000 Australians plan on visiting one of the NSW Snowfields in the next two years. Over three-quarters of these prospective skiers and snowboarders (249,000) are from NSW/ACT including 180,000 from Sydney and a further 69,000 from Country NSW/ACT.
There are a further 60,000 Australians from the rest of Australia (Queensland, WA, SA, NT or Tasmania) who plan on visiting one of the NSW Snowfields in the next two years. NSW borders remain open to residents of all these locations although the return home might require a period of quarantine.
The Victorian border closure will not have a big impact on the NSW ski resorts as only 13,000 potential skiers and snowboarders from the southern State plan on visiting one of the NSW ski resorts. Most Victorians prefer one of the local resorts.
Australians planning to visit NSW ski resorts by location
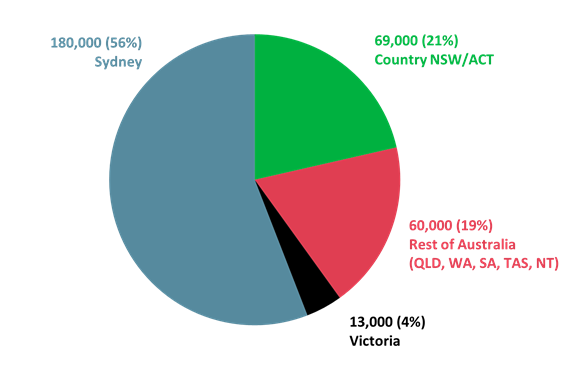 Source: Roy Morgan Single Source (Australia), April
2019 – March 2020, n=378. Base: Australians
aged 14+ who say they regularly or occasionally go skiing or snowboarding.
Source: Roy Morgan Single Source (Australia), April
2019 – March 2020, n=378. Base: Australians
aged 14+ who say they regularly or occasionally go skiing or snowboarding.
Victorian lockdown closes two resorts, but Mt. Buller remains open
The renewed outbreak of COVID-19 in Melbourne has led to the re-implementation of Stage 3 lockdown restrictions across metropolitan Melbourne and has already seen two of Victoria’s leading ski resorts, Falls Creek and Mt. Hotham, announce immediate six week closures of their ski lifts until late August.
The independently owned Mt. Buller ski resort is still open for business but the latest Roy Morgan data shows Victorian ski resorts, such as Mt. Buller, rely heavily on Melburnians. Of the 163,000 Victorians planning to visit a local ski resort in the next two years 134,000 (82%) are from locked down Melbourne and only 29,000 (18%) are from the still open Country Victoria.
Michele Levine, CEO Roy Morgan, says the renewed outbreak of COVID19 in Victoria has dashed the hopes of Victorian ski resorts but further north in NSW the resorts are open and ready for business:
“Australian ski resorts have
spent months hoping Australians were able to ‘flatten the curve’ of COVID19.
For NSW resorts this wish has been granted with minimal rates of community
transmission in the State for many weeks allowing the Thredbo
and Perisher/Smiggins resorts to open for visitors
from all parts of Australia apart from Victoria.
“The latest Roy Morgan data
shows the southern border closure will not have a big impact on visits to the
NSW resorts – only 13,000 Victorians say they planned to visit NSW ski resorts
during the next two years. Of the 322,000 Australians who do plan to visit a
NSW ski resort over three-quarters are in NSW/ACT including 180,000 in Sydney
and 69,000 in regional NSW or the ACT.
“Unfortunately for the
Victorian resorts it is set to be a long winter with Mt. Hotham and Falls Creek
– both owned by US ski resort operator Vail Resorts – announcing they are
closing their ski lifts until late August.
“The rival Mt. Buller resort
announced on Friday afternoon that it would remain open for business. However,
the lockdown of the Melbourne metropolitan area means only Victorians in rural
and regional areas are allowed to visit Mt. Buller. The latest In-depth Roy
Morgan data on Victorian skiers and snowboarders shows over 80% of those
planning to visit the ski fields reside in metropolitan Melbourne and fewer
than 20%, or about 29,000, are in Country Victoria.”
(Roy Morgan)
July 14, 2020
MULTICOUNTRY STUDIES
647-43-19/Poll
The Global God Divide
People’s thoughts on whether belief in God is necessary to be moral vary by economic development, education and age.
What is the connection between belief in God and morality? And how important are God and prayer in people’s lives? Pew Research Center posed these questions to 38,426 people in 34 countries in 2019.
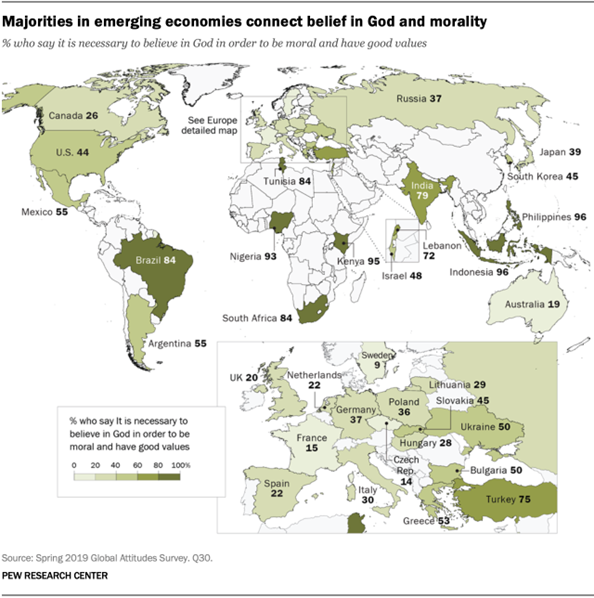
Across the 34 countries, which span six continents, a median of 45% say it is necessary to believe in God to be moral and have good values. But there are large regional variations in answers to this question.
People in the emerging economies included in this survey tend to be more religious and more likely to consider religion to be important in their lives, and they are also more likely than people in this survey who live in advanced economies to say that belief in God is necessary to be moral. Differences occur within countries as well. In general, people who are relatively nonreligious are more inclined than highly religious people in the same countries to say it is not necessary to believe in God to be a moral person.
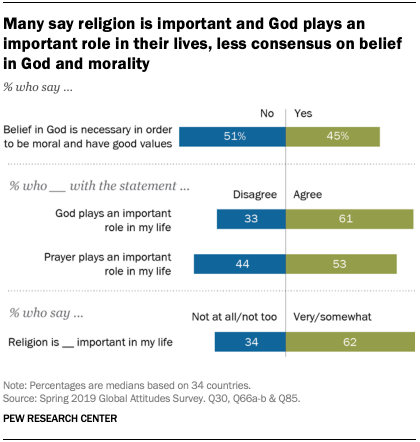 Despite
variances in religious observance, a median of 62% across the countries
surveyed say that religion plays an important role in their lives, while 61%
agree that God plays an important role in their lives and 53% say the same
about prayer. Since 1991, the share of people who say God is important to them
has increased in Russia and Ukraine, while the opposite has occurred over the
same time span in Western Europe.
Despite
variances in religious observance, a median of 62% across the countries
surveyed say that religion plays an important role in their lives, while 61%
agree that God plays an important role in their lives and 53% say the same
about prayer. Since 1991, the share of people who say God is important to them
has increased in Russia and Ukraine, while the opposite has occurred over the
same time span in Western Europe.
In the eight Western European publics surveyed, a median of just 22% say belief in God is necessary to be moral, while in the six Eastern European nations studied, a median of 33% share the same view. Prior research establishes the European continent as increasingly secular on the whole, though among Europeans, there are notable differences between Eastern and Western countries in attitudes toward religion and religious minorities.
Opinions on whether belief
in God is necessary to have good values vary by region
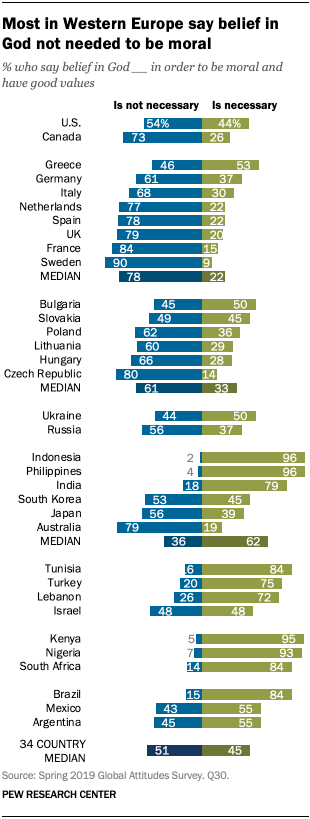 Of all 13
countries surveyed in the European Union, Greece has the largest share of
residents who tie belief in God to morality (53%), followed closely by Bulgaria
(50%) and Slovakia (45%). Still, in many countries on the European continent,
relatively few people say it is necessary to believe in God to be moral,
including just 9% in Sweden, 14% in the Czech Republic and 15% in France.
Of all 13
countries surveyed in the European Union, Greece has the largest share of
residents who tie belief in God to morality (53%), followed closely by Bulgaria
(50%) and Slovakia (45%). Still, in many countries on the European continent,
relatively few people say it is necessary to believe in God to be moral,
including just 9% in Sweden, 14% in the Czech Republic and 15% in France.
Less than half in both Canada and the U.S. say belief in God is necessary to be moral (26% and 44%, respectively). (For more on religion in the U.S., go to “In a Politically Polarized Era, Sharp Divides in Both Partisan Coalitions.”)
By contrast, nearly everyone surveyed in Indonesia and the Philippines (96% each) draws a connection between belief in God and having good values. And nearly eight-in-ten (79%) in India say the same. But in East Asia, South Koreans are somewhat split on this question (53% say it is necessary, 46% say it is not), while smaller shares in Japan (39%) and Australia (19%) take the view that it’s necessary to believe in God to be a moral person.
Among those in the Middle East and North African nations surveyed, at least seven-in-ten in Lebanon (72%), Turkey (75%) and Tunisia (84%) think belief in God is necessary to have good values. Israelis are split on this question, with 48% of the population on either side.
Additionally, strong majorities in each of the sub-Saharan African nations surveyed say belief in God is necessary to be moral. Over nine-in-ten in Kenya and Nigeria (95% and 93%, respectively) connect belief in God with morality, while 84% of South Africans are of the same opinion.
Majorities in all three Latin American countries surveyed say that belief in God is necessary to be moral, with the highest share in Brazil (84%). Catholicism remains the largest religion in Latin America, and majorities of Catholics in all three nations surveyed think it is necessary to believe in God to be moral.
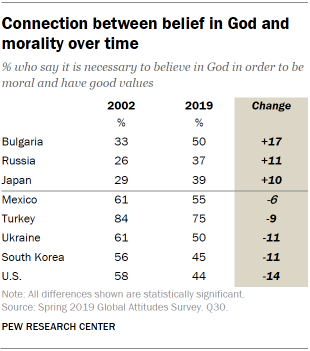 Strikingly,
both Russia and Ukraine have seen an evolution of opinion on this question, but
in opposite directions. Russia has seen an 11 percentage point increase since
2002 in the share who say belief in God is necessary to have good values, while
Ukraine has seen an 11-point drop. Aside from Russia, only two other countries
– Bulgaria and Japan – have seen significant increases in the share of their
publics who hold this opinion (17 points and 10 points, respectively). In
addition to Ukraine, four other countries – Mexico, Turkey, South Korea and the
United States – have seen significant decreases in the percentage of their
publics who say belief in God is necessary to be moral.
Strikingly,
both Russia and Ukraine have seen an evolution of opinion on this question, but
in opposite directions. Russia has seen an 11 percentage point increase since
2002 in the share who say belief in God is necessary to have good values, while
Ukraine has seen an 11-point drop. Aside from Russia, only two other countries
– Bulgaria and Japan – have seen significant increases in the share of their
publics who hold this opinion (17 points and 10 points, respectively). In
addition to Ukraine, four other countries – Mexico, Turkey, South Korea and the
United States – have seen significant decreases in the percentage of their
publics who say belief in God is necessary to be moral.
Differences in views on
belief in God and morality by GDP per capita
Overall, respondents in nations with lower gross domestic product are more likely to say that belief in God is necessary to be moral and have good values. In other words, there is an inverse relationship between GDP per capita and the percentage of the public that draws this connection between belief in God and morality. Statistical analysis shows a strong inverse correlation, with a coefficient of -0.86.
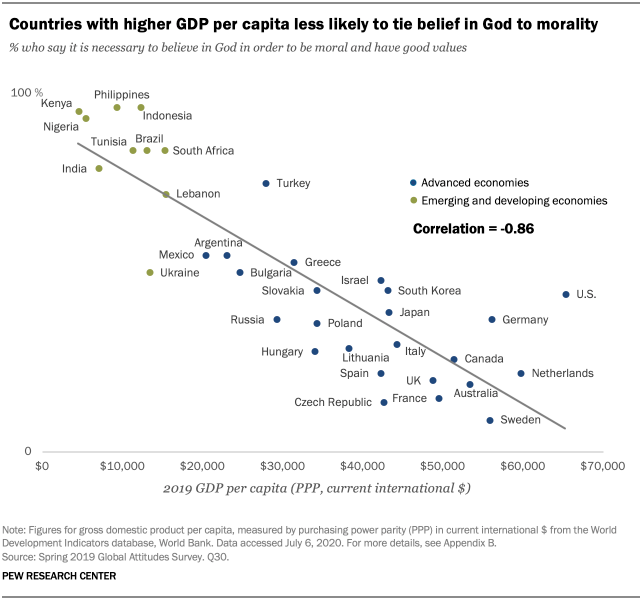
For example, in Kenya, which has the lowest GDP per capita of all 34 nations included in this analysis ($4,509 in 2019) 95% of respondents express the view that belief in God is integral to being moral.
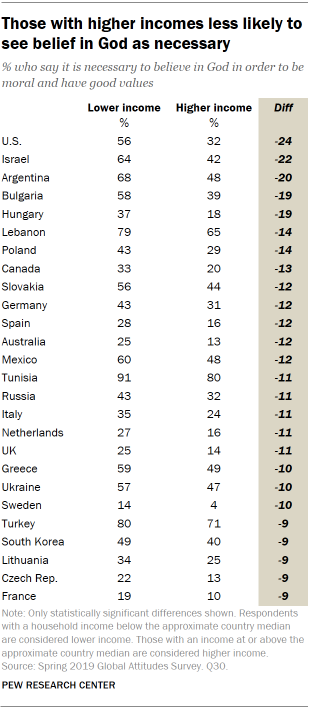 By
contrast, only 9% of respondents in Sweden – which has one of the highest GDP
per capita of the nations surveyed ($55,815 in 2019) – say belief in God is necessary
to be moral. This pattern is consistent with prior research that has found
that Europeans
tend to be less religious than people in many other parts of the
world.
By
contrast, only 9% of respondents in Sweden – which has one of the highest GDP
per capita of the nations surveyed ($55,815 in 2019) – say belief in God is necessary
to be moral. This pattern is consistent with prior research that has found
that Europeans
tend to be less religious than people in many other parts of the
world.
On an individual basis, those who earn at or above the median income threshold in most nations are significantly less likely to say that belief in God is necessary for morality. The largest difference between those at different income levels is in the U.S., where there is a 24 percentage point difference between those below the median income and those at or above it.
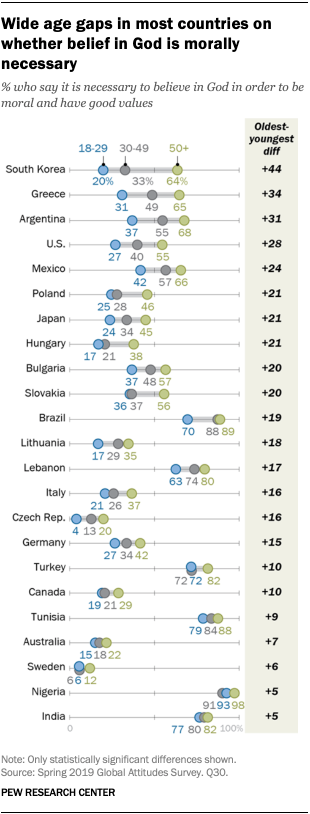 Most
countries surveyed display generational gaps on the question of whether belief
in God is necessary in order to be moral and have good values. In keeping
with past
analyses that found younger adults are generally less religious by
several measures, 18- to 29-year-olds are the least likely to say it is
necessary to believe in God to be moral. In a majority of the 34 countries
surveyed, those ages 50 and older are significantly more likely than those ages
18 to 29 to think that belief in God is necessary for morality.
Most
countries surveyed display generational gaps on the question of whether belief
in God is necessary in order to be moral and have good values. In keeping
with past
analyses that found younger adults are generally less religious by
several measures, 18- to 29-year-olds are the least likely to say it is
necessary to believe in God to be moral. In a majority of the 34 countries
surveyed, those ages 50 and older are significantly more likely than those ages
18 to 29 to think that belief in God is necessary for morality.
This is especially true in South Korea, where 64% of older adults take the position that belief in God is connected with morality, while only one-fifth of younger South Koreans say the same. The gap between adults ages 50 and older and adults ages 18 to 29 is equal to or greater than 20 percentage points in South Korea, Greece, Argentina, the U.S., Mexico, Poland, Japan, Hungary, Bulgaria and Slovakia.
Age gaps on this question are present in nearly every region of the world. In Nigeria, Tunisia, Turkey and Brazil, at least seven-in-ten people in every age group agree that belief in God is necessary to morality. However, in the Czech Republic and Sweden, no more than two-in-ten people in every age group take that position. In no country surveyed were 18- to 29-year-olds more likely than older age cohorts to say that it is necessary to believe in God to be moral.
More education connected
with belief that God is not necessary to have good values
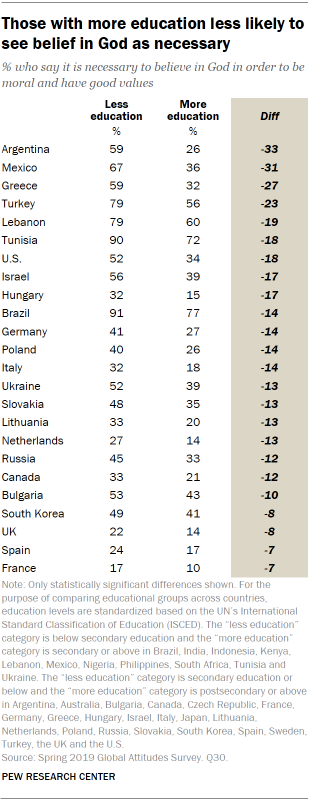 In most
European and North American countries surveyed, individuals with more education
are less likely to say that belief in God is necessary to be moral. This
pattern closely tracks the connection between income levels and the way people
answer this question, because there is a significant correlation between educational attainment
and earnings.
In most
European and North American countries surveyed, individuals with more education
are less likely to say that belief in God is necessary to be moral. This
pattern closely tracks the connection between income levels and the way people
answer this question, because there is a significant correlation between educational attainment
and earnings.
In addition, there are differences on this question among respondents at different education levels in several other nations included in the 2019 survey. In 24 out of the 34 countries surveyed, respondents with higher levels of education are significantly less likely to say belief in God is necessary to be moral. There are no significant differences among the other 10 countries included in the survey.
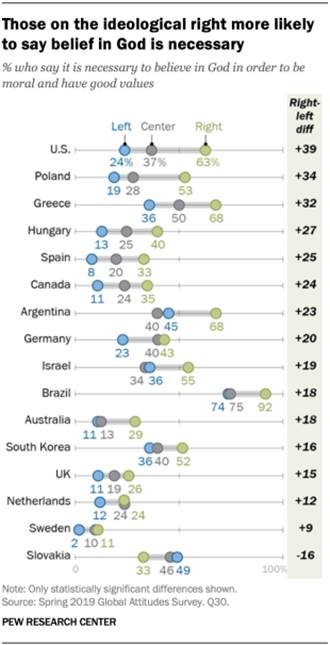 In 15
countries surveyed, those on the ideological right are significantly more
likely to say it is necessary to believe in God in order to be moral and have
good values (ideology is self-reported and varies by country). Majorities of
those on the right in the U.S., Greece, Argentina and Israel say that belief in
God is necessary for morality; less than half of those on the left in those
countries say the same. The left-right gap exceeds 30 percentage points in the
U.S., Poland and Greece.
In 15
countries surveyed, those on the ideological right are significantly more
likely to say it is necessary to believe in God in order to be moral and have
good values (ideology is self-reported and varies by country). Majorities of
those on the right in the U.S., Greece, Argentina and Israel say that belief in
God is necessary for morality; less than half of those on the left in those
countries say the same. The left-right gap exceeds 30 percentage points in the
U.S., Poland and Greece.
Though only about one-in-ten right-leaning Swedes say that it is morally necessary to believe in God, the right-left gap persists even in Sweden: Just 2% of those on the left say the same. Those on the right also are significantly more likely to say it is necessary to believe in God in order to be moral in Hungary, Spain, Canada, Argentina, Germany, Israel, Brazil, Australia, South Korea, the UK, the Netherlands and Sweden.
Slovakia is the only country surveyed where those on the left are more likely to say that it is necessary to believe in God in order to be moral: 49% of those on the left in Slovakia agree, compared with 33% of those on the right.
The importance of religion
varies around the globe
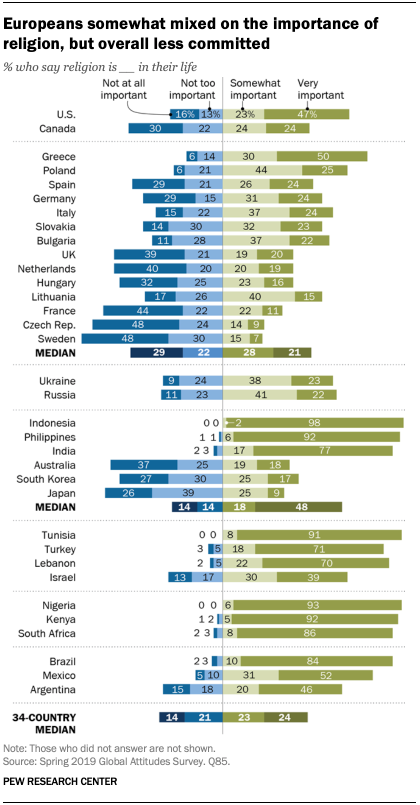 In most
of the countries surveyed, more than half of the public says religion is either
“very important” or “somewhat important” in their lives. However, Europeans
generally show less religious commitment on this measure than people in other
regions.
In most
of the countries surveyed, more than half of the public says religion is either
“very important” or “somewhat important” in their lives. However, Europeans
generally show less religious commitment on this measure than people in other
regions.
When asked about the importance of religion in their lives, majorities in 23 out of 34 countries say religion is very or somewhat important to them. This includes nine-in-ten or more in Indonesia, Nigeria, Tunisia, the Philippines, Kenya, India, South Africa, Brazil and Lebanon.
Majorities in several of these countries have particularly high levels of religious commitment, saying religion is very important their lives. Such attitudes are common in Indonesia (98%), the Philippines (92%), Tunisia (91%), Brazil (84%), India (77%), Turkey (71%), Lebanon (70%) and all African countries surveyed – 93% in Nigeria, 92% in Kenya and 86% in South Africa.
Meanwhile, the European countries in the study tend to have much smaller shares who say religion is either very or somewhat important in their lives, including 22% of adults in Sweden, 23% in the Czech Republic, 33% in France and 39% in both the Netherlands and Hungary.
In multiple European nations, pluralities say religion is “not at all” important in their lives. This is the case in the Czech Republic, France, the Netherlands, Sweden and the United Kingdom, where adults are more likely to say religion is not at all important in their lives than to choose any other answer option.
On the other hand, more than six-in-ten respondents in Greece, Poland and Italy say religion is very or somewhat important in their lives. More people in Greece say religion is at least somewhat important to them (80%) than in any other European country. Lesser majorities in Germany, Slovakia, Lithuania (each at 55%) and Bulgaria (59%) say religion is at least somewhat important to them.
More say God plays an
important role in life than say the same about prayer
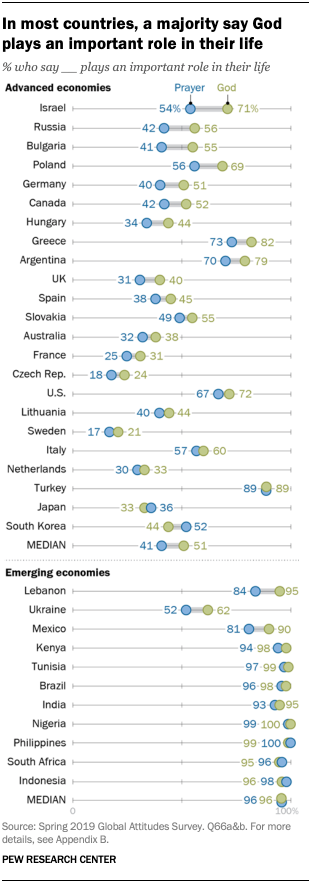 When
asked separate questions about the roles that prayer and God play in their
lives, more respondents say that God is important than say that prayer is
important, though strong majorities in half of the countries surveyed say that
both are important to them. Across 34 countries, a median of 61% say that God
plays an important role in their lives, compared with 53% who say that prayer
is important in their daily life.
When
asked separate questions about the roles that prayer and God play in their
lives, more respondents say that God is important than say that prayer is
important, though strong majorities in half of the countries surveyed say that
both are important to them. Across 34 countries, a median of 61% say that God
plays an important role in their lives, compared with 53% who say that prayer
is important in their daily life.
Just as respondents in wealthier countries tend to disagree that it is necessary to believe in God to be a moral person, people in wealthier countries generally say that God and prayer are not especially important in their lives (For more on advanced and emerging economies, see Appendix B). People in emerging economies are more than twice as likely as people in advanced economies to agree that prayer is an important part of daily life. Nine-in-ten or more respondents in all the emerging economies surveyed (except for Ukraine) say that God plays an important role in their lives. By contrast, less than half of respondents in 11 of the economically advanced countries surveyed consider God to be important in life. Similarly, while a median of 41% across these advanced economies say that prayer is an important part of daily life, 96% of those in emerging economies say that it is.
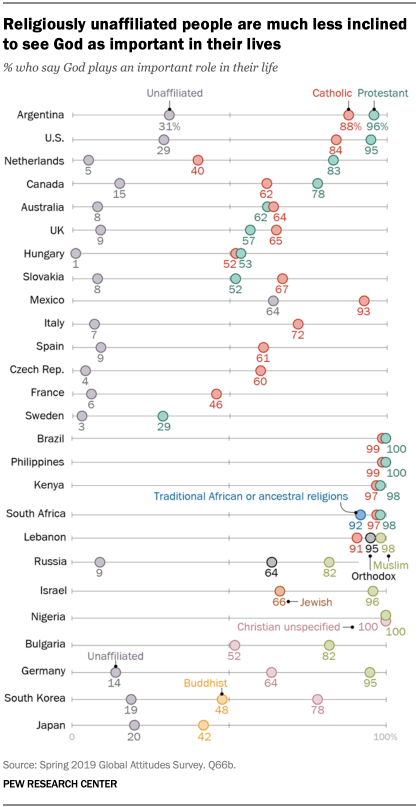 In some
countries, respondents are less likely to say that prayer is an important part
of daily life than they are to say that God is important in their lives. For
example, 71% of Israeli respondents say that God is important in their life,
while 54% say the same about prayer. Muslim Israelis drive much of this
sentiment. Among Muslim Israelis, 96% say God is important in their life,
compared with 66% of Jewish Israelis; 81% of Muslim Israelis say prayer is
important, compared with 50% of Jewish Israelis.
In some
countries, respondents are less likely to say that prayer is an important part
of daily life than they are to say that God is important in their lives. For
example, 71% of Israeli respondents say that God is important in their life,
while 54% say the same about prayer. Muslim Israelis drive much of this
sentiment. Among Muslim Israelis, 96% say God is important in their life,
compared with 66% of Jewish Israelis; 81% of Muslim Israelis say prayer is
important, compared with 50% of Jewish Israelis.
Views on whether God plays an important role in life differ substantially based on religious affiliation as well. Not surprisingly, in most countries relatively few religiously unaffiliated people (those who say they are atheist, agnostic or “nothing in particular”) agree that God is important in their lives. Still, around three-in-ten religiously unaffiliated people in Argentina and the U.S. say that God is important to them, and a majority of religiously unaffiliated people in Mexico say that God plays an important role in their lives.
There is near unanimous agreement that God is important in life among people of all major religious affiliations in Brazil, the Philippines and Kenya, as well as among all Muslim and Christian respondents in Nigeria.
The rising significance of
God after the dissolution of the Soviet Union
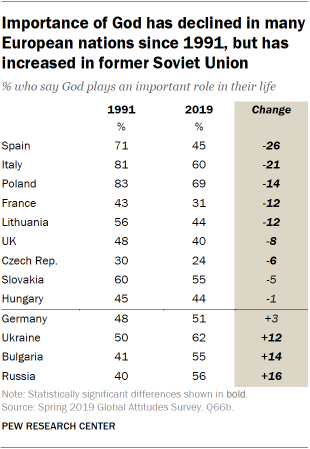 Following well-documented
trends that trace the decline of Christianity in Western Europe, the
share of Europeans who say that God plays an important role in life has
declined since 1991. Spain, Italy and Poland had the most dramatic decreases,
with declines of 26, 21 and 14 percentage points, respectively. This trend is
mirrored in many other European countries, including Lithuania. Since the
collapse of the USSR, Lithuania has seen a 12 percentage point drop in the
share of its public that feels God plays an important role in their lives.
Following well-documented
trends that trace the decline of Christianity in Western Europe, the
share of Europeans who say that God plays an important role in life has
declined since 1991. Spain, Italy and Poland had the most dramatic decreases,
with declines of 26, 21 and 14 percentage points, respectively. This trend is
mirrored in many other European countries, including Lithuania. Since the
collapse of the USSR, Lithuania has seen a 12 percentage point drop in the
share of its public that feels God plays an important role in their lives.
At the same time, other former Soviet republics where religion was harshly repressed or effectively banned during the Soviet period have experienced an increase in the percentage of people who say God plays an important role in life. Both Ukraine and Russia have experienced double-digit increases in the share of people who agree that God is important to them. In Bulgaria, a former satellite state of the USSR, 41% said in 1991 that God was important in their lives. Today, a majority of Bulgarian respondents (55%) express that view.
Similar trends hold for those who say prayer is an important part of their daily lives.
(PEW)
July 20, 2020
Source: https://www.pewresearch.org/global/2020/07/20/the-global-god-divide/