BUSINESS
& POLITICS IN THE WORLD
GLOBAL
OPINION REPORT NO. 650-651
Week: August 03 – August 16,
2020
Presentation: August 21, 2020
One in Three Americans Would Not Get
COVID-19 Vaccine
A
large proportion of urban Indians likely to switch to homegrown apps after
TikTok’s departure
A
large majority of UAE residents favour the economy becoming cashless
Media-only
election campaigns likely to leave many Ugandans under-informed
Impact
of the quarantine imposed in the UK on travelers from Spain
Worried,
Belgians adapt their holiday intentions to the context of COVID-19
A
fifth of the British public feel more at risk of cybercrime and fraud since
lockdown
Largest
home antibody testing programme for COVID-19 publishes findings
Britons
prefer Biden to Trump in US race
Four
in ten Scots don’t think English travellers should be allowed in without
quarantining
Animals
or environment: which do Brits donate more to?
Four
out of five healthcare workers expect second COVID wave
Which
Brits are social media ‘stalkers’?
Which
out-of-home advertisements are most effective?
Pandemic
has made properties with gardens more attractive
One
in Five Canadians Don’t Trust Any Business when it comes to their Health and
Safety
25%
in U.S. Say Neither Candidate Would Be a Good President
U.S.
Satisfaction With Women's Treatment Remains Tepid
Americans
Regard Gender Equality as Unfinished Business
One
in Three Americans Would Not Get COVID-19 Vaccine
52%
of U.S. Air Travelers Now Uncomfortable Flying
PM
Jacinda Ardern maintains ‘crushing’ lead over new National leader Judith Collins
Most
European tourists would rather cancel their holiday than go on quarantine
Majority
worry whether online news is true
INTRODUCTORY NOTE
650-651-43-31/Commentary:
One in Three Americans Would Not Get COVID-19 Vaccine
The coronavirus' toll on the lives of people around the world continues to grow, with over 18 million confirmed cases and more than 700,000 deaths, including upwards of 150,000 of those in the United States. Dr. Anthony Fauci, director of the National Institute of Allergy and Infectious Diseases, recently testified before Congress that he continues to be confident that a coronavirus vaccine will be ready by early 2021. With more indications that a vaccine could be close, the next question for health professionals, policymakers and political leaders will be Americans' willingness to be vaccinated once a vaccine is ready.
But many Americans appear reluctant to be vaccinated, even if a vaccine were FDA-approved and available to them at no cost. Asked if they would get such a COVID-19 vaccine, 65% say they would, but 35% would not.
The results are based on July 20-Aug. 2 polling in Gallup's COVID-19 tracking survey, conducted with members of Gallup's probability-based panel.
While Gallup has consistently seen that U.S. party preferences play a strong role in Americans' views on COVID-19, the new poll extends that to willingness to be vaccinated. Eighty-one percent of Democrats are willing to be vaccinated today if a free and FDA-approved vaccine were available. That compares with 59% of independents and just under half of Republicans, 47%.
Americans' Willingness to Take an FDA Approved, No Cost Vaccine for COVID-19
If an FDA-approved vaccine to prevent coronavirus/COVID-19 was available right now at no cost, would you agree to be vaccinated?
|
Yes |
No |
|
|
% |
% |
|
|
All Americans |
65 |
35 |
|
Men |
65 |
35 |
|
Women |
65 |
35 |
|
Democrats |
81 |
19 |
|
Independents |
59 |
41 |
|
Republicans |
47 |
53 |
|
White Americans |
67 |
33 |
|
Non-White Americans |
59 |
41 |
|
18-29 years old |
76 |
24 |
|
30-49 years old |
64 |
36 |
|
50-64 years old |
59 |
41 |
|
65 and older |
70 |
30 |
|
Rural area/Farm |
56 |
44 |
|
Small town/Village |
68 |
32 |
|
Suburb of a large city |
69 |
31 |
|
Large city |
65 |
35 |
|
GALLUP PANEL, JULY 20-AUG. 2, 2020 |
||
Older Americans have been most likely to have serious complications, including death, from COVID-19. Yet, young people are still affected, and an increasing proportion of new infections are occurring among younger adults, possibly because this age group is engaging in riskier behaviors that are promoting the spread of the disease.
Given the age-related risks seen to date, it may come as good news to public health officials that 76% of adults aged 18-29 are willing to get a COVID-19 vaccination, as are 70% of senior citizens. Willingness to be vaccinated is lower among the middle-aged groups -- 64% among those 30-49 years old and 59% among those between 50 and 64.
Slight Majority of Non-White and Rural Americans Would Get Vaccine
While party affiliation likely explains many of the differences seen in willingness to be vaccinated, there are differences by race that defy the partisan patterns. White Americans are significantly more likely than non-White Americans to say they would be vaccinated if a free FDA-approved version were available -- 67% vs. 59%, respectively. This is particularly noteworthy, given media reports on the pandemic noting that Black and Latino Americans have been disproportionately affected by COVID-19.
Those living in rural areas appear to be less eager than their more urban counterparts to take advantage of a vaccine. Just 56% of those living in a rural area say they would get vaccinated. This may be concerning to public health officials, as the U.S. Centers for Disease Control and Prevention has pointed out that "long-standing systemic health and social inequities have put some rural residents at increased risk of getting COVID-19 or having severe illness."
In contrast, more than six in 10 Americans living in more urban areas such as a large city (65%) or a suburb of a large city (69%) -- both of which were associated with early hot spots for the virus -- would be willing to take a vaccine. Those in small towns or villages are on par with their more urban counterparts, with 68% on board for a vaccine.
More Than a Third of Employed Americans Unwilling to Take Vaccine
Of potential interest to employers who are counting on a vaccine to get workers back into the workplace is the finding that employed Americans are roughly as likely as the public at large to say they would get vaccinated if they had the option.
Similar to workplaces, schools are also grappling with how and when to get students back into the classroom, with vaccination being the ultimate tool for keeping the virus at bay. While the survey did not ask parents about their willingness to have their children vaccinated, it may be instructive to know that parents themselves lag behind the general public in willingness to be vaccinated themselves. Just 59% of parents of children under 18 say they would agree to be vaccinated, while 41% would not.
Implications
As the situation stands today, the nation's influencers -- including health professionals, policymakers and leaders -- who see a vaccine as a way forward may have their work cut out for them in persuading Americans to take advantage of such an option. Policymakers in government, healthcare, industry and education will need to anticipate that a significant proportion of the population will be hesitant to get a vaccine, even at no cost. Some of the most at-risk populations, including non-White and rural Americans, may not only be hesitant but resistant to getting vaccinated. Employers continuing to grapple with new workplace realities must also anticipate that a number of their workers may resist a vaccine.
Such resistance is not unprecedented. When Gallup in 1954 asked U.S. adults who had heard or read about the then-new polio vaccine, "Would you like to take this new polio vaccine (to keep people from getting polio) yourself?" just 60% said they would, while 31% said they would not. So far, willingness to adopt a new vaccine looks similar today. Leaders in favor of a vaccine may be well-served to study what caused the public to ultimately adopt earlier vaccines as they consider how best to influence Americans to take advantage of such an option now.
(Gallup USA)
August 07, 2020
Source: https://news.gallup.com/poll/317018/one-three-americans-not-covid-vaccine.aspx
650-651-43-32/Country Profile: United States of America
SUMMARY
OF POLLS
ASIA
(India)
A large proportion of urban Indians likely to switch to homegrown apps
after TikTok’s departure
Recently the government of India put a ban on many Chinese apps including the widely used video sharing platform - TikTok. The departure of the popular Chinese app has presented an opportunity for other video sharing apps to gain a foothold in the market. Now YouGov’s latest survey reveals in the absence of TikTok, nearly two-thirds of urban Indians (65%) said they are very likely or likely to turn to alternatives or start using video apps that are either Indian or non-Chinese in origin. Among the generations, millennials (69%) were most likely to show their readiness to switch to Tik-Tok’s alternatives, as compared to GenZ (54%). Likewise, men were more likely than women to hold a similar view (70% vs 59%). (YouGov)
August 14, 2020
(Pakistan)
Nearly 4 in 5
Pakistanis (83%) consider work to be an important part of their life; 8% say
work is not important at all
According to a World Values Survey and Gallup & Gilani Pakistan, 83% Pakistanis consider work to be an important part of their lives while 8% say work is not important at all. A representative sample of men and women from across the four provinces was asked, “How important is work in your life?” In response, 63% said work is very important, another 20% said it is rather important, 8% said not very important while 8% said work is not important at all. The question was asked previously between 1994-1998 and 68% Pakistanis then said very important while between 1999-2004, 60% claimed that work is very important. Proportion of Pakistanis claiming that work is very important rose between 1994 and 2014. (Gallup Pakistan)
August 10, 2020
MENA
(UAE)
A large majority of UAE residents favour the
economy becoming cashless
YouGov’s latest survey reveals a large majority of UAE residents (63%) consider it very or fairly positive if their country became cashless. Men are more likely than women to hold this view (67% vs 55%). Preference for electronic payment is also higher among high-income households (earning AED 25000+ monthly) than the rest at 76%. In general, ever since the Coronavirus pandemic engulfed the country, people seem to prefer going cashless and slightly more than half (52%) claimed to have paid in cash less often since the outbreak. Respondents within the income group of AED 10,001- 20,000 were more likely to say this than the rest of the income group members. (YouGov)
August 14, 2020
AFRICA
(Nigeria)
Approval rating for government anti-corruption efforts drops after strong
gains in 2017, new Afrobarometer study shows
A majority of Nigerians say the level of corruption in the country has increased and the government is doing a poor job of fighting it, a stark reversal from positive assessments three years ago, a new Afrobarometer study shows. Among a variety of key formal and informal leaders, all are seen as plagued by widespread corruption by a significant proportion of the population. Among Nigerians who had contact with selected public services during the past year, substantial proportions say they had to pay a bribe to obtain the services they needed. The most frequent experience of paying a bribe was among citizens who sought assistance from the police. (NOI Polls)
August 06, 2020
(Uganda)
Media-only election campaigns likely to leave many Ugandans
under-informed
Media-only election campaigns proposed to avoid mass rallies during
the COVID-19 pandemic are likely to leave many Ugandans under-informed, a new
analysis of Afrobarometer survey data shows. Afrobarometer survey data show that the proportion of Ugandans who can access
and who make use of various media channels remains relatively low and
concentrated among certain demographics, such as the young, the more educated,
men, urban residents, and people in the Central region. Media-only campaigns
may thus disadvantage more women than men, and many poorer, less educated,
older, and rural citizens. (Afrobarometer)
August 14, 2020
EUROPE
(Spain)
Impact of the quarantine imposed in the UK on travelers from Spain
Last Saturday, July 26, the British Government announced by
surprise the obligation to carry out a 14-day quarantine to any person entering
the United Kingdom from Spain. This fact caused a strong alarm in the Spanish
tourism industry if we consider that in our country we receive more than 18 million
British tourists a year. We have looked at the data provided by the Profiles
and DestinationIndex tools to see how tourists from
the United Kingdom are in Spain, as well as the impact that the announcement of
the Executive of Boris Johnson has had on the Spain brand as a tourist
destination, using the opinion of the UK population about other European
countries, as well as about their own country. (YouGov)
August 03, 2020
(Belgium)
Worried, Belgians adapt their holiday intentions to the context of
COVID-19
According to a survey carried out by Ipsos for the Europ Assistance Group1 , 82% of Belgians say they are
going on holiday this year. Among them, 59% intend to leave this summer. The
COVID-19 pandemic and the resulting health measures have had a significant
impact on the Belgian way of life. Their travel plans have been compromised
since March. The easing of measures and the reopening of our borders go hand in
hand with the realisation of travel plans for some of
them. However, COVID-19 strongly influences the behaviour
of holidaymakers, as well as their travel intentions. (Ipsos)
July 30, 2020
(UK)
A fifth of the British public feel more at risk of cybercrime and fraud
since lockdown
New research from Ipsos MORI shows around a fifth of the British public feel more at risk of certain types of cybercrime and fraud since the Prime Minister announced lockdown due to the Coronavirus on 23 March. New findings from Ipsos MORI shows around a fifth of the British public feel more at risk of certain types of cybercrime and fraud since the Prime Minister announced lockdown due to the Coronavirus on March 23rd. This includes feeling more at risk of buying counterfeit goods online, someone accessing their online accounts without permission and their devices being infected with computer viruses or other malware. (Ipsos MORI)
August 11, 2020
(UK)
Largest home antibody testing programme for
COVID-19 publishes findings
Over half (55%) of women say they are finding it harder to stay positive day-to-day compared with 44% of men. Six in ten women (59%) say they are finding it harder to stay positive about the future compared with half of men (49%). Among working parents, 55% of working mums say they are finding it harder to stay positive day-to-day compared with around a third of working dads (35%). And the story is similar about staying positive about the future, where 57% of working mums say they are finding it harder to stay positive compared with 42% of working dads. (Ipsos MORI)
August 13, 2020
(UK)
Few believe
Britain will be back to normal by Christmas, while opinion split on ending
furlough in October
Most Britons lack confidence that life in Britain will mainly be back to normal by Christmas, according to the latest Ipsos MORI Political Monitor. The poll shows nine in ten (89%) have no or little confidence things will be back to normal by Christmas, with just one in ten (10%) being confident. When reminded of Boris Johnson’s quote respondents showed slightly more optimism with 18% being confident normality will return by Christmas, but still eight in ten (82%) say they are not confident. (Ipsos MORI)
August 07, 2020
(UK)
Britons
prefer Biden to Trump in US race
Seven in ten would prefer to see Biden win the Presidential Election in November. Three-quarters (76%) of the British public feel unfavourable towards US President Donald Trump while 12% are favourable, according to the latest Ipsos MORI Political Monitor. Mr Trump’s low favourability scores are slightly worse compared with two years ago when 68% were unfavourable and 19% favourable, but are slightly better than his ratings in 2016. Britons however have less strong feelings towards former Vice President and Democratic challenger, Joe Biden. (Ipsos MORI)
August 07, 2020
(UK)
Four in ten
Scots don’t think English travellers should be allowed in without quarantining
As the summer holiday season began, groups of Scots began protests at the border demanding English tourists stay away rather than risk bringing coronavirus to Scotland. Now the results of a new YouGov survey reveal that four in ten Scots (40%) oppose English people coming to Scotland if they don’t have to quarantine on arrival. They are, however, marginally outnumbered by the 47% of Scots who are fine with English tourists still being allowed in. Politics likely plays a role. The majority of 2019 SNP voters (54%) want English travellers to stay away, while just 19% of Scottish Tory voters say the same. (YouGov)
August 14, 2020
(UK)
Animals or
environment: which do Brits donate more to?
Charities focused on animals are currently the second most popular category choice with donors, with 13% of Brits having made a donation to one in the last three months. On the other hand, just 6% of Brits have backed an environment-focused charity over the same period. Who is more likely to donate, however? YouGov Profiles demographics shows that, as other recent YouGov investigations into the charity sector have, that younger Brits are much less likely to donate than their elders. (YouGov)
August 13, 2020
(UK)
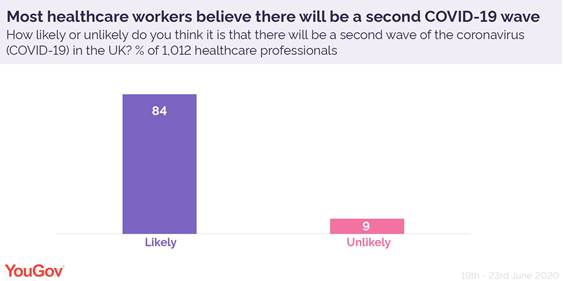
Four out of
five healthcare workers expect second COVID wave
Some 84% of healthcare professionals believe there will be a second wave of coronavirus, as a quarter of NHS workers who need PPE still report shortages. The Prime Minister may hope for a ‘return to normality by Christmas’, but the vast majority of healthcare professionals are not quite as optimistic. A third (33%) believed a second wave is very likely while half (51%) said it’s fairly probable when surveyed in late June. Only 9% believed another outbreak is unlikely. (YouGov)
August 11, 2020
(UK)
Which Brits
are social media ‘stalkers’?
One in six Brits say they’ve “stalked” someone on social media – that is to say, researched someone surreptitiously online. It’s tempting to use social media platforms to take a sneak peek at the personal life of a colleague, an ex-partner, or even to vet future housemates. But how many Brits say admit that they’ve ‘stalked’ someone on social media? Overall, one in six (17%) of Britons agree that they have been known to ‘stalk’ through social media, while 78% say they have not. Who are these curious 17%? YouGov Profiles reveals that younger women are the most likely to be using social media to check out others – with the plurality (the largest group, but one that is not a majority) of social media ‘stalkers’ (21% of overall stalkers) being women aged from 25 to 34. (YouGov)
August 11, 2020
(UK)
Which
out-of-home advertisements are most effective?
YouGov Profiles shows that ads placed on buses and billboards are noticed most frequently. Even with some elements of lockdown still in effect, and certain areas under stricter rules, the average Briton is still spending time outside the home. Approaching half (45%) of Britons say they have spent up to four hours each week travelling for various reasons (work, leisure etc) in the last 28 days. Over a third (36%) have spent more than four hours travelling outside the home, with 15% spending up to 6 hours, and 8% travelling for up to 9 hours each week. (YouGov)
August 07, 2020
(UK)
Pandemic
has made properties with gardens more attractive
Brits planning to buy within the next year say the coronavirus crisis has changed their priorities, with outdoor space and home offices now more important. Months of lockdown and fears over a second coronavirus wave have prompted Britons looking to buy a new home within the next year to re-evaluate their priorities. A third of buyers (32%) say the pandemic has made having a garden more important to them – the largest increase in the survey. One in seven buyers (14%) also now see a balcony or terrace as more important. This figure is higher among first-timers (18%) who tend to have less spending power than people who already own a property (11%). (YouGov)
August 06, 2020
NORTH AMERICA
(Brazil)
Ipsos
Essentials: in Brazil, three out of four support restricting the number of days
children go to school per week
Most respondents prefer to wait at least four months before sending their children back to school.
In the opinion of Brazilians, at the present time, children and adolescents should attend school in person less frequently than the traditional weekly period, from Monday to Friday. South Korea (83%), India (81%) and Mexico (80%) are the nations that most endorse the idea. On the other hand, in Europeans France (42%), Italy (44%) and Germany (46%) less than half agree with the restriction of frequency in the classroom. (Ipsos)
August 14, 2020
(Canada)
One in Five
Canadians Don’t Trust Any Business when it comes to their Health and Safety
A new study by Ipsos finds trust is low, along with a high willingness to halt visiting locations not meeting the mark. As Canadians begin to resume more and more of their day-to-day lives and as areas of the country enter phase 3 and 4, consumer trust in businesses to keep them safe from COVID-19 is low. According to a study conducted by Ipsos, 1 in 5 Canadians don’t trust any industry for their cleanliness and safety protocols, a slight increase from May, when 1 in 4 indicated a lack of trust. With a wide variance in regulations across the country, including from one municipality to the next, the challenge for businesses to meet customer and employee expectations for safety measures, and communicate these appropriately, is immense. (Ipsos)
July 29, 2020
(USA)
25%
in U.S. Say Neither Candidate Would Be a Good President
As both political parties prepare for their conventions, one in four Americans do not think either of the major-party presidential candidates would be a good president. At the same time, roughly equal percentages say only Joe Biden (36%) or only Donald Trump (33%) would make a good president, while 5% say both candidates would. Similar percentages of Democrats (75%) and Republicans (79%) think only their candidate is suitable, while a 37% plurality of independents do not think either would be a good candidate and nearly equal percentages say only Biden or only Trump would be. (Gallup USA)
August 14, 2020
(USA)
U.S.
Satisfaction With Women's Treatment Remains Tepid
Americans' satisfaction with the treatment of women in society fell to a record low two years ago after the emergence of the #MeToo movement as a national phenomenon in 2017, and it remains at that level today. Just over half of U.S. adults, 54%, are now very or somewhat satisfied with the treatment of women, down roughly 10 percentage points from 2015-2016 and well below the 67% to 72% range found previously between 2001 and 2013. Today's level of satisfaction nearly matches the 53% recorded in late 2018, after allegations of sexual harassment or assault that toppled a number of prominent men in media, entertainment and business. (Gallup USA)
August 13, 2020
(USA)
Americans
Regard Gender Equality as Unfinished Business
A century after women in the U.S. gained the right to vote with the adoption of the 19th Amendment in August 1920, most Americans think additional work remains before women achieve equality with men. Nearly seven in 10 U.S. adults (69%) say women have not yet achieved equality in the workplace, and 66% say the same about politics. Women are even less confident than Americans as a whole about gender equality. Roughly three-quarters say equality has not been realized in either sphere -- 79% for the workplace and 75% for politics. Men agree, but by smaller majorities. (Gallup USA)
August 10, 2020
(USA)
One in Three
Americans Would Not Get COVID-19 Vaccine
With more indications that a vaccine could be close, the next question for health professionals, policymakers and political leaders will be Americans' willingness to be vaccinated once a vaccine is ready. But many Americans appear reluctant to be vaccinated, even if a vaccine were FDA-approved and available to them at no cost. Asked if they would get such a COVID-19 vaccine, 65% say they would, but 35% would not. Eighty-one percent of Democrats are willing to be vaccinated today if a free and FDA-approved vaccine were available. That compares with 59% of independents and just under half of Republicans, 47%. (Gallup USA)
August 07, 2020
(USA)
52% of U.S.
Air Travelers Now Uncomfortable Flying
Indicating how severely COVID-19 has disrupted the airline industry in its peak travel season, about half of American adults who flew at least once a year before the pandemic (52%) currently say they would not be comfortable flying. This figure varies significantly by age and political affiliation; most notably, 69% of American air travelers aged 55 and older say they would not be comfortable flying, compared with 33% of those aged 18 to 34. Currently, about six in 10 Democrats (59%) say they would not be comfortable flying at all, compared with about four in 10 Republicans (42%). Independents lean more toward Democrats' views, at 54%. (Gallup USA)
August 06, 2020
(USA)
Why are
COVID-19 cases rising in U.S.? Republicans point to more testing, Democrats to
more infections
Overall, six-in-ten Americans say the number of confirmed coronavirus cases in the U.S. is rising primarily because there are more new infections in the country, not just because more people are being tested compared with previous months. Around four-in-ten (39%) say the increase is primarily the result of more people being tested, according to the survey. Most Republicans and Republican-leaning independents (62%) say the primary reason for the rise in confirmed cases is that more people are being tested. (PEW)
August 14, 2020
(USA)
Americans
see pressure, rather than genuine concern, as big factor in company statements
about racism
Overall, 52% of U.S. adults say it is very or somewhat important that companies and organizations make public statements about political or social issues, while a similar share (48%) say this is not too or not at all important, according to the July 13-19 survey. Americans’ views vary substantially by race and ethnicity. While most Black (75%), Asian (70%) and Hispanic adults (66%) say it is at least somewhat important that companies and organizations release statements about political or social issues, this share falls to 42% among white adults. (PEW)
August 12, 2020
(USA)
Republicans
more open to in-person worship, but most oppose religious exemptions from COVID
restrictions
Republicans and Democrats differ in their opinions on many aspects of the coronavirus outbreak, including their levels of concern about the safety of various activities. Two-thirds of Republicans and independents who lean toward the Republican Party say that houses of worship should be required to follow the same rules about social distancing and large gatherings as other organizations and businesses in their local area, compared with a third who say they should be allowed more flexibility. (PEW)
August 11, 2020
AUSTRALIA
PM
Jacinda Ardern maintains ‘crushing’ lead over new National leader Judith
Collins
In July support for Prime Minister Jacinda Ardern’s Labour Party was at 53.5% down 1% since June, but still more than double the support for National on 26.5%, down 0.5%, with just over a month to go before the election in mid-September. If an election were held today Labour could govern without the help of either New Zealand First or the Greens. Interviewing for this survey in July encompassed the period before and after Judith Collins became the new leader of National in mid-July after former leader Todd Muller’s shock resignation after less than two months in the role. (Roy Morgan)
August 08, 2020
MULTICOUNTRY STUDIES
Most European
tourists would rather cancel their holiday than go on quarantine
The European travel industry has been clearly marked by shifting restrictions and bans under COVID-19. The latest YouGov Eurotrack survey provides insight into how the restrictions have affected people's holiday plans in the UK, France, Germany, Denmark and Sweden. While the majority of European tourists would cancel their holiday plans if they were to be quarantined on return (65-84%), it is even less appealing to Europeans to be quarantined on arrival at their holiday destination. Nine out of ten travelers in the UK, Germany, Denmark and Sweden (89-93%) would either possibly or definitely cancel their plans if they were to be quarantined on arrival, while this applies to 76% of French people. (YouGov)
August 06, 2020
Majority worry
whether online news is true
YouGov and the Reuters Institute for the Study of Journalism’s annual study examining how people from 40 countries consume news reveals high levels of concern about misinformation online. Overall, four in ten (40%) are most worried about false or misleading information from politicians online. In May 2020, Twitter began labelling certain posts from President Donald Trump and other leaders as “potentially misleading” – a culmination of a debate about whether the platform should take action against his allegedly false statements that date back to his election in 2016. (YouGov)
August 16, 2020
ASIA
650-651-43-01/Poll
A large proportion of urban Indians likely to switch to homegrown apps after TikTok’s departure
Although Instagram Reels emerges as the most popular video-sharing app, many people have tried homegrown counterparts and are likely to continue using them
Recently the government of India put a ban on many Chinese apps including the widely used video sharing platform - TikTok. The departure of the popular Chinese app has presented an opportunity for other video sharing apps to gain a foothold in the market.
Now YouGov’s latest survey reveals in the absence of TikTok, nearly two-thirds of urban Indians (65%) said they are very likely or likely to turn to alternatives or start using video apps that are either Indian or non-Chinese in origin.
Among the generations, millennials (69%) were most likely to show their readiness to switch to Tik-Tok’s alternatives, as compared to GenZ (54%). Likewise, men were more likely than women to hold a similar view (70% vs 59%).
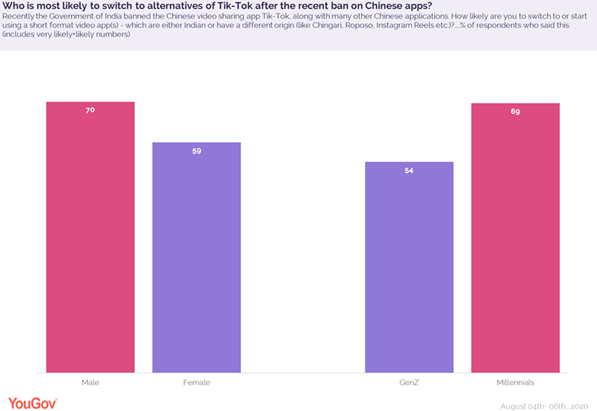
Interestingly, in the absence of the Chinese platform, 68% of TikTok content creators said they are likely to switch to Indian or non-Chinese versions of video sharing apps.
On being presented with a list of alternatives, Instagram Reels topped the list of apps most likely to be used by people in the future. The platform, which is Facebook's answer to TikTok, is welcomed by more than six in ten (62%) urban Indians who claim to have tried it and are likely to continue using it. Instagram Reels is especially popular among young adults (between 18-29 years), and 70% of these respondents indicated their likeliness to use this platform for video sharing.
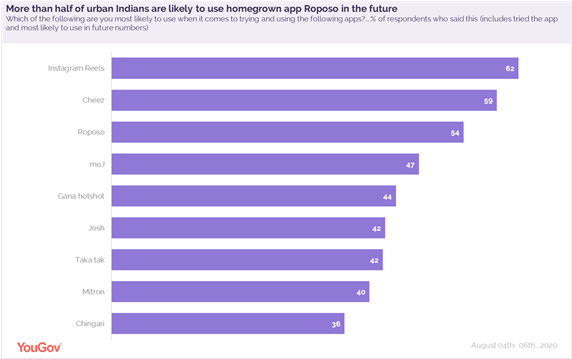
Almost as many have a similar view about Singapore-based app called Cheez (59%), which has a higher appeal among Tier-3 public in India as compared to tier-1 city residents (with 80% vs 42%).
Apart from these foreign apps, more than half claimed to have tried the homegrown app Roposo and are likely to use it in the future (54%).
Other regional apps such as moJ (47%), Gana hotshot (44%), Josh (42%), Taka Tak (42%), Mitron (40%) and Chingari (36%) also seem to have gained ground following Tik-Tok’s departure but still lag behind non-Indian apps in the race to capture the video-sharing app market.
Until recently, TikTok was one of the most popular apps in India with a user base of over 200+ million. Amongst its various features, its short format option for creating videos (72%) appealed the most to users. Following that, its wide music library (58%), user-friendly interface (56%) and ease of creating content in regional language (54%) were some of the other features that attracted people to this platform, and these could be key takeaways for brands trying to replicate the Chinese app’s success in India.
Even though respondents have shown an interest in switching to alternatives of TikTok, the popularity of the Chinese app cannot be completely dismissed. A large majority (63%) of urban Indians favour (strongly or somewhat) the ban on TikTok to be revoked, and only a fifth (21%) still ‘strongly or somewhat’ oppose the ban being lifted in India.
Talking about the ban on TikTok, followed by the surge in demand of regional short video apps, Deepa Bhatia, General Manager, YouGov India, said, “The government’s decision to ban TikTok along with other Chinese apps has presented an opportunity for homegrown players who are gearing up to take advantage of this situation. It is therefore imperative to gauge the needs of the audiences and understand their preferences in this space. While the situation is favourable to entice people into using the apps, retention will be the real challenge, and the Indian players will have to do thorough research to achieve this goal.”
(YouGov)
August 14, 2020
Source:
https://in.yougov.com/en-hi/news/2020/08/14/large-proportion-urban-indians-likely-switch-homeg/
650-651-43-02/Poll
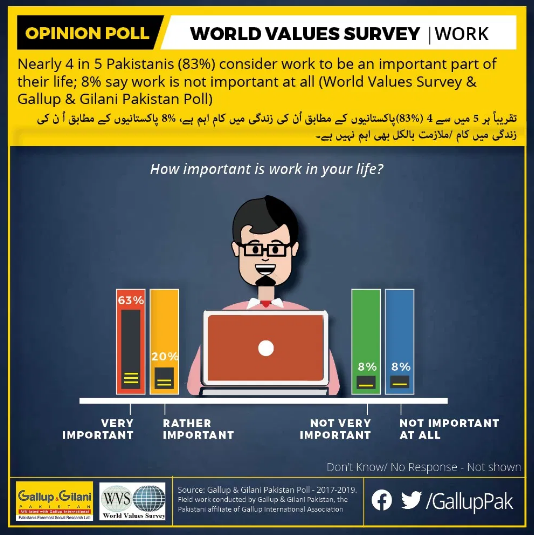
Nearly 4 in 5 Pakistanis (83%) consider work to be an important part of their life; 8% say work is not important at all
According to a World Values Survey and Gallup & Gilani Pakistan, 83% Pakistanis consider work to be an important part of their lives while 8% say work is not important at all.
A representative sample of men and women from across the four provinces was asked, “How important is work in your life?” In response, 63% said work is very important, another 20% said it is rather important, 8% said not very important while 8% said work is not important at all.
Comparative Picture:
The question “How important is work in your life?” was asked previously between 1994-1998 and 68% Pakistanis then said very important while between 1999-2004, 60% claimed that work is very important. Proportion of Pakistanis claiming that work is very important rose between 1994 and 2014. For more historical data regarding this question, please visit our website.
(Gallup Pakistan)
August 10, 2020
Source: https://gallup.com.pk/post/30209
MENA
650-651-43-03/Poll
A large majority of UAE residents favour the economy becoming cashless
More than half claim to have paid in cash less often since the Coronavirus outbreak
YouGov’s latest survey reveals a large majority of UAE residents (63%) consider it very or fairly positive if their country became cashless. Men are more likely than women to hold this view (67% vs 55%). Preference for electronic payment is also higher among high-income households (earning AED 25000+ monthly) than the rest at 76%.
In general, ever since the Coronavirus pandemic engulfed the country, people seem to prefer going cashless and slightly more than half (52%) claimed to have paid in cash less often since the outbreak. Respondents within the income group of AED 10,001- 20,000 were more likely to say this than the rest of the income group members.
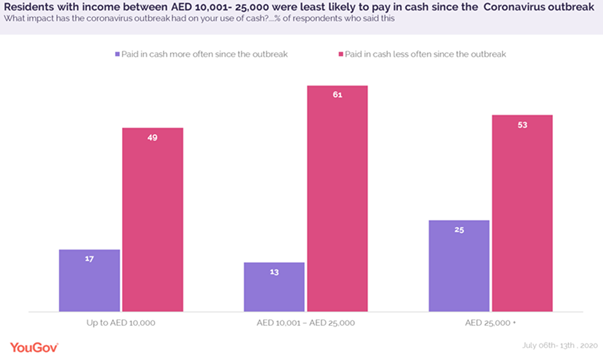
However, a small proportion (17%) have paid in cash more often since the outbreak with high-income individuals (AED 25,000+) more likely than others to have done so.
The availability of cash has not been affected amidst the crisis and residents have access to cash both from free ATMS ( with 85% saying they find it very or fairly easy to access cash from here) as well as from an ATM that charges a fee for a transaction (68% saying this).
In their day-to-day lives, cash is mostly used to make payments for very or fairly cheap items in physical stores, while cards (debit or credit) are used to make expensive (fairly or very expensive) purchases. Very few are using digital modes of payment for any of these purchases.
When it comes to making purchases in shops, a higher number of respondents consider it important to be able to make payments through credit or debit cards (79%), compared to cash (56%) or digital means like Apple Pay, Samsung Pay etc. (58%). Contactless payment, either through cards (86%) or digital wallets (69%), appears to be more important to high-income members (AED 25,000+) than the rest of the population.
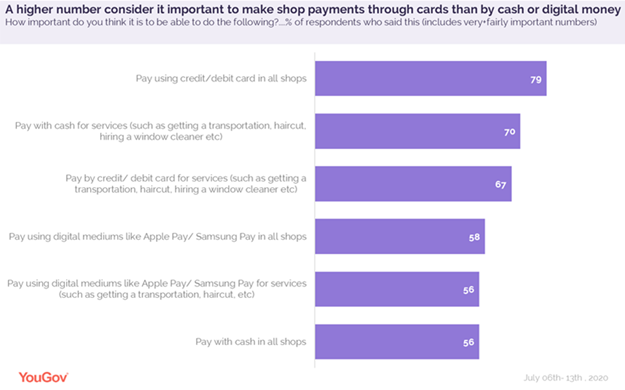
However, when it comes to personal services such as getting transportation, haircut, hiring a window cleaner, etc, seven in ten prefer making payments in cash (70%). Perhaps despite the ongoing Covid-19 situation, residents may not always have a choice of making these payments in any other form. The data indicate a large proportion of residents (67%) consider it important to have the option of paying with a card for these services, regardless of the circumstances. Comparatively, fewer favour digital modes of payment (56%) and it seems the use of this medium is less popular among residents than the other forms of payment.
(YouGov)
August 14, 2020
Source: https://mena.yougov.com/en/news/2020/08/14/large-majority-uae-residents-favour-economy-becomi/
AFRICA
650-651-43-04/Poll
Approval rating for government anti-corruption efforts drops after strong gains in 2017, new Afrobarometer study shows
A majority of Nigerians say the level of corruption in the country has increased and the government is doing a poor job of fighting it, a stark reversal from positive assessments three years ago, a new Afrobarometer study shows.
Among a variety of key formal and informal leaders, all are seen as plagued by widespread corruption by a significant proportion of the population. Among Nigerians who had contact with selected public services during the past year, substantial proportions say they had to pay a bribe to obtain the services they needed. The most frequent experience of paying a bribe was among citizens who sought assistance from the police.
In addition to negative reviews of the government’s anti-corruption efforts, a large majority of citizens say they do not feel safe reporting corrupt acts to the authorities.
Since assuming office in May 2015, the administration of President Muhammadu Buhari has taken several measures to curb corruption, including the establishment of the Presidential Advisory Committee Against Corruption (PACAC), prosecution of high-profile corruption cases, suspension of top government officials alleged to be involved in corrupt practices, adoption of a whistleblower protection policy, and enhanced capacity building programs for officers of anti-corruption agencies. But critics express distrust in the government’s anti-corruption campaign, voicing concerns about possible abuse of the whistleblower policy, institutional weaknesses, and perceived discrimination and lack of transparency in the management and distribution of COVID-19 funds and palliatives.
Key findings
- A majority (56%) of Nigerians say the level of corruption in the country increased “somewhat” or “a lot” during the past year (Figure 1).
- Six in 10 respondents (61%) say “most” or “all” police officials are corrupt, although this reflects continued improvement since 2012 (78%). About four in 10 citizens see widespread corruption among elected officials and judges, while traditional and religious leaders are least commonly seen as corrupt (by 26% and 30%, respectively) (Figure 2).
- Among Nigerians who had contact with key public services during the previous year, a large majority say they had to bribe the police at least once to get help (76%) or avoid a problem (68%) (Figure 3). Four in 10 (40%) say they paid a bribe to obtain a government document, while a quarter or fewer paid a bribe for school services (25%) or medical care (21%).
- Fewer than three in 10 citizens (28%) say the government is doing “fairly well” or “very well” in fighting corruption, half the proportion who approved of the government’s performance in 2017 (59%) (Figure 4).
- Eight in 10 Nigerians (83%) say ordinary citizens risk retaliation or other negative consequences if they report incidents of corruption to the authorities, up from 77% in 2017 (Figure 5).
Afrobarometer surveys
Afrobarometer is a pan-African, nonpartisan survey research network that provides reliable data on African experiences and evaluations of democracy, governance, and quality of life. Seven rounds of surveys were completed in up to 38 countries between 1999 and 2018. Round 8 surveys in 2019/2020 are planned in at least 35 countries. Afrobarometer conducts face-to-face interviews in the language of the respondent’s choice with nationally representative samples.
The Afrobarometer team in Nigeria, led by NOIPolls, interviewed 1,599 adult citizens of Nigeria in January-February 2020. A sample of this size yields country-level results with a margin of error of +/-2.5 percentage points at a 95% confidence level. Previous surveys were conducted in Nigeria in 1999, 2002, 2005, 2007, 2008, 2012, 2014, and 2017.
Charts
Figure 1: Level of corruption | Nigeria | 2020

Respondents were asked: In your opinion, over the past year, has the level of corruption in this country increased, decreased, or stayed the same?
Figure 2: Who is corrupt? | Nigeria | 2020
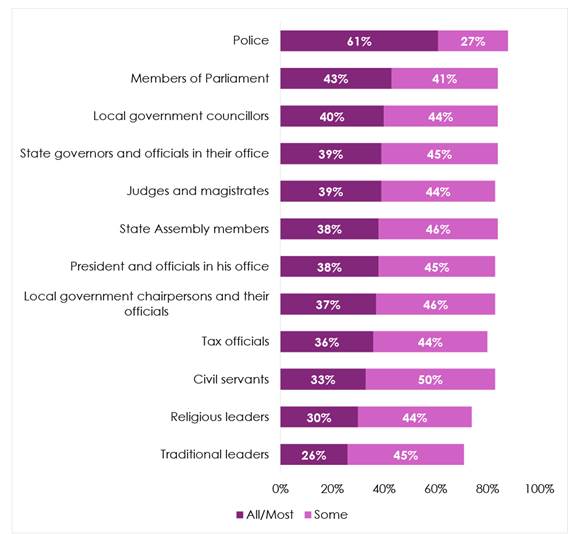
Respondents were asked: Respondents were asked: How many of the following people do you think are involved in corruption, or haven’t you heard enough about them to say:
Figure 3: Paid bribes to access public services | Nigeria | 2020
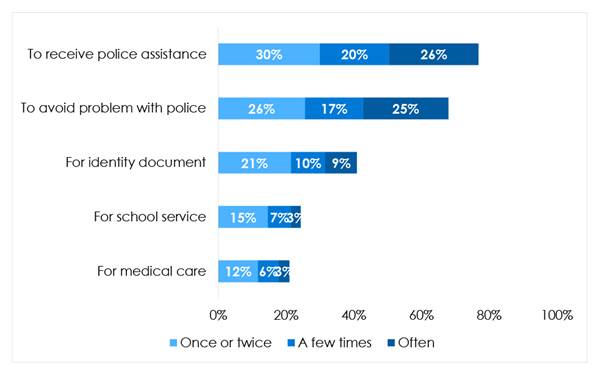
Respondents who had contact with key public services during the previous year were asked: And how often, if ever, did you have to pay a bribe, give a gift, or do a favour [for a public official to obtain the needed assistance or avoid problems]? (Note: Figure excludes those who had no contact with these public services.)
Figure 4 : Government performance in fighting corruption | Nigeria | 2008-2020
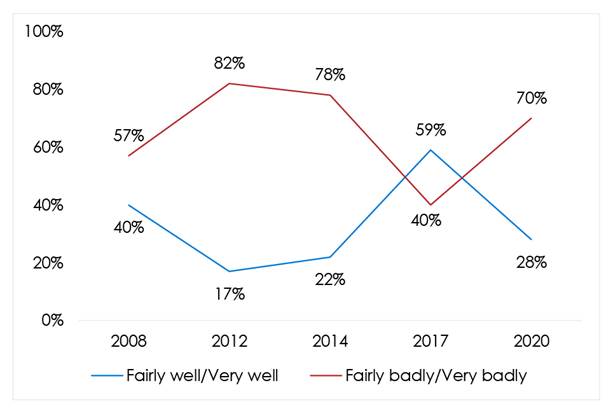
Respondents were asked: How well or badly would you say the current government is handling the following matters, or haven’t you heard enough to say: Fighting corruption in government?
Figure 5: Risk of retaliation for reporting corruption | Nigeria | 2017-2020
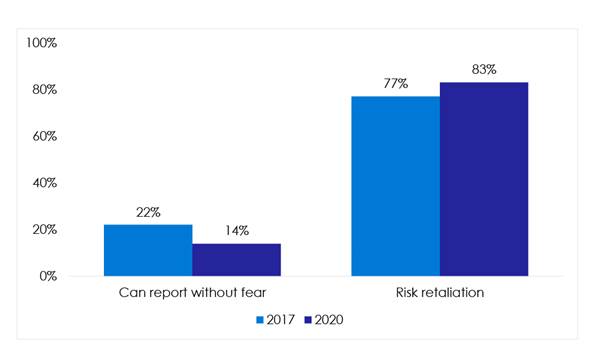
Respondents were asked: In this country, can ordinary people report incidents of corruption without fear, or do they risk retaliation or other negative consequences if they speak out?
(NOI Polls)
August 06, 2020
650-651-43-05/Poll
Media-only election campaigns likely to leave many Ugandans under-informed
Media-only election campaigns proposed to avoid mass rallies during the COVID-19 pandemic are likely to leave many Ugandans under-informed, a new analysis of Afrobarometer survey data shows.
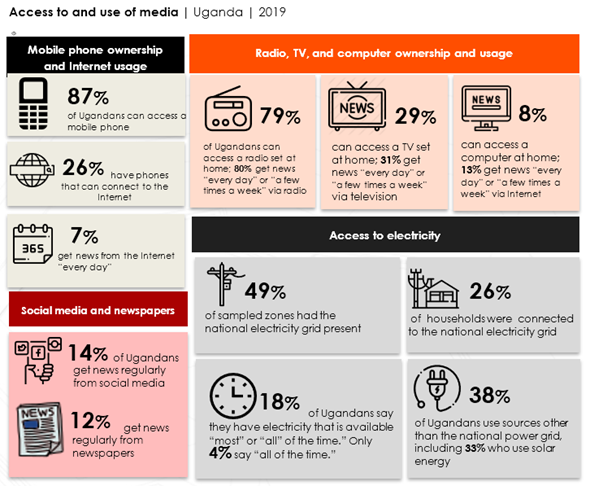
Migrating most campaign activities to the media to limit the spread of the coronavirus, as recently directed by the Electoral Commission, may be feasible as the number of registered/operational media outlets in Uganda has reached more than 300 radio stations, 50 television stations, and 10 major news publications while the Internet and social media are now available in most trading centers and villages. Recent increases in media penetration into the countryside and in local-language media, as well as strong popular support for a free media, add to the feasibility of media-only campaigns in the 2021 elections.
However, Afrobarometer survey data show that the proportion of Ugandans who can access and who make use of various media channels remains relatively low and concentrated among certain demographics, such as the young, the more educated, men, urban residents, and people in the Central region. Media-only campaigns may thus disadvantage more women than men, and many poorer, less educated, older, and rural citizens.
These findings make a strong case for the government to ensure access to media that guarantees equitable access and free engagement between candidates and members of the public.
(Afrobarometer)
August 14, 2020
EUROPE
650-651-43-06/Poll
Impact of the quarantine imposed in the UK on travelers from Spain
UK imposes quarantine on travelers from Spain
Last Saturday, July 26, the British Government announced by surprise the obligation to carry out a 14-day quarantine to any person entering the United Kingdom from Spain.
This fact caused a strong alarm in the Spanish tourism industry if we consider that in our country we receive more than 18 million British tourists a year.
We have looked at the data provided by the Profiles and DestinationIndex tools to see how tourists from the United Kingdom are in Spain, as well as the impact that the announcement of the Executive of Boris Johnson has had on the Spain brand as a tourist destination, using the opinion of the UK population about other European countries, as well as about their own country.
IMPACT ON THE SPAIN BRAND
The following graph clearly shows us how negative news in any type of media that has occurred about Spain in the UK has increased dramatically from the date of the announcement.
Similarly, the brand image of Spain as a tourist destination among the British is affected, going from being a reference in the tourist market, to placing last in just over a week. Italy and the United Kingdom itself gain integers compared to the rest of the countries and it is Italy that seems to benefit from the loss of image of our country.
Obviously, after the decisions taken by the Government in the UK, our brand Spain has generated a large number of comments, triggering the Word Of Mouth.
In fact, comments about Spain among the British population increased by more than 10 percentage points, giving much more to talk about than the rest of the countries.
Spain is the country with the highest level of consideration as a tourist destination among the population of the United Kingdom, if we compare it with other European destinations, with almost 40%. However, it appears that due to events, the British are considering the option of staying in their own country.
Although Spain is the preferred country for almost 20 out of 100 British people, far from the rest of destinations, how could it be otherwise, the intention to visit shows a decrease since the announcement about quarantine.
It seems that this intention to visit Spain is losing, is taken up by the option of local tourism (UK) and is not reflected in the rest of the countries.
Profile of the British tourist with the intention of traveling to Spain
In view of the data from the Profiles tool , we can conclude that the British tourist in Spain has a medium profile whose interests are based on the different types of mass sports in the UK (Football and Rugby), who travel looking for the sun and the beach, choosing vacation programs and using Low Cost airlines.
(YouGov)
August 03, 2020
Source: https://es.yougov.com/news/2020/08/03/impacto-de-la-cuarentena-impuesta-en-uk-los-viajer/
650-651-43-07/Poll
Worried, Belgians adapt their holiday intentions to the context of COVID-19
According to a survey carried out by Ipsos for the Europ Assistance Group1 , 82% of Belgians say they are going on holiday this year. Among them, 59% intend to leave this summer.
The COVID-19 pandemic and the resulting health measures have had a significant impact on the Belgian way of life. Their travel plans have been compromised since March. The easing of measures and the reopening of our borders go hand in hand with the realisation of travel plans for some of them. However, COVID-19 strongly influences the behaviour of holidaymakers, as well as their travel intentions. The survey conducted in June by the Europ Assistance Group and carried out by Ipsos among 11,001 people on three continents, including 1,000 in Belgium, highlights certain clear trends. We are particularly interested here in the results for Belgium.
Impact of COVID-19 on the
Belgians
We know that COVID-19 had a direct and significant impact on the population. Indeed:
- 72% of Belgian respondents said they were concerned about the risks that COVID-19 might have on their health;
- 30% said they had been financially impacted by the crisis;
- 20% have been affected by the disease themselves or one of their relatives.
What are the fears of
Belgian travellers regarding COVID-19?
Belgian respondents expressed a variety of fears that could impact their
stay. The main fear expressed is that of a resurgence of the COVID-19 epidemic
during their trip (for 34%).
The other fears put forward concern:
- the possibility of quarantine (33%);
- falling ill during the trip (26%);
- the inability to carry out planned visits, activities and leisure activities because of COVID-19 (25%);
- inability to return home (21%);
- the possible closure of bars, restaurants and hotels due to COVID-19 (20%);
- the need to cancel the trip (18%);
- the effectiveness of the medical infrastructure in the country visited (12%).
How do Belgian holidaymakers
plan to adapt their behaviour?
Travellers who have actually made the decision to go on holiday this
summer have taken COVID-19 into account and will prefer to avoid restricted
areas and crowds. Thus, 72% of Belgian respondents with a travel plan say they
will avoid certain particularly affected countries and crowded places and 62%
will favour places from which they can easily return.
54% will avoid planes and airports.
This is reflected in the means of transport favoured
by Belgians during their holidays:
- 69% will prefer to go by car this summer (compared to 55% in 2019)2 ;
- 61% will avoid cruises;
- and only 26% plan to go by plane this summer (against 43% in 2019).
This summer, the car seems to be the means of transport in which the traveller feels safest and which allows him/her to reach his/her destination (and return quickly). These precautions go hand in hand with the purchase of insurance and assistance in order to be prepared for any eventuality. Thus, 93% consider it very important to have good medical coverage, 87% to have cancellation insurance and 83% to have luggage insurance.
Which destinations and types
of accommodation will Belgians choose this summer?
The survey conducted in June revealed that 23% of Belgians had already booked their holidays this summer and 14% were planning to do so soon.
- 23% intended to travel to Belgium or to staycation (compared to 18% in summer 2019);
- 64% in Europe (of which a majority in France);
- 8% hoped to be able to travel outside Europe.
Compared to previous years, the types of accommodation favoured this summer are also impacted by the crisis. Hotels, which are usually very popular, are chosen by only 38% of Belgian holidaymakers this summer compared to 53% in 2019. Private rentals and campsites also remain popular (respectively 35% and 15% against 35 and 13% in 2019).
What kind of holidays are
Belgians looking for and how long are they staying?
Contrary to the results of 2019 (47%), holidays spent with family and/or friends no longer seem to be the preferred formula since only 18% of respondents plan this type of holiday for their next stays. The majority will leave with their family "bubble". Furthermore, 27% say they want to go to the beach, 15% to the countryside and 11% to the city.
Long-term stays are still popular, with 48% of Belgians surveyed planning to leave for 2 weeks or more during the summer of 2020. On the other hand, only 6% of those surveyed plan to go away for a weekend, compared with 14% for 3 or 4 days.
What budget will Belgian
households spend on their next big trip?
The average budget that Belgian households say they plan to spend on their next trip (in the summer or later in the year) is also affected by the crisis, rising from 2,242 EUR last year to 1,788 EUR this year. The effect of the crisis on the incomes of some people and the prudence and uncertainty of the current situation probably explain this decline. Nevertheless, the Belgian budget for holidays is higher than the European average of 1,604 EUR.
At the Belgian level, French-speaking households (Brussels and Wallonia) would be prepared to spend more on their holidays than Dutch speakers (Flanders), respectively 1,886 EUR and 1,690 EUR.
(Ipsos)
July 30, 2020
Source: https://www.ipsos.com/en-be/worried-belgians-adapt-their-holiday-intentions-context-covid-19
650-651-43-08/Poll
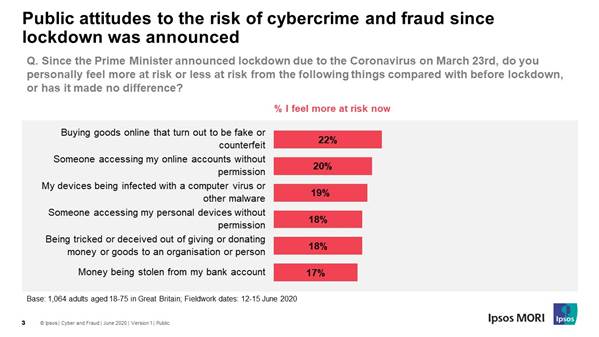
A fifth of the British public feel more at risk of cybercrime and fraud since lockdown
New research from Ipsos MORI shows around a fifth of the British public feel more at risk of certain types of cybercrime and fraud since the Prime Minister announced lockdown due to the Coronavirus on 23 March.
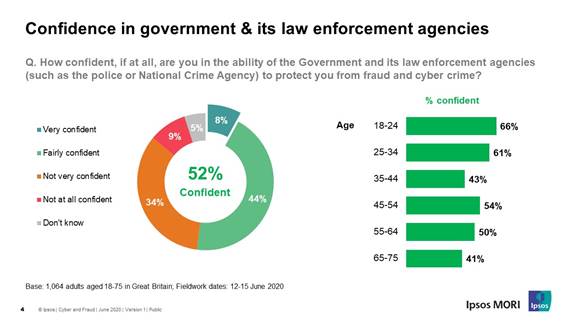
New findings from Ipsos MORI shows around a fifth of the British public feel more at risk of certain types of cybercrime and fraud since the Prime Minister announced lockdown due to the Coronavirus on March 23rd. This includes feeling more at risk of buying counterfeit goods online, someone accessing their online accounts without permission and their devices being infected with computer viruses or other malware. Against a backdrop of uncertainty, half of the British public feel confident in the ability of the Government and its law enforcement agencies to protect them from fraud and cybercrime.
When it comes to feeling at risk of cybercrime and fraud, people feel most at risk of someone accessing their online accounts without permission (58%) and devices being infected with a computer virus or other malware (57%). But since the Prime Minister announced lockdown due to the Coronavirus on March 23rd a fifth of the British public feel more at risk of buying counterfeit goods online (22%), someone accessing their online accounts without permission (20%) or their devices being infected with computer viruses or other malware (19%).
Half of the British public have confidence in government and law enforcement agencies to protect them from fraud and cybercrime (52%). This differs by age with 18-24s (66%) and 25-34s (61%) the most likely to place confidence in the government and law enforcement agencies while those aged 65-75 the least likely (41% confident).
When asked about specific cyber-secure behaviours, one in four Britons (27%) say they have installed the latest software and app updates on their devices since the Prime Minister announced lockdown on 23rd March with a similar proportion saying they have checked if a company is genuine before sending a payment of information (26%). One in five have reported suspicious emails (21%) or updated any account password with a stronger alternative (21%).
People aged 18-34 (36%) and those in social grade AB (34%) are more likely to have taken steps to be more cyber secure since lockdown was announced compared with older Britons. While the majority of people say they would have taken cyber secure steps regardless of the coronavirus lockdown, there are certain behaviours which are more likely to have been adopted as a direct result of feeling more at risk due to coronavirus, for example, updating account passwords with a stronger alternative (36%) or changing the password of a main email account to be strong and separate from all other accounts (33%).
One in five Britons (18%) say they have received emails, text messages or calls offering investment or money-making opportunities or senders callers impersonating a government department or other public service. Around one in eight (13%) have received emails, text messages or calls regarding the sales of face masks, personal protective equipment (PPE) or coronavirus testing kits from unofficial sources.
.
Commenting on the findings, James Stannard, Associate Director at Ipsos MORI, said:
Around half of the British
public say they are confident in the government and law enforcement agencies to
protect them from fraud and cybercrime but a sizeable chunk of the population
is feeling more at risk since the PM announced lockdown in late March.
When it comes to specific risks, people are most concerned about their online
accounts being accessed without permission or their devices being infected with
viruses or malware. While around a third of people who have taken steps to be
more cyber-secure say they have done so as direct result of feeling more at
risk, it’s vital everyone does more to protect themselves from fraud and
cybercrime, not just those who feel more vulnerable.
(Ipsos MORI)
August 11, 2020
650-651-43-09/Poll
Largest home antibody testing programme for COVID-19 publishes findings
Working mums are most likely to feel the strains of the crisis and women are more likely to be concerned about the emotional and mental toll of the pandemic.
NEW research by Ipsos MORI shows that women are much more likely to be finding life harder during the crisis than men and the strains are most keenly felt by working mums. The survey, carried out online among 2,125 adults aged 18-75, shows that:
- Over half (55%) of women say they are finding it harder to stay positive day-to-day compared with 44% of men. Six in ten women (59%) say they are finding it harder to stay positive about the future compared with half of men (49%).
- Among working parents, 55% of working mums say they are finding it harder to stay positive day-to-day compared with around a third of working dads (35%). And the story is similar about staying positive about the future, where 57% of working mums say they are finding it harder to stay positive compared with 42% of working dads.
- Women are also more likely to say they are finding it harder to keep entertained (46% vs 38% for men), staying fit and healthy (43% vs 37% for men) being able to work (42% vs 36% for men) and being able to afford their usual expenses (36% vs 31% for men).
- The gender gap on these measures is wider among working parents, with working mums finding the hardships much greater than working dads across the board, including keeping entertained (56% working mums vs 40% working dads), staying fit and healthy (49% vs 37%), being able to afford your usual expenses (48% vs 37%) and staying in touch with family and friends (48% vs 36%).
Women are more concerned than men about the mental and emotional toll the pandemic will have over the next 12 months. The survey shows that:
- Two in five Brits (39%) say that the pandemic is likely to have a negative impact on their mental health personally over the next year. A similar proportion (38%) say it will have a negative impact on their ability to do the things that make them feel fulfilled. Around a third (35%) are personally worried about the impact on their financial situation.
- Women are more worried about these impacts than men (42% vs 35% of men on mental health and 41% vs 35% of men on their ability to do things that make them fulfilled). And while there are similar levels of concern over these measures among working parents, working mums are significantly more likely than working dads to be concerned about the impact it will have on their mental health (44% vs 28%).
- One area where men are more concerned than women is the impact it will have on their relationships; single men are more worried about the impact of the pandemic on their romantic relationships than single women (30% vs 25%).
- On a more optimistic note, half of parents (48%) say that the Coronavirus crisis is likely to have a positive impact on their relationship with their children over the next year compared with just seven per cent who say it will have a negative impact.
- On this measure, there is no difference between working mums and dads.
Kully Kaur-Ballagan, Research Director at Ipsos MORI said:
Throughout the pandemic and
during lockdown women have borne much more of the emotional strains of the
crisis. These new findings highlight the disproportionate impact the crisis has
had on working mums – who are finding it more difficult to stay positive
day-to-day and are more concerned about the impact on their mental
health.
The strains women feel may
be linked to the heightened economic uncertainty they face as result of the
crisis, which as Britain enters into recession, are likely to be brought into
sharper relief.
(Ipsos MORI)
August 13, 2020
650-651-43-10/Poll
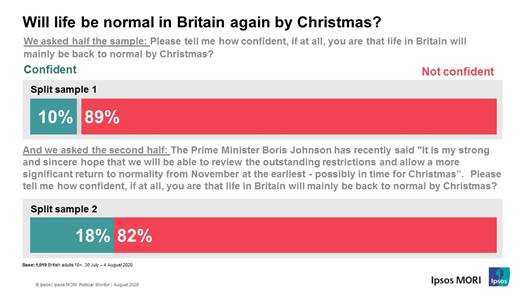
Few believe Britain will be back to normal by Christmas, while opinion split on ending furlough in October
The latest Ipsos MORI Political Monitor shows that most Britons lack confidence that life in Britain will mainly be back to normal by Christmas.
Most Britons lack confidence that life in Britain will mainly be back to normal by Christmas, according to the latest Ipsos MORI Political Monitor. The question was split-sampled, with half the sample being just asked how confident they were that life in Britain would be mainly back to normal by Christmas, and half being reminded of the Prime Minister’s statement that “It is my strong and sincere hope that we will be able to review the outstanding restrictions and allow a more significant return to normality from November at the earliest - possibly in time for Christmas”. Without reminding, the poll shows nine in ten (89%) have no or little confidence things will be back to normal by Christmas, with just one in ten (10%) being confident. When reminded of Boris Johnson’s quote respondents showed slightly more optimism with 18% being confident normality will return by Christmas, but still eight in ten (82%) say they are not confident.
Other findings from the survey include:
- Half (48%) think that the Chancellor is right to end the furlough scheme in October compared with 43% who think it is too soon.
- Seven in ten (69%) Conservative supporters think the Chancellor is right to end the furlough scheme in October (26% think it’s too soon) compared with 37% of Labour supporters (59% think it’s too soon).
- Young people are more likely to think the furlough scheme is being ended too soon (52% of 18-34 year olds vs 36% of those aged 55+).
- Pessimism remains high in Britain on the health of the economy. Seven in ten (68%) think it will get worse in the next 12 months (down 1 point from June) while 20% think it will improve (down 2 points) leaving an Economic Optimism Index score of -48.
- Just over half (54%) think that schools fully reopening in September would be about the right time, while a third (32%) say it’s too soon and just 7% say it’s too late.
- Conservative supporters are more likely to say schools reopening in September is about the right time (65%) than Labour supporters (52%) while Labour supporters are more likely than Conservative supporters to say this is too soon (40% vs 19% respectively).
Commenting on the findings, Gideon Skinner, Head of Political Research at Ipsos MORI, said:
Britons remain concerned
about the coronavirus and are preparing for a long haul with few expecting a
return to normality any time soon. Having said that, around half are prepared
for schools to fully reopen and the furlough scheme to end in the Autumn, but
many young people in particular are worried these are coming too soon
August 07, 2020
650-651-43-11/Poll
Britons prefer Biden to Trump in US race
Seven in ten would prefer to see Biden win the Presidential Election in November.
Three-quarters (76%) of the British public feel unfavourable towards US President Donald Trump while 12% are favourable, according to the latest Ipsos MORI Political Monitor. Mr Trump’s low favourability scores are slightly worse compared with two years ago when 68% were unfavourable and 19% favourable, but are slightly better than his ratings in 2016. Britons however have less strong feelings towards former Vice President and Democratic challenger, Joe Biden. A third (35%) are favourable to Mr Biden and just 15% unfavourable – 33% are neutral while 18% are yet to make up their mind. In October 2016 46% felt favourable towards Hillary Clinton and 36% unfavourable.
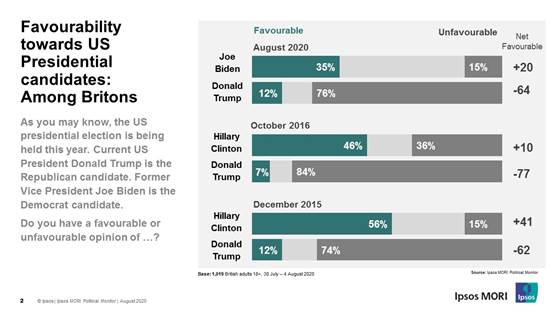
Despite the lukewarm reception for Joe Biden amongst the British public seven in ten (69%) would prefer him to win the election over Donald Trump (12%). A majority of both Conservative and Labour supporters prefer Joe Biden although Labour supporters are much more enthusiastic for the former Vice President to beat Mr Trump (89% of Labour supporters vs. 54% of Conservatives). One in five (22%) Conservatives prefer Donald Trump vs. just 4% of Labour supporters.
Even though most prefer Joe Biden to win the presidency Britons are more divided on whether he actually will be victorious. Two in five (42%) think Joe Biden will win compared with 38% who think Trump will be re-elected. Conservatives are also split (42% think Trump will win vs. 38% saying Biden) while Labour supporters have a stronger feeling that Joe Biden will win (49% vs. 37% saying Trump).
Commenting on the findings, Keiran Pedley, Research Director at Ipsos MORI, said:
Our poll shows that Britons overwhelmingly prefer Joe Biden
as US President to Donald Trump, though they are pretty evenly split on who
they think will actually win in November. The British public took a dim view of
Trump before the last election in 2016, when 84% were unfavourable
towards him and little has changed since. Our most recent poll shows some 76%
of Briton are unfavourable towards Trump now, with 6
in 10 saying that they are ‘very unfavourable’.
Joe Biden, meanwhile, excites less opinion either way than the last
Democrat candidate, Hillary Clinton.
(Ipsos MORI)
August 07, 2020
Source:
https://www.ipsos.com/ipsos-mori/en-uk/britons-prefer-biden-trump-us-race
650-651-43-12/Poll
Four in ten Scots don’t think English travellers should be allowed in without quarantining
A
similar number of Welsh people feel the same way
As the summer holiday season began, groups of Scots began protests at the border demanding English tourists stay away rather than risk bringing coronavirus to Scotland.
Now the results of a new YouGov survey reveal that four in ten Scots (40%) oppose English people coming to Scotland if they don’t have to quarantine on arrival. They are, however, marginally outnumbered by the 47% of Scots who are fine with English tourists still being allowed in.
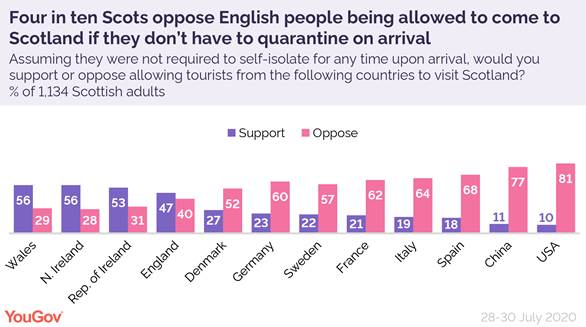
Politics likely plays a role. The majority of 2019 SNP voters (54%) want English travellers to stay away, while just 19% of Scottish Tory voters say the same. Likewise, ‘Yes’ voters from 2014 would block English tourists by 52% to 36%, while these figures are largely reversed among ‘No’ voters, who support allowing English tourists to cross the border by 55% to 30%.
Opposition is somewhat lower for tourists from Wales (29%), Northern Ireland (28%) and the Republic of Ireland (31%). Scots of all political dispositions are happy for travellers from these countries to make their way to Scotland.
Travellers from further afield are less welcome, however. Scots’ reluctance to allow tourists from continental Europe, the US and China is even greater than it was among Britons as a whole when we asked the same question at the end of June.
Welsh
people are slightly more willing than Scots to accept travellers from the rest
of the British Isles
The results in Wales are very similar to those in Scotland: 37% of Welsh people want English tourists to stay away compared to 50% who would welcome them. Again, politics plays a role, with 2019 Plaid Cymru voters the most likely to oppose English travellers at 54%.
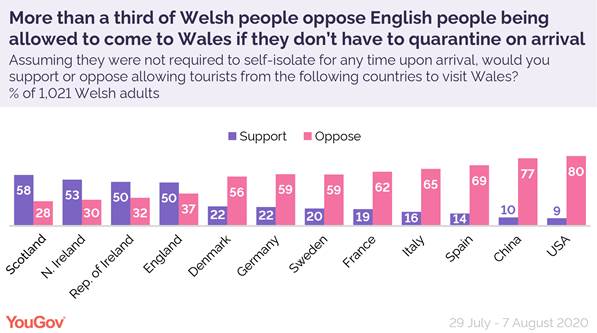
Welsh people are slightly more supportive – or at least slightly less opposed – to people from the rest of Britain and Ireland coming to visit. And, as in Scotland, they are much more worried about tourists from continental Europe, the US and China.
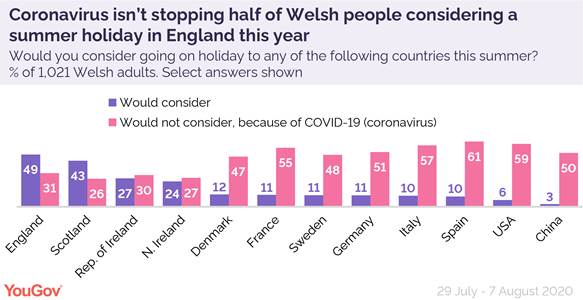
Where
would Scottish and Welsh people consider going on holiday this summer?
The survey also looked at whether Scots and Welsh people themselves would be willing to cross any borders – internal and international – for a summer holiday this year.
Few Scots would consider going to England (36%) or Wales (32%) on holiday this year. Welsh people are more willing to cross nearby borders: 49% are open to going to England, and 43% might hit up Scotland.
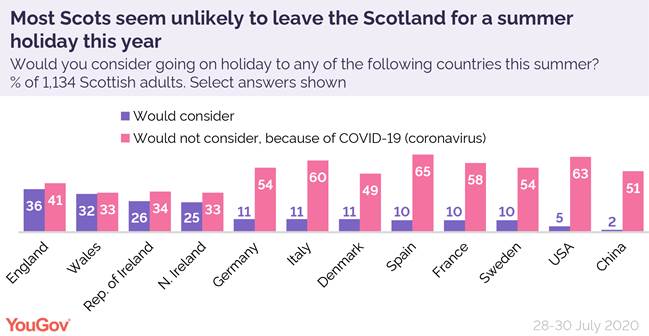
Both, however, are unlikely to go to Ireland or Northern Ireland, with about a quarter of Scots and Welsh people saying they might in both cases.
Willingness to travel further afield plummets by comparison. Among both national groups only 10-12% would be willing to visit any of the countries in continental Europe we asked about. China and the US are even less appealing: just 5-6% would consider going Stateside and a mere 2-3% say the same of China.
(YouGov)
August 14, 2020
650-651-43-13/Poll
Animals or environment: which do Brits donate more to?
Which Brits donate to which cause? YouGov Profiles reveals all
Charities focused on animals are currently the second most popular category choice with donors, with 13% of Brits having made a donation to one in the last three months. On the other hand, just 6% of Brits have backed an environment-focused charity over the same period.
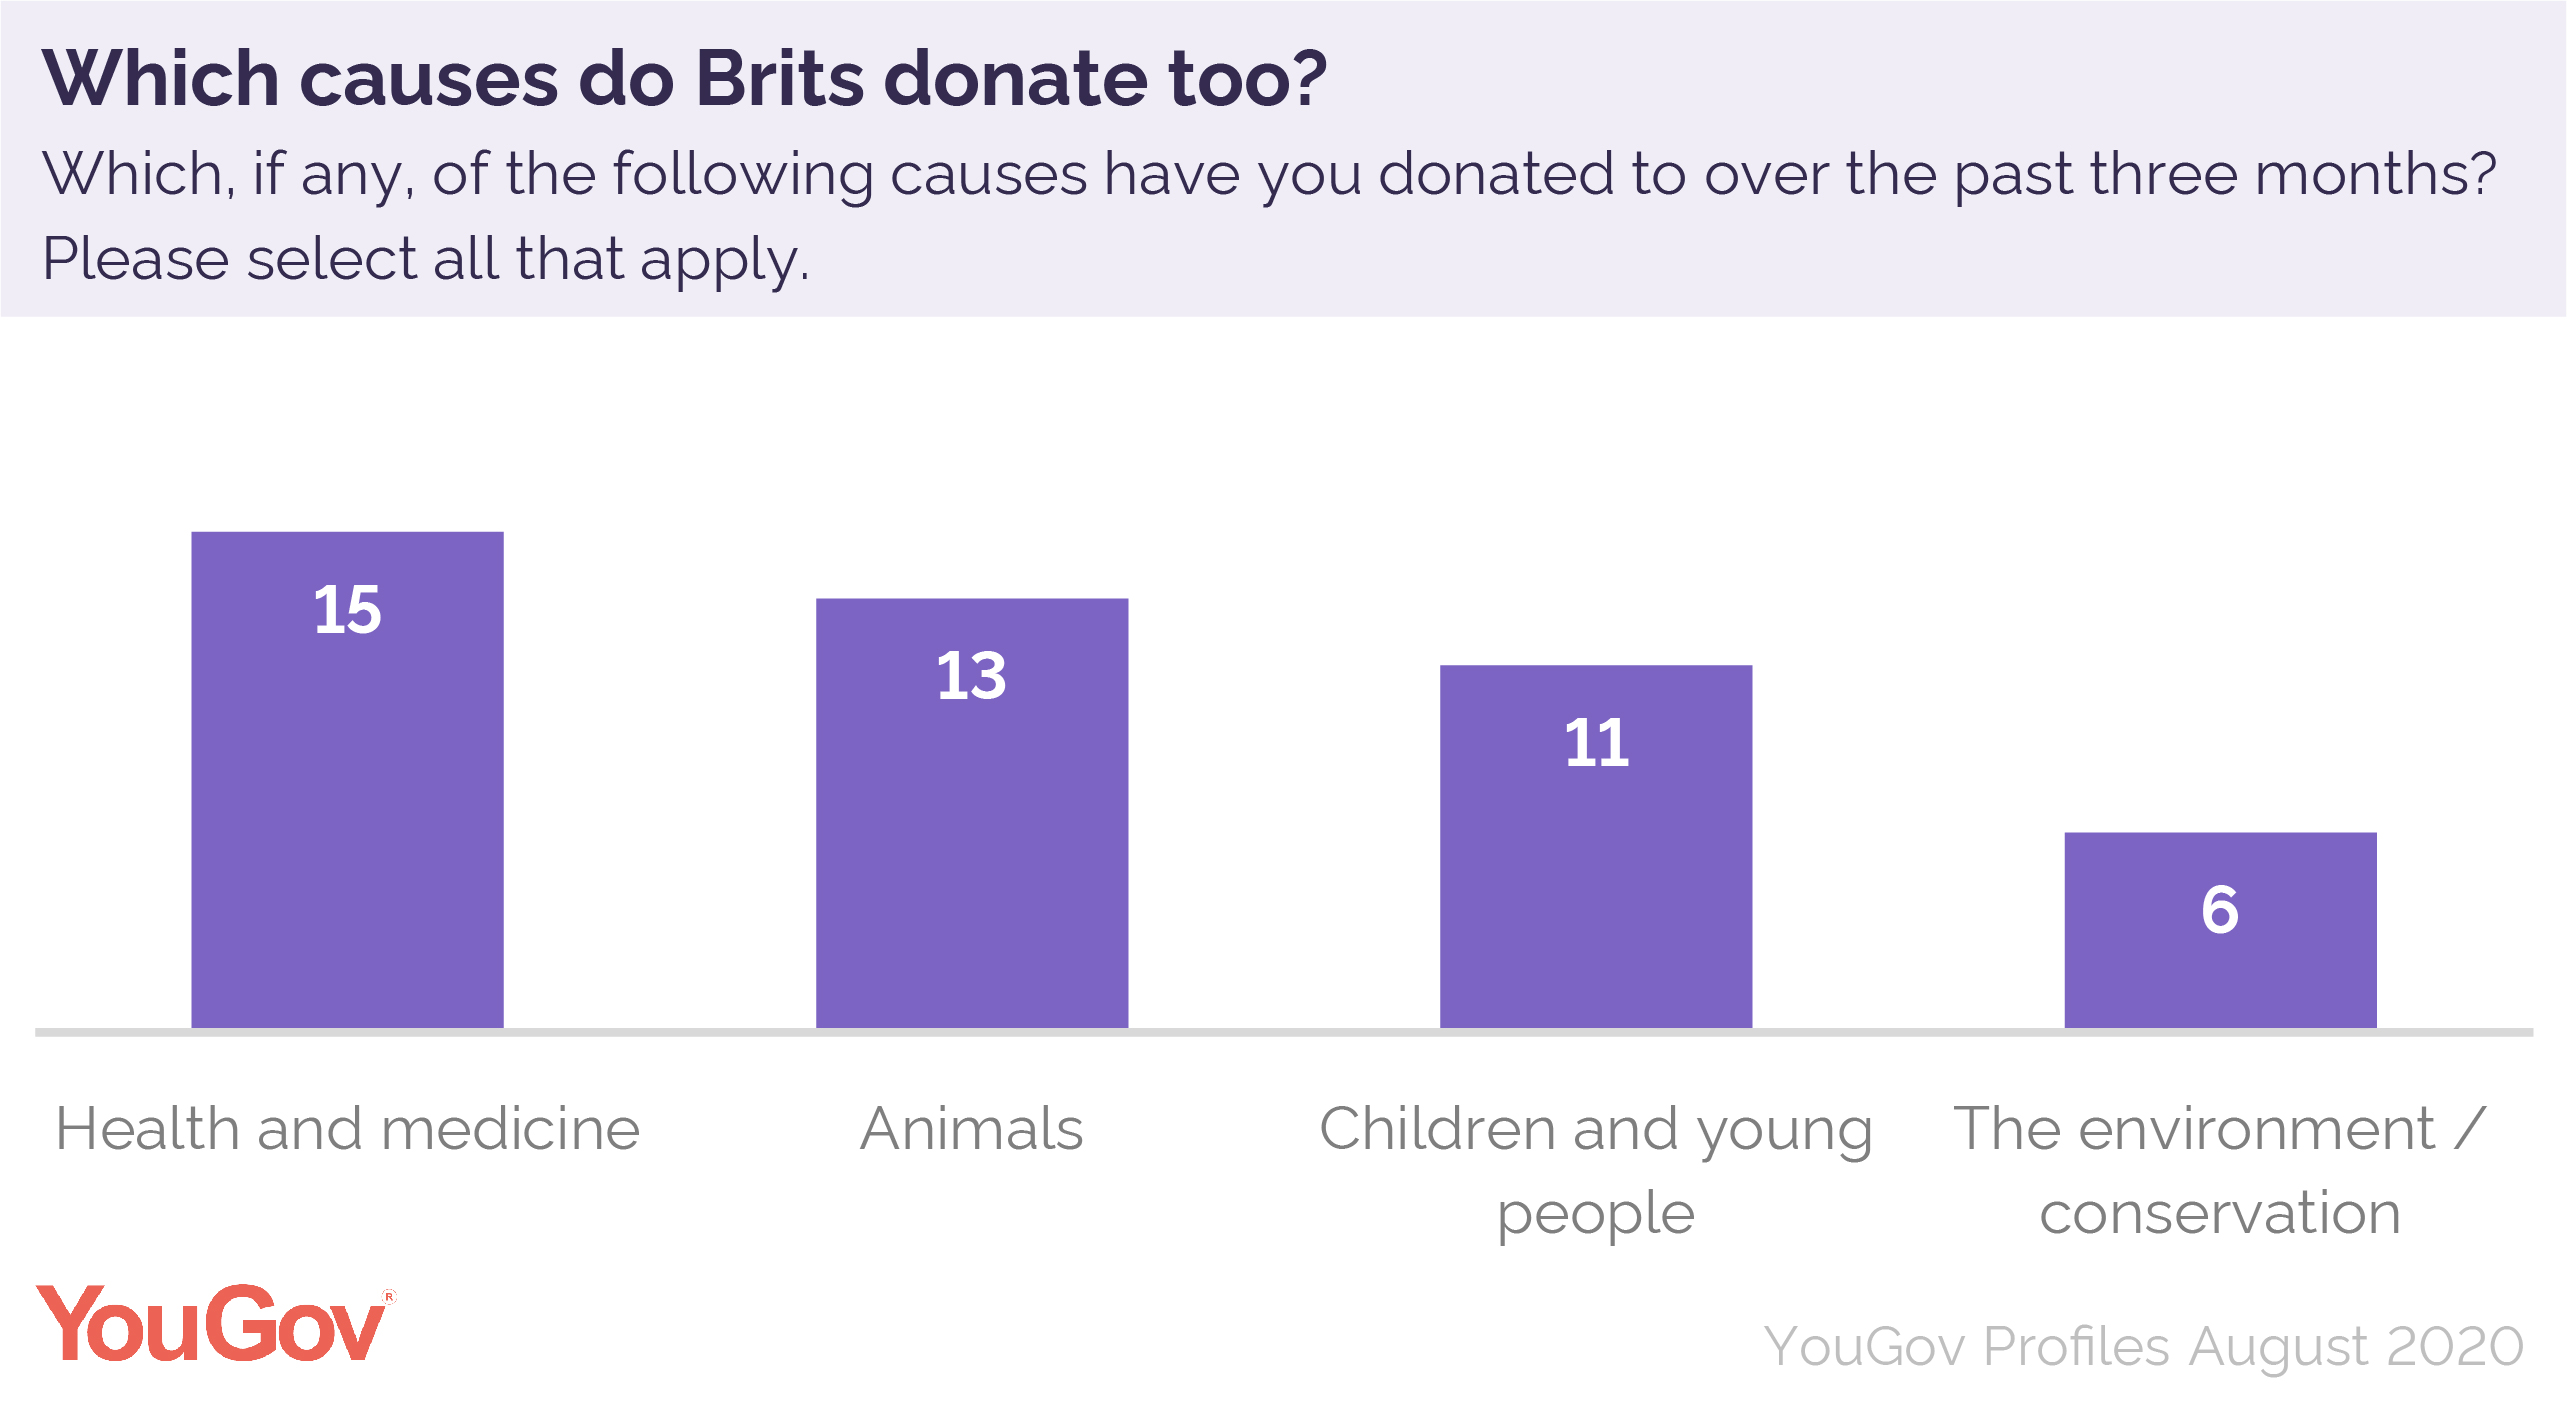
Who is more likely to donate, however? YouGov Profiles demographics shows that, as other recent YouGov investigations into the charity sector have, that younger Brits are much less likely to donate than their elders.
Younger Brits, such as those aged 18 to 29, are more likely to be donors to environmental charities (21%) than animal charities (11%).

Older Brits are inversely more likely to support causes looking after animals; 60% of recent donors to animal charities are aged over 51, compared to 49% of recent environmental charity donors.
YouGov Profiles also reveals some interesting attitude differences between the two groups, such as environmental charity donors being more likely to agree that veganism is a more ethical diet (45%) compared to animal charity donors (31%) – a difference of 14% percentage points.
The groups also differ when it comes to diet. Animal charity donors are more likely to have a conventional carnivorous diet (62%) than those who recently donated to an environmental cause (54%).
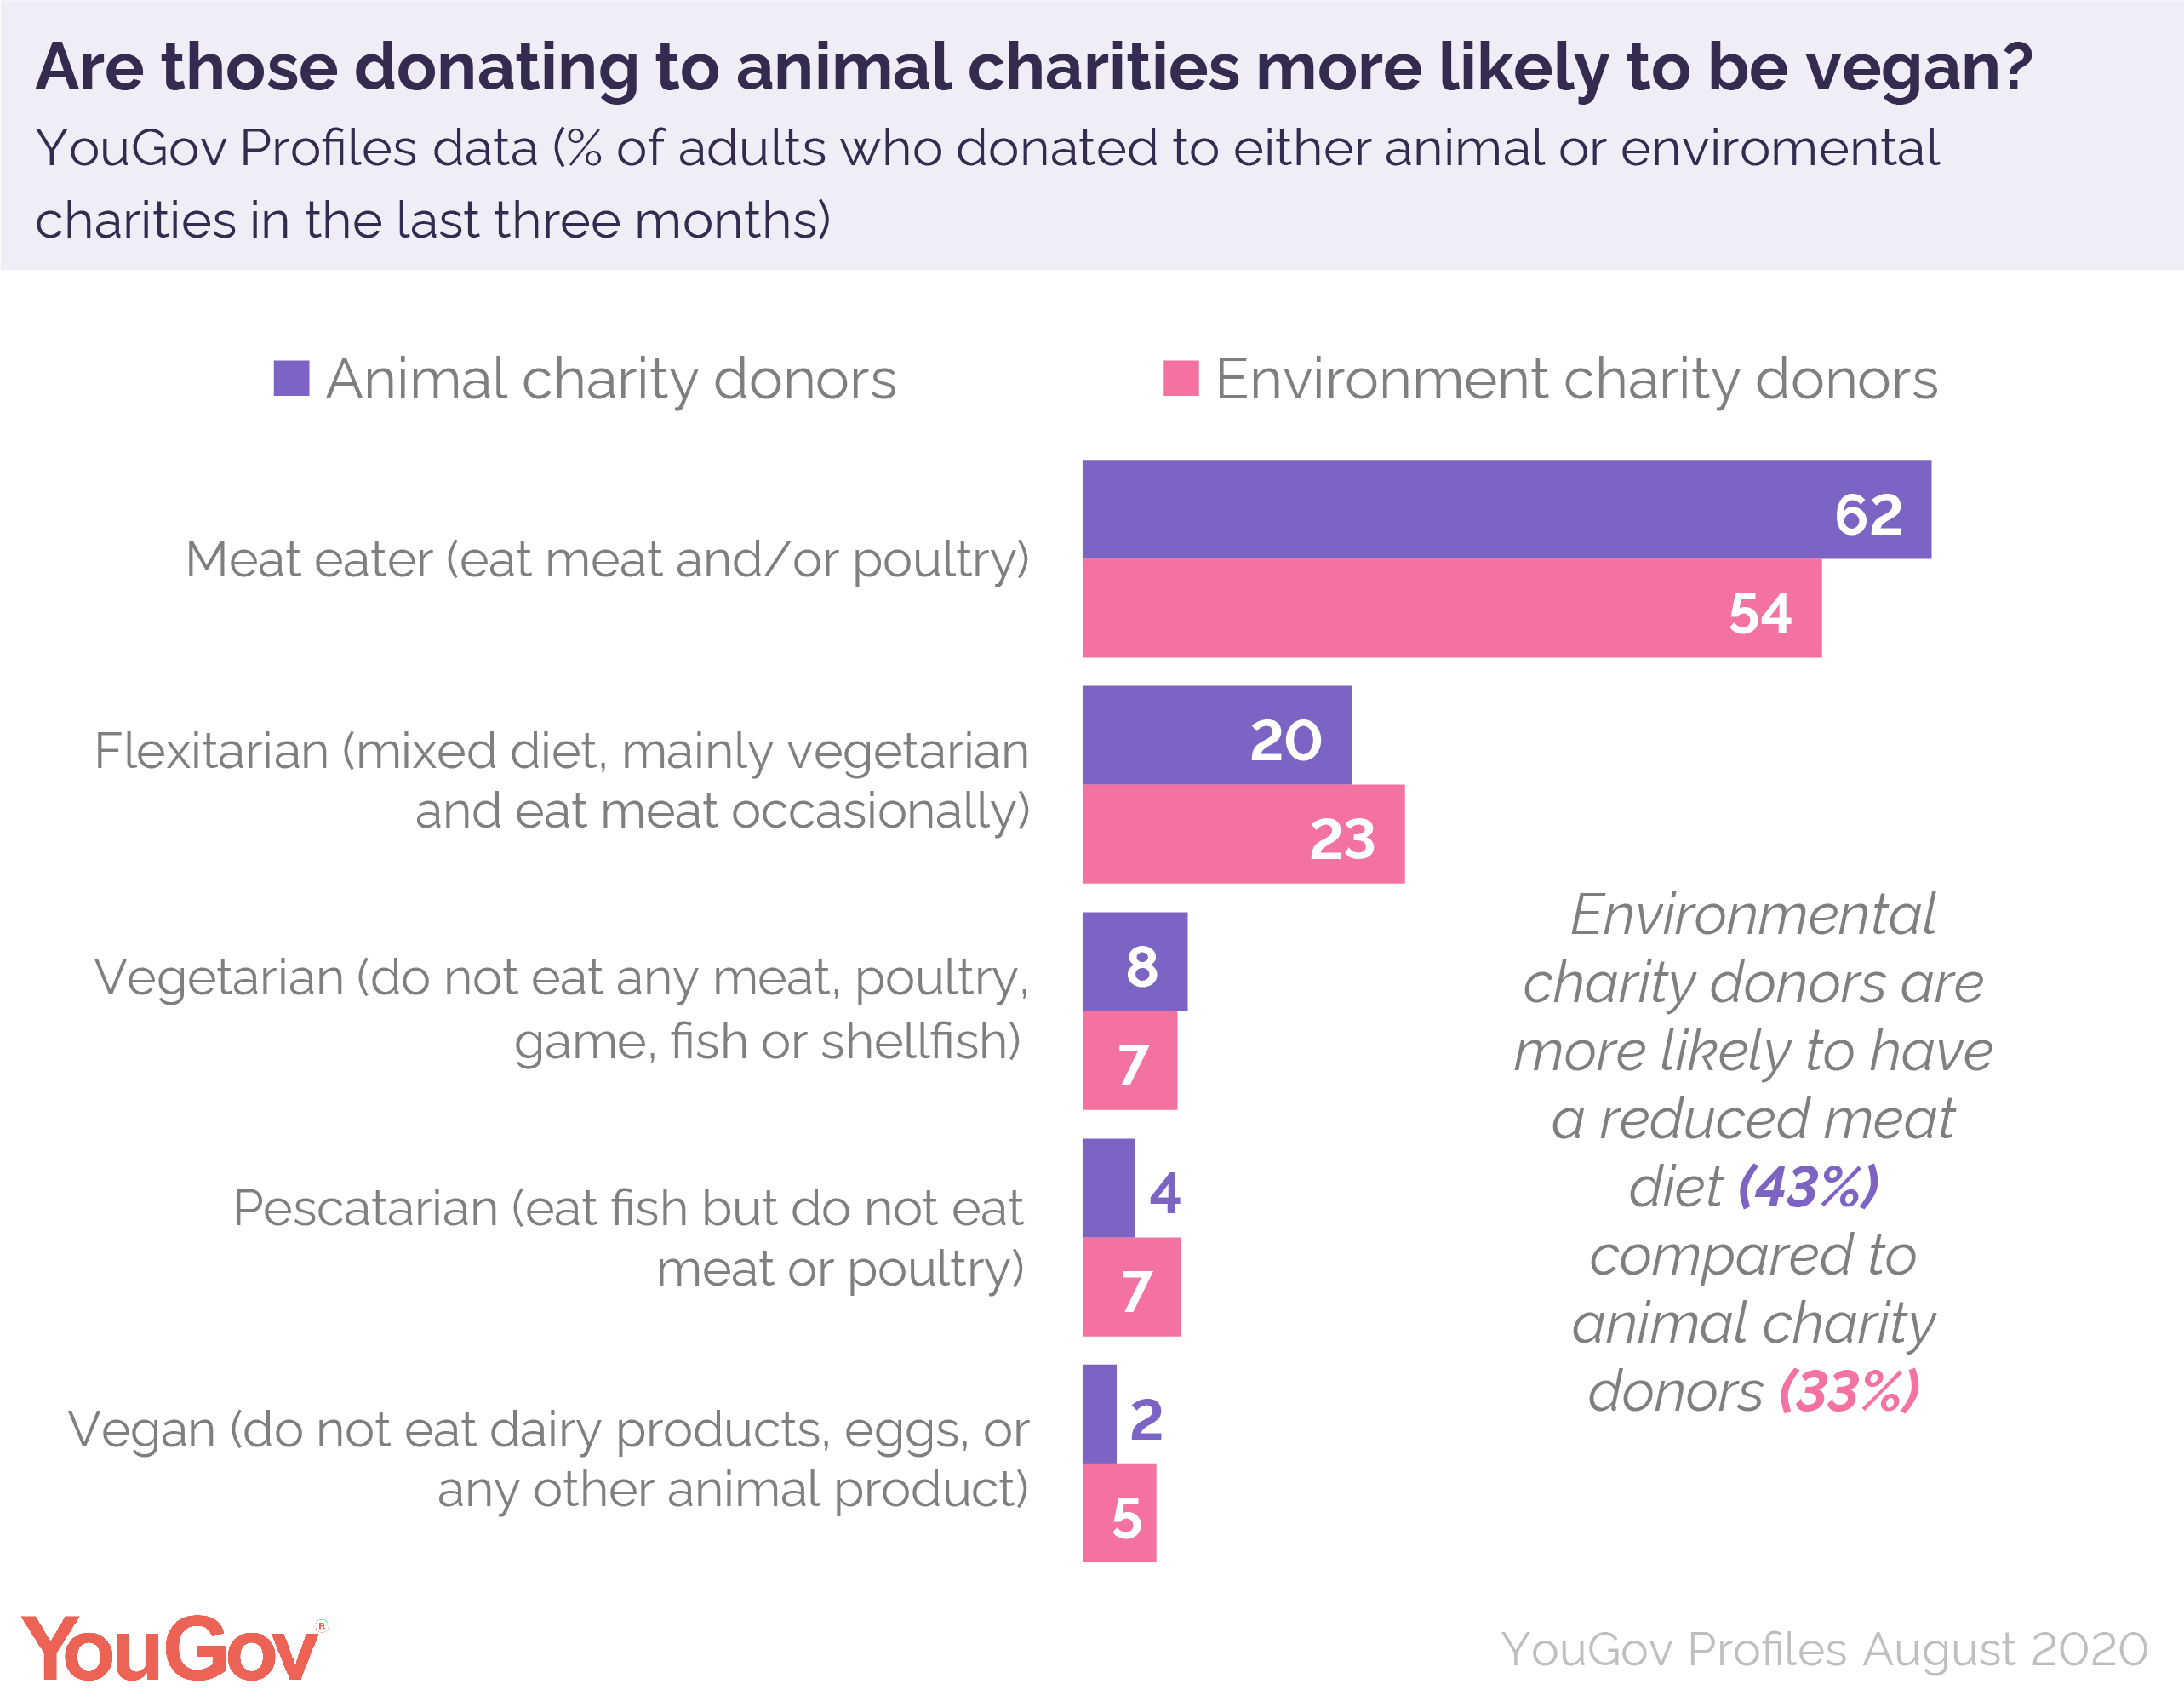
Those who have recently donated to an environment charity are more likely to have a form of reduced-meat diet, with 43% of donors to such charities being either flexitarian, vegetarian, pescatarian, or vegan compared to 33% of animal charity donors.
(YouGov)
August 13, 2020
650-651-43-14/Poll
Four out of five healthcare workers expect second COVID wave
Some
84% of healthcare professionals believe there will be a second wave of
coronavirus, as a quarter of NHS workers who need PPE still report shortages
The Prime Minister may hope for a ‘return to normality by Christmas’, but the vast majority of healthcare professionals are not quite as optimistic. A third (33%) believed a second wave is very likely while half (51%) said it’s fairly probable when surveyed in late June. Only 9% believed another outbreak is unlikely.
NHS staff still concerned about their health and PPE
A quarter of NHS workers (25%) who need PPE still said they lacked adequate equipment, even as the Government in June announced it had delivered two billion items of PPE to frontline workers.
The figure includes 18% who said they don’t have enough of the correct PPE to protect against coronavirus, 5% who only had less suitable equipment and 2% who had no PPE at all.
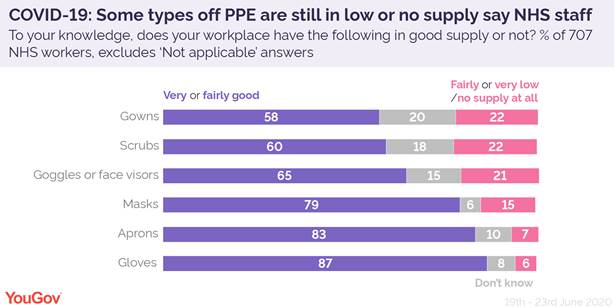
A breakdown shows that over a fifth of NHS workers who need PPE said gowns (22%), scrubs (22%) and goggles or face visors (21%) are in short supply or entirely lacking. These numbers include one in twenty staff (5%) who said they have no access at all to gowns or scrubs.
One in seven NHS workers who need PPE also said stock of masks is low (14%) or non-existent (1%). Apron (7%) and glove (6%) shortages are less common but are still an issue for some.
Overall, three in ten NHS workers (31%) said it’s fairly (23%) or very likely (8%) that they will contract coronavirus in their workplace. And while the Prime Minister recently announced that anyone can now use public transport, 31% of healthcare professionals said it’s fairly (12%) or very (19%) difficult to socially distance on their commute.
(YouGov)
August 11, 2020
650-651-43-15/Poll
Which Brits are social media ‘stalkers’?
One
in six Brits say they’ve “stalked” someone on social media – that is to say,
researched someone surreptitiously online
It’s tempting to use social media platforms to take a sneak peek at the personal life of a colleague, an ex-partner, or even to vet future housemates. But how many Brits say admit that they’ve ‘stalked’ someone on social media?
Overall, one in six (17%) of Britons agree that they have been known to ‘stalk’ through social media, while 78% say they have not.
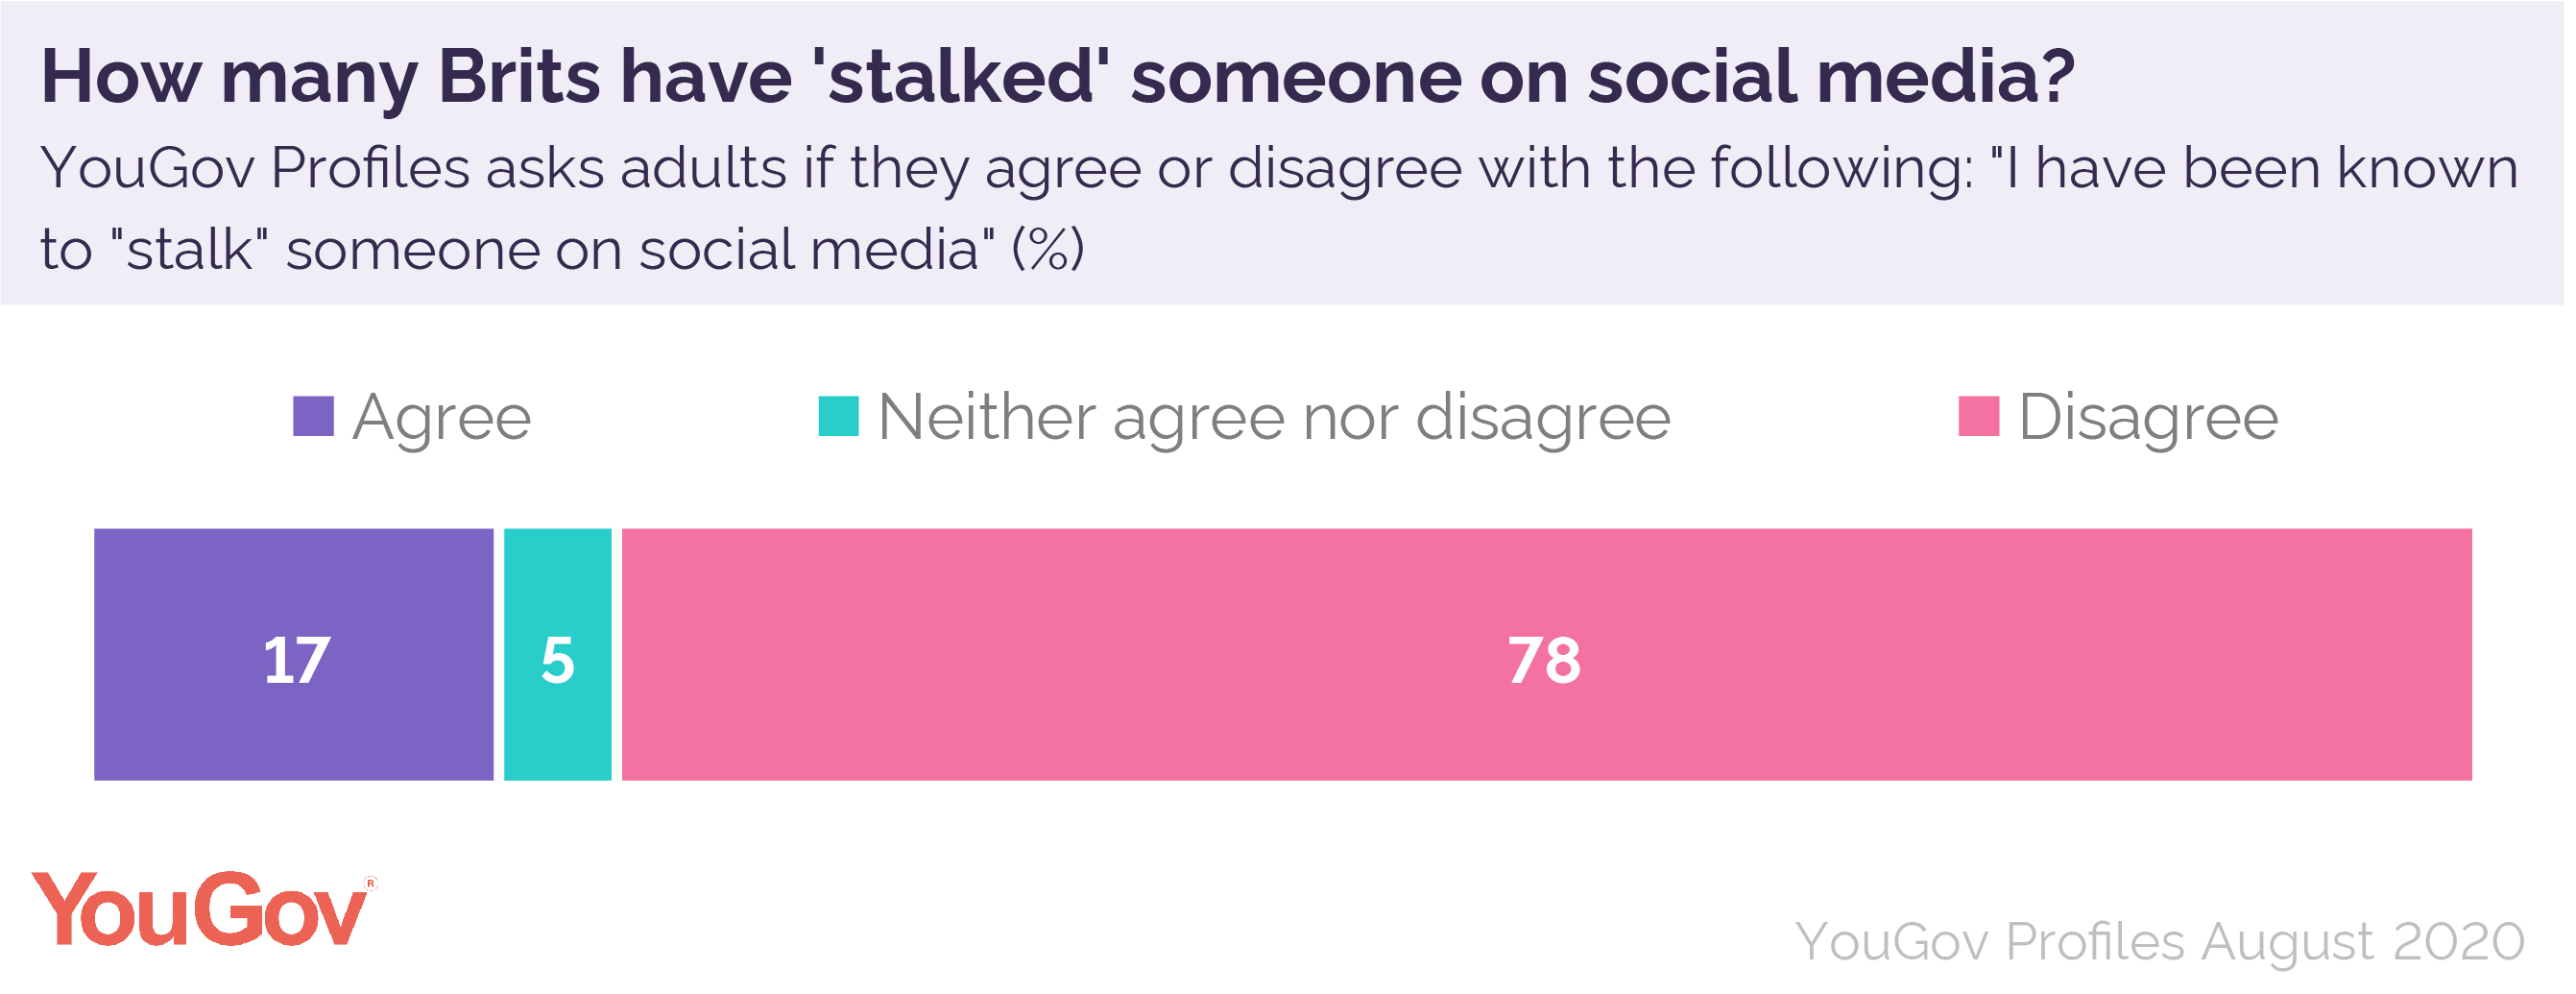
Who are these curious 17%? YouGov Profiles reveals that younger women are the most likely to be using social media to check out others – with the plurality (the largest group, but one that is not a majority) of social media ‘stalkers’ (21% of overall stalkers) being women aged from 25 to 34.
If we include the younger age bracket as well, 39% of ‘stalkers’ are women aged 18 to 34, compared to 25% who are men of the same age.
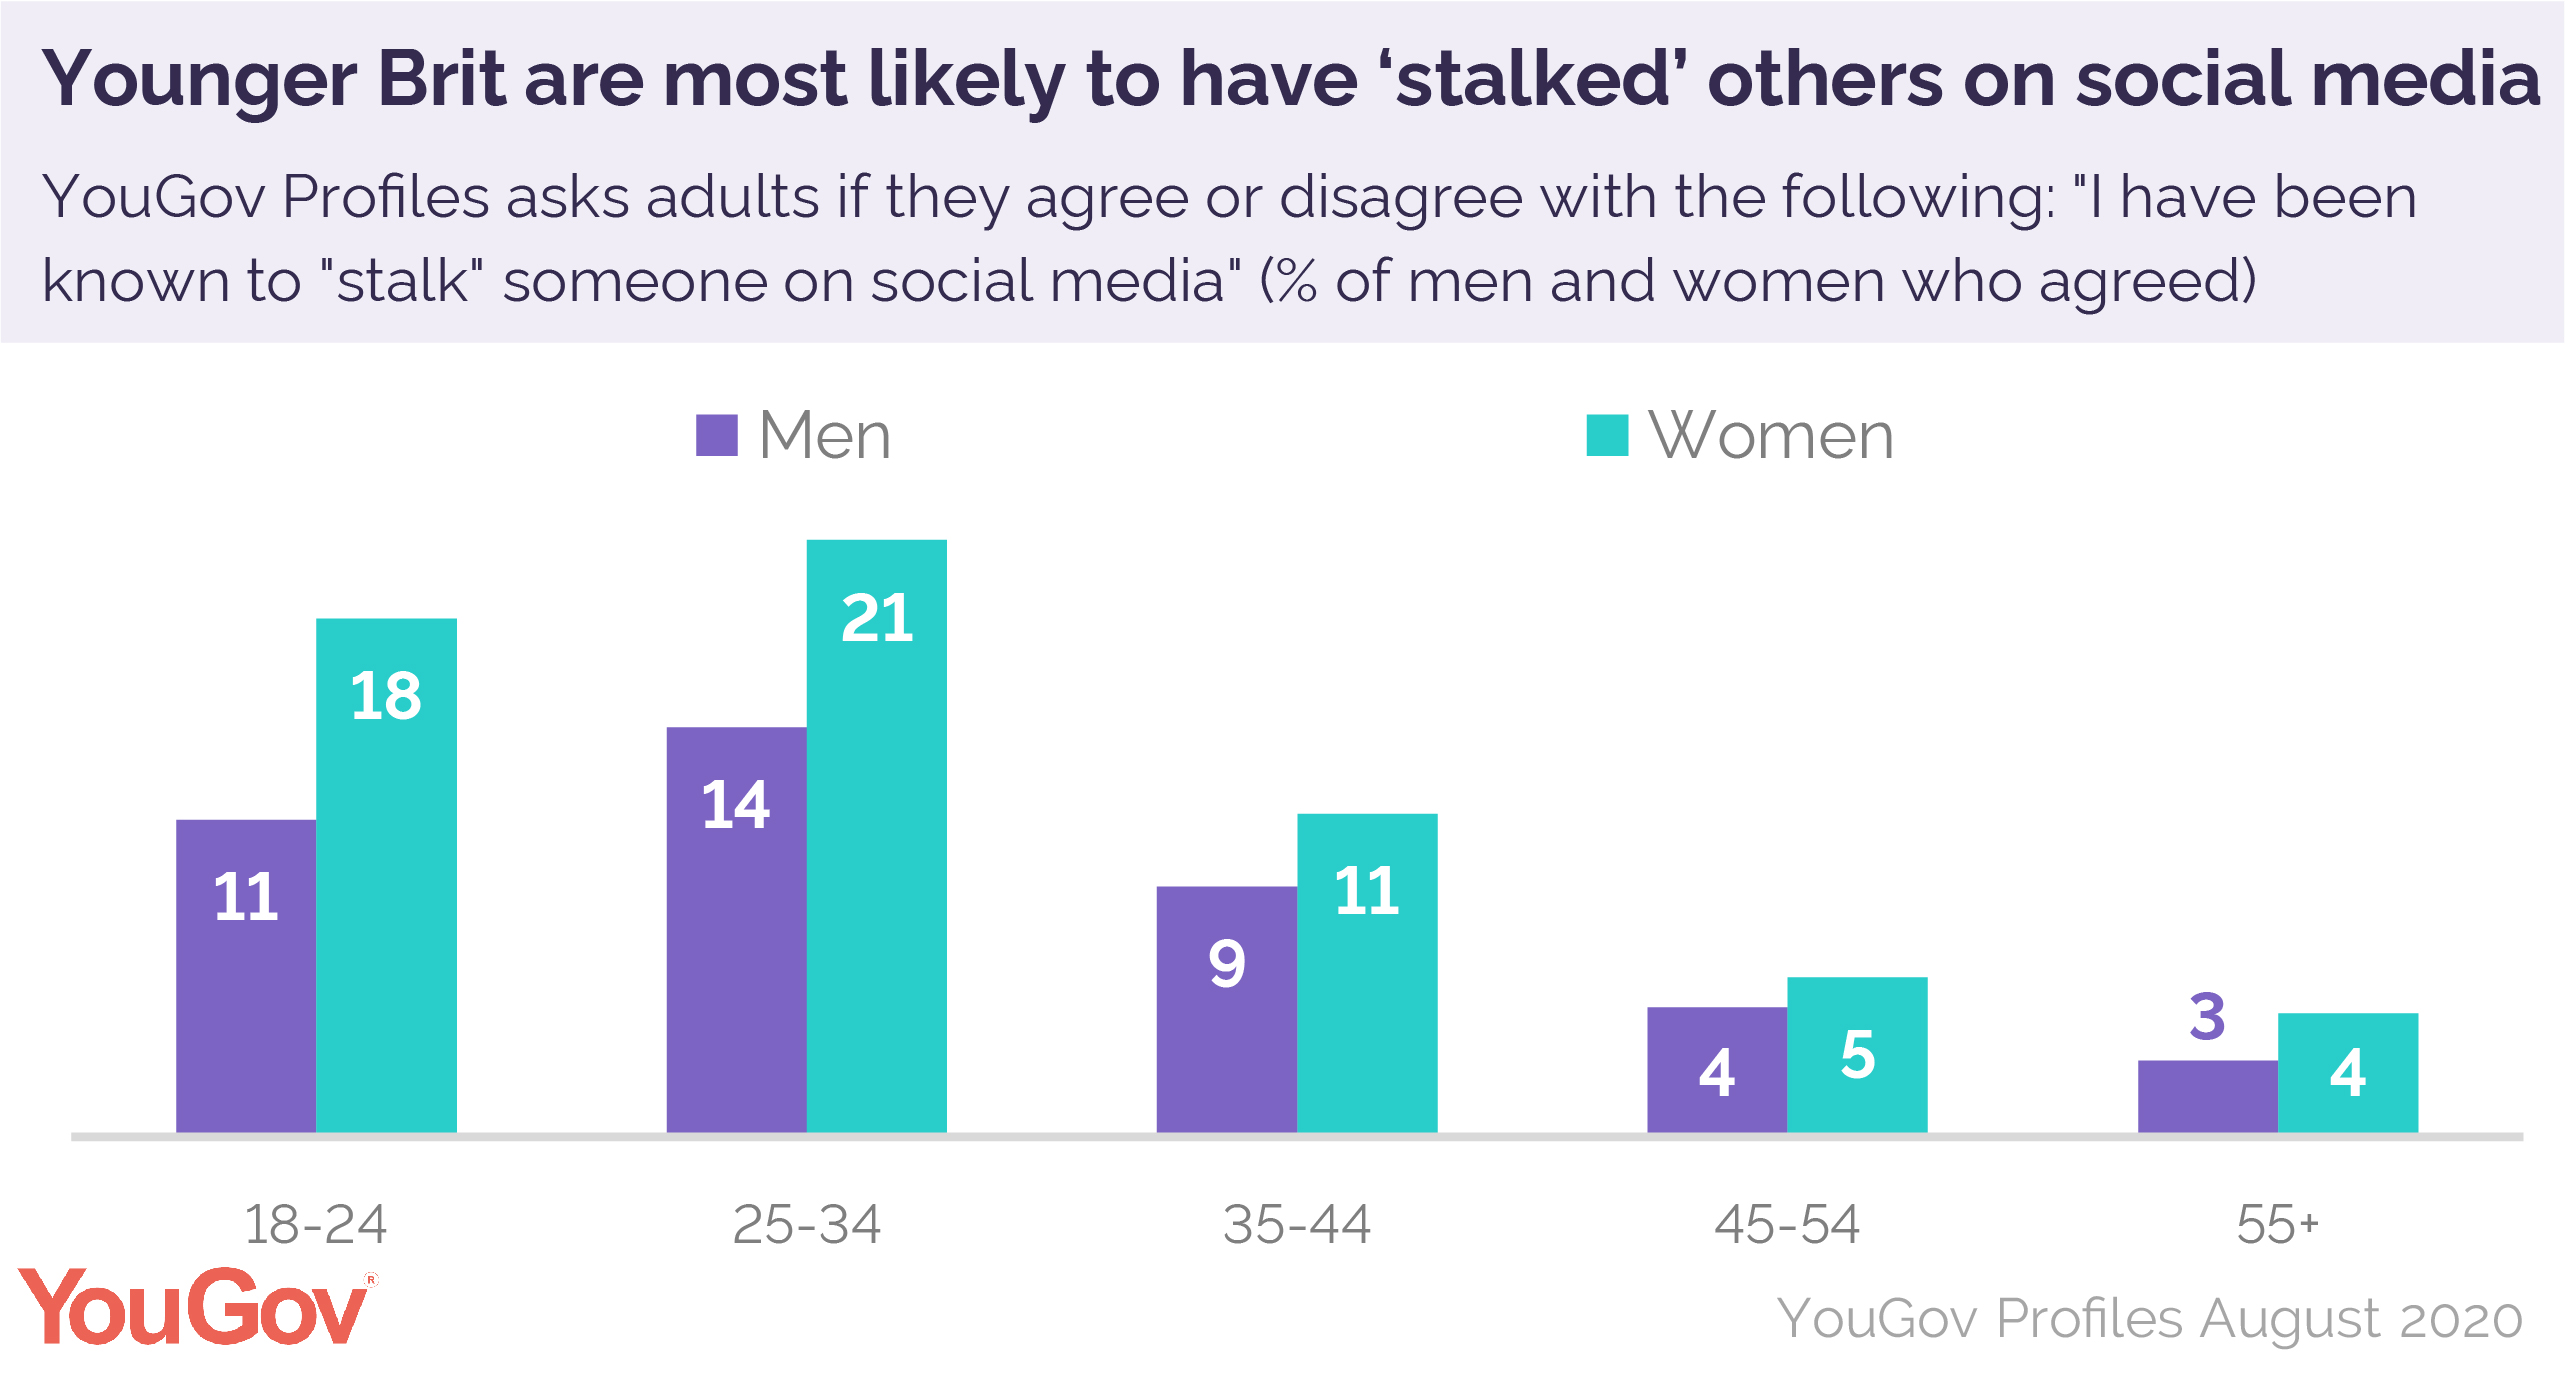
Older Brits are not completely innocent of the habit, however, with 17% of social medial ‘stalkers’ being over 45.
Does all that social media ‘stalking’ change the way these brits think about relationships? YouGov Profiles shows that 39% of male ‘stalkers’ and 30% of female ‘stalkers’ are single, compared to the 27% and 19% respective averages.
YouGov Profiles shows that these social media ‘stalkers’ are more likely to have pessimistic views about relationships when compared to the general public.
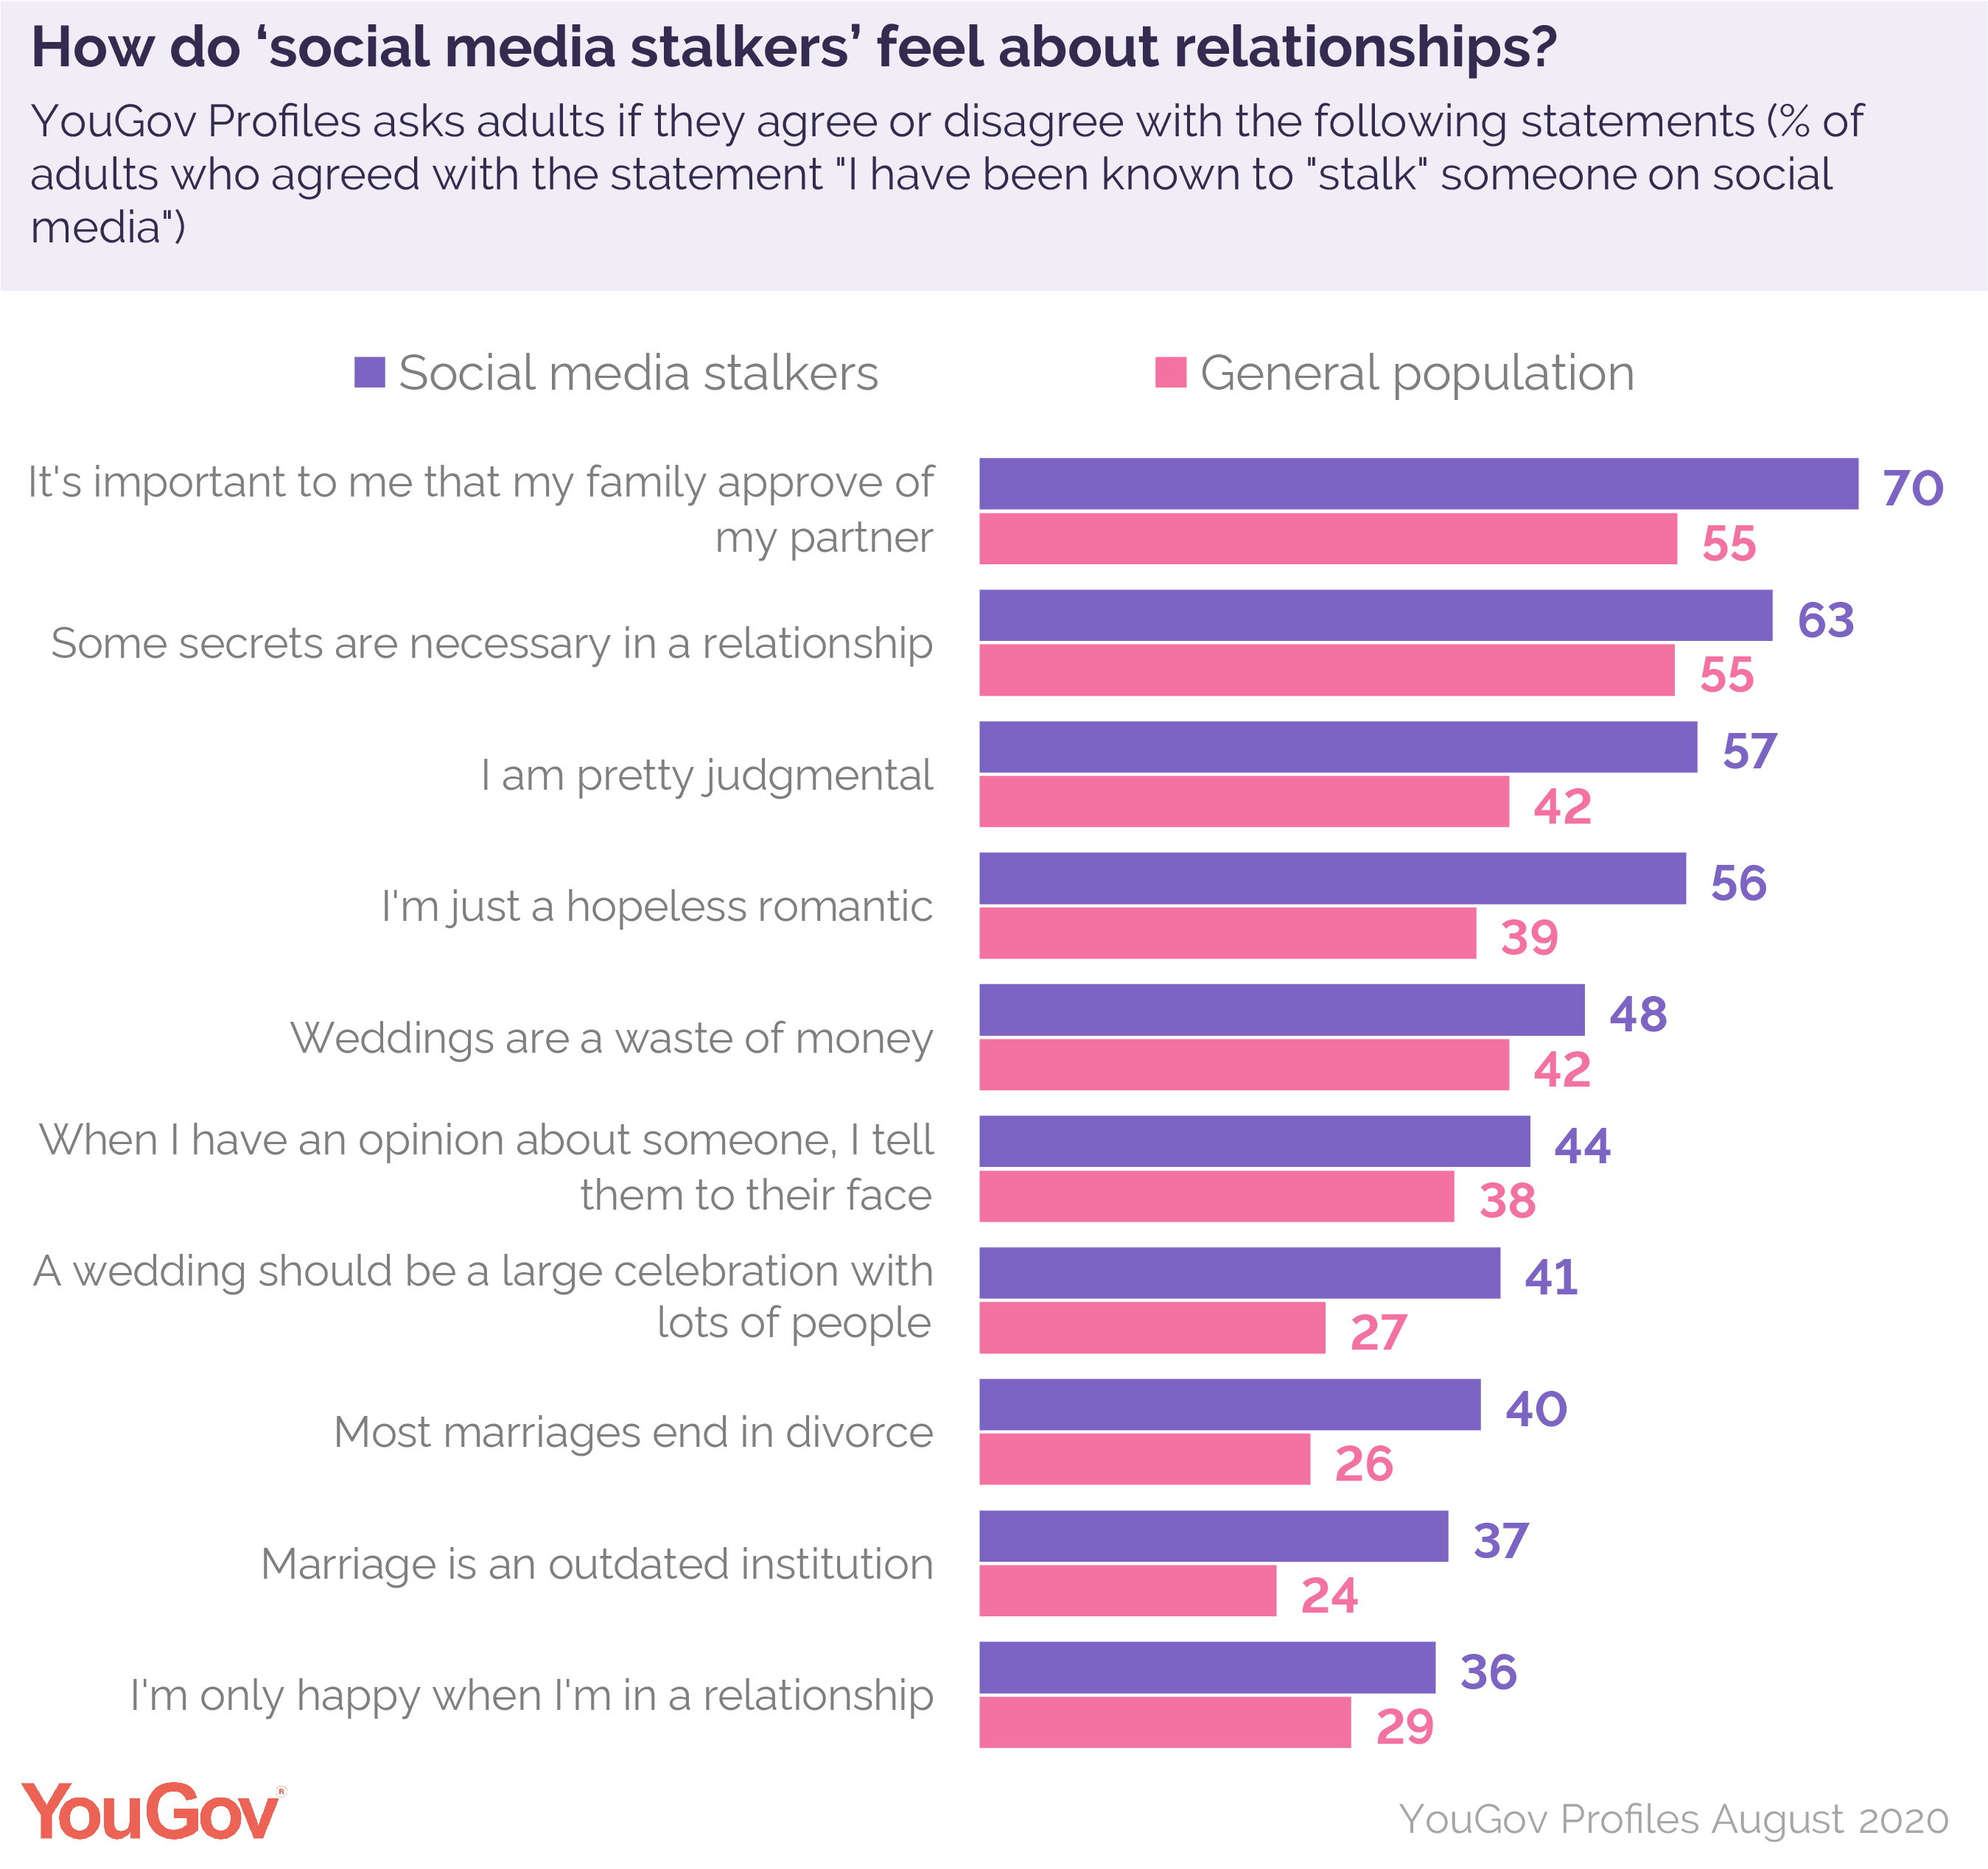
Social media ‘stalkers’ are more likely to describe themselves as hopeless romantics (56%) than the general population (39%). They are also more likely to see marriage in negative way, for example 37% see marriage as an outdated institution, compared to 24% of the general population.
Despite this they are more likely to say they can only be happy in a relationship (36% v 29%), and say that it’s important to them that their family approves of their partner (70% vs 50%).
(YouGov)
August 11, 2020
650-651-43-16/Poll
Which out-of-home advertisements are most effective?
YouGov
Profiles shows that ads placed on buses and billboards are noticed most
frequently
Even with some elements of lockdown still in effect, and certain areas under stricter rules, the average Briton is still spending time outside the home.
Approaching half (45%) of Britons say they have spent up to four hours each week travelling for various reasons (work, leisure etc) in the last 28 days.

Over a third (36%) have spent more than four hours travelling outside the home, with 15% spending up to 6 hours, and 8% travelling for up to 9 hours each week.
But which types of out-of-home (OOH) advertising are noticed most frequently?
YouGov Profiles reveals that adverts placed on the exterior of buses are noticed most frequently by Brits – with 48% of adults saying they see at least one of these types of ad a week. Only one in ten Brits (10%) said they never see ads on buses.
Billboards come second, with 42% of Brits seeing at least one advertising billboard on a weekly basis.

Following buses and billboards, ads placed on other vehicles are seen by a significant of Brits on a weekly basis with 25% saying they seeing adverts on taxis weekly, compared to 21% and 20% who report seeing ads on lorries or trucks.
Despite the rise of the smartphone, a fifth (20%) of Brits still notice ads on the sides of phone boxes on a weekly basis.
The least noticed ads come in the form of those inside service stations and insides of taxies, with only 9% and 8% of Brits respectively seeing these weekly. Ads placed inside taxis are the most likely to go unseen, with 39% of Brits never seeing them.
Despite more Brits saying they see adverts on buses more frequently, the most attention grabbing form of OOH are billboards (11%).
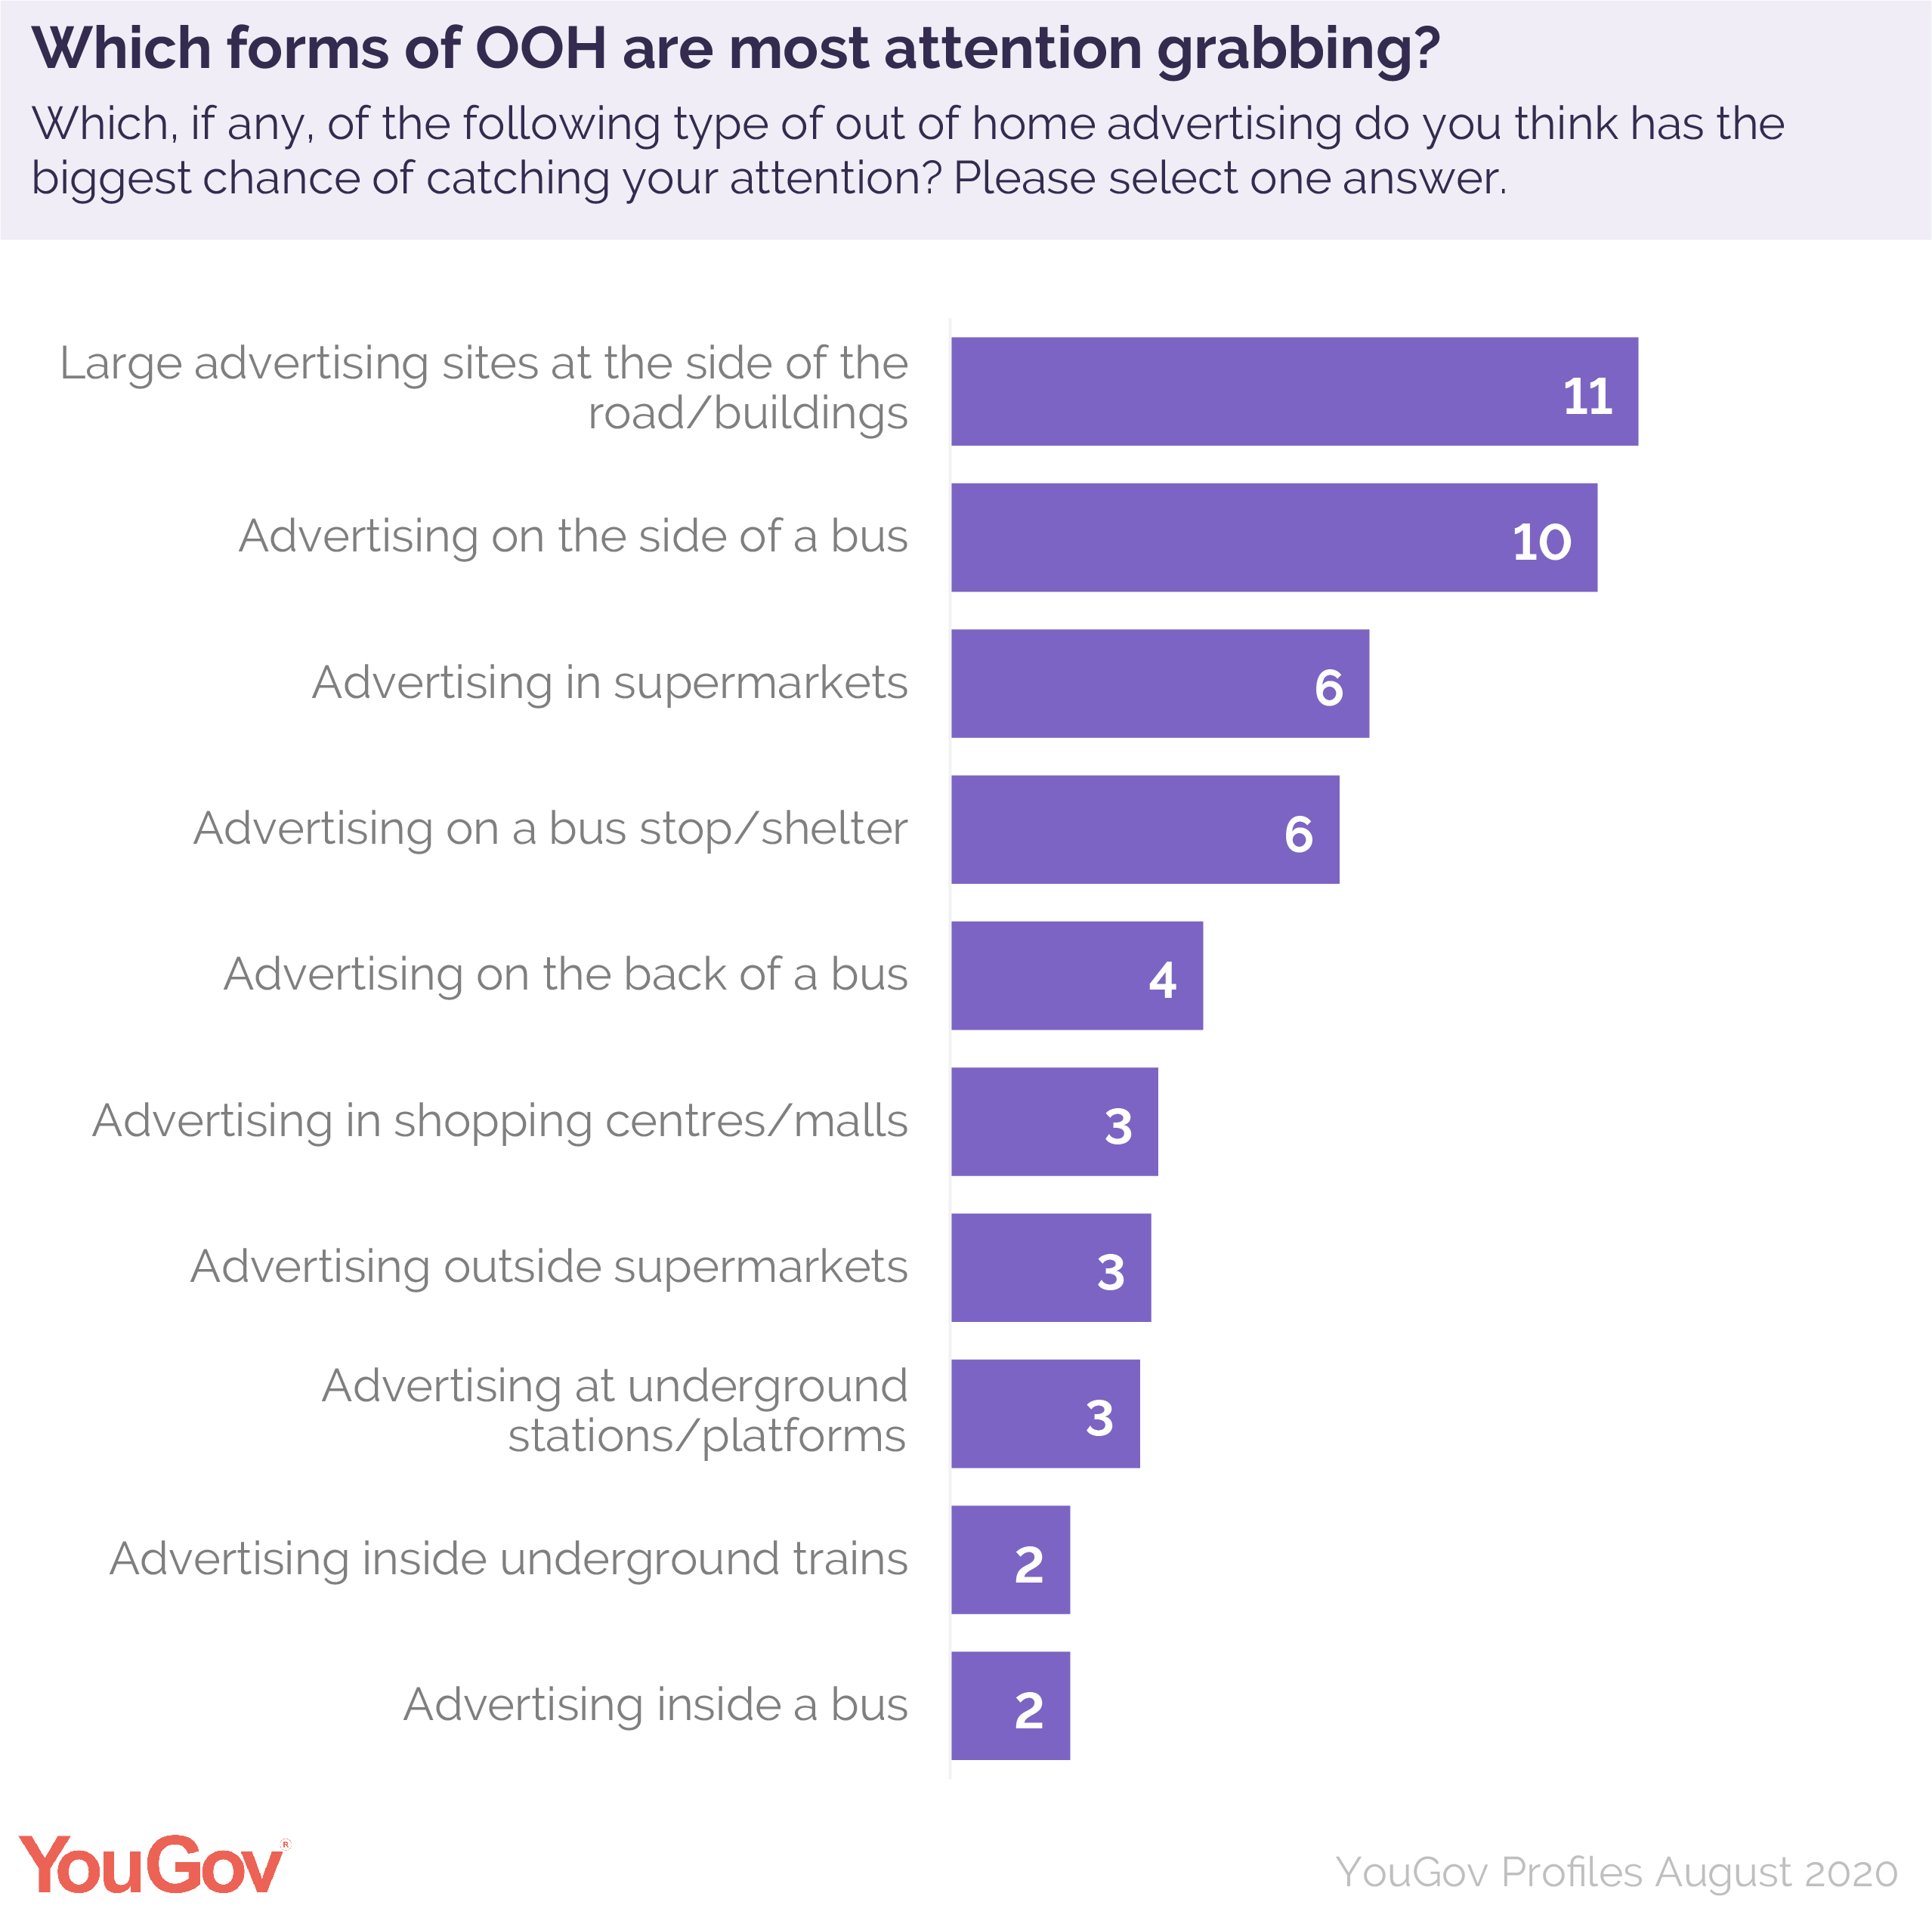
Bus-based OOH adverts are the second most attention form of OOH however with 10% of Brits saying this form of advertising is most likely to grab their attention.
(YouGov)
August 07, 2020
650-651-43-17/Poll
Pandemic has made properties with gardens more attractive
Brits
planning to buy within the next year say the coronavirus crisis has changed
their priorities, with outdoor space and home offices now more important
Months of lockdown and fears over a second coronavirus wave have prompted Britons looking to buy a new home within the next year to re-evaluate their priorities. A third of buyers (32%) say the pandemic has made having a garden more important to them – the largest increase in the survey.
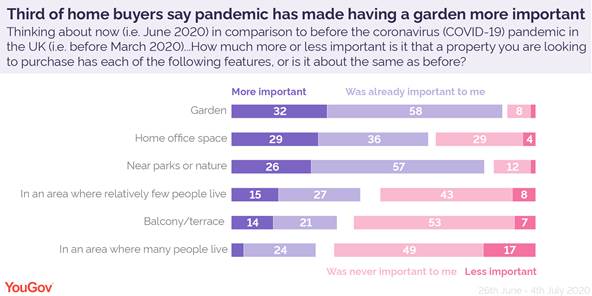
One in seven buyers (14%) also now see a balcony or terrace as more important. This figure is higher among first-timers (18%) who tend to have less spending power than people who already own a property (11%).
Home office space more in demand
With many workers still unable to return to offices, having a suitable workspace at home has taken on new significance. Three in ten buyers (29%) say the pandemic has made it a greater priority - the second largest jump.
The figure is even higher among buyers with young kids aged four and below (37%). First-time buyers are also more likely to prioritise office space as a result of the pandemic (37%) than existing home-owners looking to buy (23%).
A separate YouGov article found that first-time buyers are more likely than the average person to have benefitted financially from the pandemic, which could imply many have been able to work from home and save more during lockdown.
Buyers seek out nature and are less bothered about cities
A quarter of Brits planning to buy (26%) are seeking more green space as a result of the pandemic. There is also some evidence that city-dwellers are longing for the quiet life, with one in six buyers (17%) saying finding a property in an area where many people live has become less important. Only 4% disagree.
Meanwhile, 15% of buyers say purchasing a home in an area with relatively few people is now a greater priority, while 8% say the opposite. This is more popular among homeowners looking to move (18%) than first-time buyers (12%) who are often younger.
Similarly, a fifth of homeowners planning to buy say it’s now less important to live in an area with many people while only 13% of buyers hoping to get on the ladder agree.
(YouGov)
August 06, 2020
NORTH
AMERICA
650-651-43-18/Poll
Ipsos Essentials: in Brazil, three out of four support restricting the number of days children go to school per week
Most respondents prefer to wait at least four months before sending their children back to school.
In the opinion of Brazilians, at the present time, children and
adolescents should attend school in person less frequently than the traditional
weekly period, from Monday to Friday. This is the most recent result of
the Ipsos Essentials study ,
conducted with respondents from 16 countries. Of the 1000 respondents in
Brazil, 74% support the measure to restrict the number of days students must go
to classes.
South Korea (83%), India (81%) and Mexico (80%) are the nations that most
endorse the idea. On the other hand, in Europeans France (42%), Italy
(44%) and Germany (46%) less than half agree with the restriction of frequency
in the classroom.
The survey also
pointed out the expectation of the time that populations deem appropriate to
wait for their children to return to their studies safely. In Brazil, 24%
say they would feel comfortable sending their children back to school only 4 to
6 months from now. Second, with 20%, there is an even longer period: from
7 to 12 months. With 17%, the term between 1 and 3 months was in the third
position. 13% would only be comfortable after one year and, finally, only
4% would send their children to school already next month.
One in five Brazilians (18%) did not know how to answer the question; and
1% said that their children are already attending school in
person. Considering the 16 countries evaluated, the only one where more
than half said their children have returned to school is Japan, with
60%. Next are France (47%) and Germany (45%).
The Ipsos Essentials online survey was conducted between July 17 and 20 with
approximately 14,500 adults, aged 16 to 74, in 16 countries.
(Ipsos)
August 14, 2020
650-651-43-19/Poll
One in Five Canadians Don’t Trust Any Business when it comes to their Health and Safety
A new study by Ipsos finds trust is low, along with a high willingness to halt visiting locations not meeting the mark.
As Canadians begin to resume more and more of their day-to-day lives and as areas of the country enter phase 3 and 4, consumer trust in businesses to keep them safe from COVID-19 is low. According to a study conducted by Ipsos, 1 in 5 Canadians don’t trust any industry for their cleanliness and safety protocols, a slight increase from May, when 1 in 4 indicated a lack of trust. With a wide variance in regulations across the country, including from one municipality to the next, the challenge for businesses to meet customer and employee expectations for safety measures, and communicate these appropriately, is immense.
Which industries do Canadians trust most? Only one-fifth of Canadians put their trust in any sector, with Pharmacies (23%) and Grocery stores (20%) leading the way. The level of trust with Banks is next at 9%, less than half the level for Pharmacies and Grocers. All other businesses, from Big Box and Quick Service Restaurants, to Coffee Shops and Gas Stations, had fewer than 5% of Canadians select them as their most trusted industry. Trust levels do vary by gender, with women over 35% more distrustful of any business than men.
This lack of trust also carries over into Canadians’ willingness to continue to visit various businesses if health and safety isn’t up to par. At least 1 in 5 Canadians would stop visiting essential service providers, such as Grocery stores (21%), Gas Stations (22%), Banks (22%), Pharmacies (24%), and Home Improvement stores (24%) if health and safety wasn’t to their expectations, placing great pressure on businesses to get it right. Businesses providing more discretionary needs such as Individual retailers (34%), Full Service Restaurants (32%), Shopping Malls (32%), Coffee Shops (30%), and Wireless Carriers (30%) have less leeway from Canadians, with at least 3 in 10 indicating they would temporarily stop using this business if health and safety didn’t meet standards. Canadians are the least forgiving of businesses providing entertainment, such as Casinos (48%), Gyms (47%), and Cinemas (39%), with nearly half indicating they would stop visiting altogether if health and safety measures were not in place.
While recognizing that they themselves have some responsibility for health and safety, Canadians expect businesses to step up. Across the country, Canadians assign just under half of the responsibility (46%) to the businesses they are supporting. Generationally, Boomers (48%) feel it’s more of a businesses’ responsibility, while GenXers (24%) assigned a higher proportion of responsibility to “other” customers.
The verdict is out on whether or not Canadians expect both employees and consumers to wear masks in retailers, restaurants, banks and other businesses. In this most recent study, more Canadians expected employees to wear masks than they did in May, yet the numbers are still less than 50% (48% - up 15 points) and only 36% of consumers feel it is important for customers to wear masks. With the rules continually changing and an increasing number of municipalities implementing requirements to wear masks indoors, businesses are challenged to implement the best ways to keep their customers and employees safe and to understand their role in enforcement of these new rules. The importance of masks resonates at a similar level for all age groups, yet they are significantly more important to women (61%) than men (50%), and are most accepted in Ontario (55% vs. National average of 48%). Availability of hand sanitizer at entrances continues to be the number 1 priority of Canadian customers (55%, up 6 points from May).
As we continue to flatten the curve and push to keep a second wave at bay, more than ever, businesses will need to keep their focus on health and safety and the changes in consumer sentiment and expectations to keep their customers coming back.
(Ipsos)
July 29, 2020
650-651-43-20/Poll
25% in U.S. Say Neither Candidate Would Be a Good President
WASHINGTON, D.C. -- As both political parties prepare for their conventions, one in four Americans do not think either of the major-party presidential candidates would be a good president. At the same time, roughly equal percentages say only Joe Biden (36%) or only Donald Trump (33%) would make a good president, while 5% say both candidates would.
Similar percentages of Democrats (75%) and Republicans (79%) think only their candidate is suitable, while a 37% plurality of independents do not think either would be a good candidate and nearly equal percentages say only Biden or only Trump would be.
Americans' Views of Donald Trump and Joe Biden
Which best describes your view of Donald Trump and Joe Biden: Both would be a good president, neither would be a good president, only Donald Trump would be a good president (OR) only Joe Biden would be a good president?
|
Only
Biden |
Only
Trump |
Neither |
Both |
|
|
% |
% |
% |
% |
|
|
U.S. adults |
36 |
33 |
25 |
5 |
|
Republicans |
4 |
79 |
12 |
5 |
|
Independents |
28 |
27 |
37 |
6 |
|
Democrats |
75 |
3 |
19 |
1 |
|
GALLUP, JULY 30-AUG. 12, 2020 |
||||
These readings, from a July 30-Aug. 12 poll, mark the fourth U.S. presidential election of the five that have occurred since 2004 for which Gallup has asked this question. The current percentage saying neither candidate would make a good president is the highest on record.
In 2004 and 2012, when incumbents were also running, 11% and 17%, respectively, lacked faith in both candidates' ability to be a good president. In 2008, an open-race year, 19% said the same -- however, Gallup did not track this measure in 2016 when both nonincumbent candidates, Trump and Hillary Clinton, were historically unpopular.
Americans' Perceptions of Whether Presidential Candidates Would Make Good Presidents
|
Only
Republican candidate would |
Only
Democratic candidate would |
Neither
would |
Both
would |
|
|
% |
% |
% |
% |
|
|
2020 Trump*/Biden |
33 |
36 |
25 |
5 |
|
2012 Romney/Obama* |
31 |
38 |
17 |
12 |
|
2008 McCain/Obama |
25 |
29 |
19 |
25 |
|
2004 Bush*/Kerry |
40 |
33 |
11 |
15 |
|
Note: Asterisk indicates incumbent status. This question was not asked in 2016. |
||||
|
GALLUP |
||||
Republicans More Pleased Than Democrats With Their Party's Candidate
The new poll also asked people who identify with either of the two major parties if they are generally pleased with the selection of their party's nominee. Republicans and Republican-leaning independents are more likely than Democrats and Democratic-leaning independents to say they are generally pleased with their party's candidate.
About three-quarters of Republicans/leaners are generally pleased with Trump, while 25% wish someone else were the nominee. In contrast, 48% of Democrats/leaners are pleased with Biden and 52% would prefer another candidate.
Republicans' and Democrats' Satisfaction With Their Party's Nominee
Are you generally pleased with the selection of [Donald Trump/Joe Biden] as the [Republican/Democratic] nominee, or do you wish someone else was the [Republican/Democratic] nominee?
|
Generally
pleased with party's nominee |
Wish
someone else were nominee |
|
|
% |
% |
|
|
Republicans/Republican leaners |
74 |
25 |
|
Democrats/Democratic leaners |
48 |
52 |
|
GALLUP, JULY 30-AUG. 12, 2020 |
||
However, Democrats are much more pleased with Biden as the nominee than are independents who lean toward the Democratic Party (56% vs. 34%, respectively). Likewise, Republicans (81%) are more satisfied with Trump as the nominee than are Republican-leaning independents (63%).
While Gallup has not asked this question in all recent presidential election years, this imbalance in the views of partisans follows a pattern from past elections when an incumbent was running. This can most likely be attributed to the fact that those whose party had a nominating contest may have supported a candidate other than the eventual party nominee and are not yet fully on board with the nominee. In the past, this has often changed after the winner accepts the nomination at the party's convention, as Biden will -- virtually -- next week.
In May 2012, 80% of Democrats/leaners were satisfied with then-President Barack Obama as their party's nominee, while fewer Republicans/leaners were satisfied with Mitt Romney (59%). Likewise, in June 1992, 80% of Republicans/leaners were pleased with then-President George H.W. Bush, while 46% of Democrats/leaners were satisfied with Bill Clinton.
Satisfaction with an incumbent has not always translated to victory, as seen in 1992; Democrats were about as pleased with Clinton as they are with Biden today, and Clinton went on to defeat Bush that November. The Clinton reading was taken before the Democratic convention -- which, along with Ross Perot's departure from the campaign, led to a Clinton surge in the polls after which he never trailed in pre-election polls.
Further evidence of an incumbent advantage on the measure comes in comparing Trump's current standing to what it was in 2016. In August of that year, after he had accepted his party's nomination, less than half of Republicans/leaners said they were pleased he was the nominee.
Biden's current standing is slightly worse than it was for Hillary Clinton in 2016 after the Democratic convention (56%).
Partisans' Satisfaction With Their Party's Nominee
% Satisfied/Pleased with own party's nominee
|
Republican |
% |
Democrat |
% |
|
|
August 2020 |
Trump* |
74 |
Biden |
48 |
|
August 2016 |
Trump |
46 |
H. Clinton |
56 |
|
May 2012 |
Romney |
59 |
Obama* |
80 |
|
June 1992 |
H.W. Bush* |
80 |
B. Clinton |
46 |
|
Note: Asterisk indicates incumbent status. |
||||
|
GALLUP |
||||
This year, Democrats/leaners who say they would have preferred another nominee are slightly more likely to be men (56%) than women (49%). Those younger than 35 are the least satisfied with Biden as their nominee -- 82% would rather have someone else.
Trump and Biden Favorable Ratings Remain Below 50%
Although Republicans are more pleased with Trump's nomination than Democrats are with Biden's, Biden holds an edge in candidate favorable ratings among all Americans. Currently, 47% of Americans have a favorable opinion of Biden, compared with 42% for Trump. Trump's rating is down from 49% the last time Gallup asked this question in April, while Biden's is essentially unchanged from 45%.
While Trump's favorable rating has not reached 50% since 2005 -- long before he became a Republican politician -- Biden has been viewed favorably by a majority of U.S. adults as recently as April 2019.
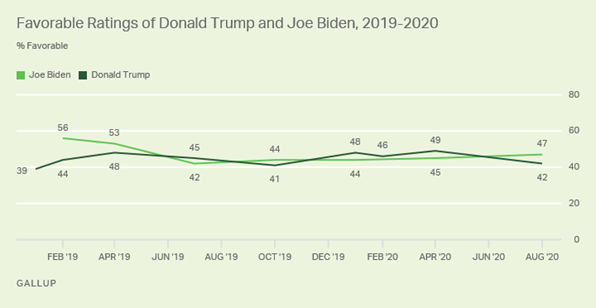
Line graph. Trump's and Biden's favorable ratings since 2019. Trump is currently viewed favorably by 42% of Americans and Biden by 47%. While Trump's favorability has never risen above 50% since 1999, Biden has been viewed favorably by a majority of U.S. adults as recently as April 2019.
Trump's unfavorable rating is 57% among all Americans, resulting in a net favorability of -15. Biden's net favorability is closer to positive territory, at -1.
Republicans and Democrats view their party's presidential candidate nearly as favorably -- 91% of Republicans hold a favorable view of Trump, while Biden's favorable rating is 87% among Democrats. However, among independents, favorability is far lower and about equal for both Trump (39%) and Biden (41%).
Bottom Line
Although a quarter of Americans overall do not think either Trump or Biden would be a good president, about seven in 10 Democrats and Republicans alike think their party's candidate would be. Yet, Republicans are more likely than Democrats to say they are pleased with their party's nominee.
Neither of these measures has been predictive of election outcomes in the past -- likely in part because partisans' attitudes tend to change closer to Election Day, with each group falling in line behind their candidate. These pre-convention ratings may simply provide some perspective on the importance of conventions for rallying the partisan base.
Historically, the more important measure is what Americans as a whole think of the candidates, as reflected in their favorable ratings. In general, since 1992, the candidate who is rated more favorably by Americans has won the election. The 2016 election was a notable exception, when Hillary Clinton was viewed more favorably than Trump but still lost the election. In addition to favorability, in incumbent election years, presidential job approval ratings are also strong predictors of reelection.
(Gallup USA)
August 14, 2020
Source: https://news.gallup.com/poll/317474/say-neither-candidate-good-president.aspx
650-651-43-21/Poll
U.S. Satisfaction With Women's Treatment Remains Tepid
Americans' satisfaction with the treatment of women in society fell to a record low two years ago after the emergence of the #MeToo movement as a national phenomenon in 2017, and it remains at that level today. Just over half of U.S. adults, 54%, are now very or somewhat satisfied with the treatment of women, down roughly 10 percentage points from 2015-2016 and well below the 67% to 72% range found previously between 2001 and 2013.
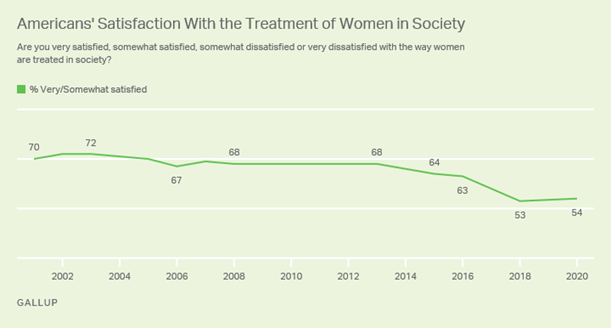
Line graph. Trend from 2001 to 2020; it reflects the percentage of Americans feeling satisfied with the treatment of women in society, which has fallen from 70% in 2001 to 53% in 2018 and 54% in 2020.
Today's level of satisfaction nearly matches the 53% recorded in late 2018, after allegations of sexual harassment or assault that toppled a number of prominent men in media, entertainment and business.
Fewer Than Half of Women Satisfied, Unchanged Since 2018
Men's and women's attitudes about the treatment of women have held steady since 2018, with about six in 10 men versus 46% of women in both polls saying they are satisfied with the situation. The 16-point higher satisfaction rating for men than women this year is slightly more than the average 11-point gender gap found since the start of the trend.
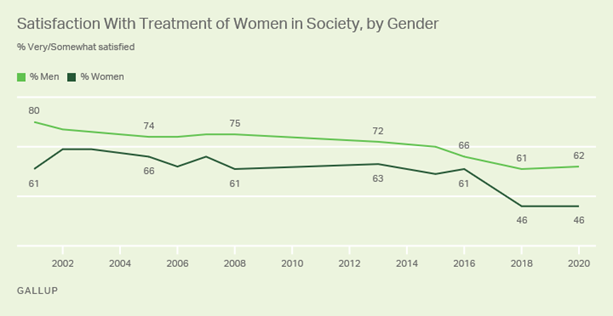
Line graph. Trend from 2001 to 2020 in percentages of men and women feeling satisfied with the treatment of women in society. Satisfaction was 80% among men and 61% among women in 2001, while today those figures are 62% and 46%, respectively.
The latest results are based on a Gallup poll conducted June 8 through July 24, including an oversample of Black Americans weighted to their correct proportion of the population. The question asks about Americans' satisfaction with the treatment of women without defining it; so responses could reflect perceptions of a variety of factors, ranging from job and pay equity to sexual harassment to women's share of domestic duties.
A recent Gallup poll, which investigated Americans' views about women's progress since the passage of the 19th Amendment in 1920 gave women the right to vote, found most believe equality has yet to be achieved in either the workplace or politics.
Other Gallup polling shows that nearly half of women have experienced sexual harassment in their lifetime and that married women are more likely than their husbands to do most of the laundry, house cleaning and meal preparation, even in households where both partners work.
Most Republican Women Satisfied While Democratic Women Not
As Gallup found in 2018, larger differences in perceptions of women's treatment are seen by partisanship than by gender. While solid majorities of Republicans, regardless of gender, are satisfied with how women are treated in society, between one-quarter and one-third of Democratic men and women are satisfied. Women who are politically independent tilt more to the Democratic side on this question, with 43% satisfied.
Party Groups' Satisfaction With the Treatment of Women, by Gender
% Very/Somewhat satisfied
|
Nov
19-Dec 22, 2018 |
Jun
8-Jul 24, 2020 |
||||||||||||||||||||||||||||||||||||||||||||||||||||||||||||
|
% |
% |
||||||||||||||||||||||||||||||||||||||||||||||||||||||||||||
|
Republicans |
|||||||||||||||||||||||||||||||||||||||||||||||||||||||||||||
|
Women |
79 |
80 |
|||||||||||||||||||||||||||||||||||||||||||||||||||||||||||
|
Men |
88 |
83 |
|||||||||||||||||||||||||||||||||||||||||||||||||||||||||||
|
Independents |
|||||||||||||||||||||||||||||||||||||||||||||||||||||||||||||
|
Women |
43 |
51 |
|||||||||||||||||||||||||||||||||||||||||||||||||||||||||||
|
Men |
62 |
63 |
|||||||||||||||||||||||||||||||||||||||||||||||||||||||||||
|
Democrats |
|||||||||||||||||||||||||||||||||||||||||||||||||||||||||||||
|
Women |
25 |
26 |
|||||||||||||||||||||||||||||||||||||||||||||||||||||||||||
|
Men |
29 |
33 |
|||||||||||||||||||||||||||||||||||||||||||||||||||||||||||
|
GALLUP |
|||||||||||||||||||||||||||||||||||||||||||||||||||||||||||||
Smaller differences are seen by race and age, with more White women and women over 50 than their counterparts being satisfied.
Gender Views on Women's Treatment in Society, by Race and Age
% Very/Somewhat satisfied
|
Nov
19-Dec 22, 2018 |
Jun
8-Jul 24, 2020 |
||||||||||||||||||||||||||||||||||||||||||||||||||||||||||||
|
% |
% |
||||||||||||||||||||||||||||||||||||||||||||||||||||||||||||
|
Gender
by race |
|||||||||||||||||||||||||||||||||||||||||||||||||||||||||||||
|
White women |
52 |
47 |
|||||||||||||||||||||||||||||||||||||||||||||||||||||||||||
|
Black women |
24 |
35 |
|||||||||||||||||||||||||||||||||||||||||||||||||||||||||||
|
White men |
67 |
67 |
|||||||||||||||||||||||||||||||||||||||||||||||||||||||||||
|
Black men |
35 |
40 |
|||||||||||||||||||||||||||||||||||||||||||||||||||||||||||
|
Gender
by age |
|||||||||||||||||||||||||||||||||||||||||||||||||||||||||||||
|
Women, 18-49 |
42 |
42 |
|||||||||||||||||||||||||||||||||||||||||||||||||||||||||||
|
Women, 50 and older |
51 |
50 |
|||||||||||||||||||||||||||||||||||||||||||||||||||||||||||
|
Men, 18-49 |
57 |
61 |
|||||||||||||||||||||||||||||||||||||||||||||||||||||||||||
|
Men, 50 and older |
66 |
61 |
|||||||||||||||||||||||||||||||||||||||||||||||||||||||||||
|
GALLUP |
|||||||||||||||||||||||||||||||||||||||||||||||||||||||||||||
Bottom Line
Three years after the #MeToo movement brought sexual assault and harassment against women into the open and contributed to a historically large number of women being elected to Congress in 2018, there has been no rebound in Americans' satisfaction with how women are treated.
While the slight majority of all Americans are satisfied, this is owing to the majority of men feeling this way versus less than half of women. But there is also a strong partisan aspect to this, with most Republican women satisfied, but not politically independent or Democratic women.
These differences likely affect the pressure that Republican vs. Democratic political leaders feel from their colleagues and constituencies on the issue, ultimately filtering through to the policies passed at the state and federal levels when different parties are in charge.
(Gallup USA)
August 13, 2020
Source: https://news.gallup.com/poll/317279/satisfaction-women-treatment-remains-tepid.aspx
650-651-43-22/Poll
Americans Regard Gender Equality as Unfinished Business
A century after women in the U.S. gained the right to vote with the adoption of the 19th Amendment in August 1920, most Americans think additional work remains before women achieve equality with men. Nearly seven in 10 U.S. adults (69%) say women have not yet achieved equality in the workplace, and 66% say the same about politics.
Women are even less confident than Americans as a whole about gender equality. Roughly three-quarters say equality has not been realized in either sphere -- 79% for the workplace and 75% for politics. Men agree, but by smaller majorities.
Americans' Perception of Gender Equality in the Workplace and Politics
Thinking about life in the U.S. today, do you think women have achieved equality with men in [Rotate: the workplace/politics]?
|
U.S.
adults |
Men |
Women |
|||||||||||||||||||||||||||||||||||||||||||||||||||||||||||
|
% |
% |
% |
|||||||||||||||||||||||||||||||||||||||||||||||||||||||||||
|
The
workplace |
|||||||||||||||||||||||||||||||||||||||||||||||||||||||||||||
|
Yes |
31 |
42 |
21 |
||||||||||||||||||||||||||||||||||||||||||||||||||||||||||
|
No |
69 |
58 |
79 |
||||||||||||||||||||||||||||||||||||||||||||||||||||||||||
|
Politics |
|||||||||||||||||||||||||||||||||||||||||||||||||||||||||||||
|
Yes |
34 |
43 |
25 |
||||||||||||||||||||||||||||||||||||||||||||||||||||||||||
|
No |
66 |
57 |
75 |
||||||||||||||||||||||||||||||||||||||||||||||||||||||||||
|
GALLUP PANEL, JULY 13-19, 2020 |
|||||||||||||||||||||||||||||||||||||||||||||||||||||||||||||
Partisanship is a stronger factor than gender when it comes to perceptions of women's equality, but a gender gap persists among Republicans. While majorities of Republicans believe women have achieved equality in the workplace and politics, Republican women are less certain of these achievements than are Republican men:
- 56% of Republican women contrasted with 75% of Republican men say women have achieved equality with men in the workplace.
- 63% of Republican women versus 82% of Republican men believe women have equality with men in politics.
Meanwhile, more than nine in 10 Democratic women and men alike think women have not achieved equity in both the workplace and politics.
These findings are based on self-administered web interviews conducted July 13-19 with a nationally representative sample of U.S. adults, using the Gallup Panel.
Most Foresee a Long Road to Equality
Those who believe equality has not yet been realized in the workplace or politics were then asked how long they think it will take for women in the United States to achieve equality with men in each area. When looking at the results of all Americans, few foresee equality being reached within the next decade -- 13% for the workplace and 12% for politics. The majority think it will take another 10, 20 or 30+ years -- if it ever happens.
Outlook for Length of Time Before Equality is Achieved in the Workplace and Politics
How long do you think it will take for women in the United States to achieve equality with men in [the workplace/politics]?
|
The
workplace |
Politics |
|
|
% |
% |
|
|
Already achieved |
31 |
34 |
|
Less than 10 years |
13 |
12 |
|
10 to 19 years |
20 |
16 |
|
20 years to 29 years |
16 |
13 |
|
30 or more years |
12 |
16 |
|
Never |
8 |
9 |
|
GALLUP PANEL, JULY 13-19, 2020 |
||
Women are more pessimistic than men about achieving equality in both the workplace and political realms. About a third of women (32%) versus 17% of men predict political equality will take another 30-plus years to achieve if it ever happens. For workplace equality, 25% of women versus 15% of men think women are in for a long haul.
Outlook for Women's Equality With Men in Each Sphere, by Gender
|
Have
equality now |
Less
than 20 years |
20
to 29 years |
30
or more years or never |
||||||||||||||||||||||||||||||||||||||||||||||||||||||||||
|
% |
% |
% |
|||||||||||||||||||||||||||||||||||||||||||||||||||||||||||
|
Workplace |
|||||||||||||||||||||||||||||||||||||||||||||||||||||||||||||
|
Men |
42 |
30 |
14 |
15 |
|||||||||||||||||||||||||||||||||||||||||||||||||||||||||
|
Women |
21 |
37 |
17 |
25 |
|||||||||||||||||||||||||||||||||||||||||||||||||||||||||
|
Politics |
|||||||||||||||||||||||||||||||||||||||||||||||||||||||||||||
|
Men |
43 |
27 |
13 |
17 |
|||||||||||||||||||||||||||||||||||||||||||||||||||||||||
|
Women |
25 |
30 |
14 |
32 |
|||||||||||||||||||||||||||||||||||||||||||||||||||||||||
|
GALLUP PANEL, JULY 13-19, 2020 |
|||||||||||||||||||||||||||||||||||||||||||||||||||||||||||||
Older women are more optimistic than younger women about achieving equality within the next 20 years, but this is especially pronounced for politics.
- There is a 40-percentage-point age difference in women's belief that equality exists or will be realized in politics in under 20 years; 74% of women aged 65+ believing this versus 34% of those aged 18 to 44.
- By contrast, there is a 17-point age difference in women's views about workplace equality; 64% of women aged 65+ versus 47% of those 18 to 44 believe equality exists or will happen in under 20 years.
Most Identify 19th Amendment as Key, if Not Top, Advancement
The 19th Amendment was ratified more than seventy years after the "First Women's Rights Convention" in Seneca Falls, NY, that launched the women's suffrage movement.
Two-thirds of Americans consider the amendment to have been either "the most important step" in advancing women's rights in the U.S. (23%) or "one of the most important steps" (45%). Another 30% call it "just one of many important steps," while 2% say it wasn't important.
Men assign slightly greater significance to the amendment than do women: 26% of men vs. 21% of women call it the most important step that has been taken to further women's rights in the U.S.
Importance of 19th Amendment to Women's Rights in the U.S.
In 1920, the 19th Amendment to the Constitution gave women in the United States the right to vote. Compared to other steps that have been taken to further women's rights in the U.S., how important do you consider the 19th Amendment to achieving that goal?
|
U.S.
adults |
Men |
Women |
|
|
% |
% |
% |
|
|
The most important step |
23 |
26 |
21 |
|
One of the most important steps |
45 |
42 |
48 |
|
Just one of many important steps |
30 |
30 |
29 |
|
Not an important step |
2 |
2 |
2 |
|
Total most important/one of the most important steps |
68 |
68 |
69 |
|
GALLUP PANEL, JULY 13-19, 2020 |
|||
Among women, appreciation for the 19th Amendment is somewhat correlated with age, as the percentage calling it the most important step for women's equality rises from 13% of women aged 18 to 44, to 21% of those 45 to 64, and 31% of those 65 and older.
Eight in 10 Acknowledge Progress Since 19th Amendment
Consistent with the small percentages of Americans who believe equality has been achieved in work and politics, relatively few (36%) think the United States has made a lot of progress on women's rights since the 19th Amendment was ratified. Another 44% say there has been a fair amount of progress, while 20% say only a little or none.
Women are much less positive than men about the amount of progress that has been made as 29% of women versus 43% of men describe it as a lot of progress. Women are more likely than men to say a fair amount or only a little progress has been made.
Americans' Assessment of the Progress the U.S. Has Made on Womens' Rights
How much progress do you think the United States has made in the area of women's rights since the 19th Amendment was added to the Constitution in 1920?
|
U.S.
adults |
Men |
Women |
|
|
% |
% |
% |
|
|
A lot |
36 |
43 |
29 |
|
A fair amount |
44 |
42 |
47 |
|
Only a little |
19 |
14 |
23 |
|
None |
1 |
1 |
1 |
|
GALLUP PANEL, JULY 13-19, 2020 |
|||
Bottom Line
Women's access to the ballot has been the norm throughout the lives of nearly all adults living today, yet Americans have a broad appreciation for the significance of that achievement for women, as two-thirds describe it as the most or one of the most important steps in the advancement of women's equality in the U.S.
At the same time, Americans, and particularly women, view the 19th Amendment as the beginning of the road to equality, not the end. This may reflect frustration with the continued low levels of women filling leadership roles in business and government. For instance, the number of women CEOs in the U.S. hit a record high of 37 this year, up from two in 2000, but is still only 7% of the total. This is in spite of nearly half of women employees aspiring to C-Suite positions in their career. The #MeToo movement could be another factor in perceptions of women's inequality, with close to half of all women saying they have been the victim of sexual harassment.
Older women -- perhaps because they have witnessed more change in their own lifetimes -- are more likely than younger women to both believe significant progress has occurred since the adoption of the 19th Amendment and to be more optimistic about how soon full equality might be achieved. But the majority of women of all ages see more work to be done in both the workplace and politics.
(Gallup USA)
August 10, 2020
Source: https://news.gallup.com/poll/317009/americans-regard-gender-equality-unfinished-business.aspx
650-651-43-23/Poll
One in Three Americans Would Not Get COVID-19 Vaccine
The coronavirus' toll on the lives of people around the world continues to grow, with over 18 million confirmed cases and more than 700,000 deaths, including upwards of 150,000 of those in the United States. Dr. Anthony Fauci, director of the National Institute of Allergy and Infectious Diseases, recently testified before Congress that he continues to be confident that a coronavirus vaccine will be ready by early 2021. With more indications that a vaccine could be close, the next question for health professionals, policymakers and political leaders will be Americans' willingness to be vaccinated once a vaccine is ready.
But many Americans appear reluctant to be vaccinated, even if a vaccine were FDA-approved and available to them at no cost. Asked if they would get such a COVID-19 vaccine, 65% say they would, but 35% would not.
The results are based on July 20-Aug. 2 polling in Gallup's COVID-19 tracking survey, conducted with members of Gallup's probability-based panel.
While Gallup has consistently seen that U.S. party preferences play a strong role in Americans' views on COVID-19, the new poll extends that to willingness to be vaccinated. Eighty-one percent of Democrats are willing to be vaccinated today if a free and FDA-approved vaccine were available. That compares with 59% of independents and just under half of Republicans, 47%.
Americans' Willingness to Take an FDA Approved, No Cost Vaccine for COVID-19
If an FDA-approved vaccine to prevent coronavirus/COVID-19 was available right now at no cost, would you agree to be vaccinated?
|
Yes |
No |
|
|
% |
% |
|
|
All Americans |
65 |
35 |
|
Men |
65 |
35 |
|
Women |
65 |
35 |
|
Democrats |
81 |
19 |
|
Independents |
59 |
41 |
|
Republicans |
47 |
53 |
|
White Americans |
67 |
33 |
|
Non-White Americans |
59 |
41 |
|
18-29 years old |
76 |
24 |
|
30-49 years old |
64 |
36 |
|
50-64 years old |
59 |
41 |
|
65 and older |
70 |
30 |
|
Rural area/Farm |
56 |
44 |
|
Small town/Village |
68 |
32 |
|
Suburb of a large city |
69 |
31 |
|
Large city |
65 |
35 |
|
GALLUP PANEL, JULY 20-AUG. 2, 2020 |
||
Older Americans have been most likely to have serious complications, including death, from COVID-19. Yet, young people are still affected, and an increasing proportion of new infections are occurring among younger adults, possibly because this age group is engaging in riskier behaviors that are promoting the spread of the disease.
Given the age-related risks seen to date, it may come as good news to public health officials that 76% of adults aged 18-29 are willing to get a COVID-19 vaccination, as are 70% of senior citizens. Willingness to be vaccinated is lower among the middle-aged groups -- 64% among those 30-49 years old and 59% among those between 50 and 64.
Slight Majority of Non-White and Rural Americans Would Get Vaccine
While party affiliation likely explains many of the differences seen in willingness to be vaccinated, there are differences by race that defy the partisan patterns. White Americans are significantly more likely than non-White Americans to say they would be vaccinated if a free FDA-approved version were available -- 67% vs. 59%, respectively. This is particularly noteworthy, given media reports on the pandemic noting that Black and Latino Americans have been disproportionately affected by COVID-19.
Those living in rural areas appear to be less eager than their more urban counterparts to take advantage of a vaccine. Just 56% of those living in a rural area say they would get vaccinated. This may be concerning to public health officials, as the U.S. Centers for Disease Control and Prevention has pointed out that "long-standing systemic health and social inequities have put some rural residents at increased risk of getting COVID-19 or having severe illness."
In contrast, more than six in 10 Americans living in more urban areas such as a large city (65%) or a suburb of a large city (69%) -- both of which were associated with early hot spots for the virus -- would be willing to take a vaccine. Those in small towns or villages are on par with their more urban counterparts, with 68% on board for a vaccine.
More Than a Third of Employed Americans Unwilling to Take Vaccine
Of potential interest to employers who are counting on a vaccine to get workers back into the workplace is the finding that employed Americans are roughly as likely as the public at large to say they would get vaccinated if they had the option.
Similar to workplaces, schools are also grappling with how and when to get students back into the classroom, with vaccination being the ultimate tool for keeping the virus at bay. While the survey did not ask parents about their willingness to have their children vaccinated, it may be instructive to know that parents themselves lag behind the general public in willingness to be vaccinated themselves. Just 59% of parents of children under 18 say they would agree to be vaccinated, while 41% would not.
Implications
As the situation stands today, the nation's influencers -- including health professionals, policymakers and leaders -- who see a vaccine as a way forward may have their work cut out for them in persuading Americans to take advantage of such an option. Policymakers in government, healthcare, industry and education will need to anticipate that a significant proportion of the population will be hesitant to get a vaccine, even at no cost. Some of the most at-risk populations, including non-White and rural Americans, may not only be hesitant but resistant to getting vaccinated. Employers continuing to grapple with new workplace realities must also anticipate that a number of their workers may resist a vaccine.
Such resistance is not unprecedented. When Gallup in 1954 asked U.S. adults who had heard or read about the then-new polio vaccine, "Would you like to take this new polio vaccine (to keep people from getting polio) yourself?" just 60% said they would, while 31% said they would not. So far, willingness to adopt a new vaccine looks similar today. Leaders in favor of a vaccine may be well-served to study what caused the public to ultimately adopt earlier vaccines as they consider how best to influence Americans to take advantage of such an option now.
(Gallup USA)
August 07, 2020
Source: https://news.gallup.com/poll/317018/one-three-americans-not-covid-vaccine.aspx
650-651-43-24/Poll
52% of U.S. Air Travelers Now Uncomfortable Flying
Indicating how severely COVID-19 has disrupted the airline industry in its peak travel season, about half of American adults who flew at least once a year before the pandemic (52%) currently say they would not be comfortable flying. This figure varies significantly by age and political affiliation; most notably, 69% of American air travelers aged 55 and older say they would not be comfortable flying, compared with 33% of those aged 18 to 34.
U.S. Air Travelers' Comfort With Air Travel, by Age
Are you currently comfortable taking a flight of the following duration?
|
Not
comfortable flying at all |
|
|
% |
|
|
Overall |
52 |
|
18-34 |
33 |
|
35-54 |
51 |
|
55+ |
69 |
|
Among those who flew at least once in the year prior to the pandemic |
|
|
FRANKLIN TEMPLETON-GALLUP ECONOMICS OF RECOVERY STUDY, JULY 2-14, 2020 |
|
These results are based on more than 10,000 web-based surveys completed July 2-14 as part of the Franklin Templeton-Gallup Economics of Recovery Study. This study is conducted via Dynata's opt-in web panel, and the sample has been adjusted statistically to ensure it represents key subgroups in their proper proportions of the U.S. adult population.
For the U.S. airline industry to recover from the current crisis, it will be critical for industry leaders to have reliable information about when and under what conditions passengers will feel comfortable returning to air travel. Differences in comfort level by age group might be expected given that older adults are more vulnerable to severe illness from COVID-19. But the extent of those differences is especially noteworthy given that baby boomers and retirees are important market segments for leisure travel.
Political affiliation also shows significant ties to U.S. air travelers' attitudes about flying. Currently, about six in 10 Democrats (59%) say they would not be comfortable flying at all, compared with about four in 10 Republicans (42%). Independents lean more toward Democrats' views, at 54%.
Flight Length Has Some Effect on Comfort Level
Many air travelers who feel comfortable with flying are more hesitant about longer flights. When asked whether they would currently be comfortable taking flights of various durations, almost half say they would be OK with taking one that lasted less than two hours (44%) or two to three hours (47%). However, this figure drops to just over one-fourth (27%) for flights lasting four to six hours and to about one-fifth (21%) for those longer than six hours.
U.S. Air Travelers' Comfort With Air Travel, by Duration of Flight
Are you currently comfortable taking a flight of the following duration?
|
Yes,
comfortable |
|
|
% |
|
|
Less than two hours |
44 |
|
Two to three hours |
47 |
|
Four to six hours |
27 |
|
More than six hours |
21 |
|
Categories not mutually exclusive; among those who flew at least once in the year prior to the pandemic and do not say they are currently uncomfortable flying altogether |
|
|
FRANKLIN TEMPLETON-GALLUP ECONOMICS OF RECOVERY STUDY, JULY 2-14, 2020 |
|
This greater reluctance to return to longer flights implies carriers that provide cross-country or international flights may have to take additional precautions to bring customers back. International carriers already face extensive travel restrictions, as most countries worldwide are currently closed to U.S. travelers.
53% of Air Travelers Willing to Pay Extra Fee for Empty Companion Seat
Airlines are testing various ways to help customers feel more comfortable flying, including enhanced onboard cleaning and requiring passengers to wear face masks during flights. Another common measure is finding ways to put more space between passengers. Delta and JetBlue are currently guaranteeing empty middle seats, while Southwest Airlines promises to book flights at no more than two-thirds full.
U.S. air travelers were asked whether they would be willing to pay fees of different amounts to guarantee they would have an empty seat next to them. Currently, almost half (47%) indicate they would be unwilling to pay any amount. Another 47% say they would find it acceptable to pay a fee of under $100 to ensure an empty seat next to them. These figures drop significantly for amounts of $100 or more, although about three in 10 air travelers (29%) say they would pay $100 to $149 for an empty companion seat and almost two in 10 (18%) say they would pay $250 or more -- a 50% increase over their original ticket price.
U.S. Air Travelers' Willingness to Pay for Empty Seat Next to Them
Assume you are purchasing a plane ticket for personal travel for $500. Would you be willing to pay the following extra amounts to ensure an empty seat next to you?
|
Yes,
would pay |
|
|
% |
|
|
Less than $100 |
47 |
|
$100-$149 |
29 |
|
$150-$249 |
22 |
|
$250 or more |
18 |
|
No amount selected |
47 |
|
Categories not mutually exclusive; among those who flew at least once in the year prior to the pandemic |
|
|
FRANKLIN TEMPLETON-GALLUP ECONOMICS OF RECOVERY STUDY, JULY 2-14, 2020 |
|
Importantly, offering empty seats for a fee is much less acceptable to older air travelers than younger people; 36% of those aged 55 and older say they would pay something for an empty seat, versus 64% of those aged 18 to 34. The difference suggests such offerings are less likely to be effective at encouraging older people to fly again.
Implications
Air travel is among the industries hit hardest by COVID-19, as airlines face pandemic travel restrictions in addition to widespread concerns about potential exposure among their customer base. The CARES Act passed in March devoted some relief funds to the U.S. airline industry, under the condition that passenger airlines promise to not lay off employees until Oct. 1. With the virus continuing to spread at a rapid rate, that provision may result in tens of thousands of industry layoffs this fall.
Knowing that older and long-distance passengers are among the least likely to feel comfortable returning to the air in the short term, for example, may help airlines adjust their marketing strategies by targeting other segments or providing additional safety precautions for those groups. In the coming months, the Franklin Templeton-Gallup Economics of Recovery Study will track changes in these measures and a range of others gauging Americans' attitudes toward resuming pre-COVID behaviors, with the goal of better informing the path to recovery.
(Gallup USA)
August 06, 2020
Source: https://news.gallup.com/poll/316742/air-travelers-uncomfortable-flying.aspx
650-651-43-25/Poll
Why are COVID-19 cases rising in U.S.? Republicans point to more testing, Democrats to more infections
The United States has now recorded more than 5 million cases of COVID-19, but Republicans and Democrats point to different explanations for the recent increase in confirmed cases, according to a new Pew Research Center survey.
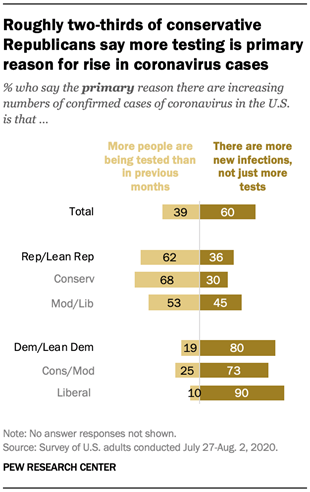
Overall, six-in-ten Americans say the number of confirmed coronavirus cases in the U.S. is rising primarily because there are more new infections in the country, not just because more people are being tested compared with previous months. Around four-in-ten (39%) say the increase is primarily the result of more people being tested, according to the survey, which was conducted July 27-Aug. 2 among 11,001 U.S. adults.
Most Republicans and Republican-leaning independents (62%) say the primary reason for the rise in confirmed cases is that more people are being tested. Self-described conservative Republicans are especially likely to hold this view: Around two-thirds (68%) say this, compared with 53% of moderate and liberal Republicans.
How we did this
By contrast, 80% of Democrats and Democratic leaners say the primary reason for the recent increase in confirmed COVID-19 cases is that there are more new infections, not just more tests. Liberal Democrats are considerably more likely than moderate and conservative Democrats (90% vs. 73%) to say the increase in cases is mainly due to more new infections, not just more testing.
The U.S. has carried out more than 69 million COVID-19 tests nationwide as of Aug. 13, 9% of which – more than 6.2 million – came back positive, according to the Centers for Disease Control and Prevention. The number of positive tests exceeds the number of confirmed cases because some people may have been tested more than once, the CDC notes. While the number of tests has risen in recent months, the increase has not been enough to account for an even bigger rise in confirmed COVID-19 cases, according to a July analysis by The New York Times.
Americans’ perceptions about the recent increase in cases also differ by educational attainment, according to the survey.
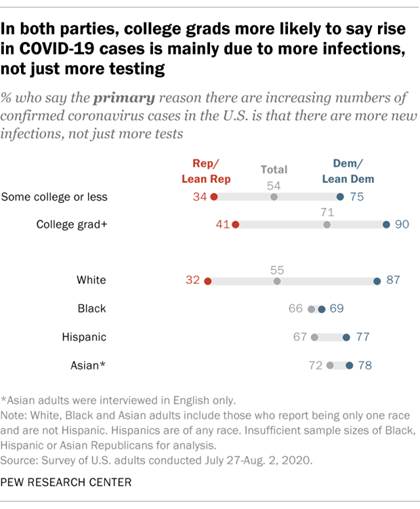
Around seven-in-ten adults with a bachelor’s degree or more education (71%) say the recent increase in confirmed cases is primarily the result of more infections, not just more testing. A little over half of those with some college or less education (54%) say the same. In both partisan coalitions, those with at least a bachelor’s degree are more likely than those without to attribute the rise in confirmed cases primarily to more infections.
Majorities across all major racial and ethnic groups say the increase in confirmed COVID-19 cases is primarily due to a rise in infections and not just an increase in testing. White Americans (55%) are less likely than Black (66%), Hispanic (67%) and English-speaking Asian Americans (72%) to hold this view. However, when taking partisanship into account, white Democrats (87%) are more likely than Black (69%), Hispanic (77%) or Asian American Democrats (78%) to say this.
President Donald Trump has said that the country’s increase in COVID-19 cases is the result of more testing, and Americans who approve of Trump’s job performance largely agree with that assessment. Around two-thirds of those who approve of the job Trump is doing as president (66%) say the rise in confirmed cases is primarily the result of more people being tested than in previous months. An even larger majority of those who disapprove of Trump’s job performance (78%) say the main reason is an increase in new infections, not just more tests.
(PEW)
August 14, 2020
650-651-43-26/Poll
Americans see pressure, rather than genuine concern, as big factor in company statements about racism
Companies from Silicon Valley to Wall Street have publicly denounced racism since the protests following the killing of George Floyd. But Americans are divided on whether it’s important for firms to weigh in on political and social issues. And they are more likely to believe pressure from others – more than genuine concern for Black people – has driven recent statements about race, according to a new Pew Research Center survey.
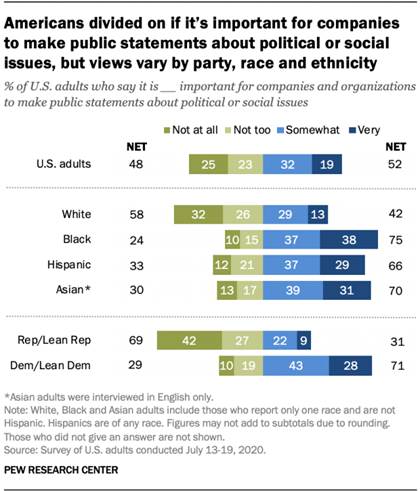
Overall, 52% of U.S. adults say it is very or somewhat important that companies and organizations make public statements about political or social issues, while a similar share (48%) say this is not too or not at all important, according to the July 13-19 survey.
Americans’ views vary substantially by race and ethnicity. While most Black (75%), Asian (70%) and Hispanic adults (66%) say it is at least somewhat important that companies and organizations release statements about political or social issues, this share falls to 42% among white adults.
How we did this
There are also stark partisan differences on these questions. Some 71% of Democrats and independents who lean toward the Democratic Party say it is very or somewhat important for companies to make public statements about political or social issues, compared with 31% of Republicans and Republican leaners. Conversely, 69% of Republicans believe it is at most not too important for firms to make these kinds of statements, including about four-in-ten (42%) saying this is not important at all for companies to do. Among Democrats, these shares drop to 29% and 10%, respectively.
Still, there are some racial differences among Democrats on how much importance they place on this. For example, Black Democrats are more likely than white Democrats to say it is very important for companies and organizations to make public statements about political or social issues (40% vs. 22%).
Even as Americans hold mixed views about the importance of such statements, they have become fairly common following the global protests that erupted in response to the killing of Floyd in police custody on Memorial Day. This survey finds that a vast majority of adults (80%) say they have seen or heard companies and organizations making public statements about race or racial inequality in the past few months, with majorities across racial and ethnic groups and political parties saying this.
While some businesses have been praised for speaking out about racial inequality, critics have questioned the timing and sincerity of these messages. At the same time, many brands have been called out for their own track records related to diversity and inclusion.
This survey finds that people who have come across brands releasing statements about race are more likely to attribute those pronouncements to companies feeling pressured to do so than a genuine concern about the plight of Black people.
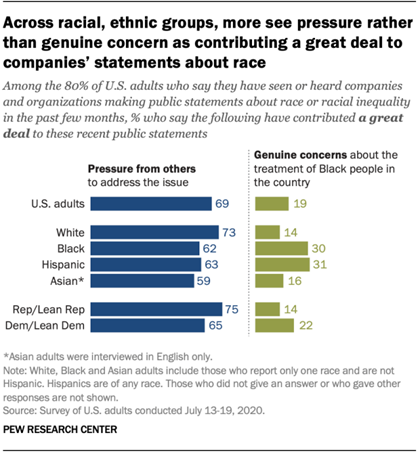
Among those who have seen or heard public statements about race or racial inequality in the past few months, 69% say pressure from others to address this issue has contributed a great deal to recent public statements about race or racial inequality, while a much smaller share (19%) believes genuine concerns about the treatment of Black people in the country have been a major contributing factor to companies speaking out about race during this time.
Majorities across racial and ethnic groups think pressure from others has contributed a great deal to these statements. But white adults who have come across recent statements from firms about race or racial inequality are more likely to express this sentiment – with 73% saying this compared with about six-in-ten of the same group of Black, Hispanic or Asian adults. On the other hand, Hispanic (31%) and Black (30%) Americans are about twice as likely as Asian (16%) or white Americans (14%) to believe genuine concerns for Black people motivated companies a great deal to make statements about race or racial inequality.
There are also some partisan differences in assessing companies’ motivations for speaking out about race. Among those who have come across firms publicly addressing race-related issues, 75% of Republicans believe pressure from others to address the issue factored into companies’ decisions a great deal, compared with 65% of Democrats. And though relatively small shares across parties say genuine concern has contributed a great deal to statements they’ve seen or heard, Democrats are more likely than Republicans to say this (22% vs. 14%).
Views about the sincerity of these statements are also tied to the level of importance the public places on brands speaking out about issues. For example, 26% of those who say it is at least somewhat important for companies to make public statements about social or political issues think that genuine concern for Black people contributed a great deal to recent statements they’ve seen about race or racial inequality. Just 11% of those who say such statements are not too or not at all important say the same.
Those who deem these politically minded declarations important are less likely than those who don’t to think pressure from others largely contributed to recent statements about race. Still, majorities across both groups feel that pressure from others is a key factor driving such statements they’ve come across (65% vs. 74%, respectively).
(PEW)
August 12, 2020
650-651-43-27/Poll
Republicans more open to in-person worship, but most oppose religious exemptions from COVID restrictions
Republicans and Democrats differ in their opinions on many aspects of the coronavirus outbreak, including their levels of concern about the safety of various activities. These partisan gaps extend to views about religious practices during the pandemic – although majorities in both parties say that houses of worship should be subject to virus-related restrictions, according to a new Pew Research Center survey.
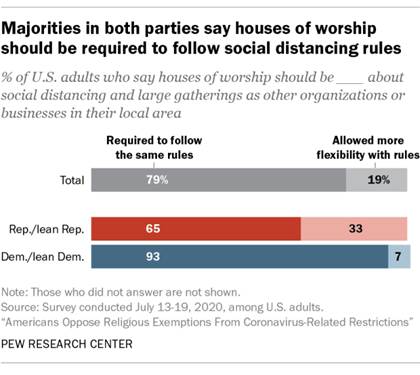
Two-thirds of Republicans and independents who lean toward the Republican Party say that houses of worship should be required to follow the same rules about social distancing and large gatherings as other organizations and businesses in their local area, compared with a third who say they should be allowed more flexibility. An even bigger majority of Democrats and Democratic leaners – 93% – believe houses of worship should be required to follow local rules about social distancing and large gatherings without exemptions from coronavirus-related regulations.
When asked what they think their own house of worship should be doing, the survey finds substantial differences between Republican and Democratic religious attenders – but majorities in both groups favor some level of caution about the virus. (In this analysis, regular attenders are those who said before the pandemic that they typically attend services at least once or twice a month, as well as those who attended in person in the last month prior to when the survey was conducted July 13 to 19.)
How we did this
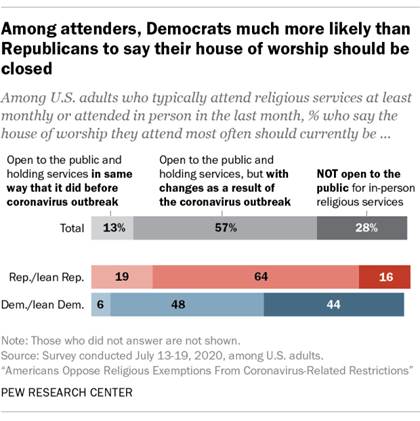
Among regularly attending Democrats, 44% think their house of worship should not be open to the public at all – much larger than the share of Republicans who say the same (16%). But most Republican attenders (64%) say that their house of worship should be open with precautions in place due to the coronavirus outbreak, such as requiring that congregants remain 6 feet apart or wear masks, or limiting the number of people who can attend at one time. About half of Democratic congregants (48%) prefer this approach.
One-in-five Republicans and GOP leaners think that their house of worship should be open to the public and holding services in the same way that it did before the coronavirus outbreak, although they are three times as likely as Democrats to hold this opinion (19% vs. 6%).
Opinions on what houses of worship should be doing largely reflect what respondents say their congregations are doing in practice. Among those who attended in-person services in the last month or who said before the outbreak that they attend at least monthly, there are similar partisan differences in the current operating status of the house of worship they attend most often.
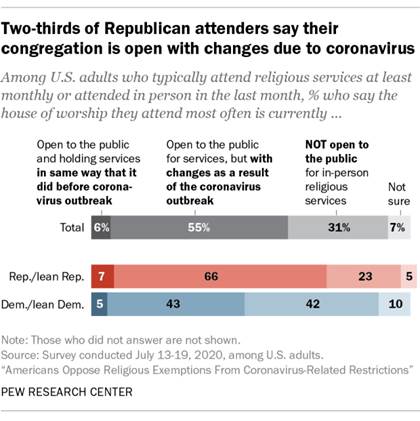
Two-thirds of Republican attenders say their house of worship is open to the public with changes as a result of the coronavirus outbreak, while 43% of Democrats say this. Democratic congregants are more likely than Republicans to say that their houses of worship are closed altogether (42% vs. 23%). And small shares in both parties say that their houses of worship are currently open to the public and operating in the same way that they did before the outbreak (7% of Republicans say this, as do 5% of Democrats).
Democrats and Republicans also differ in their feelings about their own personal safety and in their recent religious attendance habits. For instance, Democrats are far less confident than Republicans in their ability to safely attend services in person: Eight-in-ten Republican congregants (79%) say that they are “very” or “somewhat” confident that they could safely attend religious services without catching or spreading the coronavirus, while 44% of Democratic attenders agree. And among partisans who attend services regularly (according to a 2019 survey), far fewer in each group say they have actually attended in-person religious services in the past month, but, again, Republicans (42%) are twice as likely as Democrats (19%) to report doing so.
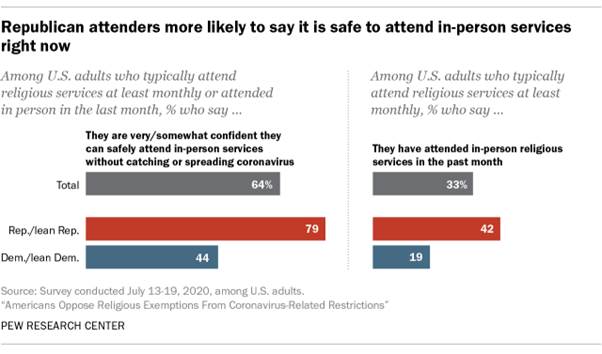
These partisan breaks are in line with racial and ethnic differences in views toward worship amid the pandemic. Black and Hispanic attenders are more cautious about the safety of in-person services during the outbreak than white attenders, and 54% of Democrats who regularly attend religious services are Black or Hispanic, while most Republican attenders (78%) are white.
And these patterns are also in line with partisans’ views on whether the coronavirus is a threat to their health. Half of Democrats overall view the virus as a major threat to their personal health, while just 29% of Republicans say the same.
(PEW)
August 11, 2020
AUSTRALIA
650-651-43-28/Poll
PM Jacinda Ardern maintains ‘crushing’ lead over new National leader Judith Collins
In July support for Prime Minister Jacinda Ardern’s Labour Party was at 53.5% down 1% since June, but still more than double the support for National on 26.5%, down 0.5%, with just over a month to go before the election in mid-September.
If an election were held today Labour could govern without the help of either New Zealand First or the Greens.
Interviewing for this survey in July encompassed the period before and after Judith Collins became the new leader of National in mid-July after former leader Todd Muller’s shock resignation after less than two months in the role.
The early indications are that the new leader has had a negligible impact on support for National although a full month of interviewing in August will provide a clearer picture in the run-up to next month’s election.
This latest New Zealand Roy Morgan Poll on voting intention was conducted by telephone – both landline and mobile – with a NZ wide cross-section of 899 electors during July. Of all electors surveyed 4% (down 2%) didn’t name a party. Electors were asked: “If a New Zealand Election were held today which party would receive your party vote?”
Support for the Labour/NZ First/Greens governing coalition remains strong at 63% in July
In June 63% of electors supported the Labour/NZ First/Greens governing coalition, down 2% since June. The governing coalition was well ahead of the Parliamentary opposition National/ Act NZ on only 33%, up 1% since June.
- Support for Deputy Prime Minister Winston Peter’s NZ First was unchanged at only 1.5% in July, and more importantly down a significant 5.7% since their election result of 7.2% in 2017. NZ First are again below the party vote threshold of 5% in July and may be ejected from Parliament altogether at this year’s NZ Election if the voting intention translates into less than 5% of the vote.
- Greens support was at 8%, down 1% since June, but still up 1.7% since their election result in 2017 and was comfortably above the 5% threshold.
- Importantly, support for Act NZ continues to increase and was at 6.5% in July, up 1.5% since June and were this level of support repeated at the election it would be Act’s best election result since 2002 when the party scored over 7% of the vote and won 9 seats in Parliament.
A small minority of 4% of electors support other minor parties outside Parliament.
- Of the parties outside Parliament The Opportunities Party (TOP) was unchanged at 1.5% in July and the Maori Party was at 0.5% (down 0.5%).
New Zealand Government
Confidence Rating down, but still near highs at 152.5 in July
Despite a small decline, the Roy Morgan Government Confidence Rating was at a very high 152.5 in July, down 1pt from 153.5 in June.
The majority (71.5%) of New Zealand electors (down 0.5% since June) said New Zealand was ‘heading in the right direction’ compared to only 19% (up 0.5%) that said New Zealand was ‘heading in the wrong direction’.
The latest monthly ANZ-Roy Morgan Consumer Confidence Rating was also barely changed in July at 104.3, down 0.2pts from June (104.5).
The stability in both indicators follows four months of large changes from March to June that drove Roy Morgan Government Confidence to a record high in April while the ANZ-Roy Morgan Consumer Confidence Rating hit its lowest level since the Global Financial Crisis in the same month at only 84.8.
Michele Levine, CEO, Roy Morgan, says Prime Minister Jacinda Ardern is set to be re-elected with an increased majority next month as National turn to yet another new leader in mid-July to try and revive their fortunes:
“Today’s Roy Morgan New
Zealand Poll shows Prime Minister Jacinda Ardern’s adept handling of the
COVID-19 pandemic is still paying dividends with the Labour
Party set to substantially increase its majority at next month’s election.
“Support for the Jacinda
Ardern-led Labour Party was at 53.5% in July and
still more than double that of National on 26.5%, now led by new leader Judith
Collins. Collins became National’s third leader in 2020 in mid-July and today’s
Roy Morgan Poll shows there has been no immediate bounce in support for
National after their second change of leader this year.
“Labour’s
coalition partners NZ First are in danger of missing out on a return to
Parliament as their support has stagnated at only 1.5% for a second straight
month. Support for NZ First is down 5.7% on their result at the 2017 NZ
Election and may signal the end of the long political career of leader and
Deputy Prime Minister Winston Peters. Peters was first elected to the
Parliament more than forty years ago before current Prime Minister Jacinda
Ardern was born.
“The biggest beneficiaries
of the demise of NZ First are set to be Act NZ which has again increased its
support in July, up 1.5% to 6.5%. Act NZ are set to achieve their best result
at a New Zealand election since 2002 when the party received 7.1% of the vote
and won nine seats.
“A strong performance from
the right-wing Act NZ at this year’s election will strengthen the hand of David
Seymour, and his new deputy leader Brooke van Velden, and place further
pressure on National leader Judith Collins to rally support on the centre-right.”
New Zealand Party
Vote: 2020
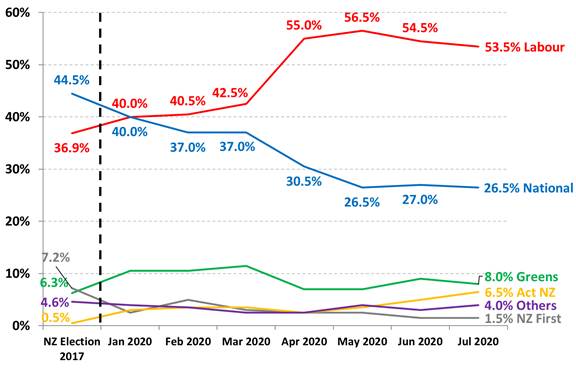
New Zealand Party Vote: NZ Govt. v Parliamentary Opposition
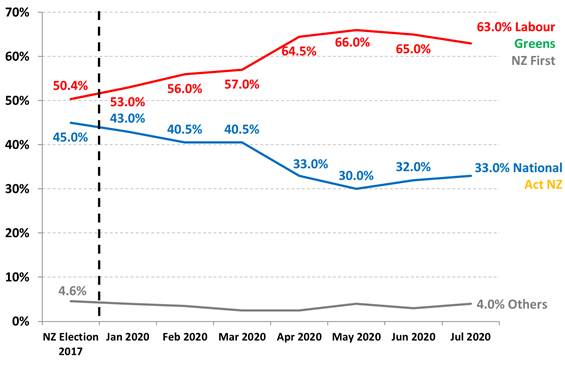
Roy Morgan NZ Government Confidence Rating vs. ANZ-Roy Morgan NZ Consumer Confidence
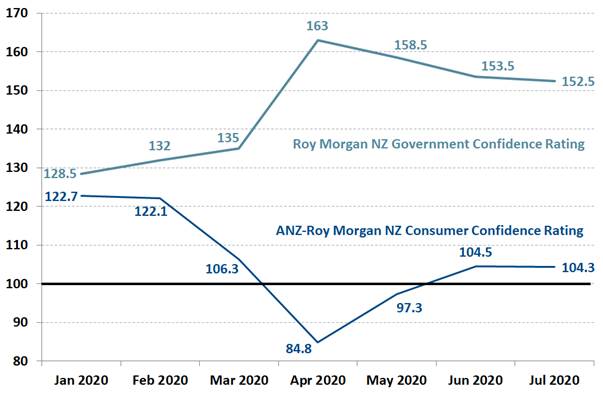
Voting Intention Summary
The following table compares the latest New Zealand Roy Morgan Polls on Voting Intention with the result from the September 23, 2017 General Election:
|
PARTY VOTE |
Labour |
NZ First |
Green Party* |
National |
ACT NZ |
TOP** |
Maori Party** |
Other |
|
ELECTIONS |
% |
% |
% |
% |
% |
% |
% |
% |
|
October 12, 1996* |
28.19 |
13.35 |
10.10 |
33.87 |
6.10 |
n/a |
n/a |
8.39 |
|
November 27, 1999 |
38.74 |
4.26 |
5.16 |
30.50 |
7.04 |
n/a |
n/a |
14.30 |
|
July 27, 2002 |
41.26 |
10.38 |
7.00 |
20.93 |
7.14 |
n/a |
n/a |
13.29 |
|
September 17, 2005 |
41.10 |
5.72 |
5.30 |
39.10 |
1.51 |
n/a |
2.12 |
5.15 |
|
November 8, 2008 |
33.99 |
4.07 |
6.72 |
44.93 |
3.65 |
n/a |
2.39 |
4.25 |
|
November 26, 2011 |
27.48 |
6.59 |
11.06 |
47.31 |
1.07 |
n/a |
1.43 |
5.06 |
|
September 20, 2014 |
25.13 |
8.66 |
10.70 |
47.04 |
0.69 |
n/a |
1.32 |
6.46 |
|
September 23, 2017 |
36.89 |
7.20 |
6.27 |
44.45 |
0.50 |
2.44 |
1.18 |
1.07 |
|
ROY MORGAN POLL |
||||||||
|
Oct 2-15, 2017 |
31 |
6.5 |
11 |
46 |
0.5 |
2 |
1.5 |
1.5 |
|
Oct 30-Nov 12, 2017 |
39.5 |
5 |
10 |
40.5 |
0.5 |
2 |
1.5 |
1 |
|
Nov 27-Dec 10, 2017 |
37 |
8 |
10 |
40.5 |
0.5 |
2.5 |
0.5 |
1 |
|
Jan 2-28, 2018 |
42.5 |
6 |
9 |
39 |
0.5 |
1.5 |
1 |
0.5 |
|
2020 |
||||||||
|
January 2020 |
40 |
2.5 |
10.5 |
40 |
3 |
0.5 |
1.5 |
2 |
|
February 2020 |
40.5 |
5 |
10.5 |
37 |
3.5 |
1.5 |
1 |
1 |
|
March 2020 |
42.5 |
3 |
11.5 |
37 |
3.5 |
1 |
0.5 |
1 |
|
April 2020 |
55 |
2.5 |
7 |
30.5 |
2.5 |
0.5 |
1.5 |
0.5 |
|
May 2020 |
56.5 |
2.5 |
7 |
26.5 |
3.5 |
1 |
1.5 |
1.5 |
|
June 2020 |
54.5 |
1.5 |
9 |
27 |
5 |
1.5 |
1 |
0.5 |
|
July 2020 |
53.5 |
1.5 |
8 |
26.5 |
6.5 |
1.5 |
0.5 |
2 |
*The 1996 Election was the
first New Zealand Election contested via MMP (Mixed Member Proportional). At
the 1996 Election the Greens Party contested as part of the “Alliance”
political grouping with four other political parties. **The Maori Party was
launched in July 2004. The Opportunities Party (TOP) was launched in November
2016.
Two-Party Preferred: Labour Party-led Government vs. Parliamentary Opposition Parties
|
Labour Party-led Government (Labour, NZ First, Greens) |
Parliamentary (National
& Act NZ) |
|
|
Election, September 23, 2017* |
50.36 |
44.95 |
|
ROY MORGAN NEW ZEALAND POLL |
||
|
Oct 2-15, 2017 |
48.5 |
46.5 |
|
NZ First under leader Winston Peters decides to support Labour’s Jacinda Ardern for PM |
||
|
Oct 30-Nov 12, 2017 |
54.5 |
41 |
|
Nov 27-Dec 10, 2017 |
55 |
41 |
|
2020 |
||
|
January 2020 |
53 |
43 |
|
February 2020 |
56 |
40.5 |
|
March 2020 |
57 |
40.5 |
|
April 2020 |
64.5 |
33 |
|
National elects new leader Todd Muller to replace Simon Bridges – May 22, 2020 |
||
|
May 2020 |
66 |
30 |
|
June 2020 |
65 |
32 |
|
July 2020 |
63 |
33 |
|
National elects new leader Judith Collins to replace Todd Muller - July 14, 2020 |
||
*At
the 2017 New Zealand Election the National-led Government returned only two
parties (National & Act NZ) who received 44.95% of the vote compared to
50.36% that went to the three Parliamentary Opposition Parties: Labour, New Zealand First and the Greens.
NEW ZEALAND: HEADING IN “RIGHT” OR “WRONG” DIRECTION?
Electors were asked: “Generally speaking, do you feel that things in New Zealand are heading in the right direction or would you say things are seriously heading in the wrong direction?”
|
NZ Roy Morgan Government Confidence Rating: Interviewing Dates (National Party Govt.) |
|||||||
|
June
8-21, |
June
29-July 12, |
Aug
3-16, |
Aug
31-Sep 13, |
Sep
28-Oct 11, |
Oct
26- Nov 8, |
Nov
23-Dec 6, |
|
|
% |
% |
% |
% |
% |
% |
% |
|
|
Right direction |
62.5 |
51 |
54 |
58 |
53 |
60 |
59.5 |
|
Wrong direction |
27 |
33 |
34 |
29.5 |
31 |
28.5 |
31 |
|
Roy Morgan GCR# |
135.5 |
118 |
120 |
128.5 |
122 |
131.5 |
128.5 |
|
Can’t say |
10.5 |
16 |
12 |
12.5 |
16 |
11.5 |
9.5 |
|
TOTAL |
100 |
100 |
100 |
100 |
100 |
100 |
100 |
|
NZ Roy Morgan Government Confidence Rating: Interviewing Dates (National Party Govt.) |
||||||||
|
Jan
4-17, |
Feb
1-14, |
Feb
29-Mar 13, |
Apr
4-17, |
May
2-15, |
May
30-June 12, |
Jul
4-17, |
Aug
8-21, |
|
|
% |
% |
% |
% |
% |
% |
% |
% |
|
|
Right direction |
59.5 |
56.5 |
61 |
57.5 |
59 |
54.5 |
57.5 |
58 |
|
Wrong direction |
28 |
28.5 |
29 |
30.5 |
29 |
34 |
30.5 |
30.5 |
|
Roy Morgan GCR# |
131.5 |
128 |
132 |
127 |
130 |
120.5 |
127 |
127.5 |
|
Can’t say |
12.5 |
15 |
10 |
12 |
12 |
11.5 |
12 |
11.5 |
|
TOTAL |
100 |
100 |
100 |
100 |
100 |
100 |
100 |
100 |
|
NZ Roy Morgan Government Confidence Rating: Interviewing Dates (National Party Govt.) |
||||||||
|
Sep
5-18, |
Oct
10-23, |
Nov
7-20, |
Nov
28-Dec 11, |
Jan
3-16, |
Jan
30-Feb 12, |
Feb
27-Mar 12, |
April
3-16, |
|
|
% |
% |
% |
% |
% |
% |
% |
% |
|
|
Right direction |
52 |
55.5 |
65 |
58.5 |
63 |
63.5 |
61.5 |
58 |
|
Wrong direction |
35 |
29 |
24 |
27.5 |
23 |
23.5 |
25.5 |
29 |
|
Roy Morgan GCR# |
117 |
126.5 |
141 |
131 |
140 |
140 |
136 |
129 |
|
Can’t say |
13 |
15.5 |
11 |
14 |
14 |
13 |
13 |
13 |
|
TOTAL |
100 |
100 |
100 |
100 |
100 |
100 |
100 |
100 |
|
NZ Roy Morgan Government Confidence Rating: Interviewing Dates (National Party Govt.) |
||||||
|
May
1-14, |
May
29-Jun 11, |
Jun
26-Jul 9, |
July
31-Aug 13, |
Aug
28-Sep 10, |
Oct
2-15, |
|
|
% |
% |
% |
% |
% |
% |
|
|
Right direction |
60.5 |
61.5 |
63 |
62.5 |
62 |
58.5 |
|
Wrong direction |
27 |
27 |
23.5 |
23.5 |
25 |
27.5 |
|
Roy Morgan GCR# |
133.5 |
134.5 |
139.5 |
139 |
137 |
131 |
|
Can’t say |
12.5 |
11.5 |
13.5 |
14 |
13 |
14 |
|
TOTAL |
100 |
100 |
100 |
100 |
100 |
100 |
|
NZ Roy Morgan Government Confidence Rating: Interviewing Dates (Labour Party Govt.) |
|||||||||
|
Oct
30-Nov 12, |
Nov
27-Dec 10, |
January |
February |
March |
April |
May |
June |
July 2020 |
|
|
% |
% |
% |
% |
% |
% |
% |
% |
% |
|
|
Right direction |
66.5 |
68 |
58 |
59 |
60.5 |
77 |
76 |
72 |
71.5 |
|
Wrong direction |
20 |
18 |
29.5 |
27 |
25.5 |
14 |
17.5 |
18.5 |
19 |
|
Roy Morgan GCR# |
146.5 |
150 |
128.5 |
132 |
135 |
163 |
158.5 |
153.5 |
152.5 |
|
Can’t say |
13.5 |
14 |
12.5 |
14 |
14 |
9 |
6.5 |
9.5 |
9.5 |
|
TOTAL |
100 |
100 |
100 |
100 |
100 |
100 |
100 |
100 |
100 |
(Roy Morgan)
August 08, 2020
Source: https://www.roymorgan.com/findings/8489-nz-national%20-voting-intention-july-2020-202008070802
MULTICOUNTRY STUDIES
650-651-43-29/Poll
Most European tourists would rather cancel their holiday than go on quarantine
European tourists will above
all avoid being quarantined in connection with their travel - and especially
Danes and Swedes are careful with holiday planning.
The European travel industry has been clearly marked by shifting restrictions and bans under COVID-19. The latest YouGov Eurotrack survey provides insight into how the restrictions have affected people's holiday plans in the UK, France, Germany, Denmark and Sweden.
While the majority of European tourists would cancel their holiday plans if they were to be quarantined on return (65-84%), it is even less appealing to Europeans to be quarantined on arrival at their holiday destination. Nine out of ten travelers in the UK, Germany, Denmark and Sweden (89-93%) would either possibly or definitely cancel their plans if they were to be quarantined on arrival, while this applies to 76% of French people.
The results are based on the part of the population in each country that tends to travel abroad - that is, those that the travel industry would consider as their customer base.
Most Europeans would also cancel their holiday plans if the government advised against traveling to a particular country - even if it was not a direct ban. Eight out of ten travelers in Denmark, Sweden and the United Kingdom would cancel if the government advised against it (80-85%), just as almost three quarters in Germany (74%) and 70% in France would cancel.
Europeans are least concerned about wearing sanitary napkins in public places such as shops and hotels at their destination, but this would still deter more than half of tourists from Denmark (61%), Sweden (65%) and Germany (51%) from traveling , while this applies to four out of ten Britons (43%) and a quarter of French people.
In general, the survey shows that French tourists are least likely to cancel their holiday plans, while Danes and Swedes are most likely to cancel.
(YouGov)
August 06, 2020
Source: https://yougov.dk/news/2020/08/06/de-fleste-europaeiske-turister-ville-hellere-aflys/
650-651-43-30/Poll
Majority worry whether online news is true
YouGov and the Reuters
Institute for the Study of Journalism’s annual study examining how people from
40 countries consume news reveals high levels of concern about misinformation
online
Every year the Reuters Institute for the Study of Journalism publishes an international survey - conducted by YouGov - that examines the state of digital news across the globe.
The study reveals that the global public are highly concerned about misinformation: 56% of a sample of more than 80,000 adults say they’re concerned about what’s true or false on the internet when it comes to news – and they’re especially worried when it comes to false statements from politicians.
The (mis)information age
Overall, four in ten (40%) are most worried about false or misleading information from politicians online. In May 2020, Twitter began labelling certain posts from President Donald Trump and other leaders as “potentially misleading” – a culmination of a debate about whether the platform should take action against his allegedly false statements that date back to his election in 2016.
Americans are more likely to be worried about online misinformation from these leaders than the average, as are those from Brazil and the Philippines: two other countries with populist “strongman” premiers. South Africans are also more likely to report concern about politicians. Over half of those surveyed (52%) say that when leaders say untrue things online, the news media should report it because it’s important to know what the politician said. Only three in ten (29%) said it should not be emphasised as it might give the leader unwarranted attention.
Beyond politicians, the global sample is most worried about misinformation from activists (14%), journalists (13%), and ordinary people (13%), with only one in ten (10%) most concerned about foreign governments spreading fake news.
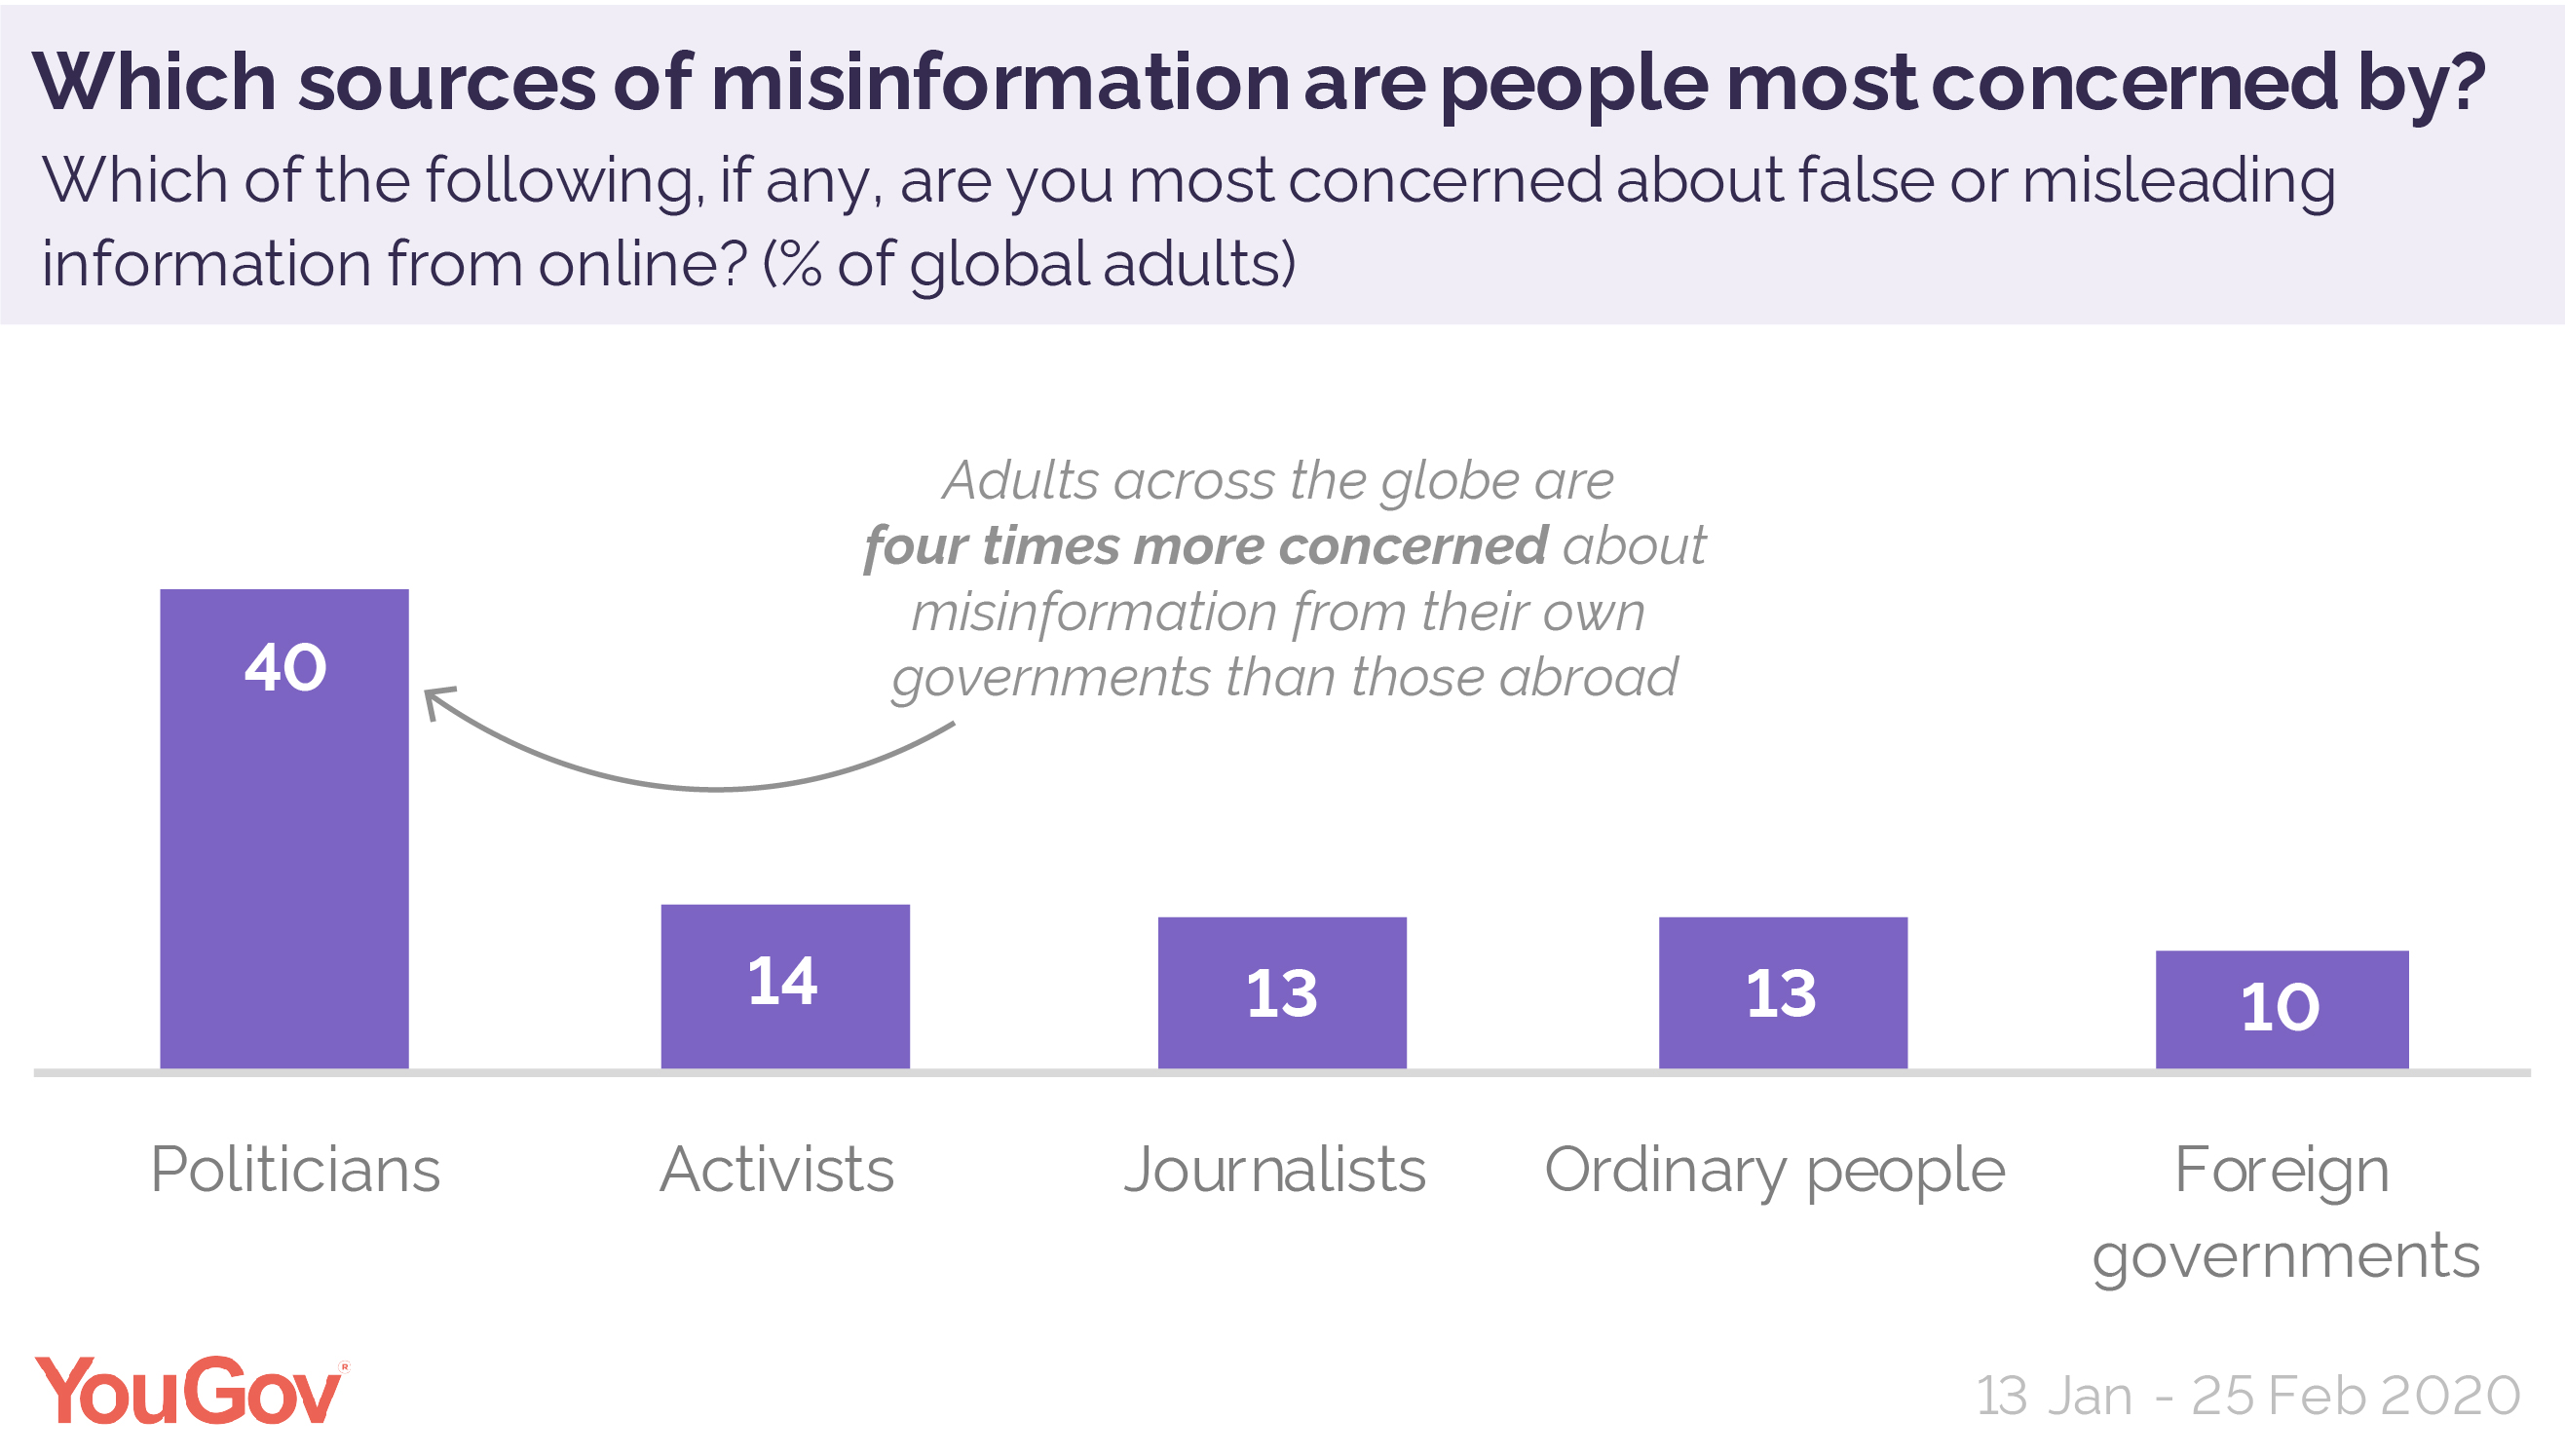
The report indicates that faith in the global media continues to decline. Less than four in ten (38%) claim to trust most news most of the time – a year-on-year fall of four percentage points – while less than half (46%) trust news they consume themselves. Three in ten (32%) distrust online searches most of the time, and a fifth (22%) distrust social media.
In Hong Kong, the contentious island’s relationship with mainland China has led to protests -and a 16 percentage point decline in media trust. Chile has seen a similar fall of 15 percentage points. Following a divisive year that involved a general election and further clashes over Brexit, trust in the UK media has declined by 12 points – hitting 28% overall. On the other end of the scale, Finland and Portugal (56% for both) enjoy the highest trust in their news.
How do global consumers like their news?
As for how global consumers prefer their news, six in ten (60%) prefer it to have no point of view compared to 28% who prefer it to share their opinions.
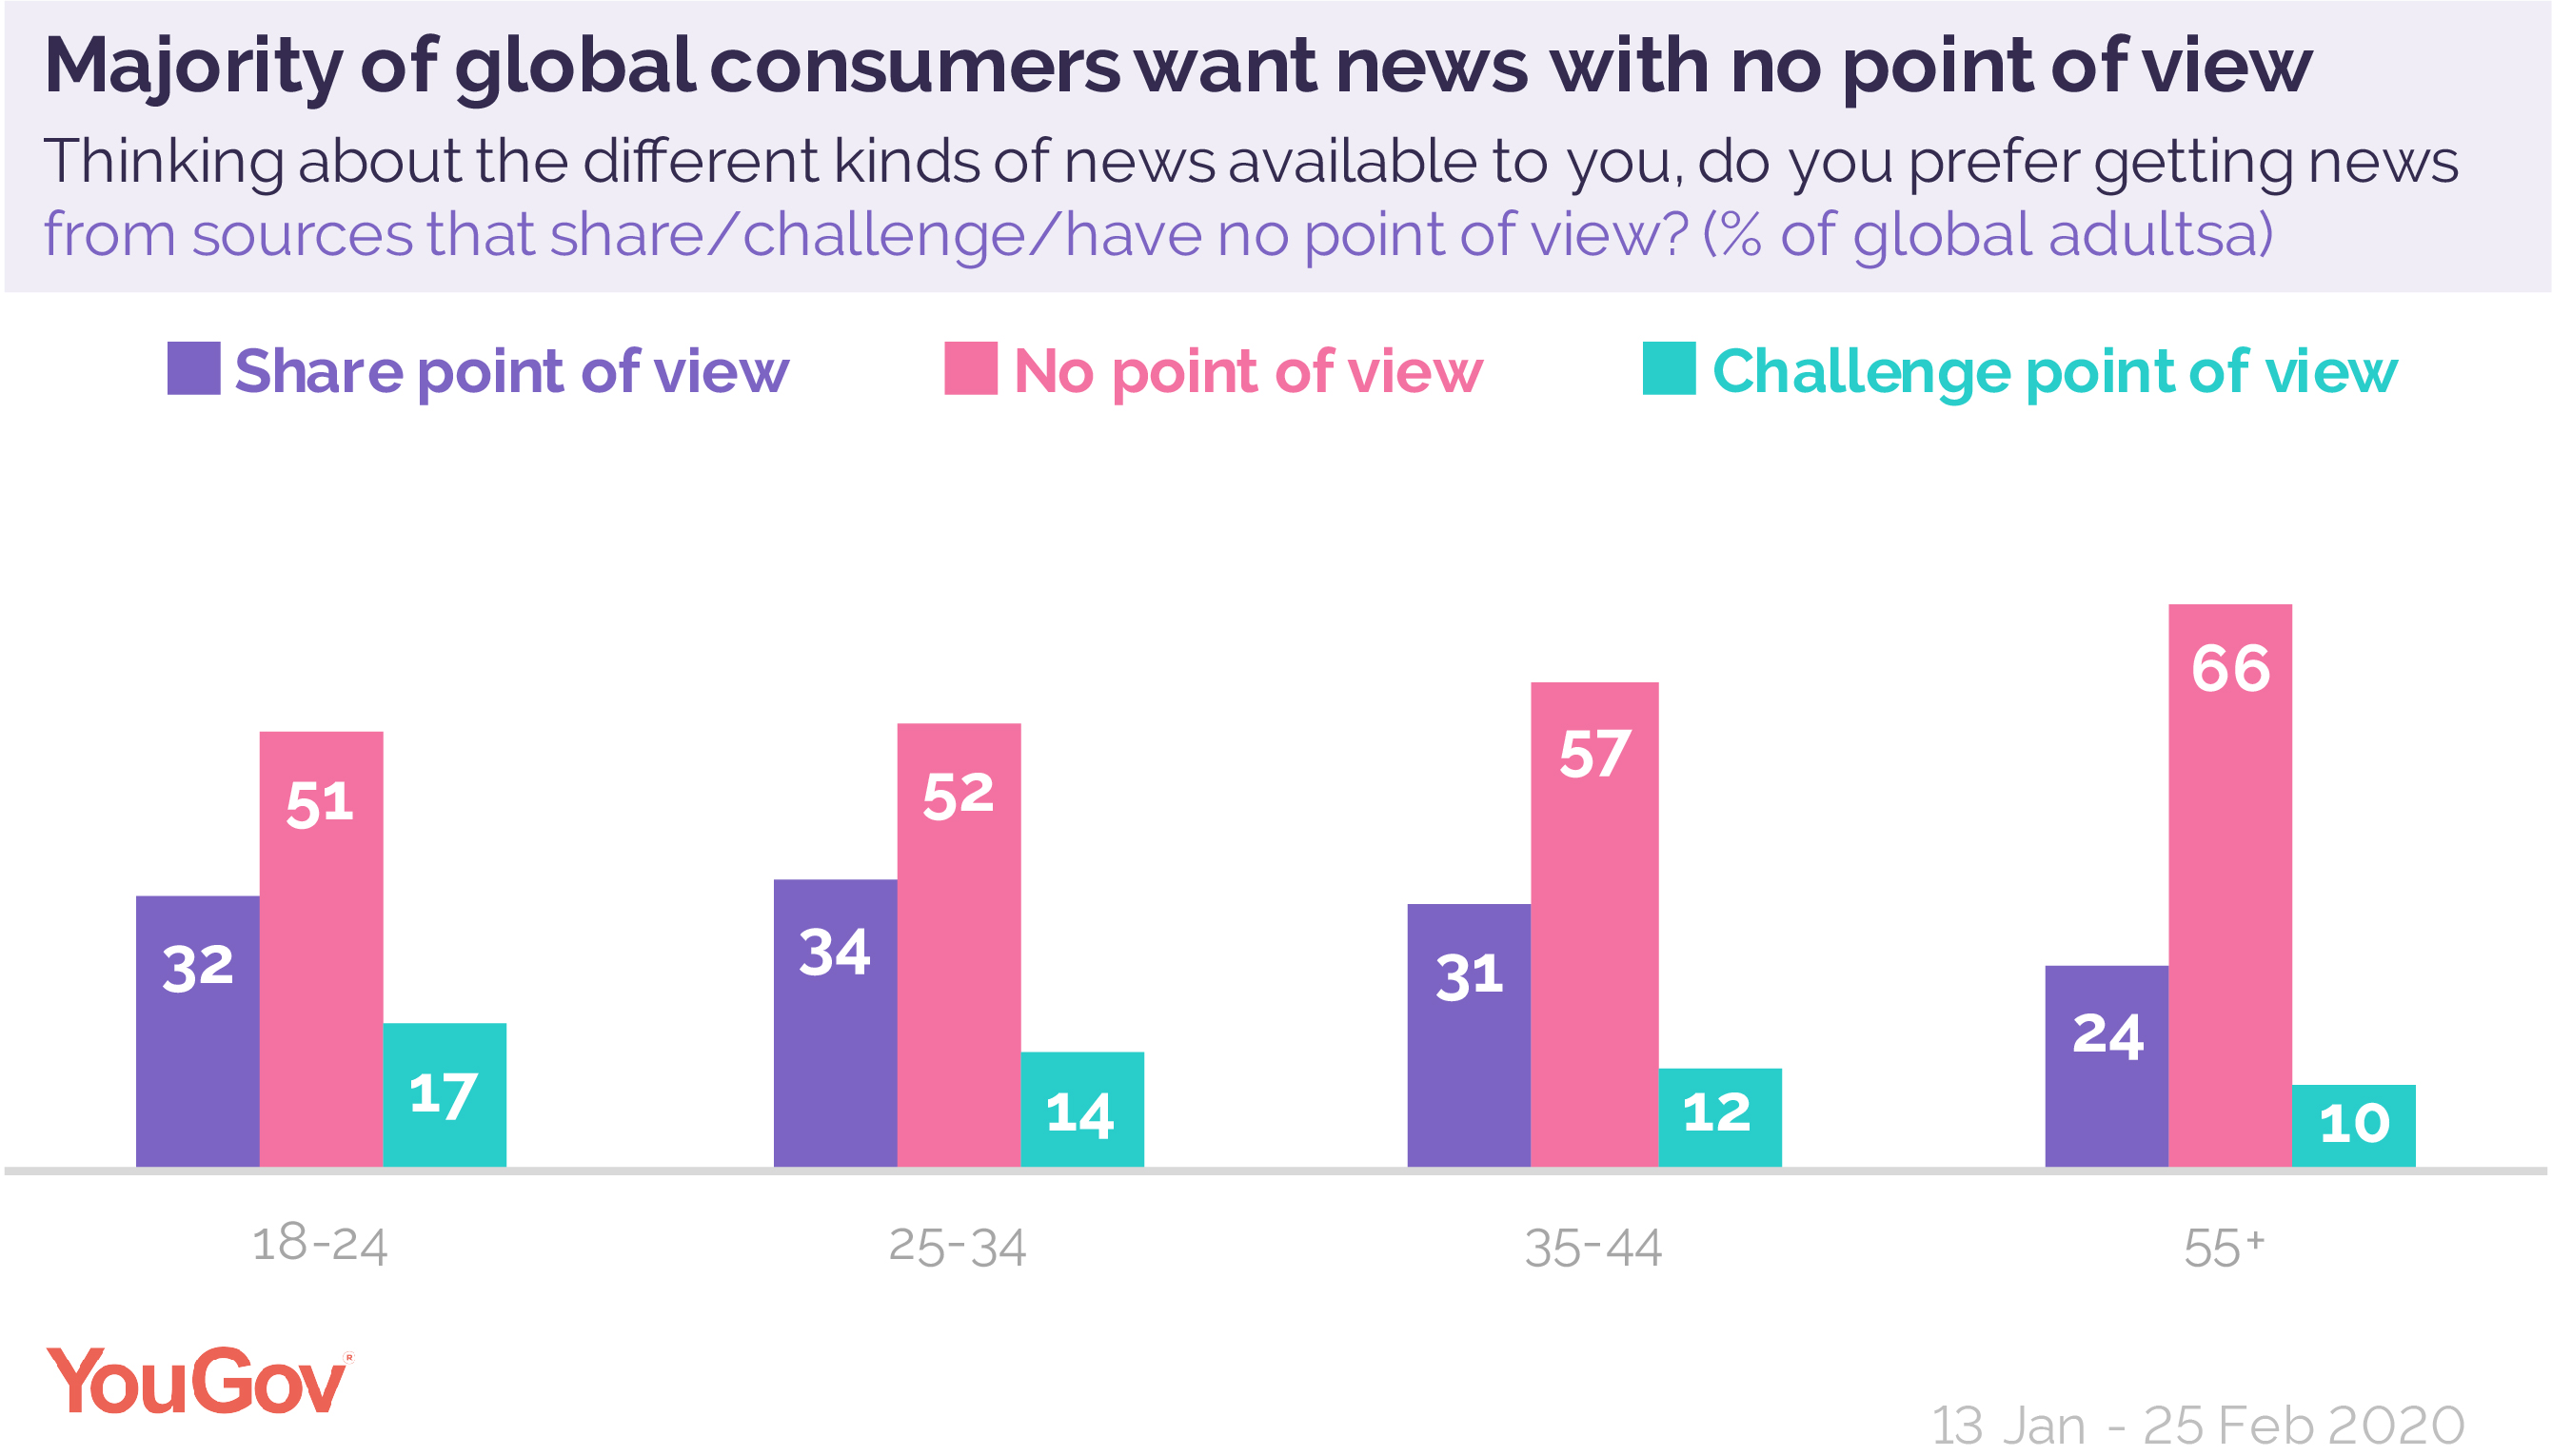
The data from January suggests that there have been significant increases in the percentage of consumers paying for online news in a number of markets. In the US, 20% pay for some sort of news publication on an ongoing basis, with The New York Times and The Washington Post enjoying a 39% and 31% share of this market respectively. In Norway, four in ten (42%) pay for online news, with almost two-thirds (64%) paying for local papers.
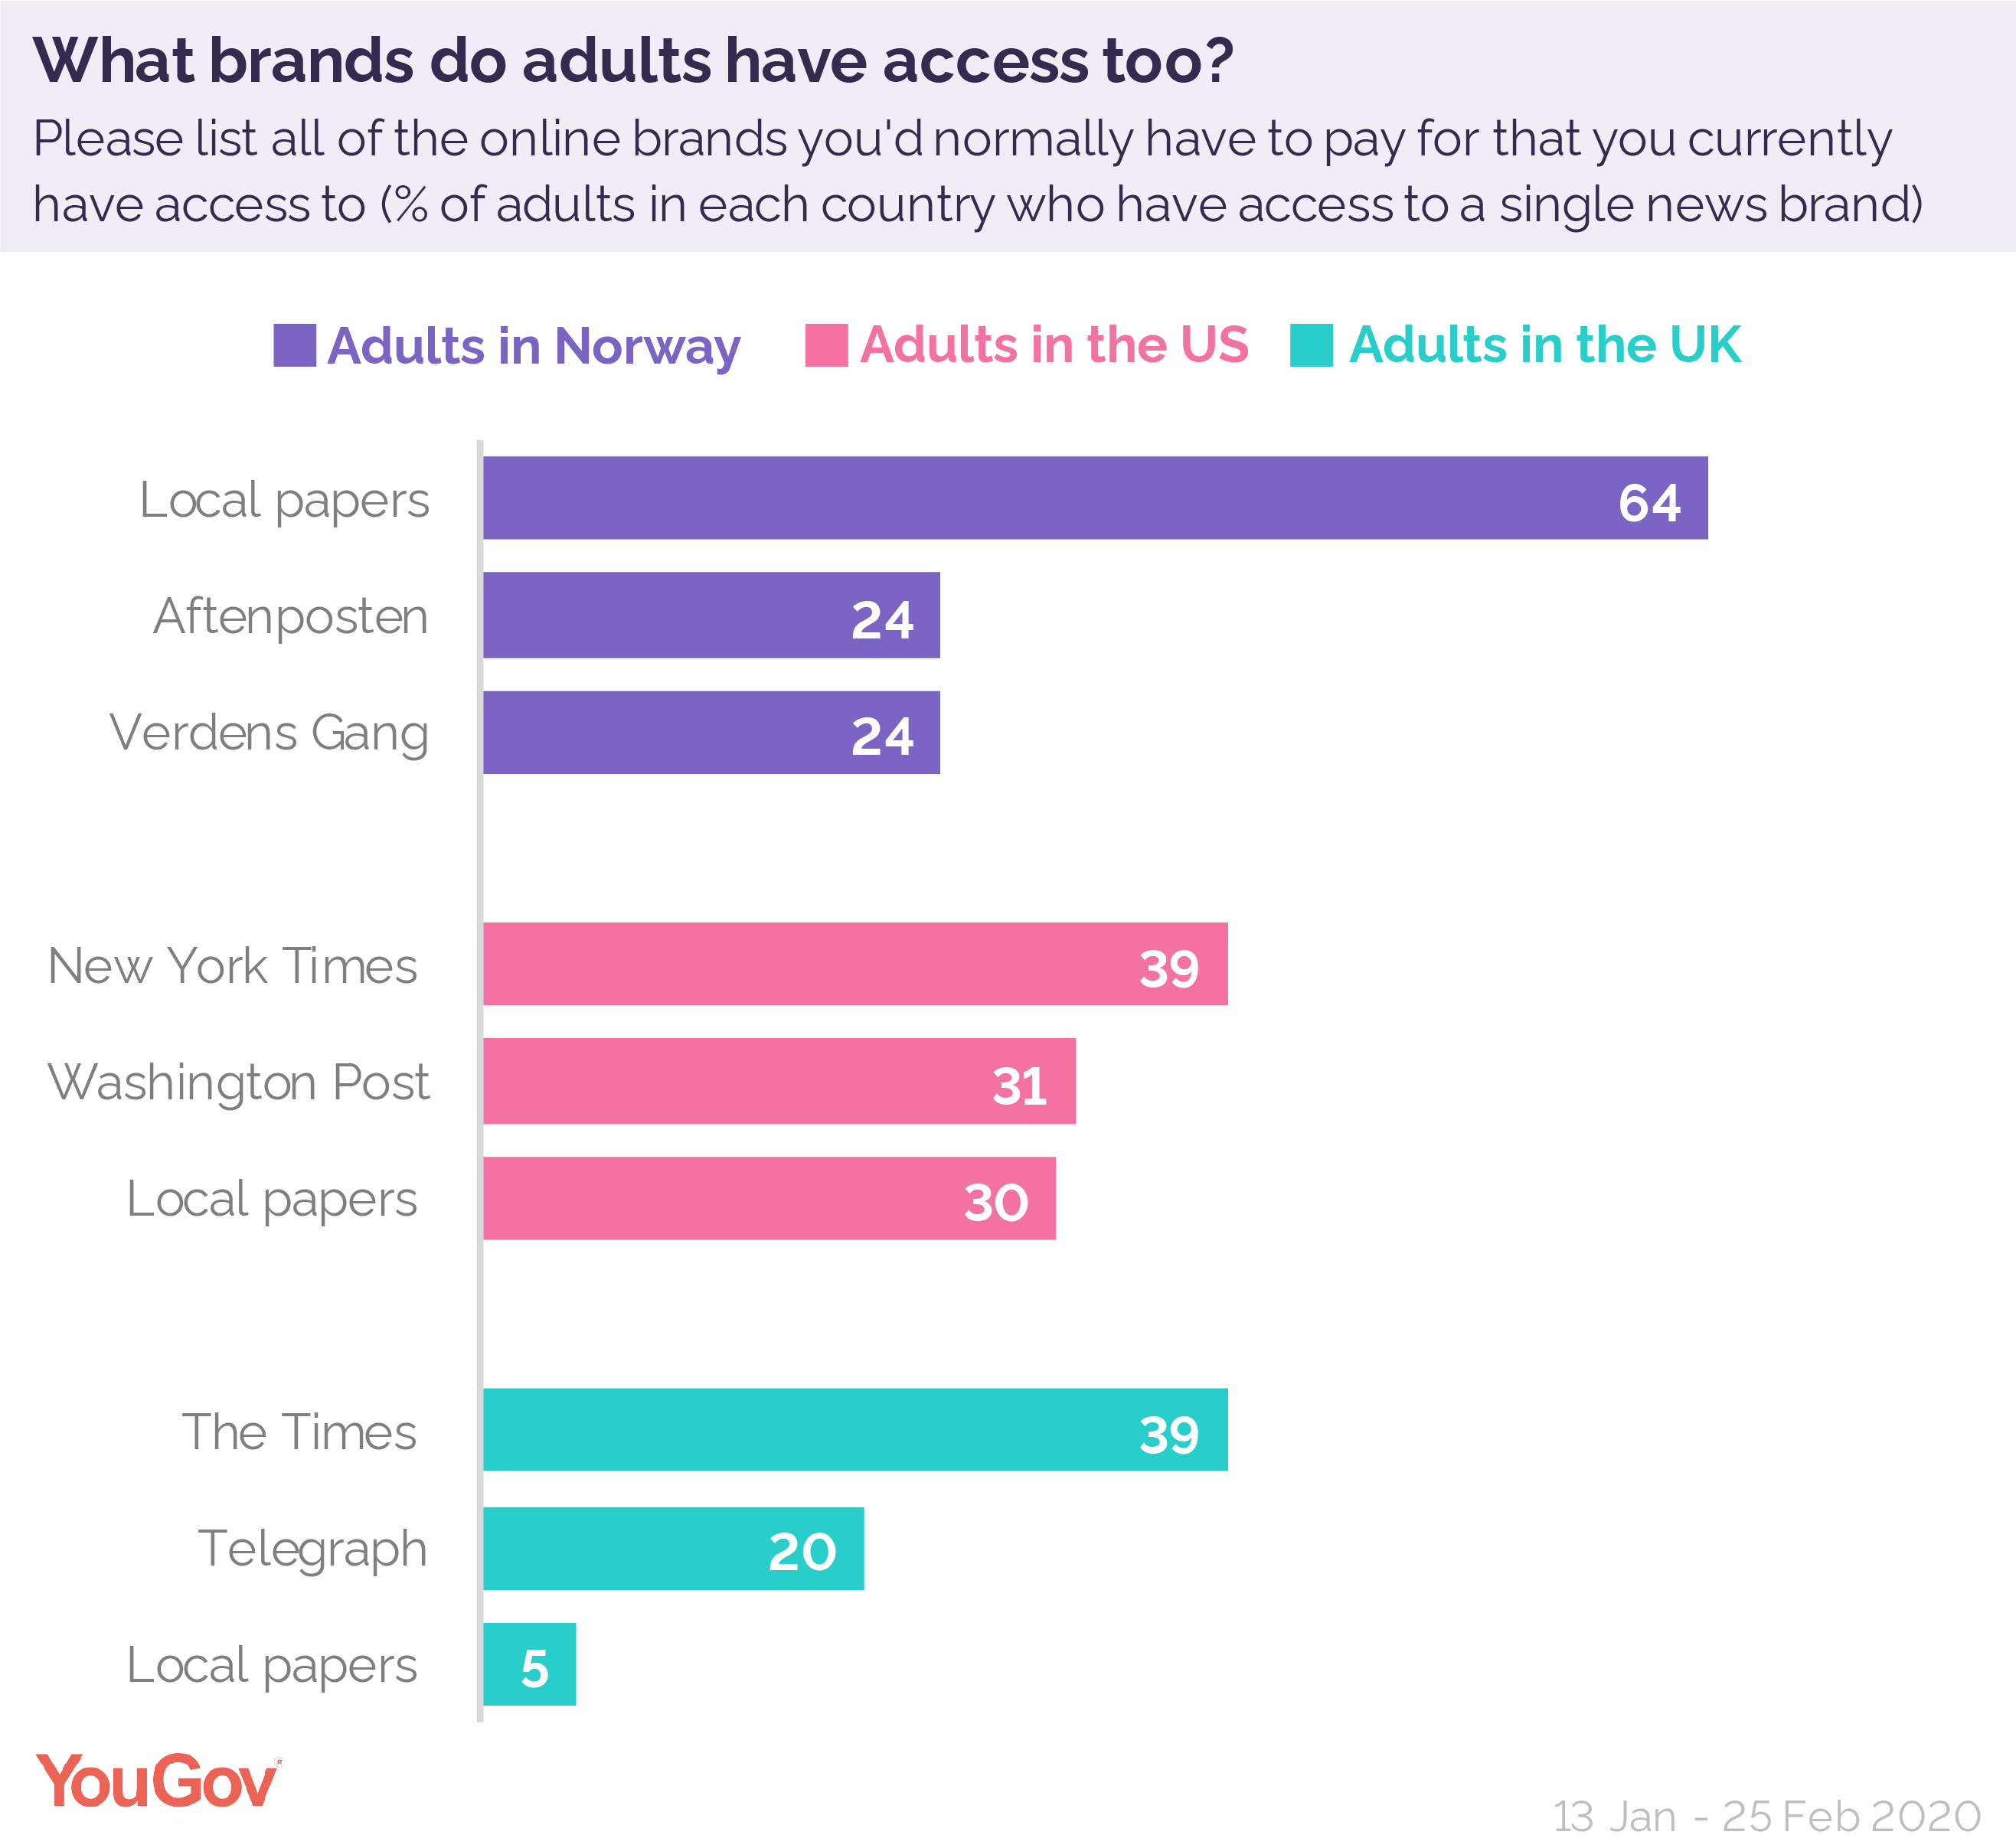
Of Norwegians, half (49%) say they’d miss local papers if they were to disappear, and a similar proportion of Germans (54%) feel the same. But regional news doesn’t enjoy the same support across the globe: in the UK, for example, The Times is clearly on top in the subscription market, with four in ten (39%) paying for its content, and The Telegraph (20%) comes in a distant second, while only 5% pay for local news. What’s more, only a quarter (25%) say they’d miss their regional papers if they were to disappear.
The impact of coronavirus
From the additional April study, which was restricted to six countries, we found that consumers were using a number of platforms and services to gather information about coronavirus.
A quarter of those surveyed said they used WhatsApp to learn about or share news about COVID-19 (24%), while a fifth (18%) joined a support or discussion group with people they didn’t know on either Facebook or WhatsApp with the express intention of talking about it. Half (51%) took part in these groups with people they did know: friends, family, and colleagues.
(YouGov)
August 16, 2020
Source: https://id.yougov.com/en-id/news/2020/06/16/majority-worry-whether-online-news-true/