BUSINESS
& POLITICS IN THE WORLD
GLOBAL
OPINION REPORT NO. 661-662
Week: October 19 – November 01,
2020
Presentation: November 6, 2020
Over 60% in India accessing newspaper and TV
news on mobile
Over
60% accessing newspaper and TV news on mobile
By
and large, Japanese have lost their community spirit
Amid
lucrative exports of natural resources, Basotho overwhelmingly feel left out
Overwhelming
majority of Ethiopians support democracy, seek accountable governance
More
and more Germans are sticking to wearing mouth and nose protection
Germans
say more often that Joe Biden won the TV duels before Donald Trump
What
is the general opinion about the coronavirus in Sweden?
Will
the French celebrate Halloween this year?
Government
handling of unemployment hits lockdown low
Fresh
versus Frozen, which Brits prefer which?
3 in
10 Britons are worried about paying their rent or mortgage
Snap
poll: 72% of English people back Prime Minister’s plan to return to lockdown
Public
support for a two week lockdown persists
U.S.
Catholics Have Backed Same-Sex Marriage Since 2011
56%
of U.S. Voters Say Trump Does Not Deserve Reelection
More
Voters Than in Prior Years Say Election Outcome Matters
Americans'
Social Distancing Habits Have Tapered Since July
Fewer
mothers and fathers in U.S. are working due to COVID-19 downturn; those at work
have cut hours
Key
findings about Americans’ views on COVID-19 contact tracing
‘Mortgage
stress’ is near record lows during the COVID-19 pandemic as payments are put on
hold
COVID-19:
how does support for business compare across Europe?
Job
loss is a concern for half of workers across the world
Arabs
Do Not Support A Second Trump Victory
From
voter registration to mail-in ballots, how do countries around the world run
their elections?
INTRODUCTORY NOTE
661-662-43-29/Commentary:
Over 60% in India accessing newspaper and TV news on mobile
Consumption of news on mobile phones is on the rise as more than 60 per cent are accessing newspapers and TV news channels on their smartphones, according to the IANS CVoter Media Tracker.
As per the survey, 61.7 per cent respondents said that they are reading newspapers more on mobile phones, while 32.5 per cent disagreed. A higher number is consuming TV news on mobile phones at 68.1 per cent.
The survey had a sample size of 5,000 plus respondents from across India covering all the districts in all the states, representing the demographic profile according to the latest census figures.
The interviews were conducted in the last week of September and the first week of October. The margin of error is +/- 3 per cent at the national level and +/- 5 per cent at the regional level. The data is weighted to the known demographic profile.
On the consumption trends of TV new channels, the survey found that 31.8 per cent watch them multiple times in a day, 16.9 per cent watch them couple of times in a day and 32.5 per cent watch TV new channels once a day.
As many as 51.9 per cent of the respondents read newspapers once a day, while 10.3 per cent read them multiple times in a day.
On news portals, the survey found that 74.2 per cent respondents do not read news portals, while 64.9 per cent do not listen to the radio.
As per the survey, Facebook is the most favoured social media outlet with 31.7 per cent respondents agreeing, followed by WhatsApp at 21.4 per cent and Twitter and Instagram at 5.7 per cent each.
A total of 48 per cent respondents said they use social media multiple times in a day, 25.1 per cent said they do not use social media, while 42.2 per cent said they use social media for more than an hour a day.
As many as 76.7 per cent respondents said the average Indian needs more newspapers while 80.3 per cent said the younger generation is watching the media more on internet.
On the impact of the coronavirua pandemic on festival related shopping and purchasing, 44.5 per cent said they will spend ‘a lot’ less than last year, while 25.8 per cent said they will spend ‘somewhat’ less than last year.
(CVoter India)
October 14, 2020
Source: http://www.cvoterindia.com/over-60-accessing-newspaper-and-tv-news-on-mobile/
661-662-43-30/Country
Profile:
SUMMARY
OF POLLS
ASIA
(India)
Over 60% accessing newspaper and
TV news on mobile
Consumption of news
on mobile phones is on the rise as more than 60 per cent are accessing
newspapers and TV news channels on their smartphones, according to the IANS CVoter Media Tracker. As per
the survey, 61.7 per cent respondents said that they are reading newspapers
more on mobile phones, while 32.5 per cent disagreed. A higher number is
consuming TV news on mobile phones at 68.1 per cent. The survey had a sample
size of 5,000 plus respondents from across India covering all the districts in
all the states, representing the demographic profile according to the latest
census figures. (CVoter India)
October 14, 2020
(Japan)
By and large, Japanese have lost
their community spirit
The building housing
the Ministry of Health, Labor and Welfare (Asahi Shimbun file photo)
Although new Prime
Minister Yoshihide Suga champions mutual support, nearly half of voter-age
respondents in an online survey said they do nothing to help out their
neighbors or acquaintances, according to the welfare ministry. The results of the
survey will be incorporated into the ministry's white paper on Health, Labor
and Welfare for fiscal 2020, which was approved by the government on Oct. 23. (The
Asahi Shimbun)
October 24, 2020
MENA
(Palestine)
The Palestinian-Israeli Pulse
Despite stable levels
of support for a two-state solution, the two publics display substantial
hardening of attitudes regarding a permanent peace package that implements that
solution. Nonetheless both publics still prefer two states to any other framework
for resolving the conflict. Pairs of zero-sum incentives can raise support
somewhat on both sides, showing some flexibility. But trust is declining, and
the majority of Palestinians, but also Israelis, agree that annexation will
hinder progress towards peace. (Arab
Barometer)
October 26, 2020
AFRICA
(South Africa)
Amid lucrative exports of natural
resources, Basotho overwhelmingly feel left out
Basotho
overwhelmingly believe that the export of diamonds, water, and wool does not
benefit ordinary citizens, the most recent Afrobarometer
survey shows. Indeed, though rich in natural resources, the country’s
mountainous areas also record higher lived poverty and poorer access to basic
infrastructure than other regions. The survey also shows that a majority of Basotho
went without enough food and clean water at least once during the previous 12
months. (Afrobarometer)
October 21, 2020
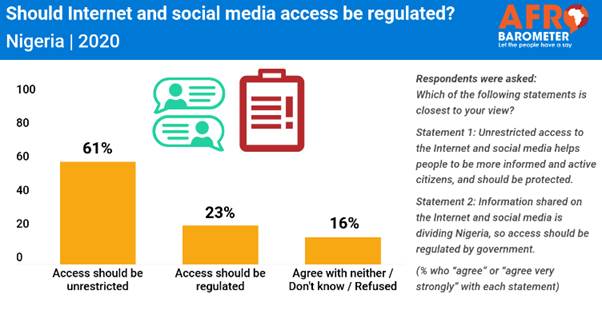
(Nigeria)
Majority of Nigerians want
unrestricted access to Internet and social media, Afrobarometer
survey shows
A majority of Nigerians want unrestricted
access to the Internet and social media, Afrobarometer
survey findings show. The level of support for unfettered Internet and social
media access is among the highest recorded across 18 African countries. Among
the two-thirds of Nigerians who are aware of social media, large majorities say
these digital platforms keep people informed and enable them to have more impact
on political processes. (Afrobarometer)
October 30, 2020
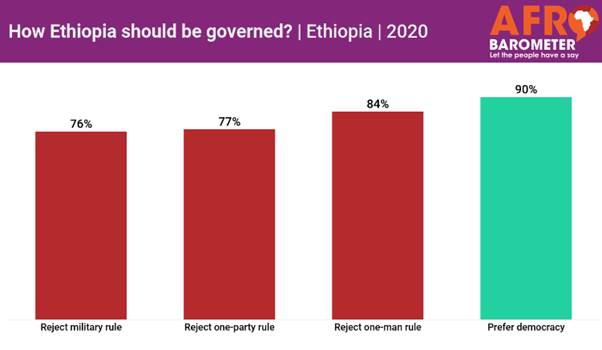
(Ethiopia)
Overwhelming majority of
Ethiopians support democracy, seek accountable governance
Large majorities of Ethiopians support
democracy and reject non-democratic regimes such as one-party rule, military
rule, and one-man rule, the most recent Afrobarometer
survey shows. Most Ethiopians want a government accountable to citizens, a
prime minister monitored by and answerable to Parliament, and elected officials
who are accountable to their constituents. The survey also found that half of
Ethiopians consider their country either a democracy with major problems or not
a democracy at all. (Afrobarometer)
October 30, 2020
EUROPE
(Germany)
More and more Germans are
sticking to wearing mouth and nose protection
The number of new
corona infections in Germany has risen again since August and the end of the
summer holidays. In October, a large majority of Germans (86 percent) said that
they always obey the rules for wearing mouth and nose protection in public
places. In August it was 6 percentage points less - 80 percent. The number of
those who do not always adhere to the wearing of clothes fell from 16 percent
in August to 8 percent in October.
(YouGov)
October 23, 2020
(Germany)
Germans say more often that Joe
Biden won the TV duels before Donald Trump
In the fight for the
US presidency, Joe Biden and Donald Trump competed in two TV duels. Which of
the two candidates was more likely to convince the Germans with his respective
appearance? Latest YouGov surveys provide answers. (YouGov)
October 27, 2020
(Sweden)
What is the general opinion about
the coronavirus in Sweden?
Sweden's management
of the coronavirus differs from other countries' ways of dealing with the
crisis. Sweden is known for being one of the few countries that has not
introduced any form of national closure. At the time of writing, Sweden has the
thirteenth highest death toll per capita among all countries in the world -
significantly higher than its neighbors in the Nordic region, but not as high
as in Spain, Italy, the USA and the United Kingdom. (YouGov)
October 22, 2020
(France)
Will the French celebrate
Halloween this year?
According to our
study, 38% of French people are used to celebrating Halloween and one in ten
people (10%) even claim to be there every year. However, this annual
celebration is not unanimous since 62% admit never celebrating the event, a
figure which climbs to 75% among those 55 and over. On the other hand and unsurprisingly, Halloween is very popular with
18-34 year olds and French people living with at least one child under 18
(54%). (YouGov)
October 23, 2020
(UK)
Government handling of
unemployment hits lockdown low
YouGov’s latest
tracking data shows that the public has little faith in how the Government is
handling unemployment, as the furlough scheme draws to a close. Less than a
third of Brits (31%) say they are doing well, while 55% believe they are doing
badly. Approval of the Government when it comes to this key issue has gradually
been falling since the start of lockdown and is now almost the opposite of
levels seen back in March. At that time nearly half (47%) of Brits thought the
Government were doing well at handling unemployment, compared to 32% who said
badly. Now, the numbers are 31% well to 55% badly. (YouGov)
October 23, 2020
(UK)
Fresh versus Frozen, which Brits
prefer which?
Frozen foods offer
longevity and convenience, but others prefer their foods fresh. YouGov Profiles
lets us explore which Brits prefer each type, who they might be, and where
their attitudes on foods differ. Overall, a quarter (25%) of Brits definitely
agree with the statement that “fresh food is better than frozen”, while at the
other end of the scale, 3% say they definitely disagree with the statement. (YouGov)
October 23, 2020
(UK)
3 in 10 Britons are worried about
paying their rent or mortgage
In a new survey by
Ipsos MORI, 3 in 10 Britons say they are concerned about paying their rent or
mortgage at the moment (30%), and a similar proportion (31%) are worried about
these payments in 12 months’ time. While a majority are not concerned about
their housing payments at the moment (63%), this has
fallen from 69% last year and a similar level in 2017. At the same time, lack
of concern about payments in 12 months’ time has fallen from 67% in 2019 to 60%
now. (Ipsos MORI)
October 23, 2020
Snap poll: 72% of English
people back Prime Minister’s plan to return to lockdown
Yesterday evening
prime minister Boris Johnson announced plans to put England in a new
coronavirus lockdown, similar to that the nation went
through at the beginning of the crisis in March. A snap YouGov poll, conducted
last night and this morning, reveals that almost three quarters of English
people (72%) support returning the country to lockdown, including 42% who say
they “strongly support” doing so. Fewer than one in four Britons (23%) oppose
the move. (YouGov)
November 30, 2020
Public support for a two week
lockdown persists
Back in March we saw
almost universal support for the first full lockdown, with 93% of the public
saying they were in favour of the decision. This
level of support is unheard of in public opinion research. In fact, after
searching our archives, the only policy we could find that came close to
matching this level of support was “planting more trees”. The public proceeded
to support each extension of the full lockdown, content with the new lockdown
life. This support for restrictions coincided with high approval for the Prime
Minister and his government’s handling of the crisis. (YouGov)
October 30, 2020
NORTH AMERICA
(USA)
U.S. Catholics Have Backed
Same-Sex Marriage Since 2011
Pope Francis recently
said he supports legalizing civil unions for gay couples. Most U.S. Catholics
believe same-sex unions should be legal -- only they go further than the pope
and support marriage for same-sex couples. A majority of Catholics have
consistently approved of gay marriage in Gallup polling since 2011, with an
average 59% approving from 2011-2015, rising to an average 69% since 2016. (Gallup
USA)
October 23, 2020
(USA)
56% of U.S. Voters Say Trump Does
Not Deserve Reelection
The majority of U.S.
registered voters, 56%, believe President Donald Trump does not deserve to be
reelected, while 43% say he does. Voters are even less likely to think
"most members of Congress" deserve reelection (29%), although six in
10 say their own House member does. The percentage of voters who say Trump
deserves reelection to a second term is down seven percentage points from
Gallup's previous measure in January -- a much different time in Trump's
presidency, when confidence in the U.S. economy was high, the Senate was
preparing to vote to keep Trump in office during his impeachment trial, and
only a few cases of COVID-19 had been confirmed in the U.S. (Gallup USA)
October 22, 2020
(USA)
More Voters Than in Prior Years
Say Election Outcome Matters
A record-high
percentage of U.S. voters say the outcome of this year's election matters more
to them than prior elections did. The 77% of registered voters holding this
view is up six percentage points from 2016 and is the highest in Gallup's trend
dating back to 1996. While few voters (2%) say the election matters less than
in the past, 21% think it matters about the same. It is
currently 77%, the highest on record and up six points since 2016. (Gallup USA)
October 19, 2020
(USA)
Americans' Social Distancing
Habits Have Tapered Since July
Americans are less likely now than at any point
since the early days of the coronavirus pandemic to say they are avoiding
events with large crowds (70%), public places such as stores and restaurants
(53%) and small gatherings (45%). Though each of these behaviors has changed
only slightly from late August, they represent significant declines from
mid-to-late July and new low points for each of their respective trends since
Gallup's initial March 13-15 reading. Still, the majority are avoiding public
places and, in particular, large crowds. (Gallup USA)
October 19, 2020
(USA)
Foreign policy experts in the
U.S. have much different views about threats to the country than the general
public
Foreign policy might not be the primary issue
of the 2020 presidential election campaign, but Americans have clear ideas on
the various threats facing the United States. Recent Pew Research Center
surveys find that Americans are especially concerned about the spread of
infectious diseases and are more likely than not to blame China for its role in
the current COVID-19 pandemic. (PEW)
October 23, 2020
(USA)
Fewer mothers and fathers in
U.S. are working due to COVID-19 downturn; those at work have cut hours
The COVID-19 recession has upended the lives of
American workers, millions of whom remain without a job despite a recent
upswing in hiring. Working parents have faced unique challenges as many schools
and child care centers around the United States closed their doors due to the
coronavirus outbreak. A new Pew Research Center analysis of government data
finds that in the first six months of the pandemic, the workplace engagement of
mothers and fathers with children younger than 18 at home has been affected
about equally. (PEW)
October 22, 2020
(USA)
Both Republicans and Democrats
cite masks as a negative effect of COVID-19, but for very different reasons
The COVID-19 outbreak has upended life across
the United States and exposed growing divisions between supporters of the two
major political parties. And when Americans are asked to describe in their own
words how the outbreak has affected them negatively, no topic divides Democrats
and Republicans more than the subject of masks, according to a new Pew Research
Center analysis of survey findings collected in late August and early
September. Overall, 14% of U.S. adults mentioned the word “mask” when asked how
the pandemic has made their life difficult or challenging. (PEW)
October 29, 2020
(USA)
Key findings about Americans’
views on COVID-19 contact tracing
As the U.S. battles COVID-19, effective contact
tracing has proven to be a major challenge for those trying to contain the
spread of the coronavirus. A new Pew Research Center report from a survey
conducted July 13-19, 2020, finds that Americans hold a variety of views that
could complicate the ongoing efforts of public health authorities to trace and
contain the virus. The report largely focuses on what Americans tell us they
might do when faced with three key parts of the contact tracing and quarantine
process amid COVID-19, which we refer to as “speak,” “share” and “quarantine”.
(PEW)
October 30, 2020
AUSTRALIA
‘Mortgage stress’ is near
record lows during the COVID-19 pandemic as payments are put on hold
New research from Roy Morgan shows an estimated
751,000 mortgage holders (20.2%) were at risk of ‘mortgage stress’ in the three
months to August 2020 as Australia navigated its way through the COVID - 19
pandemic. Much of Australia was progressing towards a ‘COVID-normal’ situation
in August although Victoria entered a Stage 4 lockdown. (Roy Morgan)
October 20, 2020
MULTICOUNTRY STUDIES
COVID-19: how does support for
business compare across Europe?
British businesses are the most likely to feel
adequately supported among the large European economies – but their outlook is
also the most pessimistic. The Chancellor today announced further COVID-19
support to businesses through what he branded the world’s most generous
short-time work scheme. YouGov data shows that even before the new measures,
British businesses were the most likely to say the government had provided enough
support during the coronavirus crisis in a survey including France, Germany,
Italy and Spain. (YouGov)
October 22, 2020
Job loss is a concern for half
of workers across the world
A new Ipsos survey of more than 12,000 working
adults from 27 countries for the World Economic Forum finds 54% of them
expressing concern about losing their job in the next 12 months. Perceived job
insecurity varies widely across countries: it is stated by three in four
workers in Russia, compared to just one in four in Germany. Two thirds of
workers worldwide say they can learn and develop skills needed for the jobs of
the future through their current employer. While nearly nine in ten workers in
Spain report being able to gain essential new skills on the job, fewer than half
in Japan, Sweden and Russia do. (Ipsos)
October 19, 2020
Arabs Do Not Support A Second
Trump Victory
We asked Arab citizens across MENA about their
preferred US presidential candidate and their opinion of the US. And the
results reveal clear preferences within the election. Overall, Arab citizens
think Biden’s foreign policies would be better for the region. And, the U.S.’s
image suffers, in part as majorities in the Arab world express unfavorable
views of Trump’s approach. That is based on Arab Barometer’s latest survey of
more than 5,000 people in five countries in the Middle East and North Africa
that was conducted by mobile phone during the fall 2020.
(Arab Barometer)
November 01, 2020
From voter registration to
mail-in ballots, how do countries around the world run their elections?
The 2020 U.S. presidential election is
unfolding amid a pandemic and public uncertainty over some aspects of the
voting process itself. Here’s a look at how elections are run in the United
States and other countries around the world. All findings are based on a Pew
Research Center analysis of data from the International Institute for Democracy
and Electoral Assistance, the ACE Electoral Knowledge Network and the Electoral
Integrity Project. (PEW)
October 30, 2020
ASIA
661-662-43-01/Poll
Over 60% accessing newspaper and TV news on mobile
Consumption of news on mobile phones is on the rise as more than 60 per cent are accessing newspapers and TV news channels on their smartphones, according to the IANS CVoter Media Tracker.
As per the survey, 61.7 per cent respondents said that they are reading newspapers more on mobile phones, while 32.5 per cent disagreed. A higher number is consuming TV news on mobile phones at 68.1 per cent.
The survey had a sample size of 5,000 plus respondents from across India covering all the districts in all the states, representing the demographic profile according to the latest census figures.
The interviews were conducted in the last week of September and the first week of October. The margin of error is +/- 3 per cent at the national level and +/- 5 per cent at the regional level. The data is weighted to the known demographic profile.
On the consumption trends of TV new channels, the survey found that 31.8 per cent watch them multiple times in a day, 16.9 per cent watch them couple of times in a day and 32.5 per cent watch TV new channels once a day.
As many as 51.9 per cent of the respondents read newspapers once a day, while 10.3 per cent read them multiple times in a day.
On news portals, the survey found that 74.2 per cent respondents do not read news portals, while 64.9 per cent do not listen to the radio.
As per the survey, Facebook is the most favoured social media outlet with 31.7 per cent respondents agreeing, followed by WhatsApp at 21.4 per cent and Twitter and Instagram at 5.7 per cent each.
A total of 48 per cent respondents said they use social media multiple times in a day, 25.1 per cent said they do not use social media, while 42.2 per cent said they use social media for more than an hour a day.
As many as 76.7 per cent respondents said the average Indian needs more newspapers while 80.3 per cent said the younger generation is watching the media more on internet.
On the impact of the coronavirua pandemic on festival related shopping and purchasing, 44.5 per cent said they will spend ‘a lot’ less than last year, while 25.8 per cent said they will spend ‘somewhat’ less than last year.
(CVoter India)
October 14, 2020
Source:
http://www.cvoterindia.com/over-60-accessing-newspaper-and-tv-news-on-mobile/
661-662-43-02/Poll
By and large, Japanese have lost their community spirit
The building housing the Ministry of Health, Labor and Welfare (Asahi Shimbun file photo)
Although new Prime Minister Yoshihide Suga champions mutual support, nearly half of voter-age respondents in an online survey said they do nothing to help out their neighbors or acquaintances, according to the welfare ministry.
The results of the survey will be incorporated into the ministry's white paper on Health, Labor and Welfare for fiscal 2020, which was approved by the government on Oct. 23.
“We need to build a network of connecting with others and supporting each other by seeking help from family members, community associations, nonprofit groups and other entities,” the Ministry of Health, Labor and Welfare said of the finding.
Suga espouses “self-support, mutual support and public support,” a rallying cry that has drawn fire from critics who say the central and local governments should play a larger role in outreaching people in need.
The survey, conducted last December but only announced now, received responses from 3,000 people aged 18 or older.
Asked to choose answers about how they are involved in their community’s health care and welfare fields, the most common answer, cited by 46.9 percent, was they “do nothing” as there is no room for their involvement.
It was followed by 32.1 percent of respondents who said they “help out friends and acquaintances with daily troubles.”
The ratio of respondents who replied that they help neighbors was 27.1 percent.
Japan’s population of those aged 65 and older is projected to peak in 2040, with a growing number of senior singles among them.
Experts are concerned that a sense of mutual support will further erode in the coming decades due to the growing ranks of the elderly.
(The Asahi Shimbun)
October 24, 2020
Source:
http://www.asahi.com/ajw/articles/13866655
MENA
661-662-43-03/Poll
The Palestinian-Israeli Pulse
Despite stable levels of support for a two-state solution, the two publics display substantial hardening of attitudes regarding a permanent peace package that implements that solution. Nonetheless both publics still prefer two states to any other framework for resolving the conflict. Pairs of zero-sum incentives can raise support somewhat on both sides, showing some flexibility. But trust is declining, and the majority of Palestinians, but also Israelis, agree that annexation will hinder progress towards peace.
These are the results of Palestinian-Israeli Pulse: A Joint Poll conducted by the Palestinian Center for Policy and Survey Research (PSR) in Ramallah and the Evens Program in Mediation and Conflict Management at Tel Aviv University with funding from the Netherlands Representative Office in Ramallah and the Representative Office of Japan to Palestine through UNDP/PAPP. The Palestinian sample size was 1200 adults interviewed face-to-face in the West Bank, East Jerusalem and Gaza Strip in 127 randomly selected locations between 12-26 August, 2020. The margin of error is +/-3%. The Israeli sample includes 900 adult Israelis interviewed through the internet by Midgam in Hebrew and Arabic between 12 August and 3 September 2020. The number of Jews interviewed inside Israel is 500, 200 West Bank settlers, and 200 Israeli Arabs. The combined Israeli data file has been reweighted to reflect the exact proportionate size of these three groups in the Israeli society, and to reflect current demographic and religious-secular divisions. The margin of error is +/-4%.
(Arab Barometer)
October 26, 2020
Source:
https://www.arabbarometer.org/2020/10/the-palestinian-israeli-pulse/
AFRICA
661-662-43-04/Poll
Amid lucrative exports of natural resources, Basotho overwhelmingly feel left out
Basotho overwhelmingly believe that the export of diamonds, water, and wool does not benefit ordinary citizens, the most recent Afrobarometer survey shows. Indeed, though rich in natural resources, the country’s mountainous areas also record higher lived poverty and poorer access to basic infrastructure than other regions. The survey also shows that a majority of Basotho went without enough food and clean water at least once during the previous 12 months.
These findings suggest that
new approaches to the exploitation and sharing of the country’s natural
resources are needed.
The data were collected in February-March 2020, just as African countries began
reporting their first cases of the coronavirus. While Lesotho had recorded
fewer than 50 deaths due to COVID-19 as of October 2020, global economic
pressures as a result of the pandemic are likely to affect the country’s
economic outlook and performance.
(Afrobarometer)
October 21, 2020
661-662-43-05/Poll
Majority of Nigerians want unrestricted access to Internet and social media, Afrobarometer survey shows
A majority of Nigerians want unrestricted access to the Internet and social media, Afrobarometer survey findings show. The level of support for unfettered Internet and social media access is among the highest recorded across 18 African countries.
Among the two-thirds of Nigerians who are aware of social media, large majorities say these digital platforms keep people informed and enable them to have more impact on political processes. And while majorities also see social media as making people more likely to believe fake news and more intolerant of different opinions, positive views of its overall effects on society outnumber negative assessments by a ratio of 6 to 1.
As Nigeria has been rocked by #EndSARS protests against police brutality, Minister of Information and Culture Lai Mohammed has called for a social media policy that will help regulate the spread of fake news. But Afrobarometer findings show that Nigerians are more likely to blame politicians for disseminating false information than social media users and activists.
(Afrobarometer)
October 30, 2020
661-662-43-06/Poll
Overwhelming majority of Ethiopians support democracy, seek accountable governance
Large majorities of Ethiopians support democracy and reject non-democratic regimes such as one-party rule, military rule, and one-man rule, the most recent Afrobarometer survey shows.
Most Ethiopians want a government accountable to citizens, a prime minister monitored by and answerable to Parliament, and elected officials who are accountable to their constituents.
The survey also found that half of Ethiopians consider their country either a democracy with major problems or not a democracy at all. And more than half say they are not satisfied with the way democracy is working in their country.
(Afrobarometer)
October 30, 2020
EUROPE
661-662-43-07/Poll
More and more Germans are sticking to wearing mouth and nose protection
How seriously do Germans
currently take the corona pandemic? Do you always follow the rules for
wearing mouth and nose protection in public spaces? Our current surveys
show that as the number of new infections rises again, a change in the behavior
pattern can be seen when wearing mouth and nose protection.
The number of new corona infections in Germany has risen again since August and the end of the summer holidays. In October, a large majority of Germans (86 percent) said that they always obey the rules for wearing mouth and nose protection in public places. In August it was 6 percentage points less - 80 percent. The number of those who do not always adhere to the wearing of clothes fell from 16 percent in August to 8 percent in October.
WOMEN ARE GENERALLY MORE
CONSISTENT WHEN WEARING MOUTH AND NOSE PROTECTION
In both August and October, women were more likely to say that they always obey the rules for wearing mouth and nose protection (84 percent in August and 88 percent in October). But there is also a growing consequence among men: The number of men who always keep to wearing rose from 77 percent in August to 83 percent in October.
OLDER PEOPLE ARE MORE LIKELY
TO SAY THAT THEY ALWAYS ADHERE TO THE RULES FOR WEARING MOUTH AND NOSE
PROTECTION
Respondents aged 55 and over are particularly vigilant: in October, more than 9 out of 10 respondents in this age group said that they always wear mouth and nose protection (92 percent). In August it was 6 percentage points less. 18- to 24-year-olds, however, are not quite as consistent. In October they are the only age group to say less often than in August that they always stick to wearing (69 percent in October and 75 percent in August).
(YouGov)
October 23, 2020
Source: https://yougov.de/news/2020/10/23/immer-mehr-deutsche-halten-sich-das-tragen-eines-m/
661-662-43-08/Poll
Germans say more often that Joe Biden won the TV duels before Donald Trump
In the fight for the US
presidency, Joe Biden and Donald Trump competed in two TV duels. Which of
the two candidates was more likely to convince the Germans with his respective
appearance? Latest YouGov surveys provide answers.
On November 3rd, the time has come: In the USA, the next presidential election will take place after four years. In advance, as part of the election campaign, there had been two TV duels between the Democrat nominee Joe Biden and the incumbent US President Donald Trump. The judgment of the Germans after the television duels is clear: After both TV appearances, the respondents are more likely to believe that Joe Biden won before Donald Trump: On September 30, immediately after the two of them met for the first time, a quarter (25 percent) of Germans said that Biden had won, only 5 percent said this about Donald Trump. After the second duel, this opinion became even clearer: A third (34 percent) of all respondents are in favor of Joe Biden's victory, 6 percent for that of the incumbent US president. The number of those who spoke out in favor of a stalemate was 24 percent after the first duel, but fell to 21 percent after the second. This makes the Germans' tendency that Joe Biden won the duel even clearer.
As the US election approaches, the interest of Germans in their outcome is also growing. While a third (32 percent) of all respondents said after the first duel that they had not seen, read or heard anything about the TV duel, this number fell to 23 percent after the second survey at the end of October.
(YouGov)
October 27, 2020
Source: https://yougov.de/news/2020/10/27/deutsche-sagen-haufiger-dass-joe-biden-vor-donald-/
661-662-43-09/Poll
What is the general opinion about the coronavirus in Sweden?
We compare Sweden with other
countries using YouGov's COVID-19 tracker
Sweden's management of the coronavirus differs from other countries' ways of dealing with the crisis. Sweden is known for being one of the few countries that has not introduced any form of national closure.
At the time of writing, Sweden has the thirteenth highest death toll per capita among all countries in the world - significantly higher than its neighbors in the Nordic region, but not as high as in Spain, Italy, the USA and the United Kingdom.
Anyone who expects these figures to mean that the Swedes think that the government has failed is, however, completely wrong.
On the contrary: Anders Tegnell - the current state epidemiologist in Sweden and one of the architects behind the country's handling of the coronavirus - is extremely popular. 65% have a positive image of Anders Tegnell and less than a quarter (24%) have something negative to say about him.
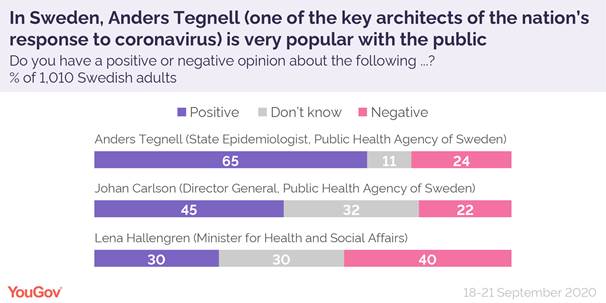
Johan Carlson - Director General of the Swedish Public Health Agency, who is responsible for the Swedish handling of the pandemic - is perceived in much the same way, even though he is not as well known. Almost twice as many have a positive image of Johan Carlson compared to those who have a negative image (45% versus 22%).
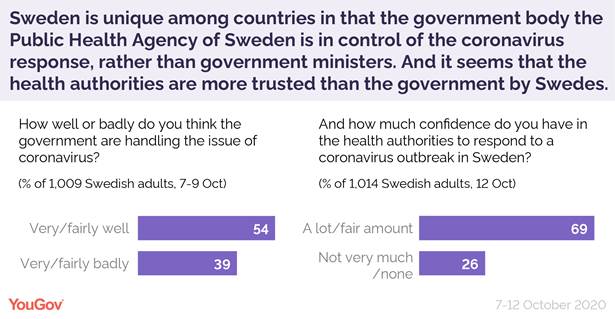
Most Swedes believe that the government has handled the covid-19 crisis well (54%), which can be compared with 39% being negative.
Although this does not directly give Sweden a high ranking in terms of confidence in the government - 12th place among the 17 countries surveyed since the end of September - it is still significantly higher than for countries that have had a stricter strategy for closure, such as Spain ( 33%), the United Kingdom (32%) and France (29%). The figure is still less positive than for neighbors in the region, such as Denmark (77%), Norway (75%) and Finland (65%).
In addition, 69% of Swedes state that they have great or fairly great confidence in the national health authorities' handling of the infection, thus the Swedes have greater confidence in the Public Health Agency's actions compared with the government's.
Swedes are among those who
are least worried about the coronavirus
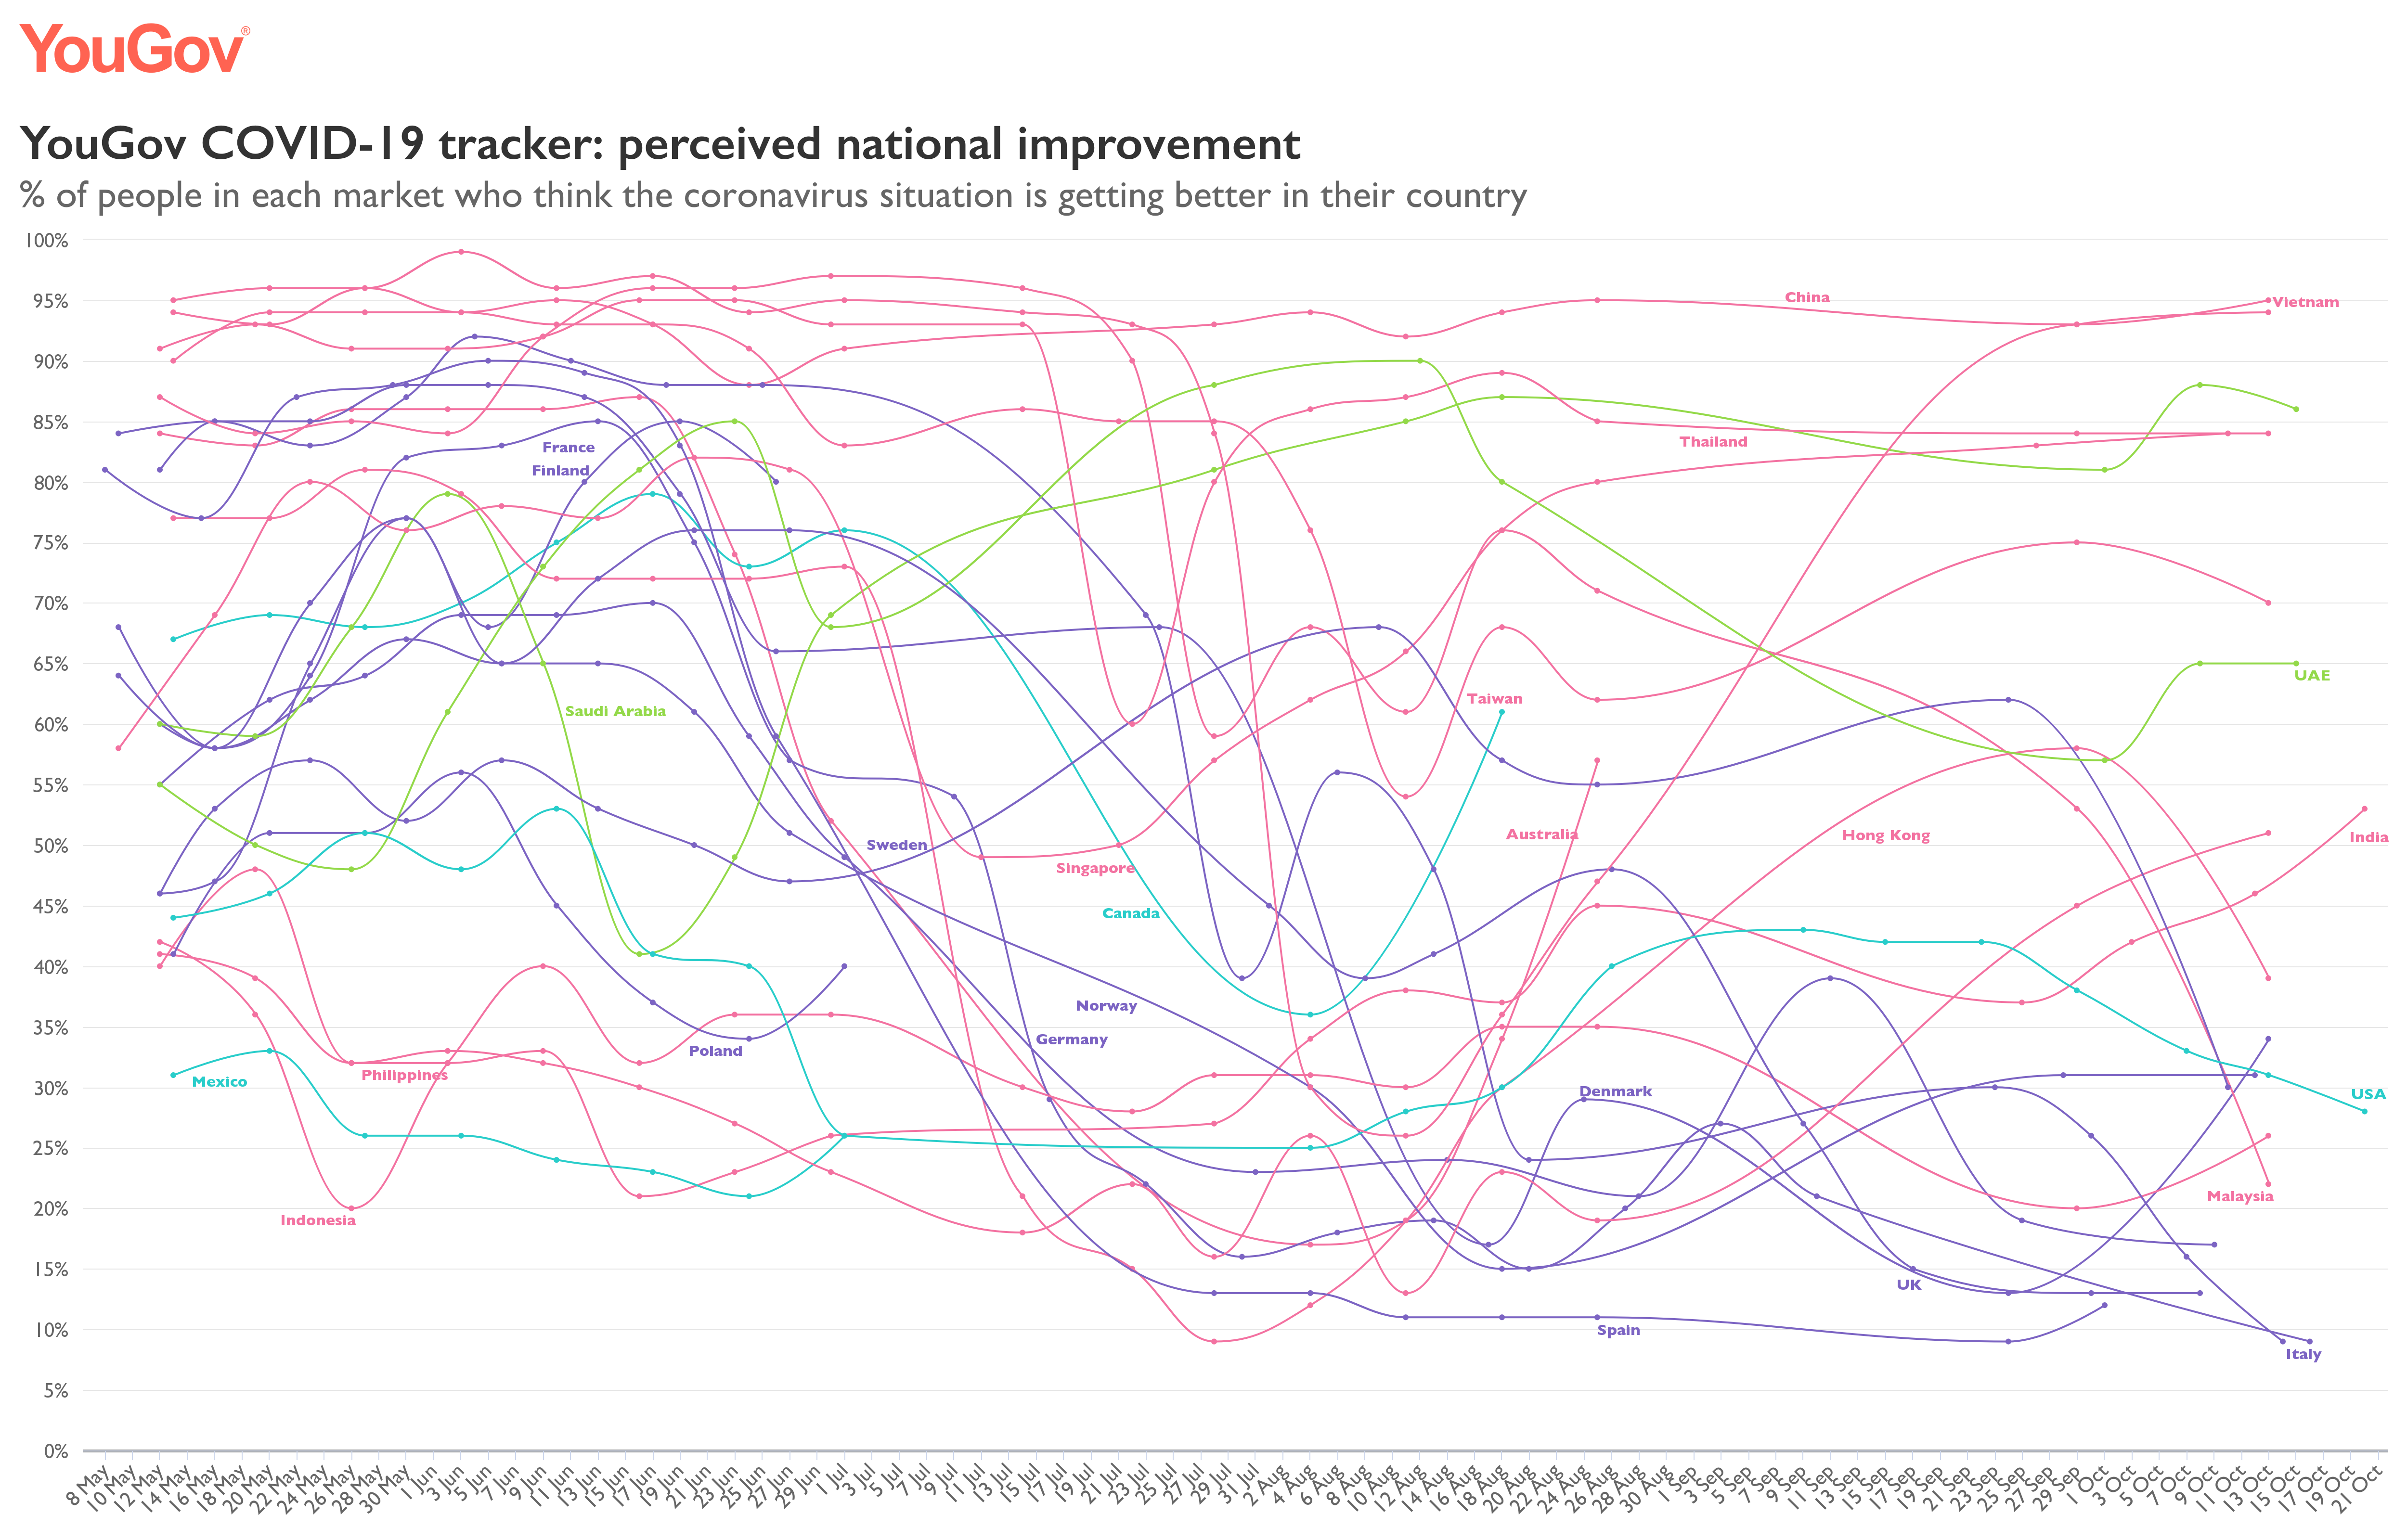
The Swedes are among those who are most optimistic that the situation regarding the coronavirus is improving in their country. Until very recently, most Swedes felt that the situation was getting better, more than in any other western country (this has been the case since the end of August) and many countries in Asia.
Now that cases are increasing again in Sweden, this figure has decreased to 30% - a level in line with the neighboring countries Denmark (34%) and Norway (31%), but still higher than in the countries of the rest of Europe (9–17%).
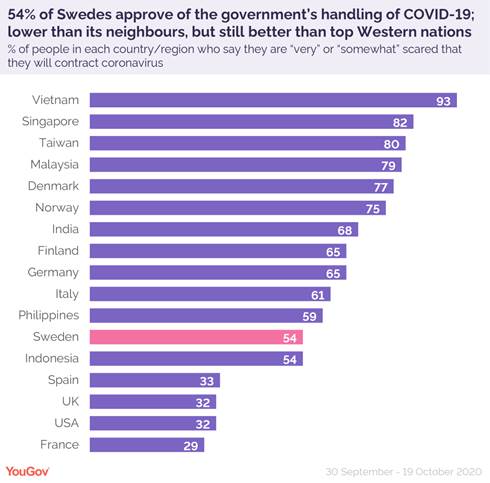
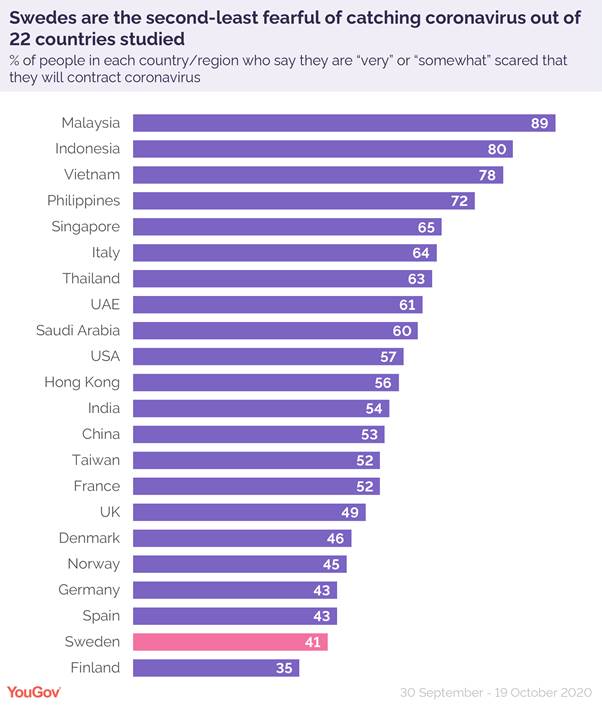
Throughout the corona crisis, Swedes have been among those who are least afraid of being affected by the corona virus. The proportion who state that they themselves are "very" or "quite" afraid of being affected by the coronavirus reached a peak level of 53% in mid-April. This means that Sweden ended up in place 20 out of 26 countries when it comes to personal concerns about the virus.
In mid-October, only 41% were equally afraid of infection, a figure that has hardly changed compared to the previous survey, when it was 38%. This is despite the fact that the number of people who believe that the crisis is worsening in Sweden has increased dramatically. There is only one country in the survey where fewer people are afraid of contracting the disease: Finland, at 35%.
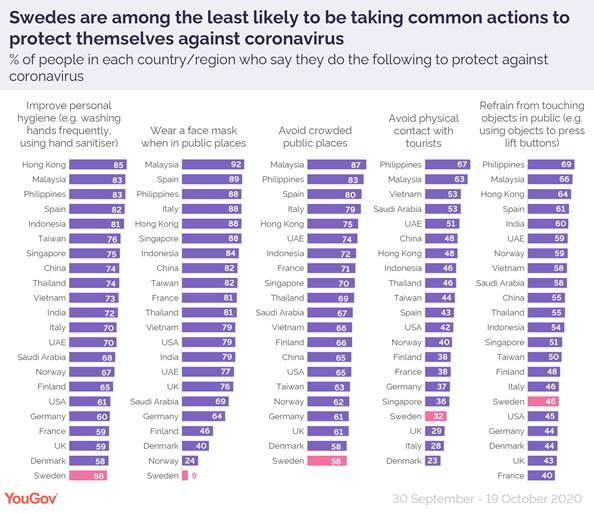
Fewer Swedes take measures to protect themselves against the coronavirus compared with other countries surveyed. Among the countries surveyed are the Swedes:
- Least likely to wear face mask - 9%
- Least likely to avoid tourists - 29%
- Least likely to sharpen their personal hygiene - 56%
- Together with Denmark least likely to avoid places with crowds - 58%
- Among the least likely to avoid touching objects in public places - 46%, as one of seven countries in the bottom, where the level is 40-46%
(YouGov)
October 22, 2020
Source: https://yougov.se/news/2020/10/22/hur-ser-den-allmanna-opinionen-om-coronaviruset-ut/
661-662-43-10/Poll
Will the French celebrate Halloween this year?
Are the French used to celebrating Halloween?
According to our study, 38% of French people are used to celebrating Halloween and one in ten people (10%) even claim to be there every year. However, this annual celebration is not unanimous since 62% admit never celebrating the event, a figure which climbs to 75% among those 55 and over.
On the other hand and unsurprisingly, Halloween is very popular with 18-34 year olds and French people living with at least one child under 18 (54%).
Halloween in a context of health crisis
Halloween week is essential for the confectionery category but also for mass distribution as a whole, positioning itself in the top 10 of the annual ranking of the best weeks, with around 1.3 billion sales made in consumer products (source Nielsen) .
Nevertheless, regulars seem mixed with the idea of celebrating Halloween this year. Indeed, if 46% of French people who are used to celebrating Halloween say they intend to do so this year, 51% remain skeptical. A reluctance that is particularly observed among the oldest: 63% of 55 years.
The main reason given by the French is fear of the virus (50%).
Among the other reasons cited: 25% of French people consider that this Halloween year will be too different from other years, 20% think that this holiday loses its meaning and finally 13% evoke financial reasons.
What enthusiasm for confectionery this year?
More than a third of French people (37%) say they buy sweets every year for Halloween in order to distribute them. Conversely, 15% of French people never buy them.
If 66% of French people who are used to buying sweets for Halloween wish to repeat these purchases this year, 30% intend to reduce spending and 25% plan to give it up.
Why do the French intend to buy less candy / candy, or even not buy any this year?
- 46% want to avoid contact for fear of COVID-19
- 36% anticipate a lower number of visitors than in previous years
- 16% want to save money
The expected changes this year compared to last year
Despite the health situation, 2 in 3 people (66%) intend to make their Halloween purchases in stores this year (22% intend to favor online purchases and 12% do not yet know).
However, we observe that a majority intends to change their habits. Only 26% of respondents do not intend to make any changes.
(YouGov)
October 23, 2020
Source: https://fr.yougov.com/news/2020/10/23/les-francais-feteront-ils-halloween-cette-annee/
661-662-43-11/Poll
Government handling of unemployment hits lockdown low
Majority of Brits also think
the Government is doing a bad job when it comes to the economy
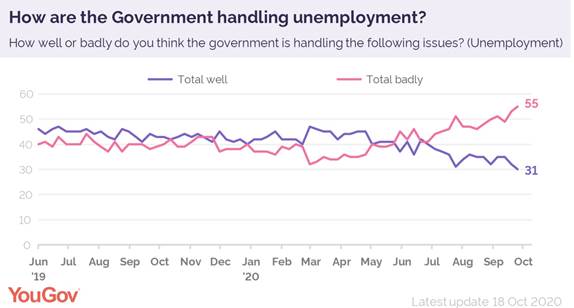
YouGov’s latest tracking data shows that the public has little faith in how the Government is handling unemployment, as the furlough scheme draws to a close. Less than a third of Brits (31%) say they are doing well, while 55% believe they are doing badly.
Approval of the Government when it comes to this key issue has gradually been falling since the start of lockdown and is now almost the opposite of levels seen back in March. At that time nearly half (47%) of Brits thought the Government were doing well at handling unemployment, compared to 32% who said badly. Now, the numbers are 31% well to 55% badly.
Those aged from 18 to 24 years old are significantly more likely to be critical of Government’s handling of the situation, with 70% saying they are doing a bad job when it comes to unemployment.
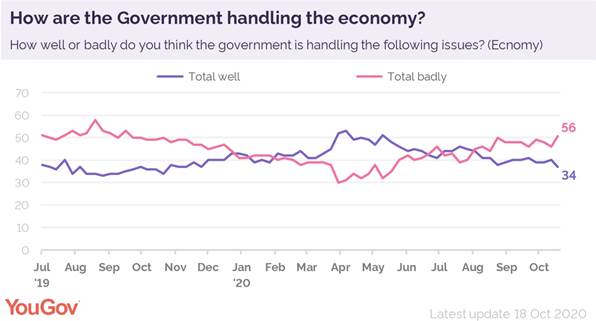
A similar picture emerges around the Government’s economic policies. The majority of Brits (56%) think that the Government is handling the economy badly, while only 34% think it has handled it well. Again, public pessimism has grown over the course of lockdown. It is now a long way from peak approval back in March, when 52% thought the Government was handling the economy well.
When asking Brits which political party would be best at handling unemployment, a third (33%) opt for Labour and just 24% the Conservatives. More people said Labour were best on this issue than the Conservatives for the first time this year in late June and the gap has continued to grow since then, correlating with a decrease in approval of the Government on the issue.
While this may be positive news for Keir Starmer, traditional party lines still hold true when it comes to the economy. Some 37% of Brits believe that the Conservative Party would still be the best at handling the economy, with a smaller portion of 21% choose Labour. The trend over the past few months for this issue has been a lot flatter, with similar proportions picking the Conservatives and Labour in each of our tracking polls since June.
(YouGov)
October 23, 2020
661-662-43-12/Poll
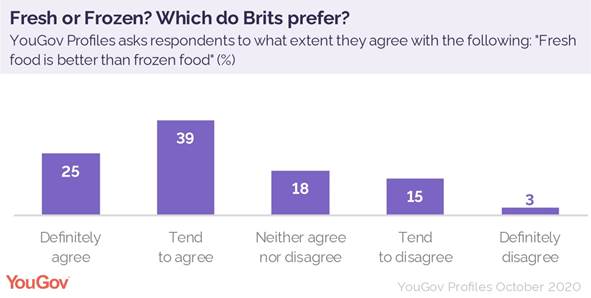
Fresh versus Frozen, which Brits prefer which?
A new YouGov Profiles study
compares Brits who prefer fresh foods, and those who opt for frozen
Frozen foods offer longevity and convenience, but others prefer their foods fresh. YouGov Profiles lets us explore which Brits prefer each type, who they might be, and where their attitudes on foods differ.
Overall, a quarter (25%) of Brits definitely agree with the statement that “fresh food is better than frozen”, while at the other end of the scale, 3% say they definitely disagree with the statement.
Breaking these two groups down by age shows that older Britons tend to say that they disagree and that frozen foods are better than fresh, while younger adults are more likely to think fresh foods are better. For example, 30% of adults who prefer fresh foods are aged 25-39, compared to 19% of those who prefer frozen and fall into the same age bracket.
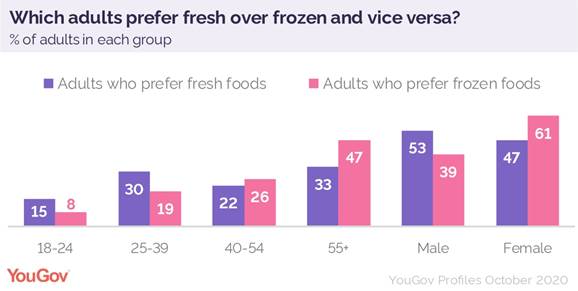
Alternatively, 47% of Brits who prefer frozen over fresh are aged over 55, while only 33% of those who prefer fresh are of the same age.
When it comes to gender, there is a slight split among Brits who prefer fresh foods, with 53% being male and 47% being female. For adults who prefer frozen, the gap is more substantial, with 61% of the adults who disagreed with the original statement that fresh foods are better being female, compared to 39% who are men.
YouGov Profiles also shows that adults who prefer frozen are also much more likely to say that frozen foods offer better value for money (68%) than those who opt for fresh foods (49%).
Profiles also shows the half (52%) of Brits who prefer fresh foods are still willing to stock up on frozen foods when they are on sale compared to 63% of those who prefer frozen foods who say they do the same.
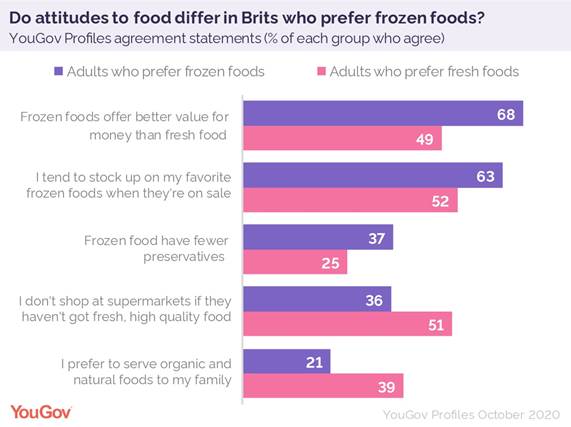
Brits who say frozen foods are better are also more likely to say that frozen foods have fewer preservatives (37%) compared to those who prefer fresh (25%), as well being less likely to avoid shops that don’t offer fresh foods (36%) compared to half (51%) of Brits who prefer fresh and would do so.
(YouGov)
October 23, 2020
661-662-43-13/Poll
3 in 10 Britons are worried about paying their rent or mortgage
In a new survey by Ipsos MORI, 3 in 10 Britons say they are concerned about paying their rent or mortgage at the moment (30%), and a similar proportion (31%) are worried about these payments in 12 months’ time.
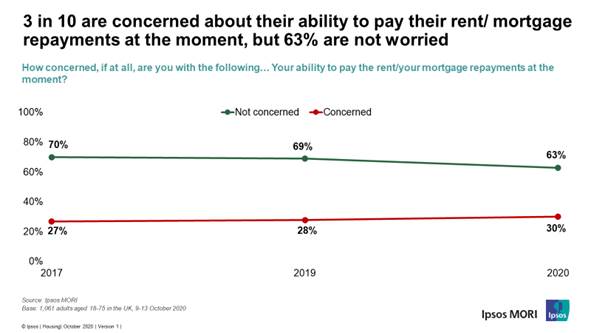 While a majority are not concerned
about their housing payments at the moment (63%), this
has fallen from 69% last year and a similar level in 2017. At the same time,
lack of concern about payments in 12 months’ time has fallen from 67% in 2019
to 60% now.
While a majority are not concerned
about their housing payments at the moment (63%), this
has fallen from 69% last year and a similar level in 2017. At the same time,
lack of concern about payments in 12 months’ time has fallen from 67% in 2019
to 60% now.
Levels of concern are highest amongst private renters, 43% are very or fairly concerned about paying their rent now, compared to 39% of social renters and 35% of mortgage-holders. There are though similar levels of worry about paying housing costs in 12 months’ time; this rises five points among those with a mortgage to 40% and is 39% among social renters, 41% of private renters.
Reflecting patterns in tenure, concern is highest in London. Around 4 in 10 in the capital are worried about making payments, 39% at the moment and 38% in 12 months. Those in Wales and the Midlands are least concerned currently (23% and 25% respectively) and for the future (25% and 27%).
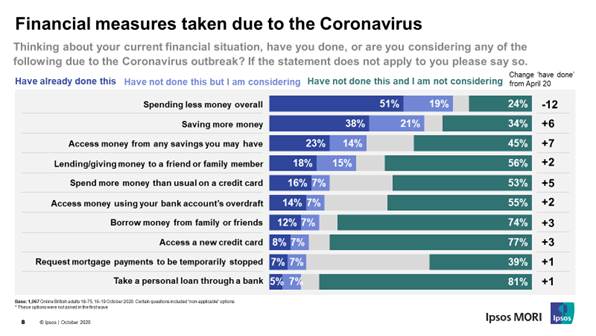
The survey also found half of Britons saying they are spending less money overall (51%), however this has dropped 12 percentage points since April, perhaps due to the lifting of the national lockdown in May and more opportunities to spend. But while four in ten (38%) say they have saved more money generally – up 6 percentage points since April – almost a quarter (23%) have accessed money from their savings (up from 14% 6 months ago). Sixteen per cent are spending more money using a credit card, an increase from 11%.
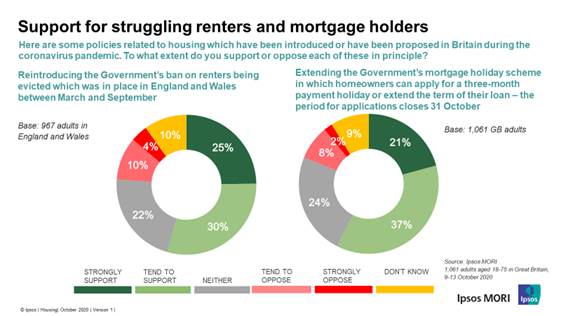
 Almost
6 in 10 (58%) across Britain are in favour of
extending the Government’s mortgage holiday scheme, while in England and Wales
54% want to reintroduce the Government’s ban on renters being evicted, which
ended in September.
Almost
6 in 10 (58%) across Britain are in favour of
extending the Government’s mortgage holiday scheme, while in England and Wales
54% want to reintroduce the Government’s ban on renters being evicted, which
ended in September.
 Ipsos MORI’s Ben Marshall
(Research Director) said:
Ipsos MORI’s Ben Marshall
(Research Director) said:
Previous Ipsos MORI research
has shown younger age groups and private renters have had an especially tough
time during Covid. This is further underlined in our
latest survey with renters more worried about falling behind on housing costs
than mortgage-holders in the short-term.
In August we found national opinion split on whether it was right to end the
furlough scheme in October. Now, against a backdrop of tightening restrictions
and further economic shocks, most people support the reintroduction of
protection for private renters from eviction and extending the mortgage holiday
scheme too.
(Ipsos MORI)
October 23, 2020
Source: https://www.ipsos.com/ipsos-mori/en-uk/3-10-britons-are-worried-about-paying-their-rent-or-mortgage
661-662-43-14/Poll
Snap poll: 72% of English people back Prime Minister’s plan to return to lockdown
Three in ten still don’t
think the measures go far enough
Yesterday evening prime minister Boris Johnson announced plans to put England in a new coronavirus lockdown, similar to that the nation went through at the beginning of the crisis in March.
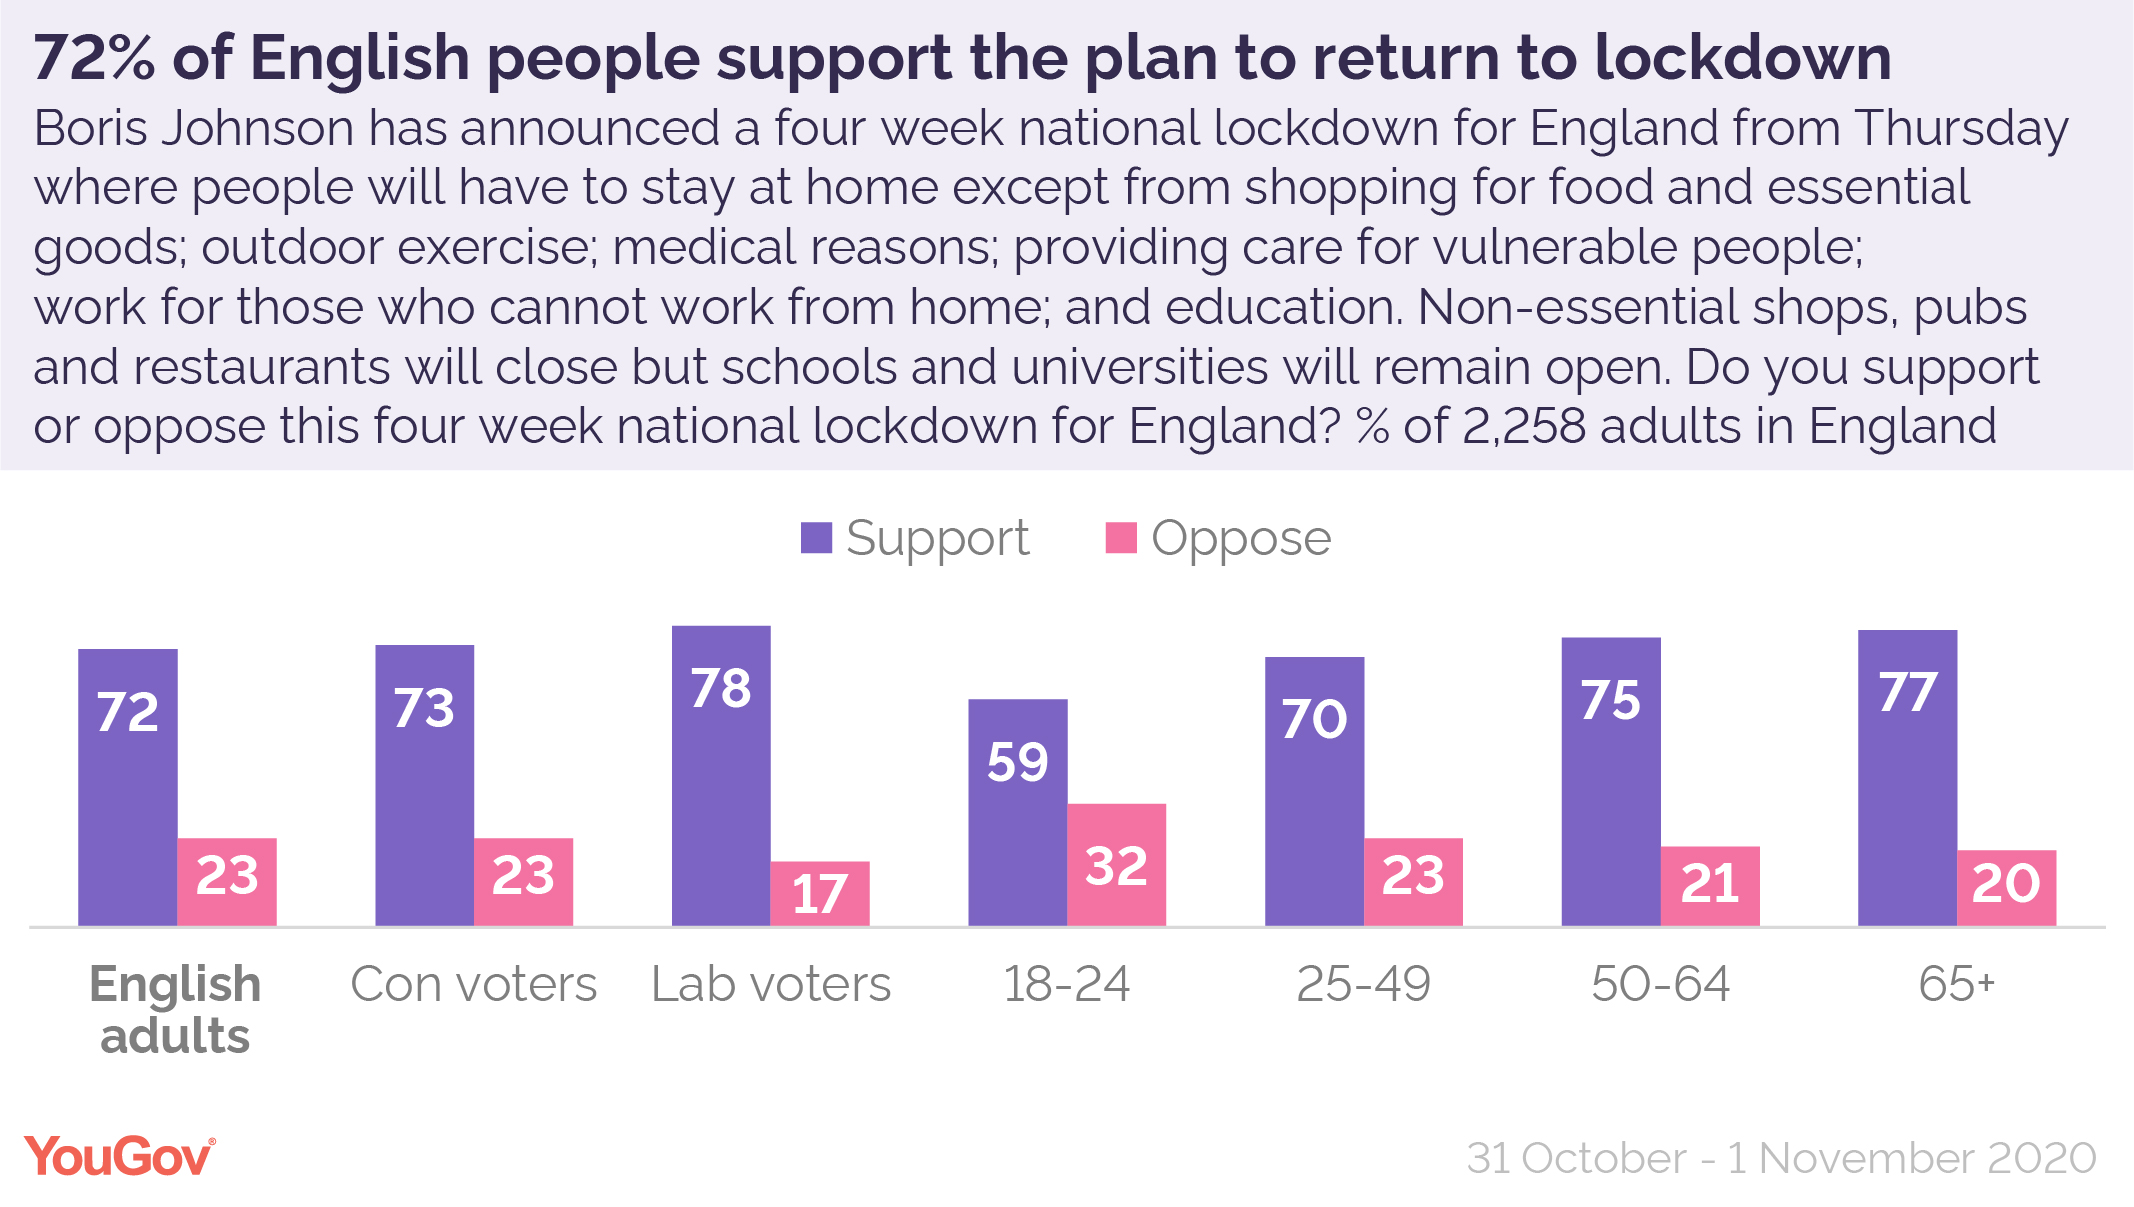
A snap YouGov poll, conducted last night and this morning, reveals that almost three quarters of English people (72%) support returning the country to lockdown, including 42% who say they “strongly support” doing so. Fewer than one in four Britons (23%) oppose the move.
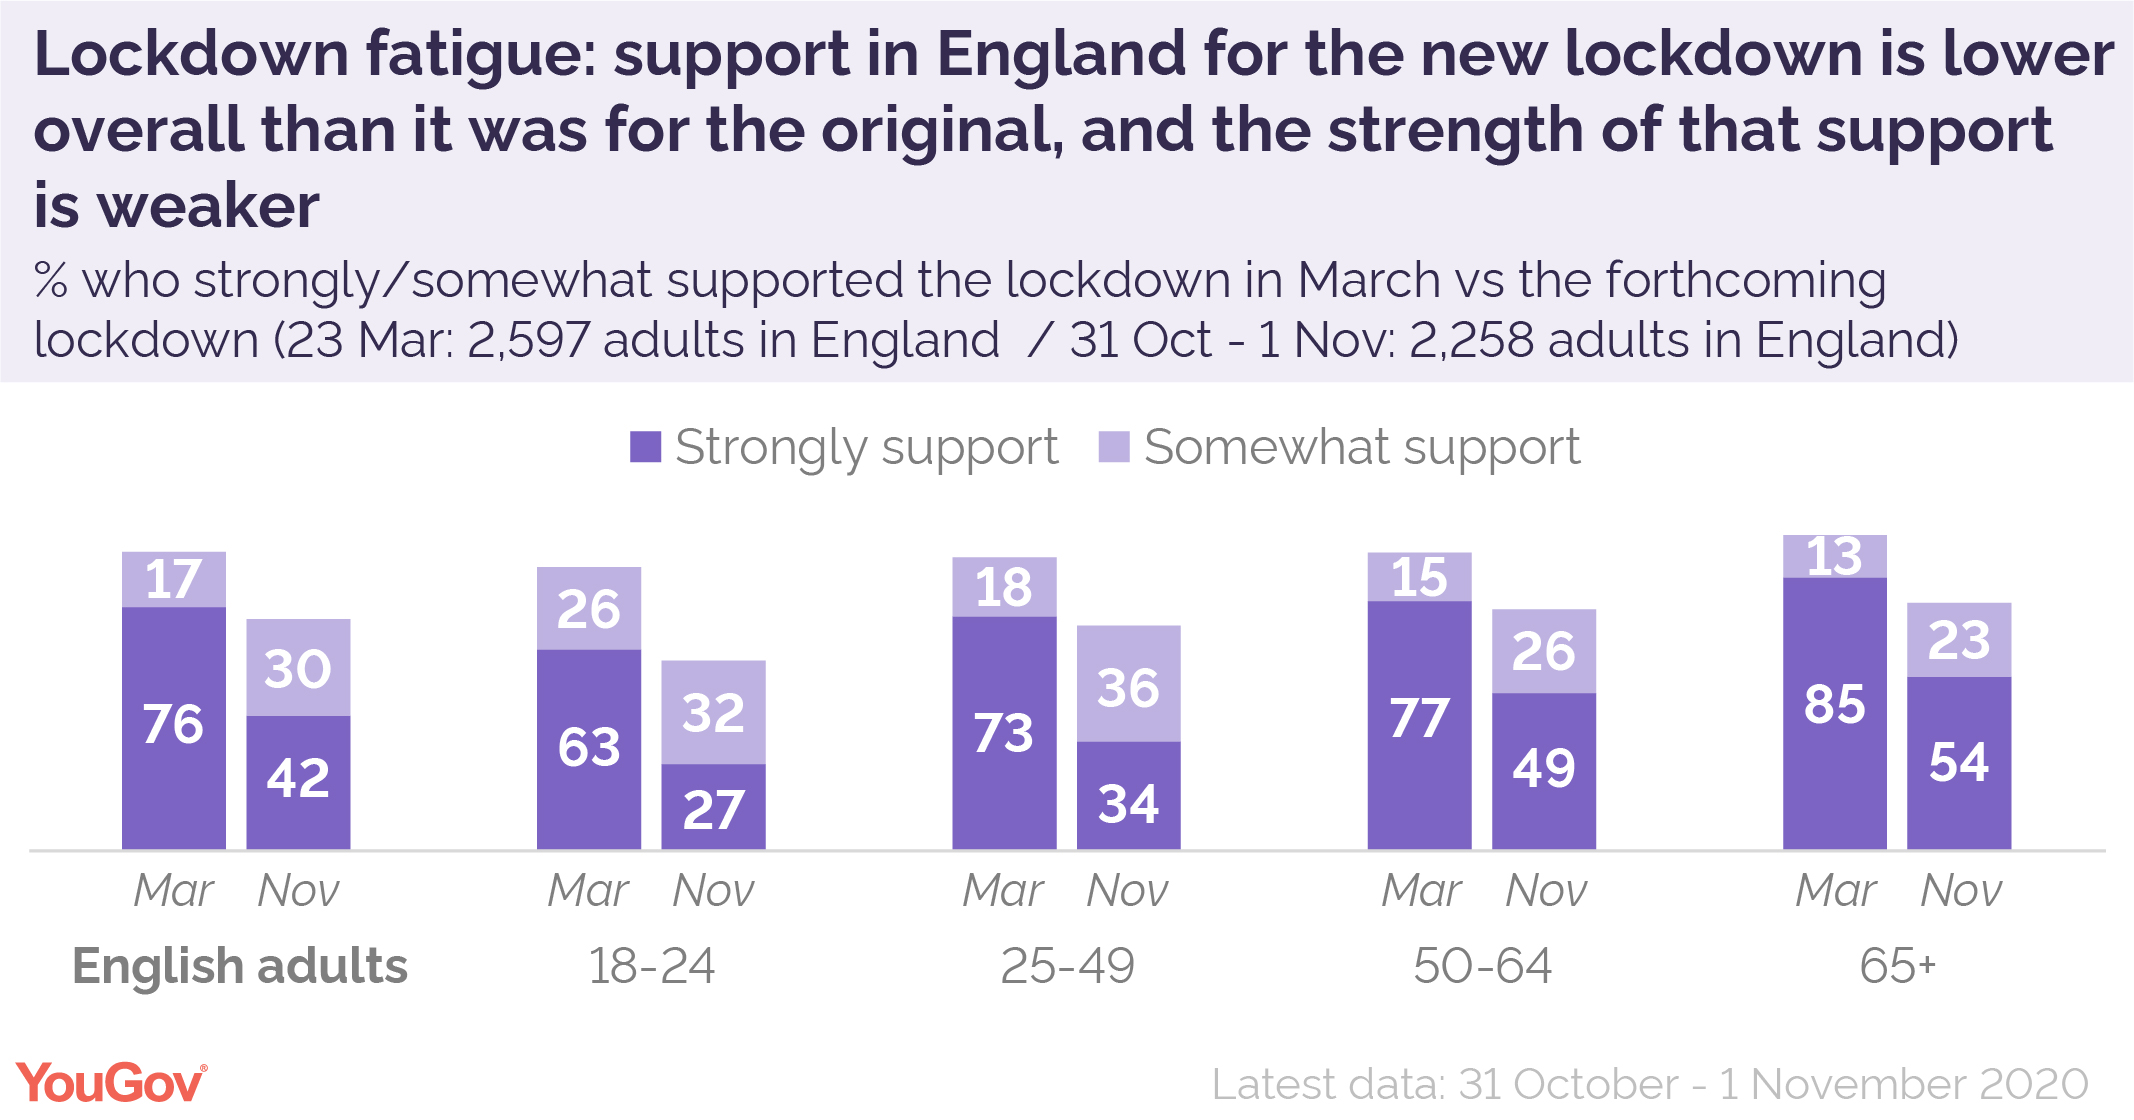
The result does show signs of lockdown fatigue when compared to earlier in the year. When the first lockdown was announced fully 93% of English people were in support, including 76% who said they “strongly supported” the measure. Back then, just 3% were opposed.
This drop in support is highest among the young. A relatively low 59% of 18-24 year olds back the new lockdown, down from 88% in March. One in three young people (32%) are opposed. By comparison, support is 70% among 25-49 year olds (down from 91%) and 77% among those aged 65 and above (down from 98%).
The new lockdown will commence on Thursday, assuming that MPs give their support in a vote on Wednesday.
English people are split on the scale of the measures. The most widely-held view is that the government has got the balance about right (41%), but 30% think the measures announced still don’t go far enough in tackling the problem, and 20% think they go too far.
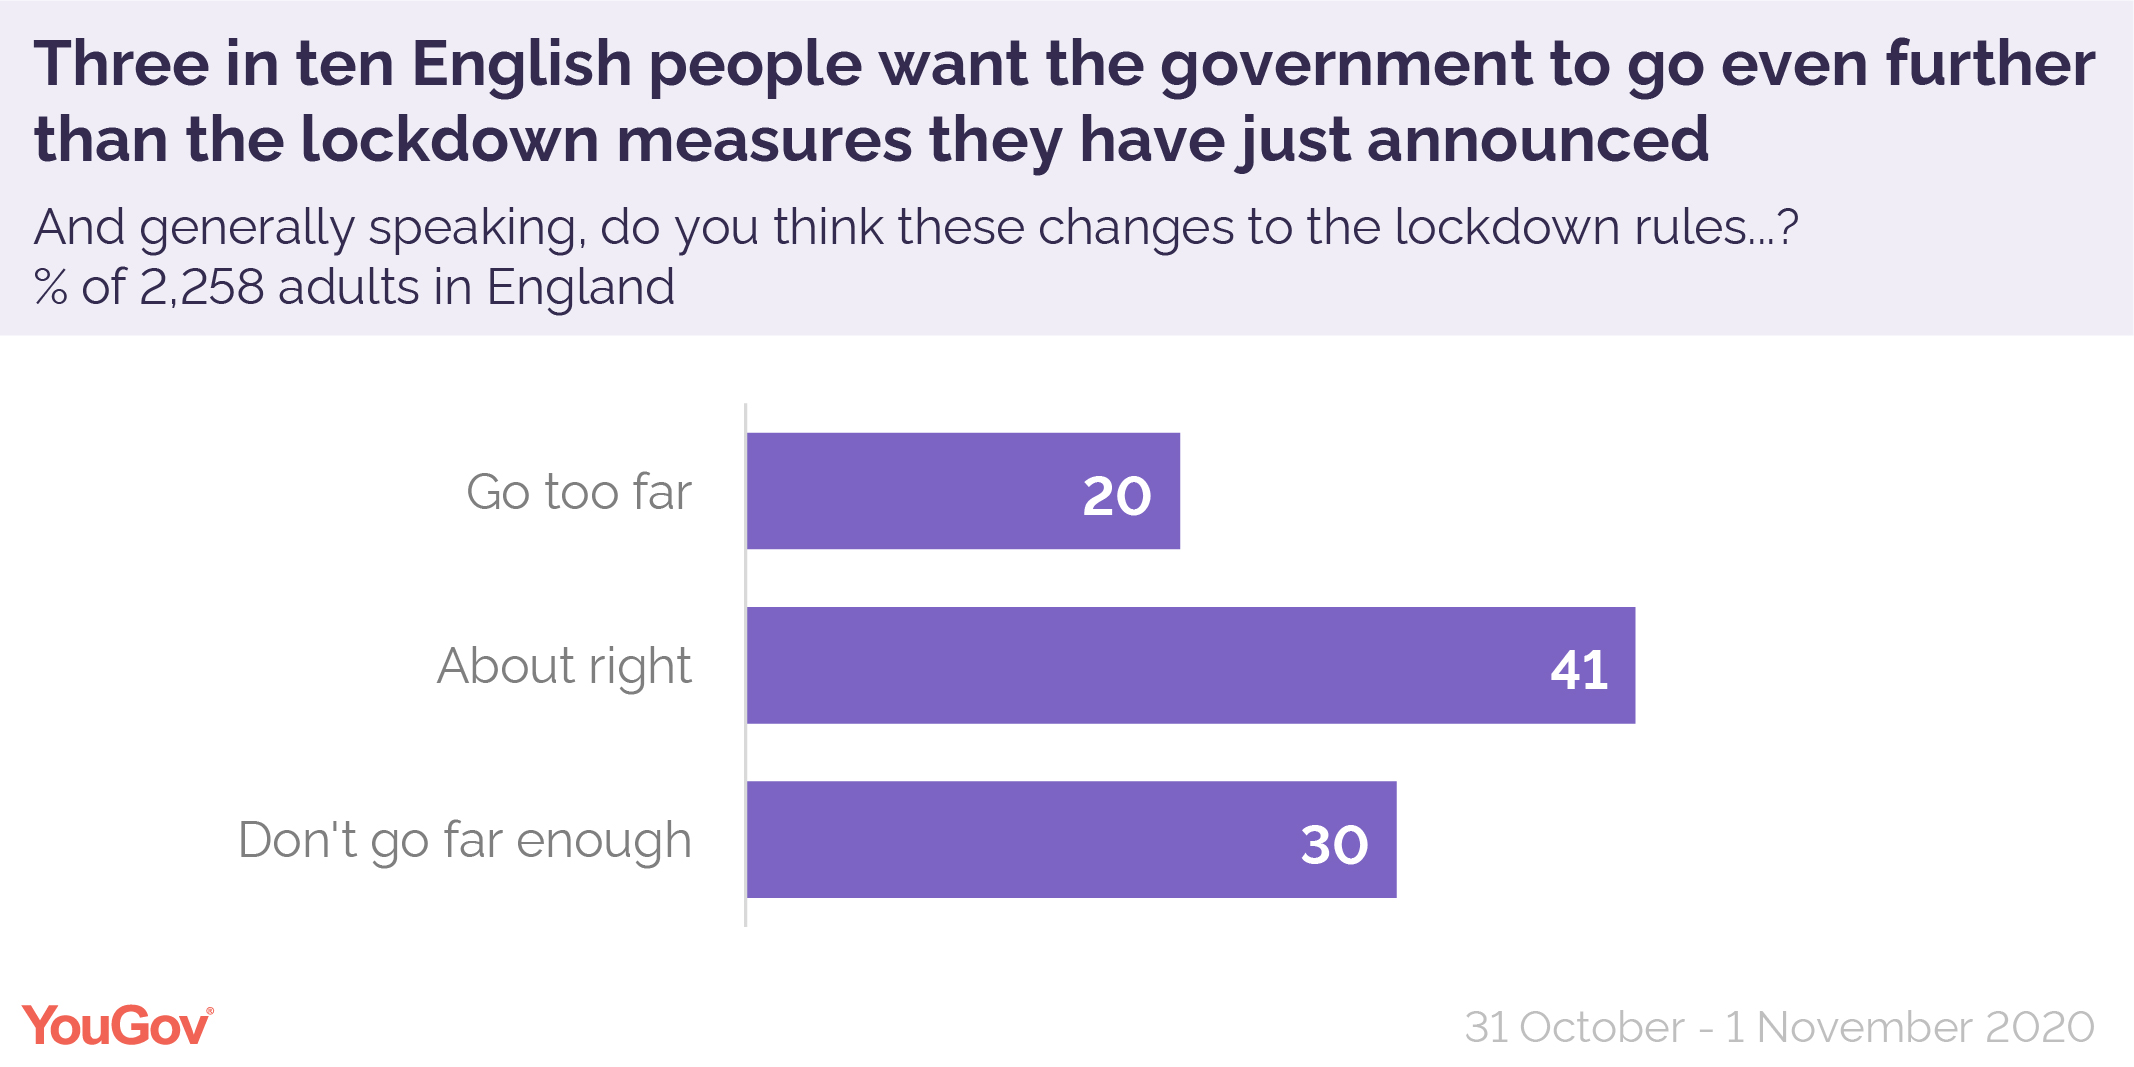
Labour voters are split between thinking the measures are about right (39%) and not thinking they go far enough (41%). Conservative voters are much more likely to think the measures are about right (48%) than either of the other options.
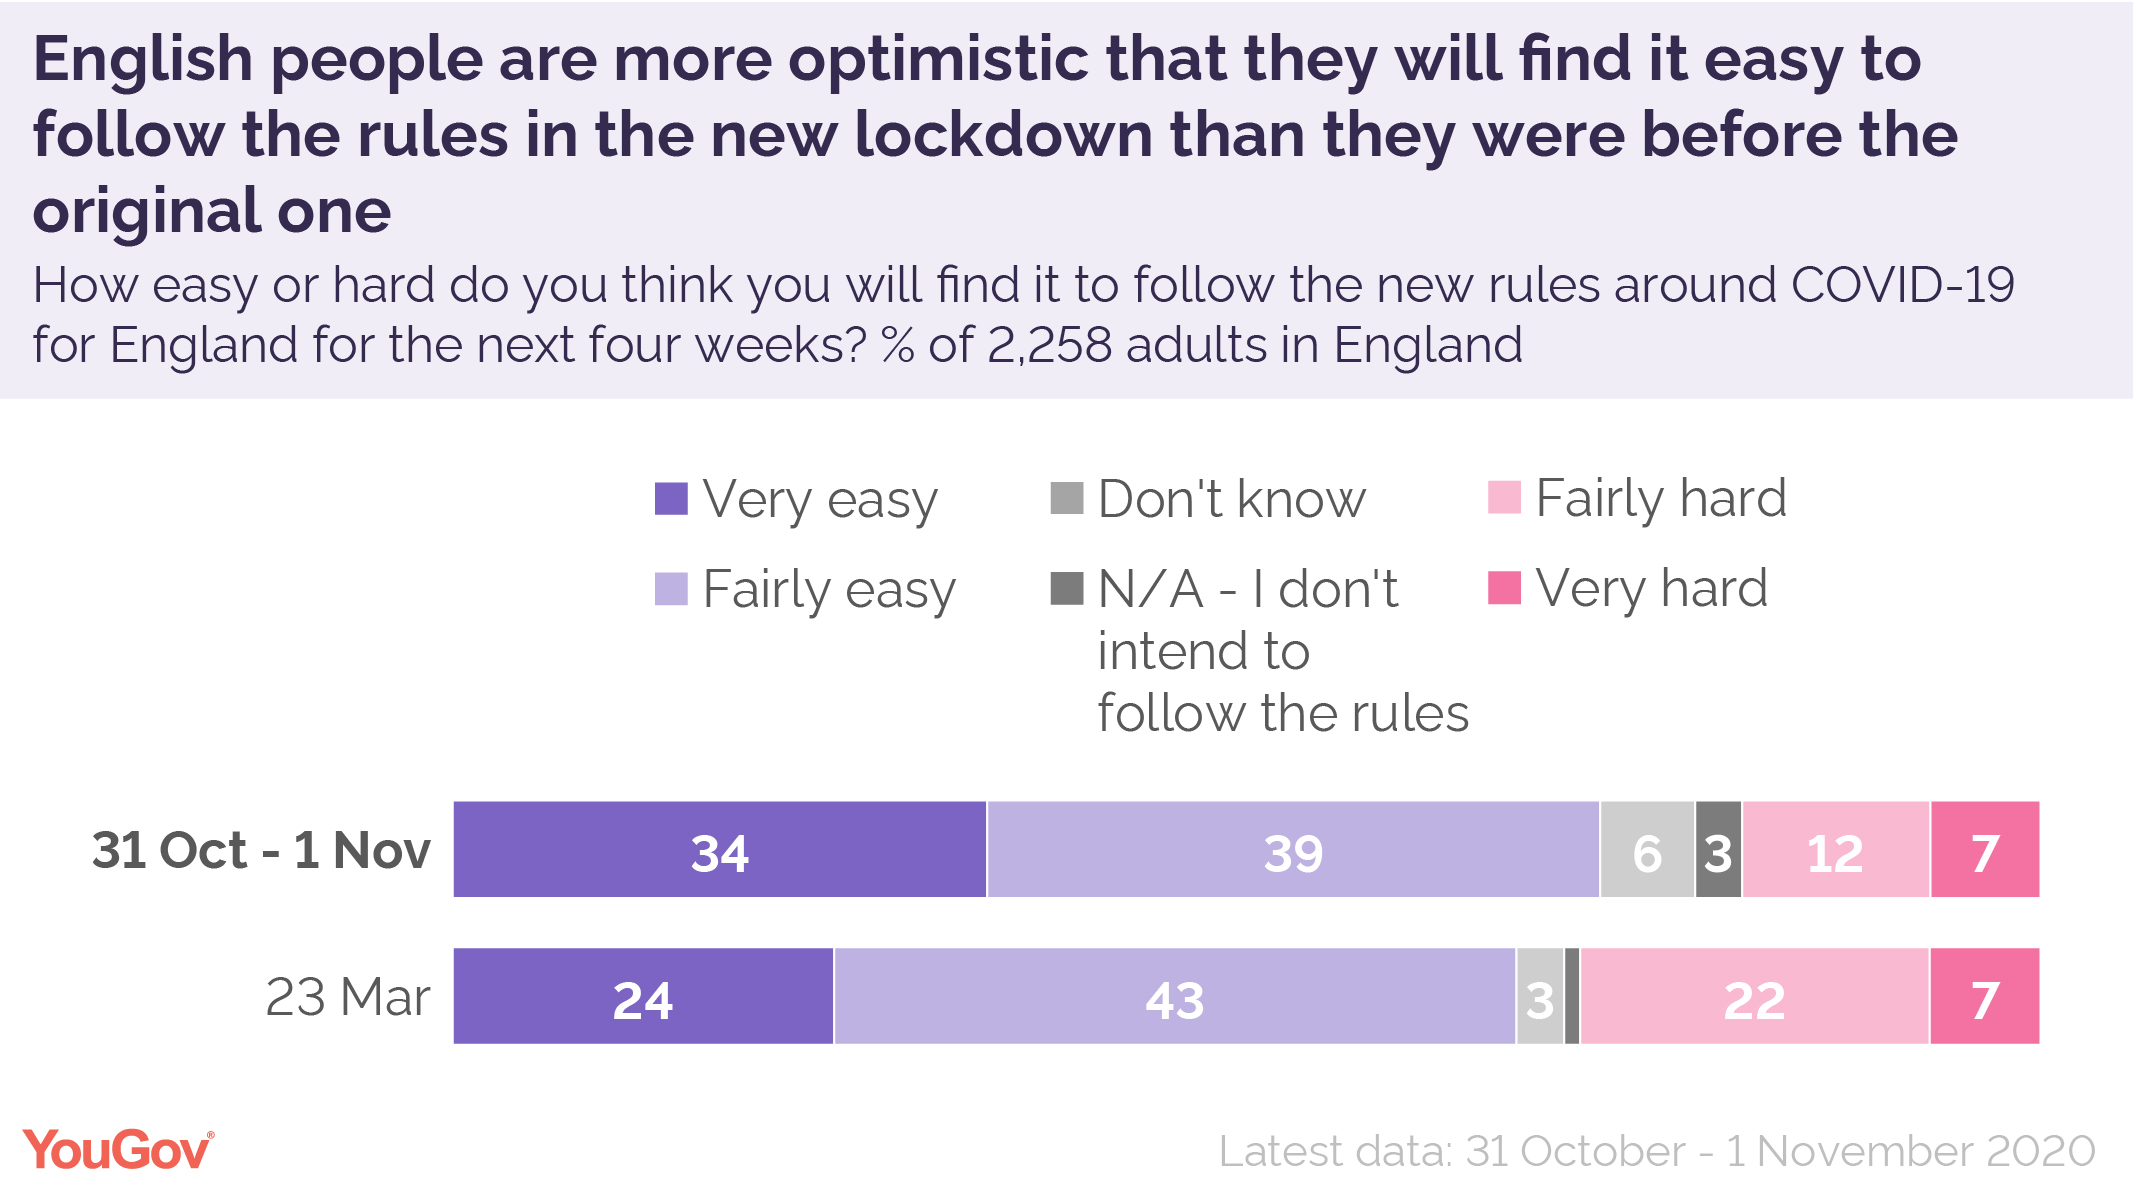
Most English people (73%) tend to think it’ll be easy enough to follow the new rules for the next four weeks. Only 19% think it will be hard work.
This is actually a more optimistic view than first lockdown, when 67% of English people thought it would be easy to follow the rules. This could indicate that the experience of going through the first lockdown has reassured many English people about their capacity to get through this next one.
(YouGov)
November 30, 2020
661-662-43-15/Poll
Public support for a two week lockdown persists
One of the most surprising
things about public opinion during the coronavirus crisis is just how
supportive people have been of lockdown restrictions.
Back in March we saw almost universal support for the first full lockdown, with 93% of the public saying they were in favour of the decision. This level of support is unheard of in public opinion research. In fact, after searching our archives, the only policy we could find that came close to matching this level of support was “planting more trees”.
The public proceeded to support each extension of the full lockdown, content with the new lockdown life. This support for restrictions coincided with high approval for the Prime Minister and his government’s handling of the crisis.
Convincing the public to relax was trickier for the government. While the Eat Out to Help Out scheme was popular, the public were still reluctant to return to their normal life. Indeed, we found in September that just 44% of the public had been to a pub since the restrictions were lifted in July.
Now, in the midst of a second wave, government approval is low, there is confusion over what rules apply where, and the devolved governments have diverged on policies. One thing persists though, public support for lockdown policies.
Recent data looking at a range of different restrictions shows overwhelming support for rules on wearing masks (89%), working from home where possible (87%) and gatherings of no more than 6 (77%). There is also more modest, but still majority, support for more restrictive measures such as banning households from mixing indoors (58%) and a full closure of pubs and restaurants (53%). Where the public do draw the line is on schools, with 56% opposed, although even almost four in ten (39%) are in support.
All these individual measures are one thing, but with Wales currently in their ‘firebreak’ lockdown and talks of a similarly dramatic sounding ‘circuit breaker’ in England, where do the public stand on another full lockdown? In short, they support it. Our latest polling on a two-week full lockdown show that two thirds (67%) would be in favour of this decision, with a quarter (26%) opposed. While this is less support than we saw for the initial restrictions in March, it is still a very strong endorsement of such a restrictive policy.
At a personal level, the public also report that they are continuing to stick to the rules. In fact, four in 10 Brits claim to be taking measures beyond the government rules, with a further 50% saying they are sticking to the government rules. Just 7% of Brits say they are not sticking to all the rules in place.
As things currently stand, the public are even against lifting restrictions for Christmas Day. Fully 49% oppose such an idea, compared to 36% who would prefer a pause on restrictions during the festivities. Indeed 68% of the public think they would be able to abide to the ‘rule of six’ on Christmas Day if it was required to tackle the virus. Time will tell whether the mood changes once the big day approaches.
One issue the government has found when implementing policy is how best to juggle the competing priorities of healthcare and the economy. The public, however, are firmly in the healthcare camp, which goes someway to explaining their continued support for lockdown measures. Four in ten (38%) think the government is currently focussing too much on the economy, compared to just 16% who say they are focussing too much on healthcare.
While a national lockdown would be received positively by the public, they do tend to favour a local approach within each of the four nations. Half (51%) say that lockdown rules should differ in areas depending on local circumstances, compared to 34% who would prefer a blanket policy. Opinion differs by geography though, with the North split on whether a local or national approach would be better and the South firmly in favour of it being decided area by area.
Problems are undoubtedly mounting for the government, with both cases and deaths rising across the country, and as more areas begin to move into Tier 3 restrictions in the coming weeks, we may find support for a national lockdown starting to increase too.
(YouGov)
October 30, 2020
NORTH AMERICA
661-662-43-16/Poll
U.S. Catholics Have Backed Same-Sex Marriage Since 2011
Pope Francis recently said he supports legalizing civil unions for gay couples. Most U.S. Catholics believe same-sex unions should be legal -- only they go further than the pope and support marriage for same-sex couples. A majority of Catholics have consistently approved of gay marriage in Gallup polling since 2011, with an average 59% approving from 2011-2015, rising to an average 69% since 2016.
U.S. Catholics' support for gay marriage has consistently exceeded the national average by five or more percentage points since the 2000s.
U.S. Catholics' Support for Legal Same-Sex Marriage, 2006-2020
Do you think marriages between same-sex couples should or should not be recognized by the law as valid, with the same rights as traditional marriages?
|
U.S.
Catholics |
National
adults |
Difference |
|
|
% Should be valid |
% Should be valid |
(pct. points) |
|
|
2006-2010 |
49 |
42 |
+7 |
|
2011-2015 |
59 |
54 |
+5 |
|
2016-2020 |
69 |
64 |
+5 |
|
Figures only shown from Gallup's annual Values poll, conducted in May of each year |
|||
|
GALLUP |
|||
Civil unions for same-sex couples are, and have been, allowed in some countries as well as some U.S. states in lieu of the legal distinction of marriage. In most cases, civil unions allow many of the same benefits as marriages, but not all. Civil unions remain as legal options for couples in five U.S. states after the U.S. Supreme Court's 2015 Obergefell v. Hodges decision making same-sex marriage legal nationwide. Other states that once allowed civil unions have since converted these arrangements to legally recognized marriages.
Support for same-sex marriage among Americans as a whole has grown since Gallup began asking about it in 1996. Today, two in three U.S. adults (67%) say marriages between same-sex couples should be recognized by the law as valid, matching the previous high Gallup measured in 2018.
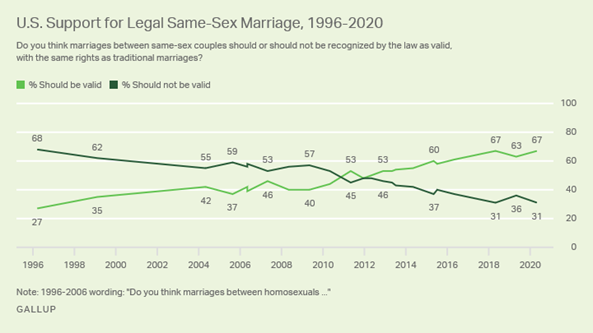
Line graph: Americans' views of whether marriages between same-sex couples should or should not be recognized by the law as valid, with the same rights as traditional marriages, since 1996. Currently, 67% say marriages should be legal and 31% say they should not. This is roughly the opposite of what it was in 1996.
Lower Support Among Frequent Catholic Churchgoers
From 2016 to 2020, Gallup found that the more often a Catholic attends church, the less likely they are to support legal recognition of same sex marriage.
A small majority (56%) of Catholics who report attending church weekly support gay marriage, compared with two in three Catholics who attend church nearly weekly or monthly (67%). In contrast, 78% of Catholics who say they seldom attended mass support it.
Meanwhile, 56% of Catholics who say that religion is "very important" to their life support same-sex marriage, while 78% of Catholics who say religion is "fairly important" support it. Eighty-seven percent of Catholics who say religion is "not very important" to their lives support gay marriage.
Bottom Line
Catholics, who constitute more than a fifth of U.S. adults, have been consistently more supportive of same-sex marriage than the population as a whole over more than a decade -- much like young adults and Democrats.
Francis' comments are unprecedented for a pontiff but will likely make little difference on the issue in the U.S., where same-sex couples have enjoyed full marriage rights and protections since 2015. Politically, the issue is largely a moot point, with no serious efforts being made to overturn that right by lawmakers. However, recent statements made by two U.S. Supreme Court justices suggest that the right of marriage license issuers to deny a license to same-sex couples could be revisited -- potentially reigniting an issue once considered settled law.
From a global perspective, Francis' new stance on civil unions could potentially be more influential in countries where gay rights are less accepted and LGBT citizens can be legally discriminated against.
(Gallup USA)
October 23, 2020
Source: https://news.gallup.com/poll/322805/catholics-backed-sex-marriage-2011.aspx
661-662-43-17/Poll
56% of U.S. Voters Say Trump Does Not Deserve Reelection
The majority of U.S. registered voters, 56%, believe President Donald Trump does not deserve to be reelected, while 43% say he does. Voters are even less likely to think "most members of Congress" deserve reelection (29%), although six in 10 say their own House member does.
Views on Elected Officials' Deservedness of Being Reelected
Please tell me whether you think each of the following political office-holders deserves to be reelected, or not. How about ... ?
|
Yes, deserves |
No, does not |
No opinion |
|
|
% |
% |
% |
|
|
The U.S. representative in your congressional district |
60 |
35 |
5 |
|
President Donald Trump |
43 |
56 |
1 |
|
Most members of Congress |
29 |
68 |
4 |
|
Based on registered voters in the U.S. |
|||
|
GALLUP, SEPT. 30-OCT. 15, 2020 |
|||
These data are from a Sept. 30-Oct. 15, 2020, Gallup poll.
The percentage of voters who say Trump deserves reelection to a second term is down seven percentage points from Gallup's previous measure in January -- a much different time in Trump's presidency, when confidence in the U.S. economy was high, the Senate was preparing to vote to keep Trump in office during his impeachment trial, and only a few cases of COVID-19 had been confirmed in the U.S.
The percentage of voters who currently say Trump deserves to be reelected matches his latest overall job approval rating from the same poll. Gallup's previous measures of Trump's reelection deservedness were each within three points of his approval rating, and the significance to reelection is clear. As Gallup reported in May: "Historically, all incumbents with an approval rating of 50% or higher have won reelection, and presidents with approval ratings much lower than 50% have lost."
As would be expected, nearly all Republicans (93%) say the president deserves to be reelected, while few Democrats (3%) agree. Among independents, 36% say Trump deserves reelection and 61% say he does not.
House Representatives Viewed as More Deserving in Presidential Election Years
Six in 10 registered voters say their own district's House representative deserves to be reelected -- similar to what Gallup found in the recent presidential election years of 2012 (59%), 2008 (59%) and 2004 (63%).
Since 2006, voters have been more likely to support the reelection of their own member of Congress in presidential election years (59%, on average) than in midterm elections (52%). This aligns with the more mercurial nature of midterm elections -- which, particularly recently, have been wave elections for the president's opposition party.
Voters are much less likely to view "most members of Congress" as deserving of reelection as they are their own district's member. The current 29% saying most members deserve another term is not the lowest final preelection reading Gallup has found. Still, from a longer-term perspective, voters have become less likely to view most members as deserving of reelection over time -- paralleling Congress' sinking approval ratings.
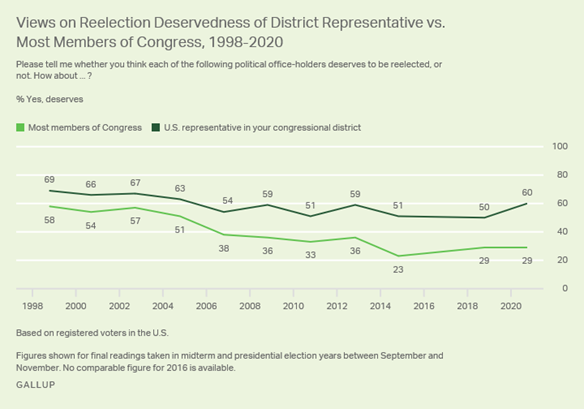
Line graph. Americans views on whether their personal U.S. House Representative and most members of congress deserve re-election. 60% of Americans say their own representative deserves re-election, while 29% indicate most members of congress deserve re-election.
There is little daylight between Republicans' (70%) and Democrats' (65%) views on whether their representative deserves reelection, while less than half of independents (47%) agree.
Among both Republicans and Democrats, 32% say that most members of Congress deserve reelection, while a smaller 23% of independents say the same.
Bottom Line
Trump secures small majorities of support for his handling of the economy and his recent U.S. Supreme Court nomination, but the current percentage of voters who see him as deserving of a second term falls short of the 50% mark less than two weeks away from Election Day.
With little time left and many Americans voting early, this could pose a challenge for Trump's prospects in November. The president's last best chance to sway voters in his favor may be in Thursday's final presidential debate -- though historically, debates have rarely changed voter preferences.
(Gallup USA)
October 22, 2020
Source:
https://news.gallup.com/poll/322340/voters-say-trump-not-deserve-reelection.aspx
661-662-43-18/Poll
More Voters Than in Prior Years Say Election Outcome Matters
A record-high percentage of U.S. voters say the outcome of this year's election matters more to them than prior elections did. The 77% of registered voters holding this view is up six percentage points from 2016 and is the highest in Gallup's trend dating back to 1996.
While few voters (2%) say the election matters less than in the past, 21% think it matters about the same.
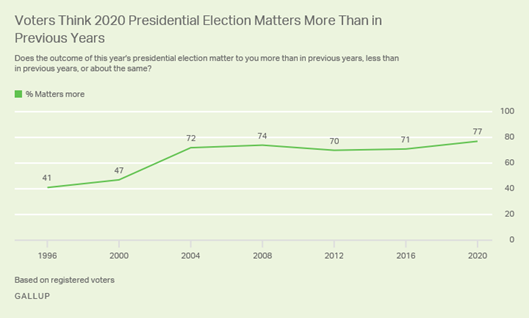
Line graph. Registered voters' belief that the outcome of this year's presidential election matters more than in previous years since 1996. It is currently 77%, the highest on record and up six points since 2016.
These findings, from a Sept. 14-28 poll, mark the seventh consecutive presidential election in which Gallup has tracked this measure. The previous six readings were taken closer to the election date, but this should not be of consequence given that more voters than ever in U.S. history are voting early this year, either in person or by mail as a result of the coronavirus pandemic.
Since 2004, at least seven in 10 voters have regarded each election as more consequential than those before it. However, far fewer voters considered the 1996 and 2000 elections as mattering more than the previous election, as 41% and 47%, respectively, said as much. This shift may have been a result of the 2000 election when the outcome of the election was ultimately decided by the U.S. Supreme Court after close vote totals in Florida necessitated a recount.
Partisans' Views of Election Depend on Which Party Is in Power
While broad majorities across the political spectrum say this year's election is more important, Democrats are slightly more likely than Republicans to say so -- 85% vs. 79%. Independents (69%) are less likely to say this year's election matters more, as is typically the case. Democrats' current reading is the highest on record for the party and is up 16 points from 2016 -- and it matches Republicans' views in 2012 when President Barack Obama was up for reelection. Republicans' views on the election are unchanged from 2016.
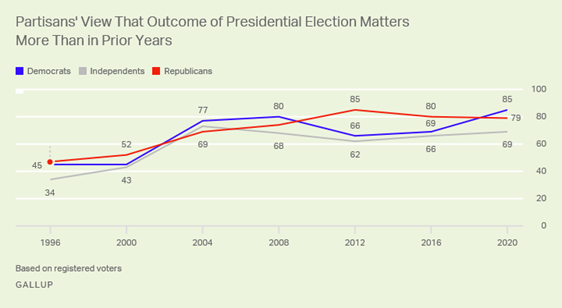
Line graph. Partisan registered voters' belief that the outcome of this year's presidential election matters more than in previous years since 1996. Currently, 85% of Democrats, 79% of Republicans and 69% of independents say this election matters more.
Partisans' views of how much each election mattered have varied based on the sitting president's party. That is, in every year that a Republican president was in the White House, Democrats were more likely than Republicans to say they thought the election mattered more than those prior. Likewise, each year the sitting president was a Democrat, Republicans were more likely to say the election mattered more.
Partisan Voters' Views That Election Outcome Matters More Than Past Depends on Sitting President's Party
% Saying election matters more
|
Democrats |
Republicans |
Advantage |
Party of sitting
president |
|
|
% |
% |
pct. pts. |
||
|
2020 |
85 |
79 |
D +6 |
Republican |
|
2016 |
69 |
80 |
R +11 |
Democrat |
|
2012 |
66 |
85 |
R +19 |
Democrat |
|
2008 |
80 |
74 |
D +6 |
Republican |
|
2004 |
77 |
69 |
D +8 |
Republican |
|
2000 |
45 |
52 |
R +7 |
Democrat |
|
1996 |
45 |
47 |
R +2 |
Democrat |
|
GALLUP |
||||
Turnout Directly Linked to Voters' Belief Election Matters More
Voter turnout has historically followed the same trajectory as the measure tracking how much the election matters. The more intently the electorate has viewed the election as mattering more than prior years, the higher voter turnout has been.
The correlation between Americans' view that the election matters more and voter turnout has been 0.98 since 1996. This is on a scale from -1.0 to 1.0, where a score of 1.0 represents a perfect correlation -- meaning the two figures move at the same rate in the same direction. A score of zero would indicate no correlation, while a score of -1.0 would represent a perfect negative correlation -- meaning the figures move at the same rate in opposite directions.
Voter Turnout Connected With Voters' Belief That Election Matters More
|
This election matters
more |
Voter turnout |
|
|
% |
% |
|
|
2016 |
71 |
60.1 |
|
2012 |
70 |
58.6 |
|
2008 |
74 |
61.6 |
|
2004 |
72 |
60.1 |
|
2000 |
47 |
54.2 |
|
1996 |
41 |
51.7 |
|
GALLUP AND U.S. ELECTIONS PROJECT |
||
In 2008, when voter turnout was at its highest point since 1968 and 61.6% of eligible voters went to the polls, 74% of voters had said the election outcome mattered more to them.
Bottom Line
The 2020 election is unique given that, amid the coronavirus pandemic, early voting is already reaching record-high levels. While some election indicators suggest that this year might not be remarkable in terms of turnout, the latest reading on Gallup's 24-year measure tracking voters' view that the election matters more than in the past suggests that turnout in this year's election could be significantly higher than it has been in recent years. In fact, looking at this measure only, turnout would likely surpass the recent high of nearly 62% citizen participation in 2008.
(Gallup USA)
October 19, 2020
Source:
https://news.gallup.com/poll/322010/voters-prior-years-say-election-outcome-matters.aspx
661-662-43-19/Poll
Americans' Social Distancing Habits Have Tapered Since July
Americans are less likely now than at any point since the early days of the coronavirus pandemic to say they are avoiding events with large crowds (70%), public places such as stores and restaurants (53%) and small gatherings (45%). Though each of these behaviors has changed only slightly from late August, they represent significant declines from mid-to-late July and new low points for each of their respective trends since Gallup's initial March 13-15 reading. Still, the majority are avoiding public places and, in particular, large crowds.
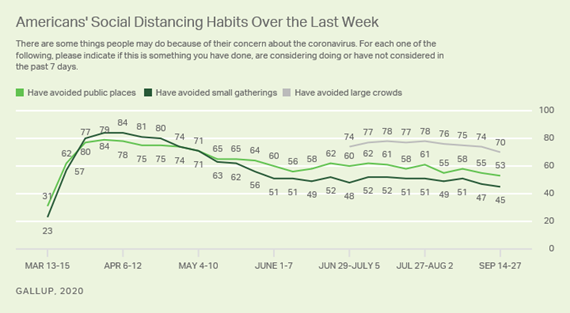
Line graph. Americans' social distancing habits over the last week. 70% of Americans have avoided large crowds. 53% in the U.S. have avoided public places. 45% of Americans have avoided small gatherings.
The latest data are from Gallup's September 14-27 online, probability-based panel survey tracking Americans' attitudes and behaviors related to the pandemic. If the percentage of Americans who avoid small gatherings continues to decline, it may be of particular concern as the holiday season approaches. CDC Director Robert Redfield recently warned U.S. governors that "small household gatherings" are contributing to the current rise in cases in many states and stressed that people should be wary of relaxing their adherence to social distancing guidelines during the holidays.
Asked how often they have practiced social distancing in the past 24 hours, 40% of Americans currently say they have "always" and 32% say they have "very often" done so. The combined 72% is virtually unchanged from the 73% who gave one of these responses in late August, but like the indicators reported above, the trend has tapered somewhat since mid-July.
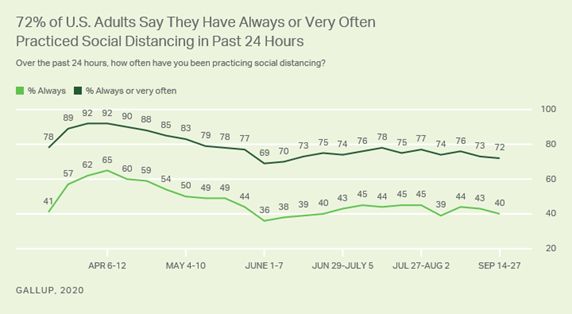
Line graph. Americans' frequency of practice of social distancing in the past 24 hours. 72% of Americans say they have done so always or very often. 40% say of Americans say they have always done so.
Face mask use has leveled off at just over nine in 10 Americans
The prevalence of face masks may be one factor in the recent tapering of Americans' social distancing behaviors. Mask use has become routine for the vast majority of Americans; since mid-July, at least 90% report having worn a mask when outside their home in the past week. Large majorities of Americans across demographic groups like age and political party now say they wear masks in public. A previous analysis from the Franklin Templeton-Gallup Economics of Recovery Study has suggested widespread mask use increases Americans' confidence that they can avoid COVID-19 infection in public places.
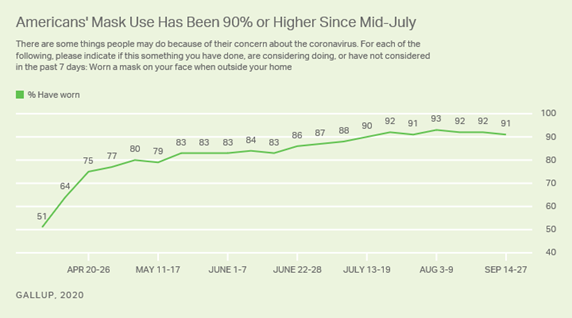
Line graph. The percentages of Americans who have worn masks in the last week. Currently, 91% of Americans say they have used a mask in the last week. Americans' mask use has been at 90% or higher since mid-July of this year.
However, Gallup's tracking polls have also demonstrated that Americans are much more likely to say they wear masks outside the home in indoor settings, such as offices or stores -- where they are often required to do so -- than in outdoor settings when they cannot socially distance.
Implications
As the pandemic has stretched past the six-month mark and precautions like social distancing and mask use have become more habitual parts of daily life, Americans' tendency to avoid contact with others outside their household has waned somewhat, though such practices are still common. The percentage who are largely isolating themselves by avoiding public places and small gatherings reached new lows in the most recent survey.
These trends correspond to others showing that more Americans are resuming some aspects of their pre-COVID routines. For example, one-third of U.S. workers (33%) currently say they are "always" working remotely to avoid coronavirus infections, down from about half (51%) last April.
However, coronavirus cases are currently rising again in much of the U.S. Many public health officials -- including leaders in the World Health Organization -- are hoping to avoid the most socially and economically detrimental responses, such as the lockdowns imposed when the pandemic began last spring. Their ability to deploy less disruptive containment measures may depend in large part on Americans' ongoing adherence to precautionary measures like social distancing and mask use -- even in circumstances such as small family gatherings or outdoor events, where they are not required to do so.
(Gallup USA)
October 19, 2020
Source:
https://news.gallup.com/poll/322064/americans-social-distancing-habits-tapered-july.aspx
661-662-43-20/Poll
Foreign policy experts in the U.S. have much different views about threats to the country than the general public
Foreign policy might not be the primary issue of the 2020 presidential election campaign, but Americans have clear ideas on the various threats facing the United States. Recent Pew Research Center surveys find that Americans are especially concerned about the spread of infectious diseases and are more likely than not to blame China for its role in the current COVID-19 pandemic.
But foreign policy experts have distinctly different perspectives. A September survey of 706 international relations scholars in the U.S. as part of the College of William & Mary’s Teaching, Research and International Policy (TRIP) poll found that their assessment of the current crises facing America and the world are often at odds with those of the U.S. general public.
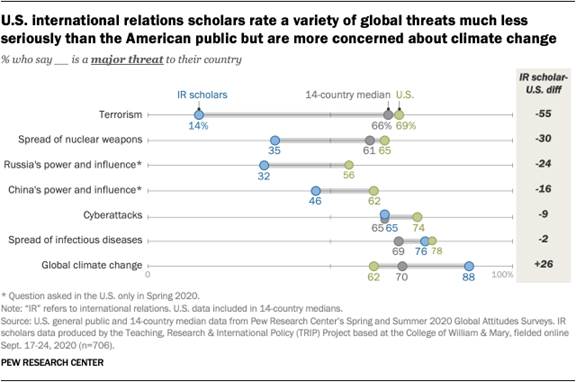
These experts are less concerned about terrorism, more concerned about climate change and much more positive about China’s response to the coronavirus outbreak, even as they are harshly critical of the U.S. response. However, scholars and the American people do agree that U.S. policy should work to promote human rights in China, even at the expense of economic relations.
The scholars also tended to express much less concern about various issues than people in 13 other advanced economies surveyed by Pew Research Center.
How
we did this
Just 14% of the scholars say terrorism is a major threat to the U.S., compared with about two-thirds of the U.S. public (69%), a difference of 55 percentage points. Similarly, a median of 66% across 14 countries say terrorism is a major threat, a much higher reading than among U.S.-based foreign policy academics. And international relations scholars are also much less concerned about the spread of nuclear weapons than both Americans and surveyed general publics.
On the power and influence of Russia and China, a smaller share of the scholars see these as major threats, while the U.S. public is generally much more concerned. There is a 16-point difference between the U.S. general public and the scholars on the threat from China.
Amid the ongoing coronavirus pandemic, foreign policy scholars and the U.S. public are more closely aligned in their concerns about the spread of infectious diseases: 76% of scholars and 78% of the U.S. public say this is a major threat. Across 14 countries surveyed, including the U.S., a median of 69% say infectious disease poses a major threat. The foreign policy scholars overwhelmingly consider the issue of global climate change to be a major threat, while the U.S. public shows less concern. Almost nine-in-ten scholars (88%) say climate change is a major threat, compared with about six-in-ten Americans who say the same (62%), a difference of 26 percentage points. This is in keeping with previous TRIP Project surveys.
Around the world, people in 14 advanced economies, including the U.S., also perceive climate change to be a threat: A median of 70% say climate change is a major threat, making this issue the top perceived threat on this year’s survey.
When it comes to views of global climate change as a threat, Democrats and Democratic-leaning independents are more closely aligned with the scholars in their attitudes: 85% of Democrats and 88% of scholars see climate as a major threat, compared with only 31% of Republicans and Republican-leaning independents. But Republicans are more closely aligned with the scholars in their characterization of Russia as a major threat, with 46% of Republicans saying this in a spring 2020 Pew Research Center survey, compared with 32% of the scholars and 68% of Democrats.

The scholars surveyed differ from the American general public when measuring how various countries and multilateral institutions have handled the coronavirus outbreak. For example, more experts give China high marks for its handling of the pandemic, with 61% saying China did a good job compared with only 31% of the American public saying the same. Across 14 countries, a similarly low median of 37% say China has done a good job of handling COVID-19.
In evaluating the U.S. response, only 3% of the scholars say the U.S. has done a good job of containing the outbreak compared with 47% of Americans who say the same. On this measure, IR scholars are more closely aligned with the view across all 14 nations, who generally see the U.S. response to the virus as poor.
However, on evaluations of the European Union’s and World Health Organization’s responses to the crisis, the general public (in both the U.S. and across 14 advanced economies) are closely aligned with the positive marks that IR scholars give to these institutions.
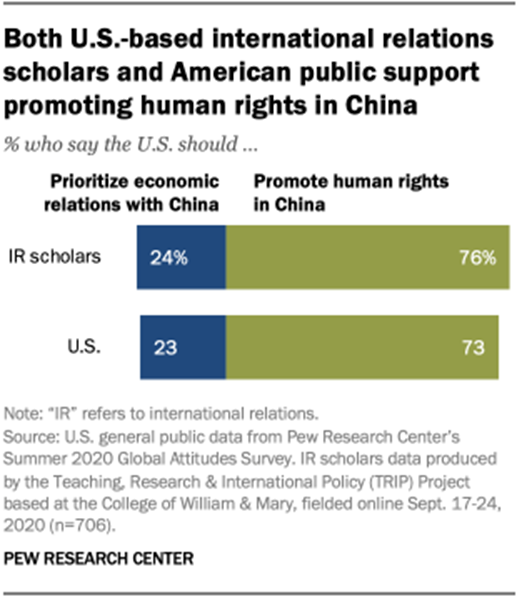
Despite differing quite clearly on China’s handling of COVID-19, scholars and the U.S. public hold similar views concerning priorities for the U.S.-China relationship. About three-quarters among both groups say the U.S. should try to promote human rights in China, even if it harms economic relations between the two countries. In contrast, roughly a quarter of both IR scholars and the U.S. public say that the U.S. should prioritize strengthening economic relations with China, even if it means not addressing human rights issues.
(PEW)
October 23, 2020
661-662-43-21/Poll
Fewer mothers and fathers in U.S. are working due to COVID-19 downturn; those at work have cut hours
The COVID-19 recession has upended the lives of American workers, millions of whom remain without a job despite a recent upswing in hiring. Working parents have faced unique challenges as many schools and child care centers around the United States closed their doors due to the coronavirus outbreak. A new Pew Research Center analysis of government data finds that in the first six months of the pandemic, the workplace engagement of mothers and fathers with children younger than 18 at home has been affected about equally.
The shares of mothers and fathers who are working – employed and on the job – have fallen from 2019 to 2020, but the falloff has been comparable for each group. The shares of mothers who were not in the labor force edged up more than among fathers but, among those at work, fathers appear to have reduced their work hours more than mothers.
How
we did this
Terminology

Earlier studies found that some mothers – more so than fathers – were cutting back on their work hours or taking leave from work at the beginning of the pandemic. But, over the first six months of the outbreak, the labor market impact of COVID-19 has similarly affected mothers and fathers, and the wide gulf that exists in the workplace engagement of mothers and fathers persists virtually unchanged. The share of mothers and fathers who were employed and at work plunged with the onset of the coronavirus outbreak and had recovered only partially through September 2020. The gender gap in September (22 percentage points) is slightly greater than in February (20 points), but a similar gap was also present in September 2019.
Labor market outcomes alone do not capture the full extent of the experiences of parents, such as the loss in leisure time or additional stress as they juggle work, child care and online learning. Given that mothers already assumed greater responsibility for child care than fathers, it is likely that the additional duties during COVID-19 – as many schools, day care centers and summer camps closed, at least temporarily – have fallen more on their shoulders. It is possible that these effects vary across mothers and fathers and that the gender gap on this account may change as the coronavirus outbreak extends its run.
Here are five facts about how labor market activity among women and men with children at home has been affected in the first six months of the COVID-19 outbreak. The focus is on the shares of mothers and fathers who are working – employed and at work – in September 2020 and how that compares with where things stood in September 2019.
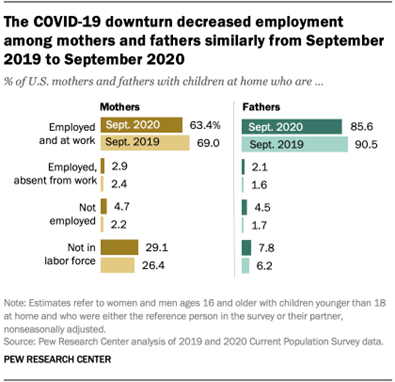
The shares of mothers and fathers who were employed and at work in September 2020 were smaller than in September 2019. Among mothers, this share decreased from 69.0% to 63.4% and, among fathers, it decreased from 90.5% to 85.6% over this period. The drop in the share of mothers working was about the same as the drop among fathers, 5.6 vs. 4.9 percentage points.
Mothers and fathers who are employed but not at work may be absent for a vacation, illness, maternity or paternity leave, child care, and other family obligations, among several reasons. Because vacations or sick leave may also be taken for family reasons, our analysis does not attempt to distinguish among the reasons for absence from work. In September 2020, the share of those absent from work was 2.9% among mothers and 2.1% among fathers. Mothers and fathers experienced the same increase in this share in comparison with September 2019.
The downturn did increase unemployment across the board. Among mothers, the share of the working-age population, ages 16 and older, that was not employed increased from 2.2% in September 2019 to 4.7% in September 2020. Fathers saw a similar rise in the share not employed, from 1.7% to 4.5%.
A key difference between mothers and fathers is in the share who are not in the labor force – neither employed nor actively looking for work. Among mothers, 29.1% were not in the labor force in September 2020, compared with only 7.8% of fathers, a disparity driven in part by child care and other family obligations. This share was higher than in September 2019 among both mothers and fathers, with a slightly greater increase occurring among mothers than fathers (2.6 vs. 1.6 percentage points).
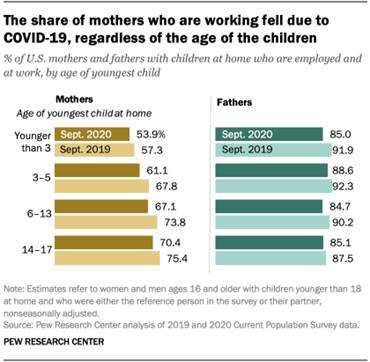
Among mothers, those with children ages 3 and older experienced a slightly greater decrease in the share employed and at work; among fathers, the decrease in this share was greater among those with children younger than 3. Reflecting the gender gap in childcare, mothers with children younger than 3 are less likely to be at work. In September 2020, 53.9% of these mothers were employed and at work, compared with 70.4% of mothers whose youngest child was 14 to 17 years old. These shares have dropped since September 2019 for all groups of mothers, with the decrease among mothers with children ages 3 to 5 or ages 6 to 13 (6.7 percentage points each) being greater than among other mothers.
Among fathers with children younger than 3, the share who were working fell from 91.9% in September 2019 to 85.0% in September 2020. The decrease in workplace activity was more modest among fathers with older children. For example, among fathers with children ages 14 to 17, the overall share who were at work fell from 87.5%% in September 2019 to 85.1% in September 2020.
Underlying these trends in the workplace engagement of mothers and fathers were changes in their labor force participation. Mothers with children ages 3 to 5 or ages 6 to 13 experienced more of a decrease in labor force participation, as did fathers with children younger than 3. Absences from work were largely unchanged among mothers and fathers regardless of the ages of their children.
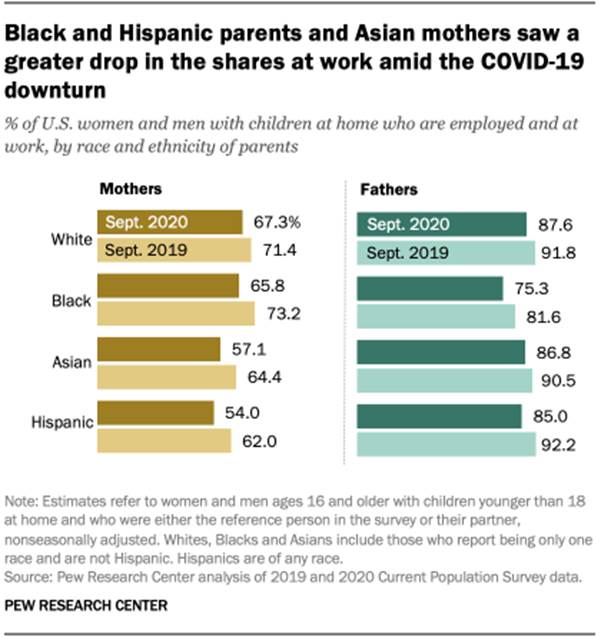
Black, Asian and Hispanic mothers experienced a greater decrease in the shares who were at work in the COVID-19 downturn than White mothers. Among fathers, Black and Hispanic fathers saw a greater decrease in the share employed than White and Asian fathers.
In September 2019, 73.2% of Black mothers were at work, greater than the shares among White, Asian and Hispanic mothers. By September 2020, the share of Black mothers who were working stood at 65.8%, a drop of 7.4 percentage points. Asian and Hispanic mothers experienced drops of 7.3 and 8.0 points in the shares employed, respectively. The decreases in this share for White mothers – 4.1 percentage points – is also notable, but not as high, in keeping with the trends among women overall.
Black and Hispanic fathers saw a greater decrease in work activity than other fathers over the same period. In September 2019, 81.6% of Black fathers and 92.2% of Hispanic fathers were employed and at work. By September 2020, 75.3% of Black fathers and 85.0% of Hispanic fathers were at work. The decreases in the share working among White and Asian fathers were not as high.
Workplace engagement among Black, Asian and Hispanic mothers fell more than among White mothers because they left the labor force in greater proportions and they also experienced more of an increase in unemployment from September 2019 to September 2020. Similarly, Black and Hispanic fathers were more likely to have left the labor force than White and Asian fathers over this period, and unemployment increased more among Black, Asian and Hispanic fathers than among White fathers.
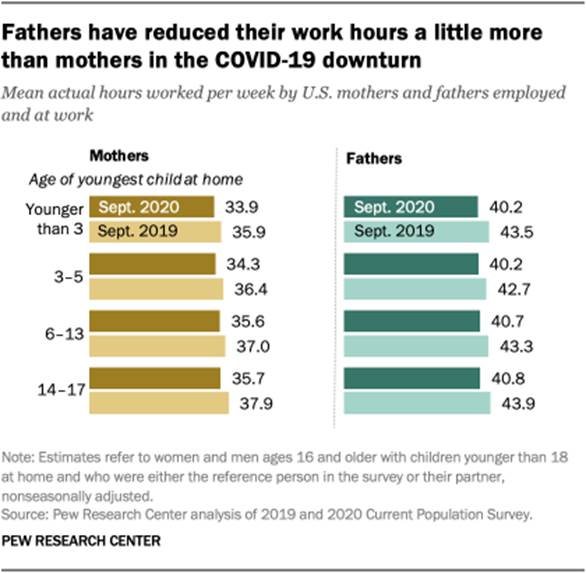
Fathers who are employed and at work cut back on the hours they spent on the job by a little more than mothers did. From September 2019 to September 2020, the average weekly hours worked by fathers fell from 43.3 to 40.5 – nearly three hours per week. At the same time, mothers pared their average weekly hours from 36.8 to 35.0, close to two hours per week. The change in work hours among mothers and fathers did not vary notably by the ages of the youngest children at home.
The key difference among mothers and fathers is that mothers spend significantly less time on the job, and the gender gap on this front is largely intact. The demands of family life have a large impact on this disparity, as is partly evident in the fact that women with younger children work the least number of hours whereas the age of a child has no impact on the hours worked by fathers.
Another manifestation of the gender gap in work hours is that women are more likely than men to work part time. In September 2019, 21.0% of mothers worked part time compared with 3.9% of fathers. In September 2020, the shares working part time stood at 20.3% for mothers and 4.3% for fathers. The slight decrease in the share of mothers working part time is likely a consequence of the fact that employment fell more sharply among part-time workers than full-time workers in the COVID-19 downturn.

Because of the COVID-19 downturn, the share of men overall who are working is at a record low. Among women, the share who are working is the lowest since the mid-1980s, when labor force participation among women was much lower and still on the rise.
In September 2020, 49.2% of women ages 16 and older were employed and at work, down from 54.0% in September 2019. Among men, the share who are active decreased from 65.3% in September 2019 to 60.5% in September 2020, the lowest on record since 1976, when data first became available.
It is worth noting that mothers and fathers who are referenced in this analysis and with children younger than 18 at home are more likely to be working than women and men overall. One reason is that these parents are younger on average than women or men overall, among those 16 and older: The mean age of mothers in September 2020 was 39, compared with 48 for women overall. The mean age of fathers was 42 compared with 46 for men overall.
Our analysis of the labor market engagement of mothers and fathers finds that, in the first six months of the COVID-19 outbreak, the gender gap on this front is perhaps more reflective of long-standing patterns in the labor market than of a new dynamic brought on by the outbreak. As business closures peaked in April and May, researchers found that, among married parents with children younger than 13 at home, mothers reduced their time worked by about one hour more than fathers from February to April.
Another study estimated that employed mothers with school-age children were more likely to take leave from work if they lived in states that imposed closures earlier. But this study also observed that mothers in early closure states did not change their labor force participation differently than fathers. Meanwhile, a New York Times survey conducted in April found that both women and men were doing more housework and child care than usual, although the division was about the same as before COVID-19 emerged.
Looking forward, the impact of the COVID-19 downturn on working parents, especially mothers, may intensify if business and school closures remain in effect. In a survey conducted in July by the Federal Reserve Board, 23% of employed mothers and 15% of employed fathers said they expected to reduce their work hours if schools did not resume in-person classes in the fall. Another 4% of working mothers and 2% of working fathers said they might quit their jobs.
(PEW)
October 22, 2020
661-662-43-22/Poll
Both Republicans and Democrats cite masks as a negative effect of COVID-19, but for very different reasons
The COVID-19 outbreak has upended life across the United States and exposed growing divisions between supporters of the two major political parties. And when Americans are asked to describe in their own words how the outbreak has affected them negatively, no topic divides Democrats and Republicans more than the subject of masks, according to a new Pew Research Center analysis of survey findings collected in late August and early September.
Overall, 14% of U.S. adults mentioned the word “mask” when asked how the pandemic has made their life difficult or challenging. That made “mask” the fourth most common term in these responses, behind “family” and “work” – each of which was mentioned by 19% of the public – and “friend,” mentioned by 14% of respondents.
How
we did this
“Mask,” however, was the single most-used term among Republicans and Republican-leaning independents, who were roughly twice as likely as Democrats and Democratic leaners to mention it in the context of negative effects from the outbreak (19% vs. 10%, respectively).
To gain further insights into these differences, researchers examined each of the nearly 1,000 open-ended responses that mentioned the term “mask.”
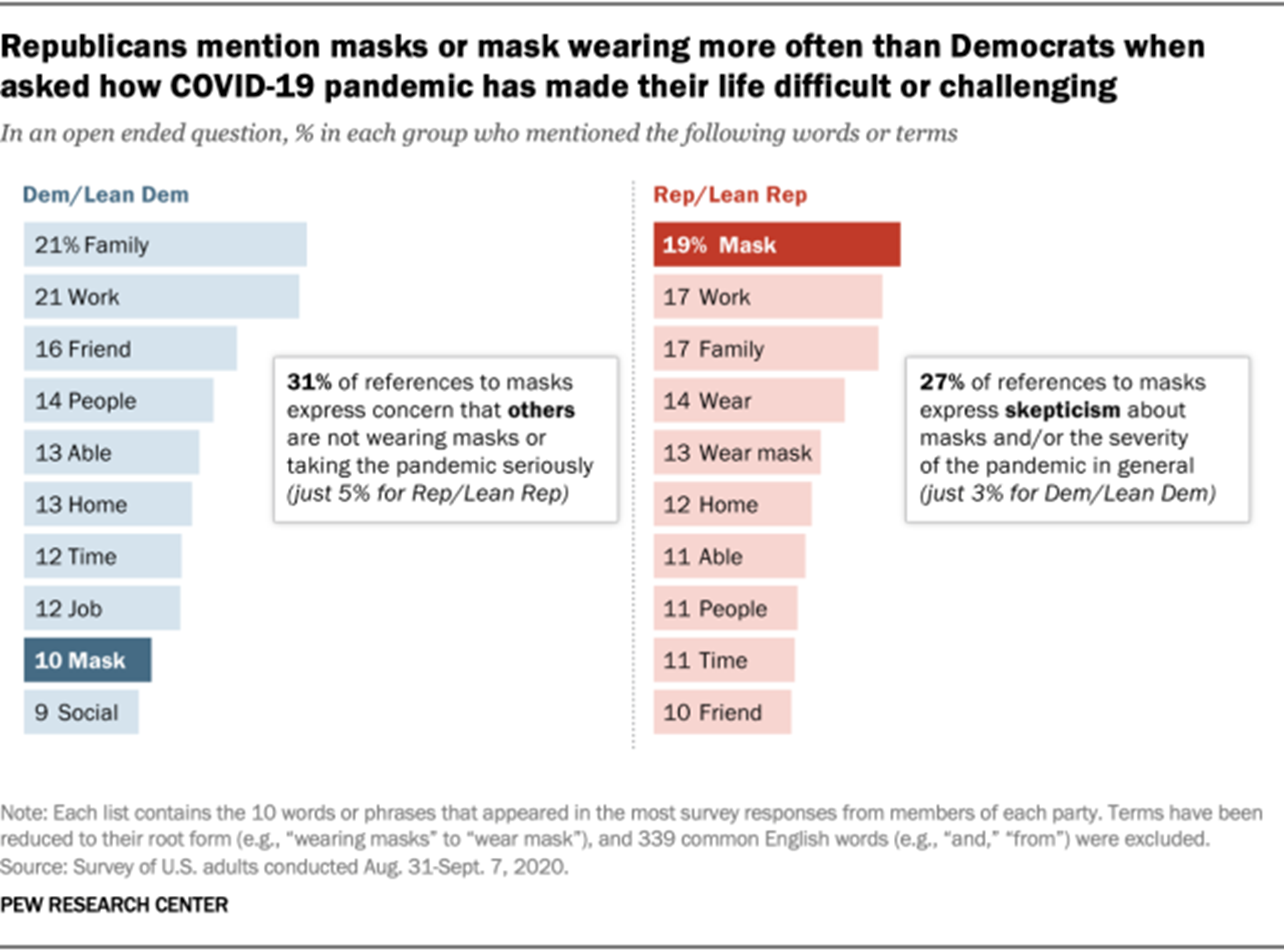
Americans frequently brought up masks in their responses simply to complain about them in a general sense or to cite them as an example of how things have changed since the pandemic began. But a third of those who mentioned masks provided more detailed opinions on face coverings and safety precautions in general. These detailed opinions illuminate a clear divide between those who are skeptical of masks and those who are concerned about other people refusing to wear them.
Among the Americans who mentioned masks in their responses, 15% expressed frustration with other people not wearing them or refusing to follow safety precautions more generally; lamented the politicization of basic safety precautions; or expressed concern that some people were not taking the pandemic seriously.
These concerns were largely concentrated among Democrats. Some 31% of Democrats who brought up masks did so to complain or express concern about other people not wearing them. By comparison, just 5% of Republicans who brought up masks expressed this sentiment. Put differently, Democrats accounted for around three-quarters (76%) of those who expressed worry about others not using masks.
Quotes
from Democrats expressing concern about others not wearing masks
(The responses below are lightly edited for spelling, style and readability.)
“Customers complaining about masks and not wearing them are both the biggest personal issues COVID has caused. The maskless customers are usually ruder than other people.” –Man, 24
“Having to be around people at work who don’t wear masks despite it being required by our governor. Feeling like I need to check the news about the virus only to be constantly reminded that Trump is actively trying to kill off Americans, incite violence, start a civil war, and become a fascist dictator and the corrupt GOP are actively allowing it to happen and the Dems aren’t doing enough to stop it. This country is falling apart and it’s extremely depressing and scary.” –Woman, 26
“I live in Missouri in a smaller town, less than 5K. Everyone thinks it’s made up, no one wears masks or social distances. […] I don’t feel safe or protected by my managers but I also can’t say anything because I need the job.” –Woman, 36
“I wear [a mask] for at least 8 hours a day along with a face shield, gloves and lab coat. I see approximately 100 patients a day and when I hear people complain about having to wear it for 20 minutes or those who refuse to wear it, I just have to scream silently inside.” –Woman, 59
“Some people who refuse to wear a mask. I am a believer in Jesus and to see other so-called Christians rebel against wearing a mask and calling COVID-19 a hoax is depressing. And discouraging to find out what really is in their hearts. It’s all about their rights only.” –Woman, 68
“I have chronic asthma so I am fearful of being exposed to the coronavirus. It makes me extremely angry to go out and see people not wearing masks or keeping social distance. And my intense dislike of Trump has grown because he lies about the coronavirus and there is blood on his hands. His lack of telling the truth about the coronavirus and his attempt to use the public health systems of the U.S. for his own political ends are the equivalent of murdering thousands of people.” –Man, 73
On the other hand, nearly one-in-five of all respondents who mentioned the word “mask” (18%) specifically called masks unnecessary, ineffective, oppressive or unfair; stated that they refuse to wear masks; expressed skepticism about the COVID-19 pandemic in general; or expressed a belief that the pandemic is being used to manipulate Americans for political gain.
These responses were far more common from Republicans: 27% of all mask mentions by Republicans expressed such views, compared with just 3% among Democrats who brought up masks. Looked at another way, Republicans accounted for 92% of those expressing skepticism or opposition to masks.
Quotes
from Republicans expressing skepticism about masks
“Forced to wear masks for a virus that killed less than 10,000 people, I am more likely to be murdered in Kansas City than catch COVID there.” –Man, 28
“The entire unnecessary shutdown of the country got my husband furloughed for 9 weeks, more government overreach with mask orders, people are just so terrified to live it’s disgusting, so the ones of us like me who aren’t scared get treated like we are awful people” –Woman, 31
“Being forced to wear a completely useless mask when going into businesses. I have bad allergies and can’t breathe well. The CDC has reported that the masks are useless, which to me indicates they are virtue signaling items and are being used to control people.” –Woman, 70
“The total and arbitrary violation of our civil rights by stooge governors (Whitmer, Cuomo, Newsom). The frustration of listening to little Fauci who has been wrong on almost everything. The dishonesty of the media to accurately report. I refused lockdown, I refuse masks, I refuse to participate in any of this bogus crap.” –Man, 60
“I really do think this outbreak is not a big deal. We have more people dying from the flu, heart disease, overdoses, car accidents, suicides. I really believe it is a government control thing to see how far they can push us. I am here to tell you! The American veteran will not stand by and let government take away our rights!!! If they are looking for a civil war they will get one. Don’t mess with the 1st and 2nd Amendment.” –Man, 67
“Masks! Being told to wear one even though we all learned in Microbiology 101 that they don’t work. I’m heartsick that kids can’t go to school. I’m disgusted with people who wear masks outside when exercising. I loathe the lying mainstream media even more for their negative influence on media.” –Woman, 72
Since answers to open-ended survey questions can be wide-ranging and varied in length, any specific keyword or topic typically only appears in a minority of responses. Overall, just 5% of Republicans expressed skepticism of masks and only 3% of Democrats brought up concerns about others not wearing them.
Still, the hundreds of responses from Republicans and Democrats that did express these views highlight a growing divide among partisans about coronavirus-related restrictions and safety measures. In June, 77% of Democrats – compared with 45% of Republicans – said they were very or somewhat concerned that they might unknowingly spread COVID-19 to others. And nearly two-thirds of Democrats (64%) were very or somewhat concerned that they would personally get COVID-19 and require hospitalization, while just 35% of Republicans expressed the same concern. In the same survey, Democrats were about twice as likely as Republicans to say that people in their community should always wear a mask (63% vs. 29%).
At the same time, the Center has also found that majorities in both parties say they are making regular use of masks, even if some may be skeptical about their effectiveness. In August, 92% of Democrats and 76% of Republicans said that they had worn a mask or face covering when in stores or other businesses most or all of the time during the prior month.
(PEW)
October 29, 2020
661-662-43-23/Poll
Key findings about Americans’ views on COVID-19 contact tracing
As the U.S. battles COVID-19, effective contact tracing has proven to be a major challenge for those trying to contain the spread of the coronavirus. A new Pew Research Center report from a survey conducted July 13-19, 2020, finds that Americans hold a variety of views that could complicate the ongoing efforts of public health authorities to trace and contain the virus.
The report largely focuses on what Americans tell us they might do when faced with three key parts of the contact tracing and quarantine process amid COVID-19, which we refer to as “speak,” “share” and “quarantine”:
- How likely people say they would be to speak with a public health official who contacted them by phone or text message to speak with them about the coronavirus outbreak.
- How comfortable they say they would be sharing information about the people with whom they have been in contact and where they have been (either via places they have recently visited or location data from their cellphone).
- Whether they say they would act on advice to quarantine for 14 days if advised to do so by a public health official because they had the coronavirus.
How
we did this
While majorities of Americans say they would be comfortable or likely to engage with some parts of contact tracing programs, others express wariness. In all, 48% of U.S. adults say they would be comfortable or likely to engage with all three steps. Others might engage with some steps, but be less comfortable or willing for others. Some 36% of Republicans and those who lean toward the Republican Party say they would be comfortable or likely to engage with all three of these steps under our “speak, share, quarantine” definition of engagement, compared with six-in-ten Democrats and leaners.
Here are five key takeaways from the report:
Some 41% of adults say they would not be likely to speak with a public health official by phone or text message about COVID-19. Not all Americans are equally likely to say this. For example, looking at this first step of the process only, 48% of those with a high school diploma or less formal education say they would be not at all or not too likely to speak with a public health official in this way, compared with a smaller share (30%) of those with a bachelor’s degree or higher. There are also differences by income: 45% of those from households with lower incomes say they would be not at all or not too likely to do so by phone or text, while a smaller share (31%) of those in higher-income households say the same.
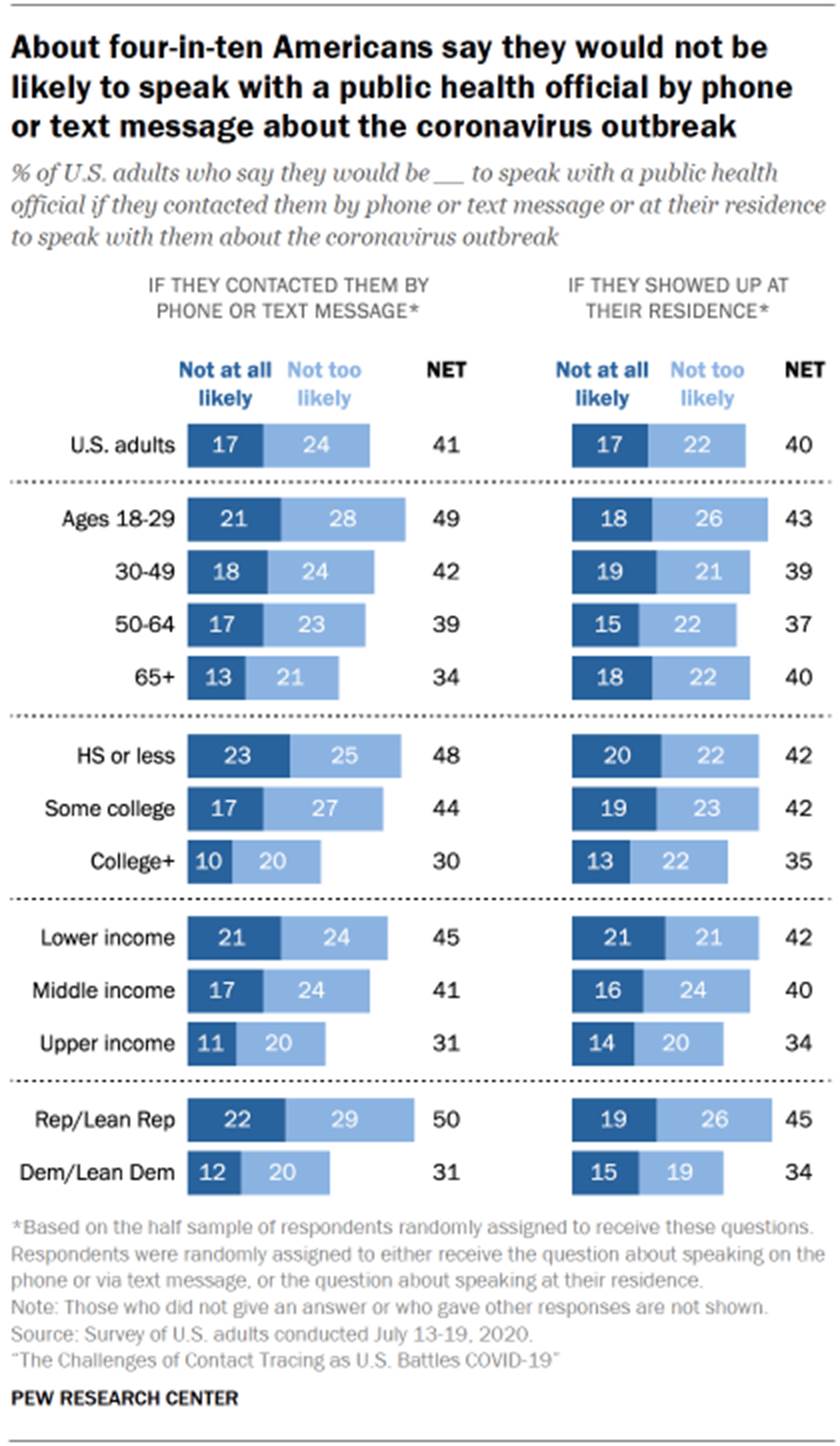
Younger Americans are also less likely to say they would speak with a public health official by phone or text during the outbreak. Roughly half (49%) of adults ages 18 to 29 say they would be not at all or not too likely to do so, compared with smaller shares of Americans 50 and older who express such reluctance.
Republicans are roughly 20 percentage points more likely to express resistance to speaking with a public health official about the coronavirus: Half of Republicans say they are at most not too likely to do so, compared with 31% of Democrats.
Americans’ comfort with sharing information with public health officials about whom they have been with and where they have been varies. Roughly three-in-ten U.S. adults (27%) say they would be not at all or not too comfortable sharing the names of people with whom they might have been in physical contact. A similar share (22%) say the same about their lack of comfort sharing information on places they have recently visited. Half of U.S. adults say they would be not at all or not too comfortable sharing location data from their cellphone.
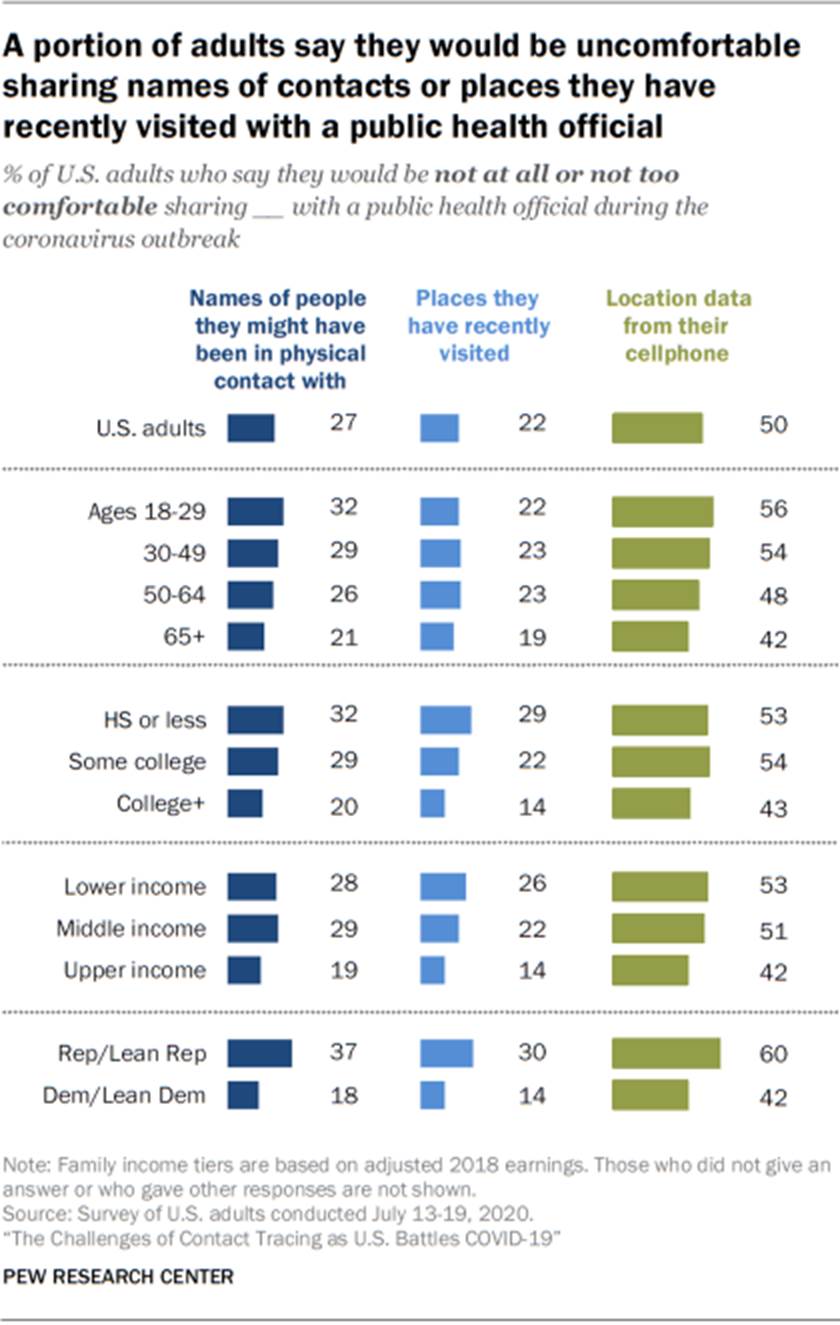
Republicans are about twice as likely as Democrats to say that they would be not at all or not too comfortable sharing the names of people with whom they might have been in physical contact (37% vs. 18%) and places they’ve recently visited (30% vs. 14%). They are also more likely to express discomfort about sharing location data from their cellphone (60% vs. 42%).
Younger adults express less comfort sharing information than older adults. For instance, 32% of those ages 18 to 29 say they would be not at all or not too comfortable sharing the names of people they might have been in physical contact with, compared with 21% of those ages 65 and older who say this. And those with lower incomes and less formal education tend to be less comfortable sharing information. About three-in-ten of those from households with lower (28%) or middle incomes (29%) say they would be not at all or not too comfortable sharing names of contacts, compared with 19% of those with higher incomes who say so.
The vast majority of Americans say they would definitely or probably quarantine if told they had COVID-19, but some report it would be difficult. About nine-in-ten adults (93%) say they definitely (73%) or probably (20%) would act on the advice of a public health official to quarantine for at least 14 days because they had the coronavirus.
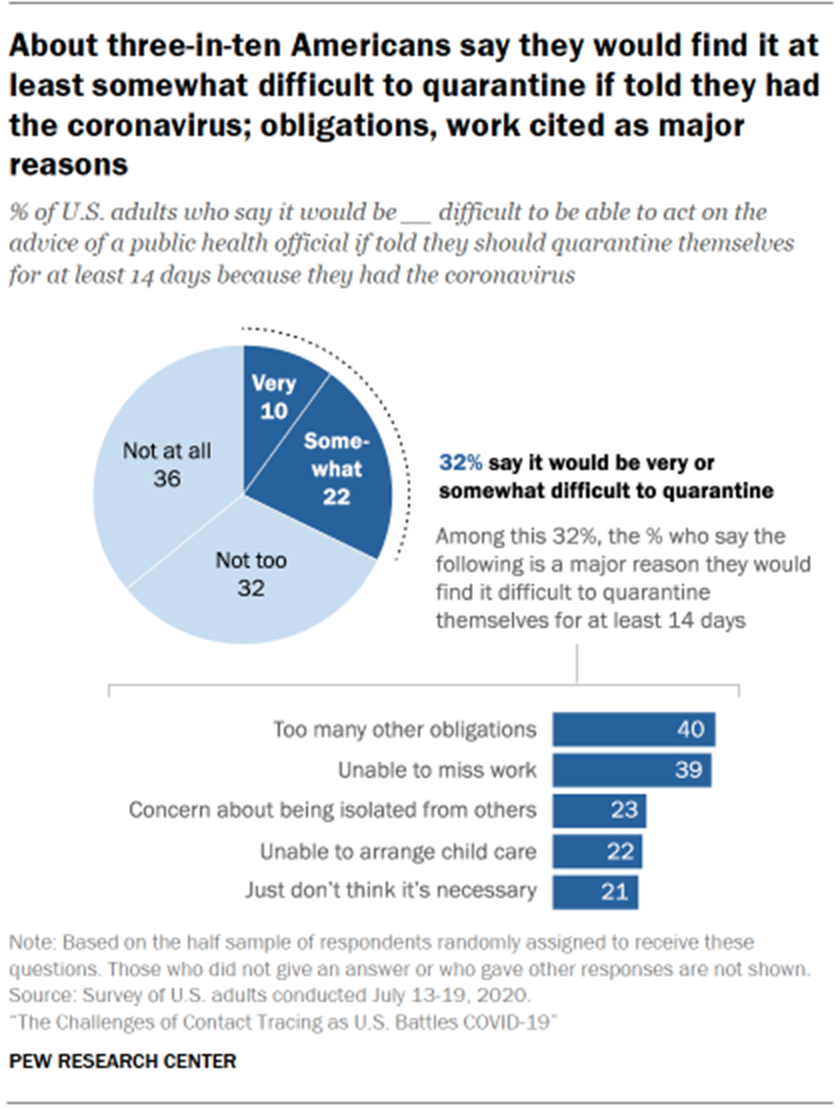
Although the majority of Americans who identify with either party say that they would definitely or probably quarantine (97% of Democrats and 88% of Republicans say this), Republicans are 26 percentage points less likely than Democrats to say they definitely would quarantine – some 59% of Republicans say so, compared with 85% of Democrats. Men are also less likely than women to report they would definitely quarantine (65% vs. 80%), and White adults (70%) are less likely to say this than Hispanic (80%) or Black (76%) Americans.
Further, about three-in-ten Americans (32%) say it would be very (10%) or somewhat (22%) difficult to be able to act on advice from a public health official to quarantine for at least 14 days if told they had the coronavirus. When those individuals who said it would be very or somewhat difficult to quarantine were asked about the reasons why, major reasons cited included having too many other obligations (40%) and being unable to miss work (39%).
Awareness of contact tracing and perceptions of how often scams happen are linked to the steps people say they would be likely or comfortable to take in the process. Some seven-in-ten U.S. adults had seen or heard a great deal or some about contact tracing at the time this survey was taken in July, whereas three-in-ten (29%) had heard nothing at all or not too much about this process. Those who had seen or heard not much or nothing at all are least likely to say they would be comfortable or likely to engage with all three contact tracing steps explored here (“speak, share, quarantine”).
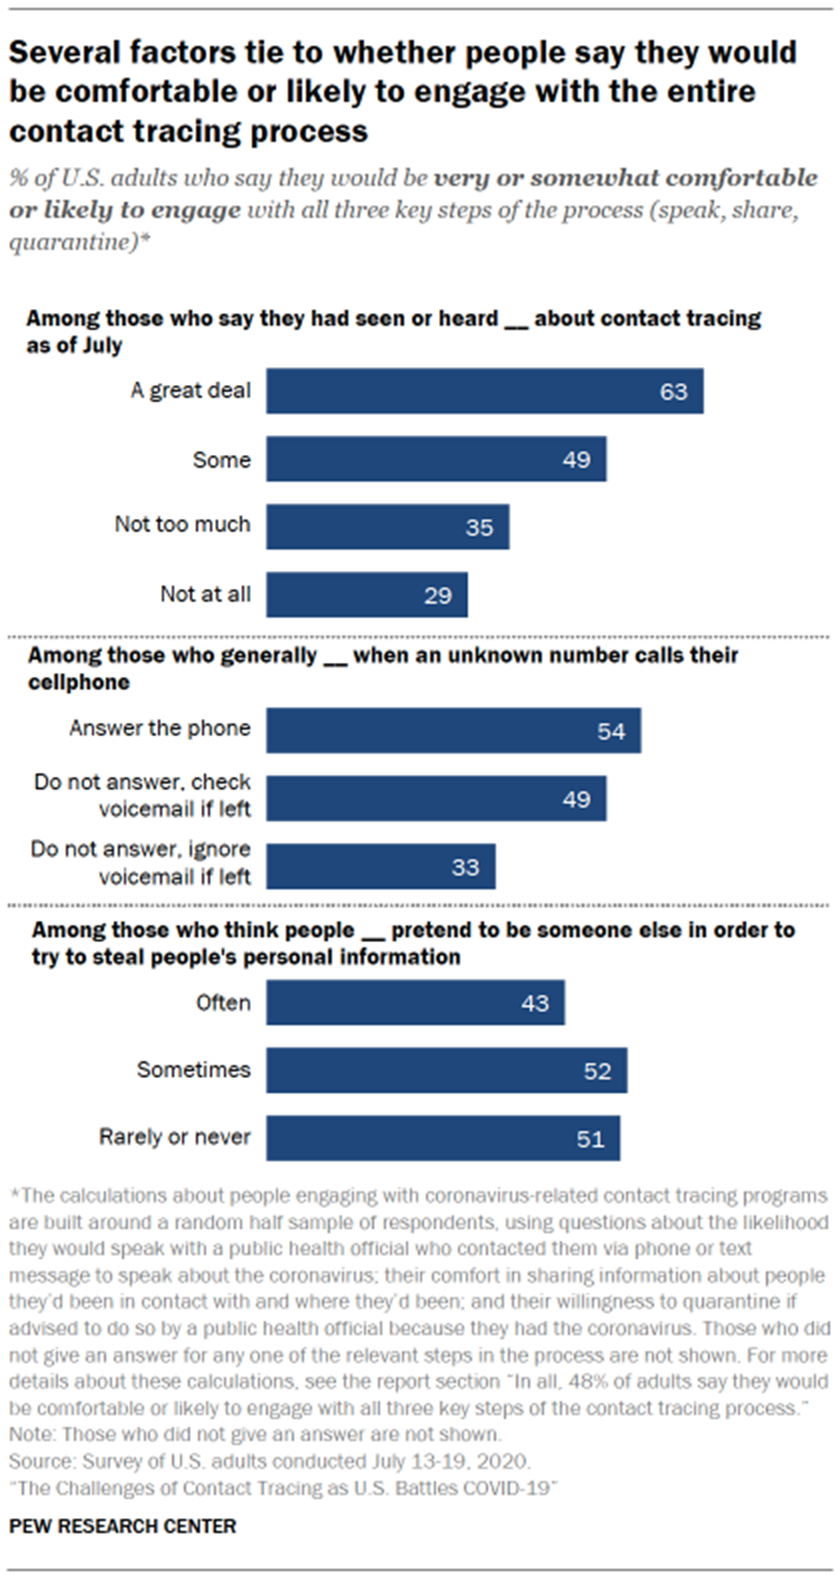
The survey also shows that just 19% of Americans report generally answering their cellphone when a call comes from an unknown number. Another 14% say they do not answer the phone and would ignore a voicemail if left. The majority of U.S. adults (67%), however, would not answer a call from an unknown number, but would check a voicemail. Those who generally ignore both a call and a voicemail from a number they do not know are also less likely to say they are comfortable or likely to engage with the three steps of the contact tracing process than others.
This wariness also applies to those who think people pretend to be someone else in order to steal others’ personal information with some frequency. Nine-in-ten Americans think people pretend to be someone else in order to try to steal people’s personal information often (49%) or sometimes (42%). Americans who think this happens often are less likely than those who think it happens less frequently to be comfortable or likely to engage with the speak, share, quarantine steps of the process in the context of the coronavirus outbreak.
Americans are more confident than not in public health organizations to keep their records safe from hackers or unauthorized users, but about four-in-ten are at most not too confident in this. In light of general privacy concerns about tech-based solutions to contact tracing, as well as new findings about general trust in public institutions, Americans were asked about their confidence in relevant organizations and institutions to keep their personal records safe in general. A majority (59%) of Americans say they are very or somewhat confident that public health organizations will keep their personal records safe from hackers or unauthorized users. Some 41% say they are not at all or not too confident in these organizations to do this.
Those who express less confidence in public health organizations to keep their personal records safe are also less likely than others to say they would be comfortable or likely to engage with all three steps of the contact tracing process. Seven-in-ten of those who are very confident that public health organizations will protect their personal records from hackers or unauthorized users also say that they would be comfortable or likely to engage with all three steps, compared with smaller shares of those who express less confidence – 56% of those who are somewhat confident, 36% of those who are not too confident, and 21% of those who are not at all confident.
(PEW)
October 30, 2020
AUSTRALIA
661-662-43-24/Poll
‘Mortgage stress’ is near record lows during the COVID-19 pandemic as payments are put on hold
New research from Roy Morgan shows an estimated 751,000 mortgage holders (20.2%) were at risk of ‘mortgage stress’ in the three months to August 2020 as Australia navigated its way through the COVID - 19 pandemic. Much of Australia was progressing towards a ‘COVID-normal’ situation in August although Victoria entered a Stage 4 lockdown.
This is near the record lows of a year ago when only 723,000 mortgage holders were considered ‘At Risk’ in the three months to October 2019. However, the significant support provided to the economy by the Federal Government as well as measures taken by banks and financial institutions to support borrowers over the last six months is not going to last forever.
Mortgage Stress –
Owner-Occupied Mortgage-Holders
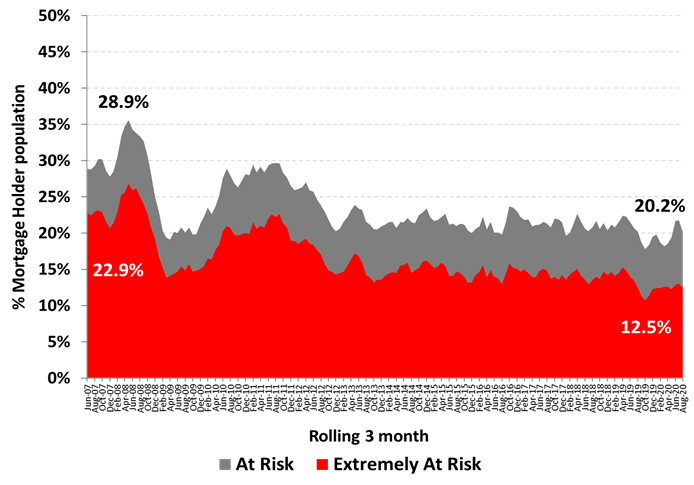
Source: Roy Morgan Single Source (Australia), average
interviews per 3 month period April 2007 – August 2020, n=2,687. Base: Australians 14+ with owner
occupied home loan.
Importantly, Roy Morgan has tracked the impact of COVID-19 on the employment situations of Australians. In May 2020, 11.2 million working Australians (72%) reported a change to their employment circumstances because of COVID-19, and in July 2020 there were still 10.4 million reporting their employment situation had changed – see more detail here.
Many of these employment changes are negative and include having ‘work hours reduced’, ‘not having any work offered’, ‘have been stood down for a period of time’, ‘business has slowed or stopped completely’, ‘had pay reduced for the same number of work hours’ or being ‘made redundant’.
For Australians with negative employment changes due to COVID-19 mortgage stress is significantly higher with over a quarter, 26.7%, now in ‘mortgage stress’ – over 6% points higher than for all mortgage holders. In addition, over one-in-six, 16.8%, are ‘extremely at risk’.
Mortgage Risk for
those with negative employment changes due to COVID-19
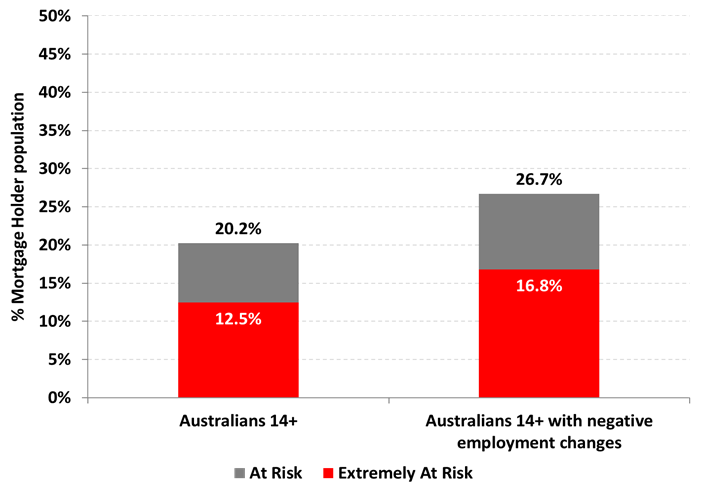
Source: Roy Morgan Single Source (Australia), June –
August 2020, n=1,929. Base: Australians
14+ with owner occupied home loan.
How are mortgage holders
considered ‘At Risk’ or ‘Extremely At Risk’
determined?
Roy Morgan considers the risk of ‘mortgage stress’ among Mortgage holders in two ways:
Mortgage holders are considered ‘At Risk’1 if their mortgage repayments are greater than a certain percentage of household income – depending on income and spending.
Mortgage holders are considered ‘Extremely at Risk’2 if even the ‘interest only’ is over a certain proportion of household income.
Over 1-in-5 mortgage
holders were ‘At Risk’ in August, near the record lows of late 2019
In the three months to August 2020, 20.2% of mortgage holders were ‘At Risk’ (751,000) which is near the record low of 723,000 reported a year ago in the three months to October 2019.
Of those ‘At Risk’ more than half, 433,000 or 12.5% of all mortgage holders, were considered ‘Extremely at Risk’ - also near the record low of 425,000 reported a year ago in the three months to October 2019.
The low level of mortgage holders ‘At Risk’ and ‘Extremely At Risk’ of mortgage stress during this period is due to the substantial support provided to the Australian economy by the Federal Government as well as the significant financial support provided by banks and financial institutions.
These are the latest findings from Roy Morgan’s Single Source Survey, based on in-depth interviews conducted with 50,000 Australians each year including over 10,000 owner-occupied mortgage-holders.
Michele Levine, Chief
Executive Roy Morgan, says COVID-19 has provided an unprecedented shock to the
Australian economy during 2020, however the support provided by the Federal
Government and banking and financial institutions has prevented, or at least
put off, a potential real estate crisis:
“The latest Roy Morgan data
into the Australian housing market shows mortgage stress was near record lows
in the three months to August 2020 as most of Australia, apart from Victoria,
was emerging from nation-wide lockdowns implemented through March-May 2020.
“There were 751,000 mortgage
holders considered ‘At Risk’ in August 2020, one of the lowest figures on
record and only 433,000 considered ‘Extremely At Risk’ – also near a record
low.
“However, these figures are
somewhat deceptive as they rely on an unprecedented level of support provided
to the economy. The Federal Government has subsidised
workers with the $1,500 a fortnight JobKeeper wage
subsidy, the almost doubled JobSeeker payment of over
$1,100, and allowed businesses to trade while insolvent this year to keep
people employed.
“In addition, according to
the Australian Prudential Regulation Authority (APRA), banks have deferred payments on housing loans
valued at around $160 billion – an average of 9.6% of Australia’s mortgage
market through the end of July 2020. APRA figures show that those holding loans
with a loan-to-value ratio above 90% were significantly more likely to take up
a repayment deferral. These loans make up 5% of all housing loans, but 9% of
deferred loans, and are for borrowers more likely to fall into an ‘At Risk’
category if they were to become unemployed or fall upon hard times.
“Because of these measures
the impact of COVID-19 is yet to be fully felt, but we already know there will
be significant pressures emerging when the support ends. A special survey by Roy Morgan into the employment
impact of COVID-19 showed
11.2 million working Australians (72%) in May 2020 had experienced a change to
their employment due to the pandemic – and most of these were negative changes
such as having ‘work hours reduced’, ‘being stood down for a period of time’,
‘not having any work offered’ or being ‘made redundant’ – or a combination of
the above.
“Over the many years of our
research into mortgage stress, the data shows clearly The
loss of a job is the biggest driver of increased mortgage stress as the
reduction in income causes an immediate jump into a ‘risk’ category. Over
two-in-three mortgages rely on more than one income and our analysis shows
losing even the lower of these two incomes causes an immediate quadrupling of
those mortgage holders considered ‘At Risk’ or ‘Extremely at Risk’.
“JobKeeper
has already been reduced in early October 2020 and is set to end entirely by
April 21 while the mortgage deferrals offered by banks to customers in
financial distress are set to run out at the same time. One of the biggest tasks
for banks during the present period is to determine which customers will be
able to return to paying their mortgage in the period ahead and which customers
will not have that capacity when the deferrals end early next year.”
(Roy Morgan)
October 20, 2020
MULTICOUNTRY STUDIES
661-662-43-25/Poll
COVID-19: how does support for business compare across Europe?
British businesses are the
most likely to feel adequately supported among the large European economies –
but their outlook is also the most pessimistic
The Chancellor today announced further COVID-19 support to businesses through what he branded the world’s most generous short-time work scheme. YouGov data shows that even before the new measures, British businesses were the most likely to say the government had provided enough support during the coronavirus crisis in a survey including France, Germany, Italy and Spain.
About half of businesses in Britain (48%) felt adequately supported before today’s announcement. This is significantly higher than in Germany (28%), Italy (28%), France (24%) and Spain (13%).
In contrast, a quarter of Spanish businesses (27%) said the government had not provided any support. This sentiment is also more common in Italy (22%), Germany (17%) and France (16%) compared with Britain (8%).
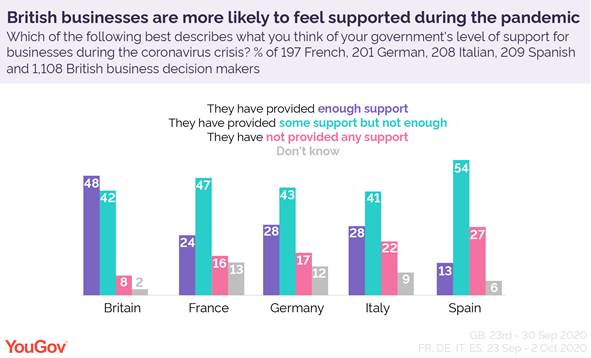
As of 30 September, a quarter of British businesses (27%) were receiving government support, compared with about one in six Spanish (16%) and one in seven French (15%), German (15%) and Italian (14%) companies.
While the coronavirus timelines for the countries vary, British businesses are also more likely to have received support at any point during the crisis (58%). This is nine points above Germany and France (each at 49%), while the figure is 48% in Italy and 42% in Spain.
More support doesn’t necessarily equal fewer redundancies
Labour’s Shadow Chancellor, Anneliese Dodds, today slammed the Government for announcing the measures after the redundancy deadlines for businesses reliant on the 80% furlough scheme had passed.
The chances are many companies could not afford to wait to lay off workers. Half of British businesses surveyed (52%) were expecting to make redundancies before the end of the year when polled in the last week of September.
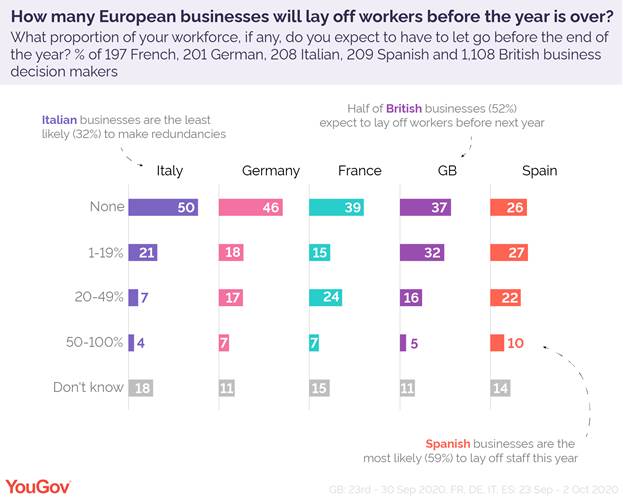
This figure is only dwarfed by Spain where three in five businesses (59%) believed they would have to lay off employees before the new year – including one in ten (10%) expecting to let half of their workforce or more go.
Italian businesses were the least likely to expect redundancies, however a third (32%) still assumed there would be some more layoffs this year.
British businesses expect the slowest recovery
Over two in five British businesses (45%) believe it will take at least a year to recover financially from coronavirus. This is the highest figure among the countries in the survey despite more companies in Britain being content with the Government’s support.
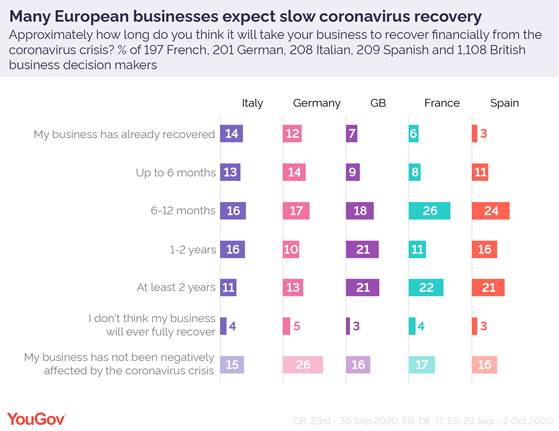
German businesses are the most upbeat. At 28%, they’re the least likely to expect recovery to take longer than a year, while a quarter say they’ve not been affected by the crisis at all (26%).
Italians are also optimistic, with one in seven businesses (14%) saying they have already recovered, and only three in ten (31%) believing they’ll need more than a year to bounce back.
(YouGov)
October 22, 2020
661-662-43-26/Poll
Job loss is a concern for half of workers across the world
A new Ipsos survey of more than 12,000 working adults from 27 countries for the World Economic Forum finds 54% of them expressing concern about losing their job in the next 12 months. Perceived job insecurity varies widely across countries: it is stated by three in four workers in Russia, compared to just one in four in Germany.
Two thirds of workers worldwide say they can learn and develop skills needed for the jobs of the future through their current employer. While nearly nine in ten workers in Spain report being able to gain essential new skills on the job, fewer than half in Japan, Sweden and Russia do.
Concern about job loss
On average, 54% of employed adults from 27 countries say they are concerned about losing their job in the next 12 months (17% are very concerned and 37% somewhat concerned). The prevalence of being concerned about losing one’s job in the next year ranges from 75% in Russia, 73% in Spain, and 71% in Malaysia, to just 26% in Germany, 30% in Sweden, and 36% in the Netherlands and the United States.
Ability to acquire new
skills
Globally, 67% of employed adults surveyed say they can learn and develop skills needed for the jobs of the future through their current employer (23% are very much able to do so, 44% somewhat able). Across the 27 countries, perceived ability to learn and develop those skills on the job is most widespread in Spain (86%), Peru (84%), and Mexico (83%) and least common in Japan (45%), Sweden (46%), and Russia (48%).
New skill acquisition vs.
job insecurity
Globally, workers are more likely to say they can learn and develop skills needed for the jobs of the future through their current employer (67%) than to express concern about losing their job in the next 12 months (54%), a difference of 13 percentage points. The countries where those who can gain new skills on the job outnumber those who are concerned about losing their job by the largest margins are the United States and Germany (by 40 points). In reverse, job loss concern is more prevalent than perceived ability to acquire skills in Russia (by 28 points) and, to a lesser extent in Malaysia, Poland, Japan, Turkey, and South Korea.
(Ipsos)
October 19, 2020
Source: https://www.ipsos.com/en/workers-concerns-about-job-loss-and-access-new-skills-27-countries
661-662-43-27/Poll
Arabs Do Not Support A Second Trump Victory
We asked Arab citizens across MENA about their preferred US presidential candidate and their opinion of the US. And the results reveal clear preferences within the election.
Overall, Arab citizens think Biden’s foreign policies would be better for the region. And, the U.S.’s image suffers, in part as majorities in the Arab world express unfavorable views of Trump’s approach. That is based on Arab Barometer’s latest survey of more than 5,000 people in five countries in the Middle East and North Africa that was conducted by mobile phone during the fall 2020. Notably, the results reveal that Lebanese are indifferent between the two candidates, while the most common response is that the policies of both would be equally bad for the region.
But, will America’s position in the Arab world improve if Biden wins the US elections? I asked Michael Robbins, Arab Barometer’s director, to comment on the results and to share his thoughts on how the outcome of the upcoming election might affect Arab citizens’ views of the U.S..
Aseel Alayli: What can the data tell us about Arabs’ views towards Trump’s presidency and how it might impact the future US relations with MENA countries?
Michael Robbins: President Donald Trump remains deeply unpopular across the Middle East and North Africa. Arab Barometer surveys from 2018-9 reveal that his support is far lower than for other world leaders. Across the region, an average of 12 percent of Arab citizens approved of his policies for the region, which are significantly lower than for Russian President Vladamir Putin (28 percent) and far lower than for Turkish President Recep Tayyip Erdogan (51 percent).
In new Arab Barometer surveys from fall 2020, his approval of his policies toward the region remains unchanged across citizens in five countries surveyed (Algeria, Jordan, Lebanon, Morocco, and Tunisia). By comparison, about a third say they approve of the policies of Chinese President Xi Jinping.
Views of the U.S. overall are somewhat more positive than views of Trump across the region, only a minority rate the U.S. positively. On average, about a quarter of citizens view the U.S. favorably or somewhat favorably, with a high of 39 percent in Morocco and a low of 16 percent in Jordan. However, there has been an overall decline in views toward the U.S. and the American people since 2016, which suggests the policies of the Trump administration might be a factor in changing views of the U.S. during this period.
Alayli: How would a second Trump term versus a Biden victory shift Arabs’ views towards the US?
Robbins: Across the five countries surveyed, citizens are, on average, more than three times more likely to prefer Biden over Trump. Overall, only one-in-ten say that Trump’s policies would be better compared to about a third that prefer Biden. The only exception is Lebanon, where support for Biden (17 percent) and Trump (18 percent) are about equal, although there are significant differences by sectarian identity. Overall, Christians and Sunnis are significantly more likely to prefer Trump compared with Shias and Druze.
Notably, many citizens across MENA are unconvinced that either candidate would have better policies for the region. On average, a quarter of citizens say that the policies of both candidates would be equally bad, including 42 percent of those in Lebanon. Additionally, roughly one-in-three across the countries surveyed say they don’t know which candidate would be better.
Given Trump’s relatively low ratings in MENA over the last four years, a Biden presidency could offer an opportunity for improving view of the U.S. Over half of citizens in the five countries surveyed are hopeful Biden would be better or don’t know how to evaluate him compared with Trump, suggesting a Biden could improve the U.S.’s image among Arab publics.
Still, preliminary data from an ongoing survey suggests only a minority believe that the outcome of the election will actually lead to any change in U.S. policies toward MENA. Although Biden’s policies will differ somewhat from those of Trump, it is unlikely that they will be demonstrably different in the eyes of most citizens on key challenges facing the region such as Israel-Palestine, Syria, Libya or Yemen. Although views of Biden are likely to remain higher than for Trump, the likelihood of a major shift in views of the U.S. is relatively limited.
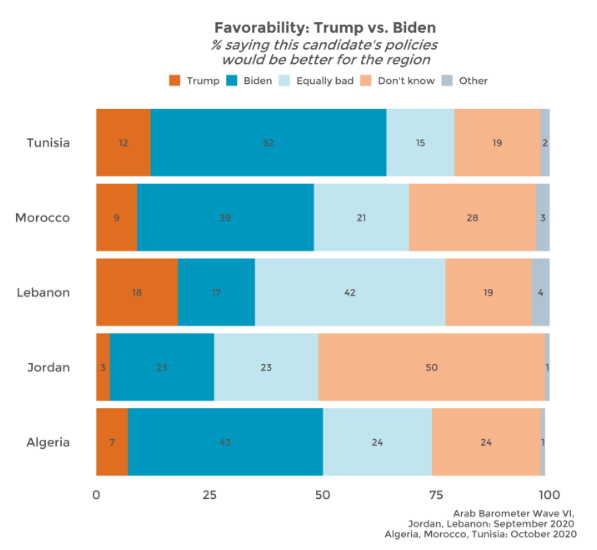
(Arab Barometer)
November 01, 2020
Source: https://www.arabbarometer.org/2020/11/arabs-do-not-support-a-second-trump-victory/
661-662-43-28/Poll
From voter registration to mail-in ballots, how do countries around the world run their elections?
The 2020 U.S. presidential election is unfolding amid a pandemic and public uncertainty over some aspects of the voting process itself. Here’s a look at how elections are run in the United States and other countries around the world. All findings are based on a Pew Research Center analysis of data from the International Institute for Democracy and Electoral Assistance, the ACE Electoral Knowledge Network and the Electoral Integrity Project.
More than half of all countries and territories have compulsory voter registration. Though the exact policy varies from one place to another, 122 of the 226 countries and territories in the ACE Electoral Knowledge Network have some form of compulsory voter registration. In Argentina, Chile, Hungary, Israel, the Netherlands and elsewhere, such registration is automatic, based on government records such as census counts. In other cases, qualified residents are required to register themselves. Failing to register is punishable by a fine in some places, including New Zealand, Tonga and the United Kingdom.
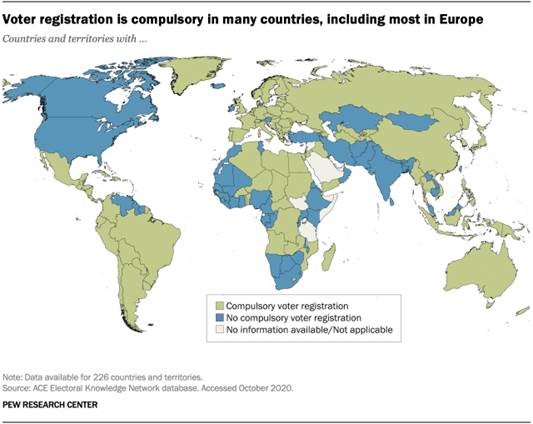
Another 90 countries and territories have no laws requiring all qualified residents to register to vote, though registration may be required in order to vote. In India – the world’s largest democracy – and Mongolia, voter rolls are compiled automatically through census data collection, though registration is not compulsory. In Austria, voter registration and voting itself were compulsory in at least one province until 2004; today, there is no requirement to register or to vote in Austrian elections. There is no compulsory voter registration in the U.S., though registration is necessary in order to vote in nearly all states and U.S. territories (North Dakota does not have voter registration).
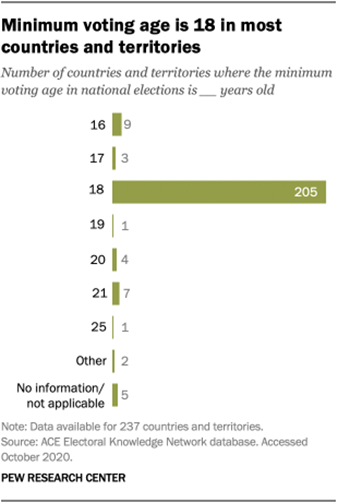
The vast majority of countries and territories have a minimum voting age of 18 for national elections. The U.S. aligns with most other places in this respect. Out of 237 countries and territories for which the ACE Electoral Knowledge Network has data, 205 have a minimum voting age of 18. Just 12 countries or territories allow people younger than 18 to vote in national elections.
Worldwide, the lowest minimum voting age for national elections is 16, including in Argentina, Austria and Brazil. The highest is in the United Arab Emirates, where citizens must be 25. In Italy, there is a split voting age: The minimum voting age for the lower house of Parliament is 18 years old, while voters must be 25 to vote in Senate elections.
Before the coronavirus outbreak, about a quarter of countries had used postal ballots in their national elections. Out of 166 countries for which data is available, 40 used postal ballots in their most recent national election, according to country experts surveyed before the COVID-19 outbreak by the Electoral Integrity Project. Postal ballots were used most widely in Europe and North America and are also common in some countries in the Asia-Pacific region, such as India, Indonesia, South Korea and Sri Lanka. Postal ballots were not available in most African and Caribbean countries, and not available in any Middle Eastern or Latin American countries.
Paper ballots are by far the most common form of voting. Votes are cast by manually marking ballots in 209 of the 227 countries and territories for which the ACE Electoral Knowledge Network has data. In some places, voters make their selection by placing a symbol – such as an X, cross or checkmark – on a paper ballot that contains the entire list of candidates and/or parties. In a few countries, including Israel and Mali, voters select a ballot for a particular political party, put the ballot in an envelope and then deposit the envelope in a ballot box.
Some countries use a mix of methods. In addition to paper ballots, electronic voting machines are used in about 10% of the countries and territories for which data is available. Electronic voting machines are used in some large countries, such as India and the U.S., as well as in smaller ones like Singapore.
Voting by internet is used in four countries: Armenia, Canada, Estonia and Switzerland. In Gambia, meanwhile, the most recent presidential election relied on a system of placing marbles into drums. The system was established in the 1960s to address high levels of illiteracy.
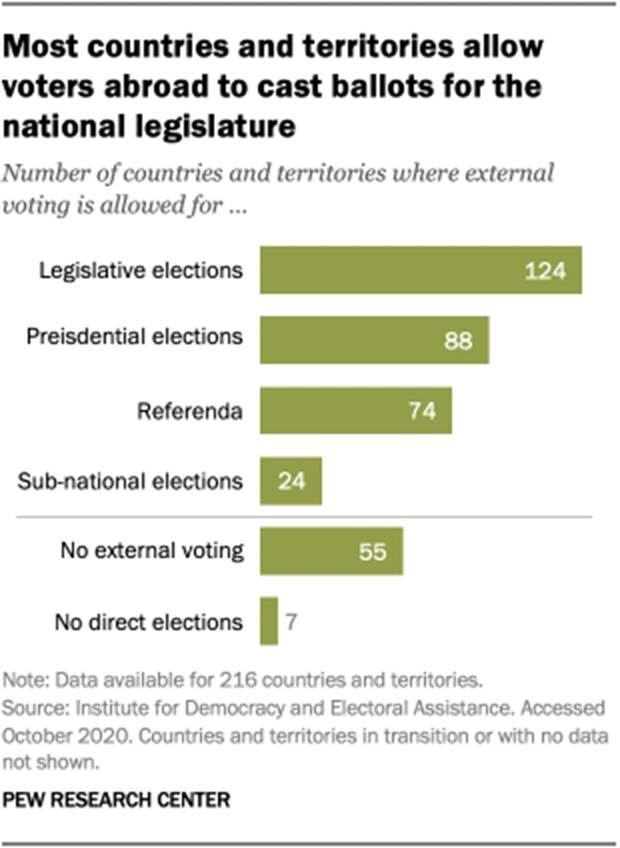
Most countries and territories allow voters abroad to cast ballots in some capacity. That’s the case in the U.S. and another 151 of the 216 countries and territories evaluated by the International Institute for Democracy and Electoral Assistance, at least for national legislative, European Parliament or presidential elections. Among those, many allow external voting for legislative elections (124), presidential elections (88) or referenda (74), and just 24 allow it for sub-national elections.
Nearly every country in Europe provides for some form of external voting, and many allow citizens to vote from abroad for multiple types of elections. Most European Union countries (23 of 27) also allow citizens abroad to vote in European Parliamentary elections.
Around the world, 55 countries and territories do not allow any voting from abroad. Many of these countries are located in Latin America, sub-Saharan Africa and the Asia-Pacific region.
(PEW)
October 30, 2020