BUSINESS
& POLITICS IN THE WORLD
GLOBAL
OPINION REPORT NO. 677
Week: February 08 –
February
14, 2021
Presentation: February 19, 2021
677-43-23/Commentary: Global survey: Where should
facemasks be mandatory?
During
January, Pepsi achieved the highest uplift in Ad Awareness of any brand in
Egypt
Ethiopians
endorse higher taxes in exchange for more government services, Afrobarometer
survey shows
At
home and with food at home: this is how this Valentine's Day will be celebrated
Willingness
to vaccinate increases significantly
How
willing are employers to recruit people with physical disabilities?
Which
lockdown rules should the police enforce?
Four
in ten straight women have been let down by a partner on Valentine’s Day
Two
in five NHS staff say patient care has declined during pandemic
Immigrants
and children of immigrants make up at least 14% of the 117th Congress
For
Valentine’s Day, 5 facts on relationships and dating in the U.S.
U.S.
Senate has fewest split delegations since direct elections began
Americans
far more likely to say evangelicals will lose influence, rather than gain it,
under Biden
Support
for Third U.S. Political Party at High Point
Two-Thirds
of Americans Not Satisfied With Vaccine Rollout
Americans'
Views of Impeachment, Trump's Record on Issues
North
American Tracker: Biden’s Presidential Win: The Impact On Canada
Digital
media usage during times of distress
Global
survey: Where should facemasks be mandatory?
INTRODUCTORY NOTE
677-43-23/Commentary: Global survey: Where should facemasks be mandatory?
People around the world tend
to agree on mask use indoors apart from in their own homes
The global rise in facemask use has been one of the defining features of the COVID-19 pandemic. Research from the YouGov-Cambridge Globalism Project carried out in 25 countries last summer reveals where people think wearing a facemask should be compulsory during the pandemic.
Facemasks and public
transport
Efforts have been made around the world to keep public transport running during the pandemic while ensuring passengers are safe.
People in Brazil are the most likely think facemask should be required on public transport during the pandemic (93%). A similar proportion (92%) of South Africans, Mexicans, and Spaniards agree.
In the United Kingdom, 83% of people think facemasks should be compulsory on public transport for the duration of the pandemic, while 78% of Canadians and 77% of Germans agree.
Only half of Swedes (51%) think facemask should be mandatory on public transport while the pandemic is ongoing, the lowest of the surveyed countries.
Facemasks and medical
facilities
Facemasks were already a common sight in medical facilities before the pandemic, but most people now think they should be compulsory for the duration of the pandemic.
Mexicans, Spaniards and Brazilians (93%) are among the most likely to say this, closely followed by 92% of South Africans and French people, and 91% of Nigerians.
Just over four in five people in the UK (84%) think facemasks should be rule in medical facilities, as do 83% of Canadians and 81% of Hungarians.
Despite a majority of Swedish adults (61%) agreeing, they are again the least likely to approve.
Facemasks and shopping
Public opinion on wearing facemasks inside shops while COVID-19 is in circulation is similar. Brazilians and Spaniards are the most likely to support it at 90%. Most South Africans (89%) and Mexicans, Turks and Italians (all at 87%) also favour this policy.
Elsewhere, three quarters of people in Thailand and the UK (76%) agree facemasks should be compulsory for shopping during the pandemic. In the US, around three in five people (62%) are of the same opinion.
Fewer than half of Swedes (35%) and Danes (45%) support the approach – the lowest among the surveyed countries.
Facemasks and airports
Air travel has been a major issue during the pandemic, with many countries blocking international flights, and others implementing testing regimes for passengers. Brazilians and Spaniards are again the most likely to think masks should be required in airports during the pandemic at 92% each. This sentiment is shared by a similar proportion (90%) of Mexicans, South Africans, and French people.
In China where COVID was first detected, 87% of people support airports having a facemask use rule. Britons are also largely in favour at 79%.
Swedish people are least likely to think mask use should be compulsory at 53%.
Facemasks on public streets
While people in the surveyed countries mostly agree that facemasks should be compulsory in indoor spaces, opinion on mask wearing outdoors is divided.
In Indonesia, 81% of people think that facemasks should be compulsory on public streets during the pandemic, as do 79% of Indians, 75% of Thai people, and 72% of both Mexicans and Brazilians.
Elsewhere public opinion is split. In Australia and France, approaching half (47%) say facemasks should be required in public streets during the pandemic. About a third of adults in the United States (36%) and Italy (34%) agree.
Only a fifth of Britons (18%) are supportive, while among Swedes this drops to one in ten (10%).
Facemasks at home
Further to wearing facemasks on public streets, making facemasks mandatory when at home during the pandemic proves even less popular. Support is greatest among Indians (21%), Saudi Arabians (18%) and Turks and Egyptians (both at 16%).
In the west, one in ten adults in the United States (10%) agree, as do the same proportion of Mexicans and Brazilians. In the UK, just 2% of people think facemasks should be compulsory in private homes.
(YouGov)
February 09, 2021
ASIA
(India)
Inflation Unchecked Since Modi Became PM, Life of Most Indians Affected
in 2020: Key Takeaways From IANS-CVoter Pre-Budget
Survey
The Modi government in 2020 is faring as
the worst on the economic front since it came to power in 2014, according to an
IANS-CVoter pre-budget survey. As
many as 46.4 per cent said that under Prime Minister Narendra Modi and Finance
Minister Nirmala Sitharaman, the performance of the Central government on the
economic front so far has been worse than expected. A lesser number of 31.7 per
cent said the performance is better than expected.
(CVoter)
February 01, 2021
MENA
(Egypt)
During January, Pepsi achieved the highest uplift in Ad Awareness of
any brand in Egypt
Giant soft-drink brand, Pepsi, enjoyed
the greatest improvement in Ad Awareness of any brand in Egypt during January.
The uplift coincides with the brands new creative campaign, featuring famous
icon Amr Diab, which appears to have resonated with the public. The advert was
released at the beginning of January and using nostalgic themes looks back on
the last 20 years of the Amr Diab and Pepsi collaboration. (YouGov)
February 04, 2021
AFRICA
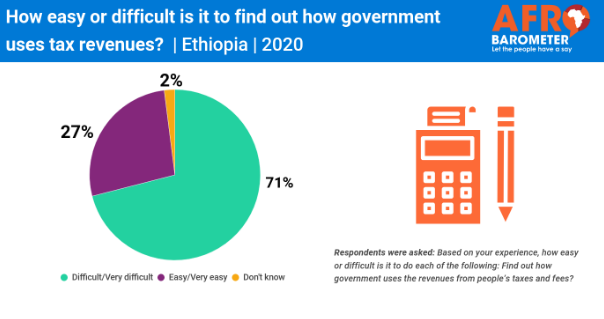
(Ethiopia)
Ethiopians endorse higher taxes in exchange for more government
services, Afrobarometer survey shows
A majority of Ethiopians would prefer to
pay higher taxes if it would ensure more government services, the most recent Afrobarometer survey shows. Most citizens consider it fair
to tax rich people at a higher rate than ordinary people in order to fund government
programs to help the poor. But they also want the government to make sure that
small traders and other people working in the informal sector pay taxes on
their businesses. (Afrobarometer)
February 12, 2021
(Nigeria)
Majority of Nigerians say they find it difficult to get information
about taxes, new Afrobarometer study shows
Only half of Nigerians endorse the right
of the tax authorities to make people pay taxes. About the same proportion are
willing to pay higher taxes for more government services. A significant
proportion think ordinary Nigerians are required to pay too much in taxes while
the rich pay too little. Many think it is fair to tax rich people at a higher
rate than ordinary people in order to help pay for government programs to
benefit the poor. (Afrobarometer)
February 10, 2021
EUROPE
(Spain)
At home and with food at home: this is how this Valentine's Day will be
celebrated
60% of those consulted affirm that they
will celebrate with their partner this day compared to 79% who did it last
year. 56% will do it at home by ordering lunch or dinner at home. Perfumes will
be the most gifted next Sunday (44%), followed by fashion (33%) and flowers
(26%). (Ipsos)
February 09, 2021
(Austria)
Willingness to vaccinate increases significantly
39% of the respondents are determined to
be vaccinated, 22% are more determined. Around a third generally or generally
excludes a corona vaccination. At the beginning of December, almost half of the
population (49%) agreed to a corona vaccination, should the vaccine prove to be
safe and effective. (Gallup Austria)
January 28, 2021
(Finland)
How willing are employers to recruit people with physical disabilities?
According to our survey of employers,
readiness for recruitment can be found, but a slightly more disabled applicant
is expected than others. Employers' understanding of their ability to
work, the effects of an injury or illness on their job performance, and their
awareness of the possibilities of forms of support need to be further
strengthened. (Invalidi Liitto)
February 09, 2021
(UK)
Which lockdown rules should the police enforce?
New YouGov data shows that Britons mostly
think it’s important that police dedicate resources to enforcing lockdown
rules. Nearly everyone (92%) says it’s essential that officers make sure
arrivals from abroad quarantine. Previous reports suggest that up until
recently they have done little to fine those not self-isolating after travel or
tracking down travellers giving false quarantine addresses. (YouGov)
February 11, 2021
(UK)
Two in five NHS staff say patient care has declined during pandemic
New YouGov research shows that two in
five NHS workers (40%) say the quality of patient care in their workplace has
fallen compared to before the COVID-19 pandemic. This includes some 10% who say
patient care quality is now “much lower” than normal. Another 42% of NHS staff
say the quality of their workplace’s care hasn’t changed, and 4% say it has
improved. (YouGov)
February 16, 2021
NORTH AMERICA
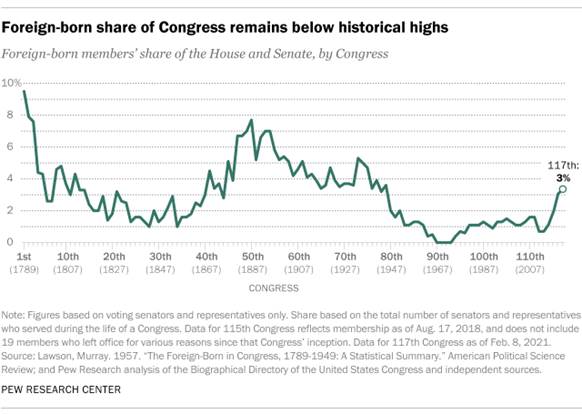
Immigrants and children of immigrants make up at
least 14% of the 117th Congress
Immigrants and the children of immigrants account for a small but
growing share of lawmakers on Capitol Hill. At least 76 (14%) of the voting
members of the 117th Congress are foreign born or have at least one parent born
in another country, a slight uptick from the prior two Congresses.
(PEW)
February 12, 2021
Boomers, Silents still
have most seats in Congress, though number of Millennials, Gen Xers is up
slightly
The number of Millennials and Generation Xers in the U.S. House of
Representatives rose slightly with the new 117th Congress, though less so than
with the 116th. And even as these generations gain representation in both
chambers, older generations still make up the majority of senators and
representatives. (PEW)
February 12, 2021
For Valentine’s Day, 5 facts on relationships and
dating in the U.S.
Valentine’s Day this year will be unlike any in recent memory as
coronavirus-related restrictions continue to limit what Americans can do to
celebrate. But many Americans may still find special ways to mark the holiday
with their loved ones or hop on a dating website or app to meet someone new.
Here are five facts about relationships and dating in the United States, based
mostly on Pew Research Center surveys and analyses conducted before the
COVID-19 pandemic. (PEW)
February 11, 2021
U.S. Senate has fewest split delegations since
direct elections began
Only six states now have U.S. senators of different parties – the
smallest number of split delegations since Americans started directly electing
their senators more than a century ago, according to a new Pew Research Center
analysis. The number of split Senate delegations has ratcheted downward since
peaking at 27 in 1979-80. There were just nine split Senate delegations in the
recently concluded 116th Congress, which tied the prior record low. (PEW)
February 11, 2021
Americans far more likely to say evangelicals will
lose influence, rather than gain it, under Biden
Evangelical Christians were among former President Donald Trump’s
most loyal supporters. So it is no surprise that half of all U.S. adults think
evangelical Christians will lose influence in Washington under President Joe
Biden’s new administration while just 9% think they will gain influence,
according to a January Pew Research Center survey. (PEW)
February 10, 2021
Support for Third U.S. Political Party at High
Point
Americans' desire for a third party has ticked up since last fall
and now sits at a high in Gallup's trend. Sixty-two percent of U.S. adults say
the "parties do such a poor job representing the American people that a
third party is needed," an increase from 57% in September. Support for a
third party has been elevated in recent years, including readings of 60% in
2013 and 2015 and 61% in 2017. (Gallup USA)
February 15, 2021
Two-Thirds of Americans Not Satisfied With Vaccine
Rollout
As the Biden administration begins to grapple with the COVID-19
situation, two-thirds of Americans say they are not satisfied with the way the
vaccination process is going in the U.S. This includes 21% who are "very
dissatisfied." At the same time, 34% are satisfied, with 4% of them
"very satisfied." (Gallup USA)
February 10, 2021
Americans' Views of Impeachment, Trump's Record on
Issues
As former President Donald Trump's second Senate impeachment trial
is about to begin, a new Gallup poll finds a slim majority of Americans (52%)
saying they would like their senators to vote to convict him. Americans tilted
against conviction in his first impeachment trial a little over a year ago.
(Gallup USA)
February 08, 2021
AUSTRALIA
New Roy Morgan Cross-Platform Audience results
show 2020 was a year of growth for Australia’s leading mastheads
In the year to December 2020 an estimated 19.2 million (91%)
Australians aged 14+ read or accessed newspapers or newspaper content in some
way – print editions, online via website, app or news platforms including
(metropolitan, local and regional titles) in an average four weeks. This
represents significant growth of 3% points from the 6 months to June when the
total cross-platform audience for newspapers was 18.5 million (88%).
MULTICOUNTRY STUDIES
North American Tracker: Biden’s Presidential Win:
The Impact On Canada
61% of Canadians and 43% of Americans think the election of Joe
Biden as President of the United States will improve Canada-US relations.
47% of Canadians think that Biden promoting Buy American policies will
negatively impact the Canadian economy, 40% think it will have no real impact,
and 13% think it will have a positive impact. (LEO News)
February 9, 2021
Digital media usage during times of distress
COVID-19 has disrupted livelihoods and economies across the world,
changing consumption patterns of all different types of products and services,
including digital media. The Arab World is no exception, though perhaps the
transformation in digital media consumption has been accelerated by the
pandemic outbreak. The Arab world has witnessed a steady increase in both
internet usage and social media penetration, as well as increasing reliance on
social media for breaking news. (Arab Barometer)
February 10, 2021
Global survey: Where should facemasks be
mandatory?
People around the world tend to agree on mask use indoors apart
from in their own homes. The global rise in facemask use has been one of the
defining features of the COVID-19 pandemic. Research from the YouGov-Cambridge
Globalism Project carried out in 25 countries last summer reveals where people
think wearing a facemask should be compulsory during the pandemic. (YouGov)
February 09, 2021
ASIA
677-43-01/Poll
Inflation Unchecked Since Modi Became PM, Life of Most
Indians Affected in 2020: Key Takeaways From IANS-CVoter Pre-Budget Survey
The survey reflects the growing worries on the economic front in a pandemic-hit year, on the eve of the Union Budget on Monday.
The Modi government in 2020 is faring as the worst on the economic front since it came to power in 2014, according to an IANS-CVoter pre-budget survey.
As many as 46.4 per cent said that under Prime Minister Narendra Modi and Finance Minister Nirmala Sitharaman, the performance of the Central government on the economic front so far has been worse than expected. A lesser number of 31.7 per cent said the performance is better than expected.
This is the worst score for any government since 2010, except in 2013 when Manmohan Singh was Prime Minister and P Chidambaram was Finance Minister. In 2013, 60 per cent respondents said the delivery on the economic front was worse than expected.
The pandemic has severely impacted the economy and experts have recommended that the government should come up with measures to put in more money in the hands of the people to boost demand and support the economy.
The sample size of the poll is 4,000 plus and the fieldwork for the survey was done in third-fourth week of January 2021. The theme of the survey is “Expectations from the Union Budget”.
Over 72% say inflation has been unchecked since Modi became PM
Almost three-fourth respondents feel that after Narendra Modi became Prime Minister, inflation has been unchecked and prices have gone up, as per the IANS-CVoter Budget Tracker.
At 72.1, this is the highest percentage in PM Modi’s tenure who feel this way compared to a low of 17.1 per cent in 2015.
In 2020, only 10.8 per cent of the respondents said that prices have gone down while 12.8 per cent said nothing has changed.
The sample size of the poll is 4,000 plus and the fieldwork for the survey was done in third-fourth week of January 2021. The theme of the survey is “Expectations from the Union Budget”.
To a question in the survey, 72.1 per cent respondents said after Narendra Modi became Prime Minister, inflation has been unchecked and prices have gone up. This is the worst score for the Modi government on the inflation front since 2015.
Inflation affected life of most Indians in 2020
Over 70 per cent people have felt the impact of high commodity prices in the past one year, according to an IANS-CVoter pre-budget survey.
The survey showed that 38.2 per cent of respondents said that their quality of life has been “too much” adversely affected due to inflation in the past one year, and 34.9 per cent said that the there was “little bit” of impact.
However, 26.7 per cent people did not feel any impact of high inflation at all.
For most of 2020, inflation remained at elevated levels, on the back of high food and fuel prices.
Most Indians feel common man’s quality of life deteriorated in past year
As the coronavirus pandemic wreaked havoc on the economy and people’s livelihood, the survey has shown that nearly 50 per cent Indians feel that the quality of life of a common man has deteriorated in the past one year.
Around 48.4 per cent of the respondents feel the common man’s quality of life has “deteriorated” and 21.3 per cent felt that it has remained the same.
However on the other hand, 28.8 per cent respondents said that the quality of life has, in fact, improved during the pandemic-hit past one year.
Four-member family needs up to Rs 20,000 income for average quality of life
Over a majority, or 51.5 per cent, feel that an income of up to Rs 20,000 per month is required by a family of four for an average quality of life, as per the survey.
A total of 23.6 per cent respondents said that an income of Rs 20,000-30,000 per month is required for an average quality of life, while another 10 per cent feel that Rs 30,000-40,000 is required.
Another 8.6 per cent people felt the need of up to Rs 50,000-1,00,000 per month for a family of four people.
According to the survey, 81.4 per cent feel that the income required to live an average quality of life should be tax free, while 12.7 per cent of the respondents feel that it should be taxed.
Most Indians facing difficulty in managing their expenses
A majority of Indians are finding it difficult to manage their expenses, showed the IANS-CVoter pre-budget survey.
Around 65.8 per cent respondents in the survey said that current expenses have become difficult to manage, while 30 per cent people said that although expenses have gone up, they are in manageable limits.
A miniscule 2.1 per cent of the respondents said that their expenses have gone down in the past one year and another 2.1 per cent could not respond on the matter.
The survey also showed that with a massive impact of the pandemic on businesses and people’s earnings, purchasing power of most Indians weakened in the past one year.
37% people feel common man’s quality of life to improve this year
As 2020 was largely marred by the pandemic and its impact on people’s income, the IANS-CVoter survey reveals that 37.4 per cent respondents feel that the quality of life of the common man will improve in the next one year.
Another 21.7 per cent of the respondents felt that the quality of life of a common Indian will remain the same, while 25.8 per cent of the respondents said that the quality of life will deteriorate further in days ahead.
Around 15 per cent respondents said that they cannot respond on the matter.
According to the Economic Survey 2020-21, which was presented in the Parliament on Friday by Union Finance Minister Nirmala Sitharaman, the GDP of India is likely to contract by 7.7 per cent in FY 2021.
It has also anticipated that the Indian economy would grow at over 11 per cent in the next fiscal.
(CVoter)
February 01, 2021
MENA
677-43-02/Poll
During January, Pepsi achieved the highest uplift in Ad Awareness of any brand in Egypt
Giant soft-drink brand, Pepsi, enjoyed the greatest improvement in Ad Awareness of any brand in Egypt during January. The uplift coincides with the brands new creative campaign, featuring famous icon Amr Diab, which appears to have resonated with the public. The advert was released at the beginning of January and using nostalgic themes looks back on the last 20 years of the Amr Diab and Pepsi collaboration. In addition to the adverts (released on digital and out of home across Cairo), Pepsi also launched Amr Diab limited edition Pepsi cans and a competition whereby consumers could collect Pepsi bottle caps and cans and exchange them for Amr Diab branded gifts.
YouGov brand tracking data shows that people are certainly noticing the ads, with Pepsi’s Ad Awareness score rising by 10 points, from +43.1 on January 1st to +53.1 on January 28th. Looking at the data by age group shows among 35 to 44 year olds, these numbers are even higher, with Ad Awareness reaching +60.2 at the end of January, increasing by 14 points throughout the month.
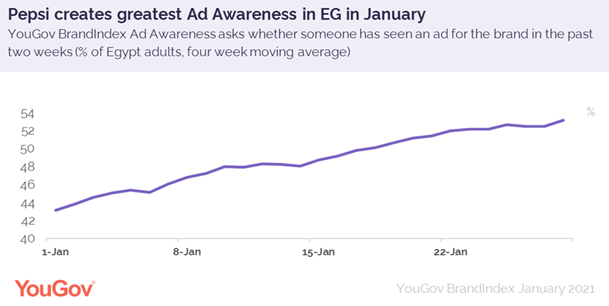
Not only are people noticing the campaign, but it has got people talking too. Pepsi’s Word of Mouth score (whether you have talked about a brand with friends or family) improved by 6.5 points throughout January, while Buzz (sentiment tracking) increased by 5. In terms of behavioural changes, BrandIndex Consideration tracking (whether a respondent would consider a brand) shows an uplift of 3.1% throughout January.
The success of this campaign will continue to be tracked in BrandIndex over the coming weeks, and we will get a better idea of whether the newest Amr Diab and Pepsi collaboration has translated to greater Current Customer numbers for Pepsi in Egypt.
(YouGov)
February 04, 2021
Source:
https://mena.yougov.com/en/news/2021/02/04/during-january-pepsi-achieved-highest-uplift-ad-aw/
AFRICA
677-43-03/Poll
Ethiopians endorse higher taxes in exchange for more government services, Afrobarometer survey shows
A majority of Ethiopians would prefer to pay higher taxes if it would ensure more government services, the most recent Afrobarometer survey shows.
Most citizens consider it fair to tax rich people at a higher rate than ordinary people in order to fund government programs to help the poor. But they also want the government to make sure that small traders and other people working in the informal sector pay taxes on their businesses
About half think that ordinary people pay too much in taxes and say they find it difficult to get information about what taxes and fees they are supposed to pay.
(Afrobarometer)
February 12, 2021
677-43-04/Poll
Majority of Nigerians say they find it difficult to get information about taxes, new Afrobarometer study shows
A majority of Nigerians say they find it difficult to get information about taxes they are supposed to pay and how the government uses taxes revenues, the latest Afrobarometer study shows.
Only half of Nigerians endorse the right of the tax authorities to make people pay taxes. About the same proportion are willing to pay higher taxes for more government services. A significant proportion think ordinary Nigerians are required to pay too much in taxes while the rich pay too little. Many think it is fair to tax rich people at a higher rate than ordinary people in order to help pay for government programs to benefit the poor.
The study also shows that a significant proportion of citizens want the government to strengthen the tax net to ensure that small traders and other workers in the informal sector pay taxes on their businesses.
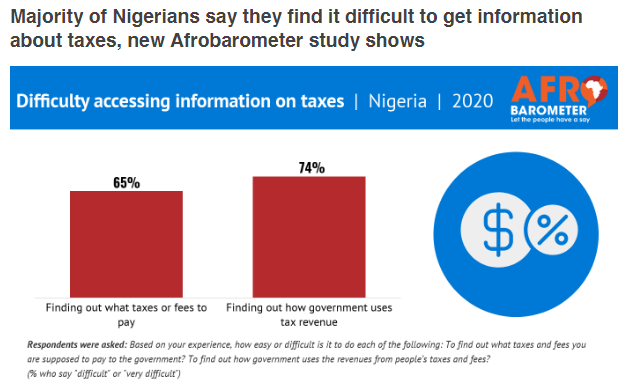
(Afrobarometer)
February 10, 2021
EUROPE
677-43-05/Poll
At home and with food at home: this is how this Valentine's Day will be celebrated
60% of those consulted affirm that they will celebrate with their partner this day compared to 79% who did it last year. 56% will do it at home by ordering lunch or dinner at home. Perfumes will be the most gifted next Sunday (44%), followed by fashion (33%) and flowers (26%).
We have been living in a situation of constant uncertainty for almost a year that has already affected numerous important dates such as last Christmas, now we are a few days away from another important appointment (for some more than for others), since this Sunday is Valentine's Day and no one is clear on how to celebrate love in times of pandemic.
To clear these doubts and better understand how this date is presented in such an exceptional year, Ipsos has made a consultation through its What & Why online Community to find out what Valentine's Day will be like in the middle of the pandemic.
The first notable difference is found between the percentage of respondents who celebrated Valentine's Day last year compared to those who will do so next Sunday, registering a difference of 19 points (79% vs 60%). In addition, this year the figure of the undecided arises, and that is that 22% are still thinking about whether to do something special that day.
Love ... for delivery
The closure and generalized restrictions in the hospitality industry, the different curfews and the recommendation to reduce social life will mean that on Sunday 56% of those surveyed choose to order food at home and enjoy it as a couple. And even for 50% food will not be part of the equation and they will dedicate themselves to enjoying each other in the warmth of the home. 22% will be encouraged to go out to have lunch or dinner at a restaurant, perhaps longing for a certain normality, and 20% will choose outdoor spaces as a plan more adapted to the reality in which we are immersed. Another 12% will choose an activity that provides them some relaxation in the midst of this situation, such as a spa or a massage, and 11% will opt for a cultural plan.
What does love smell like?
There is something that the pandemic has not yet been able to take away from us, and that is to give something to that special person for Valentine's Day, therefore, a large majority (75%) of those consulted say that they will buy a detail for their partner on this occasion. Nor has the coronavirus been able to with one of the great classics of this date, and that is that 44% will give a perfume next Sunday. Clothing or footwear will be chosen by 33%, 26% of those consulted will opt for something that never fails either, such as flowers, closely followed (25%) by those who will buy a fashion accessory, and 24 % will choose a technological product to surprise their partner.
(Ipsos)
February 09, 2021
Source: https://www.ipsos.com/es-es/en-casa-y-con-comida-domicilio-asi-se-celebrara-este-san-valentin
677-43-06/Poll
Willingness to vaccinate increases significantly
One month after the start of the corona vaccination, the willingness to be vaccinated is 61% in Austria. The coronavirus threat is taken seriously.
39% of the respondents are determined to be vaccinated, 22% are more determined. Around a third generally or generally excludes a corona vaccination. At the beginning of December, almost half of the population (49%) agreed to a corona vaccination, should the vaccine prove to be safe and effective.
The willingness to vaccinate is highest among people over 50 years of age (74% “yes, definitely” and “more or less yes”) and people with a high level of formal education (75%). Men are still more likely than women to agree to a vaccination (66% vs. 56%).
(Gallup Austria)
January 28, 2021
677-43-07/Poll
How willing are employers to recruit people with physical disabilities?
According to our survey of employers, readiness for recruitment can be found, but a slightly more disabled applicant is expected than others. Employers' understanding of their ability to work, the effects of an injury or illness on their job performance, and their awareness of the possibilities of forms of support need to be further strengthened.
There is readiness to hire
Of the employers who responded to the survey, 62 percent had no experience of physical disability in their immediate circle. Only 14 percent of the respondents identified that the organization employs a person or person with a physical disability. Most of these organizations were large, more than a hundred person organizations. The result itself is not surprising, not all injuries are visible in the external nature, and so respondents may not have knowledge of the physical functioning of their employees.
The study asked “Would your organization be willing to hire a person with a physical disability if such a person were among the applicants?”. Fifty-seven percent of respondents were willing to hire a person with a physical disability. Uncertain answers were found by 27 percent of respondents and 16 percent indicated that they would not be willing to hire. Among the respondents, large companies with more than 100 employees stood out, of which 75 per cent were willing to hire a person with a physical disability, and none of these answered that they could not hire a person with a physical disability. There was more hesitation in small businesses.
The majority of respondents showed a positive willingness to recruit people with physical disabilities, which is a positive contribution of this study. A positive attitude means that when the right job and the right job seeker meet, there are no barriers to hiring.
Ignorance and attitudes as
barriers to hiring
In those organizations that were hesitant to hire, the negative attitude was usually influenced by the physical nature of the job. In these organizations, work was at least assumed to be unsuitable for job seekers with physical disabilities, as evidenced in the following comment: “The industry is physically heavy. A two-storey production plant without a lift would be an unreasonable additional challenge for people with reduced mobility. ”
The next most recognizable in the responses were attitudes related to attitudes and ignorance, as in this response: “The productivity of a worker with reduced mobility may not be sufficient to cover the wage and incidental costs incurred. The work we have requires a certain speed and dexterity. We do not have the time and resources to devote to the bureaucracy and paperwork of possible subsidies related to wage costs. ”
There are often no alternatives to the physical nature of work, but attitudes and ignorance can be corrected by communicating labor potential and different job opportunities. In addition, there is currently strong development work in employer support services in TE services.
There are more expectations
for a jobseeker with a physical disability
Companies were asked what things have affected when new employees have been recruited to the organization. By far the most emphasized in the responses was the jobseeker's competence and attitude to work. After these, the jobseeker's motivation received the most mentions. Organizations that had previously hired an employee with a physical disability were also asked about the factors that influenced the employment of the disabled person.
Also in this group of respondents, competence, attitude to work and motivation rose to the top even with clearly higher percentages than in the whole group of respondents. However, the difference in the responses of the whole set is reflected in the fact that the organizations that hired people with physical disabilities placed more emphasis on social skills, personality, and flexibility than the entire set of respondents.
The noticeable difference in responses suggests that an applicant with a physical disability is expected to have personality, social skills and flexibility more often than other applicants in addition to competence, motivation and attitude. Alongside these expectations, looking at the willingness of organizations to hire an applicant with a physical disability, one may consider whether the hesitation of small businesses is affected by the presumption that the disabled person is unable to be flexible in their jobs.
In a small company, an employee is likely to be required to have more flexibility in terms of work tasks and thus it may be assumed that an employee with a physical disability is not capable of everything required in the company. In large companies, on the other hand, there are several different work tasks, which means that options are also available for people with physical disabilities.
Physical disability usually
does not matter in hiring
Most of the organizations that previously recruited people with physical disabilities were large, more than a hundred organizations. The majority of these (73%) answered that the physical disability was not a disadvantage in the job in question and that the physical disability had no effect on pay in general (54%). Respondents also saw that a person’s skills added value to the company (46%) and hiring matched the values of the organization (35%).
Quite a few of the organizations that hired people with reduced mobility highlighted the possibility of wage subsidies as a factor influencing the hiring decision. According to previous surveys, wage subsidies have been seen as a somewhat cumbersome and bureaucratic form of support for employers, and even on the basis of this study, it appears to be relatively little used. However, the state administration is in the process of developing wage subsidies and the aim is to make it more attractive to companies.
Organizational support for
working conditions unknown to employers
The study also found out how familiar the organizational support for working conditions is for respondents. Organizational support for working conditions is a financial support applied for from the Employment and Economic Development Office, which can compensate for new work equipment or furniture or alterations at the workplace or assistance from another employee required by the injury or illness of a person hired or already employed.
Arrangement support for working conditions was familiar to 12% of respondents. More familiar support was found in larger organizations of more than 100 people (35%) than in small organizations of less than 20 people (9%). Twenty per cent of the companies that recruited people with reduced mobility had used support for the organization of working conditions. The support had been used e.g. the purchase of a ramp, a dictation program, a lift, special equipment and electronic door opening mechanisms.
The labor potential of
people with disabilities is visible
The survey was answered by a number of CEOs or equivalent or HR people representing different organizations. Although the sample is small from the Finnish organizational field, we can state that its results are in line with previous studies. In summary:
- A very small proportion of organizations have hired people with physical disabilities (consciously).
- Understanding of the potential of people with physical disabilities in the labor market is weak.
- A person with a physical disability has more expectations than in normal recruitment.
- Knowledge and use of organizational support for working conditions is limited (although one might imagine that it can specifically offset the recruitment of a disabled worker).
The results of the economic study tell us that there is still a need to invest in informing, campaigning and telling working life stories about the employment potential of people with disabilities in the media.
(Invalidi Liitto)
February 09, 2021
677-43-08/Poll
Which lockdown rules should the police enforce?
Britons want the police to
dedicate resources to ensuring shoppers wear masks – and half say stopping
vehicles to make sure people don’t travel too far is important too
No lockdown would be complete without news stories of overzealous police officers fining walkers that they deem to have wandered too far, stopping vehicles, or, as we saw in spring, cracking down on easter egg sales.
New YouGov data shows that Britons mostly think it’s important that police dedicate resources to enforcing lockdown rules. Nearly everyone (92%) says it’s essential that officers make sure arrivals from abroad quarantine. Previous reports suggest that up until recently they have done little to fine those not self-isolating after travel or tracking down travellers giving false quarantine addresses.
Fining people at parties with more than 15 attendees is likewise universally popular at 88%, while three quarters (75%) say police should also focus on fining those celebrating in smaller numbers.
Police in England earlier this month said they will not enforce mask-wearing in supermarkets because it’s “impossible” and diverts limited resources away from other matters such as domestic violence. But four in five Britons (79%) say they should be checking whether shoppers and people on public transport are wearing masks.
The public are split on the benefit of stopping vehicles to ensure drivers are staying close to where they live. Half (52%) believe it’s important, while just ofter two fifths (44%) do not.
Meanwhile, only a third (34% in each instance) say it’s imperative that officers stop pedestrians to ask if they’ve left the house for an approved purpose, or make sure people who exercise are not too far from home.
Older people generally feel more convinced that the police should spend resources on the tasks we asked about. For example, nearly half of people aged 65+ (47%) want officers to make sure those who are out exercising stay local, compared with only 15% of Britons aged 18 to 24.
Likewise, two in five older people (42%) say it’s important that the police stop pedestrians to make sure they’ve left the house for an approved purpose, while only a fifth of 18- to 24-year-olds (20%) agree.
(YouGov)
February 11, 2021
677-43-09/Poll
Four in ten straight women have been let down by a partner on Valentine’s Day
Gay or bisexual women are
noticeably less likely to have been disappointed
It’s Valentine’s Day this Sunday, and couples across the land will be looking for ways to show their appreciation for one another as best they can around the coronavirus restrictions.
Inevitably, some will find themselves let down by their partner’s lack of effort, and a new YouGov survey shows that men seem to be letting the side down.
Overall, 26% of Britons say they have felt disappointed by a romantic partner not doing enough for Valentine’s Day – but this figure is 38% among women and just 12% among men.
Lesbian and bisexual women are noticeably less likely to report having been let down (26%) than straight women (38%). Likewise, gay and bisexual men are more likely than straight men to report having been disappointed by a poor showing from their partner (22% vs 11%).

(YouGov)
February 12, 2021
677-43-10/Poll
Two in five NHS staff say patient care has declined during pandemic
Nine in ten healthcare
workers are worried about the impact on non-COVID patients with conditions such
as cancer
New YouGov research shows that two in five NHS workers (40%) say the quality of patient care in their workplace has fallen compared to before the COVID-19 pandemic. This includes some 10% who say patient care quality is now “much lower” than normal.
Another 42% of NHS staff say the quality of their workplace’s care hasn’t changed, and 4% say it has improved.
However, among private sector healthcare workers, the majority (60%) say the quality of care where they work has not changed, with only 20% of those working in private healthcare saying their quality of care has fallen during the pandemic.
Healthcare workers report
not having enough time with each patient
The research also shows the time constraints patient-facing healthcare workers in the NHS and the private sector are facing. Just over a third of staff who care for patients with chronic or long-term health conditions say they either have “much less” (17%) or “somewhat less” (19%) time than necessary to give each patient the attention they need. A small minority (9%) say they have more time than required.
The figures are similar for coronavirus patients. One in three staff working with these say they have much (14%) or somewhat (21%) less time than necessary, while 12% say they have more than enough.
Staff caring for people with acute or short-term health problems report similar constraints, with 13% saying they have much less time than needed, while a fifth (22%) are somewhat short. One in ten (10%) have more time than they need.
Staff are worried about the
impact on non-COVID patients
Most healthcare workers are either very (48%) or somewhat (44%) fearful for how the pandemic is affecting patients suffering from other conditions than coronavirus such as cancer.
Among those working for the NHS, nearly all staff (91%) say normal services continue to suffer from some level of disruption due to the pandemic.
One in eleven (9%) say that they are not running at all, and another 48% of staff say their normal functions are heavily disrupted. Only 3% of NHS staff say their normal services are no longer affected, and 4% say their services were never disrupted by the pandemic.
(YouGov)
February 16, 2021
NORTH AMERICA
677-43-11/Poll
Immigrants and children of immigrants make up at least 14% of the 117th Congress
Immigrants and the children of immigrants account for a small but growing share of lawmakers on Capitol Hill. At least 76 (14%) of the voting members of the 117th Congress are foreign born or have at least one parent born in another country, a slight uptick from the prior two Congresses.
Overall, there are 18 foreign-born members of the 117th Congress – 17 representatives and one senator, Mazie Hirono, D-Hawaii, who was born in Japan. At least 58 other members, including 42 in the House and 16 in the Senate, were born in the United States or its territories to at least one immigrant parent, according to a Pew Research Center analysis of biographical information from the Congressional Research Service, news stories and members’ official websites and genealogical records through Feb. 8.
How we did this
The 18 immigrant lawmakers in the current Congress represent just 3% of all voting members, a lower share than the foreign-born share of Congresses many decades ago. For example, about 10% of members in the first and much smaller Congress of 1789-91 were foreign born. About a century later, in the 50th Congress of 1887-89, 8% of members were born abroad, according to a previous analysis.
The current share of foreign-born lawmakers in Congress is also far below the foreign-born share of the U.S. as a whole, which was 13.7% as of 2018.
Democrats far outnumber Republicans among both immigrants and children of immigrants in Congress. Fourteen of the 18 foreign-born members are Democrats, as are 44 of the 58 members who are children of immigrants. That includes Sen. Bernie Sanders of Vermont, an independent who caucuses with Democrats: His father came to the U.S. from Poland.
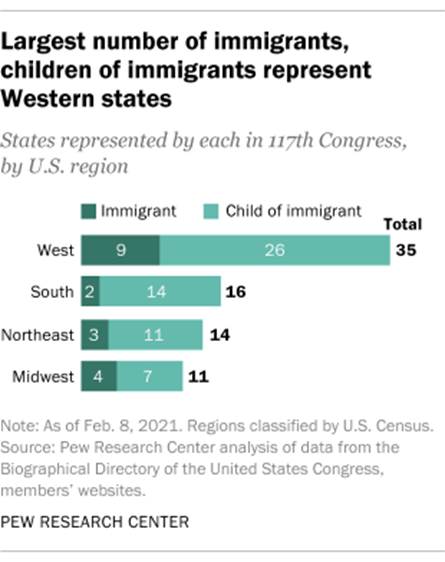
Immigrants and children of immigrants represent 27 states. Far more of these lawmakers come from Western states (35) than from any other of three other major U.S. regions: the South (16), Northeast (14) and Midwest (11). California has by far the most: 22 of the state’s 55 members of Congress are immigrants or children of immigrants. New York, Florida and Illinois all have five members of their delegations who are immigrants or children of immigrants, tied for the second-highest total.
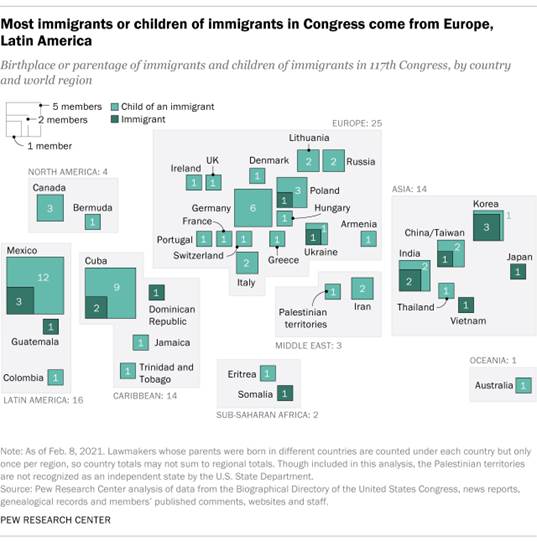
Europe is the most common origin region for immigrant lawmakers or those who are children of immigrants. About one-third (32%) have roots in countries there. Latin America (20%) and the Caribbean region (18%) each account for roughly one-in-five immigrants and children of immigrants, and most of these lawmakers have roots in Mexico (15) or Cuba (11). Asia has a similar share, 18%. Collectively, 70% of immigrants and children of immigrants in Congress have origins in countries in Europe, Latin America or the Caribbean.
Much smaller shares claim heritage in countries in the Middle East, North America and sub-Saharan Africa – each at or below 5%. (Some lawmakers in this analysis are tallied under more than one country and region. For example, Rep. Anthony Brown, D-Md., has a Caribbean father and a European mother.)
Some lawmakers in the current Congress have achieved notable firsts. For
example, Rep. Marilyn Strickland, D-Wash., wore
a hanbok, a traditional Korean garment, at
her swearing-in ceremony in honor of her mother and heritage. She became one of
the first three Korean American women elected to Congress last year, alongside
Michelle Steel and Young Kim, both California Republicans.
Under the
U.S. Constitution, an immigrant taking office in the House must be a
U.S. citizen for seven years or more, age 25 or older and living in the state
where they are elected. Nine years of citizenship are required to serve in the
Senate, and the person must be 30 or older and live in the represented state
when elected.
(PEW)
February 12, 2021
677-43-12/Poll
Boomers, Silents still have most seats in Congress, though number of Millennials, Gen Xers is up slightly
The number of Millennials and Generation Xers in the U.S. House of Representatives rose slightly with the new 117th Congress, though less so than with the 116th. And even as these generations gain representation in both chambers, older generations still make up the majority of senators and representatives.
How we did this
Republicans added more Millennials and Gen Xers (28) to the House in this election cycle than Democrats did (10), according to a Pew Research Center analysis. By comparison, in the 116th Congress, 46 of 64 new Millennial and Gen X House members were Democrats.
The latest election cycle brought the House its youngest current representative (Madison Cawthorn of North Carolina) and the Senate its first Millennial (Jon Ossoff of Georgia).
In the new Congress, 31 House members are Millennials (born between 1981 and 1996), up from only five at the start of the 115th Congress in January 2017. Overall, 11 of the 61 new House members are Millennials, bringing that generation’s share of members in the chamber to 7%. Seven of those 11 new members are Republicans.
Twenty-seven of the new representatives are from Gen X (those born from 1965 to 1980), making them the highest share among the new members, and most of them (21) are Republicans. That brings Gen X’s share of the House to 33% (144 members, little changed since the last Congress).
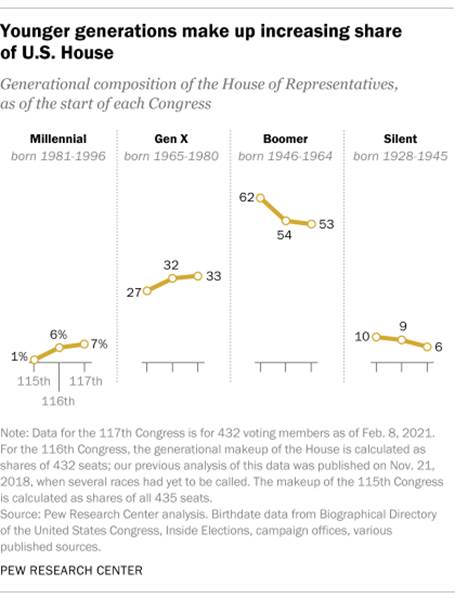
Though there were only minor shifts in the age demographics from the 116th House of Representatives to the 117th, the shares of Baby Boomer (born 1946 to 1964) and Silent Generation (born 1928 to 1945) members have continued to decrease in the House since the 115th Congress.
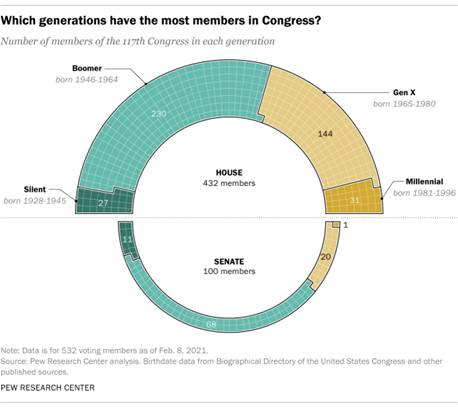
Boomers make up 230 voting members (53%) in the House, down from 270 representatives (62%) in the 115th Congress. And the ranks of the Silent Generation continue to dwindle, from 42 (10%) at the start of the 115th Congress to 27 (6%) now.
In the Senate, Boomers remain the majority (68), and their numbers have risen slightly from the last Congress (66) and the prior one (65). The number of Silent Generation senators has fallen from 19 in 2017 to 11 now. But the number of Gen Xers has ticked up over the last few Congresses, from 16 in the 115th to 20 in the current session.
The median age of senators has risen over the last several Congresses. The median age in the current session is 64.8 years old, a slight increase from the 116th (63.6) and 115th Congresses (62.4).
Among House members, meanwhile, the median age ticked up slightly to 58.9, compared with 58 in the 116th Congress and 58.4 in the 115th. The median age of all new members is somewhat lower, at 52.1.
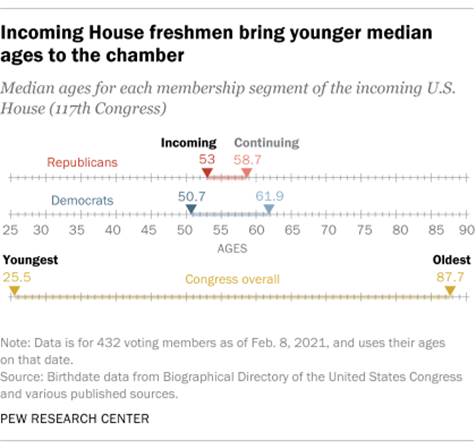
When comparing the ages of new and continuing House members, the gap is widest among Democrats, who as a whole have a median age of 60.6. The median age of the 206 Democrats who were reelected is 61.9; the 17 newly elected Democrats have a median age of 50.7. This gap is not as pronounced as in the previous Congress, when the continuing Democrats had a median age of 64.3 versus a median of 45.8 among newly elected Democrats.
The 165 Republican House members continuing into the 117th Congress have a median age of 58.7, while the 44 new GOP representatives have a median age of 53. For all Republican House members, the median age is 57.3. As with Democrats, the age gap between new and reelected GOP members is narrower than in the 116th Congress, when continuing Republicans had a median age of 58.4 and new GOP representatives had a median age of 48.9.
(PEW)
February 12, 2021
677-43-13/Poll
For Valentine’s Day, 5 facts on relationships and dating in the U.S.
Valentine’s Day this year will be unlike any in recent memory as coronavirus-related restrictions continue to limit what Americans can do to celebrate. But many Americans may still find special ways to mark the holiday with their loved ones or hop on a dating website or app to meet someone new. Here are five facts about relationships and dating in the United States, based mostly on Pew Research Center surveys and analyses conducted before the COVID-19 pandemic.
How we did this
Married and cohabiting adults are just as satisfied with their relationships as they were before the coronavirus outbreak.
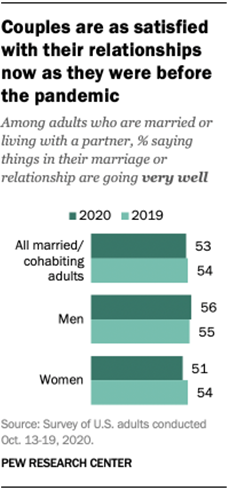
The pandemic has reshaped many aspects of American life, and the relationship and dating landscape is no exception. Still, as of October 2020, adults who were married or living with a partner were just as likely to say they are satisfied with their relationship as they had been before the outbreak.
Despite stay-at-home orders and other pandemic-related restrictions that might have put a strain on many relationships, 53% of married or cohabiting adults said things in their marriage or relationship were going very well in 2020 – virtually unchanged from 54% in 2019.
Three-in-ten Americans had used a dating site or app as of 2019, and most said their experiences were positive. Some 30% of Americans said in October 2019 that they had ever used a dating site or app, though it remains to be seen if and how the coronavirus pandemic has impacted these figures.
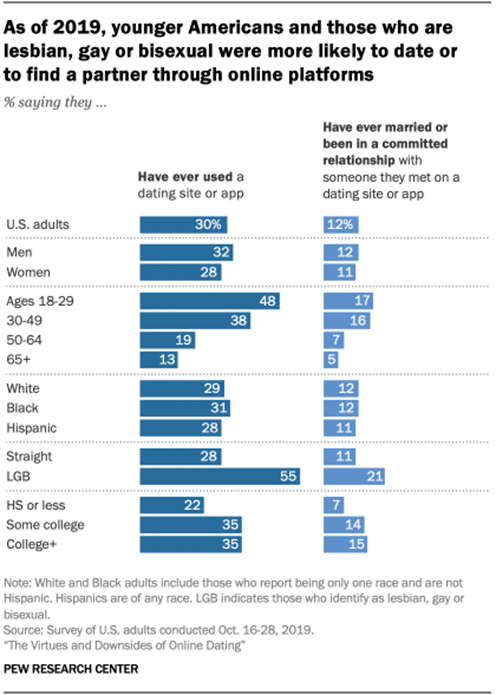
There are some demographic differences in who uses online dating websites or apps, especially along age, sexual orientation and educational lines, according to the 2019 survey. About half (48%) of adults ages 18 to 29 said they had ever used a dating site or app, followed by 38% of adults ages 30 to 49. The shares were substantially smaller for older adults: 19% of adults 50 to 64 and 13% of those 65 and older said they had ever used a dating site or app. When it comes to sexual orientation, lesbian, gay and bisexual (LGB) adults were about twice as likely as straight adults to say they had used a dating site or app (55% vs. 28%).
About six-in-ten online daters said their experience using these sites or apps had been very or somewhat positive, while 42% described their experiences as very or somewhat negative. Majorities of online dating users said it was at least somewhat easy to find people who they were physically attracted to (71%); shared their hobbies and interests (64%); seemed like someone they wanted to meet in person (64%); and were looking for the same kind of relationship (61%).
Single Americans said in 2019 that they were generally open to dating people from a variety of backgrounds, but some characteristics would give them pause.
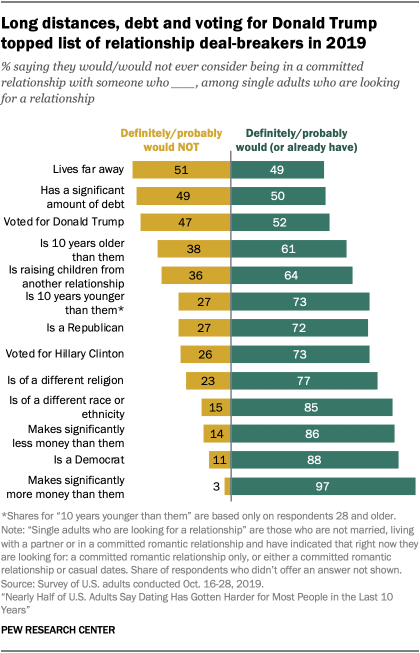
In the 2019 survey, about half of single adults who were looking for a relationship said they would definitely or probably not consider seriously dating someone who lived far away (51%), had a significant amount of debt (49%) or had voted for Donald Trump in 2016 (47%).
Other items on the list of potential relationship deal-breakers included dating someone who was 10 years older (38%) or someone who was raising children from another relationship (36%). But majorities of single adults looking for a relationship were still open to dating someone with these characteristics.
Meanwhile, a significant majority of single adults who were looking for a relationship said they would definitely or probably date someone who was a different race or ethnicity (85%) or a different religion (77%) from them.
Most Americans said in 2019 that premarital and casual sex were at least sometimes acceptable, but sex on a first date and open relationships were seen as more taboo.
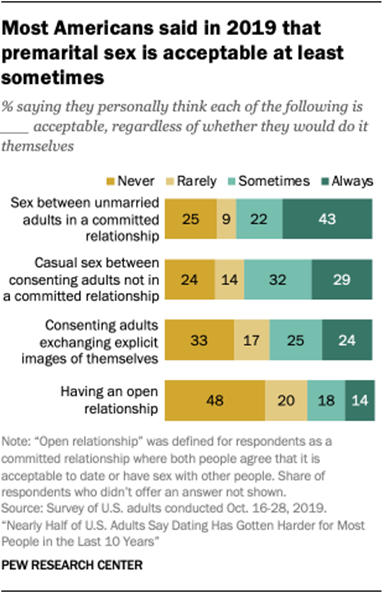
Around two-thirds of adults (65%) said sex between unmarried adults in a committed relationship is sometimes or always acceptable, while a slightly smaller share (62%) said the same about casual sex between consenting adults.
Open relationships – that is, committed relationships where both people agree that it is acceptable to date or have sex with other people – were viewed as the least acceptable behavior of those asked about in the survey, with 68% of adults saying this type of arrangement is rarely or never acceptable. Views on the exchange of explicit images between consenting adults were more evenly divided.
There were differences by sexual orientation in views of these relationship arrangements and behaviors. LGB adults, for example, were significantly more likely than straight adults (61% vs. 29%) to say that having an open relationship is always or sometimes acceptable. They were also more likely than their straight counterparts (74% vs. 47%) to say it is at least sometimes acceptable for two consenting adults to exchange explicit images of themselves. And while majorities of both LGB and straight adults said premarital and casual sex are acceptable, LGB adults were significantly more likely to say this. When it comes to premarital sex, 77% of LGB adults said it was acceptable, compared with 64% of straight adults, and the differences between these groups only increase for casual sex: 86% of LGB adults said it was acceptable, compared with 60% of straight adults.
As of 2019, single Americans ages 65 and older were less likely to be looking to date, but around a quarter had still tried online dating. Three-quarters of singles 65 and older said in 2019 that they were not looking for a date or a committed relationship. These older singles – the vast majority of whom were widowed or divorced – also were less likely than their younger counterparts to say they felt pressure to find a partner. Roughly two-in-ten said they felt pressure from society to be in a relationship (vs. 53% of 18- to 29-year-olds) or pressure from family members (vs. 47% of 18- to 29-year-olds).
Around a quarter (27%) of single Americans ages 65 and up said they had tried online dating at some point. Yet among all partnered adults, only 5% of those 65 and older said they found their spouse or partner online, compared with 21% of partnered adults 18 to 29. It was more common for partnered adults 65 and older to have met their spouse or partner in an offline setting, such as through family or friends (30%), work (20%) or school (15%).
Overall, 36% of Americans ages 65 and older were single in 2019, and among this group, women were much more likely than men to be single (49% vs. 21%).
(PEW)
February 11, 2021
677-43-14/Poll
U.S. Senate has
fewest split delegations since direct elections began
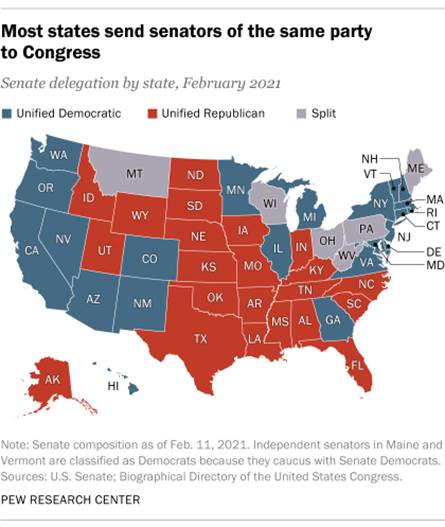
Only six states now have U.S. senators of different parties – the smallest number of split delegations since Americans started directly electing their senators more than a century ago, according to a new Pew Research Center analysis.
The number of split Senate delegations has ratcheted downward since peaking at 27 in 1979-80. There were just nine split Senate delegations in the recently concluded 116th Congress, which tied the prior record low.
How we did this
This analysis examines every Senate since the general election of 1914, the first one after ratification of the 17th Amendment, which provided for the direct election of senators.
From the beginning of our analysis until the late 1960s and early 1970s, the number of split Senate delegations generally oscillated between 10 and 20. The count fell to nine in the closely divided 84th Congress (1955-56), in which Democrats held a 49-to-47 majority thanks to independent-turned-Democrat Wayne Morse of Oregon.
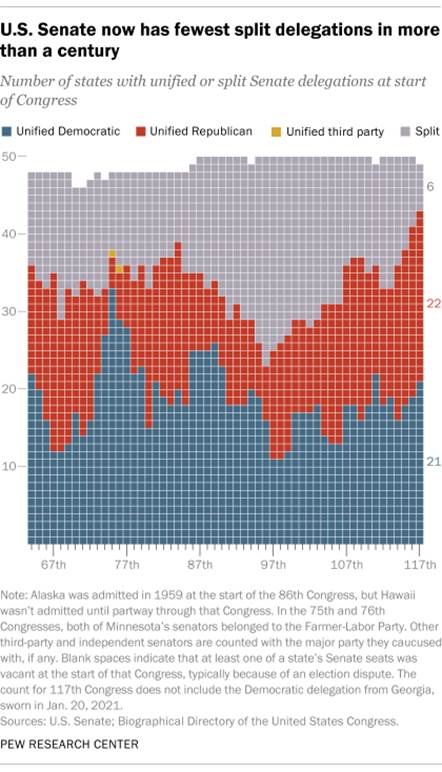
Politically divided delegations became more common in the 1960s and ’70s, as decades-old patterns of state-level party dominance began to break down. By the 96th Congress of 1979-80, more than half the states (27) had split delegations; from 1973 through 1994, there were never fewer than 20 split delegations in the Senate.
Since then, however, the trend has been toward more and more single-party delegations, as partisanship has grown and many long-serving senators died or retired. It wasn’t that long ago that states like Arkansas, Louisiana and Nebraska could send two Democratic senators to Washington, while Republicans could and did win in states like New York, Illinois and Oregon.
In another reflection of the partisan polarization that has reshaped American politics over the past few decades, states’ current Senate delegations are remarkably aligned with their presidential preferences.
In the current Congress, all 22 states with two Democratic senators went for Democratic nominee Joe Biden in the November election, and all 22 states with two Republican senators went for GOP incumbent Donald Trump. Three of the states with split Senate delegations – Montana, Ohio and West Virginia – chose Trump, while the other two (Pennsylvania and Wisconsin) opted for Biden. (Two states, Maine and Nebraska, allocate their electoral votes by congressional district. Maine, which has a split Senate delegation, gave three of its four electoral votes to Biden and one to Trump. Nebraska, which has two Republican senators, gave four of its five electoral votes to Trump and one to Biden.)
The partisan divisions weren’t always as clear-cut as they are today. Consider the 87th Congress, elected in 1960 and seated in 1961. Of the 25 unified Democratic Senate delegations, only 13 represented states that gave their electoral votes to John F. Kennedy the year before, while 10 were from states that had chosen Richard Nixon. (Mississippi chose an anti-Kennedy “unpledged Democratic” slate of electors, and Alabama chose a “mixed” slate of Kennedy and unpledged electors.) Of the 10 states represented by two Republican senators, three chose Kennedy for president instead of Nixon. The 15 states with split delegations were split nine-to-six for Nixon.
Political scientists have explored the question of why a state’s voters, whose party preferences and turnout behavior presumably don’t change that much from one election cycle to another, would elect senators of different parties. One school of thought is that some voters deliberately seek to balance their state’s delegation, though other researchers have not found support for that idea. Other researchers have focused on diverse electorates as predictors of split delegations, argued for candidate-specific factors (such as financing, campaigning skill and the presence or absence of scandal), or tied the ebb and flow of split delegations to broader partisan realignments.
Whatever the explanation, several states have sent pairs of senators to Washington who were so ideologically disparate that their votes all but canceled each other out. Past examples include Minnesota’s Paul Wellstone and Rod Grams, North Carolina’s John Edwards and Jesse Helms, and California’s Alan Cranston and S.I. Hayakawa (each Democrat and Republican, respectively). A few years back, the Capitol Hill publication Roll Call took a look at some of the Senate’s “odd couples,” awarding the top spot to Wisconsin’s Ron Johnson, R, and Tammy Baldwin, D.
Having fewer split delegations in the Senate likely diminishes opportunities for bipartisan cooperation. Senators from different parties may disagree on everything else but can sometimes work together on matters of special interest to their state. In 2006, for example, Florida Sens. Bill Nelson, D, and Mel Martinez, R, teamed up on a bill to prohibit offshore oil and gas drilling off the state’s Gulf Coast. Last year, Montana Sens. Steve Daines, R, and Jon Tester, D, collaborated on legislation to settle a decades-old water dispute between Indigenous tribes and the state and federal governments.
(PEW)
February 11, 2021
677-43-15/Poll
Americans far more likely to say evangelicals will lose influence, rather than gain it, under Biden
Evangelical Christians were among former President Donald Trump’s most loyal supporters. So it is no surprise that half of all U.S. adults think evangelical Christians will lose influence in Washington under President Joe Biden’s new administration while just 9% think they will gain influence, according to a January Pew Research Center survey.
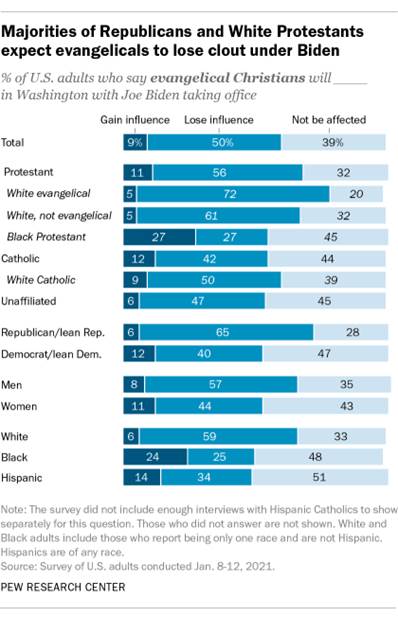
Most of the remainder (39%) say evangelical Christians will not be affected by the change in administrations.
White evangelical Protestants are particularly likely to expect a loss of influence during the Biden presidency. Nearly three-quarters (72%) say evangelical Christians will lose influence, as do a clear majority of White Protestants who do not identify as born-again or evangelical (61%). In both cases, just 5% expect evangelicals to gain influence.
In general, White Americans are especially likely to say evangelical Christians will lose influence as Biden takes office. Black Americans, however, are divided on this question, including Black Protestants, who are equally likely to say evangelicals are set to gain or lose sway under Biden (27% each). Roughly two-thirds of Black Protestants (69%) identify as evangelical or born-again Christians.
How we did this
Men and Republicans, including those who lean toward the Republican Party, are more likely than Americans overall to expect a loss of influence for evangelical Christians. But even among women and Democrats, far more people expect evangelicals to lose influence than gain it. Indeed, there is no demographic group in which people are more likely to say evangelical Christians will gain influence.
Moreover, Americans are more likely to foresee evangelicals losing influence than to believe it will be the case for any of more than a dozen other groups of Americans asked about in the survey, including White people, wealthy people and the military.
The survey did not ask about the influence of any other religious group, aside from evangelicals. But it did ask Americans whether they think “people like yourself” will gain or lose clout with Biden in the White House.

Looking at those results by religious group, Black Protestants are most likely to say people like them will gain influence in Biden’s Washington. More than half of Black Protestants (55%) say they expect people like them to gain influence in the nation’s capital, while just 4% anticipate losing influence. Those findings are roughly the same as among Black Americans overall. Indeed, respondents may have been thinking about other aspects of their identity – and not necessarily their religious affiliation – when answering this question.
Once again on this question, response patterns indicate that racial differences play a role. Almost two-thirds of White evangelical Protestants say they expect people like them to lose influence under Biden (63%), and just 9% think they will gain influence. Among Black evangelicals, by contrast, 55% say they think people like them will gain influence under Biden, while just 5% expect people like them to lose influence.
Biden is only the second Catholic president, after John F. Kennedy, but his political stance on certain issues – including abortion – has elicited mixed reactions from Catholic leaders. On balance, U.S. Catholics are more likely to say they expect people like them to lose influence (34%) rather than gain it (25%) as Biden takes office, but there are sharp differences by ethnicity: White Catholics are more likely than not to expect people like them to lose influence, while Hispanic Catholics are more inclined to say people like them will gain influence.
Meanwhile, Americans without a religious affiliation are about equally likely to say people like them will gain (26%) or lose (27%) clout.
Some of these findings reflect political partisanship: For example, Black Protestants and Hispanic Catholics are more likely to identify as Democrats, while White Protestants and White Catholics more often identify as Republicans. Overall, two-thirds of Republicans expect people like them to see their influence wane under Biden.
(PEW)
February 10, 2021
677-43-16/Poll
Support for Third U.S. Political Party at High Point
Americans' desire for a third party has ticked up since last fall and now sits at a high in Gallup's trend. Sixty-two percent of U.S. adults say the "parties do such a poor job representing the American people that a third party is needed," an increase from 57% in September. Support for a third party has been elevated in recent years, including readings of 60% in 2013 and 2015 and 61% in 2017.
Meanwhile, 33% of Americans believe the two major political parties are doing an adequate job representing the public, the smallest percentage expressing this view apart from the 26% reading in October 2013.
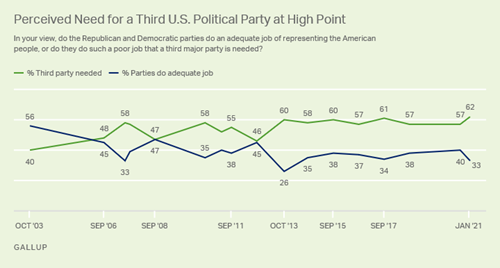
Line graph. Sixty-two percent of Americans say a third political party is needed in the U.S., up from 57% in September and the highest, by one point, in Gallup's trend. Americans have typically been more likely to believe a third party is needed than to say it is not.
The latest results are from a Jan. 21-Feb. 2 poll. The survey was conducted before recent news reports that dozens of government officials in prior Republican administrations were in discussions to form an anti-Donald Trump third political party.
The survey found Americans' favorable opinion of the Republican Party has declined to 37%, while 48% view the Democratic Party positively. The poll also shows 50% of U.S. adults identifying as political independents, the highest percentage Gallup has ever measured in a single poll.
Gallup first asked about the need for a third party in 2003. At that time, most Americans did not think it was necessary, with 56% saying the parties were doing an adequate job representing the American people and 40% saying a third party was needed.
In several election years -- 2006, 2008 and 2012 -- Americans were divided as to whether a third party was needed, but since 2012, Americans have consistently favored the idea.
Majority of Republicans Now Favor Third Party
Independents are usually much more likely than Republicans or Democrats to favor a third political party, but in the current poll, Republicans are nearly as likely as independents to hold this view, 63% to 70%. That represents a dramatic shift for Republicans since last September when 40% favored a third party.
Republicans' current level of support for a third party is also the highest Gallup has measured for Republicans or Democrats in Gallup's trend. The previous high was 54% for Democrats in 2018. Currently, 46% of Democrats endorse a third party, down from 52% in September.
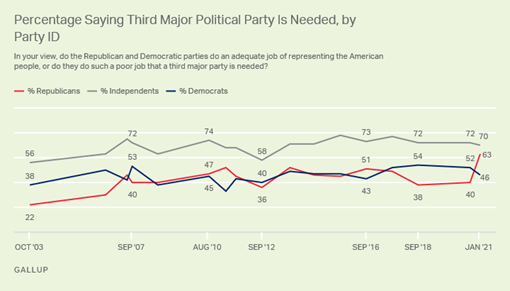
Line graph. Support for a third party by political party identification. Currently, 70% of independents, 63% of Republicans and 46% of Democrats say a third party is needed. Independents are always more likely than Republicans or independents to favor a third party. The current gap between Republicans and independents is the smallest measured to date.
Republicans' record desire for a third party comes at a time when they are deciding whether to remain loyal to Trump or to move on from him.
Currently, 68% of Republicans prefer that Trump remain the party leader, while 31% want the party to have a new leader. Republican-leaning independents, however, are divided, with 47% wanting Trump to continue leading and 51% preferring a new voice.
Republicans' preferences for a third party are similar among those who want Trump to continue to lead the party and among those who prefer a new leader.
An analysis that takes into account preference for a third party -- and preference of Trump leading the party -- finds that 41% of Republicans and Republican-leaning independents both favor a third party and want Trump to be the leader of the GOP. Meanwhile, 28% favor a third party but want a new leader for the GOP. The remaining 31% of Republicans and Republican-leaners either don't want a third party or don't have a preference on Trump's future role in party politics.
More Republicans Want the Party to Move to the Right Than to the Center
The survey asked Republicans and Republican-leaning independents what direction they would like to see the party move in the future. A 40% plurality want the party to become more conservative, while 34% want it to stay the same and 24% to become more moderate. While Republican identifiers are about twice as likely to say the party should become more conservative than moderate (44% to 21%), Republican-leaning independents are split, with 36% wanting it to move further to the right of the ideological spectrum and 30% to move toward the center.
Republicans Most Inclined to Want Party to Become More Conservative
[Asked of Republicans and Republican-leaning independnets] If you had to choose, would you rather see the Republican Party - [ROTATED: become more conservative, stay the same, (or) become more moderate]?
|
All
Republicans/Republican Leaners |
Republicans |
Republican-leaning
indepdents |
|
|
% |
% |
% |
|
|
More conservative |
40 |
44 |
36 |
|
Stay the same |
34 |
35 |
33 |
|
More moderate |
24 |
21 |
30 |
|
Jan. 21-Feb. 2, 2021 |
|||
|
GALLUP |
|||
Democrats Divided on the Direction of Their Party
Democrats' internal divisions between its moderate and liberal wings appear to be muted for now, following the party's victory in the presidential election and its regaining a Senate majority while maintaining a House majority. Democrats and Democratic-leaning independents are evenly divided on the direction their party should go -- 34% want it to become more liberal, 34% more moderate, and 31% to stay where it is.
Democratic identifiers tilt more toward wanting the party to go in a liberal direction (34%) than a moderate one (25%), while Democratic-leaning independents tilt toward wanting the party to become more moderate, 42% to 35%.
Democrats Have No Clear Preference on Direction of Party
[Asked of Democrats and Democratic-leaning independents] If you had to choose, would you rather see the Democratic Party -[ROTATED: become more liberal, stay the same, (or) become more moderate]?
|
All
Democrats/Democratic-leaners |
Democrats |
Democratic-leaning
independents |
|
|
% |
% |
% |
|
|
More liberal |
34 |
34 |
35 |
|
Stay the same |
31 |
40 |
23 |
|
More moderate |
34 |
25 |
42 |
|
Jan. 21-Feb. 2, 2021 |
|||
|
GALLUP |
|||
Bottom Line
Americans' appetite for a third party has never been greater in Gallup's nearly two decades of polling on the subject, and now a majority of Republicans are joining the usual majority of independents in wanting that option. The GOP is struggling to find its way in the post-Trump world, but party leaders hope it can unite in time to make gains in the 2022 elections. The possibility still exists that a pro-Trump or anti-Trump third party will splinter off from the Republican Party before then. However, that is something that party leaders like Republican National Committee Chair Ronna McDaniel and House Minority Leader Kevin McCarthy are trying to prevent.
(Gallup USA)
February 15, 2021
Source: https://news.gallup.com/poll/329639/support-third-political-party-high-point.aspx
677-43-17/Poll
Two-Thirds of Americans Not Satisfied With Vaccine Rollout
As the Biden administration begins to grapple with the COVID-19 situation, two-thirds of Americans say they are not satisfied with the way the vaccination process is going in the U.S. This includes 21% who are "very dissatisfied." At the same time, 34% are satisfied, with 4% of them "very satisfied."
Meanwhile, 71% of Americans are now willing to be vaccinated, up from 65% in late December and the highest recorded since July, when the measure was first included in Gallup's probability-based online tracking survey. The current figure includes 62% who say they would be willing to be vaccinated if it were available to them right now at no cost and 9% who say they have already received at least one of the two doses needed to be fully inoculated. Those resistant to receiving the vaccine remain divided in their reasons for not doing so, but concerns about its safety and a general distrust of vaccines are chief among them.
Dissatisfaction With Vaccine Process Is High
The question gauging satisfaction with the vaccine process was included for the first time in the Jan. 25-31 survey. During the survey's field period, President Joe Biden addressed the nation's vaccine supply shortfall by announcing an increase in the number of doses the government was purchasing. The Biden administration also began work on an aggressive national distribution plan.
As with most other COVID-19 measures, partisans' satisfaction levels with the vaccination process diverge. Republicans are about evenly divided, with 49% satisfied and 51% dissatisfied, while Democrats (79%) and independents (63%) are largely dissatisfied. These differences suggest people may still be evaluating the situation based on their assessments of former President Donald Trump's handling of the vaccination effort, rather than Biden's, given Democrats' and independents' general discontent with the Trump administration's handling of the coronavirus situation more generally.
Americans' Satisfaction With COVID-19 Vaccination Process
How satisfied are you with how the coronavirus/COVID-19 vaccination process is going in the U.S.?
|
U.S.
adults |
Republicans |
Independents |
Democrats |
|
|
% |
% |
% |
% |
|
|
Very satisfied |
4 |
7 |
5 |
2 |
|
Satisfied |
30 |
42 |
32 |
20 |
|
Dissatisfied |
45 |
33 |
41 |
57 |
|
Very dissatisfied |
21 |
18 |
22 |
22 |
|
Total satisfied |
34 |
49 |
37 |
22 |
|
Total dissatisfied |
66 |
51 |
63 |
79 |
|
GALLUP PANEL, JAN. 25-31, 2021 |
||||
Willingness to Be Vaccinated Rises as Americans Begin to Receive Shots
Americans' willingness to receive the COVID-19 vaccine continues on an upward trajectory since hitting a low of 50% in September. The latest 71% of U.S. adults who are willing to be vaccinated is the highest on record and the first measurement that includes a reading for those who have already been vaccinated.
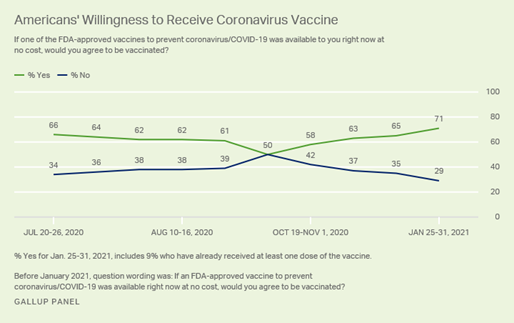
Line graph. Americans' willingness to receive a COVID-19 vaccination that has been approved by the FDA since late July. Currently, 71% say they are willing to receive one, and 29% say they will not. This includes 9% who have already received at least one dose of the vaccine. The previous high was 66% in July and the low was 50% reading in September.
Democrats' Vaccine Willingness Rises
Democrats' willingness to be vaccinated has risen eight percentage points since late December, and Republicans' is up six points. The 91% of Democrats and 51% of Republicans willing to be immunized are the highest percentages to date for each group. Independents' views are roughly in line with recent readings, tying that group's high recorded in November.
Among Democrats, the overall 91% includes 12% who have already received at least one shot; fewer Republicans (7%) and independents (8%) say they have been vaccinated.

Line graph. Percentage of partisans who are willing to receive the COVID-19 vaccine or have already received it. Currently, 91% of Democrats, 61% of independents and 51% of Republicans are in that category. Each is the highest reading for that group since the question was first asked in July.
Differences in Vaccine Views by Age, Income, Education, Region
Aside from Republicans, substantial majorities in all major demographic groups express willingness to be vaccinated. Yet, significant differences persist within several subgroups:
- The oldest and youngest adults are the most likely age groups to express willingness to be vaccinated. Middle-aged Americans (aged 45 to 64) remain the least willing. Fourteen percent of adults aged 65 and older, who are among one of the first groups the Centers for Disease Control and Prevention has recommended receive the vaccine, are the most likely of all demographic groups to have already done so.
- Americans with an annual household income of $90,000 or more are the most likely to express willingness to be immunized among the three income groups.
- Adults with a college degree are much more likely than those without to say they would get a COVID-19 vaccine or have already done so.
- Americans living in the Northeast are the most willing to say they would like to receive the vaccine but are the least likely to have done so.
Americans' Willingness to Receive COVID-19 Vaccine, by Subgroup
If one of the FDA-approved vaccines to prevent coronavirus/COVID-19 was available to you right now at no cost, would you agree to be vaccinated?
|
Have
already received vaccine |
Combined:
Willing to receive/Have already received |
||||||||||||||||||||||||||||||||||||||||||||||||||||||||||||
|
% |
% |
||||||||||||||||||||||||||||||||||||||||||||||||||||||||||||
|
U.S. adults |
9 |
71 |
|||||||||||||||||||||||||||||||||||||||||||||||||||||||||||
|
Gender |
|||||||||||||||||||||||||||||||||||||||||||||||||||||||||||||
|
Men |
7 |
69 |
|||||||||||||||||||||||||||||||||||||||||||||||||||||||||||
|
Women |
11 |
72 |
|||||||||||||||||||||||||||||||||||||||||||||||||||||||||||
|
Age |
|||||||||||||||||||||||||||||||||||||||||||||||||||||||||||||
|
18-44 |
10 |
73 |
|||||||||||||||||||||||||||||||||||||||||||||||||||||||||||
|
45-64 |
6 |
63 |
|||||||||||||||||||||||||||||||||||||||||||||||||||||||||||
|
65+ |
14 |
80 |
|||||||||||||||||||||||||||||||||||||||||||||||||||||||||||
|
Race |
|||||||||||||||||||||||||||||||||||||||||||||||||||||||||||||
|
White adults |
10 |
71 |
|||||||||||||||||||||||||||||||||||||||||||||||||||||||||||
|
Non-White adults |
8 |
72 |
|||||||||||||||||||||||||||||||||||||||||||||||||||||||||||
|
Party
identification |
|||||||||||||||||||||||||||||||||||||||||||||||||||||||||||||
|
Republicans |
7 |
51 |
|||||||||||||||||||||||||||||||||||||||||||||||||||||||||||
|
Independents |
8 |
61 |
|||||||||||||||||||||||||||||||||||||||||||||||||||||||||||
|
Democrats |
12 |
91 |
|||||||||||||||||||||||||||||||||||||||||||||||||||||||||||
|
Education |
|||||||||||||||||||||||||||||||||||||||||||||||||||||||||||||
|
College graduate |
13 |
84 |
|||||||||||||||||||||||||||||||||||||||||||||||||||||||||||
|
Not college graduate |
8 |
66 |
|||||||||||||||||||||||||||||||||||||||||||||||||||||||||||
|
Annual
household income |
|||||||||||||||||||||||||||||||||||||||||||||||||||||||||||||
|
<$36,000 |
6 |
67 |
|||||||||||||||||||||||||||||||||||||||||||||||||||||||||||
|
$36,000-<$90,000 |
10 |
69 |
|||||||||||||||||||||||||||||||||||||||||||||||||||||||||||
|
$90,000+ |
10 |
76 |
|||||||||||||||||||||||||||||||||||||||||||||||||||||||||||
|
U.S.
region |
|||||||||||||||||||||||||||||||||||||||||||||||||||||||||||||
|
Northeast |
6 |
78 |
|||||||||||||||||||||||||||||||||||||||||||||||||||||||||||
|
Midwest |
8 |
69 |
|||||||||||||||||||||||||||||||||||||||||||||||||||||||||||
|
South |
11 |
68 |
|||||||||||||||||||||||||||||||||||||||||||||||||||||||||||
|
West |
10 |
72 |
|||||||||||||||||||||||||||||||||||||||||||||||||||||||||||
|
GALLUP PANEL, JAN. 25-31, 2021 |
|||||||||||||||||||||||||||||||||||||||||||||||||||||||||||||
Reasons Americans Are Reluctant to Get COVID-19 Vaccine
Asked for the main reason behind their reluctance, those who are unwilling to receive a COVID-19 vaccine are most likely to say they have concerns about the rushed timeline (25%). However, the percentage giving this response has dropped by 12 points since the question was last asked in the fall. Twenty-two percent say they want to wait and confirm it is safe, 16% say they do not trust vaccines in general, and 9% want to see how effective it is.
Another 28% cite other reasons, including views that the risks of the virus are overblown, a belief that they already have COVID-19 antibodies, concerns about adverse reactions to the vaccine and a general distrust of the government.
Reasons for Choosing to Not Be Vaccinated Against COVID-19
What is the main reason that you would not agree to receive a coronavirus/COVID-19 vaccine, if one was available now?
|
Oct
19-Nov 1, 2020 |
Jan 25-31,
2021 |
|
|
% |
% |
|
|
Concerns about rushed timeline |
37 |
25 |
|
Want to wait to confirm it is safe |
26 |
22 |
|
Don't trust vaccines generally |
12 |
16 |
|
Want to wait to see how effective it is |
10 |
9 |
|
Other reason |
15 |
28 |
|
Among those who say they would not be vaccinated |
||
|
GALLUP PANEL |
||
Bottom Line
At the beginning of Joe Biden's presidency, Americans are largely dissatisfied with the rollout of the COVID-19 vaccine thus far, perhaps reflecting residual concerns with the Trump administration's handling of the situation. The public is increasingly willing to be immunized, largely reflecting Democrats' increased comfort with the vaccine, and the Biden administration is working to make more doses available.
Johnson & Johnson has submitted an application to the Food and Drug Administration for emergency use authorization of its single-shot vaccine, and AstraZeneca and Novavax are expected to do the same this spring. If approved, they would go a long way toward increasing the supply chain that is needed to address the growing demand.
(Gallup USA)
February 10, 2021
Source: https://news.gallup.com/poll/329552/two-thirds-americans-not-satisfied-vaccine-rollout.aspx
677-43-18/Poll
Americans' Views of Impeachment, Trump's Record on Issues
As former President Donald Trump's second Senate impeachment trial is about to begin, a new Gallup poll finds a slim majority of Americans (52%) saying they would like their senators to vote to convict him. Americans tilted against conviction in his first impeachment trial a little over a year ago.
Americans' Preferences for Their Senators' Votes in the Impeachment Trials of Donald Trump, 2020 vs. 2021
|
Vote
in favor of convicting |
Vote
against convicting |
|
|
% |
% |
|
|
Jan 21-Feb 2, 2021 |
52 |
45 |
|
Jan 2-15, 2020 |
46 |
51 |
|
GALLUP |
||
The same poll finds the 45th president getting mixed reviews as to whether the country made progress or lost ground on 18 issues during his term. He is largely seen as presiding over progress on the economy, national defense and energy, but losing ground on numerous issues -- chiefly, the federal debt and race relations.
Gallup's Jan. 21-Feb. 2 poll was conducted after the House of Representatives voted on Jan. 13 to impeach Trump for "incitement of insurrection" related to the deadly attack on the U.S. Capitol on Jan. 6. Trump is the only president in U.S. history to be impeached twice.
Slim Majority Favor Convicting Trump in His Second Impeachment Trial
Fifty-two percent of Americans would like their senators to vote to convict Trump, while 45% prefer their senators find him not guilty and 3% are unsure.
The public is slightly more supportive of convicting Trump now than they were in January 2020 just before his first Senate trial, after he was impeached for withholding congressionally approved foreign aid to Ukraine to secure a political favor and for obstructing Congress in its investigation of the matter. At that point, 46% said they favored conviction and 51% did not. Trump was ultimately acquitted in the first trial that could have resulted in his removal from office had he been convicted.
Democrats and Democratic-leaning independents are more supportive of conviction this time than they were in 2020, as 89% favor it and 7% oppose it. In 2020, 81% favored conviction and 17% opposed.
For their part, 88% of Republicans and Republican-leaning independents currently oppose Trump's conviction, and 10% favor it. These readings are similar to January 2020.
Partisans' Preferences for Their Senators' Votes in the Impeachment Trials of Donald Trump, 2020 vs. 2021
|
Vote
in favor of convicting |
Vote
against convicting |
||||||||||||||||||||||||||||||||||||||||||||||||||||||||||||
|
% |
% |
||||||||||||||||||||||||||||||||||||||||||||||||||||||||||||
|
Jan
21-Feb 2, 2021 |
|||||||||||||||||||||||||||||||||||||||||||||||||||||||||||||
|
Democrats/Democratic leaners |
89 |
7 |
|||||||||||||||||||||||||||||||||||||||||||||||||||||||||||
|
Republicans/Republican leaners |
10 |
88 |
|||||||||||||||||||||||||||||||||||||||||||||||||||||||||||
|
Jan
2-15, 2020 |
|||||||||||||||||||||||||||||||||||||||||||||||||||||||||||||
|
Democrats/Democratic leaners |
81 |
17 |
|||||||||||||||||||||||||||||||||||||||||||||||||||||||||||
|
Republicans/Republican leaners |
12 |
86 |
|||||||||||||||||||||||||||||||||||||||||||||||||||||||||||
|
GALLUP |
|||||||||||||||||||||||||||||||||||||||||||||||||||||||||||||
Looking back at the only other postwar president to be impeached, Bill Clinton, far fewer Americans supported his conviction at the beginning of his trial: 32% wanted their senators to vote to convict and remove him from office, while 63% favored acquittal.
Americans See Progress and Setbacks During Trump's Term
Although a slight majority of Americans favor Trump's conviction in his current impeachment trial, about half also believe the country made progress in two important areas over the four years he served as president. More also see progress than regression in another five areas.
- In spite of the historic economic disruption caused by the pandemic in 2020, 51% of Americans perceive the country made progress on the economy over the past four years, outweighing the percentage who say it lost ground (38%).
- Americans' assessment of national defense and the military is even more positive, with 49% saying the U.S. made progress and only about half as many (24%) saying it lost ground.
- Positive evaluations outweigh negative ones by more than 10 percentage points for energy (46% see progress and 28% see decline) and the situation in Afghanistan (35% vs. 24%).
- The balance of opinion is also marginally positive with respect to terrorism, taxes, and the situation for gay and lesbian Americans.
Issues on Which Americans Think the U.S. Made More Progress Than Lost Ground With Trump in Office
I'm going to mention some issues facing the country and ask whether you believe the United States has made progress, stood still or lost ground in each during the last four years, since Donald Trump became president.
|
Made
progress |
Stood
still |
Lost
ground |
Net* |
|
|
% |
% |
% |
pct. pts. |
|
|
National defense and the military |
49 |
26 |
24 |
+25 |
|
Energy |
46 |
25 |
28 |
+18 |
|
The economy |
51 |
10 |
38 |
+13 |
|
The situation in Afghanistan |
35 |
35 |
24 |
+11 |
|
Terrorism |
44 |
20 |
35 |
+9 |
|
Taxes |
42 |
25 |
33 |
+9 |
|
The situation for gay and lesbian Americans |
37 |
28 |
33 |
+4 |
|
*The percentage saying "made progress" minus the percentage saying "lost ground" |
||||
|
GALLUP, JAN. 21-FEB. 2, 2021 |
||||
But Americans think the country lost more ground than it gained in the other 11 areas rated.
- They are especially critical of the trajectory of the federal debt and race relations, with roughly six in 10 saying the country lost ground on each -- about three times the level saying it gained ground on the federal debt, and nearly four times the percentage saying it gained ground on race relations.
- Climate change, the wealth gap, education, the United States' position in the world, immigration and the situation for Black Americans are also perceived as having worsened rather than improved, and by large margins.
- Americans are more narrowly critical of how crime, healthcare and trade relations with other countries fared under Trump.
Issues on Which Americans Think the U.S. Lost More Ground Than Made Progress With Trump in Office
I'm going to mention some issues facing the country and ask whether you believe the United States has made progress, stood still or lost ground in each during the last four years, since Donald Trump became president.
|
Made
progress |
Stood
still |
Lost
ground |
Net* |
|
|
% |
% |
% |
pct. pts. |
|
|
Trade relations with other countries |
38 |
15 |
45 |
-7 |
|
Healthcare |
32 |
27 |
41 |
-9 |
|
Crime |
30 |
26 |
43 |
-13 |
|
The situation for Black Americans |
32 |
17 |
49 |
-17 |
|
Immigration |
33 |
14 |
52 |
-19 |
|
The United States' position in the world |
34 |
8 |
58 |
-24 |
|
Education |
23 |
29 |
47 |
-24 |
|
The gap between the wealthy and the less well-off |
25 |
21 |
54 |
-29 |
|
Climate change |
17 |
32 |
49 |
-32 |
|
Race relations |
23 |
16 |
61 |
-38 |
|
The federal debt |
16 |
18 |
62 |
-46 |
|
*The percentage saying "made progress" minus the percentage saying "lost ground" |
||||
|
GALLUP, JAN. 21-FEB. 2, 2021 |
||||
Recent Presidents Remembered for Different Achievements, Failures
Gallup also measured Americans' views of conditions at the end of Barack Obama's and George W. Bush's second terms, asking whether the country had made progress or lost ground. The table below summarizes net-positive ratings in the 12 areas in which Trump, Obama and Bush were all rated.
Trump's perceived performance exceeds both of his two predecessors' on four issues: national defense, the economy, taxes and terrorism.
The net-negative perception of progress on crime under Trump (-13) ties with Bush's rating, with both ahead of the Obama-era rating. Trump's rating on immigration (-19) ties with Obama's, with both surpassing Bush's rating.
Trump's performance lags his immediate predecessors' on education, race relations and climate change/the environment, with especially low ratings for the latter two. Additionally, his performance lags Obama's on healthcare, the United States' position in the world and energy.
Americans' Views of Progress Made by Recent Presidents While in Office
I'm going to mention some issues facing the country and ask whether you believe the United States has made progress, stood still or lost ground in each during the last [four/eight] years, since [ ... ] became president.
|
Made
progress |
Stood
still |
Lost
ground |
Net* |
|||||||||||||||||||||||||||||||||||||||||||||||||||||||||||
|
% |
% |
% |
pct. pts. |
|||||||||||||||||||||||||||||||||||||||||||||||||||||||||||
|
National
defense and the military |
||||||||||||||||||||||||||||||||||||||||||||||||||||||||||||||
|
Donald Trump |
49 |
26 |
24 |
+25 |
||||||||||||||||||||||||||||||||||||||||||||||||||||||||||
|
Barack Obama |
30 |
28 |
39 |
-9 |
||||||||||||||||||||||||||||||||||||||||||||||||||||||||||
|
George W. Bush |
39 |
21 |
36 |
+3 |
||||||||||||||||||||||||||||||||||||||||||||||||||||||||||
|
Energy |
||||||||||||||||||||||||||||||||||||||||||||||||||||||||||||||
|
Donald Trump |
46 |
25 |
28 |
+18 |
||||||||||||||||||||||||||||||||||||||||||||||||||||||||||
|
Barack Obama |
46 |
26 |
23 |
+23 |
||||||||||||||||||||||||||||||||||||||||||||||||||||||||||
|
George W. Bush |
21 |
27 |
49 |
-28 |
||||||||||||||||||||||||||||||||||||||||||||||||||||||||||
|
The
economy |
||||||||||||||||||||||||||||||||||||||||||||||||||||||||||||||
|
Donald Trump |
51 |
10 |
38 |
+13 |
||||||||||||||||||||||||||||||||||||||||||||||||||||||||||
|
Barack Obama |
42 |
20 |
36 |
+6 |
||||||||||||||||||||||||||||||||||||||||||||||||||||||||||
|
George W. Bush |
5 |
7 |
87 |
-82 |
||||||||||||||||||||||||||||||||||||||||||||||||||||||||||
|
Taxes |
||||||||||||||||||||||||||||||||||||||||||||||||||||||||||||||
|
Donald Trump |
42 |
25 |
33 |
+9 |
||||||||||||||||||||||||||||||||||||||||||||||||||||||||||
|
Barack Obama |
23 |
40 |
34 |
-11 |
||||||||||||||||||||||||||||||||||||||||||||||||||||||||||
|
George W. Bush |
16 |
35 |
45 |
-29 |
||||||||||||||||||||||||||||||||||||||||||||||||||||||||||
|
Terrorism |
||||||||||||||||||||||||||||||||||||||||||||||||||||||||||||||
|
Donald Trump |
44 |
20 |
35 |
+9 |
||||||||||||||||||||||||||||||||||||||||||||||||||||||||||
|
Barack Obama |
28 |
20 |
49 |
-21 |
||||||||||||||||||||||||||||||||||||||||||||||||||||||||||
|
George W. Bush |
40 |
20 |
37 |
+3 |
||||||||||||||||||||||||||||||||||||||||||||||||||||||||||
|
Healthcare |
||||||||||||||||||||||||||||||||||||||||||||||||||||||||||||||
|
Donald Trump |
32 |
27 |
41 |
-9 |
||||||||||||||||||||||||||||||||||||||||||||||||||||||||||
|
Barack Obama |
43 |
13 |
43 |
0 |
||||||||||||||||||||||||||||||||||||||||||||||||||||||||||
|
George W. Bush |
13 |
33 |
52 |
-39 |
||||||||||||||||||||||||||||||||||||||||||||||||||||||||||
|
Crime |
||||||||||||||||||||||||||||||||||||||||||||||||||||||||||||||
|
Donald Trump |
30 |
26 |
43 |
-13 |
||||||||||||||||||||||||||||||||||||||||||||||||||||||||||
|
Barack Obama |
21 |
21 |
56 |
-35 |
||||||||||||||||||||||||||||||||||||||||||||||||||||||||||
|
George W. Bush |
25 |
33 |
39 |
-14 |
||||||||||||||||||||||||||||||||||||||||||||||||||||||||||
|
Immigration |
||||||||||||||||||||||||||||||||||||||||||||||||||||||||||||||
|
Donald Trump |
33 |
14 |
52 |
-19 |
||||||||||||||||||||||||||||||||||||||||||||||||||||||||||
|
Barack Obama |
27 |
27 |
45 |
-18 |
||||||||||||||||||||||||||||||||||||||||||||||||||||||||||
|
George W. Bush |
14 |
28 |
51 |
-37 |
||||||||||||||||||||||||||||||||||||||||||||||||||||||||||
|
Education |
||||||||||||||||||||||||||||||||||||||||||||||||||||||||||||||
|
Donald Trump |
23 |
29 |
47 |
-24 |
||||||||||||||||||||||||||||||||||||||||||||||||||||||||||
|
Barack Obama |
31 |
28 |
39 |
-8 |
||||||||||||||||||||||||||||||||||||||||||||||||||||||||||
|
George W. Bush |
28 |
38 |
42 |
-14 |
||||||||||||||||||||||||||||||||||||||||||||||||||||||||||
|
The
United States' position in the world |
||||||||||||||||||||||||||||||||||||||||||||||||||||||||||||||
|
Donald Trump |
34 |
8 |
58 |
-24 |
||||||||||||||||||||||||||||||||||||||||||||||||||||||||||
|
Barack Obama |
30 |
19 |
49 |
-19 |
||||||||||||||||||||||||||||||||||||||||||||||||||||||||||
|
George W. Bush |
12 |
17 |
69 |
-57 |
||||||||||||||||||||||||||||||||||||||||||||||||||||||||||
|
Climate
change/The environment |
||||||||||||||||||||||||||||||||||||||||||||||||||||||||||||||
|
Donald Trump |
17 |
32 |
49 |
-32 |
||||||||||||||||||||||||||||||||||||||||||||||||||||||||||
|
Barack Obama |
42 |
20 |
36 |
+6 |
||||||||||||||||||||||||||||||||||||||||||||||||||||||||||
|
George W. Bush |
28 |
28 |
42 |
-14 |
||||||||||||||||||||||||||||||||||||||||||||||||||||||||||
|
Race
relations |
||||||||||||||||||||||||||||||||||||||||||||||||||||||||||||||
|
Donald Trump |
23 |
16 |
61 |
-38 |
||||||||||||||||||||||||||||||||||||||||||||||||||||||||||
|
Barack Obama |
25 |
20 |
52 |
-27 |
||||||||||||||||||||||||||||||||||||||||||||||||||||||||||
|
George W. Bush |
40 |
31 |
25 |
+15 |
||||||||||||||||||||||||||||||||||||||||||||||||||||||||||
|
*The percentage saying
"made progress" minus the percentage saying "lost ground" |
||||||||||||||||||||||||||||||||||||||||||||||||||||||||||||||
|
GALLUP |
||||||||||||||||||||||||||||||||||||||||||||||||||||||||||||||
Trump is rated similar to Obama on the wealth gap and trade relations; better than Obama on the situation in Afghanistan; and worse than Obama on the federal debt, the situation for Black Americans, and the situation for lesbian and gay Americans. Trump-Bush comparisons cannot be made on these issues as Gallup did not rate them for Bush.
Americans' Views of Progress Made by Trump and Obama on Six Issues
I'm going to mention some issues facing the country and ask whether you believe the United States has made progress, stood still or lost ground in each during the last [four/eight years], since [ ... ] became president.
|
Made
progress |
Stood
still |
Lost
ground |
Net* |
||||||||||||||||||||||||||||||||||||||||||||||||||||||||||
|
% |
% |
% |
pct. pts. |
||||||||||||||||||||||||||||||||||||||||||||||||||||||||||
|
The
situation in Afghanistan |
|||||||||||||||||||||||||||||||||||||||||||||||||||||||||||||
|
Donald Trump |
35 |
35 |
24 |
+11 |
|||||||||||||||||||||||||||||||||||||||||||||||||||||||||
|
Barack Obama |
26 |
26 |
38 |
-12 |
|||||||||||||||||||||||||||||||||||||||||||||||||||||||||
|
The
situation for gay and lesbian Americans |
|||||||||||||||||||||||||||||||||||||||||||||||||||||||||||||
|
Donald Trump |
37 |
28 |
33 |
+4 |
|||||||||||||||||||||||||||||||||||||||||||||||||||||||||
|
Barack Obama |
68 |
11 |
16 |
+52 |
|||||||||||||||||||||||||||||||||||||||||||||||||||||||||
|
Trade
relations with other countries |
|||||||||||||||||||||||||||||||||||||||||||||||||||||||||||||
|
Donald Trump |
38 |
15 |
45 |
-7 |
|||||||||||||||||||||||||||||||||||||||||||||||||||||||||
|
Barack Obama |
32 |
28 |
36 |
-4 |
|||||||||||||||||||||||||||||||||||||||||||||||||||||||||
|
The
situation for Black Americans |
|||||||||||||||||||||||||||||||||||||||||||||||||||||||||||||
|
Donald Trump |
32 |
17 |
49 |
-17 |
|||||||||||||||||||||||||||||||||||||||||||||||||||||||||
|
Barack Obama |
30 |
27 |
37 |
-7 |
|||||||||||||||||||||||||||||||||||||||||||||||||||||||||
|
The
gap between the wealthy and the less well-off |
|||||||||||||||||||||||||||||||||||||||||||||||||||||||||||||
|
Donald Trump |
25 |
21 |
54 |
-29 |
|||||||||||||||||||||||||||||||||||||||||||||||||||||||||
|
Barack Obama |
14 |
34 |
48 |
-34 |
|||||||||||||||||||||||||||||||||||||||||||||||||||||||||
|
The
federal debt |
|||||||||||||||||||||||||||||||||||||||||||||||||||||||||||||
|
Donald Trump |
16 |
18 |
62 |
-46 |
|||||||||||||||||||||||||||||||||||||||||||||||||||||||||
|
Barack Obama |
21 |
18 |
57 |
-36 |
|||||||||||||||||||||||||||||||||||||||||||||||||||||||||
|
*The percentage saying
"made progress" minus the percentage saying "lost ground" |
|||||||||||||||||||||||||||||||||||||||||||||||||||||||||||||
|
GALLUP |
|||||||||||||||||||||||||||||||||||||||||||||||||||||||||||||
Extreme Partisan Differences in Trump-Era Progress Ratings
As would be expected, Republicans and Republican-leaning independents have a net-positive view of the changes that have occurred in almost all of the 18 issues on which the Trump era was rated in the new poll. But there is a wide range of positive evaluations, from +84 for the economy to +18 for both race relations and climate change. The federal debt is the only issue on which Republicans think that more ground has been lost than gained under Trump.
Democrats and Democratic-leaning independents perceive the country has lost ground in all 18 areas over the past four years, with their most negative views reserved for race relations, the United States' position in the world and immigration.
Partisans' Views of Net Progress Made While Trump Was in Office
Figures represent the the percentage saying "made progress" minus the percentage saying "lost ground," among Republicans/Republican-leaning independents and Democrats/Democratic-leaning independents.
|
Net
progress: Republicans |
Net
progress: Democrats |
|
|
pct. pts. |
pct. pts. |
|
|
The economy |
+84 |
-41 |
|
National defense and the military |
+78 |
-19 |
|
Energy |
+73 |
-30 |
|
Taxes |
+71 |
-44 |
|
Terrorism |
+67 |
-37 |
|
Trade relations with other countries |
+63 |
-57 |
|
The situation in Afghanistan |
+56 |
-26 |
|
Healthcare |
+51 |
-65 |
|
The situation for Black Americans |
+49 |
-75 |
|
Immigration |
+46 |
-78 |
|
The situation for gay and lesbian Americans |
+46 |
-40 |
|
The United States' position in the world |
+43 |
-79 |
|
Crime |
+35 |
-53 |
|
The gap between the wealthy and the less well-off |
+28 |
-76 |
|
Education |
+25 |
-61 |
|
Climate change |
+18 |
-77 |
|
Race relations |
+18 |
-81 |
|
The federal debt |
-14 |
-74 |
|
GALLUP, JAN. 21-FEB. 2, 2021 |
||
Notably, Republicans' strongly positive ratings of Trump on his top-rated issues -- as well as their desire that he not be convicted in his impeachment trial -- are not necessarily an endorsement of Trump maintaining a leadership role in the country. Asked specifically about Trump's role in the Republican Party going forward, 60% of Republicans favor him continuing to be the leader, while 38% would rather the party have a new leader.
Bottom Line
Trump's legacy is likely to be forever colored by his second impeachment trial and the events leading to it. But history will also judge him by the progress or lack thereof made on a variety of issues facing the country during his term.
Historians' assessments remain to be seen, but in Trump's first days out of office, half of Americans (fueled mostly by Republicans) give him good reviews on the two issues that normally define a presidency: the economy and national defense. Not only does he receive net-positive ratings on these, but his ratings well exceed his immediate predecessors'.
However, along with two impeachment trials, Trump's net-negative ratings on the federal debt, climate change and race relations could match or dominate those on the economy and national defense in how history -- historians and average Americans alike -- ultimately judge this presidency.
As he was leaving office, Americans were most likely to think history would judge Trump as a "poor" president. And as he departed, 34% of Americans approved of the job he was doing, an inauspicious sign for his legacy since a president's popularity as they leave office generally influences their reputation for years if not decades to follow.
(Gallup USA)
February 08, 2021
Source: https://news.gallup.com/poll/329423/americans-views-impeachment-trump-record-issues.aspx
AUSTRALIA
677-43-19/Poll
New Roy Morgan Cross-Platform Audience results show 2020 was a year of growth for Australia’s leading mastheads
Roy Morgan today releases the latest enhanced cross-platform audience results for Australian newspapers and magazines for the 12 months to December 2020 showing strong growth for Australia’s leading newspaper mastheads and across the newspaper sector more broadly.
In the year to December 2020 an estimated 19.2 million (91%) Australians aged 14+ read or accessed newspapers or newspaper content in some way – print editions, online via website, app or news platforms including (metropolitan, local and regional titles) in an average four weeks. This represents significant growth of 3% points from the 6 months to June when the total cross-platform audience for newspapers was 18.5 million (88%).
The total cross-platform audiences for newspaper mastheads in the 12 months to December 2020 includes an estimated 16.4 million (78%) reading or accessing metropolitan titles. In addition some 15.4 million (73%) Australians aged 14+ read or accessed a magazine or magazine content.
The 4 week cross-platform audience data measures both Newspaper and Magazine masthead reach across print and digital content by masthead for each Publisher.
These latest findings from Roy Morgan Single Source are available to Publishers, Media Agencies and Brand Advertisers on an on-going basis.
Sydney Morning Herald is Australia’s top masthead – read by over 8.5 million Australians
This 4 week cross-platform audience data now shows the standout performers for Newspapers are Nine Entertainment owned Sydney Morning Herald with a cross-platform audience of over 8.5 million ahead of its Melbourne stablemate The Age with a cross-platform audience of 6 million Australians in an average 4 week period in the 12 months to December 2020.
News Corp’s Daily Telegraph is in third place with a cross-platform audience of over 4.9 million in front of national broadsheet The Australian on 4.8 million and Melbourne counterpart the Herald Sun with a large cross-platform audience of over 4.5 million Australians.
A look at the discrete quarterly figures for the leading mastheads shows strong growth for The Australian which has increased its 4-week cross-platform audience in each quarter this year and by over 500,000 in the December quarter alone. These are the most consistent and largest increases of any masthead.
There were other strong performances in the December quarter by the Sydney Morning Herald, Financial Review, Adelaide Advertiser, Courier Mail and The Saturday Paper – all of which saw audience increases of at least 50,000. In fact The Saturday Paper has had a stellar year and its audience in the December quarter was around 300,000 people larger than in the March quarter – an audience increase of over 50%.
These new ‘digital first’ Enhanced Cross-Platform Audience results are drawn from Roy Morgan Single Source comprising multi-mode interviews with a representative sample of 61,294 Australians aged 14+ and machine based data collected in the 12 months to December 2020.
Are Media’s ‘Now to Love’ online magazine destination is read by over 2.3 million Australians
The results for the 12 months to December 2020 for Magazine Publishers are equally impressive with the 4 week cross-platform audience data showing the Are Media owned ‘Now to Love’ website attracts an audience of 2.3 million Australians in an average 4 week period. Are Media’s ‘Now to Love’ website allows magazine publishers to reach their audience in new ways with innovative online offerings.
Many of Are Media’s magazine brands (including Australian Women’s Weekly, Woman’s Day, TV Week and Take 5) have consolidated their online presence in the ‘Now to Love’ website which is adding incremental reach to already strong print based publications including Woman’s Day, estimated to reach over 1.4 million readers in an average 4 week period, and stablemate Australian Women’s Weekly with an estimated 4 week print reach approaching 1.1 million readers.
There are several other magazines with large cross-platform audiences
including News Corp’s Taste.com.au Magazine with a total audience of over 3.1
million, Are Media’s New Idea with almost 2.5 million and Better Home &
Gardens with well over 1.9 million readers in an average 4 weeks in the 12
months to December 2020.
Michele Levine, CEO Roy Morgan says the
latest 4 week cross-platform audience data shows millions of Australians
accessing newspapers and magazines via new media channels and several titles
have increased their audiences during pandemic year of 2020:
“Roy Morgan’s ‘digital
first’ view of the media landscape shows millions of Australians turned to
online channels to access leading Newspaper and Magazine mastheads during 2020.
“The nation-wide lockdown in
March and April was followed by a long second lockdown in Victoria and severe
restrictions on people’s movement .throughout the year that strengthened the
appeal of online news and entertainment sources that can be accessed without
the risk of contracting the virus out in the community.
“The new 4 week
cross-platform audience results show an estimated 19.2 million Australians aged
14+ (91%) read or accessed newspapers including metropolitan, regional and
community titles in an average four weeks in the 12 months to December 2020.
“The metropolitan newspapers
have a combined audience of 16.4 million Australians aged 14+ (78%) and
Australia’s most widely read masthead the Sydney Morning Herald is read by over
8.5 million in an average four weeks – over 40% of Australia’s population.
“The importance Australians
placed on trusted news sources to keep up-to-date with the latest rules and
restrictions being implemented to stop the spread of COVID-19 provided
Australia’s leading newspaper mastheads with a tremendous boost during 2020.
There have been big gains in cross-platform audiences for several leading
newspaper mastheads as a result.
“The biggest winner during
the December quarter was the national broadsheet The Australian
which grew its cross-platform audiences by over 500,000 from the
September quarter. There was extensive coverage in The Australian of the
contentious US Presidential Election in the closing months of 2020 as former
President Donald Trump disputed the results throughout November and December.
“There were other strong
performances from the Sydney Morning Herald, Financial Review, Courier Mail,
and the Perth-based West Australian which all grew their cross-platform audiences
in the December quarter.
“In the magazine realm over
2.3 million Australians now visit the ‘Now to Love’ online ‘destination’ which
provides a significant boost for popular Are Media titles such as Woman’s Day,
Australian Women’s Weekly and the Take 5 weekly and monthly titles.
“The comprehensive 4 week
cross-platform audience results create a range of new opportunities for
participating Publishers and of course Brand Advertisers. Advertisers and their
Media Agencies can now use these latest metrics to better plan campaigns and
profile these larger audiences.”
(Roy Morgan)
February 12, 2021
MULTICOUNTRY STUDIES
677-43-20/Poll
North American Tracker: Biden’s Presidential Win: The Impact On Canada
- 61% of Canadians and 43% of Americans think the election of Joe Biden as President of the United States will improve Canada-US relations.
- 47% of Canadians think that Biden promoting Buy American policies will negatively impact the Canadian economy, 40% think it will have no real impact, and 13% think it will have a positive impact.
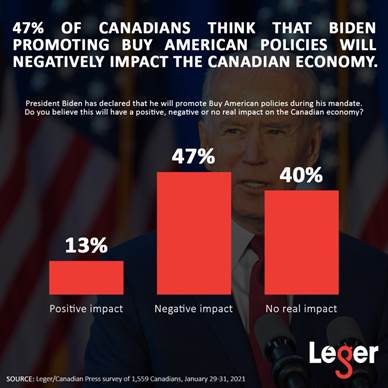
- Given the choice between taking significant steps to address climate change and growing the US economy at all costs, 56% of Canadians think Biden should prioritize addressing climate change. Americans are more divided: 37% think he should prioritize addressing climate change, and 40% think he should prioritize the economy.
- The top 5 people Americans would like to see play a significant political role in the coming years are Bernie Sanders (39%), Donald Trump (35%), Mike Pence (31%), Alexandria Ocasio-Cortez (30%), and Pete Buttigieg (29%).
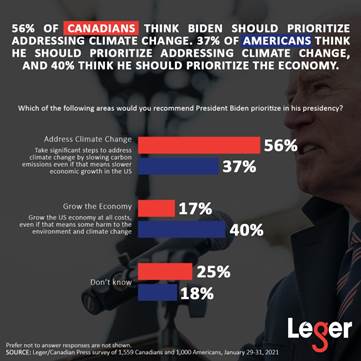
(LEO News)
February 9, 2021
Source: https://blog.legeropinion.com/en/surveys/north-american-tracker-february-9-2021/
677-43-21/Poll
Digital media usage during times of distress
COVID-19
has disrupted livelihoods and economies across the world, changing consumption
patterns of all different types of products and services, including digital
media. The Arab World is no exception, though perhaps the transformation in
digital media consumption has been accelerated by the pandemic outbreak. The
Arab world has witnessed a steady increase in both internet usage and social
media penetration, as well as increasing reliance on social media for breaking
news.
According
to Arab Barometer Wave 6 – Survey 1 data, overwhelming majorities of citizens
in Jordan, Lebanon, Tunisia, Algeria and Morocco use the internet at least once
a day. Lebanon and Jordan lead the group figures with almost 9 in 10 reporting
daily internet usage. Algeria is slightly lower, with almost 3 in 4 reporting
daily internet usage and about 2 of 3 reporting daily
usage in Morocco and Tunisia.
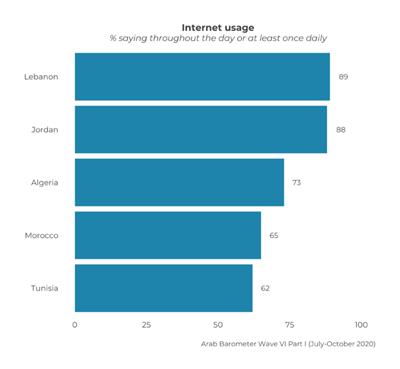
The
largest gaps in usage are (unsurprisingly) between young people and older
segments. Among countries surveyed, the largest gap in usage with respect to
age is in Tunisia, where 91 percent of those aged 18-29 report using the
internet at least once daily compared to 51 percent of those aged 30 and over.

Those
with higher education also tend to report using the internet much more than
those with secondary education or lower. The largest age gap in usage with
respect to education is in Morocco, where 91 percent of those with higher
education report using the internet at least once daily compared to 56 percent
of those with secondary education or less.
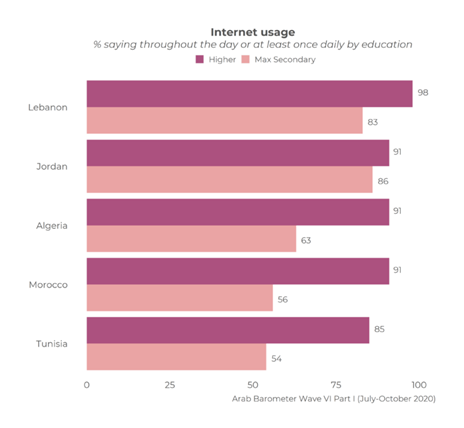
At the
same time, social media is increasingly becoming the main source Arab citizens
use to learn about breaking news. According to Arab Barometer Wave 6 – Survey 1
data, Jordan leads the way in this regard with 52 percent of respondents saying
they use social media as their primary source for breaking news. Lebanon and
Algeria follow with 43 percent for each, and Tunisia and Morocco round up the
list with 36 percent for each. Thus, a third to a half of citizens in each
country use social media as their primary source for breaking news.
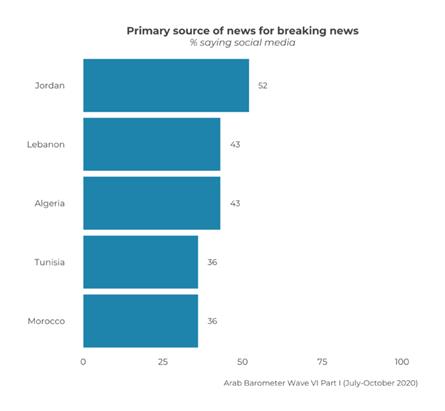
Here
again, the largest demographic differences are between young people and older
segments. The largest gap with respect to age is in Algeria, where 71 percent
of those aged 18-29 report using social media as their primary source for
breaking news compared to 34 percent of those aged 30 and over.
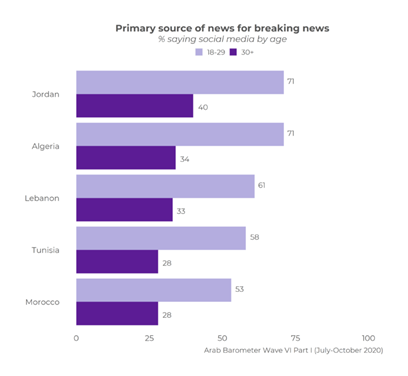
Those
with higher education also tend to report using social media as their primary
source of breaking news much more than those with secondary education or lower.
The largest age gap with respect to education is also in Morocco, where 60
percent of those with higher education report using social media as their
primary source for breaking news compared to 27 percent of those with secondary
education or less.
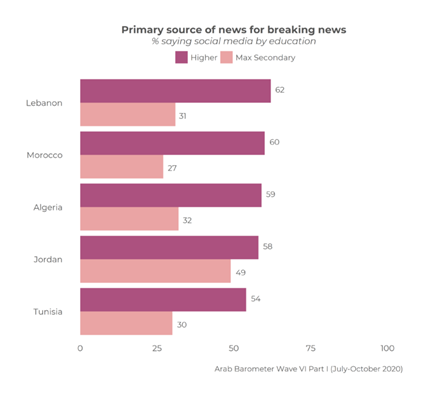
At a
cursory level, the results point to the evolution of the regional digital divide. While shrinking in absolute terms, the divide
is not so much about disparities in income and gender and increasingly about
variations in age and education (which admittedly, intersects with income and
class).
(Arab
Barometer)
February
10, 2021
Source: https://www.arabbarometer.org/2021/02/digital-media-usage-during-times-of-distress/
677-43-22/Poll
Global survey: Where should facemasks be mandatory?
People around the world tend
to agree on mask use indoors apart from in their own homes
The global rise in facemask use has been one of the defining features of the COVID-19 pandemic. Research from the YouGov-Cambridge Globalism Project carried out in 25 countries last summer reveals where people think wearing a facemask should be compulsory during the pandemic.
Facemasks and public
transport
Efforts have been made around the world to keep public transport running during the pandemic while ensuring passengers are safe.
People in Brazil are the most likely think facemask should be required on public transport during the pandemic (93%). A similar proportion (92%) of South Africans, Mexicans, and Spaniards agree.
In the United Kingdom, 83% of people think facemasks should be compulsory on public transport for the duration of the pandemic, while 78% of Canadians and 77% of Germans agree.
Only half of Swedes (51%) think facemask should be mandatory on public transport while the pandemic is ongoing, the lowest of the surveyed countries.
Facemasks and medical
facilities
Facemasks were already a common sight in medical facilities before the pandemic, but most people now think they should be compulsory for the duration of the pandemic.
Mexicans, Spaniards and Brazilians (93%) are among the most likely to say this, closely followed by 92% of South Africans and French people, and 91% of Nigerians.
Just over four in five people in the UK (84%) think facemasks should be rule in medical facilities, as do 83% of Canadians and 81% of Hungarians.
Despite a majority of Swedish adults (61%) agreeing, they are again the least likely to approve.
Facemasks and shopping
Public opinion on wearing facemasks inside shops while COVID-19 is in circulation is similar. Brazilians and Spaniards are the most likely to support it at 90%. Most South Africans (89%) and Mexicans, Turks and Italians (all at 87%) also favour this policy.
Elsewhere, three quarters of people in Thailand and the UK (76%) agree facemasks should be compulsory for shopping during the pandemic. In the US, around three in five people (62%) are of the same opinion.
Fewer than half of Swedes (35%) and Danes (45%) support the approach – the lowest among the surveyed countries.
Facemasks and airports
Air travel has been a major issue during the pandemic, with many countries blocking international flights, and others implementing testing regimes for passengers. Brazilians and Spaniards are again the most likely to think masks should be required in airports during the pandemic at 92% each. This sentiment is shared by a similar proportion (90%) of Mexicans, South Africans, and French people.
In China where COVID was first detected, 87% of people support airports having a facemask use rule. Britons are also largely in favour at 79%.
Swedish people are least likely to think mask use should be compulsory at 53%.
Facemasks on public streets
While people in the surveyed countries mostly agree that facemasks should be compulsory in indoor spaces, opinion on mask wearing outdoors is divided.
In Indonesia, 81% of people think that facemasks should be compulsory on public streets during the pandemic, as do 79% of Indians, 75% of Thai people, and 72% of both Mexicans and Brazilians.
Elsewhere public opinion is split. In Australia and France, approaching half (47%) say facemasks should be required in public streets during the pandemic. About a third of adults in the United States (36%) and Italy (34%) agree.
Only a fifth of Britons (18%) are supportive, while among Swedes this drops to one in ten (10%).
Facemasks at home
Further to wearing facemasks on public streets, making facemasks mandatory when at home during the pandemic proves even less popular. Support is greatest among Indians (21%), Saudi Arabians (18%) and Turks and Egyptians (both at 16%).
In the west, one in ten adults in the United States (10%) agree, as do the same proportion of Mexicans and Brazilians. In the UK, just 2% of people think facemasks should be compulsory in private homes.
(YouGov)
February 09, 2021