|
BUSINESS & POLITICS IN THE WORLD GLOBAL OPINION REPORT NO. 682 Week:
March 15 –March 21, 2021 Presentation:
March 26, 2021 Maruti
Suzuki Is The Healthiest Automotive Brand In India Toyota
Tops YouGov Thailand’s 2021 Automotive Rankings Honda
Tops YouGov Malaysia’s 2021 Automotive Rankings Toyota
Tops Yougov’s 2021 Automotive Rankings In Saudi Arabia Three-In-Four
Libyans Say The Economy Is In A Very Bad Or A Bad State Nine
In 10 Nigerians (85%) Say They Are Concerned About Kidnappings Six
In Ten Do Not Want To Cut Spending On Public Services To Pay Off Debt 43%
Londoners Think Sadiq Khan Has Handled COVID Well Less
Than Half Of Britons Expected To Tick ‘Christian’ In Uk Census 1
In 2 French People Think The Pandemic Has Exacerbated Ethnic Discrimination Youtube
Is The Most Popular Online Music Service Among Germans 71%
Of 14 To 24-Year-Olds State That They Have Good Social Contacts With Friends Finland's
Strongest Car Brands Above
50% Vaccination Propensity In Hungary Toyota
Tops YouGov Australia’s 2021 Automotive Rankings 73.7%
Of Australians Holding Private Health Insurance Are Satisfied Movement
Of People In Melbourne Cbd Is At 39% Of Normal One Year After The First Covid
Lockdown Global
Consumer Confidence Getting Closer To Pre-Pandemic Level 81%
Of Spanish Mothers And Fathers Feel Judged By Others After
Covid-19: Putting People Before Politics Is Key To Recovery The
Pandemic Stalls Growth In The Global Middle Class, Pushes Poverty Up Sharply INTRODUCTORY NOTE
682-43-23/Commentary:
The
Pandemic Stalls Growth In The Global Middle Class, Pushes Poverty Up Sharply
The COVID-19 pandemic is
having a deep effect on the global economy. In January 2020, as reports of
the novel coronavirus were emerging, the World Bank forecasted that the
global economy would expand by 2.5% that year. In January 2021, with the
pandemic still holding much of the world in its grip, the World Bank estimated that
the global economy contracted by 4.3% in 2020, a turnabout of 6.8 percentage
points.
The economic
downturn is likely to have diminished living standards around the world,
pushing millions out of the global middle class and swelling the ranks of the
poor. At the same time, the path to a recovery is clouded with uncertainties. A new Pew
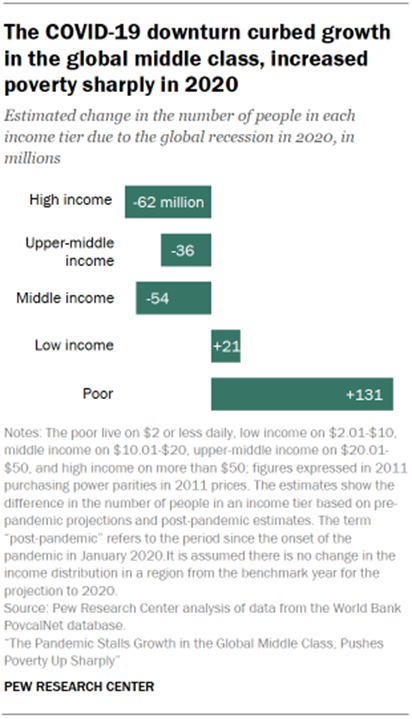
Research Center analysis finds that the global middle class encompassed 54
million fewer people in 2020 than the number projected prior to the onset of
the pandemic. Meanwhile, the number of poor is estimated to have been 131
million higher because of the recession. The drop-off
in the global middle class was centered in South Asia and in East Asia and
the Pacific, and it stalled the expansion seen in the years preceding the
pandemic. South Asia, specifically India, along with Sub-Saharan Africa,
accounted for most of the increase in poverty, reversing years of progress on
this front. As defined
in this report (and in previous Pew Research Center
analyses), people who are middle income live on
$10.01-$20 a day, which translates to an annual income of about $14,600 to
$29,200 for a family of four. This is modest by the standards of advanced
economies. In fact, it straddles the official poverty line in
the United States – about $23,000 for a family of four in 2020 (expressed in
2011 prices). By global standards, the poor live on $2 or less a day, or no
more than $2,920 annually for a family of four. The number
of people in the global high-income tier (more than $50 daily) is estimated
to have decreased by 62 million in 2020, erasing about half of the gain since
2011, with most of the change emanating from advanced economies. Meanwhile,
the upper-middle income population ($20.01-$50 daily) fell by 36 million,
while the low-income population ($2.01-$10 daily) is estimated to have
increased by 21 million. Who is middle class (or middle income)? This report
uses the terms “middle income” and “middle class” interchangeably, a common
practice among economists who tend to define the middle class in terms of
income or consumption. But being middle class can connote more than income,
be it a college education, white-collar work, economic security, owning a
home, or having certain social and political values. Class could also simply
be a matter of self-identification. The interplay among these many factors is
examined in studies by Hout (2007) and Savage et al. (2013),
among others. The
population in each global region is divided into five groups: poor, low income,
middle income, upper-middle income and high income. The poor live on $2 or
less daily, low income on $2.01-$10, middle income on $10.01-$20,
upper-middle income on $20.01-$50 and high income on more than $50. All
dollar figures are expressed in 2011 prices and purchasing power parity dollars,
currency exchange rates adjusted for differences in the prices of goods and
services across countries. The
assignment to a group, or income tier, is based on a household’s daily per
capita income or consumption, a simple way of controlling for differences in
household size. In the source data, some countries only
report income data while others only report consumption data. The terms
“income” and “consumption” are used interchangeably for the sake of
convenience. A
middle-income, or middle-class, threshold of $10 follows the practice of
other researchers. A similar threshold has been used by the World Bank (2007, 2015),
researchers at the Organization for Economic Cooperation and Development (Kharas,
2010), the development community (Birdsall, Lustig and Meyer, 2013)
and others. There is evidence that the $10 threshold, which is about five
times higher than the World Bank’s global poverty line,
is associated with economic security and
“insulates” people from falling back into poverty. An earlier Pew Research Center report discusses
the choice of income thresholds in greater detail. The global
middle-class standard is modest by the standards of advanced economies. In
2020, the official poverty line for
a family of four in the U.S. stood at about $15.90 per person per day (in
2011 prices). Thus, many who are poor by the U.S. definition would meet the
global middle-income standard or, conversely, many who are in the global
middle class would be poor by U.S. standards.
These
estimates are based on the Center’s analysis of World Bank data on
the distribution of people by either income or consumption levels in seven
major global regions. The latest available estimates of income for each
region, such as for 2018 for Europe and Central Asia and 2015 for the Middle
East and North Africa, are extrapolated to 2020 using two sets of growth
estimates: the forecasts issued by the World Bank in January 2020, prior to
the pandemic, and the estimates issued in January 2021, with the pandemic’s
economic impact in plainer sight. The difference between these two measures
is taken to represent the impact of the COVID-19 downturn on the standard of
living of people globally. Prior to the
emergence of COVID-19, some 1.38 billion people were expected to be counted
in the global middle class in 2020. But the pandemic is estimated to have
driven this number down to 1.32 billion. The share of people in the middle
class globally is estimated to have been 17.1% in 2020, instead of
potentially 17.8%. The erosion in the middle class might have been deeper if
not for the fact that China – which is home to more than one-third of the
global middle class – evaded an economic contraction,
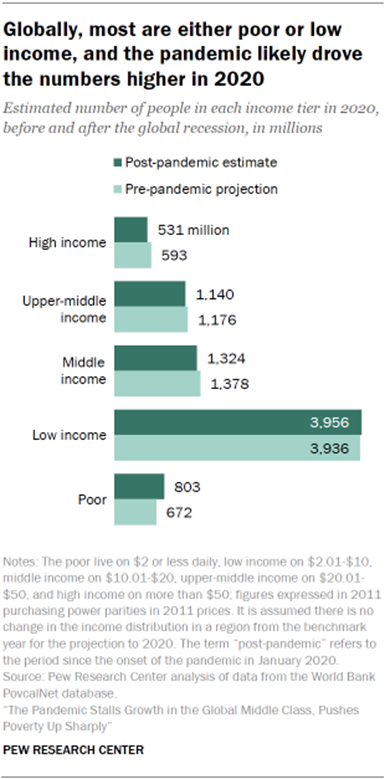
even though growth there was slower than anticipated. The number
of global poor is estimated to have risen to 803 million in 2020, much
greater than the 672 million initially expected. The global poverty rate,
which had been in steady decline this century,
is likely to have increased to 10.4%, nearly reverting to the rate in 2017,
instead of sinking to a new low of 8.7%, as previously expected. The steep
rise in global poverty is driven by the fact that many who were in the
low-income tier prior to the pandemic lived on the margin of poverty. In
2017, 877 million people lived on $2 to $3 a day, according to World Bank
estimates. Thus, large numbers were susceptible to falling back into poverty
prior to the pandemic, especially in South Asia and Sub-Saharan Africa. At the other
end of the economic spectrum, the global high-income population likely fell
to 531 million in 2020 from the 593 million originally expected.
Consequently, the expected share in the high-income tier is 6.8%, not 7.6%. A
vast majority of the global high-income population lives in advanced
economies, and this group of countries also experienced a sharp downturn in
2020. Ironically, this bolstered the global middle-income population as
people in advanced economies slipped down the ladder from higher income
tiers.
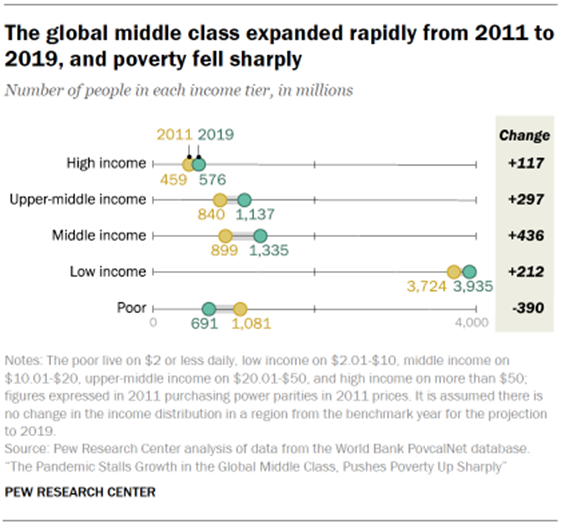
The reversal
in global living standards in 2020 comes on the heels of notable progress
earlier in the decade. From 2011 to 2019, the global middle-class population
increased from 899 million to 1.34 billion, or by 54 million people annually,
on average. The pandemic is estimated to have erased a year of growth,
leaving the global middle-class population nearly unchanged from 2019 to
2020. Global
poverty had abated at an average rate of 49 million annually from 2011 to 2019,
with the number of global poor falling from 1.10 billion to 691 million
during this period. The pandemic, by adding 131 million to the ranks of the
poor, has set the progress on poverty back by several years, and the poverty
rate is estimated to have increased from 9.0% in 2019 to 10.4% in 2020. From 2011 to
2019, the global high-income population had increased from 459 million to 576
million, growing by an average of 15 million annually. Thus, the setback of
62 million due to the pandemic in 2020 also reverses several years of growth
in the high-income population. The share of the global population in the
high-income tier is expected to have decreased from 7.5% in 2019 to 6.8% in
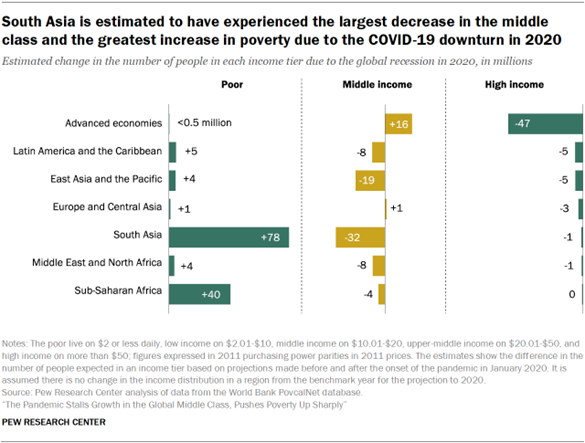
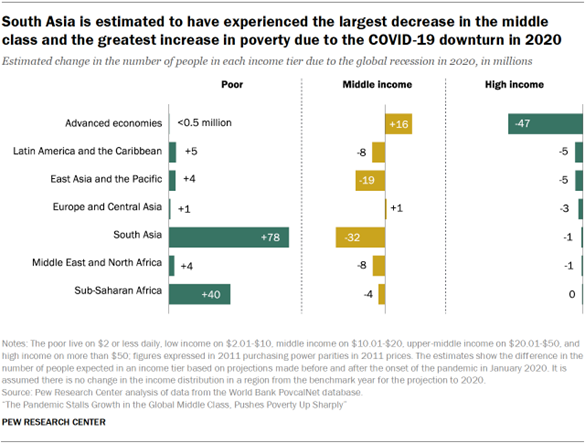
2020. The erosion of the middle class is centered in Asia, the rise in poverty
in Asia and Africa The effect
of the COVID-19 downturn on the middle class and other income tiers shows
distinct regional differences. Asia is expected to have accounted for most of
the shrinking of the global middle class in 2020, with the middle-class
population falling by 32 million in South Asia and by 19 million in East Asia
and the Pacific. Meanwhile, the middle class in advanced economies is
estimated to have increased by 16 million, in part due to the drop-off in the
high-income tier in those countries.
The
projected rise in global poverty in the pandemic is concentrated in South
Asia (an increase of 78 million) and Sub-Saharan Africa (40 million),
historically among the poorest regions in the world. The high-income
population in advanced economies is estimated to have shrunk by 47 million in
2020, accounting for most of the falloff globally. It should be noted that
the global cutoff for the high-income tier – more than $50 a day – is not
much higher than the median income across advanced economies, as an estimated
40% of the population in these countries is in the global high-income tier.
Thus, the contraction of the high-income tier in advanced economies is more a
reflection of the reduction in the standard of living of the typical person in
these countries than outcomes for the wealthy. The
contribution of a region to global changes overall and the shift in its own
income distribution depends mostly on two factors: the sizes of income tiers
in the region prior to the COVID-19 recession and the impact of the downturn
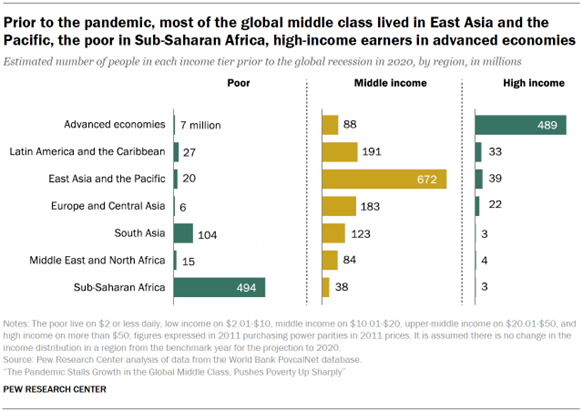
on economic growth in the region. Prior to the
pandemic, nearly half of the global middle-class population – 672 million of
1.38 billion – was estimated to live in East Asia and the Pacific, a region
that includes China. Latin America and the Caribbean accounted for 191
million, and Europe and Central Asia was home to 183 million. South Asia
accounted for 123 million more. In view of
these magnitudes, the estimated loss (relative to pre-pandemic expectations)
of 32 million people from the middle class in South Asia is notable for two
reasons. First, the region contributed the most to the shrinking of the
global middle class in 2020 despite having a middle-income population smaller
than several other regions. Second, the percentage decrease in South Asia’s
middle-income population from what was previously expected (26%) is much
greater than in any other region. Although East Asia and the Pacific shed 19
million from the middle-income tier, that represented only 3% of its middle
class.
Poverty is
most prevalent in Sub-Saharan Africa. Some 494 million people in Sub-Saharan
Africa, out of a total population of 1.14 billion, were expected to be living
in poverty ahead of the pandemic in 2020. South Asia, with a total population
of 1.86 billion, was expected to be home to 104 million poor. Nonetheless,
South Asia is estimated to have added nearly double the amount of people to
the ranks of the globally poor as Sub-Saharan Africa in the pandemic. The
percentage increase in poverty in South Asia (75%) dwarfs the increase in
Sub-Saharan Africa (8%). The number
of poor in other regions was smaller, estimated to range from 6 million in
Europe and Central Asia to 27 million in Latin America and the Caribbean
ahead of the pandemic in 2020. But, since that moment, the increase in
poverty in these regions is notable. The Middle East and North Africa and
East Asia and the Pacific are each estimated to have seen increases in
poverty of more than 20% due to the recession. The rise in poverty in both Europe
and Central Asia and Latin America and the Caribbean is not far behind, with
each experiencing a 17% increase in poverty. A large
majority of the global high-income population – 489 million of 593 million –
lived in advanced economies before the global recession took hold. The
estimated decrease of 47 million, or 10%, in this population in advanced
economies accounts for most of the shrinking of the global high-income tier. In
proportional terms, the drop off in the high-income tier is also notable in Latin
America and the Caribbean (15%), Europe and Central Asia (12%) and East Asia
and the Pacific (12%). The losses in the Middle East and North Africa, South
Asia and Sub-Saharan Africa are relatively small in magnitude (each less than
1 million people) but also represent double-digit shares of the high-income
populations in those regions.
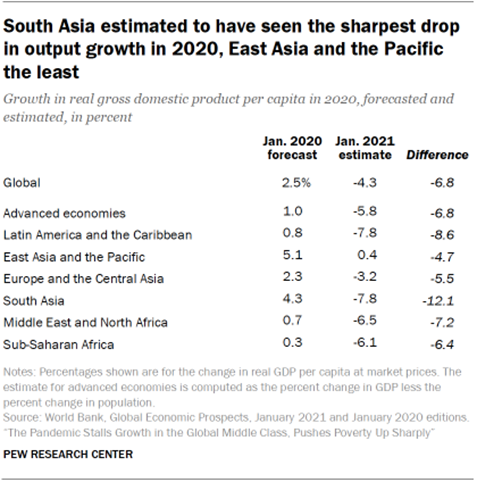
The
relatively outsized role of South Asia in the contraction of the global
middle class and the expansion of poverty is the result of it seeing the
sharpest reduction in economic growth in the pandemic. In January 2020, the
World Bank forecasted that South Asia would experience a 4.3% increase in
gross domestic product (GDP) per capita in 2020. But, in January 2021, output
in South Asia was estimated to have decreased by
7.8% in 2020, a retreat of 12.1 percentage points from potential. The setback
to economic growth in other regions is smaller, ranging from 4.7 percentage
points in East Asia and the Pacific to 8.6 points in Latin America and the
Caribbean. East Asia and the Pacific is the only region in which growth is
estimated to have stayed positive in 2020, with GDP per capita inching up by
0.4% even after the onset of the pandemic. Otherwise, the latest estimates of
the change in output per capita in 2020 ranged from -3.2% in Europe and
Central Asia to -7.8% in Latin America and the Caribbean. (PEW) MARCH 18,
2021 SUMMARY
OF POLLS
ASIA (India) Maruti Suzuki Is The Healthiest Automotive Brand In India Maruti
Suzuki tops YouGov’s 2021 Auto Rankings in India with an
Index score of 28.6. Despite this year’s global pandemic and consequent
economic downturns, the Indian auto manufacturer enjoys the best brand health
among consumers in India. The rankings were based on the Index score
from YouGov BrandIndex, which is a measure of overall brand
health calculated by taking the average of Impression, Quality, Value,
Satisfaction, Recommend and Reputation. (YouGov
India) March
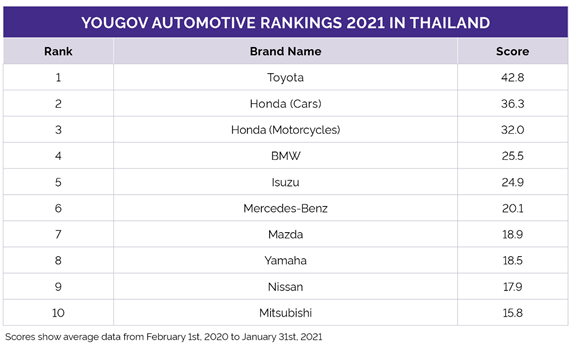
16, 2021 (Thailand) Toyota Tops YouGov Thailand’s 2021 Automotive Rankings Toyota
tops YouGov’s 2021 Automotive Rankings for Thailand with an Index score
of +42.8, making it the car brand with the best overall brand health
according to Thais. The rankings are compiled using YouGov BrandIndex Index
score, a measure of overall brand health calculated by taking the average of
Impression, Quality, Value, Satisfaction, Recommend and Reputation scores.
The rankings are measured from 1 February 2020 to 31 January
2021. (YouGov
Thailand) March
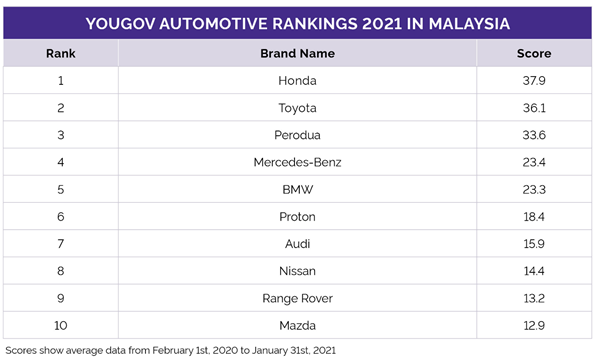
16, 2021 (Malaysia) Honda Tops YouGov Malaysia’s 2021 Automotive Rankings Honda
tops YouGov’s 2021 Automotive Rankings for Malaysia with an Index score of
+37.9, making it the car brand with the best overall brand health according
to Malaysians. The rankings are compiled using YouGov BrandIndex Index score,
a measure of overall brand health calculated by taking the average of
Impression, Quality, Value, Satisfaction, Recommend and Reputation scores.
The rankings are measured from 1 February 2020 to 31 January. (YouGov Malaysia) MENA (Saudi
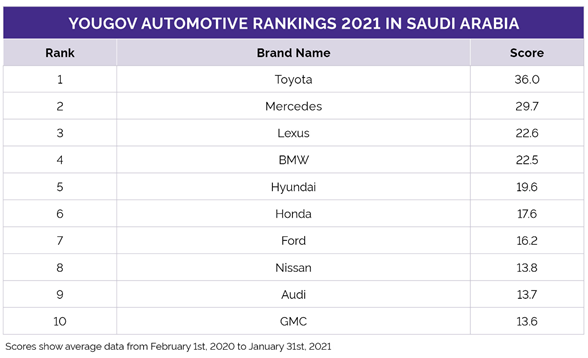
Arabia) Toyota Tops Yougov’s 2021 Automotive Rankings In Saudi
Arabia YouGov’s
2021 Automotive Rankings reveal Toyota enjoys the best brand health among
Saudi residents and tops the list with an Index score of 36. Along with the
parent brand, its luxury segment subsidiary- Lexus also makes a presence in
the list in third (with a score of 22.6). (YouGov
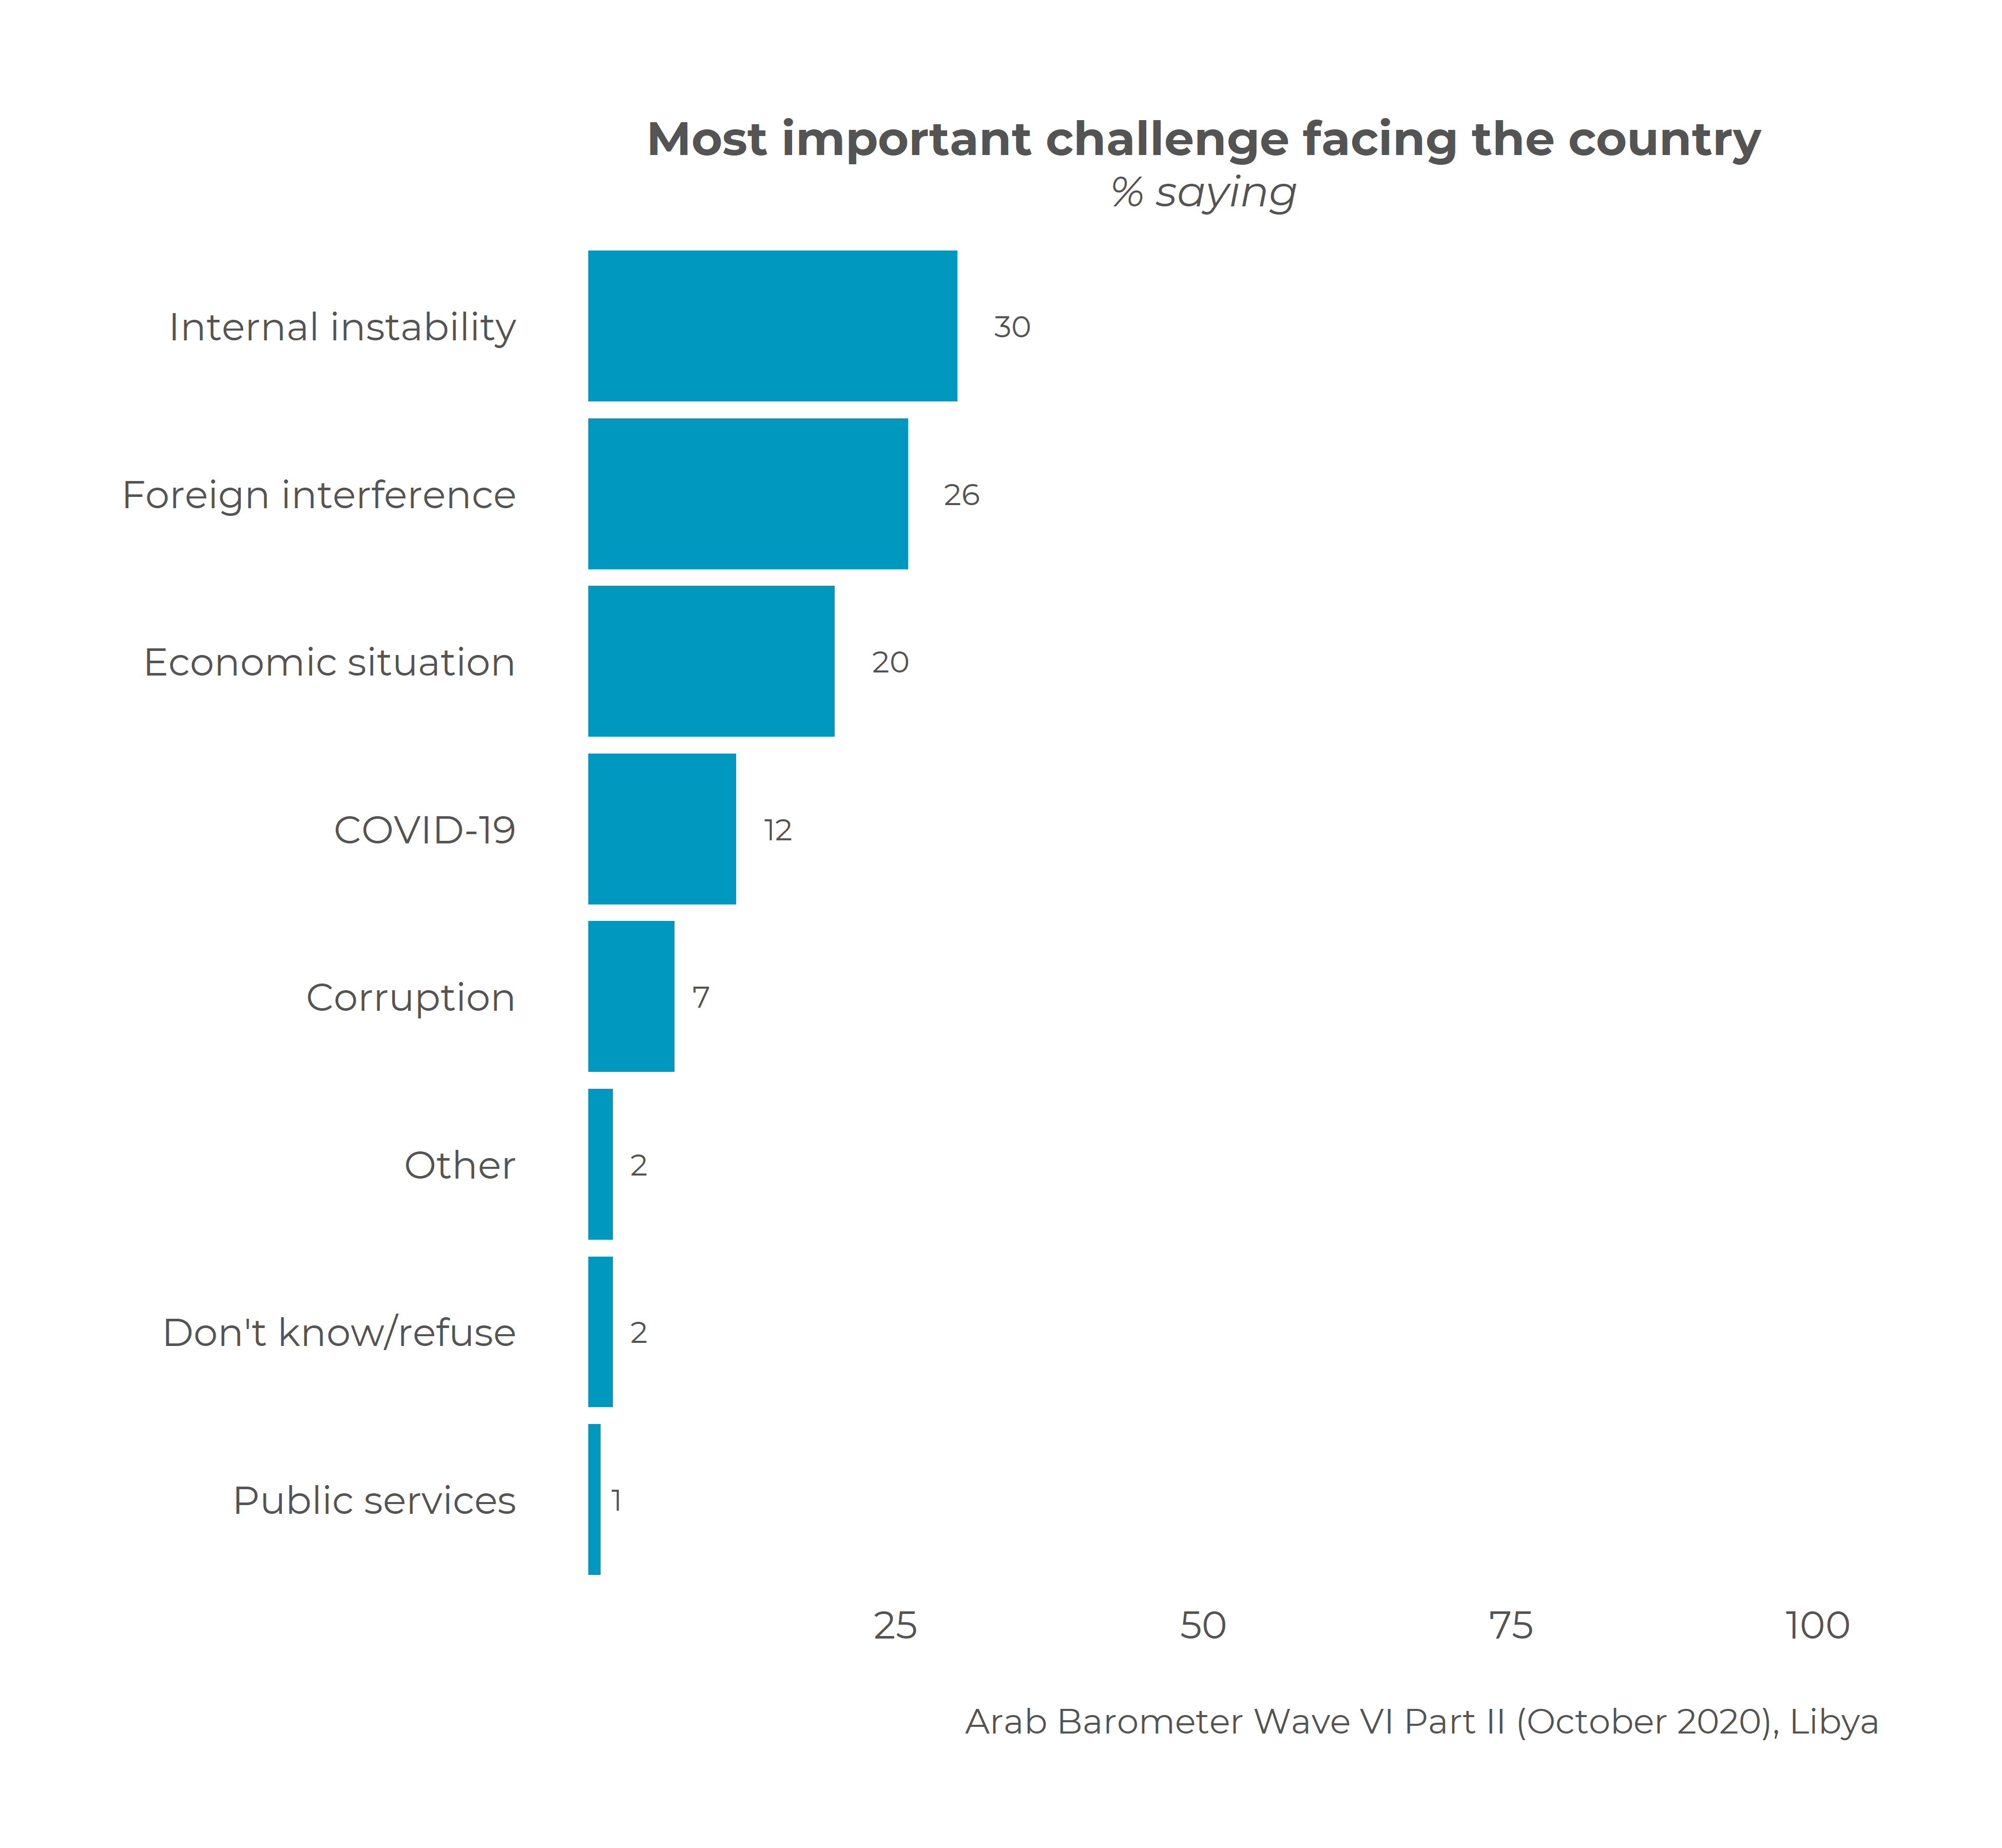
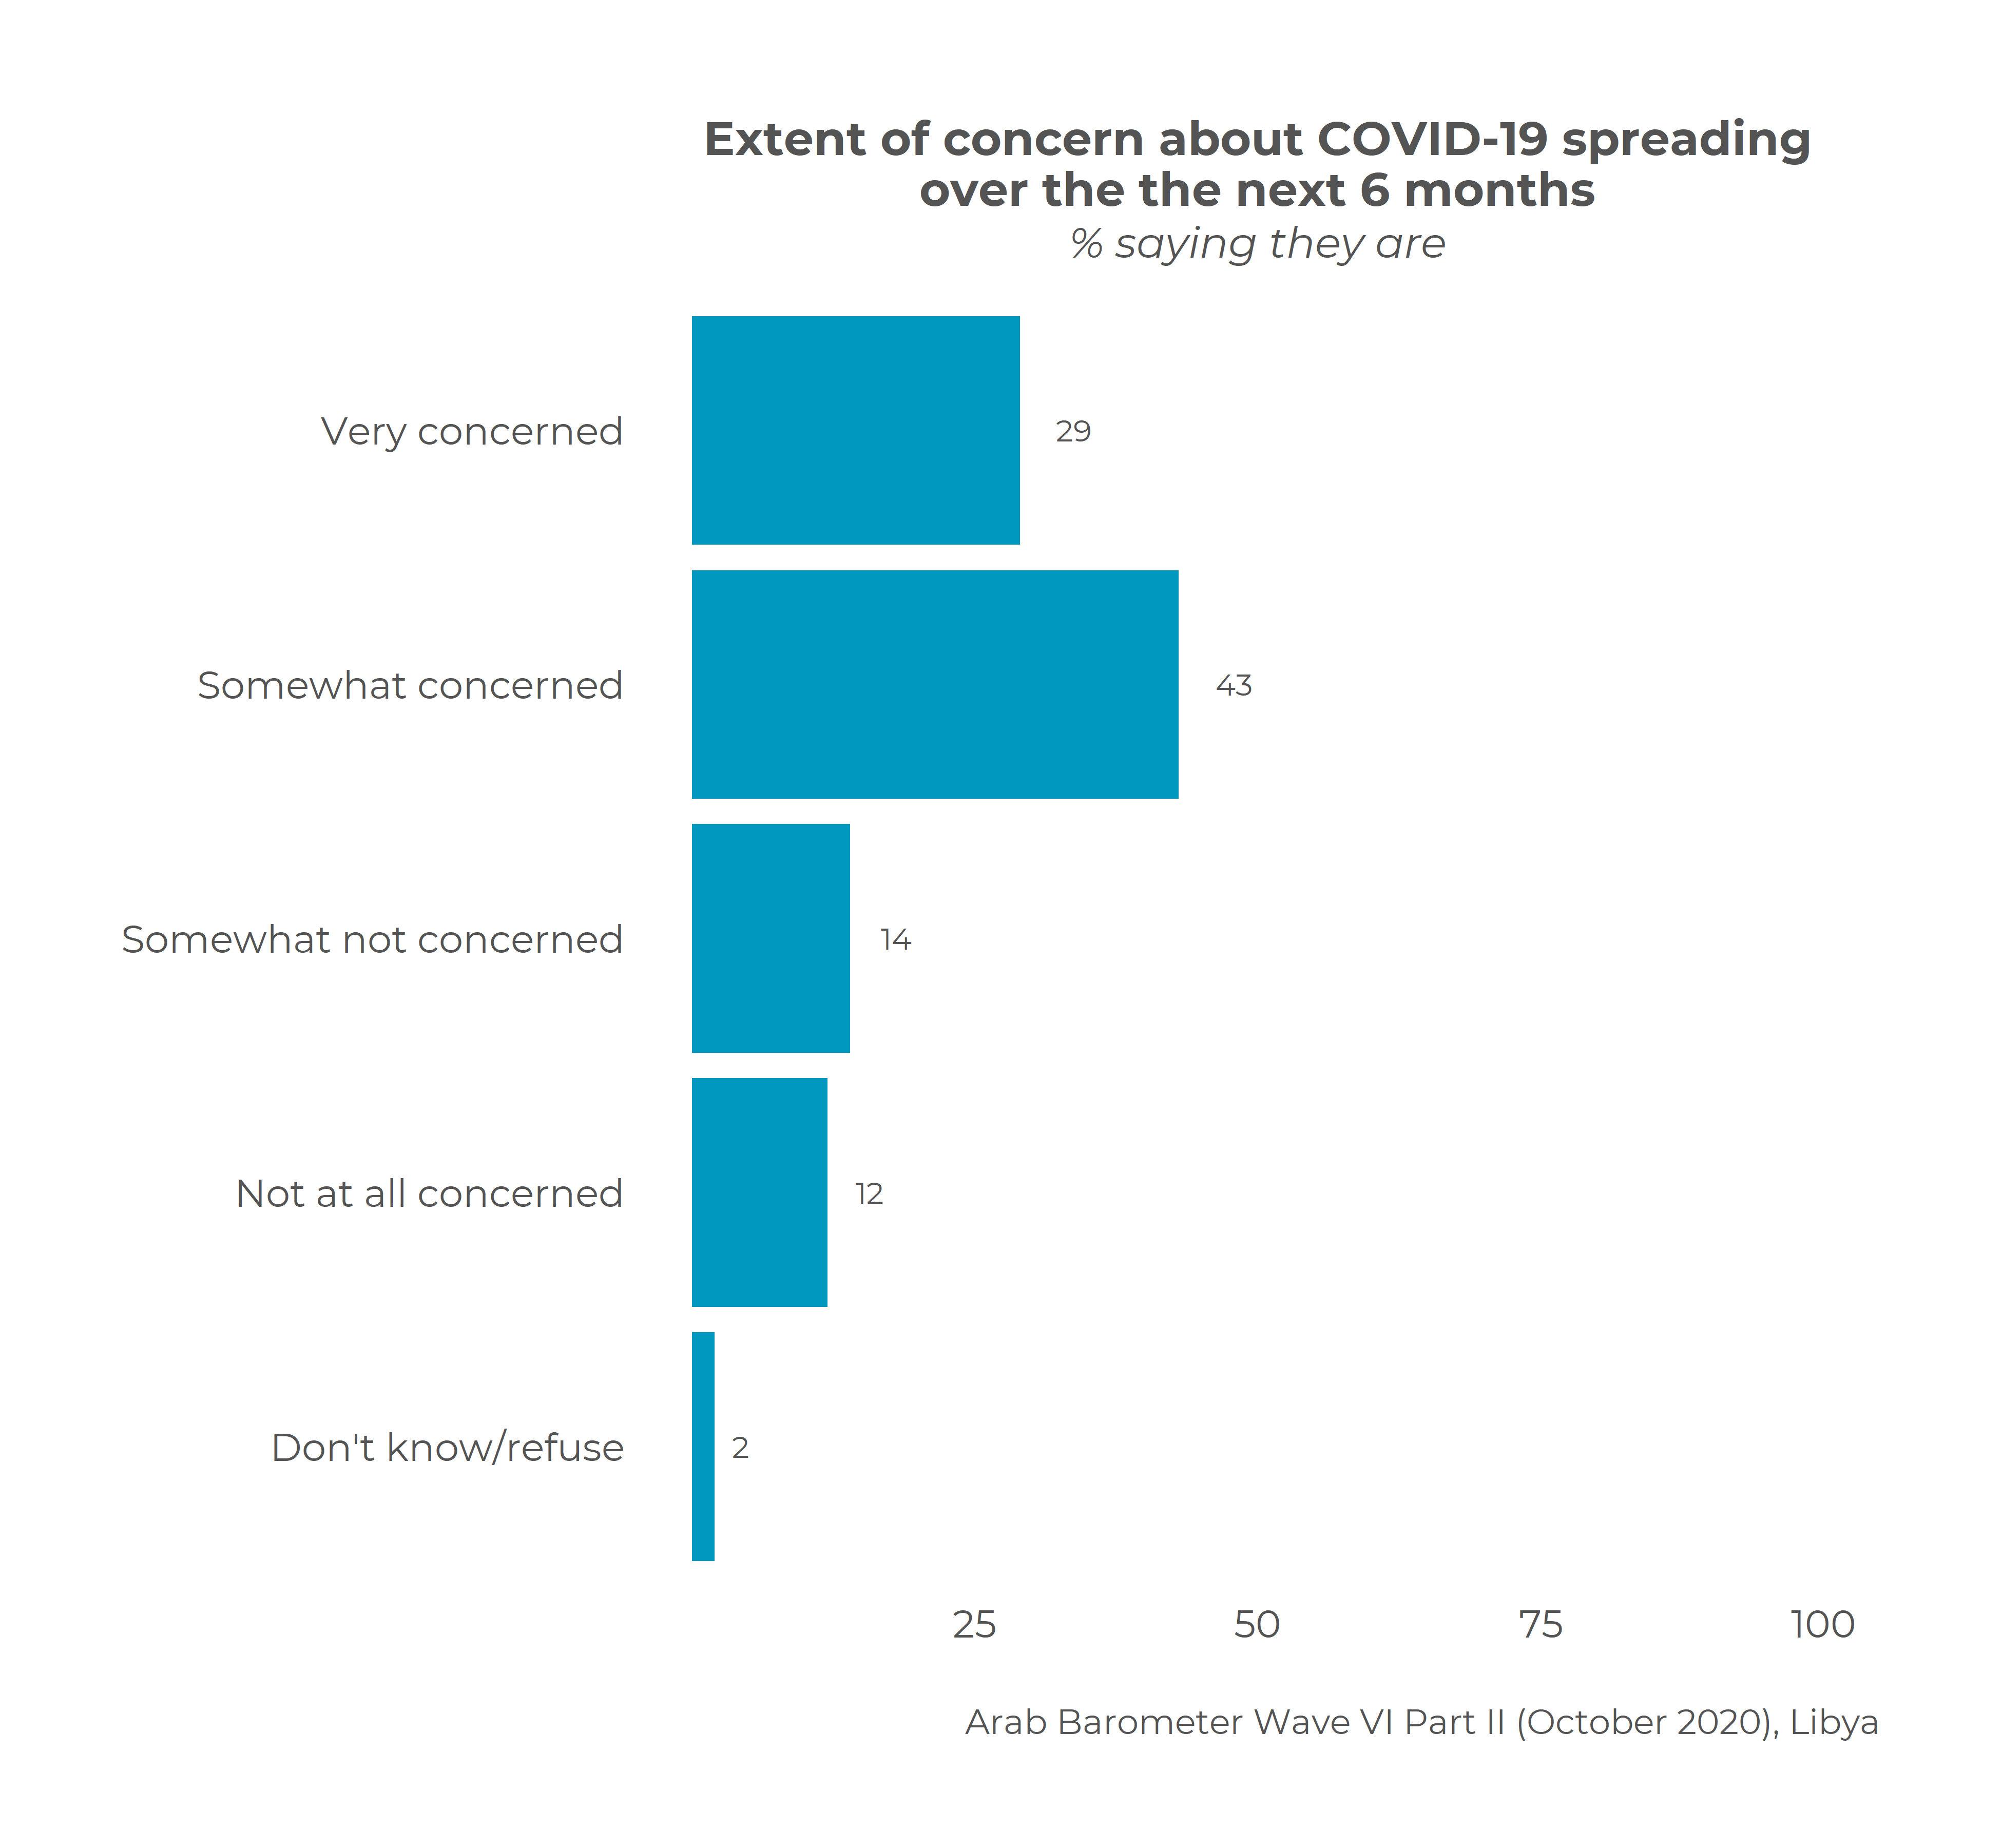
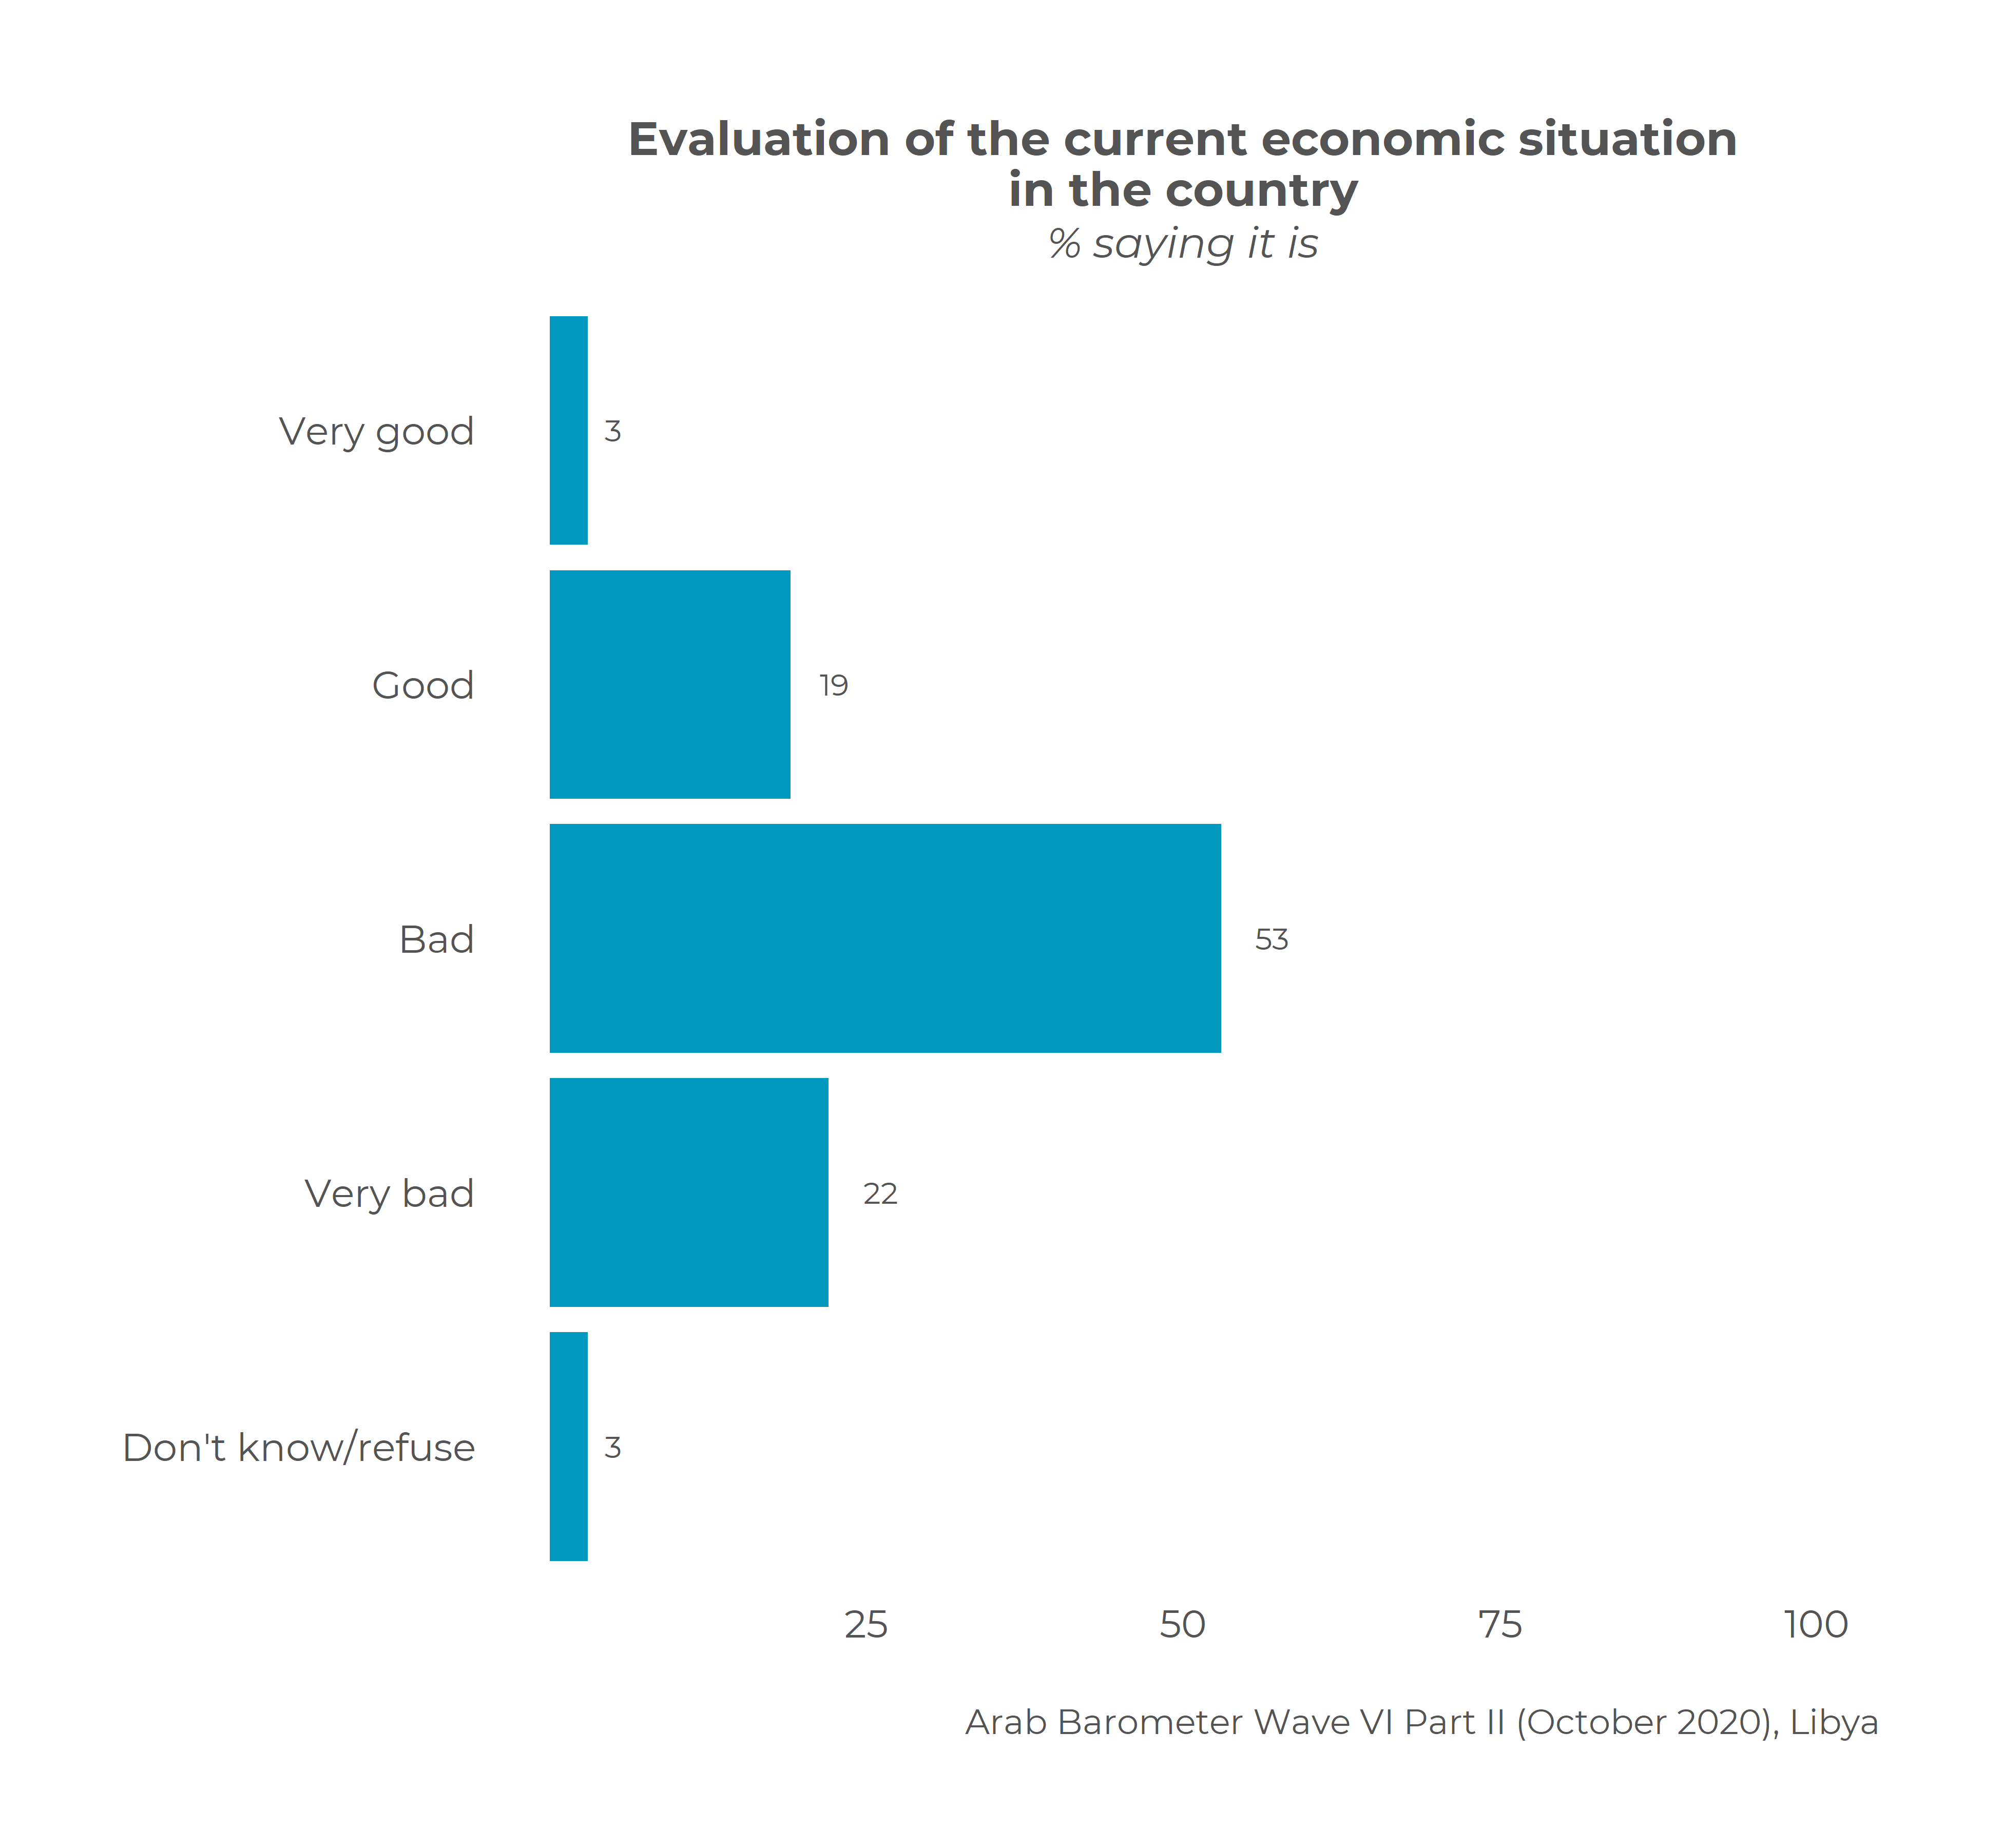
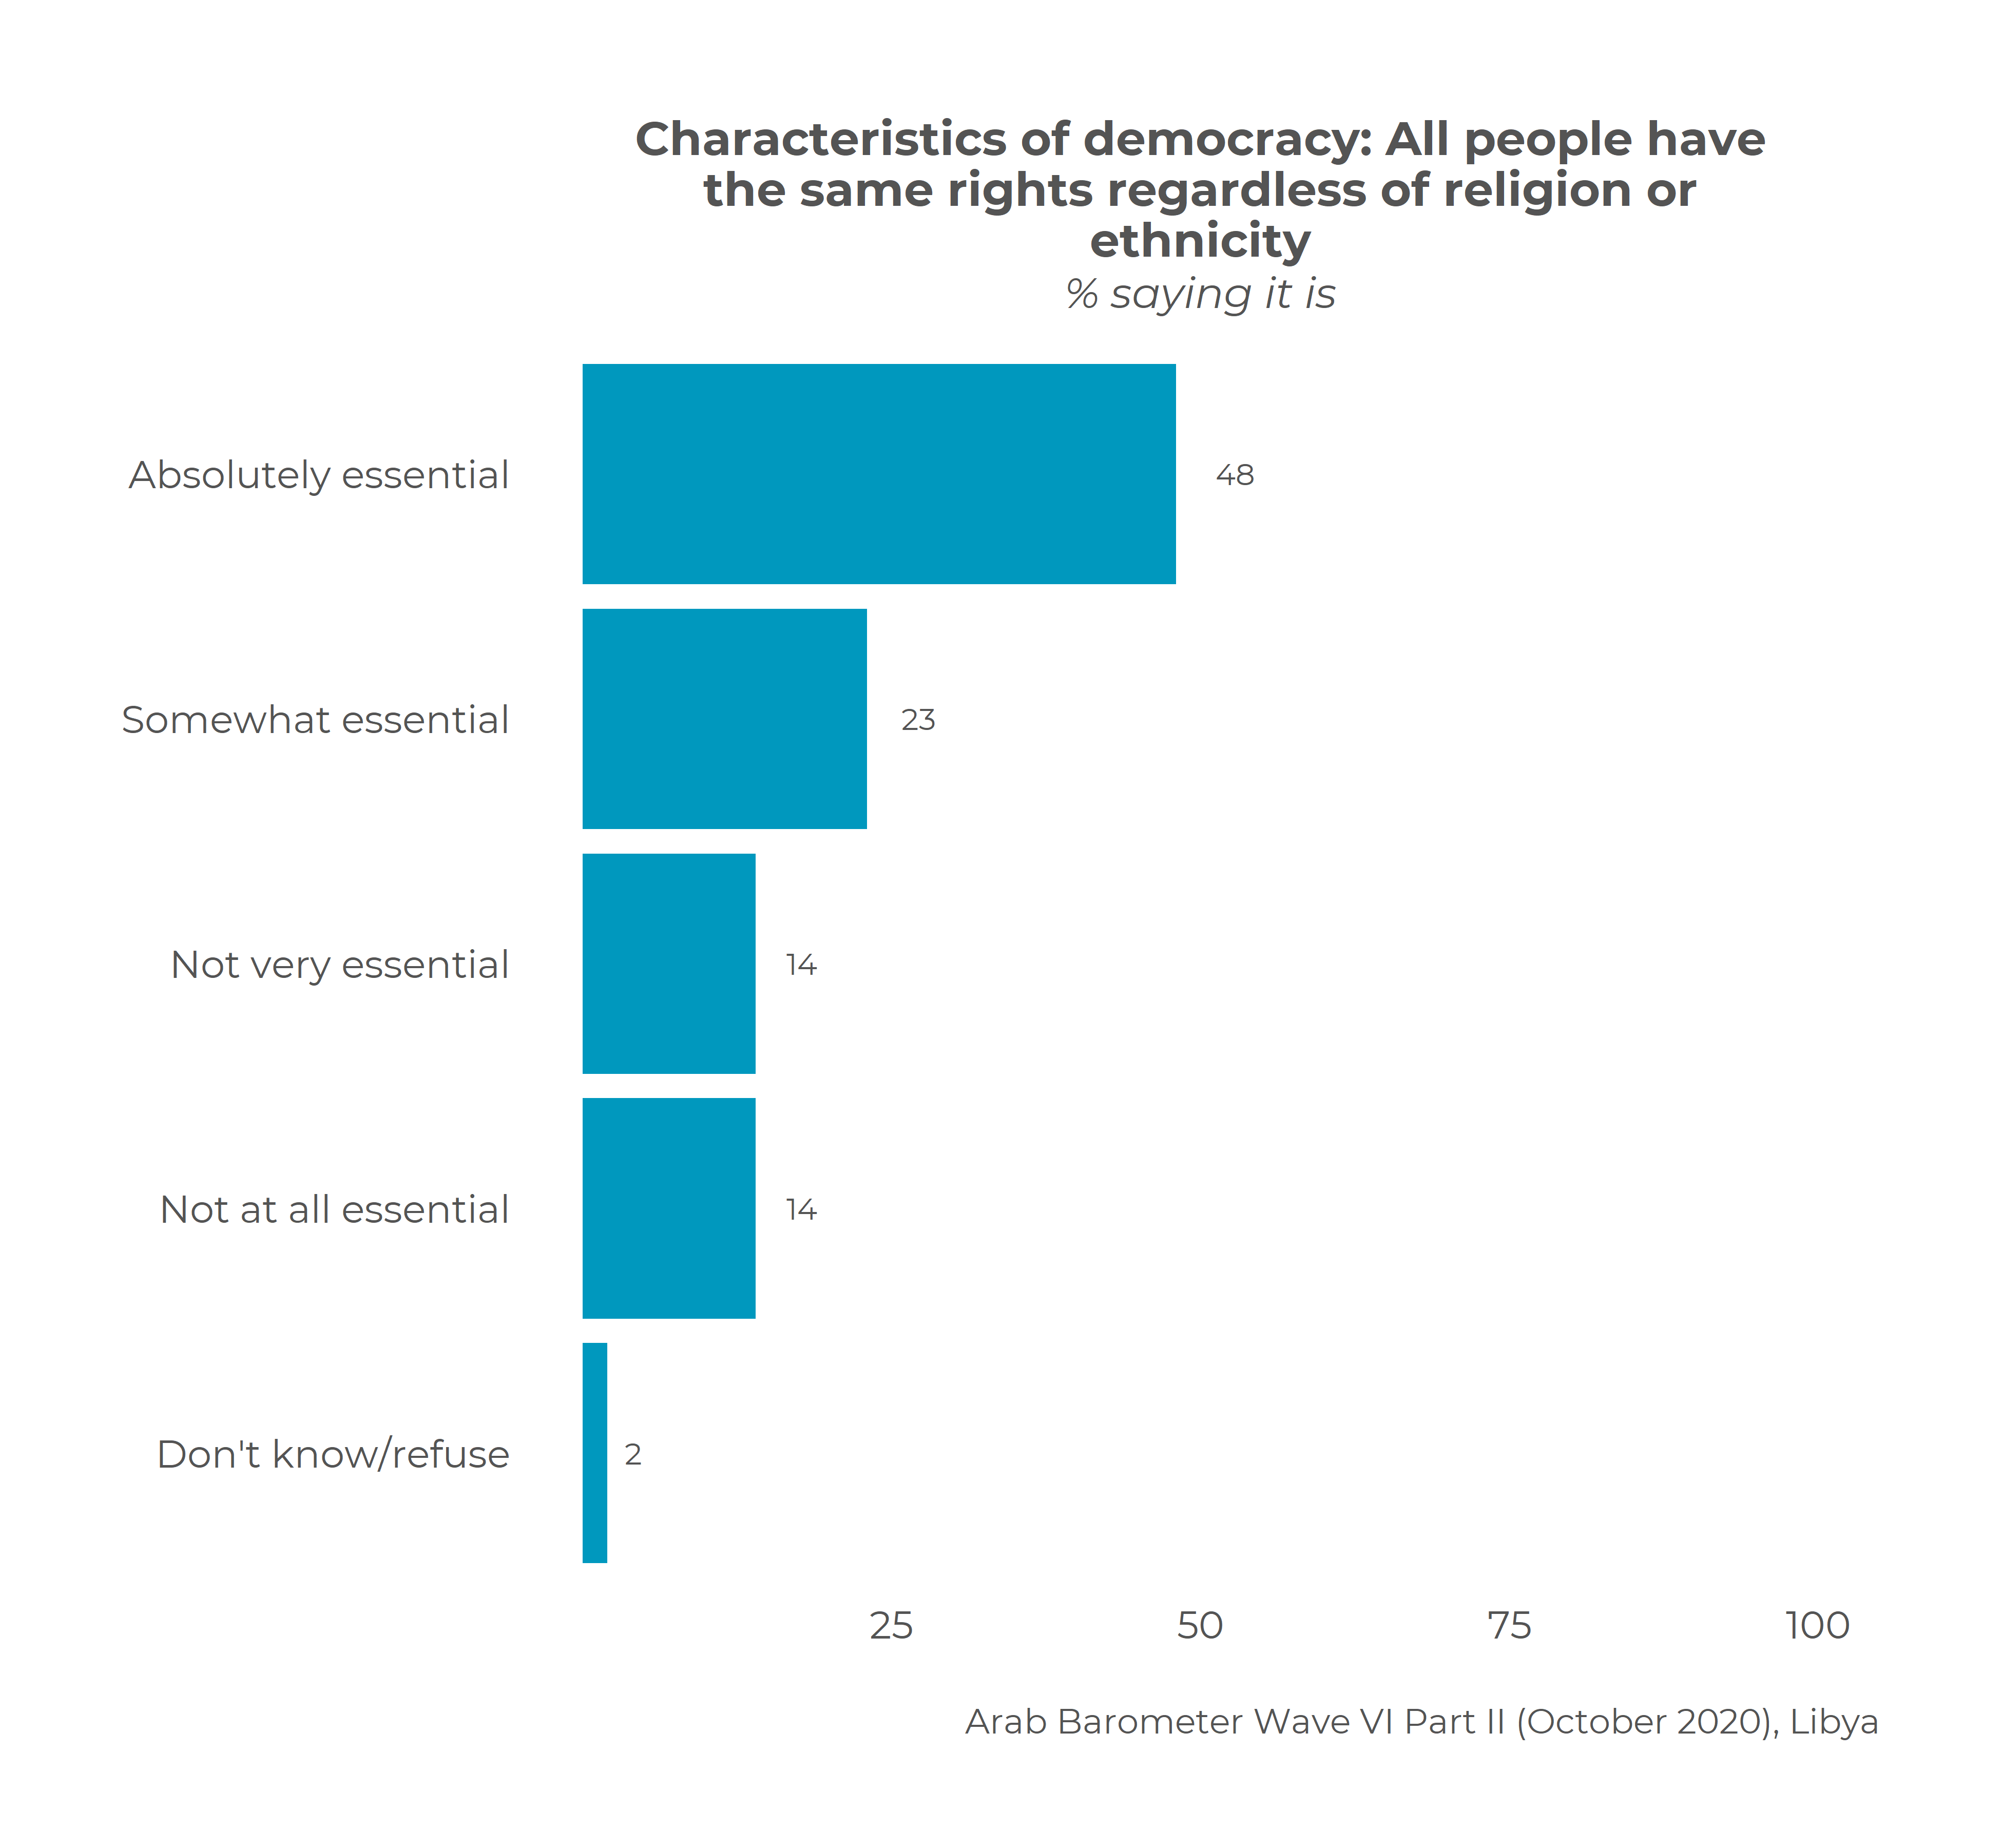
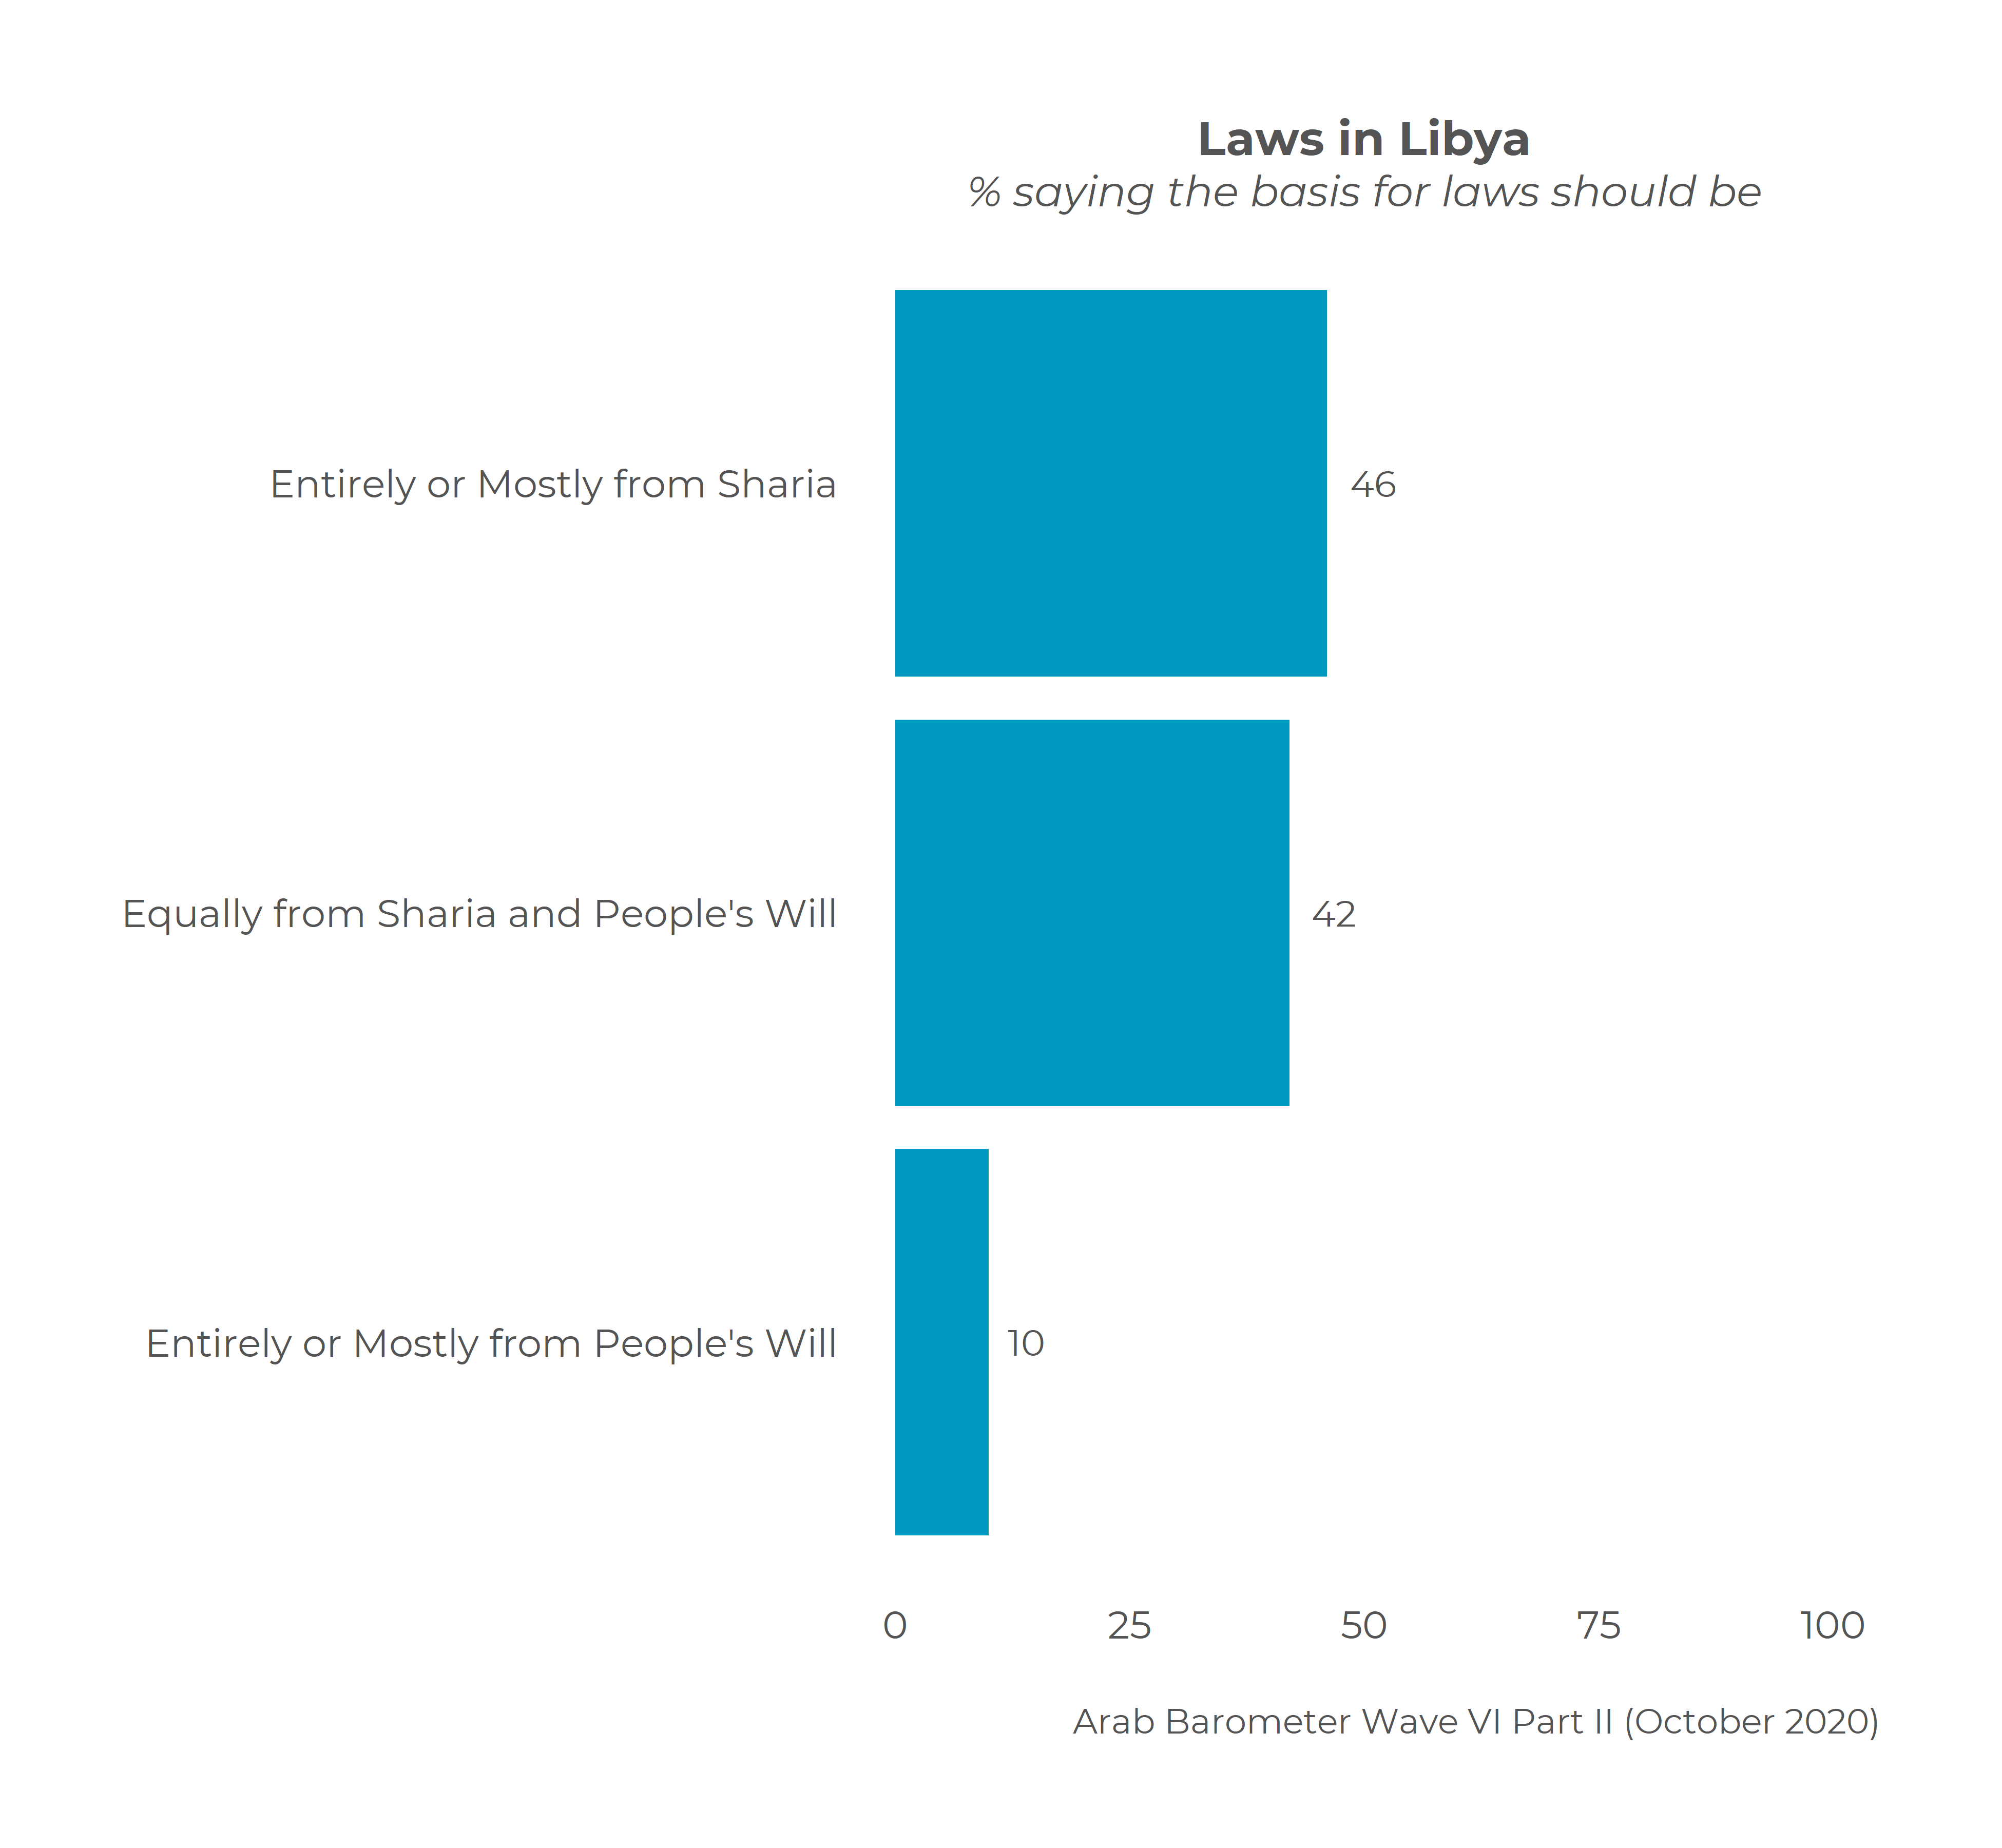
MENA) (Libya) Three-In-Four Libyans Say The Economy Is In A Very Bad Or A
Bad State When
asked about the most important challenge currently facing the country,
three-in-ten Libyans say it is the internal instability while 26% cite
foreign interference. The dire economic situation comes third with 20%, and
the COVID19 threat is seen by only 12% as the most important challenge facing
Libya. However, COVID19 remains a source of concern. The majority of Libyans
(72%) say they are very concerned or somewhat concerned about the spread of
the virus in the next 6 months. (Arabbarometer) March
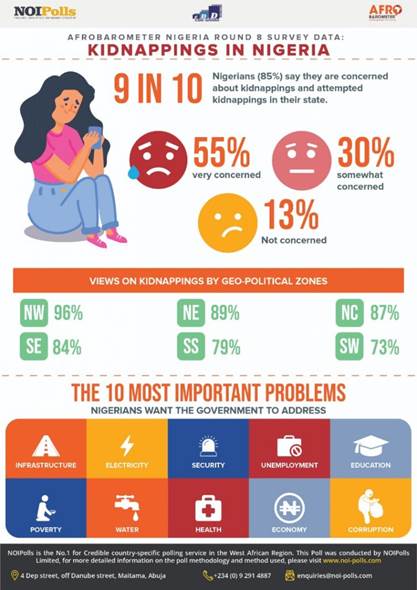
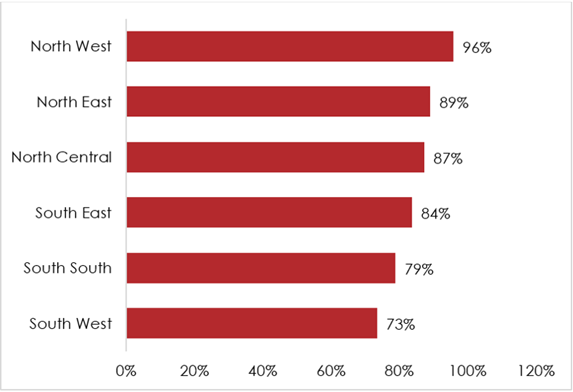
16, 2021 AFRICA (Nigeria) Nine In 10 Nigerians (85%) Say They Are Concerned About
Kidnappings Almost
nine in 10 Nigerians (85%) say they are concerned about kidnappings and
attempted kidnappings in their state, including 55% who are “very concerned”
about this issue. Only 13% say they are either not that concerned or not
concerned at all. Apprehension about kidnappings is more widespread in the
three northern zones – North West (96%), North East (89%), and North Central
(87%) – than in the South. (Afrobarometer) March
18, 2021 WEST
EUROPE (UK) Six In Ten Do Not Want To Cut Spending On Public Services
To Pay Off Debt The new Ipsos MORI Political Monitor finds
that most Britons (54%) believe that the Government has spent about the right
amount on supporting ordinary people during the pandemic so far (29% say
they’ve spent too little). However, when it comes to future spending the
public are more split, with 45% thinking the Government will spend too little
on supporting ordinary people during the recovery from the pandemic and 40%
thinking they will spend the right amount. (Ipsos
MORI) 17
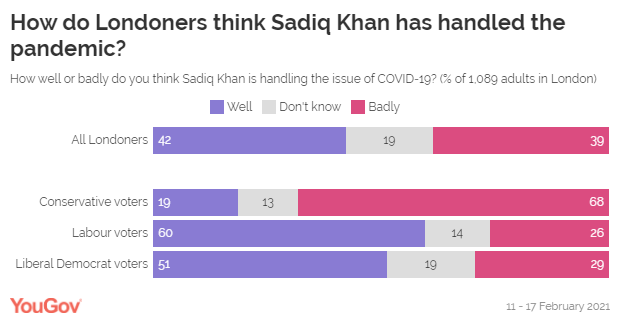
March 2021 43% Londoners Think Sadiq Khan Has Handled COVID Well Overall,
Londoners are split over Khan’s handling of the pandemic: 43% think he has
handled it well, while 39% think he has handled it badly. Labour voters (60%)
are the most likely to think Khan has handled the pandemic well, including
one in eight (12%) who think Khan has handled it “very well”. However, around
a quarter of Labour voters (26%) are not happy with Khan’s performance and
think he has handled the pandemic badly. (YouGov
UK) March
18, 2021 Less Than Half Of Britons Expected To Tick ‘Christian’ In
Uk Census The once-a-decade snapshot of the country
has included a voluntary question about religion since 2001. In 2011, returns
across England and Wales, Scotland, and Northern Ireland showed 59.3%
ticking Christianity, a fall from 71.6% a decade earlier. Day predicted the proportion of people ticking
Christianity “could drop below 50%”. Peter Brierley, an expert on religion
statistics, said he predicted 48% or 49% identifying as Christian, but David
Voas, head of the social sciences department at University College London,
said he would be surprised if the figure fell below 50%. (The
Guardian) March
20, 2021 (France) 1 In 2 French People Think The Pandemic Has
Exacerbated Ethnic Discrimination 7
out of 10 French people believe that the criteria of origin influence
the possibilities of access to housing. 69% of French people surveyed
also believe that they condition access to employment and 63% that they
determine access to education. Almost a quarter (24%) of French
people surveyed declared having had personal experience of situations in
which they considered their origin to have been an obstacle. More than
half (52%) of French people (n ° 2 after Spain) think that the
pandemic has exacerbated discrimination - employment, education, housing or
social services - linked to ethnic origins. (Ipsos
France) March
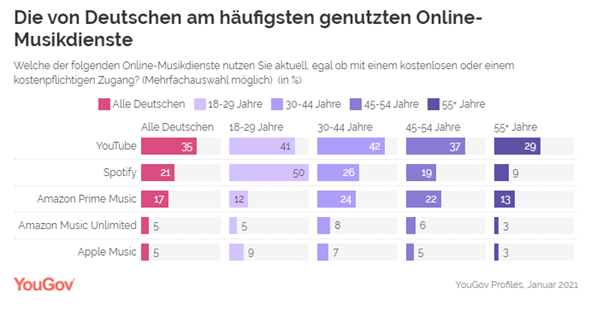
21, 2021 (Germany) Youtube Is The Most Popular Online Music Service Among
Germans Not
only video but also audio streaming was the focus, in the latter case
especially podcasts and music streaming. In this context, 35 percent of
Germans state that they currently use the YouTube platform, regardless of
whether they have free or paid access. This is what respondents aged 18
to 44 say most often (41-42 percent). The streaming portal Spotify only
ranks second among all German respondents with 21 percent, but it is more
important for the 18 to 29 year olds: Half (50 percent) of that age group
state that they currently use Spotify. (YouGov
Germany) March
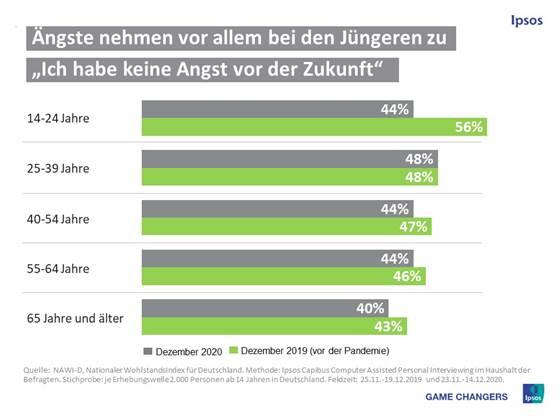
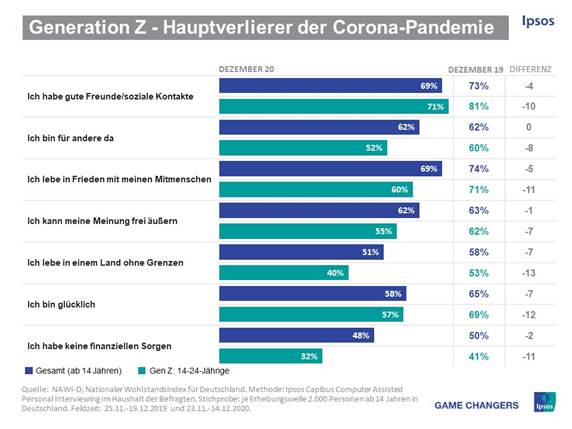
19, 2021 71% Of 14 To 24-Year-Olds State That They Have Good Social
Contacts With Friends The
proportion of 14 to 24-year-olds who state that they have good social
contacts with friends has decreased by ten percentage points to 71 percent
during this period. In terms of contacts with family members, the
difference compared to the survey from December 2019 is eight percentage
points. Likewise, the proportion of those who can “be there for others”
to the desired extent falls in Generation Z by eight percentage points to 52 percent.
(Ipsos
Germany) 18
March 2021 (Finland) Finland's Strongest Car Brands When
Finns evaluate car brands on six indicators (quality, general image, value
for money, willingness to recommend, reputation and satisfaction), Toyota
ranks number one. Volvo grabs second place in the Finnish rankings and
Mercedes-Benz third place. In addition to Mercedes-Benz, several German
brands will rise to the TOP10 list. Volkswagen is fourth, Audi fifth and
BMW sixth. Japanese brands can also be found on the list in addition to
Toyota, with Honda ranked nineth and Nissan ranked tenth. (YouGov
Finland) March
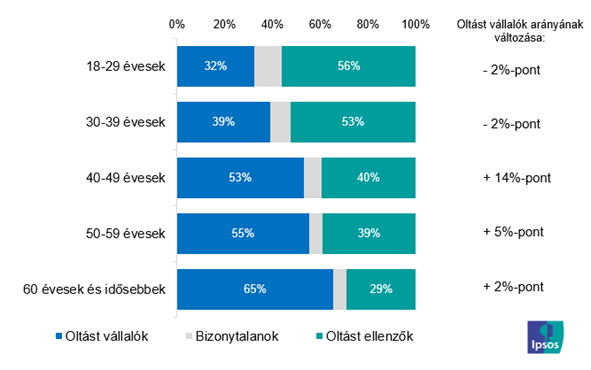
16, 2021 (Hungary) Above 50% Vaccination Propensity In Hungary Rejection
is highest in the under-30 age group, at 56%, compared to only
32%. Among those over 50, the proportion is just the opposite. In
absolute terms, two-thirds of the population who have received at least one
vaccination is over 60, and two-thirds are also women. Half of those who
oppose the vaccine are under the age of 40 (although they make up 38% of the
adult population), yet vaccination can be measured at the same rate among
both sexes. (Ipsos
Hungary) March
16, 2021 NORTH AMERICA (USA) 69 Americans Say It Is Very Important For Federal Law
Enforcement Agencies To Find And Prosecute The People Who Broke Into The U.S.
Capitol On Jan 6 The
survey by Pew Research Center, conducted March 1-7, 2021, among 12,055 U.S.
adults who are members of the Center’s nationally representative American Trends Panel, finds a wide majority of Americans (69%) saying
it is “very important” for federal law enforcement agencies to find and
prosecute the people who broke into the U.S. Capitol on Jan. 6. Another 18%
say doing this is “somewhat important.” Just 12% say this is not too or not
at all important. (PEW) MARCH
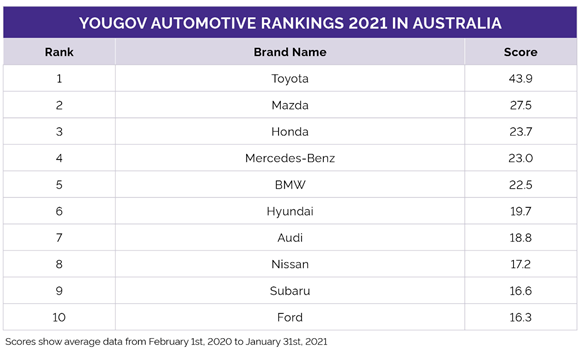
18, 2021 AUSTRALIA Toyota Tops YouGov Australia’s 2021 Automotive Rankings Toyota
tops YouGov’s 2021 Automotive Rankings for Australia with an Index score of
+43.9, making it the car brand with the best overall brand health according
to Australians. The rankings are compiled using YouGov BrandIndex Index
score, a measure of overall brand health calculated by taking the average of
Impression, Quality, Value, Satisfaction, Recommend and Reputation scores.
The rankings are measured from 1 February 2020 to 31 January 2021. (YouGov
Australia) March
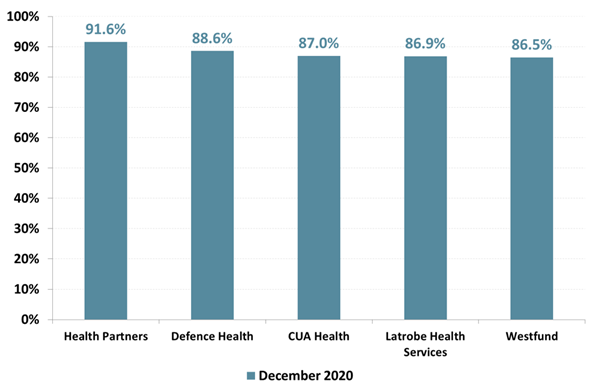
16, 2021 73.7% Of Australians Holding Private Health Insurance Are Satisfied Australia’s
largest fund by market share, Medibank Private, had a satisfaction rating of
69.8%, one of the lowest of the more than two dozen funds measured. BUPA,
which is a close second in terms of market share, had a slightly higher score
of 71.5%. Each of those funds has more than twice as many members as the next
largest fund, HCF, which had a customer satisfaction rating of 75%. (Roy
Morgan) March
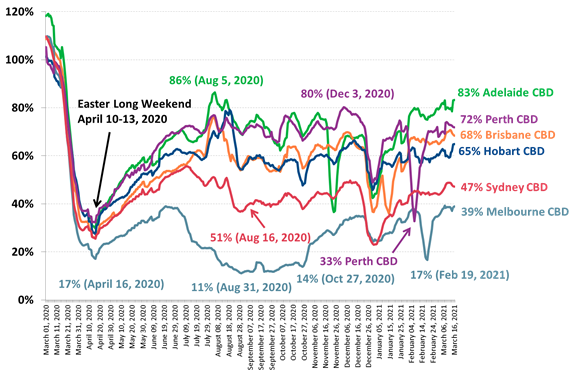
17 2021 Movement Of People In Melbourne Cbd Is At 39% Of Normal One Year
After The First Covid Lockdown The Adelaide CBD has been the standout
performer over the last two months with movement levels in mid-March now at
83% of the pre-COVID-19 levels and above 70% since the start of February.
Movement levels in the Adelaide CBD have averaged more than 10% higher than
either Brisbane CBD, Perth CBD or Hobart CBD during the last two months. (Roy
Morgan) March
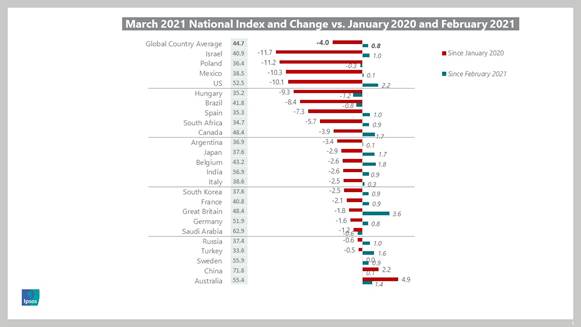
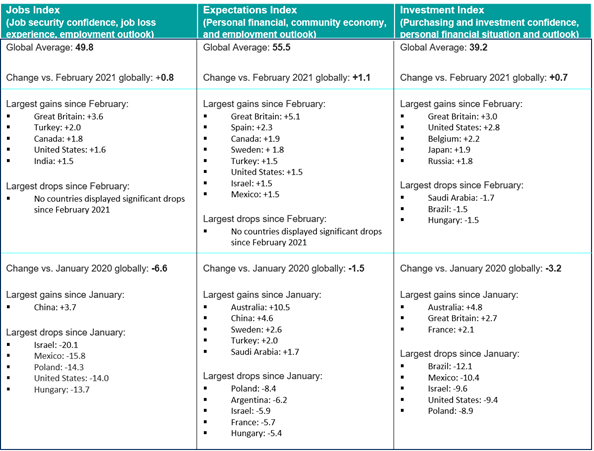
19 2021 MULTICOUNTRY STUDIES Global Consumer Confidence Getting Closer To Pre-Pandemic
Level Six of the 24 surveyed markets show
significant growth in their National Index when compared to February 2021:
Great Britain (+3.6), the United States (+2.2), Belgium (+1.8), Canada
(+1.7), Japan (+1.7), and Turkey (+1.6). Meanwhile, not a single market has experienced
a significant drop, defined as 1.5 index points or more. (Ipsos
Egypt) 17
March 2021 81% Of Spanish Mothers And Fathers Feel Judged By Others On
a global average, 82% parents interviewed in the countries where the study
was carried out, feel judged. A percentage very similar to that
of Spain, where 81% of parents feel questioned about their parenting
method . Positioning itself as the third country in Europe that
feels the most judged in this regard, only behind Poland (91%) and the United
Kingdom and Hungary (both with 83%). Germany, Holland and France, all of
them with the same percentage (77%), are the Europeans who feel less
questioned. (Ipsos
Spain) March
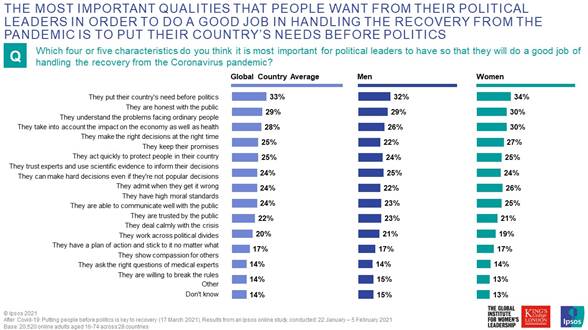
17, 2021 After Covid-19: Putting People Before Politics Is Key To
Recovery Mentioned
by a third of people (33%) and equally likely to be picked out by men and
women, the most important quality that people want from their political
leaders in order to be considered to do a good job in handling the recovery
from the pandemic is to put their country’s needs before politics. This is
followed by being honest with the public (29%), understanding the problems
facing ordinary people (28%), taking into account the impact on the economy
as well as on health (25%) and making the right decisions at the right time
(25%). (Ipsos
South Africa) 18
March 2021 The Pandemic Stalls Growth In The Global Middle Class,
Pushes Poverty Up Sharply Global
poverty had abated at an average rate of 49 million annually from 2011 to
2019, with the number of global poor falling from 1.10 billion to 691 million
during this period. The pandemic, by adding 131 million to the ranks of the
poor, has set the progress on poverty back by several years, and the poverty
rate is estimated to have increased from 9.0% in 2019 to 10.4% in 2020. (PEW) MARCH
18, 2021 ASIA
682-43-01/Poll Maruti
Suzuki Is The Healthiest Automotive Brand In India
Maruti Suzuki
tops YouGov’s 2021 Auto Rankings in India with an Index
score of 28.6. Despite this year’s global pandemic and consequent economic
downturns, the Indian auto manufacturer enjoys the best brand health among
consumers in India. The rankings were based on the Index
score from YouGov BrandIndex, which is a measure of overall
brand health calculated by taking the average of Impression, Quality, Value,
Satisfaction, Recommend and Reputation1.
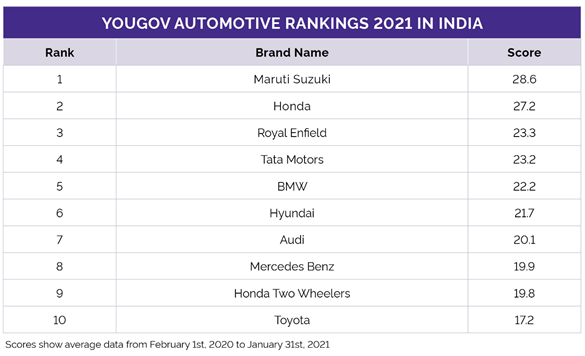
The 2021 rankings show urban Indians’
strong affinity towards Japanese auto brands. After Maruti Suzuki, Honda
takes the second place with a score of 27.2. Honda particularly seems to have had a
great year despite the pandemic. The brand created awareness about the
pandemic through its successful ad campaign “Until we drive again
#Stayathome” created entirely from home. Apart from this, the Japanese car
manufacturer took several steps to ensure the safety, well-being and
convenience of its customers and dealers across the country amidst a national
lockdown. Along with the parent brand, Honda 2
wheelers also makes an entry into the list at nine (with a score of 19.8). Hyundai and Toyota take the sixth (21.7)
and tenth (17.2) place, respectively. German luxury auto brands BMW, Audi and
Mercedes Benz take fifth, seventh and eighth place in the rankings, with a
score of 22.2, 20.2 and 19.9, respectively. Despite stiff competition from foreign
brands, two Indian brands make an appearance in the list: Royal Enfield at
third (score of +23.3) and Tata Motors at fourth (score of +23.2)
Commenting on the research, Deepa
Bhatia, General Manager at YouGov India said: “YouGov’s 2021 Auto Rankings reveals the healthiest
auto brands in the market. The Indian rankings show a dominance of Japanese
car brands or their subsidiaries, with five leading brands making up the top
10 list. Affinity towards German luxury cars is also strong among urban
Indians. In an overall tough year for carmakers, it
is good to see Indian brands Tata Motors and Royal Enfield strengthening
their place amidst global players and enjoying good brand health among Indian
consumers. (YouGov India) March 16, 2021 Source: https://in.yougov.com/en-hi/news/2021/03/16/maruti-suzuki-healthiest-automotive-brand-india/ 682-43-02/Poll Toyota Tops
YouGov Thailand’s 2021 Automotive Rankings
Toyota tops YouGov’s 2021 Automotive
Rankings for Thailand with an Index score of +42.8, making it the car
brand with the best overall brand health according to Thais. The rankings are compiled using
YouGov BrandIndex Index score, a measure of overall brand health
calculated by taking the average of Impression, Quality, Value, Satisfaction,
Recommend and Reputation scores. The rankings are measured from 1 February
2020 to 31 January 2021.
Toyota tops the charts in every metric except
for one, particularly when it comes to Value (measuring the brand that
consumers think is the most value-for-money) with a score of +45.5, making it
9.8 points ahead Honda (Cars), the brand with the next highest score in this
metric (+35.7). The one metric however that Toyota does not score top in is
for Satisfaction (which measures how satisfied consumers are with that
brand), narrowly beat out by Honda (Motorcycles) (+30.4). Japanese brands dominate the top ten, with
Honda (Cars) in second (+36.8), Honda (Motorcycles) in third (+32.0), Isuzu
in fifth (+24.9), Mazda in seventh (+18.9), Yamaha in eighth (+18.5), Nissan
in ninth (+17.9) and Mitsubishi in tenth (+15.8). German automotive manufacturers make up the
rest of the top ten. BMW comes in fourth (+25.5) and Mercedes-Benz in sixth
(+20.1). They both fare well in the Reputation metric (which measures the
corporate reputation of a brand by asking which brands consumers would be
proud of working for). BMW comes in third (+35.0) and Mercedes-Benz in fourth
(+29.3). (YouGov Thailand) March 16, 2021 Source: https://th.yougov.com/en-th/news/2021/03/16/toyota-tops-yougov-thailands-2021-automotive-ranki/ 682-43-03/Poll Honda Tops
YouGov Malaysia’s 2021 Automotive Rankings
Honda tops YouGov’s 2021 Automotive
Rankings for Malaysia with an Index score of +37.9, making it the car brand
with the best overall brand health according to Malaysians. The rankings are compiled using YouGov
BrandIndex Index score, a measure of overall brand health calculated by
taking the average of Impression, Quality, Value, Satisfaction, Recommend and
Reputation scores. The rankings are measured from 1 February 2020 to 31 January
2021. While Honda tops the list overall, there
are three metrics where it falls behind other brands. It is beaten out by
local car manufacturer Perodua (+44.0) by a big margin when it comes to Value
(measuring the brand consumer see as most value-for-money), and Toyota
(+35.5) by a small margin – Honda comes in third (+35.2). Perodua (+29.6)
also beats out Honda (+21.5) when it comes to Satisfaction (which measures
how satisfied consumers are with that brand). By scoring top marks in Value
and Satisfaction, and high scores in other metrics, Perodua comes in third
place overall (+33.6). Honda is also beaten out by Mercedes-Benz
when it comes to Reputation (which measures the corporate reputation of a
brand by asking which brands consumers would be proud of working for). The
German automotive brand holds a Reputation score of +39.3, followed by BMW
(+38.8) and then Honda (+38.1). The brand Malaysians would be least proud to
work for is Proton (+14.9). Japanese brands dominate the top ten.
Toyota comes in second (+36.1), Nissan in eighth (+14.4) and Mazda in tenth
(+12.9). German brands also fare well with Mercedes-Benz in fourth (+23.4),
BMW in fifth (+23.3). Malaysia’s national car brand Proton places
sixth (+18.4), and the list is rounded off with British brand Range Rover in
ninth (+13.2). (YouGov Malaysia) Source: https://my.yougov.com/en-my/news/2021/03/16/honda-tops-yougov-malaysias-2021-automotive-rankin/ MENA
682-43-04/Poll Toyota Tops
Yougov’s 2021 Automotive Rankings In Saudi Arabia
YouGov’s 2021 Automotive Rankings reveal
Toyota enjoys the best brand health among Saudi residents and tops the list
with an Index score of 36. Along with the parent brand, its luxury segment
subsidiary- Lexus also makes a presence in the list in third (with a score of
22.6). YouGov 2021 BrandIndex Automotive Ranking
is determined using Index score – which assesses overall brand health. The score
takes into account consumers’ perception of a brand’s overall quality, value,
impression, reputation, satisfaction and whether consumers would recommend
the brand to others.
The 2021 rankings show Saudi residents’
affinity towards Japanese auto brands as they occupy four spots in the
rankings. Along with Toyota and Lexus, Honda and Nissan are also present in
the list, at sixth (17.6) and eight place (13.8), respectively. German luxury car brands are not far behind
and are equally well represented, with Mercedes Benz and BMW landing at
second (with a score of 29.7) and fourth (22.5), respectively, and Audi at
ninth place (13.7). The launch of the BMW X series and Audi’s new E-commerce
platform last year (enabling customers to buy Audi cars online during the
pandemic) may have helped the luxury carmakers strengthen their position in
the market and secure a place in the 2021 rankings. Hyundai is ranked fifth (19.6), while
American car brands Ford and GMC, took the seventh (16.2) and tenth spot
(13.6), completing the list of KSA’s top ten auto brands in 2021. Commenting on the rankings, Scott
Booth of YouGov said, “Like many
other industries automakers also suffered the impact of the Coronavirus
lockdowns. However, things seem to have gradually improved as vaccination
efforts expand across the world. Our data shows that Saudi residents have a
strong affinity towards Japanese automakers with four of the leading brands
making the top 10 list this year. Not far behind are German luxury cars that
enjoy strong brand health among the population. The rankings show that
despite the impact of the pandemic on consumer purchasing patterns, the
strength of bellwether auto brands remains and they maintain strong brand
health in the country." (YouGov MENA) Source: https://mena.yougov.com/en/news/2021/03/16/toyota-tops-yougovs-2021-automotive-rankings-saudi/ 682-43-05/Poll Three-In-Four
Libyans Say The Economy Is In A Very Bad Or A Bad State
The following are among the key findings
from a nationally-representative public opinion survey conducted in Libya by
Arab Barometer in October 2020. The survey conducted 1008 phone interviews
with randomly-selected Libyan citizens aged 18 or older. This unique survey
captures the sentiments of Libyan citizens during the unprecedented times of
the COVID-19 pandemic. The survey has a margin of error of ± 3 percent. Key facts and figures EVALUATION OF CURRENT SITUATION
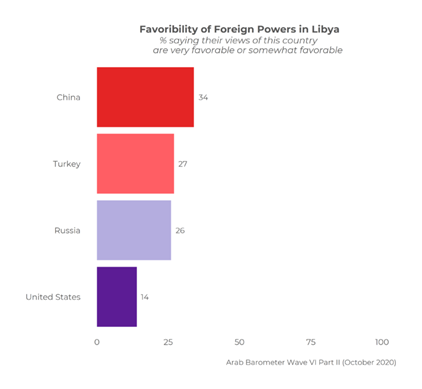
VIEWS ON DEMOCRACY
VIEWS ON FOREIGN POWERS
(Arabbarometer) March 16, 2021 Source: https://www.arabbarometer.org/2021/03/fact-sheet-libyas-pulse-during-the-covid-19-pandemic/ AFRICA
682-43-06/Poll Nine In 10
Nigerians (85%) Say They Are Concerned About Kidnappings
Abuja, Nigeria – March 2, 2021: Most
Nigerians are concerned about kidnappings and attempted kidnappings in their
state, the most recent Afrobarometer study shows. The apprehension is
widespread among all socio-demographic groups and highest in northern
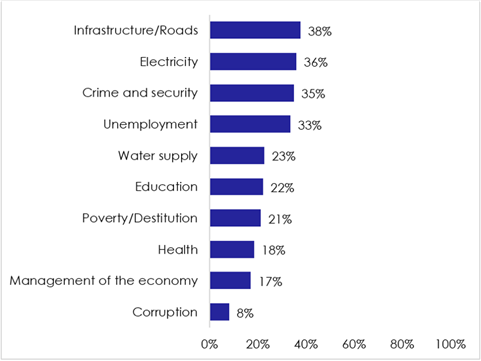
Nigeria. The study also shows that crime/security is
among the three most important problems that Nigerians want their government
to address. Kidnappings by extremists and criminal
gangs have plagued Nigeria in recent years, especially in the North. Hundreds
of schoolgirls in Zamfara State were kidnapped last Friday, and later
released, and about 26 people, including a chief imam, were kidnapped in
Niger State on Saturday – the same day that 42 students kidnapped in the same
state were ransomed. Key findings
Afrobarometer surveys Afrobarometer is a pan-African, nonpartisan
survey research network that provides reliable data on African experiences
and evaluations of democracy, governance, and quality of life. Seven rounds
of surveys were completed in up to 38 countries between 1999 and 2018. Round
8 surveys in 2019/2021 are planned in at least 35 countries. Afrobarometer
conducts face-to-face interviews in the language of the respondent’s choice
with nationally representative samples. The Afrobarometer team in Nigeria, led by
NOIPolls, interviewed 1,599 adult citizens of Nigeria in January-February
2020. A sample of this size yields country-level results with a margin of
error of +/-2.5 percentage points at a 95% confidence level. Previous surveys
were conducted in Nigeria in 1999, 2002, 2005, 2007, 2008, 2012, 2014, and
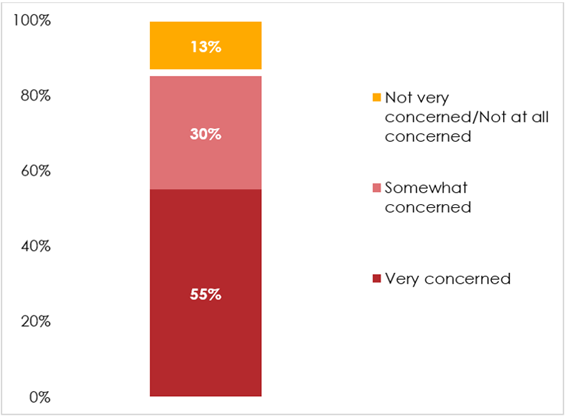
2017. Charts Figure 1: Concerns about kidnapping |
Nigeria | 2020
Respondents were asked: How concerned
are you about the problem of kidnappings and attempted kidnappings in your
state? Figure 2: Concerns about kidnapping | by
zone | Nigeria | 2020
Respondents were
asked: How
concerned are you about the problem of kidnappings and attempted kidnappings
in your state? (% who say “somewhat concerned” or “very concerned”) Figure 3: Top 10 most important problems |
Nigeria | 2020
(Afrobarometer) March 18, 2021 Source: https://noi-polls.com/kidnap-poll-afrobarometer-round-8-2020-survey-findings-in-nigeria/ WEST
EUROPE
682-43-07/Poll Six In Ten Do Not Want To Cut Spending On Public Services To Pay Off
Debt
The new Ipsos MORI Political Monitor finds that most Britons (54%)
believe that the Government has spent about the right amount on supporting
ordinary people during the pandemic so far (29% say they’ve spent too
little). However, when it comes to future spending the public are more split,
with 45% thinking the Government will spend too little on supporting ordinary
people during the recovery from the pandemic and 40% thinking they will spend
the right amount. This is largely spilt along party lines with two in three
Conservative supporters (66%) saying the Government will spend the right
amount (20% say too little) while 68% of Labour supporters believe it will
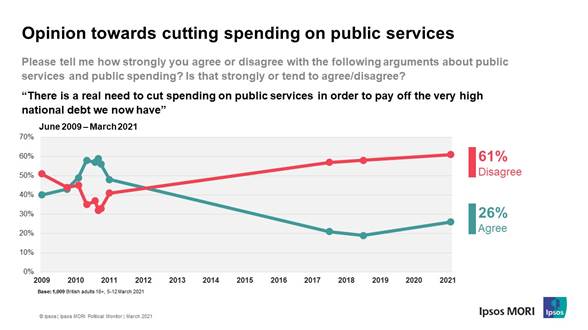
spend too little (24% say the right amount). When asked if there is a “real need to cut spending on public
services in order to pay off the very high national debt”, 26% agree but 61%
disagree – similar to the balance of opinion when last asked in August 2018
(when 19% agreed and 58% disagreed). However, this is very different to the
years after the financial crash in 2010, when most Britons believed there was
a need to cut spending to pay off the debt (for example, by 59% to 32% in
October 2010). Conservatives are more split on the matter, although are still
more likely to oppose spending cuts with 38% agreeing and 48% disagreeing,
while Labour supporters are more aligned with 12% agreeing and 75%
disagreeing. When it comes to the recent Budget half (52%) believe it is good
for the country (25% say bad) – similar to levels seen after the March 2020
budget (54% good vs 22% bad). The last Budget previous to this that achieved
similar ratings was in June 2010. Fewer however say that the Budget is good
for them personally (39% good vs 26% bad), slightly lower than in 2020 (45%
said good and 24% bad).
Other key findings from the budget include:
However, nearly four in five (78%) members of the public believe that
the pay rise of 1% for most NHS staff in England is too little. One in five
(20%) believe it is the right amount, and only 7% think it is too much. Even
Conservative supporters are at odds with the policy where 66% say that it is
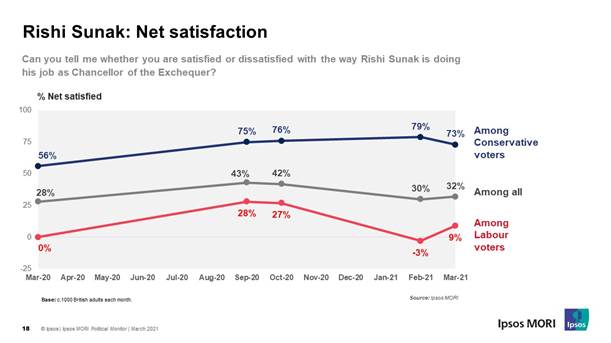
too little (32% say it’s the right amount), as do 91% of Labour supporters. Overall, though, Rishi Sunak remains popular amongst the public.
Three in five (59%) are satisfied with the way he is doing his job at Chancellor
(up 3 points from February) while 27% are dissatisfied. When asked whether
Rishi Sunak or Boris Johnson would make the most capable Prime Minister the
public are split – 42% say Sunak and 41% say Johnson. Conservatives however
are more likely to favour the PM (70% vs. 24% for Sunak) while Labour
supporters are more likely to favour Sunak (57% vs. 24% for Johnson). The
public are also split when it comes to asking if either Rishi Sunak or Keir
Starmer would make the most capable Prime Minister (39% say Sunak and 37% say
Starmer).
Gideon Skinner, Head of Political Research
at Ipsos MORI, said: It looks like the politics of public
spending post-Covid will be quite different to the reaction to the financial
crash. Although then there was agreement that cuts were needed, now Britons
don’t want to see further austerity. Broadly, the reaction to the recent
Budget and the Chancellor’s satisfaction levels suggest that the public
believes that Rishi Sunak is getting the balance right, although there is
some concern that the recovery won’t see enough support for ordinary people –
especially among those in their twenties and early thirties. (Ipsos MORI) 17 March 2021 Source: https://www.ipsos.com/ipsos-mori/en-uk/six-ten-do-not-want-cut-spending-public-services-pay-debt 682-43-08/Poll 43% Londoners Think Sadiq Khan Has Handled COVID Well
With the mayoral election fast approaching, how do Londoners think incumbent
candidate Sadiq Khan has handled the pandemic ahead of visiting the polls? Overall, Londoners are split over Khan’s handling of the pandemic:
43% think he has handled it well, while 39% think he has handled it badly.
Labour voters (60%) are the most likely to think Khan has handled the
pandemic well, including one in eight (12%) who think Khan has handled it
“very well”. However, around a quarter of Labour voters (26%) are not happy
with Khan’s performance and think he has handled the pandemic badly. While a similar number of Liberal Democrats (52%) think Khan is
handling the pandemic well, Conservatives are more likely to think that Khan
has handled the pandemic badly (68%) - including 41% of Tory voters who think
Khan has handled the issue of COVID-19 “very badly”. Khan’s rating among Londoners puts him slightly behind that of
the UK government among Britons,
YouGov’s latest research shows that 50% of all Britons think the government
is handling the pandemic well, versus 45% of the population who think they
are handling it badly. However, in the devolved nations, people are much more positive of
their own government’s handling. Some six in ten (60%) of Welsh people think
the Welsh government are
handling the crisis well while 33% think they are handling it badly. Scots
held similar feelings in January, when 60% said the Scottish government was
handling the pandemic well, compared to 36% who thought it was handling the
crisis badly. (YouGov UK) March 18, 2021 682-43-09/Poll Less Than Half Of Britons Expected To Tick ‘Christian’ In Uk Census
The “post-Christian era” in the UK will be cemented by data emerging
from Sunday’s census which
is expected to show further generational disengagement from organised
religion, according to a leading academic. The once-a-decade snapshot of the country has included a voluntary
question about religion since 2001. In 2011, returns across England and
Wales, Scotland, and Northern Ireland showed 59.3% ticking Christianity, a fall from 71.6% a
decade earlier. Abby Day, professor of race, faith and culture at Goldsmiths,
University of London, expects this year’s census to show a further erosion in
Christian identity, mainly because postwar generations regard the church as
irrelevant and immoral. Day predicted the proportion of people ticking Christianity “could
drop below 50%”. Peter Brierley, an expert on religion statistics, said he predicted
48% or 49% identifying as Christian, but David Voas, head of the social
sciences department at University College London, said he would be surprised
if the figure fell below 50%. According to Day, further decline was largely due to baby boomers –
people born between 1946 and 1964 – raising their children outside the
institutions of religion. “Religion tends to be transmitted within families. But many baby
boomers, who were largely brought up by people who went to church,
dramatically broke with that,” she told the
Observer. “Baby boomers have since raised a generation of millennials who don’t
go to church. And people who weren’t brought up as practising Christians
generally don’t become religious later in life. You don’t get many teenagers
walking into churches when they haven’t been before.” Based on recent interviews with about 50 baby boomers who were brought
up in Christian families, Day said many had rejected church in favour of
values considered to be more relevant, inclusive and humane. “Post-Christians are motivated by ethics concerning gender and sexual
equality, social justice, climate change and compassion. The churches failed
to deliver on those moral issues and so lost moral authority. “Today’s younger generations have a different sense of soul, meaning
and morality, and it’s one that rejects the church’s record of abuse, racism,
homophobia and sexism,” she said. Church
of England data shows that average Sunday
attendance in 2019 was 600,000 adults, or fewer than 1% of the population. A
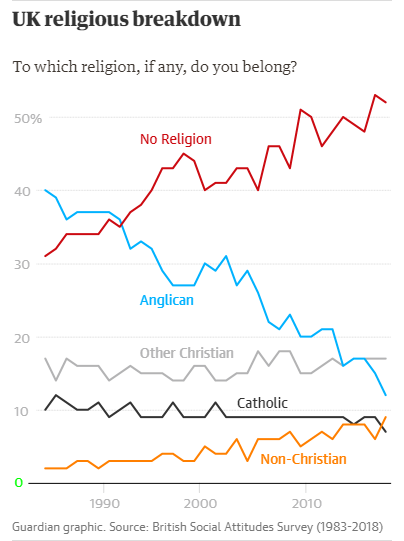
third of those attending church were aged 70 or over. Figures from the 2018 British Social Attitudes (BSA)
survey showed that 52% of the UK public said they did
not belong to any religion, 38% identified as Christian, and 9% identified
with other faiths.
But in the last census,
only 25% of the population said they had no religion. According to Voas, the
difference in wording between the census question in England and Wales and
the BSA question is “critical”. “The BSA question is, ‘Do you regard yourself as belonging to a religious
group?’ That notion of belonging pushes people to think, ‘Do I really belong,
am I a member of a church?’… as opposed to identification with a heritage,”
he told a Religion Media Centre event last
week. “The census question, ‘What is your religion?’, implies everyone
should have one… You end up with very different results.” A survey from YouGov on behalf of
Humanists UK, published this month, asked people the same
question as the census, but then asked those who identified as Christian the
reasons for their answer. Almost six in 10 (59%) said it was because they had been christened,
and 49% because they were brought up to think of themselves as Christian.
More than a quarter (26%) said it was “because this is a Christian country”.
Over half (51%) said they never attended a place of worship or did so less
than once a year. Only a third (34%) said they ticked Christian because they “believe
in the teachings of Christianity”. Andrew Copson, chief executive of Humanists UK, said: “Most people in
the UK say they are non-religious, a distinct minority have religious
beliefs, and very few attend places of worship.” Nevertheless, a majority of
people ticked a religion box in the last census because of their background
or upbringing. ‘A distinct minority have religious beliefs,’ says Andrew Copson of
Humanists UK. Photograph: coldsnowstorm/Getty Images/iStockphoto Humanists UK is urging people to tick the “no religion” box if they
don’t believe in or practice a religion. Day said there was a “dark side” to “cultural Christianity”. “The
populist right has pushed the idea that we are a Christian country to
reinforce its anti-immigration stance by fuelling rhetoric about Britain
losing its identity.” The proportion of the population identifying with non-Christian
faiths was likely to increase “quite substantially” in the 2021 census as a
result of immigration and higher birth rates in some minority communities,
said Brierley. The Office of National Statistics estimates it will take a year to
process data from the census. Northern Ireland was also holding a census on Sunday, but Scotland
has postponed its census until 2022 because of the Covid pandemic. (The Guardian) March 20, 2021 682-43-10/Poll 1 In 2 French People Think The Pandemic Has Exacerbated Ethnic
Discrimination
KEY FIGURES AND LESSONS FROM THE STUDY:
Access to housing, the sinews of war Has the crisis exacerbated discrimination based on ethnic
origins? The new Ipsos Global
Advisor study reveals that 65% of French respondents believe
that the criteria of origin really influence the possibilities of access to fundamentals , such as
housing, employment or education. Globally, the share rises to 60% of
those interviewed. On the issue of access to housing, 70% of respondents in France - 10 points more than the overall
average - think that the criteria of race, ethnicity or national origin play a role . Almost a quarter of French people (23%) say they have experienced it
themselves (compared to 35% globally). Note that on this point, France
appearing in the bottom four countries in the ranking, far behind India,
which comes first with 65%. Employment and education also impacted by
discrimination On the employment front ,
69% of French people believe that ethnic criteria can condition their access
(4 points more than the world average) and 24% of French people say they have
already had to suffer this discrimination in their professional
life. Note that more than half of French people (56%) said they had
never felt discriminated against at work because of their ethnic origins. Regarding education ,
63% of French people surveyed believe that race, ethnicity or country of
origin determine access to education, while 22% of French people say they
have had personal experience. Finally, if the health crisis has exacerbated certain social inequalities , making access
to social assistance essential or even vital in France, 6 out of 10 French people (57%)
consider that they have never felt
discrimination linked to their ethnic origins when they have wanted
to use it - a rate well above the
world average (33%). “The study reveals that more than 2/3 of
French people believe a priori that the criteria of origin really influence
the possibilities of access to the fundamentals: housing, employment, education…
It also shows that nearly a quarter of the respondents states that they have
experienced themselves situations in which they consider their origin to have
been an obstacle. What can be reassuring, despite this widely shared
feeling that origin is decisive in people's lives, is that France is one of
the three countries with Japan and Belgium where the gap between perception
and experience of the interviewees is the largest. » Emphasizes Yves Bardon, director of the Ipsos Flair
Program. The Coronavirus has widened the gaps On the face of discrimination ,
the pandemic has not improved things: 46% of
respondents worldwide believe that events in the world during the past year
have increased the are differences in
opportunities and to
access to housing, to education, to employment and / or social services in their
country. Conversely, 43% think
that the events had no impact on the differences and 12% who even believe that they
reduced them. In detail, 52% of
French people (2nd country after Spain at 63%) see in the events of 2020
f actors of aggravation of
discrimination , 40% do not find that they have had an impact
on them and 9% consider that these inequalities have lost ground . (Ipsos France) March 21, 2021 682-43-11/Poll Youtube Is The Most Popular Online Music Service Among Germans
Which online music services are currently
most popular around the world? As people spent more time at home in the past year, influenced by the
corona pandemic, streaming services for information and entertainment
purposes were booming. But not only video but also audio streaming was
the focus, in the latter case especially podcasts and music
streaming. In this context, 35 percent of Germans state that they
currently use the YouTube platform, regardless of whether they have free or
paid access. This is what respondents aged 18 to 44 say most often
(41-42 percent). The streaming portal Spotify only ranks second among
all German respondents with 21 percent, but it is more important for the 18
to 29 year olds: Half (50 percent) of that age group state that they
currently use Spotify. The International Media Consumption
Report 2021 looks, among other things, at the
frequency of media consumption and the services used by people worldwide and
how listening habits have changed. YOUTUBE ALSO LEADS IN THE US, SPOTIFY IN
THE UK A look at the data reveals that YouTube is also a world leader as a
music streaming platform, even if the portal is mainly known as a video
streaming platform. For example, in the United States, more than two in
five Americans (44 percent) say they use YouTube to listen to music, most
commonly between the ages of 18 and 34. Spotify is used by 27 percent of
Americans in the United States. In the UK, on the other
hand, Spotify is the most widely used music streaming platform of all Brits,
and especially those under the age of 55. This can be seen in Britons
aged 18-34, who listen to Spotify more than twice as often as any other music
streaming service, even YouTube. (YouGov Germany) March 19, 2021 Source: https://yougov.de/news/2021/03/19/youtube-ist-unter-deutschen-beliebtester-online-mu/ 682-43-12/Poll 71% Of 14 To 24-Year-Olds State That They Have Good Social Contacts
With Friends
It can be seen, for example, that younger people seem to suffer
particularly from contact restrictions. The proportion of 14 to
24-year-olds who state that they have good social contacts with friends has
decreased by ten percentage points to 71 percent during this period. In
terms of contacts with family members, the difference compared to the survey
from December 2019 is eight percentage points. Likewise, the proportion
of those who can “be there for others” to the desired extent falls in
Generation Z by eight percentage points to 52 percent. Generation Z feels increasing constraints Declining feeling of happiness and
increasing fear of the future A similar picture emerges when it comes to optimism about future
expectations. Despite being less secure in terms of economic factors
such as income or jobs, in the past younger people were far less afraid of
the future than the average population. However, Corona has fueled these
fears, so that the fear of the future in December 2020 among Generation Z is
roughly at the level of the other age groups. According to Hans-Peter Drews, NAWI-D project manager at Ipsos, this
uncertainty is influenced by many factors. “Can school or vocational
training or studies even be finished as planned? Are there any jobs to
finance a degree? Can an apprenticeship / study course be enriched with
valuable internships or stays abroad? Are companies currently even
taking on their trainees or are they hiring new employees? Since
expectations are important for future real developments, politicians should
attach particular importance to this target group in their measures and their
communication. " The young adults are definitely insecure. In December 2020, only
32 percent feel completely free of financial worries, compared to 41 percent
in December 2019. Futurologist Professor Horst Opaschowski
therefore warns of irreparable long-term effects:
(Ipsos Germany) 18 March 2021 682-43-13/Poll Finland's Strongest Car Brands
Each year, YouGov compiles a list of the
strongest car brands using six different imagers. When Finns evaluate car brands on six indicators (quality, general
image, value for money, willingness to recommend, reputation and
satisfaction), Toyota ranks number one.
Toyota is successful in many markets and ranks number one in the
rankings, in addition to Finland, including Australia, the United States,
Canada and Norway. Volvo grabs second place in the Finnish rankings and Mercedes-Benz
third place. In addition to Mercedes-Benz, several German brands will
rise to the TOP10 list. Volkswagen is fourth, Audi fifth and BMW sixth. Japanese brands can also be found on the list in addition to Toyota,
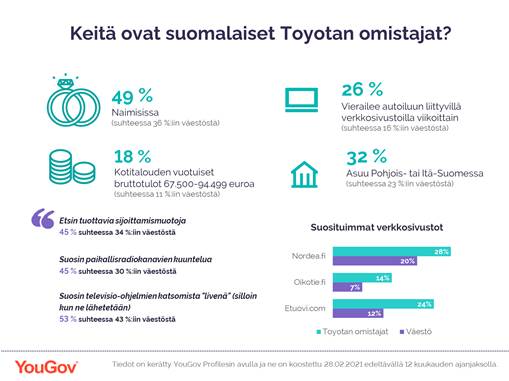
with Honda ranked nineth and Nissan ranked tenth. Who drives a Toyota?
People living in northern or eastern Finland are over-represented in
Toyota's owners in relation to the entire population. The gross
household income of Toyota owners is also higher than average and more of
them are married than average. Their interest in cars is higher than average and one in four of them
(26%) visits car websites at least weekly. About global listing YouGov has used a score index to compile the listing. The score
index consists of the average of 6 different image components: Quality,
General Image, Value for Money, Recommendation, Reputation and Customer
Satisfaction, which together give an overview of the overall condition of the
brand. In Finland, BrandIndex compares more than 350 different brands, 31 of
which are car brands. Every day, YouGov BrandIndex interviews hundreds
of people representing the entire population and asks them about their
attitudes towards different brands. (YouGov Finland) March 16, 2021 Source: https://yougov.fi/news/2021/03/16/automotive-rankings-2021-Finland/ 682-43-14/Poll Above 50% Vaccination Propensity In Hungary
According to the results of the research series, the proportion of
insecure people decreased in all age groups, but while there was a
significant shift towards vaccination among those over 40 years of age, the
relative proportion of those opposing vaccination among adults up to 39 years
of age increased. So despite the steep decline in the average age of
those who died as a result of the virus during the third wave,
anti-vaccination sentiment has intensified among those under 40 in the past
month. FIGURE: Would you vaccinate yourself with
the coronavirus vaccine currently available in Hungary? (on the basis of
the adult population, N = 1,000 people)
In absolute terms, two-thirds of the population who have received at
least one vaccination is over 60, and two-thirds are also women. Half of
those who oppose the vaccine are under the age of 40 (although they make up
38% of the adult population), yet vaccination can be measured at the same
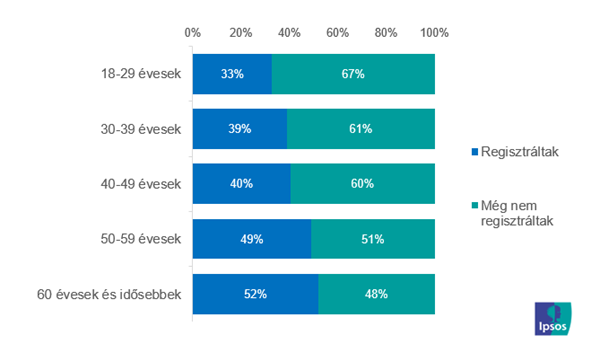
rate among both sexes. FIGURE: Proportion of those registered on
the official website (based on the vaccinated population, N = 505 people)
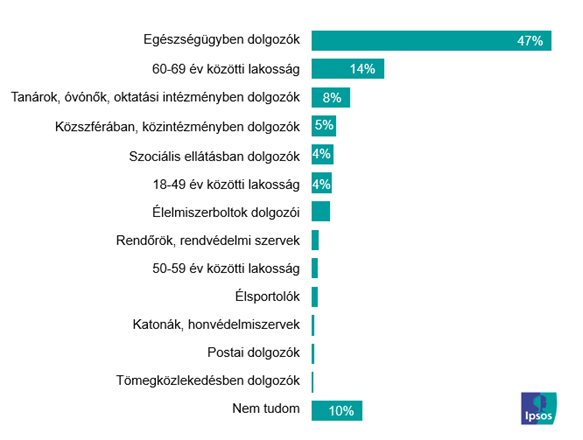
In the order of vaccinations set up by the population, health workers
are clearly in first place, with one in two compatriots (47%) believing that
in a fair system, others can only receive the vaccine after vaccinating those
who work on the front line among patients. In contrast to the United Kingdom ,
which starts mass vaccination against Covid-19 early and is at the
forefront of vaccination , in Hungary it is not teachers, kindergarten
teachers and other employees of educational institutions who are in the
second place, but those over 60 (14%). FIGURE: In your opinion, which social group
should be vaccinated with the coronavirus vaccine in the first
place? (on the basis of the adult population, N = 1,000 people)
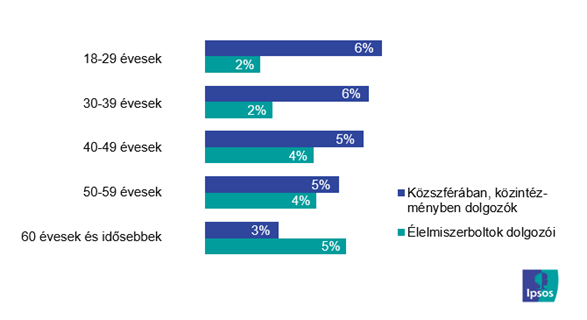
According to the
results of the research series in early March, young adults are susceptible
not only to those working in health care, but also to those working in
education and other public institutions, as well as to older age groups in
terms of vaccination order. - the leader of the now one-year research series, Annamária Földes,
summed up his experiences with the vaccination sequence expected by the
population. Primary vaccination among the 60-69 age group is initiated by the
youngest in the highest proportion (over 19%) and is equally susceptible to
those under 30 working in educational institutions, public institution staff
and social care workers. At the same time, people over the age of 60
would bring grocery store staff to the line much higher than average. FIGURE: In your opinion, which social group
should be vaccinated with the coronavirus vaccine in the first
place? (on the basis of the adult population, N = 1,000 people)
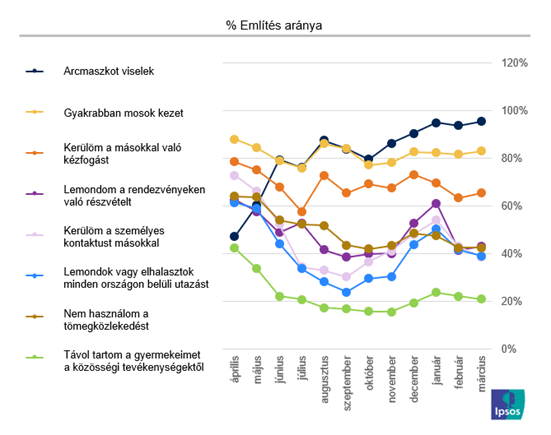
Examining the figures for the 12th month of personal protection
practice against Covid-19, another trend reversal can be observed. The
easing of discipline that characterized last month seems to be slowing down
and reversing as a result of the third coronavirus wave. Although Hungarian society has seemed to be
tired in recent months due to increasingly restrictive measures, the
resurgent numbers of cases have once again made the population already
preparing to open up uncertain. Ipsos has been monitoring the behavior
of the population in an epidemic situation in a way that is unique to the
market for 12 months now. FIGURE: Which of the following activities is
true for you? (on the basis of adult population, N = 1,000 persons /
month)
Wearing a mask Face-to-face protection was not mandatory in Hungary in the first
months of the pandemic. Nevertheless, the data
of April last year showed
a wear rate of 47%, which, after a gradual increase, reached about twice the
level of 90-95% in October. Regardless of the individual demographic
factors, such as age, place of residence, education, all segments of the
population are regularly wearing masks in Hungary. Hand washing Increased hand cleaning and disinfection, similar to the initial
phase of a pandemic, is still a more common defense practice for women, but
four out of five men make this small effort more often than
before. Unlike mask wearing, this phenomenon - thanks to information
campaigns - is immediately integrated into the daily routine and is expected
to remain with us in the long run, even after the epidemic. Personal contact, handshake Similar to the changed hand washing habits, there was an immediate
big change in the proportion of personal contacts when the pandemic broke out
a year ago. Looking back at the last 12 months, it can be stated that
not only in the first period, but also permanently, the older age group,
especially those over 60, closed in and reduced the number of contacts and
meetings related to their environment and family and friends. This
reaction of the population reached another local peak in January, but now it
is half as common to avoid contact as a year earlier. Closely related to the avoidance of meetings was the omission of
handshakes and alternative ways of greeting, even at the very beginning of
the epidemic period. The greatest indiscipline (similar to the frequency
of hand washing) was measured by Ipsos in mid-summer, July. Mainly due
to the middle and older age group, this form of protection currently
characterizes an average of two-thirds of the population. Public transport Avoiding the use of public transport has also proved unsustainable in
the long run. After the uncertainty and horror experienced in the first
months, the masses returned to this form of transport, partly voluntarily and
partly out of compulsion to work. Falling 22 percentage points in one
year, an average of 2 out of 5 residents can now afford to avoid public
transport. Higher rates can be measured among the elderly, as well as
among those with higher education and better earnings. The former is due
to lower mobility needs (pensioners), the latter due to a higher proportion
of car use (active workers but those traveling by car). Travel, events The number of domestic trips as well as event visits fell
again at the beginning of the year (also as a result of government measures
and central communications) following a temporary respite
in August-September . From January to
February , discipline eased significantly ,
a trend that seems to slow down and reverse with the onset of the third wave
of illness. The situation of foreign tourism has not improved
significantly for 12 months, based on which it can be stated that the market
is permanently, permanently reorganized following the pandemic. (Ipsos Hungary) March 16, 2021 Source: https://www.ipsos.com/hu-hu/50-felett-az-oltasi-hajlandosag-magyarorszagon NORTH
AMERICA
682-43-15/Poll 69 Americans Say It Is Very Important For Federal Law Enforcement
Agencies To Find And Prosecute The People Who Broke Into The U.S. Capitol On
Jan 6
As the FBI and other federal law enforcement agencies continue to pursue charges against
participants in the Jan. 6 riot at the U.S. Capitol, the American public
generally expresses strong support for continuing these efforts. Yet there
are sizable partisan differences in attitudes about the riot at the Capitol,
with Democrats far more likely than Republicans to view prosecution of the
rioters as very important and to say that penalties for the rioters are
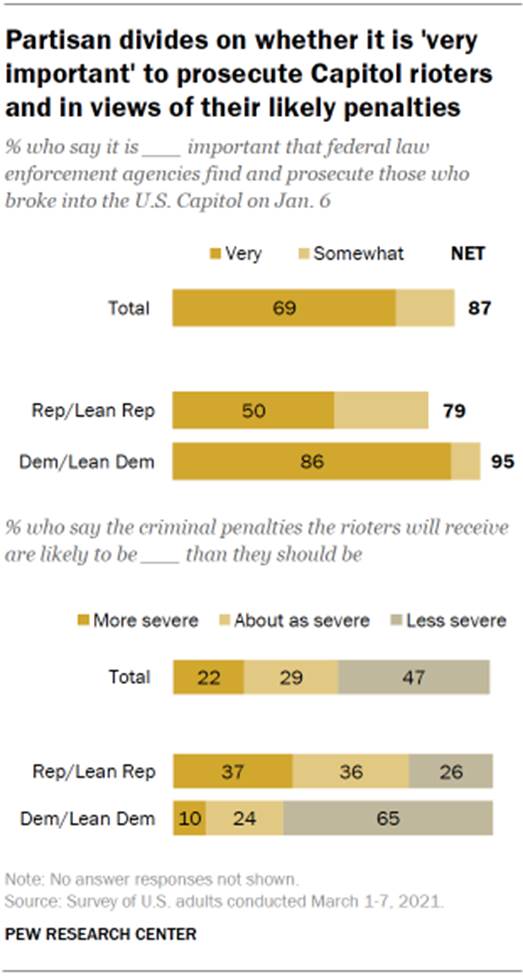
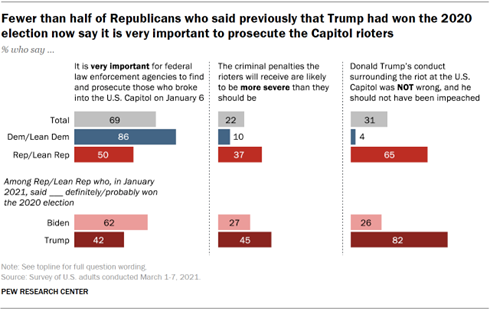
likely to be less severe than they should be. The survey by Pew Research Center, conducted March 1-7, 2021, among
12,055 U.S. adults who are members of the Center’s nationally
representative American Trends Panel,
finds a wide majority of Americans (69%) saying it is “very important” for
federal law enforcement agencies to find and prosecute the people who broke
into the U.S. Capitol on Jan. 6. Another 18% say doing this is “somewhat
important.” Just 12% say this is not too or not at all important. Nearly half of Americans (47%) say the criminal penalties that the
rioters will receive are likely to be less severe than they should be given
what happened, while 22% say the penalties will be more severe than they
should be. Only about three-in-ten (29%) expect the punishments will be about
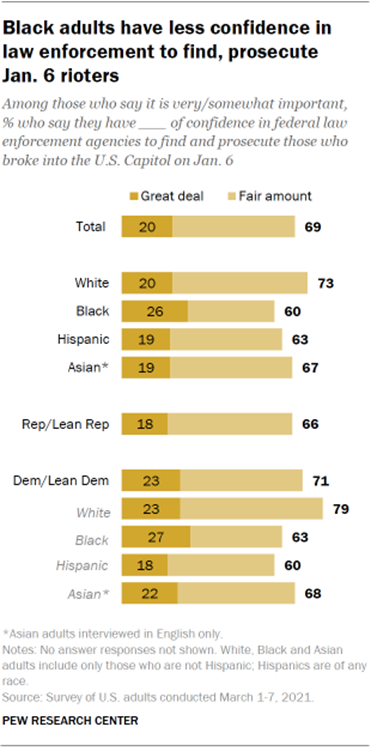
right. The public generally expresses confidence in federal law enforcement
agencies to find and prosecute those who broke into the Capitol on Jan. 6.
Still, of those who say it is important for these agencies to complete this
task, only 20% have a “great deal” of confidence that law enforcement will
bring the rioters to justice, while another 48% have a “fair amount” of
confidence. Republicans and Democrats differ sharply over how important it is for
law enforcement to prosecute those involved in the Jan. 6 riots and whether
criminal penalties will be less severe than deserved. Partisans are less
divided over whether federal law enforcement agencies are up to the task of
finding and prosecuting participants who scattered across the country after
the events that day.
While large majorities in both parties (95% of Democrats and 79% of
Republicans, including those who lean to each party) say it is at least
somewhat important that federal law enforcement agencies find and prosecute
those responsible for the Jan. 6 riot, Democrats are more intense in their
views: Fully 86% of Democrats and independents who lean toward the Democratic
Party say finding and prosecuting rioters is very important, compared with half of Republicans and
Republican leaners. Similarly, nearly two-thirds of Democrats (65%) say it is likely that
the criminal penalties the rioters receive will be less severe than they
should be. Republicans are divided: 37% say they are likely to be more severe
than they should be, while 26% expect them to be less severe. Additionally, Democrats express slightly higher confidence in federal
law enforcement to find and prosecute those responsible for what happened at
the U.S. Capitol in January. Among Democrats who said it was at least
somewhat important to find and prosecute those responsible for the Capitol
riots, about seven-in-ten Democrats (71%) say they have a great deal (23%) or
fair amount (48%) of confidence in federal law enforcement to do so, compared
with 66% of Republicans (18% a great deal and 49% a fair amount).
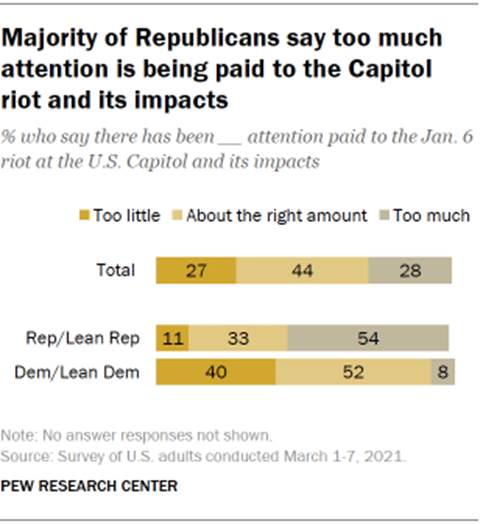
While a plurality of Americans (44%) say the Jan. 6 riot at the U.S.
Capitol and its impacts have been getting about the right amount of attention
overall, there also are significant differences in these views among
Republicans and Democrats. Many Republicans say the Jan. 6 riots and their aftermath have been
getting too much attention
(54% say this), which is not a widely shared view among Democrats (8% say too
much). By contrast, 40% of Democrats say the riot has been getting too little attention; just 11% of
Republicans say the same. About half of Democrats (52%) and a third of
Republicans say the riots have gotten about the right amount of attention.
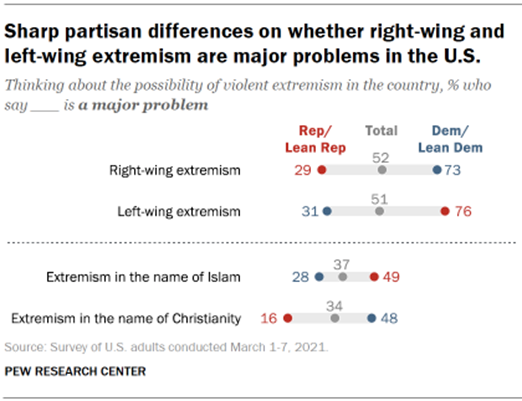
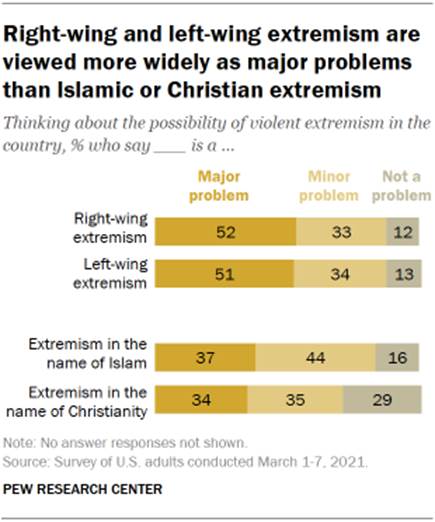
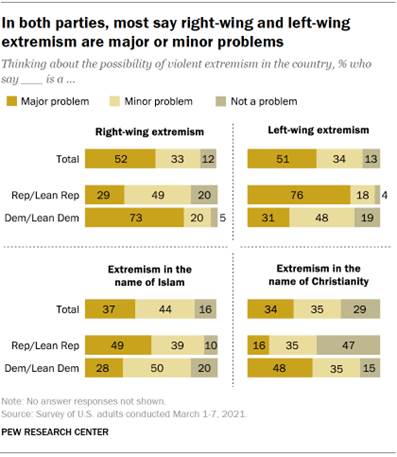
The survey finds that the public expresses more concern about
right-wing and left-wing extremism stirring possible violence in the country
than either Islamic or Christian extremism. About half of U.S. adults say
right-wing extremism (52%) and left-wing extremism (51%) are major problems
in the country. Fewer than four-in-ten say violent extremism in the name of
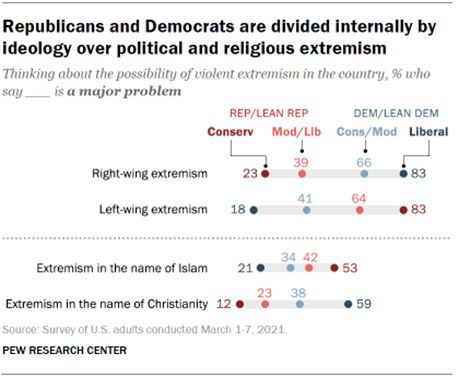
Islam (37%) or in the name of Christianity (34%) is a major problem. Republicans and Democrats are widely divided over which political
wing represents the greater threat. About three-quarters of Democrats and
Democratic-leaning independents (73%) say right-wing extremism is a major
problem, while a similar share of Republicans and Republican leaners (76%)
say the same about left-wing extremism. Only about three-in-ten Democrats
(31%) say left-wing extremism is a major problem, and 29% of Republicans say
this about right-wing extremism. In addition, Republicans (49%) are more likely than Democrats (28%)
to say extremism in the name of Islam is a major problem. The reverse is the
case for extremism in the name of Christianity: 48% of Democrats say it is a
major problem, versus 16% of Republicans. Reactions to aftermath of the Jan. 6
Capitol riot Amid continued investigations and congressional hearings into the
riots that occurred at the U.S. Capitol on Jan. 6, nearly three-in-ten adults
(27%) say there has been too little attention paid to the riots and their
impacts. A similar share (28%) says there has been too much attention paid to
the events at the Capitol, while a 44% plurality says the riots have received
about the right amount of attention.
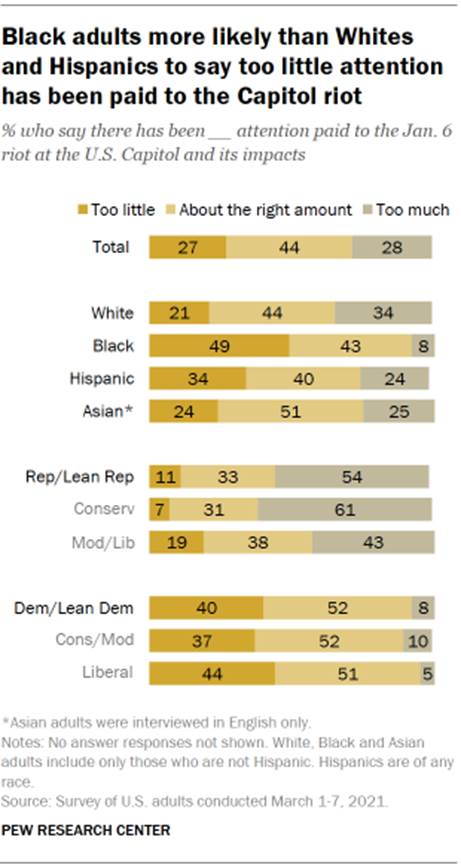
There are differences in these views by race, partisanship and
ideology. Among White adults, 44% say about the right amount of attention has
been given to the aftermath of the Capitol riots. Roughly a third (34%) say
too much focus has been given to the riots, while a smaller share (21%) says
too little attention has been paid. In contrast, Black adults are significantly more likely to say there
has been too little attention paid to the riots and its aftermath: 49% of
Black adults say there’s been too little, while just 8% say there has
been too much focus
on the riot. This racial divide in attitudes is also evident among Democrats and
Democratic-leaning adults. While a majority of White Democrats say there has
been the right amount of attention paid to the aftermath of the riots (58%),
a smaller share of Black Democrats says the same (43%). In fact, more Black
Democrats say there has been too little attention
given to the riots (50% of Black Democrats vs. 37% of White Democrats). A majority of Republicans and Republican leaners say there has
been too much attention
paid to the riot and its impacts (54%). Republicans, unlike Democrats, are divided
along ideological lines: 61% of conservative Republicans say the riot and its
aftermath have received too much attention, compared with 43% of moderate and
liberal Republicans. Pluralities of Democrats across the ideological spectrum say there
has been about the right amount of focus on the Capitol riots and its
impacts.
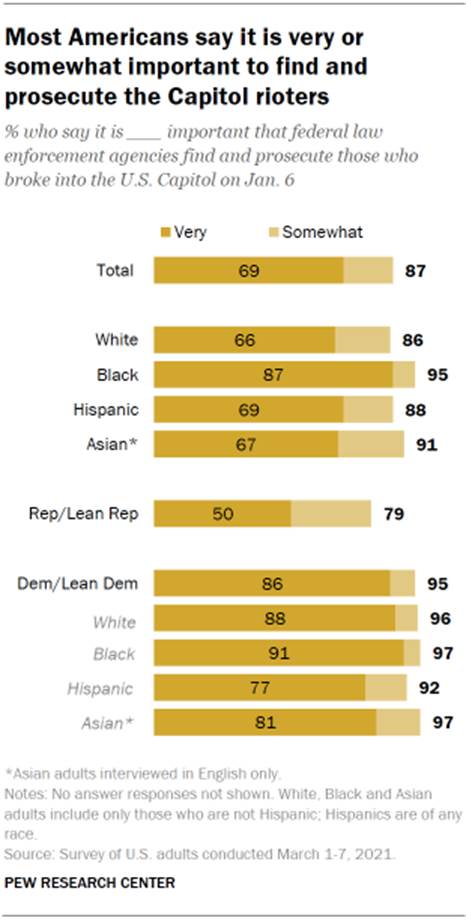
While there is broad consensus across demographic groups that it is
at least somewhat important for federal law enforcement to find and prosecute
those who broke into the U.S. Capitol on Jan. 6, there is some variation in
the degree to which these groups say it is a priority. And while majorities
say they have confidence in federal law enforcement agencies to locate and
prosecute those involved, relatively small shares express a great deal of confidence that
they can do this. Overall, about eight-in-ten or more adults across demographic groups
say it is at least somewhat important
for federal law enforcement agencies to seek out those responsible for the
Capitol breach (87% overall). There are racial, ethnic and partisan differences in these views.
Black adults are particularly likely to say it is very important for federal law
enforcement to penalize those involved (87%); smaller shares of White (66%),
Hispanic (69%) and Asian adults (67%) say the same. There also is a large gap between Republicans and Democrats on the
importance of finding and prosecuting those involved in the riots. Just 50%
of Republicans say it is very important to find and prosecute those
responsible. In contrast, 86% of Democrats say the same.
Among adults who say that finding and prosecuting those who broke
into the U.S. Capitol on Jan. 6 is at least somewhat important, 69% also
express at least a fair amount of confidence in federal law enforcement to find
and prosecute those responsible for the Capitol breach. Relatively small
shares of these adults express a great deal of confidence (20% overall). Among White adults who view prosecution as important, for example,
about seven-in-ten express confidence in federal law enforcement agencies to
identify and penalize those involved. But while Black adults are among the
most likely to say this is important, they are among the least likely to
express confidence in federal law enforcement to do this (60%). This pattern also holds true among Democrats and Democratic leaners
who say it is important to prosecute those who broke into the . Nearly
eight-in-ten White Democrats (79%) express confidence in federal law
enforcement to bring the Capitol rioters to justice, while just 63% of Black
Democrats say the same. Looking back at Trump’s impeachment and
acquittal About a month after former President Donald Trump was acquitted in
his second impeachment trial in the Senate, which focused on his conduct
leading up to the U.S. Capitol riot, just over half of Americans (52%) say
Trump’s conduct was wrong, and he should have
been convicted by the Senate. About three-in-ten say his conduct was not wrong, and he should not have
been impeached, while 15% say his conduct was wrong, but he should not have
been convicted by the Senate. Just as Republicans and Democrats were at odds over whether Trump
was responsible for the rioting at the Capitol in
early January, partisans view the results of the impeachment trial in very
different ways.
Nearly two-thirds of Republicans and GOP leaners (65%) say Trump’s
conduct was not wrong
and he should not have been impeached by the House of Representatives. Nearly
a quarter (23%) say his conduct was wrong, but senators should not have voted
to convict him. And only 11% of Republicans say that his conduct was wrong,
and he should have been convicted by the Senate. In stark contrast, an overwhelming majority of Democrats and
Democratic leaners (87%) say Trump’s conduct was wrong, and the Senate should
have voted to convict him. Just 9% say his conduct was wrong but he should
not have been convicted; another 4% say his conduct was not wrong. Though Republicans and Democrats express opposing views about several
aspects of the rioting that occurred at the U.S. Capitol on Jan. 6, there are
stark divisions among Republicans
on these issues. Republicans who in January expressed the view that Trump was
the rightful winner of the 2020 presidential election are much more likely
than those who say Biden won the 2020 election to view the riot as overblown
and Trump’s impeachment as unjustified.
In
January 2021, when asked which candidate won the
2020 presidential election, 64% of Republicans and Republican leaners said
that Trump definitely (33%) or probably (31%) received the most votes cast by
eligible voters in enough states to win the presidential election. Only about
a third (34%) said correctly that Biden was the rightful winner. Republicans who said Trump definitely or probably won the election
earlier this year are nearly twice as likely as Republicans who said Biden
definitely or probably won to now say the riots at the Capitol have
received too much attention
(66% of Republicans who say Trump won vs. 35% of Republicans who say Biden
won). Similarly, while 62% of Republicans who said Biden won now say that it
is very important
that federal law enforcement agencies find and prosecute those who broke into
the U.S. Capitol on Jan. 6, fewer than half of Republicans who said Trump won
now say prosecution is very important. This pattern is also evident in views of the punishments that rioters
are likely to receive. Republicans who said Biden won in the prior survey are
now significantly less likely than Republicans who said Trump won to think
the criminal penalties that rioters will receive are likely to be more severe
than they should be (27% vs. 45%, respectively). One of the largest gaps that divides Republicans who said Trump won
and Republicans who said Biden won is on views of Trump’s impeachment as a
result of his conduct leading up to events on Jan. 6: Fully 82% of
Republicans who said Trump won the election say his conduct was not wrong, and that the House
should not have voted to impeach him. This compares with just 26% of
Republicans who said Biden won the 2020 election. Views of violent extremism When it comes to the possibility of violent extremism in the country,
Americans are more likely to say political extremism represents a greater
problem than other forms of extremism inspired by religion.
About half of the public says right-wing extremism is a major problem
(52%), another third say it is a minor problem and 12% say it is not a
problem. The public’s overall views of left-wing extremism are similar: 51%
say it is a major problem, 34% say minor problem and 13% say not a problem. The shares saying extremism inspired by Islam or Christianity are
major problems are far lower. Slightly fewer than four-in-ten adults (37%)
say extremism inspired by Islam is a major problem, while 44% say it is a
minor problem and 16% say it is not a problem. About a third of Americans
(34%) say extremism in the name of Christianity is a major problem, with 35%
saying it is a minor problem and 29% say it is not a problem. While far more Republicans view left-wing extremism as a major
problem than right-wing extremism – and the opposite is true among Democrats
– large majorities in both parties say right-wing and left-wing extremism
are major or minor problems.
Among Republicans and Republican-leaning independents, only about
three-in-ten (29%) say violent right-wing extremism is a major problem for
the country, but about half (49%) say it is a minor problem. Just two-in-ten
say it is not a problem. Views among Democrats and Democratic leaners of left-wing extremism
follow a similar pattern: About three-in-ten (31%) say left-wing extremist
violence is a major problem, about half say it is a minor problem (48%) and
just 19% say it is not a problem. Both Republicans and Democrats broadly acknowledge that violent
extremism inspired by Islam is at least a minor problem in the country (88%
of Republicans and 78% of Democrats say this). However, Republicans are more
likely than Democrats to view Islamic extremism as a major problem (49% of
Republicans vs. 28% of Democrats). They also differ on whether extremism inspired by Christianity is a
problem for the country: 83% of Democrats say Christian extremism is at least
a minor problem (including 48% saying it is a major problem), yet only about
half of Republicans (51%) say it is at least a minor problem (with just 16%
saying major problem). Nearly half of Republicans (47%) say extremism in the
name of Christianity is not a problem in the country today.
In both parties, there are ideological differences in attitudes about
the threat posed by violent extremism. For example, a larger share of liberal
Democrats (83%) than conservative and moderate Democrats (66%) say right-wing
extremism is a major problem. By contrast, conservative Republicans are more
likely than moderate and liberal Republicans to say that left-wing extremism is
a major problem. Moderates and liberals in the GOP also are more likely than
conservative Republicans to see right-wing extremism (39% to 23%) as a major
problem. And conservative and moderate Democrats similarly diverge from
liberals in their party in views of left-wing extremism (41% of conservative
and moderate Democrats say major problem vs. 18% of liberals). There are similar patterns across ideological groups in their views
of religious extremism – though the differences are generally smaller. Fewer
moderate and liberal Republicans than conservative Republicans say extremism
in the name of Islam is a major problem (42% vs. 53%) and more say extremism
inspired by Christianity is a major problem (23% vs. 12%). The patterns are
similar but reversed among Democrats: Fewer conservative and moderate
Democrats than liberal Democrats say Christian extremists are a major problem
(38% vs. 59%), but more moderate and liberal Democrats say Islamic extremists
are a major problem (34% vs. 21%). Knowledge of QAnon and views of its
supporters A majority of Americans (61%) report knowing at least something
about the QAnon conspiracy theories,
while about four-in-ten (39%) say they know “nothing at all” about them. Few
U.S. adults say they know “a lot” (3%), while 29% say they know “some” and
the same share say they know “not much.”
Democrats and independents who lean toward the Democratic Party (68%)
are more likely than Republicans and Republican leaners (54%) to say they
know something about the QAnon conspiracy theories. Nearly half of
Republicans (45%) say they know nothing at all about them; about three-in-ten
Democrats (31%) say the same. Liberal Democrats report the highest levels of knowledge about QAnon.
Half of liberal Democrats know a lot (7%) or some (44%) about it, and another
28% say they know not much. The next most knowledgeable groups are
conservative and moderate Democrats (61% know something, including 32% who
know some or a lot) and conservative Republicans (60% know something,
including 25% some or a lot). The least knowledgeable partisans are
Republicans with moderate or liberal political views – among this group, a
majority say they know nothing at all about these conspiracy theories (54%)
and fewer than a quarter know a lot or some (22%).
Few Americans who know at least something about QAnon have favorable
views of people who support the conspiracy theories. Just 13% of those who
know about QAnon have favorable views of its supporters, while 84% have
unfavorable views (including 60% whose views are very unfavorable). Those who say their views of QAnon supporters are favorable are
concentrated among Republicans and Republican-leaning independents. About a
quarter of Republicans who know about QAnon say they view its supporters
favorably (24%) – though just 5% say their views are very favorable, compared
with 19% who say somewhat favorable. Fewer than one-in-ten Democrats and
Democratic leaners (6%) have favorable views of QAnon supporters. Most Republicans and Democrats say they view people who support these
conspiracy theories unfavorably, though Democrats are harsher in their
judgments. Fully 82% of Democrats who know about QAnon say they have very
unfavorable views of supporters, versus 28% Republicans who share this view.
About four-in-ten Republicans who know about QAnon (42%) have somewhat
unfavorable views of QAnon supporters; 12% of Democrats say the same. (PEW) MARCH 18, 2021 AUSTRALIA
682-43-16/Poll Toyota Tops YouGov Australia’s 2021 Automotive Rankings
Toyota tops YouGov’s 2021 Automotive Rankings for Australia with an
Index score of +43.9, making it the car brand with the best overall brand
health according to Australians. The rankings are compiled using YouGov BrandIndex Index score, a
measure of overall brand health calculated by taking the average of
Impression, Quality, Value, Satisfaction, Recommend and Reputation scores.
The rankings are measured from 1 February 2020 to 31 January 2021.
Toyota tops the charts in every metric, particularly for Value (which
measures which brand consumers see to be of most value-for-money), with a
score of +44.8 – with the next closest brand being Mazda with a
score of +28.1. Toyota also smokes the rest of the competition when it
comes to their Recommend score (+46.0), followed by Mazda
trailing 17.6 points with a score of (+28.4). Half of the top ten brands are Japanese, and they make up the top
three the list. In second place is Mazda (+27.5), which also comes in second
for not only for Value and Recommend but also for General Impression (+35.4),
Satisfaction (+14.4). Honda rounds up the top three (+23.7). German brands Mercedes-Benz (+23.0) and BMW (+22.5) take fourth and
fifth respectively. While Mercedes-Benz comes is fourth place overall, it
takes second for Quality (+42.1) and Reputation (+36.8) (which measures the
corporate reputation of a brand by asking which brands consumers would be
proud of working for). BMW follows Mercedes-Benz, coming in third overall for
Reputation (+35.2) and Quality (+40.9). In sixth place is the only South Korean brand to make the list is
Hyundai (+19.7), followed by German brand Audi in seventh (+17.2). Japanese brands Nissan (+17.2) is in eighth and Subaru (+16.6) in
ninth. The list is wrapped up with American brand Ford in tenth (+16.3).
While Ford comes in tenth, it stands out with its Satisfaction score – coming
in third (+12.2) on that metric, indicating that Ford customers are more
likely to be satisfied with their vehicles. (YouGov Australia) March 16, 2021 Source: https://au.yougov.com/news/2021/03/16/toyota-tops-yougov-australias-2021-automotive-rank/ 682-43-17/Poll 73.7% Of Australians Holding Private Health Insurance Are Satisfied
The report is based on interviews with almost 25,000 policy-holders,
and tracks rolling monthly averages up to December 2020. It shows that
satisfaction across the funds as a whole was up by 0.5% from the previous
month, November 2020, and up by 1.8% on a year earlier, December 2019. Many
health funds offered assistance including payment pauses or reduced premiums
during 2020 to members under financial stress as a result of the COVID-19
pandemic. However a number of funds also increased their premiums. The best-performing private health insurers had customer satisfaction
levels well above the overall industry average. In top position was Health
Partners on 91.6%. It was followed by Defence Health (on 88.6%), CUA Health
(87.0%), Latrobe Health Services (86.9%) and Westfund (86.5%). Of these five,
CUA Health is the only for-profit fund (its parent company, CUA bank, is a
mutual organisation). Australia’s largest fund by market share, Medibank Private, had a
satisfaction rating of 69.8%, one of the lowest of the more than two dozen
funds measured. BUPA, which is a close second in terms of market share, had a
slightly higher score of 71.5%. Each of those funds has more than twice as
many members as the next largest fund, HCF, which had a customer satisfaction
rating of 75%. With many health insurance members facing
another premium rise in April 2021, Roy Morgan CEO Michele Levine says
customer satisfaction is a crucial measure for health funds because of its
close link to member retention, as the percentage of Australians with private
health cover continues to shrink. “As of December 2020, 43.9% of Australians
hold at least some private health insurance, in the form of basic hospital
cover. This is only a marginal fall from the 44% who had it a year earlier,
but it’s a continuation of the steady decline seen over the past seven years,
from the 47% who held it in December 2013. “Looking at the latest retention rate data
from the Commonwealth Ombudsman (2019-2020 financial year), the link between
customer satisfaction and customer retention is crystal clear. Health
Partners, the top performer in our ‘Customer Satisfaction: Private Health
Insurance’ report, has with a satisfaction rating of 91.6%. Its member
retention rate is 90%. This compares to Medibank Private, with a satisfaction
rating of 69.8% and a retention rate of 75%. “The days when a dissatisfied customer
would stay with a health fund because it was too much trouble to change are
long gone. Unhappy customers vote with their feet … and their hard-earned
dollars. It’s true you can’t please all the people all the time and this is
an issue the largest funds grapple with, as their ratings demonstrate. “Health funds get feedback on how their own
customers feel about them, but feelings about their competitors are at least
as important, which is one of the key reasons our independent reporting is so
useful right across the industry.” Private Health Insurance Customer
Satisfaction – Top 5
March 17 2021 Source: https://www.roymorgan.com/findings/8663-phi-satisfaction-december-2020-202103150535 682-43-18/Poll Movement Of People In Melbourne Cbd Is At 39% Of Normal One Year
After The First Covid Lockdown
Movement in the Melbourne CBD during mid-March 2021 was at an average
of only 39% of the pre-COVID-19 levels of movement during January and
February 2020. The good news is that this level of movement on working days
since the Labour Day holiday (Monday March 8, 2021) is the highest in the
Melbourne CBD since mid-June 2020 just before Melbourne entered its second
lockdown. Movement levels in the Sydney CBD have tracked lower than smaller
cities over the last year as the city has dealt with a series of outbreaks –
although without a second city-wide lockdown – and were at 47% in mid-March.
This is the highest level of movement for the Sydney CBD since mid-December
2020 when movement levels touched a high of 50% just before outbreaks of
COVID-19 in Berala in Western Sydney and Avalon in Sydney’s Northern Beaches. The Adelaide CBD has been the standout performer over the last two
months with movement levels in mid-March now at 83% of the pre-COVID-19
levels and above 70% since the start of February. Movement levels in the
Adelaide CBD have averaged more than 10% higher than either Brisbane CBD,
Perth CBD or Hobart CBD during the last two months. Australian Capital City CBDs average 7-day
movement levels March 2020 – March 2021:
Roy Morgan has partnered with leading technology innovator UberMedia
to aggregate data from tens of thousands of mobile devices to assess the
movements of Australians as we deal with the restrictions imposed in response
to the COVID-19 pandemic. The
interactive dashboard available tracks the
movement data for those visiting the Capital City CBDs during 2020, excluding
the CBD residents of each city. Movement data from several key locations
around Australia is also available to view by using the interactive
dashboard. Michele Levine, CEO of Roy Morgan, says a
year after the COVID-19 pandemic began and led to an Australian nation-wide
lockdown in March/April 2020 movement in Australian Capital City CBDs is
still well down on pre-pandemic levels: “A year into the COVID-19 pandemic there
are positive signs that Australians are returning to a sense of normality
however the daily movement of people in Australia’s Capital City CBDs remains
down on average levels prior to the pandemic. “The requirement to work from home, which
is still in operation in many parts of Australia, had the biggest impact on
CBD office workers and led to huge declines in the number of people commuting
to work in the CBDs over the past year. “Hardest hit has been the Melbourne CBD
which has been through three lockdowns totaling over six months duration
since mid-March 2020. The long second lockdown between July-October 2020 hit
the city particularly hard and even today movement in the Melbourne CBD is
only at 39% of pre-COVID-19 levels – easily the lowest of any of the Capital
City CBDs. “Also struggling to regain the its
pre-pandemic levels of movement is the Sydney CBD which sits at 47% in
mid-March, and still below the levels of mid-December prior to the Avalon
outbreak on Sydney’s Northern Beaches which sent movement plunging over the Christmas/New
Year period. “Other cities have fared better despite
short and sharp lockdowns in Adelaide, Perth and Brisbane over the last few
months these cities are closest to pre-pandemic levels of movement with the
Adelaide CBD on 83% leading the Perth CBD (72%) and Brisbane CBD (68%). “The emphasis of a ‘return-to-normal’ is
particularly important as Australian businesses confront the end of the
JobKeeper wage subsidy at the end of this month. Comparing movement levels in
the Melbourne CBD (39% of pre-COVID-19 averages) to locations in suburban
areas of Melbourne such as Williamstown (71%), Glen Waverley (72%) and
Cheltenham (61%) also shows how CBD areas have been hit the hardest with the
lockdowns and restrictions. “The severity of the downturn impacting the
Melbourne CBD and Sydney CBD because of Federal Government and State
Government policies (including the ban on international travel), provides a
good argument for local authorities to take to higher levels of Government to
request targeted support beyond the aviation, travel and tourism sectors as
presently outlined.” (Roy Morgan) March 19 2021 MULTICOUNTRY
STUDIES
682-43-19/Poll Global Consumer Confidence Getting Closer To Pre-Pandemic Level
Washington, DC, March 17, 2021 -
At 44.7, this month’s Ipsos Global Consumer Confidence Index is up by
eight-tenths of a point over last month, marking a new high since the start
of the COVID-19 pandemic a year ago. National Index Trends Roughly one year after the World Health Organization declared
COVID-19 a pandemic on March 11, 2020, the Global Consumer Confidence Index
comes in at 44.7, about four points below where it was then (48.5) as well as
a couple of months earlier, in January 2020 (48.7), just before the world had
heard of the coronavirus. With a 0.8-point uptick over February 2021’s
reading, the index shows a monthly increase for the fourth straight month.
Expectations, Jobs, and Investment Index
Trends The Expectations, Jobs, and Investment Indices all display growth
since February 2021. Among the 24 markets surveyed, Great Britain and the
United States post significant gains for each index.
About the Study These findings are based on data from Refinitiv /Ipsos’ Primary
Consumer Sentiment Index (PCSI) collected in a monthly survey of consumers
from 24 markets via Ipsos’ Global Advisor online survey platform. For this
survey, Ipsos interviews a total of 17,500+ adults aged 18-74 in the United
States of America, Canada, Israel, Turkey, South Africa; and age 16-74 in all
other markets each month. The monthly sample consists of 1,000+ individuals
in each of Australia, Brazil, Canada, China (mainland), France, Germany,
Italy, Japan, Spain, Great Britain, and the U.S., and 500+ individuals in
each of Argentina, Belgium, Hungary, India, Israel, Mexico, Poland, Russia,
Saudi Arabia, South Africa, South Korea, Sweden, and Turkey. (Ipsos Egypt) 17 March 2021 Source: https://www.ipsos.com/en-eg/global-consumer-confidence-getting-closer-pre-pandemic-level 682-43-20/Poll 81% Of Spanish Mothers And Fathers Feel Judged By Others
The impact of the coronavirus has caused the number of monthly births
in Spain to plummet to the lowest levels since 1941 according to the National
Institute of Statistics (INE). However, being a mother or father has
never been an easy task, and it can get even more complicated if they feel
judged. Feeling judged on how they
develop parenthood can affect parents' mental health, which has been shown to
harm children's development in turn. Aware of this problem, Ipsos has carried out a study in 28 countries
to analyze public opinion on this issue and also to know the importance that
parents attach to the earliest stages in the development of their
children. On a global average, 82% parents interviewed in the countries where
the study was carried out, feel judged. A percentage very similar to
that of Spain, where 81% of parents
feel questioned about their parenting method . Positioning
itself as the third country in Europe that feels the most judged in this
regard, only behind Poland (91%) and the United Kingdom and Hungary (both
with 83%). Germany, Holland and France, all of them with the same
percentage (77%), are the Europeans who feel less questioned. Parents who feel judged indicate the way in which their children behave as the main reason why they are
questioned , with a global average of 46%; and the way
in which they manage their children's behavior is ranked as the second cause
(39%). It should be noted that Spanish parents are the ones who feel
least judged for this reason compared to the rest of the countries. This perception that parents have of being judged may be something
that is only part of their perception, which is not real, but when we ask people who do not have children, whether
they really question the parents' way of raising, the data they maintain a
similar proportion globally, 81% affirm that they do . Therefore,
the perception of the parents is a reality. In Spain, this percentage represents 76%,
which places Spain among the European countries where parents are least
judged , only behind the Netherlands (74%) and
Germany (63%). For their part, the United Kingdom (87%), Hungary (86%)
and Sweden (85%) top the list of European countries where parents are judged
the most. Furthermore, the reasons that lead to questioning parents coincide
with those that they themselves indicate and that we have mentioned above,
although in the reverse order: the way in which parents manage their
children's behavior (59%) is the most judged motive, followed by the way
children behave (57%). Globally, the United States is the country where
both factors have the highest incidence (76% and 73% respectively. The importance of the first years in the
development of children There is scientific consensus that the period from conception to five
years of life is critical to laying the foundation for future physical and
mental health, as well as overall well-being and productivity of a
person. However, this study shows that this fact is not recognized in
the 28 countries surveyed. The first
years are not considered especially important compared to other periods of
life, in fact only 18% of citizens, on a global average, consider this stage
as the most important . If we look at the data for
Spain, we see how it is the second country at a global level and the first at
a European level, which gives less relevance to this period, with only 8% of
the population supporting it. In contrast, the most
consensual answer at the global level is that all stages of life are equally
important (35%). Spain tops the list of European countries ,
only behind Sweden (45%), where this idea is most supported (38%), sharing
the same percentage with the Netherlands and Hungary. It is followed by
the United Kingdom (37%), Italy (37%) and Poland (36%). At a global level there is an overwhelming consensus that the
development of children in their first stage of life (up to 5 years) is not
determined so much by genetics as by the environment in which they
live. 45% of Spaniards reflect this, a percentage that at a European
level only surpasses Italy (53%) and Poland (48%). Finally, when it comes to who is responsible for ensuring that
children in their early years can enjoy a good quality of life in terms of
health and happiness, there is no consensus among the countries
surveyed. At a global level,
responsibility falls on both parents and society (41%), followed by parental
responsibility (40%) and, to a lesser extent, society (13%). At
the country level we can see how there are two differentiated blocks, those
where a greater responsibility falls on parents, although the weight of
society is also relevant. In this first block we find countries such as
Poland, the USA, Australia, the United Kingdom, Sweden, and Canada. At
the other extreme, where responsibility is more shared between parents and
society, we find eastern countries (South Korea, Japan, China) but also
European countries such as Italy, Hungary, Belgium, Germany and
Spain. In fact, Spain leads
together with Sweden (16%), the list of countries where more weight falls on
the figure of society as responsible for ensuring a good quality of life for
children in their early years. (Ipsos Spain) March 17, 2021 Source: https://www.ipsos.com/es-es/un-81-de-las-madres-y-padres-espanoles-se-sienten-juzgados-por-los-demas 682-43-21/Poll After Covid-19: Putting People Before Politics Is Key To Recovery
This is the most important result from an online Ipsos Global Advisor
study conducted from 22 January 2021 to 5 February 2021. A total of 20,520
adults in 28 countries were asked about what they expect from political
leaders. In another part of this study, results show that citizens all over
the world think that politicians are paid too much for what they do, so what
do they then expect from politicians? Mentioned by a third of people (33%) and equally likely to be picked
out by men and women, the most important quality that people want from their
political leaders in order to be considered to do a good job in handling the
recovery from the pandemic is to put their country’s needs before politics. This is followed by being honest with the public (29%), understanding
the problems facing ordinary people (28%), taking into account the impact on
the economy as well as on health (25%) and making the right decisions at the
right time (25%). Women are slightly more likely to pick out the following over men:
Looking at the results from all 28 countries, South Africans felt the
strongest of all about wanting their politicians to regard the country’s
needs as a priority above politics. This sentiment was shared by more than
half (51%) of online South Africans.
Technical Detail:
(Ipsos South Africa) 18 March 2021 Source: https://www.ipsos.com/en-za/after-covid-19-putting-people-politics-key-recovery 682-43-22/Poll The Pandemic Stalls Growth In The Global Middle Class, Pushes Poverty
Up Sharply
The COVID-19 pandemic is
having a deep effect on the global economy. In January 2020, as reports of
the novel coronavirus were emerging, the World Bank forecasted that the global
economy would expand by 2.5% that year. In January 2021, with the pandemic
still holding much of the world in its grip, the World Bank estimated that
the global economy contracted by 4.3% in 2020, a turnabout of 6.8 percentage
points.
The economic downturn is likely to have diminished living standards
around the world, pushing millions out of the global middle class and
swelling the ranks of the poor. At the same time, the path to a recovery
is clouded with uncertainties. A new Pew Research Center analysis finds that the global middle class
encompassed 54 million fewer people in 2020 than the number projected prior
to the onset of the pandemic. Meanwhile, the number of poor is estimated to
have been 131 million higher because of the recession. The drop-off in the global middle class was centered in South Asia
and in East Asia and the Pacific, and it stalled the expansion seen in the
years preceding the pandemic. South Asia, specifically India, along with
Sub-Saharan Africa, accounted for most of the increase in poverty, reversing
years of progress on this front. As defined in this report (and in previous Pew Research Center
analyses), people who are middle income live on $10.01-$20
a day, which translates to an annual income of about $14,600 to $29,200 for a
family of four. This is modest by the standards of advanced economies. In
fact, it straddles the official poverty line in
the United States – about $23,000 for a family of four in 2020 (expressed in
2011 prices). By global standards, the poor live on $2 or less a day, or no
more than $2,920 annually for a family of four. The number of people in the global high-income tier (more than $50
daily) is estimated to have decreased by 62 million in 2020, erasing about
half of the gain since 2011, with most of the change emanating from advanced
economies. Meanwhile, the upper-middle income population ($20.01-$50 daily)
fell by 36 million, while the low-income population ($2.01-$10 daily) is
estimated to have increased by 21 million. Who is middle class (or middle income)? This report uses the terms “middle income” and “middle class” interchangeably,
a common practice among economists who tend to define the middle class in
terms of income or consumption. But being middle class can connote more than
income, be it a college education, white-collar work, economic security,
owning a home, or having certain social and political values. Class could
also simply be a matter of self-identification. The interplay among these
many factors is examined in studies by Hout (2007) and Savage et al. (2013),
among others. The population in each global region is divided into five groups:
poor, low income, middle income, upper-middle income and high income. The
poor live on $2 or less daily, low income on $2.01-$10, middle income on
$10.01-$20, upper-middle income on $20.01-$50 and high income on more than
$50. All dollar figures are expressed in 2011 prices and purchasing power parity dollars,
currency exchange rates adjusted for differences in the prices of goods and
services across countries. The assignment to a group, or income tier, is based on a household’s
daily per capita income or consumption, a simple way of controlling for differences in
household size. In the source data, some countries only
report income data while others only report consumption data. The terms “income”
and “consumption” are used interchangeably for the sake of convenience. A middle-income, or middle-class, threshold of $10 follows the
practice of other researchers. A similar threshold has been used by the World
Bank (2007, 2015),
researchers at the Organization for Economic Cooperation and Development (Kharas, 2010),
the development community (Birdsall, Lustig and Meyer, 2013)
and others. There is evidence that the $10 threshold, which is about five
times higher than the World Bank’s global poverty line,
is associated with economic security and
“insulates” people from falling back into poverty. An earlier Pew Research Center report discusses
the choice of income thresholds in greater detail. The global middle-class standard is modest by the standards of
advanced economies. In 2020, the official poverty line for
a family of four in the U.S. stood at about $15.90 per person per day (in
2011 prices). Thus, many who are poor by the U.S. definition would meet the
global middle-income standard or, conversely, many who are in the global
middle class would be poor by U.S. standards.
These estimates are based on the Center’s analysis of World Bank data on the
distribution of people by either income or consumption levels in seven major
global regions. The latest available estimates of income for each region,
such as for 2018 for Europe and Central Asia and 2015 for the Middle East and
North Africa, are extrapolated to 2020 using two sets of growth estimates:
the forecasts issued by the World Bank in January 2020, prior to the
pandemic, and the estimates issued in January 2021, with the pandemic’s
economic impact in plainer sight. The difference between these two measures
is taken to represent the impact of the COVID-19 downturn on the standard of
living of people globally. Prior to the emergence of COVID-19, some 1.38 billion people were
expected to be counted in the global middle class in 2020. But the pandemic
is estimated to have driven this number down to 1.32 billion. The share of
people in the middle class globally is estimated to have been 17.1% in 2020,
instead of potentially 17.8%. The erosion in the middle class might have been
deeper if not for the fact that China – which is home to more than one-third
of the global middle class – evaded an economic contraction,
even though growth there was slower than anticipated. The number of global poor is estimated to have risen to 803 million
in 2020, much greater than the 672 million initially expected. The global
poverty rate, which had been in steady decline this century, is
likely to have increased to 10.4%, nearly reverting to the rate in 2017,
instead of sinking to a new low of 8.7%, as previously expected. The steep rise in global poverty is driven by the fact that many who
were in the low-income tier prior to the pandemic lived on the margin of
poverty. In 2017, 877 million people lived on $2 to $3 a day, according to
World Bank estimates. Thus, large numbers were susceptible to falling back
into poverty prior to the pandemic, especially in South Asia and Sub-Saharan
Africa. At the other end of the economic spectrum, the global high-income
population likely fell to 531 million in 2020 from the 593 million originally
expected. Consequently, the expected share in the high-income tier is 6.8%,
not 7.6%. A vast majority of the global high-income population lives in
advanced economies, and this group of countries also experienced a sharp
downturn in 2020. Ironically, this bolstered the global middle-income
population as people in advanced economies slipped down the ladder from
higher income tiers.
The reversal in global living standards in 2020 comes on the heels of
notable progress earlier in the decade. From 2011 to 2019, the global
middle-class population increased from 899 million to 1.34 billion, or by 54
million people annually, on average. The pandemic is estimated to have erased
a year of growth, leaving the global middle-class population nearly unchanged
from 2019 to 2020. Global poverty had abated at an average rate of 49 million annually
from 2011 to 2019, with the number of global poor falling from 1.10 billion
to 691 million during this period. The pandemic, by adding 131 million to the
ranks of the poor, has set the progress on poverty back by several years, and
the poverty rate is estimated to have increased from 9.0% in 2019 to 10.4% in
2020. From 2011 to 2019, the global high-income population had increased
from 459 million to 576 million, growing by an average of 15 million
annually. Thus, the setback of 62 million due to the pandemic in 2020 also
reverses several years of growth in the high-income population. The share of
the global population in the high-income tier is expected to have decreased
from 7.5% in 2019 to 6.8% in 2020. The erosion of the middle class is centered
in Asia, the rise in poverty in Asia and Africa The effect of the COVID-19 downturn on the middle class and other
income tiers shows distinct regional differences. Asia is expected to have
accounted for most of the shrinking of the global middle class in 2020, with
the middle-class population falling by 32 million in South Asia and by 19
million in East Asia and the Pacific. Meanwhile, the middle class in advanced
economies is estimated to have increased by 16 million, in part due to the
drop-off in the high-income tier in those countries.
The projected rise in global poverty in the pandemic is concentrated
in South Asia (an increase of 78 million) and Sub-Saharan Africa (40
million), historically among the poorest regions in the world. The
high-income population in advanced economies is estimated to have shrunk by
47 million in 2020, accounting for most of the falloff globally. It should be
noted that the global cutoff for the high-income tier – more than $50 a day –
is not much higher than the median income across advanced economies, as an
estimated 40% of the population in these countries is in the global
high-income tier. Thus, the contraction of the high-income tier in advanced
economies is more a reflection of the reduction in the standard of living of
the typical person in these countries than outcomes for the wealthy. The contribution of a region to global changes overall and the shift
in its own income distribution depends mostly on two factors: the sizes of
income tiers in the region prior to the COVID-19 recession and the impact of
the downturn on economic growth in the region. Prior to the pandemic, nearly half of the global middle-class
population – 672 million of 1.38 billion – was estimated to live in East Asia
and the Pacific, a region that includes China. Latin America and the
Caribbean accounted for 191 million, and Europe and Central Asia was home to
183 million. South Asia accounted for 123 million more. In view of these magnitudes, the estimated loss (relative to
pre-pandemic expectations) of 32 million people from the middle class in
South Asia is notable for two reasons. First, the region contributed the most
to the shrinking of the global middle class in 2020 despite having a
middle-income population smaller than several other regions. Second, the
percentage decrease in South Asia’s middle-income population from what was
previously expected (26%) is much greater than in any other region. Although East
Asia and the Pacific shed 19 million from the middle-income tier, that
represented only 3% of its middle class.
Poverty is most prevalent in Sub-Saharan Africa. Some 494 million
people in Sub-Saharan Africa, out of a total population of 1.14 billion, were
expected to be living in poverty ahead of the pandemic in 2020. South Asia,
with a total population of 1.86 billion, was expected to be home to 104
million poor. Nonetheless, South Asia is estimated to have added nearly
double the amount of people to the ranks of the globally poor as Sub-Saharan
Africa in the pandemic. The percentage increase in poverty in South Asia
(75%) dwarfs the increase in Sub-Saharan Africa (8%). The number of poor in other regions was smaller, estimated to range
from 6 million in Europe and Central Asia to 27 million in Latin America and
the Caribbean ahead of the pandemic in 2020. But, since that moment, the
increase in poverty in these regions is notable. The Middle East and North
Africa and East Asia and the Pacific are each estimated to have seen
increases in poverty of more than 20% due to the recession. The rise in
poverty in both Europe and Central Asia and Latin America and the Caribbean
is not far behind, with each experiencing a 17% increase in poverty. A large majority of the global high-income population – 489 million
of 593 million – lived in advanced economies before the global recession took
hold. The estimated decrease of 47 million, or 10%, in this population in
advanced economies accounts for most of the shrinking of the global
high-income tier. In proportional terms, the drop off in the high-income tier is also
notable in Latin America and the Caribbean (15%), Europe and Central Asia
(12%) and East Asia and the Pacific (12%). The losses in the Middle East and
North Africa, South Asia and Sub-Saharan Africa are relatively small in
magnitude (each less than 1 million people) but also represent double-digit
shares of the high-income populations in those regions.
The relatively outsized role of South Asia in the contraction of the
global middle class and the expansion of poverty is the result of it seeing
the sharpest reduction in economic growth in the pandemic. In January 2020,
the World Bank forecasted that South Asia would experience a 4.3% increase in
gross domestic product (GDP) per capita in 2020. But, in January 2021, output
in South Asia was estimated to have decreased by
7.8% in 2020, a retreat of 12.1 percentage points from potential. The setback to economic growth in other regions is smaller, ranging
from 4.7 percentage points in East Asia and the Pacific to 8.6 points in
Latin America and the Caribbean. East Asia and the Pacific is the only region
in which growth is estimated to have stayed positive in 2020, with GDP per
capita inching up by 0.4% even after the onset of the pandemic. Otherwise,
the latest estimates of the change in output per capita in 2020 ranged from
-3.2% in Europe and Central Asia to -7.8% in Latin America and the Caribbean. (PEW) MARCH 18, 2021 |