|
BUSINESS & POLITICS IN THE WORLD GLOBAL OPINION REPORT NO. 686 Week:
April 12 –April 18, 2021 Presentation:
April 23, 2021 Two-Thirds
Of Urban Indians Plan To Use Online Shopping
And Delivery Services In The Future Mcdonald’s
Shines In Yougov Singapore’s Qsr Rankings 2021 Three
In Five Singaporeans Say Shopping Habits Have Changed Since Pandemic KFC
Tops YouGov Thailand’s QSR Rankings 2021 Over
Half Of UAE Residents Plan To Use Online Shopping And Delivery Services In
The Future 72%
Ghanaians Willing To Pay Taxes But Find It Difficult To Know How Tax Revenues
Are Used Three-Quarters
Of British Adults Say That Britain’s Nhs Is One Of The Best In The World (75%
Agree) Inflation
Expectations Increase To 3.8% In March – Higher For Women (4.3%) Than Men
(3.4%) 4
In 10 French People Say They Have Suffered A Loss Of Income As A Result Of
The Crisis The
Impact Of The Pandemic On Food Consumption Habits INTRODUCTORY NOTE
686-43-24/Commentary:
One-Third
Of Asian Americans Fear Threats, Physical Attacks And Most Say Violence
Against Them Is Rising
Amid
widespread reports of discrimination and violence against
Asian Americans during the coronavirus
outbreak, 32% of Asian adults say they have feared
someone might threaten or physically attack them – a greater share than other
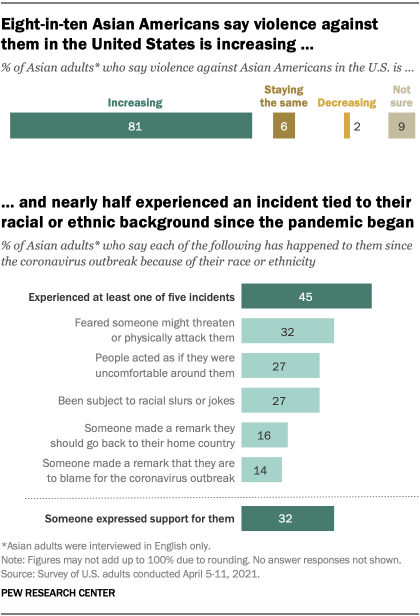
racial or ethnic groups. The vast majority of Asian adults (81%) also say
violence against them is increasing, far surpassing the share of all U.S.
adults (56%) who say the same, according to a new Pew Research Center survey.
The new
survey was conducted April 5 to 11, after the fatal
shooting of six Asian women and two other
people in the Atlanta area on March 16 and assaults
on Asian Americans that occurred that same month (Asian
adults were interviewed in English only). President Joe Biden spoke
out against anti-Asian discrimination and
violence a few days after the shooting. Overall, 45%
of Asian adults say they have experienced at least one of five specific
offensive incidents since the start of the coronavirus outbreak. At the same
time, 32% say someone has expressed support for them since the start of the
pandemic. Some 27% say
people acted as if they were uncomfortable around them, down from 39% who
said the same in June 2020. Another 27% say they have been subject to slurs
or jokes, the same share as in 2020. Meanwhile, lower shares say someone has
made a remark that they should go back to their home country (16%) or that they
are to blame for the coronavirus outbreak (14%). Asian
respondents who say violence against their group in the U.S. is increasing
give many reasons for the rise, according to an open-ended question in which
people responded in their own words. Some 20% directly cited former President
Donald Trump and his rhetoric about China as the source of the pandemic, his
racist comments or his labeling the coronavirus as the “kung flu” or “Chinese
flu” as one of the reasons for the rise in violence. Some 16% cited racism in
the United States against Asian people as the source of violence, and another
15% said the rise in violence is due to COVID-19 and its impacts on the
nation. An additional 12% said scapegoating and blaming Asian people for the
pandemic has been responsible for the rise in violence against the U.S. Asian
population. About three-in-ten Asian respondents who say violence against
their group in the U.S. is increasing (29%) did not provide an answer to the
open-ended question. Some cited
several reasons together for the rise in violence against Asian people in the
U.S. One respondent said, “Four years of Trump has normalized racism and
bullying. His continual example of blaming Asians for the coronavirus is
allowing people to openly discriminate against Asian[s].” Another respondent
mentioned that “they are blaming Asians for the coronavirus pandemic,
thinking they bring this to our country.” And a third respondent cited “a mix
of coronavirus news and its origins in China coupled with talks regarding racial
inequality. Asians are not accepted as people of color as they are seen as
the model minority, but also are seen as foreign because they are not White.”
The nation’s
Asian population recorded the fastest
growth rate among all racial and ethnic groups
in the United States between 2000 and 2019. Asian Americans are also
the fastest
growing racial or ethnic group in the U.S.
electorate. Numbering more than 20 million, the Asian population in the
United States is a
diverse group, with origins from more than 20 countries
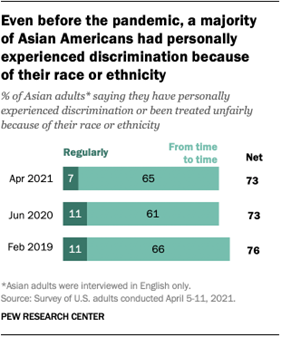
in East and Southeast Asia and the Indian subcontinent. Experiences
with discrimination among Asian adults were widely reported before the
pandemic. About three-in-four Asian Americans (73%) say they have personally
experienced discrimination or been treated unfairly because of their race or
ethnicity, according to the April 2021 Pew Research Center survey. This share
is unchanged from June 2020 and is about the same as prior to the pandemic,
when 76% of Asian adults in February 2019 said they had personally
experienced discrimination or unfair treatment because of their race or
ethnicity.
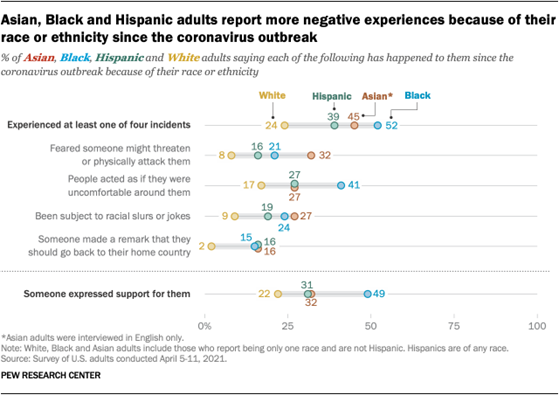
The April
survey also found that Asian adults are more likely to express fear over
discrimination than other groups. About a third (32%) say they fear someone
might threaten or physically attack them, a greater share than among Black
adults (21%), Hispanic adults (16%) or White adults (8%). Asian
Americans are about as likely as Black adults to say they have been subject
to slurs or jokes since the start of the pandemic (27% and 24%,
respectively), and more Asian adults say this than Hispanic (19%) and White
(9%) adults. By contrast, about four-in-ten Black adults (41%) say people
have acted uncomfortable around them since the start of the COVID-19
outbreak, a greater share than Asian (27%), Hispanic (27%) and White (17%)
adults who report the same.
Similar
shares of Asian (16%), Black (15%) and Hispanic (16%) adults say someone has
remarked that they should go back to their home country since the start of
the pandemic. Just 2% of White adults say this has happened to them. While about
one-third (32%) of Asian adults say someone has expressed support for them
because of their race or ethnicity since the pandemic began, a higher share
(49%) of Black adults say this. Since the
start of the outbreak, 52% of Black adults, 45% of Asian adults and 39% of
Hispanic adults report experiencing at least one of the four incidents asked
about in the survey. By comparison, 24% of White adults report the same. An early
2021 Pew Research Center survey found a
majority (71%) of U.S. adults see a lot or
some discrimination against Asian people, a share similar to the public’s
assessments for Black people and Hispanic people. And at the beginning of
Biden’s presidency, another Center survey found a majority of Asian Americans
did not feel like they would gain
influence in Washington with the new
president. (PEW) APRIL 21,
2021 686-43-25/Country Profile:
SUMMARY
OF POLLS
ASIA (India) Two-Thirds Of Urban Indians Plan To
Use Online Shopping And Delivery Services In
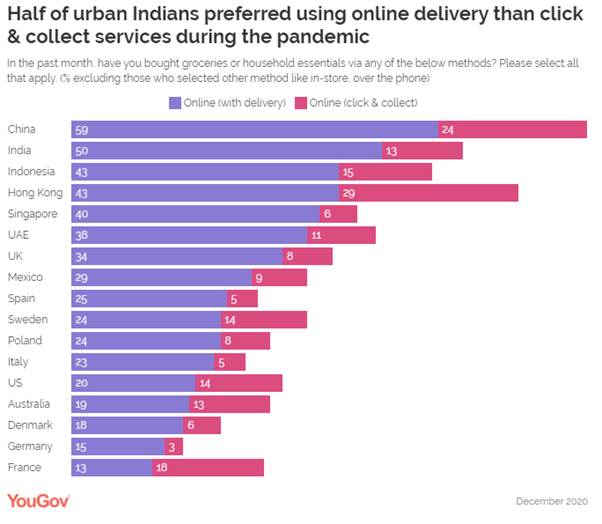
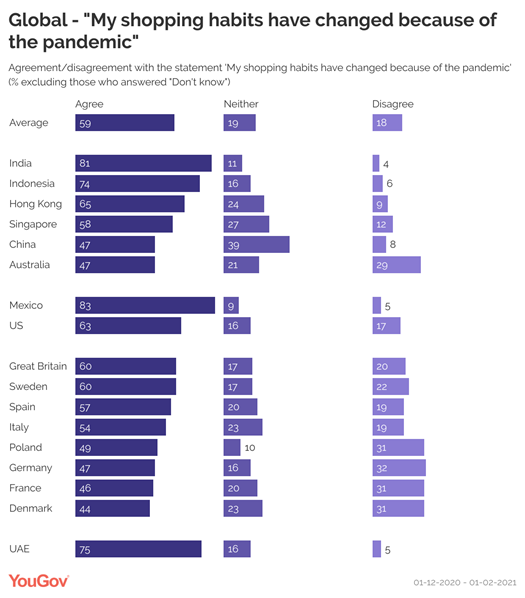
The Future Across all markets, a plurality of
consumers said that their shopping habits have altered because of the
pandemic, with the highest
numbers coming from India (81%) and Mexico (83%). An average of 81% of
consumers across the 17 markets in our study bought groceries or household essentials
in-store in the month prior to being asked this question. In India, online
shopping of groceries: either through delivery or click & collect
services remained as popular as in-store purchases during the pandemic. (YouGov India) (Singapore) Mcdonald’s Shines In Yougov Singapore’s Qsr Rankings 2021 McDonald’s tops YouGov’s 2021 QSR Rankings
for Singapore with an Index score of +39.3, making it the restaurant
brand with the best overall brand health according to Singaporeans. The
rankings are compiled using YouGov BrandIndex Index score, a
measure of overall brand health calculated by taking the average of
Impression, Quality, Value, Satisfaction, Recommend and Reputation scores.
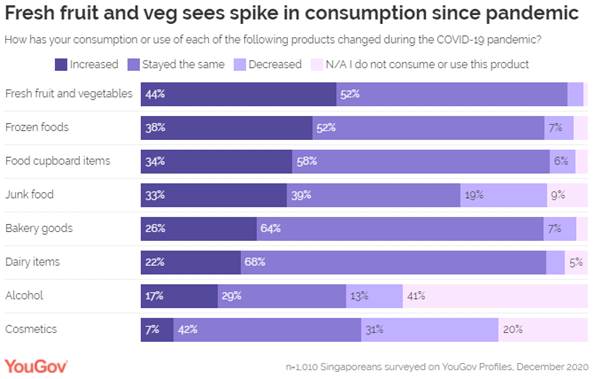
The rankings are measured from 1 March 2020 to 28 February 2021. (YouGov Singapore) Three In Five Singaporeans Say Shopping
Habits Have Changed Since Pandemic The start of the pandemic and announcement
of lockdowns saw shoppers across the world panic-buying toilet paper and
instant noodles, and Singapore was no different. Despite government ministers
assuring Singaporeans there were ample supplies to go around, images of bare
supermarket shelves and long queues flooded the media. A year later, three in
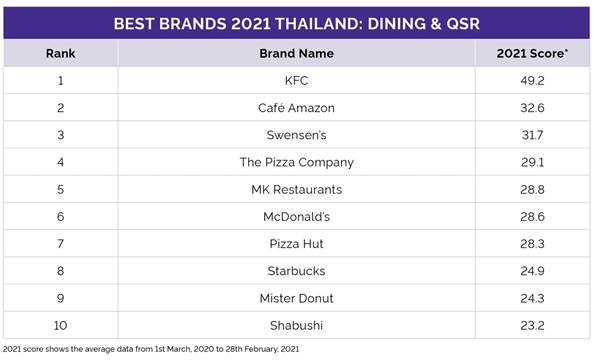
five (58%) say that their shopping habits have changed since the pandemic. (YouGov Singapore) (Thailand) KFC Tops YouGov Thailand’s QSR Rankings
2021 KFC comes up on top in all six metrics that
make up its Index score – particularly for Value (measuring which brand
consumers see to be most value-for-money). It holds a Value score of +53.0 –
making it a whopping 26.1 points ahead of Café Amazon who comes in second
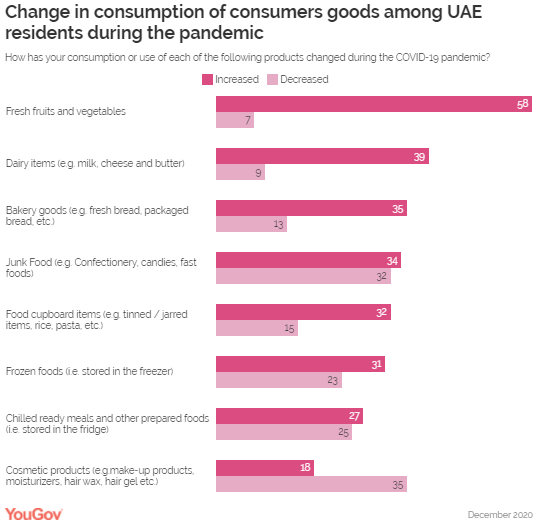
(+26.9) for Value. Café Amazon also comes in second overall (+32.6). (YouGov Thailand) MENA (UAE) Over Half Of UAE Residents Plan To Use Online Shopping And
Delivery Services In The Future YouGov’s FMCG Report 2021 reveals over half
of UAE residents (54%) intend to use online shopping and delivery services in
the future, once the pandemic is over. In the UAE, three-quarters (75%)
bought items in-store amidst the pandemic, while nearly half made purchases
online: either through delivery or click & collect services. Online
delivery was much more popular than click-and-collect services in all the
markets, except France. In the UAE, a 27-percentage point gap exists between
consumers who get their shopping delivered to their doorsteps (38%) and those
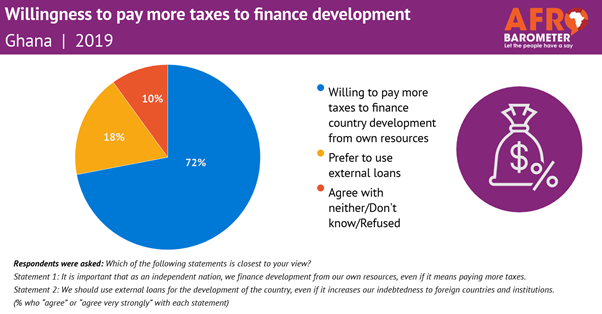
who pick it up (11%). (YouGov MENA) AFRICA (Ghana) 72% Ghanaians Willing To Pay Taxes But Find It Difficult To
Know How Tax Revenues Are Used Ghanaians endorse taxation and are even
willing to pay higher taxes to support the country’s development, a new
Afrobarometer study shows. However, a majority of citizens say it is
difficult to find out what taxes and fees they are supposed to pay and how the
government uses tax revenues. The analysis finds that citizens are more
supportive of taxation if they believe the government is doing a good job of
delivering basic services. But many citizens also express mistrust of tax
authorities and see widespread corruption among tax officials. (Afrobarometer) 12 Apr 2021 WEST
EUROPE (UK) 84% Labor Members Think The Tories Would Win The Most Seats
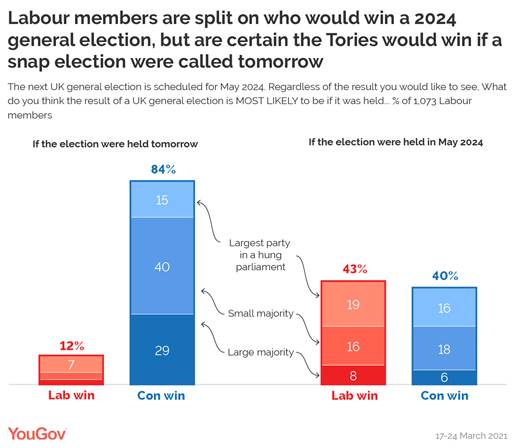
If A General Election Were Held In The Immediate Future With the Conservatives enjoying a consistent lead in voting intention polling, it is perhaps unsurprising that the
latest YouGov polling of Labour party members shows that 84% think the Tories
would win the most seats if a general election were held in the immediate
future. This includes almost a third (29%) who believe that the Conservatives
would win a “large” majority if an election were happening tomorrow. Four in
ten (40%) believe that the result would be a “small Conservative majority”,
while a further 15% think that it would be a “hung parliament, with the
Conservatives ending up forming a government”. (YouGov UK) April 15, 2021 Majority (54%) Of Adults In Britain Believe That The
Quality Of Education They Received At Their Secondary School Was Either ‘Very
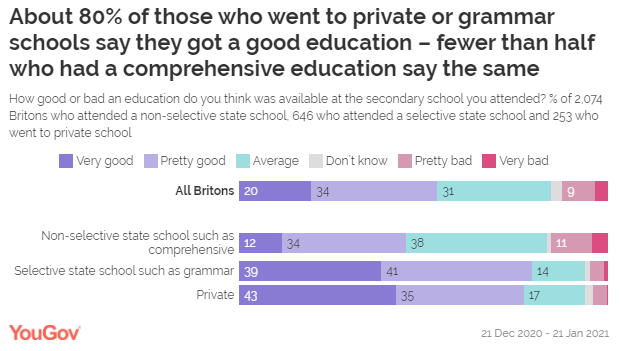
Good’ (20%) Or ‘Pretty Good’ (34%) Our research finds that the majority (54%)
of adults in Britain believe that the quality of education they received at
their secondary school was either ‘very good’ (20%) or ‘pretty good’ (34%).
Three in ten (31%) think it was average, and 12% believe the education they
received was bad. Those who went to a comprehensive were also the most likely
to rate their education as being bad (15%) compared to private school (4%)
and grammar school attendees (5%). (YouGov UK) April 16, 2021 Three-Quarters Of British Adults Say That
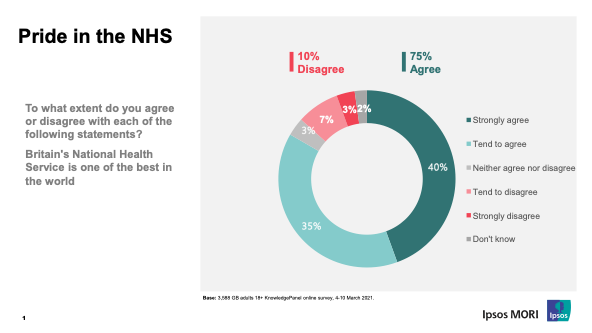
Britain’s Nhs Is One Of The Best In The World (75% Agree) New polling by Ipsos MORI, conducted ahead
of a webinar co-hosted with the Health Foundation, shows that three-quarters
of British adults say that Britain’s NHS is one of the best in the world (75%
agree), while over six in ten UK adults say they are satisfied with the
running of the NHS nowadays (63%). As concern about the pandemic starts to
decrease, over two in five people say that they think the standard of care
provided by the NHS will get better over the next 12 months (44%), while a
third think it will stay the same (35%), and fewer than one in five say it
will get worse (17%). (Ipsos MORI) 13 April 2021 7 In 10 Britons Say They Understand What
They Must Do To Fight Against Climate Change, But Few Can Identify The Best
Ways To Make An Impact In the latest Perils of Perception survey
by Ipsos, we look at how people perceive climate change and the ways they can
help fight it. While 7 in 10 Britons (71%) say they understand what they need
to do to help the fight, we examine how accurate their perceptions are. .
However, it would seem Britons are unlikely to recognise these, instead they
are most likely to identify recycling as much as possible (55%), buying
energy from renewable sources (45%) and replacing a typical car with an
electric or hybrid vehicle (39%). (Ipsos MORI) 17 April 2021 (France) 57% Of French People At Risk Say They Are
More At Risk Than The Average Of The General Population Of Contracting
Covid-19 57% of people at risk say they are more at
risk than the average of the general population of contracting
Covid-19. The most recent infection, this is the one that people at risk
think they have the most risk of contracting, ahead of the flu (54%) and
pneumococcal infections (47%). While mistrust of vaccines is relatively
strong within French society according to some studies [2] , people at risk say they are mostly in favor of
vaccination (86% are "very favorable" (41%) or
“Somewhat favorable” (45%).). (Ipsos France) April 13, 2021 NORTH AMERICA (USA) One-Third Of Asian Americans Fear Threats, Physical Attacks
And Most Say Violence Against Them Is Rising Amid widespread reports of discrimination and violence against Asian Americans during
the coronavirus outbreak, 32% of Asian adults say they have feared
someone might threaten or physically attack them – a greater share than other
racial or ethnic groups. The vast majority of Asian adults (81%) also say
violence against them is increasing, far surpassing the share of all U.S.
adults (56%) who say the same, according to a new Pew Research Center survey. (PEW) APRIL 21, 2021 The Labor Market For Women Had Fallen As Low As 54.4% In
April 2020, And The Rate For Men Had Dipped To 65.9% For women, the labor force participation
rate in February 2021 was 55.9%, compared with 57.9% a year earlier. For men,
the rate fell from 69.0% to 67.1% over this period. The decrease in the labor
force participation rate for workers overall – from 63.3% to 61.3% – exceeds
that seen in the Great Recession and ranks among the largest 12-month declines in the post-World War II era,
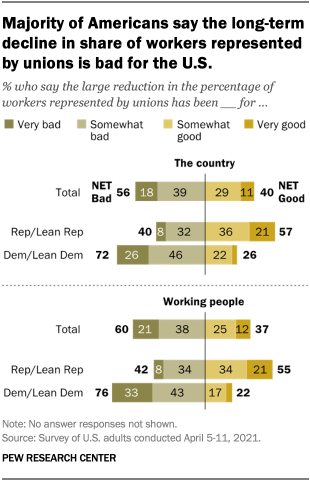
according to Bureau of Labor Statistics data. (PEW) APRIL 14, 2021 56% Say The Large Reduction Over The Past Several Decades
In The Percentage Of Workers Who Are Represented By Unions Has Been
“Somewhat” Or “Very” Bad For The Country In the survey, 56% say the large reduction
over the past several decades in the percentage of workers who are
represented by unions has been “somewhat” or “very” bad for the country, while
60% say this has been bad for working people. The survey was largely fielded
before the vote by workers in an Amazon warehouse in Alabama against forming a union was tabulated
and reported. (PEW) APRIL 15, 2021 (Canada) Over Three-Quarters (78%) Canadians Agree (22% Strongly/56%
Somewhat) Military Has Systemic Problem Of Sexual Harassment Nearly 8 in 10 (78%) agree (22%
strongly/56% somewhat) that the country’s military has a systemic problem of
sexual harassment, including its senior leaders. Women are more likely to
agree with this statement (83%), though men are not far behind (72%) in
acknowledging this issue. . As it stands, three-quarters (75%) agree (24%
strongly/50% somewhat) with this statement. No gender or age group is more
likely than another to believe that this problem is not being adequately
addressed, speaking to how widespread this sentiment is among the general
population. (Ipsos Canada) 13 April 2021 Covid-19 (38%), Healthcare (32%), The Economy (26%), And
Affordability (22%) Top Issues In Next Election COVID-19 (38%), healthcare (32%), the
economy (26%) and affordability/cost of living (22%) are atop the list of
issues that Canadians say are most important in determining how they will
vote during the next election, according to a new Ipsos poll conducted on
behalf of Global News. Not far behind are issues relating to housing
(affordability and availability) (17%), taxation (17%), climate change (17%),
unemployment and jobs (15%), poverty and social inequality (14%), government
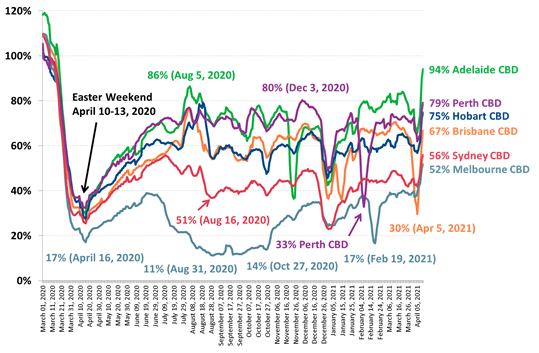
deficit/debt (13%) and senior’s issues/aging population (9%). (Ipsos Canada) 18 April 2021 AUSTRALIA At 94% Of Pre-Covid Levels Movement In Adelaide Was The
Highest Level Since Mid-March 2020 Before The Strictest Lockdown Measures
Were Implemented The Sydney CBD movement levels were at 56%
of pre-COVID normal last week, the highest since July 2020, the Hobart CBD
movement levels were at 75% of normal – the highest since late August 2020
and the movement levels in the Perth CBD were at 79% of normal matching the
level last seen in early December 2020 before the Northern Beaches outbreak
in Sydney. The one exception is the Brisbane CBD in
which movement levels were at 67% of pre-COVID normal last week as the city
was still recovering after hitting a low of 30% of normal during the recent
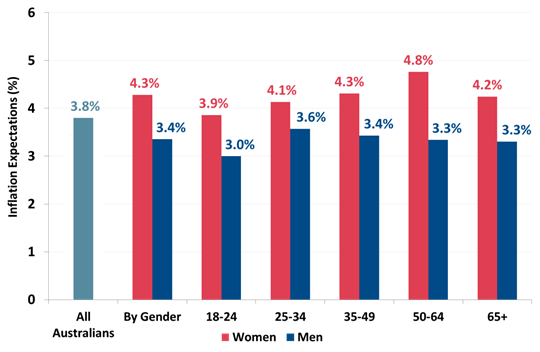
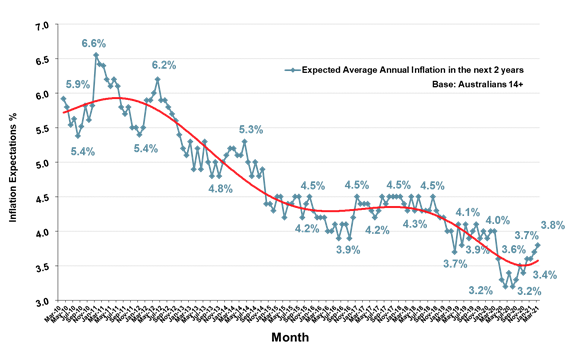
three-day lockdown of Greater Brisbane. (Roy Morgan) April 15 2021 Inflation Expectations Increase To 3.8% In March – Higher
For Women (4.3%) Than Men (3.4%) Women’s Inflation Expectations are now at
4.3%, up by 0.5% points since the low-point in August 2020, and remain far
higher than men’s at 3.4% which are up by 0.8% points during the same period.
The Inflation Expectations of women are significantly higher than men across
the age spectrum with the largest gap of 1.5% points for people aged 50-64:
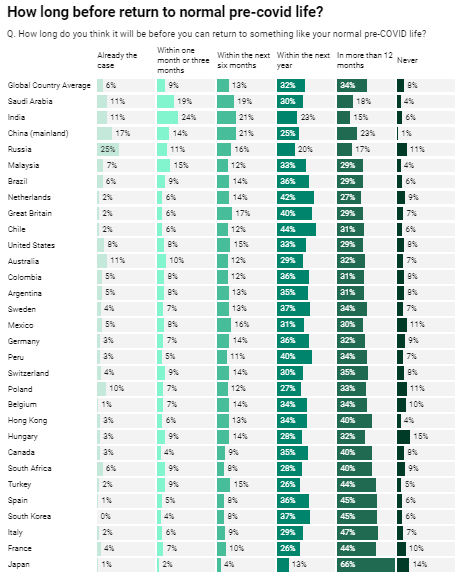
Women 4.8% cf. men 3.3%. (Roy Morgan) April 12 2021 MULTICOUNTRY STUDIES 59% Expect Being Able To Return To Something Like Their
Normal Pre-Covid Life Within The Next 12 Months A
new Ipsos survey for the World Economic Forum finds that, on average across
30 countries and markets surveyed, 59% expect being able to return to
something like their normal pre-COVID life within the next 12 months,
including 6% who think this is already the case, 9% who think it will take no
more than three months, 13% four to six months, and 32% seven to 12 months
(the median time). About one in five think it will take more than three years
(10%) or that it will never happen (8%). 12
April 2021 4 In 10 French People Say They Have Suffered A Loss Of
Income As A Result Of The Crisis The
study conducted in 2019 by BNP Paribas Cardif identified two main concerns of
citizens: illness and loss of income . Unsurprisingly,
this level of concern has increased
significantly with the Covid-19 crisis: 76% of people
surveyed around the world say they are concerned about the disease (+5 points
vs 2019) and 76% about the loss of income (+ 4 points), significant increases
in just two years. Nevertheless, major disparities are observed
depending on the geographical areas. (Ipsos
France) April
13, 2021 An Average Of 59% Of Consumers Indicate That Their Shopping
Habits Have Changed As A Result Of The Pandemic An average of 59% of consumers indicate that their
shopping habits have changed as a result of the pandemic. Globally,
Mexico is the country where most people have changed their habits (83%),
followed by India (81%) and the United Arab Emirates (75%). In Europe, the
figures are generally lower, but more and more consumers answer that they
have changed their shopping habits than they have not. At the top of the
scale, 60% of Britons and Swedes state that they have changed their routines,
while Denmark is at the bottom with 44%. There are also marked
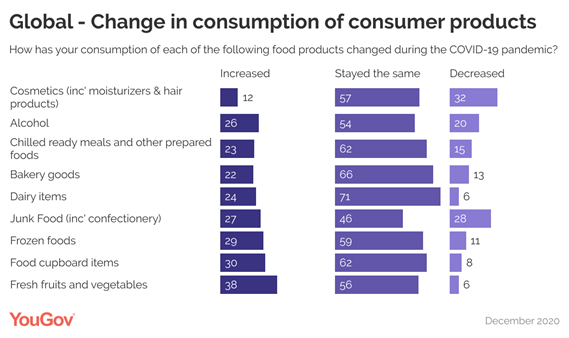
differences between these two extremes. (YouGov Norway) April 14, 2021 The Impact Of The Pandemic On Food Consumption Habits Faced
with uncertainty and the fear of a shortage, many consumers built up food
stocks at the start of the pandemic. On the other hand, the successive
confinements and the closure of restaurants have led some people to discover
(or rediscover) a passion for cooking. Thus, since the start of the
pandemic, 57% of Mexicans, 46% of Singaporeans, 30% of Australians, 27% of French , 24% of British and
23% of Americans say they have bought more fresh fruits and vegetables and dairy
products. (YouGov
France) A Global Market Average Of 7 In 10 (69%) Agree That, “I
Understand What Action I Need To Take To Play My Part In Tackling Climate
Change” People
around the world were most likely to choose recycling as much as possible
(59%), buying energy from renewable sources (49%) and replacing a typical car
with an electric or hybrid vehicle (41%). Two in
five (43%) believe conflict to be the greater cause of internal displacement,
while a third (32%) chose climate and weather-related disasters. In reality,
9.8 million people were displaced due to changes in weather or climate in the
first 6 months of 2020, compared with 4.8 million displaced by conflict. (Ipsos
Egypt) 17
April 2021 ASIA
686-43-01/Poll Two-Thirds
Of Urban Indians Plan To Use Online Shopping
And Delivery Services In The Future
YouGov’s latest research reveals two-thirds
of urban Indians (67%) plan to increase the use of online shopping or
delivery services once the pandemic is over. YouGov’s ‘‘International
FMCG/CPG report 2021: Consumer goods in a crisis’ provides a high-level analysis of
consumers’ attitudes to fast moving/consumer packaged goods across 17 global
markets. The white paper is based on more than 18,000 interviews and explores
how the COVID-19 crisis has affected the FMCG sector worldwide across a range
of categories. Across all markets, a plurality of
consumers said that their shopping habits have altered because of the
pandemic, with the highest
numbers coming from India (81%) and Mexico (83%).
An average of 81% of consumers across the
17 markets in our study bought groceries or household essentials in-store in
the month prior to being asked this question. In India, online shopping of
groceries: either through delivery or click & collect services remained
as popular as in-store purchases during the pandemic. Online delivery seems to have been much
more popular than click and collect services in most of the surveyed markets.
In India, there is a 37- percentage point difference between those who bought
groceries online using the delivery option (50%) and those who picked it up
(13%). The lockdown restrictions along with the fear of going to crowded
places could have been the key drivers for this behavior. Looking at the impact of the pandemic on
local businesses, three in five consumers (60%) across all markets claim to
support local businesses and buy local products more once the pandemic
subsides. India and Mexico feature as the top countries who plan to do this
(75% and 77% respectively). Beyond supporting local businesses, the consumers
in both these countries are most likely to buy more sustainable products once
the crisis has ended (74% each). Apart from shopping behaviour, the pandemic
has led to changes in FMCG category consumption. The data shows that during
the pandemic consumers have responded in different ways across different FMCG
categories.
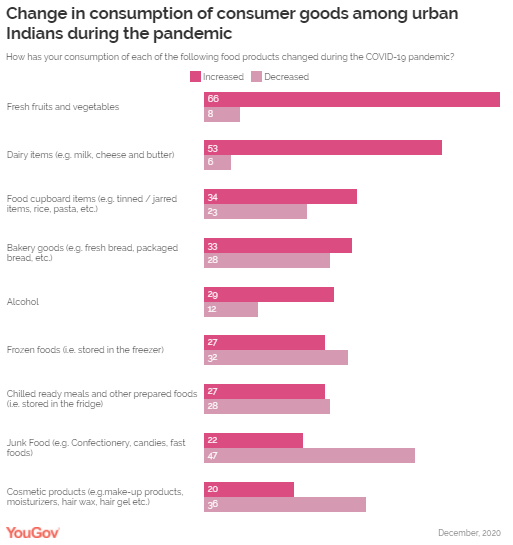
Across all 17 markets, approaching four in
ten (35%) said they eat more fresh fruit and vegetables, while just 6% said
they eat less. In India, two-thirds (66%) increased their
consumption of fruits and vegetables while only 8% said to have decreased it. Urban Indians were eating more dairy items
(53%) while consumption of chilled ready meals remained static (27% increase
vs 28% decrease in consumption). Intake of frozen foods reduced for a third
(32%), increasing for 27%, while more people ate bakery good (33% increase vs
28% decrease) and food cupboard items (34% vs 23%). Consumption of alcohol has increased for
thee in ten urban Indians (29%). In fact, India (29%) and China (27%) are the
leading markets where people said that they have consumed more alcohol during
the pandemic than elsewhere in the world. Cosmetics appears to have particularly
struggled during the crisis: 32% consumers globally said that they are buying
fewer products in this category. In India, more than a third (36%) confirmed
there been a decrease in their purchase of personal care/cosmetics products,
while only a fifth said it has increased. On the other hand, as compared to the
global average (42%), home-cleaning products performed fairly well in India
with a vast majority (70%) of respondents saying they have bought more
cleaning products during the pandemic. Commenting on this, Deepa Bhatia of YouGov India, said,
“The COVID-19 pandemic has created both challenges and opportunities
for brands operating within the broad FMCG sector. The data highlights
significant changes in consumer sentiment and behaviour. Notably, there is a
shift to remote purchasing, as well as affinity towards local businesses,
among urban Indians because of the ongoing crisis. Whether these changes will
be long-lasting or short-term, remains to be seen, as we enter the
second year of the crisis. In order to stay relevant, FMCG brands need to
revisit their well-worn marketing playbooks and adopt new ways of
understanding consumer’s changing expectations.” (YouGov India) Source: https://in.yougov.com/en-hi/news/2021/04/13/two-thirds-urban-indians-plan-use-online-shopping-/ 686-43-02/Poll Mcdonald’s
Shines In Yougov Singapore’s Qsr Rankings 2021
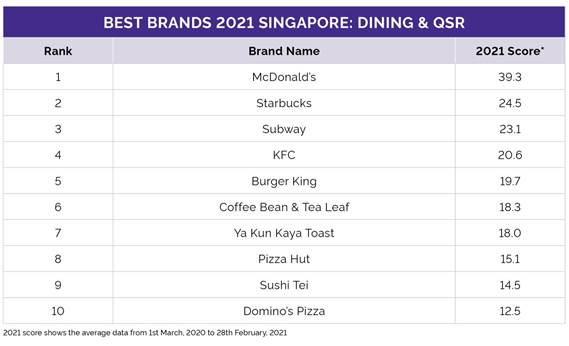
McDonald’s tops YouGov’s 2021 QSR Rankings
for Singapore with an Index score of +39.3, making it the restaurant
brand with the best overall brand health according to Singaporeans. The rankings are compiled using
YouGov BrandIndex Index score, a measure of overall brand health
calculated by taking the average of Impression, Quality, Value, Satisfaction,
Recommend and Reputation scores. The rankings are measured from 1 March 2020
to 28 February 2021.
In spite of a difficult year of staff testing positive for COVID-19, and an extended closure during the circuit breaker,
McDonald’s still came up on top in five of the six metrics that make up its
Index score. It scored particularly well for Value (measuring the brand
consumers see to be the most value-for-money). It holds a Value score of
+43.1, making it 21.2 points ahead of KFC who has the second highest Value
score (+21.9). McDonald’s is also far ahead of the competition when it comes
to Satisfaction (measuring which consumers are the most satisfied) with a
score of +50.3, with Subway trailing 22.3 points behind with a score of
+28.0. The one metric that McDonald’s doesn’t get
top marks for is for Reputation (measuring which brand consumers would be
proudest to work for). Coffee chain Starbucks comes in first place for
Reputation (+29.5), with McDonald’s following behind with a score of +20.7. American chains dominate the top ten.
Starbucks comes in strong in second place (+24.3). However, it scores the
lowest when it comes to Value, holding a low score of +2.1. Subway takes
third (+23.1), KFC in fourth (+20.6) and Burger King in fifth (+19.7). Coffee Bean & Tea Leaf takes sixth
place (+18.3), but similar to its coffee competitor Starbucks, it scores low
for Value (+4.6). Pizza Hut is in eighth (+15.1) and Domino’s Pizza is in
tenth (+12.5). The list is completed with local favourite
Ya Kun Kaya Toast in seventh (+18.0) and Sushi Tei in ninth (+14.5).
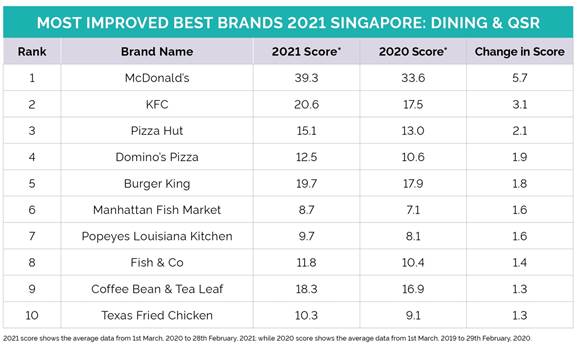
The rankings also looks at which QSR brands
have shown the most improvement over the past year. Again, McDonald’s shines
with the most improved score (moving up 5.7 points), followed by KFC (up 3.1)
and Pizza Hut (up 2.1). (YouGov Singapore) Source: https://sg.yougov.com/en-sg/news/2021/04/13/mcdonalds-shines-yougov-singapores-qsr-rankings-20/ 686-43-03/Poll Three In
Five Singaporeans Say Shopping Habits Have Changed Since Pandemic
YouGov’s ‘International FMCG/CPG report 2021:
Consumer goods in a crisis’ reveals changes to Singaporeans
consumption of fast moving / consumer packed goods since the pandemic. The start of the pandemic and announcement
of lockdowns saw shoppers across the world panic-buying toilet paper and instant noodles, and
Singapore was no different. Despite government ministers assuring Singaporeans there were ample
supplies to go around, images of bare supermarket shelves and long queues
flooded the media. A year later, three in five (58%) say that their shopping
habits have changed since the pandemic. With much of the focus last year being to
stay at home and stay clean, over a third (36%) have bought more home cleaning
products. Of all the consumer goods YouGov polled Singaporeans on, it is
fruits and vegetables that most shoppers report spending more on, with over
two in five (44%) saying their consumption has increased. Shoppers have also
stocked up more on frozen foods in the past year, with almost two in five
(38%) reporting increased consumption. This is followed by junk food (33%),
food cupboard items (34%), baked goods (26%) and dairy (22%). About one in
five (18%) also report spending more on alcohol since the pandemic.
Cosmetic products did not quite see the
same spike in consumption, with only 7% reporting an increase in spending.
Overall, three in ten (31%) say they are now spending less on cosmetics, and
amongst women, this number rises to two in five (40%). About two in five (38%) Singaporeans say
their buy their groceries or household essentials via online supermarkets,
and over two in five (46%) have done so in the past month. Amongst those aged
35 to 44, this jumps to three in five (62%). The majority (84%) do their
grocery shopping in-person at supermarkets, particularly those aged 45 and up
(92%). YouGov also asked shoppers how they foresee
their habits changing as a result of the pandemic. Over a third (36%) say
they are now more likely to buy things in bulk. Almost two-thirds (63%) agree
they will be shopping more online – a sentiment echoed particularly by
younger shoppers (aged 18 to 34) with seven in ten (69%) agreeing with this
statement. Older shoppers are less likely to be reverting to online shopping
post-pandemic, with only two in five (41%) of those aged 45 and up agreeing
that they will make more use of online shopping / delivery. Over half (53%)
say they will make more of an effort to support local businesses and the same
amount say they will buy more sustainable products in the future. Ervin Ha, Head of Data Products for YouGov
APAC: “The COVID-19 pandemic has created both challenges and opportunities
within the FMCG sector. It hasn't had a one-size-fits-all impact on shopping
behaviour and there are very real differences between different categories
and markets. Whether these changes will be long-lasting or short-term remains
to be seen but, as we enter the second year of the crisis, understanding
consumer sentiment will be for keeping FMCG players on the front foot.” (YouGov Singapore) Source: https://sg.yougov.com/en-sg/news/2021/04/13/over-two-five-singaporeans-report-increased-consum/ 686-43-04/Poll KFC Tops
YouGov Thailand’s QSR Rankings 2021
KFC tops YouGov’s 2021 QSR Rankings
for Thailand with an Index score of +49.2, making it the restaurant
brand with the best overall brand health according to Thais. The rankings are compiled using
YouGov BrandIndex Index score, a measure of overall brand health
calculated by taking the average of Impression, Quality, Value, Satisfaction,
Recommend and Reputation scores. The rankings are measured from 1 March 2020
to 28 February 2021.
KFC comes up on top in all six metrics that
make up its Index score – particularly for Value (measuring which brand consumers
see to be most value-for-money). It holds a Value score of +53.0 – making it
a whopping 26.1 points ahead of Café Amazon who comes in second (+26.9) for
Value. Café Amazon also comes in second overall (+32.6). Café Amazon is not the only home-grown
brand on the list. The Pizza Company is in fourth (+29.1), MK Restaurants
takes fifth (+28.8) and Shabushi in tenth (+24.3). The rest of the top ten consists of
American chains. Swensen’s takes third (+31.7), McDonald’s in sixth (+28.6)
and Pizza Hut in seventh (+28.3). Starbucks comes in eighth overall (+24.9),
but does score well for Reputation (measuring which brands consumers would be
proudest to work for) coming in second for this metric (+32.6). The coffee
chain also scores well for Quality, coming in third (+38.8). The list is
rounded up with Mister Donut in ninth (+24.3).
YouGov also looks at which QSR brand has
shown the greatest improvement in scores. Pizza Hut shows the greatest
improvement, with an increase of 3.5 in the past year. It is followed closely
by competitor The Pizza Company (up 3.2 points). (YouGov Thailand) Source: https://th.yougov.com/en-th/news/2021/04/13/kfc-tops-yougov-thailands-qsr-rankings-2021/ MENA
686-43-05/Poll Over Half Of
UAE Residents Plan To Use Online Shopping And Delivery Services In The Future
YouGov’s FMCG Report 2021 reveals over half
of UAE residents (54%) intend to use online shopping and delivery services in
the future, once the pandemic is over. YouGov’s ‘International FMCG Report 2021: Consumer goods in a crisis’ provides
a high-level analysis of consumers’ attitudes to fast-moving/consumer
packaged goods across 17 global markets. The white paper is based on more
than 18,000 interviews and explores how the COVID-19 crisis has affected the
FMCG/CPG sector worldwide across a range of categories. In all the 17 surveyed markets, a plurality
of consumers said their shopping habits have changed during the pandemic. In
the UAE, three-quarters of residents made this claim. Our research shows Covid-19 has not stopped
people from visiting supermarkets. An average of 81% of consumers across the
17 markets in our study bought groceries or household essentials in-store in
the month prior to being asked. Having said that, a large proportion
used the online medium to buy household items. In the UAE, three-quarters (75%) bought
items in-store amidst the pandemic, while nearly half made purchases online:
either through delivery or click & collect services.
Online delivery was much more popular than
click-and-collect services in all the markets, except France. In the UAE, a
27-percentage point gap exists between consumers who get their shopping
delivered to their doorsteps (38%) and those who pick it up (11%). Although supermarkets remained a strong
format during the pandemic, many people have pledged to support local
retailers, perhaps due to the impact of the pandemic on the local
businesses. Across all 17 markets, three in five
consumers (60%) said they intend to support local businesses and buy local
products more once the pandemic has subsided. Beyond supporting local
businesses, many global consumers are also considering doing more to help the
planet. Consumers in the UAE have good
intentions in this regard. Nearly two-thirds claim to support local
businesses (64%) and buy more sustainable products (66%) once the pandemic
ends. Impact on FMCG categories Our data shows that during the pandemic
consumers have responded in different ways to different FMCG/CPG categories. Across all 17 markets, 35% said they eat
more fresh fruit and vegetables, while just 6% said they eat less. In the UAE, people were eating more fresh
food (58%), but consumption of junk food and chilled meals remained static.
Consumption of dairy items increased for
two in five (39%) consumers (decreasing by 9%), while more people ate baked
goods (35% increase vs. 13% decrease), food cupboard items (32% vs 15%), and
frozen foods (31% vs 23%). Globally, cosmetics
appears to have particularly struggled during the crisis: 27%
of respondents across the 17 markets said they are buying fewer products
in this category. In the UAE, the consumption decreased for 35%
consumers, and only 18% increased their use of cosmetics. (YouGov MENA) Source: https://mena.yougov.com/en/news/2021/04/14/over-half-uae-residents-plan-use-online-shopping-a/ AFRICA
686-43-06/Poll 72% Ghanaians
Willing To Pay Taxes But Find It Difficult To Know How Tax Revenues Are Used
Ghanaians endorse taxation and are even
willing to pay higher taxes to support the country’s development, a new
Afrobarometer study shows. However, a majority of citizens say it is
difficult to find out what taxes and fees they are supposed to pay and how
the government uses tax revenues. The analysis finds that citizens are more
supportive of taxation if they believe the government is doing a good job of
delivering basic services. But many citizens also express mistrust of tax
authorities and see widespread corruption among tax officials. In its 2021 budget statement, the
government introduced new taxes, including a 1% COVID-19 levy added to the
VAT and a 1% addition to the National Health Insurance Levy (NHIL). (Afrobarometer) 12 Apr 2021 WEST
EUROPE
686-43-07/Poll 84% Labor Members Think The Tories Would Win The Most Seats If A
General Election Were Held In The Immediate Future
With the Conservatives enjoying a consistent
lead in voting intention polling, it is perhaps unsurprising that the
latest YouGov polling of Labour party members shows that 84% think the Tories
would win the most seats if a general election were held in the immediate
future. This includes almost a third (29%) who believe that the Conservatives
would win a “large” majority if an election were happening tomorrow. Four in
ten (40%) believe that the result would be a “small Conservative majority”,
while a further 15% think that it would be a “hung parliament, with the
Conservatives ending up forming a government”.
Only 12% of party members think that Labour would win some form of
victory. Younger members are most optimistic in this regard, with 19% of 18-24
year olds and 15% of 25-49 year old members believing that their party could
secure a Labour victory in an election happening now. Just 8% of members aged
65 and over hold the same view. Labour members are much more cheery about their party’s prospects for
an election held in May 2024 – which is, under the Fixed Term Parliament Act
(2011), the next planned date for a general election. Around two in five
members (43%) feel that Labour would emerge as the largest party in an
election held then, including 24% who believe the party could win some sort
of majority. Equally, however, around the same amount (40%) think that even by
2024 their party will not be in a position to win a general election, but
instead lose out once again – for the fifth time in a row – to the
Conservatives. The key dividing factor in estimations of Labour prospects at a 2024
general election appears to be 2020 leadership election vote. Almost half
(47%) of those who voted for Keir Starmer in last year’s contest believe that
Labour will win the most seats, while only 31% of Rebecca Long-Bailey
voters think the same. On the other hand, again, almost half (47%) of those
who voted for Long-Bailey think that the Conservatives will emerge victorious
in 2024, compared to 36% of those who voted for Starmer. (YouGov UK) April 15, 2021 686-43-08/Poll Majority (54%) Of Adults In Britain Believe That The Quality Of
Education They Received At Their Secondary School Was Either ‘Very Good’
(20%) Or ‘Pretty Good’ (34%)
With the recent release of data showing that some state schools are
outperforming private schools for offers to attend Oxford or Cambridge
University, The
Times reported that rich parents are worried that private school may
no longer be the ticket to an elite institution it once was. That attending an expensive school might not benefit a child is
nevertheless a niche view, according to new YouGov data on education quality. Our research finds that the majority (54%) of adults in Britain
believe that the quality of education they received at their secondary school
was either ‘very good’ (20%) or ‘pretty good’ (34%). Three in ten (31%) think
it was average, and 12% believe the education they received was bad. However, the answer seems to heavily depend on what type of school
you went to. Of those who attended a comprehensive school, just 45% reported that
the education they received was good. For those who attended a grammar
school, however, this figure is much higher, at 80%. This number is similar
for those who attended a private school, of whom 77% rate their education as
being good. Those who went to a comprehensive were also the most likely to rate
their education as being bad (15%) compared to private school (4%) and grammar
school attendees (5%).
Where the debate around the existence of grammar and private school
becomes most contentious is the implication for pupil’s career success. Research
by the Sutton Trust has found that a disproportionate number of
well-paid jobs are occupied by the privately educated, for example finding
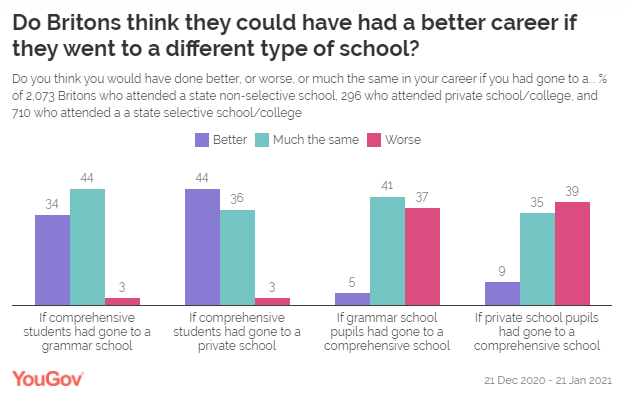
that almost three quarters (74%) of top judges were educated privately. Our research shows a large proportion of those who were state
educated believe the type of school they went to has had an impact on their
career success. Of those who attended a comprehensive, 44% believe their job
prospects would have been better if they had attended a private school, their
career would have turned out much the same and only 3% believing they would
have done worse. They are less likely to believe going to a grammar school would have
made any difference to their career than they are to believe going to a
private school would have. Only a third (34%) believe they would have done
better at a grammar school, with 44% believing they would have done much the
same and just 3% believing they would have done worse. When it comes to former grammar school pupils, they are much less
likely than former comprehensive pupils to think their life would have been
better had they attended a private school (27%). Half believe they would have
done much the same (49%). Should they have attended a comprehensive, rather than grammar
school, one in three former grammar pupils believe their lives would have
turned out worse as a result. Four in ten (41%) believe things would have
panned out much the same. By contrast, four in ten private school attendees (39%) think they
would have done worse at a state comp, compared to 35% who think they would
have done just as well.
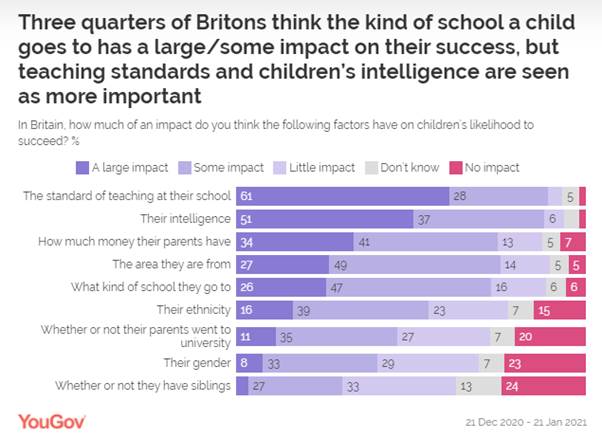
Three quarters of Britons believe the school a child attends has a
large impact (26%) or some impact (47%) on their chance of success. Only one
in six (16%) think it has little impact, and just 6% say it has no impact at
all. Britons are, however, more likely to believe that the standard of
teaching at school (89%) and a child’s own intelligence (88%) have a large or
some impact on their success. Similar numbers of people also believe that where a child lives and
grows up and the amount of money their parents have as much of an impact on
them as where they go to school, at 76% and 75% respectively. A majority (55%) also think a child’s ethnicity has a large or
moderate impact, while 41% think their gender plays into children’s success
(with women more likely to think so than men, at 46% vs 35%).
Despite the amount of influence Britons believe a school has on their
future chances of success, there is limited support for phasing out private
or state selective schools. On the question of banning private schools, just
21% would support a ban, while 30% would oppose it. In her time as Prime Minister, Theresa May set
aside money for the opening of new selective schools, paving the way
for a new generation of grammar schools. Britons are divided on this issue.
One in five (20%) support the status quo, saying we should keep the current
number of grammar schools and not open any more. Three in ten (29%) support
opening more selective schools, while a similar number (27%) believe grammar
schools should be scrapped altogether. Unsurprisingly, opinion differs between those who attended a grammar
school versus those who attended a non-selective state school. Of those who
attended a grammar school, 47% support the building of further such schools,
while just 22% of those who attended a non-selective state school feel the
same. (YouGov UK) April 16, 2021 686-43-09/Poll Three-Quarters Of British Adults Say That Britain’s Nhs Is One Of The
Best In The World (75% Agree)
New polling by Ipsos MORI, conducted ahead of a webinar co-hosted
with the Health Foundation, shows that three-quarters of British adults say
that Britain’s NHS is one of the best in the world (75% agree), while over
six in ten UK adults say they are satisfied with the running of the NHS
nowadays (63%).
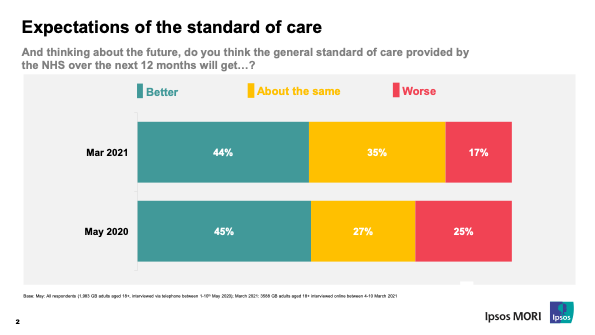
As concern about the pandemic starts to decrease, over two in five
people say that they think the standard of care provided by the NHS will get
better over the next 12 months (44%), while a third think it will stay the
same (35%), and fewer than one in five say it will get worse (17%). The
proportion saying that they think it will get worse has decreased since May
last year, when it was 25% (45% thought it would get better, while 27%
thought it would stay the same).
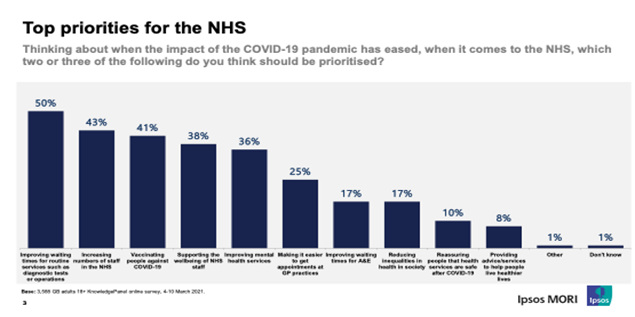
In particular, the public’s top priority for the NHS is improving
waiting times. Half say this should be prioritised when the impact of the
pandemic has eased, followed by increasing numbers of staff in the NHS (43%),
and vaccinating people against COVID-19 (41%). Supporting the wellbeing of
NHS staff is important to the public too (38%), as is improving mental health
services generally (36%).
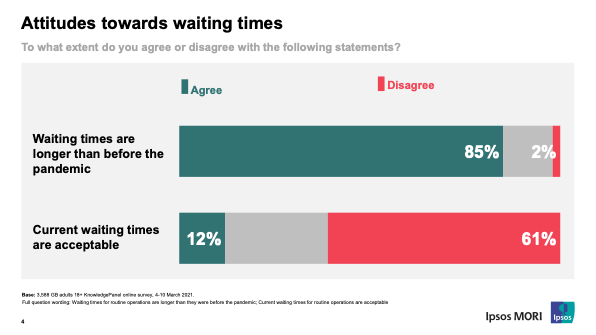
The data shows the difficult task ahead for the NHS. The public
recognise the impact of the pandemic on services, with 85% saying that
waiting times are longer than before the pandemic. At the same time, six in
ten say that current waiting times are unacceptable (61%).
Anna Quigley, Head of Health and Social
Care at Ipsos MORI, said: These results
show yet again the pride that the public has in the NHS, no doubt bolstered
by its work during the pandemic. However, the data also shows the challenges
that lie ahead for the NHS in terms of public expectations, at a time when
the service is facing a backlog of elective surgery cases, increased demand
for mental health services, and the ongoing impact of caring for patients
affected by COVID-19. (Ipsos MORI) 13 April 2021 686-43-10/Poll 7 In 10 Britons Say They Understand What They Must Do To Fight
Against Climate Change, But Few Can Identify The Best Ways To Make An Impact
In the latest Perils of Perception survey by Ipsos, we look at how
people perceive climate change and the ways they can help fight it. While 7
in 10 Britons (71%) say they understand what they need to do to help the
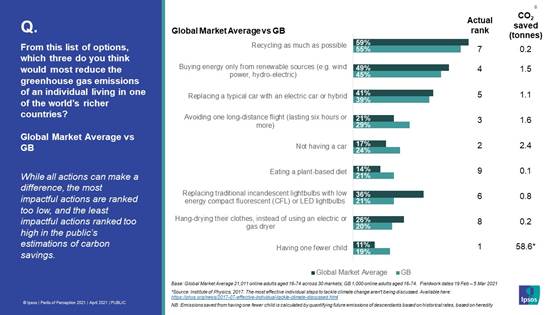
fight, we examine how accurate their perceptions are. According to the Institute of Physics, the top 3 ways to reduce
greenhouse gas emissions are having one fewer child, not having a car and
avoiding one long-distance flight1.
However, it would seem Britons are unlikely to recognise these, instead they
are most likely to identify recycling as much as possible (55%), buying
energy from renewable sources (45%) and replacing a typical car with an
electric or hybrid vehicle (39%).
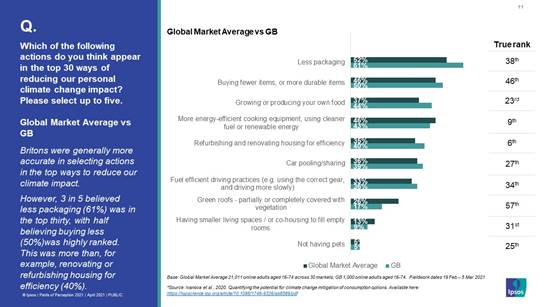
When looking at the top 30 ways to reduce our personal climate change
impact, Britons are most likely to identify less packaging (61%) and buying
fewer or more durable items (50%), placing 38th and 46th respectively2.
The measures identified that are included in the real top 30, as
identified in “Quantifying the potential for climate change mitigation of
consumption options”, include:
While there has been much conversation about internal displacement
over recent years, few Britons recognise the impact climate change has on the
movement of people. Four in ten (39%) believe conflict causes the majority of
internal displacements while only a third (32%) are correct in saying climate
change/ weather is the bigger cause. According to the GRID 2020 Mid-Year
Update, in the first 6 months of 2020 9.8m of the 14.6m cases of new internal
displacements had been caused by change in climate or weather3. Britons’ perceptions of global warming are also imprecise, only 4%
correctly say that all 6 years since 2015 have been the hottest year on
record, 61% simply don’t know. When looking at the effects of diets on the environment, the majority
of Britons (62%) believe eating a locally sourced diet, including meat and
dairy products, is better than a vegetarian one with some imported products.
Only 1 in 5 (18%) correctly believe it is the other way around4. Kelly Beaver, Managing Director of Public
Affairs at Ipsos MORI, said: The public
seem to have got the message when it comes to the importance of recycling,
the reality is that the actions that need to be taken require significantly
bigger sacrifices. The issue of the environmental crisis is familiar to
people around the world, but people remain confused about what actions are
most likely to have a significant effect on their carbon footprint. (Ipsos MORI) 17 April 2021 Source: https://www.ipsos.com/ipsos-mori/en-uk/ipsos-perils-of-perception-2021-climate-change 686-43-11/Poll 57% Of French People At Risk Say They Are More At Risk Than The
Average Of The General Population Of Contracting Covid-19
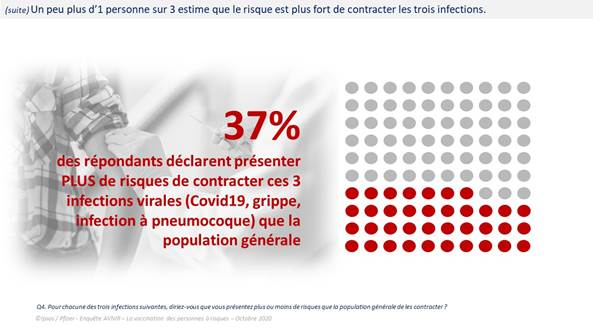
Fewer than 4 in 10 respondents (37%)
consider themselves more at risk of contracting Covid-19, influenza and a
pneumococcal infection at the same time than the general
population. This is a proportion which highlights a contrasting
perception of risk among the chronically ill patients questioned. In
detail, 57% of people at risk say they are more at risk than the average of
the general population of contracting Covid-19. The most recent
infection, this is the one that people at risk think they have the most risk
of contracting, ahead of the flu (54%) and pneumococcal infections (47%). However, a significant proportion of people at risk say that the
consequences of these infections would be more serious for them than the
average of the general population, especially with regard to Covid-19 (54%
"much more serious" and 27% "a slightly more serious ”) and
pneumococcal infections (44% and 32% respectively), significantly less for
influenza (36% and 38% respectively). Age is a determining variable in
the perception of risk for the three infections: 43% of those 35 and under
declare that contracting covid-19 would have more serious consequences for
them than for the average of the general population, a lower score. to all
respondents, the same for pneumococcal infections (35%) and influenza (28%).
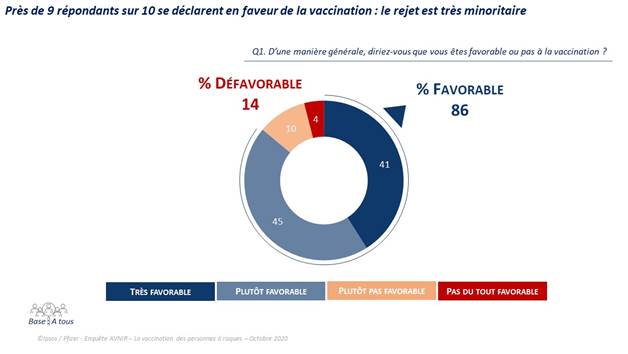
Despite a very strong adherence to
vaccination, the margins for progress are real to achieve even greater
vaccination coverage in these people at risk. While mistrust of vaccines is relatively strong within French society
according to some studies [2] , people at risk say they are mostly in favor of
vaccination (86% are "very favorable" (41%) or
“Somewhat favorable” (45%).). Several areas for improvement can be identified to increase
vaccination coverage rates:
Influenza and pneumococcal infections:
course, variable brakes and levers. Regarding influenza vaccination, although the trend is improving
compared to 2016, vaccination coverage is still not optimal compared to the
recommendations: three quarters of people at risk questioned declared that
they had been recommended influenza vaccination (75%, + 12% compared to
2016). Almost two-thirds of them say they were vaccinated last winter
(2019/2020) (63%, + 11% compared to 2016). Although a large majority of people at risk say they know
pneumococcal infections (88%), less
than two in five say they know exactly what it is (36%). This
ignorance is even stronger among those 35 and under: more than a quarter of
them have never heard of it (26%). In this context, many people at risk say they do not know where they
stand in monitoring their vaccination against pneumococcal infections:
only 41% of people at risk are sure of
being vaccinated against this infection, 43 % express doubts
and 16% who know “surely” that they are not up to date for this vaccine. Concerning those vaccinated for influenza, the doctors who follow
these people at risk were on the front line to recommend that they be
vaccinated (67% of them received the information from their specialist or
general practitioner), the voucher of vaccination was also a strong incentive
(37%). However, if the general practitioner is still largely at the
origin of the discussion on the vaccine, he vaccinates in only 31% of
cases. Nurses (29%) and pharmacists (21%) appear today as important
links in the vaccination chain. There are less contrasts for pneumococcal infections: in the vast
majority of cases (87%), it is the doctors who suggest vaccination against
pneumococcal infections: general practitioners and specialists
equally. On the other hand, the vaccine is administered in 55% of cases
by the general practitioner in front of the nurse (at 20%). The reasons given by people at risk for not getting vaccinated differ
markedly between influenza and pneumococcal infections. There are many reasons for the flu. The fear of side effects is at the top (31% of
citations) and ahead of other justifications that attest to gaps in information such as doubts about
the effectiveness of the vaccine (26%). It should also be noted that a
not insignificant proportion declares not to have been offered it
(23%), a reason which is much more
highlighted by those who have not been vaccinated against pneumococcal
infections (64%) , which makes it the first brake for this
vaccination. For this type of infection, the fear of adverse effects
linked to vaccines is less (21%). What levers, what avenues to dig to
increase vaccination coverage against these viral infections? In view of the results of the survey, several avenues seem to be emerging
to achieve the objectives of greater vaccination coverage: 1 - The vaccination voucher Although it does not concern everyone, the health insurance
vaccination voucher helps a large proportion of those who receive it to
activate the act of being vaccinated. 37% of people at risk who have
been vaccinated against the flu say they thought about it thanks to the
voucher, a proportion that increases with age (48% among those over 65). 88% of respondents would be in favor of health insurance using the
sending of this voucher to attach information on pneumococcal vaccination, at
the same time as the voucher for the coverage of the flu vaccine. 2 - Personalized information Even if they consider access to information rather easy, many people at risk are likely to expect more
precise information , in particular as regards the vaccines
recommended according to their state of health or their treatments (79%),
diseases against which these recommended vaccines protect (65%), the reasons
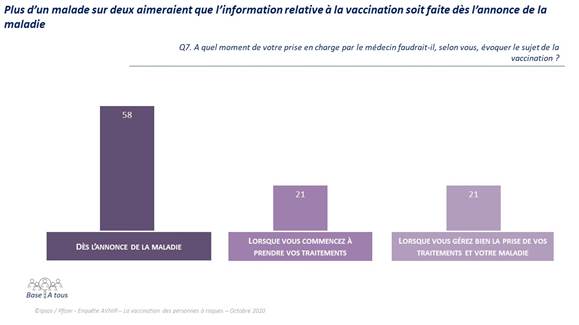
why they should be vaccinated (59%) or the best time to be vaccinated (57%). In addition, the vast majority of people at
risk would like to be informed about vaccination from the start of their care
path: 58% would like the subject of vaccination
to be mentioned as soon as the disease is announced and 21% at the start. of
taking their treatment. As for the sources of information, the general practitioner (86%) as
well as the specialist (66%), the first prescribers of vaccination, are those
in which the chronically ill have the most confidence to obtain
information. Apart from healthcare professionals, patient associations
(16%) and public authorities (16%) are those in which they have the most
confidence.
3 - Convince by setting an example in terms
of vaccination Setting an example could also be a lever
for encouraging vaccination (whether against influenza or pneumococcal
infections) for the majority of people at risk: 72%
of them would be encouraged to be vaccinated if their doctor was himself
vaccinated and 69% if their close entourage was vaccinated. 4 - Strengthen the role of the actors in
charge of the patient's vaccination course: doctors but also pharmacists The role and preponderant place of health professionals (whether
general practitioners or specialists) in the vaccination course of patients
seems undeniable. Whether for the flu or pneumococcal infections, general practitioners
or specialists are on the front line. They
are the ones most often at the origin of the recommendation for vaccination (67%
in the case of influenza, 87% in that of pneumococcus). The general
practitioner, however, remains the most in demand. It is most often the
one who follows the vaccination course of patients (71%), who vaccinates
against pneumococcus (55%) or against influenza (31%). However, and this last figure attests to it, the rise of new players
(in the case of influenza vaccination) suggests that there are other possible
vaccination circuits that patients seem ready to activate. Thus now 29%
of those questioned state that they have been vaccinated against influenza by
a nurse and 21% by a pharmacist. 33% of people at risk also state that
they trust the latter to obtain information on vaccination, thus placing him
in third position in the hierarchy of actors likely to make patients at risk
aware of the need for vaccination. vaccinate. However, if he vaccinates
and if he has the confidence of a significant part of the patients to do so, 5 - The preponderant role of patient
associations The results of the survey mentioned above show that people who are
members of patient associations say they are more informed than others on the
subject of vaccination. Thus people close to an associative network are
more aware of the consequences for them of contracting a viral infection,
they also seem more "up to date" with regard to their vaccination
schedule. The role of patient associations therefore appears essential,
moreover in the current context. The Covid-19 epidemic, a crisis that has
the impact of reminding people at risk of the importance of vaccination In the context of the Covid-19 epidemic,
nearly two thirds of people at risk questioned are now convinced of the value
of taking all the vaccines recommended to them (62%). However,
even if overall this intention is the majority, those who are most resistant
to vaccination remain a target against which awareness-raising efforts should
continue to be carried out. People who in principle declare themselves
unfavorable to vaccination continue to be so in the context of
Covid-19. Only 15% of them, faced with the virulence of the crisis,
could be convinced by the need for them to be vaccinated for the vaccines
recommended to them. (Ipsos France) April 13, 2021 NORTH
AMERICA
686-43-12/Poll One-Third Of Asian Americans Fear Threats, Physical Attacks And Most
Say Violence Against Them Is Rising
Amid widespread reports of discrimination and violence against
Asian Americans during the coronavirus
outbreak, 32% of Asian adults say they have feared someone might threaten
or physically attack them – a greater share than other racial or ethnic
groups. The vast majority of Asian adults (81%) also say violence against
them is increasing, far surpassing the share of all U.S. adults (56%) who say
the same, according to a new Pew Research Center survey.
The new survey was conducted April 5 to 11, after the fatal
shooting of six Asian women and two other people in the Atlanta area
on March 16 and assaults
on Asian Americans that occurred that same month (Asian adults were
interviewed in English only). President Joe Biden spoke
out against anti-Asian discrimination and violence a few days after
the shooting. Overall, 45% of Asian adults say they have experienced at least one
of five specific offensive incidents since the start of the coronavirus
outbreak. At the same time, 32% say someone has expressed support for them
since the start of the pandemic. Some 27% say people acted as if they were uncomfortable around them,
down from 39% who said the same in June 2020. Another 27% say they have been
subject to slurs or jokes, the same share as in 2020. Meanwhile, lower shares
say someone has made a remark that they should go back to their home country
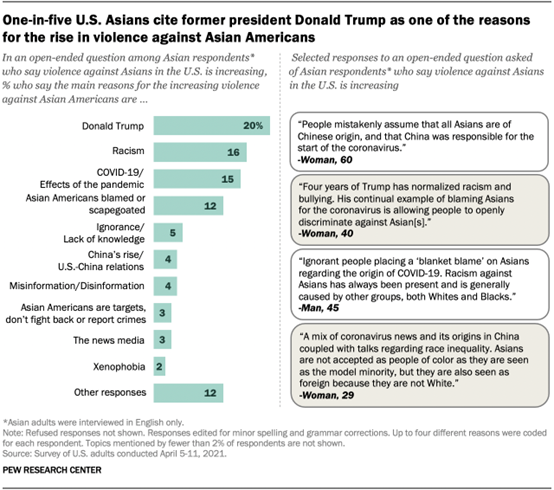
(16%) or that they are to blame for the coronavirus outbreak (14%). Asian respondents who say violence against their group in the U.S. is
increasing give many reasons for the rise, according to an open-ended
question in which people responded in their own words. Some 20% directly
cited former President Donald Trump and his rhetoric about China as the
source of the pandemic, his racist comments or his labeling the coronavirus
as the “kung flu” or “Chinese flu” as one of the reasons for the rise in
violence. Some 16% cited racism in the United States against Asian people as
the source of violence, and another 15% said the rise in violence is due to
COVID-19 and its impacts on the nation. An additional 12% said scapegoating
and blaming Asian people for the pandemic has been responsible for the rise
in violence against the U.S. Asian population. About three-in-ten Asian
respondents who say violence against their group in the U.S. is increasing
(29%) did not provide an answer to the open-ended question. Some cited several reasons together for the rise in violence against
Asian people in the U.S. One respondent said, “Four years of Trump has
normalized racism and bullying. His continual example of blaming Asians for
the coronavirus is allowing people to openly discriminate against Asian[s].”
Another respondent mentioned that “they are blaming Asians for the
coronavirus pandemic, thinking they bring this to our country.” And a third
respondent cited “a mix of coronavirus news and its origins in China coupled
with talks regarding racial inequality. Asians are not accepted as people of
color as they are seen as the model minority, but also are seen as foreign
because they are not White.”
The nation’s Asian population recorded the fastest
growth rate among all racial and ethnic groups in the United States
between 2000 and 2019. Asian Americans are also the fastest
growing racial or ethnic group in the U.S. electorate. Numbering
more than 20 million, the Asian population in the United States is a
diverse group, with origins from more than 20 countries in East and
Southeast Asia and the Indian subcontinent. Experiences with discrimination among Asian adults were widely
reported before the pandemic. About three-in-four Asian Americans (73%) say
they have personally experienced discrimination or been treated unfairly
because of their race or ethnicity, according to the April 2021 Pew Research
Center survey. This share is unchanged from June 2020 and is about the same
as prior to the pandemic, when 76% of Asian adults in February 2019 said they
had personally experienced discrimination or unfair treatment because of
their race or ethnicity.
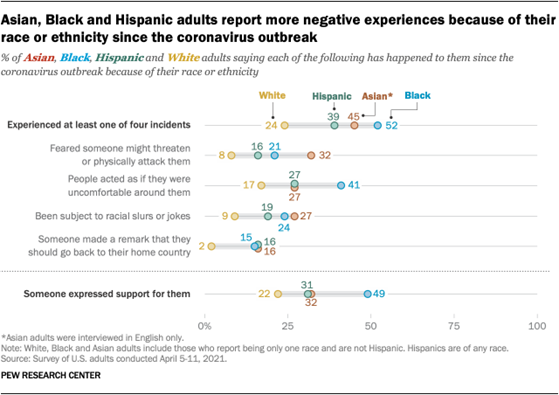
The April survey also found that Asian adults are more likely to
express fear over discrimination than other groups. About a third (32%) say
they fear someone might threaten or physically attack them, a greater share
than among Black adults (21%), Hispanic adults (16%) or White adults (8%). Asian Americans are about as likely as Black adults to say they have
been subject to slurs or jokes since the start of the pandemic (27% and 24%,
respectively), and more Asian adults say this than Hispanic (19%) and White
(9%) adults. By contrast, about four-in-ten Black adults (41%) say people
have acted uncomfortable around them since the start of the COVID-19
outbreak, a greater share than Asian (27%), Hispanic (27%) and White (17%)
adults who report the same.
Similar shares of Asian (16%), Black (15%) and Hispanic (16%) adults
say someone has remarked that they should go back to their home country since
the start of the pandemic. Just 2% of White adults say this has happened to
them. While about one-third (32%) of Asian adults say someone has expressed
support for them because of their race or ethnicity since the pandemic began,
a higher share (49%) of Black adults say this. Since the start of the outbreak, 52% of Black adults, 45% of Asian
adults and 39% of Hispanic adults report experiencing at least one of the
four incidents asked about in the survey. By comparison, 24% of White adults
report the same. An early 2021 Pew Research Center survey found a
majority (71%) of U.S. adults see a lot or some discrimination
against Asian people, a share similar to the public’s assessments for Black
people and Hispanic people. And at the beginning of Biden’s presidency,
another Center survey found a majority of Asian Americans did not feel like
they would gain
influence in Washington with the new president. (PEW) APRIL 21, 2021 686-43-13/Poll The Labor Market For Women Had Fallen As
Low As 54.4% In April 2020, And The Rate For Men Had Dipped To 65.9%
The coronavirus
outbreak that began in February 2020 sent shock waves through the
U.S. labor market, pushing the unemployment rate to near
record highs and causing millions to leave the workforce. A
year later, a full recovery for the labor market appears distant.
Employment in
February 2021 was 8.5 million less than in February 2020, a loss
that could take more than three years to recoup assuming job
creation proceeds at roughly the same monthly rate as it did from
2018 to 2019. But a faster recovery is possible if the job gains seen in
March 2021 are sustained in the coming months. As it rippled through the economy, the COVID-19 downturn affected
some Americans more than others. Unemployment climbed more
sharply among women than men, a reversal from the trend in the Great
Recession. Young adults, those with less education, Hispanic women and
immigrants also experienced
greater job losses. Unpartnered mothers saw a bigger drop in the
share at work than other parents, and low-wage workers saw a
particularly sharp
decrease in employment. Here are six facts about how the COVID-19 recession is affecting
labor force participation and unemployment among American workers a year
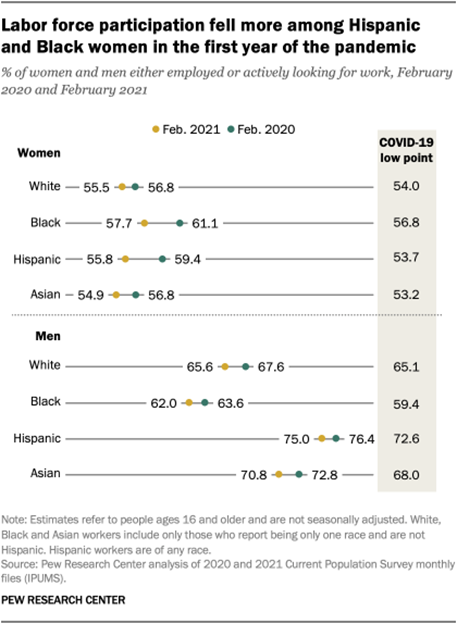
after its onset. More women than men quit the labor force in
the first year of the COVID-19 recession. From
February 2020 to February 2021, a net 2.4 million women and 1.8 million men
left the labor force – neither working nor actively looking for work –
representing drops of 3.1% and 2.1%, respectively. Women accounted for a
majority of the decrease in the labor force in the first year of the downturn
even though they make up less than half of
the U.S. workforce.
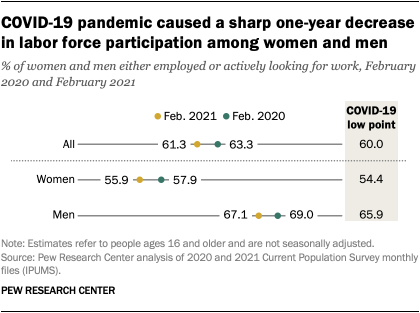
Looked at another way, the shares of women and men (ages 16 and
older) participating in the labor force – at work or actively looking for
work – have fallen notably during the pandemic. For women, the labor force
participation rate in February 2021 was 55.9%, compared with 57.9% a year
earlier. For men, the rate fell from 69.0% to 67.1% over this period. The
decrease in the labor force participation rate for workers overall – from
63.3% to 61.3% – exceeds that seen in the Great Recession and ranks among
the largest
12-month declines in the post-World War II era, according to Bureau
of Labor Statistics data. Although lower than a year ago, the labor force participation rate
has risen in recent months. The rate for women had fallen as low as 54.4% in
April 2020, and the rate for men had dipped to 65.9% in the same month. Since
then, the recovery appears to have been somewhat sharper for women. The changes in labor force participation in the COVID-19 downturn
stand in sharp contrast to the Great Recession, when men were more deeply
affected. From December 2007 to December 2009, the number of women who left
the labor force (84,000) was modest in comparison with the number of men who
did the same (929,000). Also, the labor force participation rate for women
decreased by 1 percentage point over this period of the Great Recession,
compared with 2 points for men. The key difference between the two recessions is that job losses in the pandemic have
been concentrated in service sectors in which women account for the majority
of employment, such as leisure and hospitality and education and health
services. More typically, job losses in recessions,
including the
Great Recession, have centered around goods-producing sectors, such as
manufacturing and construction, in which men account for the greater share of
employment. Hispanic and Black women accounted for much
of the decrease in labor force participation among women. The
net 2.4 million women who left the labor force from February 2020 to February
2021 included 582,000 Hispanic women and 511,000 Black women. Collectively,
Hispanic and Black women accounted for 46% of the total decrease among women
but represent less than one-third of the female labor force in the U.S.
This was also reflected in the changes in the labor force
participation rates. From February 2020 to February 2021, the decrease in the
rate among Hispanic and Black women was 3.6 and 3.4 percentage points,
respectively. For Asian women it was 1.9 points, while for White women it was
1.3 points. One reason Hispanic women may have been more likely to leave the
labor force is that they have a greater
presence than other women or men in the leisure and hospitality
sector. This sector has shed
more jobs than any other sector in the economy from February 2020 to
February 2021. Pandemic-driven pressures
on parents may also have affected Hispanic,
Black and Asian women more than White women. Compared with other women with
children at home, Hispanic and Black women are more
likely to be unpartnered parents. There is little difference in how the labor force participation rate
changed among White, Black, Hispanic and Asian men. White and Asian men
experienced a similar drop in the labor force participation rate as White and
Asian women – about 2 percentage points or less. But the decrease in the rate
among Black and Hispanic men – roughly 1.5 points each – appears to have been
less than the decrease among Black and Hispanic women, about 3.5 points each. The decrease in labor force participation
suggests that the official unemployment rate understates the share of
Americans who are out of work. Workers who left
the labor force during the pandemic are not counted among the unemployed,
as per usual practice.
As the economy improves, many of these workers may reenter the labor market,
adding to the number currently counted as unemployed and in want of work. For
that reason, Jerome Powell, chair of the Federal Reserve board of
governors, recently
suggested that those who left the labor force since February 2020
should be counted among the unemployed to gain a better understanding of the
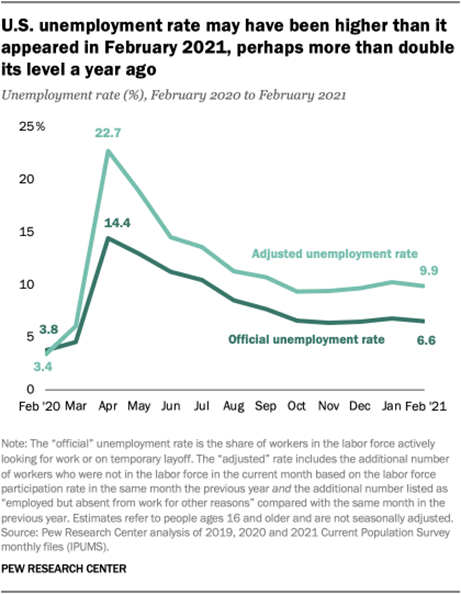
slump in the labor market. Adjusting the unemployment rate for labor force exits, and also
making a correction
for measurement challenges that have affected government surveys in
the pandemic, shows that the U.S. unemployment rate in February 2021 may have
been as high as 9.9%, instead of 6.6% as officially
reported.
The difference between the official and the adjusted unemployment
rates was highest in April 2020. In that month, the official rate stood at
14.4%, compared with an adjusted rate of 22.7%. The labor force participation
rate had dipped to 60.0% in April, the lowest rate recorded in 2020,
and measurement
issues also loomed large in the government surveys. Both the official and the adjusted unemployment rates have trended
downward since April 2020. However, a gap of about 3 percentage points has
persisted between the two measures since June 2020. It should be emphasized
that the adjusted rate assumes that all workers who left the labor force
during the pandemic will return in search of work in the near future.
Other researchers
have proposed that a more realistic unemployment rate may be closer
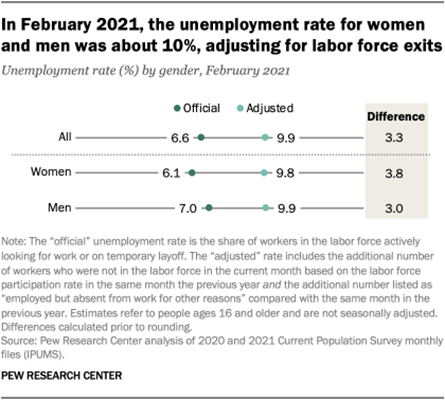
to 8% at the moment. After a sharper increase earlier in the
pandemic, the unemployment rate for women likely was on par with the rate for
men in February 2021. The initial wave of the
pandemic sent the unemployment rate for women soaring from 3.4% in February
2020 to 15.7% in April 2020, as officially reported. Men also experienced a
spike, but less so than women, as their unemployment rate increased from 4.1%
to 13.3% over this period.
By February 2021, the official unemployment rate for women (6.1%) had
fallen below the rate for men (7.0%), not seasonally adjusted. However, since
labor force participation fell more among women than men, the adjusted
unemployment rate for women (9.8%) was similar to the rate for men (9.9%) in
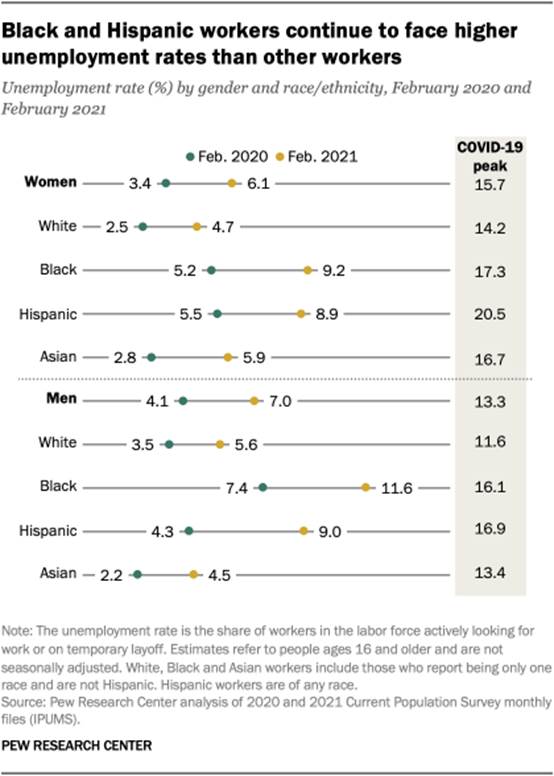
February 2021. Unemployment remained more elevated among
Black and Hispanic workers. Roughly one-in-ten
Black and Hispanic workers, women or men, were unemployed in February 2021,
based on the official unemployment rate. Black men (11.6%) were unemployed at
a higher rate than other men or women. By comparison, only about 6% of White
and Asian workers or fewer, women or men, were unemployed in February 2021.
As business operations ramped up more recently, the unemployment rate
decreased for all groups of workers. Among Black women, the unemployment rate
dropped from a peak of 17.3% in May 2020 to 9.2% in February 2021. Among
Black men, the rate fell from a high of 16.1% in June 2020 to 11.6% in
February 2021. White women saw a decrease in their unemployment rate from a peak of
14.2% in April 2020 to 4.7% in February 2021. Over the same period, White
men’s unemployment rate decreased from a peak of 11.6% to 5.6% in February
2021. Asian men and women also saw significant reductions from their peak
unemployment rates of roughly 9 or more percentage points each. In February
2021, Asian women had an unemployment rate of 5.9%, while the rate for Asian
men was 4.5%. In April 2020, Hispanic women had a peak unemployment rate of 20.5%,
while Hispanic men had an unemployment rate of 16.9%. But Hispanic women
(8.9%) and men (9.0%) had unemployment rates similar to each other in
February 2021. Despite recent improvements, unemployment rates for all major racial
and ethnic groups of workers were substantially higher in February 2021 than
in February 2020. For example, while the unemployment rate for White women
(4.7%) was lower than among other women, it was nearly double the rate they
experienced in February 2020. That was also the case among Asian women, whose
unemployment rate increased from 2.8% in February 2020 to 5.9% in February
2021. Workers in low-wage jobs experienced the
greatest drop in employment. From February 2020
to February 2021, employment among low-wage workers fell by 11.7%, from 28.1
million to 24.8 million. This compares with a loss of 5.4% among middle-wage
workers, whose employment fell by 5.5 million over the period. Meanwhile,
employment among high-wage workers was roughly unchanged, at slightly more
than 28 million.
The reason for this pattern is that the COVID-19 recession is
centered in the services sector, especially in the leisure and hospitality
industry, which has been hit
hardest in the pandemic and accounts for many of the low-wage jobs.
The trend in the current recession stands
in contrast with the Great Recession, which saw middle-wage
occupations shed jobs at a higher rate than other occupations. (PEW) APRIL 14, 2021 686-43-14/Poll 56% Say The Large Reduction Over The Past Several Decades In The
Percentage Of Workers Who Are Represented By Unions Has Been “Somewhat” Or
“Very” Bad For The Country
At a time when the labor movement in the United States has been
facing formidable challenges, majorities of Americans see the long-term
decline in the share of workers represented by unions as a bad thing for both
the country and working people in the U.S., according to a Pew Research
Center survey conducted April 5-11.
In the survey, 56% say the large reduction over the past several
decades in the percentage of workers who are represented by unions has been
“somewhat” or “very” bad for the country, while 60% say this has been bad for
working people. The survey was largely fielded before the vote by workers in
an Amazon
warehouse in Alabama against forming a union was tabulated and
reported. The share of U.S. workers who belong to a union has fallen since
1983, when 20%
of American workers were union members, though it
did rise slightly between 2019 and 2020, according to a separate Center
analysis. In 2020, 10.8% of U.S. workers were in a union. Views of the impact of the decline in union membership on the country
have changed very little since
2019 (the question about working people was not asked in 2019). While there are modest demographic differences in these attitudes,
the partisan differences are much more pronounced. Roughly three-quarters of Democrats and Democratic-leaning
independents say the decline in the percentage of workers represented by
unions in recent decades has been very or somewhat bad for the country (72%)
and for working people (76%). Among Republicans and GOP leaners, however, 40%
say the decline of organized labor membership has been bad for the country
and 42% say it has been bad for working people. Among Republicans, there are sizable age, educational and income
divides in views about the impact of the decline of union membership. The
differences among Democrats are more modest.
Older Republicans are more likely to view the decline in union
membership as good for
working people than are younger Republicans. Nearly two-thirds of Republicans
ages 65 and older (65%) say that the decline of unions has been either very
good or somewhat good for working people. Roughly half of Republicans under
age 40 (47%) say the same. While two-thirds of Republicans with a college degree (66%) say the
decline of organized labor membership has been at least somewhat good for
working people, 51% without a college degree say the same. In addition,
upper-income Republicans are more likely than those in the middle- and
lower-income tiers to view the decline in union membership positively. Among Democrats, those without a college degree are 10 percentage
points more likely than those with a college degree to say that these changes
have been at least somewhat good for working people. There are only modest
differences among Democrats by age and income. A majority of White Republicans (57%) say that the decline of union
membership has been at least somewhat good for working people. White
Democrats (16%) are slightly less likely to say this than Black or Hispanic
Democrats (27% each). The sample size for Black and Hispanic Republicans is
too small to analyze. While Republicans and Democrats overall differ greatly on whether
these shifts have been good for working people, ideological divides are
evident within both parties. A majority of conservative Republicans (64%) say the decline in
organized labor membership has been good for working people, including 28%
who say this has been very good.
In contrast, 43% of moderate and liberal Republicans say this has been at
least somewhat good for working people.
While large majorities of all Democrats say the decline in the
percentage of workers represented by unions has been bad for working people, liberal
Democrats (82%) are more likely to say this than conservative and moderate
Democrats (72%). Liberal Democrats are also much more likely to say the decline in
organized labor membership has been very bad for working people: 44% say
this, compared with 24% of conservative and moderate Democrats. (PEW) APRIL 15, 2021 686-43-15/Poll Over Three-Quarters (78%) Canadians Agree (22% Strongly/56% Somewhat)
Military Has Systemic Problem Of Sexual Harassment
Toronto, ON, April 13, 2021 – While
Canadians may be shocked to hear the details of allegations of sexual
misconduct against some high-ranking officials of the country’s military
forces, it seems that a majority may not necessarily be surprised. A recent
Ipsos poll conducted on behalf of Global News has found that more than
three-quarters of Canadians believe that the country’s military has a
systemic problem of sexual harassment and that these underlying issues still
need to be addressed by both the federal government and military leaders in a
meaningful way. Nearly 8 in 10 (78%) agree (22% strongly/56% somewhat) that
the country’s military has a systemic problem of sexual harassment, including
its senior leaders. Women are more likely to agree with this statement (83%),
though men are not far behind (72%) in acknowledging this issue. The recent vote to shut down a defence committee probe into
allegations of high-level misconduct in the nation’s military may not help
change the perception that the federal government and military leaders are
‘all talk and no action’ when it comes to dealing with sexual harassment. As
it stands, three-quarters (75%) agree (24% strongly/50% somewhat) with this
statement. No gender or age group is more likely than another to believe that
this problem is not being adequately addressed, speaking to how widespread
this sentiment is among the general population. Finally, Canadians largely believe that those in power could still do
more to address this troubling issue. Just over four in ten (42%) agree that
the federal government has done its best to change the culture in the
Canadian Forces, with only 6% saying they ‘strongly agree’, leaving the
remaining 37% saying that they ‘somewhat agree’. While there are no major
difference by gender or age, there is a political difference; those who say
they intend to vote Liberal in the next federal election are more likely to
cut Trudeau and the Liberals some slack; over half (55%) of Liberal voters
agree that the federal government has done its best. (Ipsos Canada) 13 April 2021 686-43-16/Poll Covid-19 (38%), Healthcare (32%), The Economy (26%), And
Affordability (22%) Top Issues In Next Election
Toronto, ON, April 18, 2021 – COVID-19
(38%), healthcare (32%), the economy (26%) and affordability/cost of living
(22%) are atop the list of issues that Canadians say are most important in
determining how they will vote during the next election, according to a new
Ipsos poll conducted on behalf of Global News. Not far behind are issues
relating to housing (affordability and availability) (17%), taxation (17%),
climate change (17%), unemployment and jobs (15%), poverty and social
inequality (14%), government deficit/debt (13%) and senior’s issues/aging
population (9%). Canadians were presented with a list of 29 possible priority issue
areas and asked to identify the three which will drive their personal vote
choice. The full list of issues, and the proportion of Canadians who selected
each as being among their top-three issues, is below. Top Issues Driving Vote Choice: All
Canadians
The list is a little bit different depending on which segment of the
electorate is responding. Liberal voters prioritize COVID-19 and are more
likely to think climate change is a top issue. Conservatives prioritize
economy and taxation more than supporters of other parties. Healthcare is the
top issue among NDP voters, while Bloc voters are laser focused on COVID-19
and housing affordability and availability. Supporters of the Green party are
concerned about affordability, climate change, and healthcare. The battle is already afoot for the 12% of Canadians who say they are
undecided. COVID-19 (45%) and healthcare (39%) are their top issues. Rounding
out the top-five issues for undecided voters are affordability issues (27%),
housing affordability and availability specifically (19%), and the economy
(16%). Top Issues Driving Vote Choice: By Intended
Vote
The top issues of the campaign also differ significantly by gender
and by age segment. Men and those aged 35-54 place a higher degree of
importance on COVID-19, while women and Boomers are more likely to cite
healthcare more generally as a top priority. Concerns about the economy
prevail among men and those aged 35-54, while women are more likely than men
to say that affordability is an issue which drives their vote. Concern about unemployment and jobs is higher among those aged 18-34
and 35-54, but the opposite is true when it comes to climate change. Those
aged 18-34 are least likely to mention it as being among their top issue,
while Boomers are most likely to say this is the case. Top Issues Driving Vote Choice: By Age and
Gender
Who is Best to Lead on Most-Important
Issues? The key to winning an election is to lead on the big issues. On the
two most important issues, the Liberals have a 23-point lead over the
Conservatives on COVID-19, and a 19-point lead over the NDP on healthcare.
For voters who are more aligned with a progressive agenda the Liberal Party
is their preferred choice. This is a significant problem for the NDP and
Greens who trail the LPC significantly on every progressive issue, including
the marquee issue for the Green Party: climate change. Conversely, the
Conservatives are the best choice for voters concerned about economic issues,
especially taxation and jobs. % of Canadians who Believe Party is Best to
Deal with Each Issue (among those who identify the issue as a
priority)
(Ipsos Canada) 18 April 2021 Source: https://www.ipsos.com/en-ca/news-polls/COVID-19-Healthcare-Economy-Affordability AUSTRALIA
686-43-17/Poll At 94% Of Pre-Covid Levels Movement In Adelaide Was The Highest Level
Since Mid-March 2020 Before The Strictest Lockdown Measures Were Implemented
In the week to April 11 movement levels in the Adelaide CBD were
almost back to pre-COVID times. At 94% of pre-COVID levels movement in
Adelaide was the highest level since mid-March 2020 before the strictest
lockdown measures were implemented. Although movement in the Melbourne CBD was at only 52% of pre-COVID
normal last week – lower than any other Capital City CBD – this was still the
highest level of movement for the southern capital for over a year since late
March 2020 as the first lockdown measures were being introduced. Movement in other Capital City CBDs also reached its highest in many
months as Australians return to the office as density limits are lifted and
vaccinations are rolled out across the community. The Sydney CBD movement levels were at 56% of pre-COVID normal last
week, the highest since July 2020, the Hobart CBD movement levels were at 75%
of normal – the highest since late August 2020 and the movement levels in the
Perth CBD were at 79% of normal matching the level last seen in early
December 2020 before the Northern Beaches outbreak in Sydney. The one exception is the Brisbane CBD in which movement levels were
at 67% of pre-COVID normal last week as the city was still recovering after
hitting a low of 30% of normal during the recent three-day lockdown of
Greater Brisbane. Restrictions including the mandatory wearing of masks
indoors in Queensland have continued until today (Thursday April 15, 2020). Australian Capital City CBDs average 7-day
movement levels March 2020 – April 2021:
Roy Morgan has partnered with leading technology innovator UberMedia
to aggregate data from tens of thousands of mobile devices to assess the
movements of Australians as we deal with the restrictions imposed in response
to the COVID-19 pandemic. The interactive dashboard available tracks
the movement data for those visiting the Capital City CBDs during 2020 and
2021, excluding the CBD residents of each city. Movement data from several
key locations around Australia is also available to view by using the
interactive dashboard. Michele Levine, CEO of Roy Morgan, says
more than a year after the COVID-19 pandemic began movement levels in
Australia’s Capital City CBDs are still well below pre-pandemic levels –
particularly in the largest cities of Sydney and Melbourne: “Movement levels in Australia’s Capital
City CBDs plunged over the Easter period as many Australians holidayed for
the first time since the COVID-19 pandemic began. However, the recovery in
movement levels after the Easter break sees many cities at multi-month highs
and the Melbourne CBD and Adelaide CBD now have their highest levels of
movement since the nation-wide lockdown was introduced in late March 2020. “Last week movement levels in the Adelaide
CBD were at 94% of pre-COVID averages, a record high for any Capital City CBD
since the pandemic began and on a sharp upward trajectory following the
Easter break. “Despite trailing other cities movement in
the Melbourne CBD was at 52% of pre-COVID levels in the week to Sunday April
11 – the first time movement in the southern capital has exceeded 50% since
the nation-wide lockdown was implemented. “The positive signs of increasing movement
in Australia’s Capital City CBDs were also evident in the Sydney CBD at 56%
of pre-COVID averages (highest since early July 2020), Hobart CBD at 75% of
pre-COVID averages (highest since late August 2020) and Perth CBD at 79% of
pre-COVID averages (highest since early December 2020). “The movement levels in the Brisbane CBD
had recovered to 67% of pre-COVID averages by the end of last week even as
the city deals with an ongoing mandate to wear masks indoors. The lockdown of
the Greater Brisbane area in late March saw movement levels plunge to a low
of only 30% of normal over the period leading up to Easter. “The recovery in movement levels in the
week after Easter is a positive sign for retailers in Capital City CBDs who
have been amongst the hardest hit by the COVID-19 related restrictions.
However the levels of movement in the Melbourne CBD and Sydney CBD in
particular remain well down on pre-COVID averages and present an ongoing
challenge for these businesses now that the JobKeeper wage subsidy payments
have ended. “A big issue set to face Australia’s cities
as workers return their city offices in higher numbers is the use of public
transport compared to the use of cars. Many commuters understandably regard
tightly packed public transport as a riskier way to travel to work in the era
of COVID-19 compared to the perceived safety of driving one’s self in and
avoiding close contact with others. “Roy Morgan’s public transport figures for 2020 show a big plunge in usage during the year as
people were locked down and working from home and only a slight recovery over
the last few months of the year as restrictions eased. The increased reliance
many now have for driving rather than catching public transport is likely to
lead to increasing problems of ‘gridlock’ on our roads – particularly in the
larger cities of Sydney and Melbourne.” (Roy Morgan) April 15 2021 686-43-18/Poll Inflation Expectations Increase To 3.8% In March – Higher For Women
(4.3%) Than Men (3.4%)
Inflation Expectations are now 0.9% points below their long-term
average of 4.7% but have increased by 0.6% points since reaching a record low
of only 3.2% in August 2020. Women’s Inflation Expectations are now at 4.3%, up by 0.5% points
since the low-point in August 2020, and remain far higher than men’s at 3.4%
which are up by 0.8% points during the same period. The Inflation Expectations of women are significantly higher than men
across the age spectrum with the largest gap of 1.5% points for people aged
50-64: Women 4.8% cf. men 3.3%. The lowest Inflation Expectations among women are for those aged
18-24 at 3.9%, but this is still higher than any age cohort of men. From
there women’s Inflation Expectations increase with age and peak for people aged
50-64 at 4.8% before dropping to 4.2% for those aged 65+. Young men aged 18-24 also have the lowest Inflation Expectations for
men at only 3.0%, but those slightly older aged 25-34 have the highest at
3.6%. There is little difference in Inflation Expectations for men aged 35-49
(3.4%), 50-64 (3.3%) or 65+ (3.3%) – but they are all far lower than women in
the same age brackets. Inflation Expectations by Gender & Age:
March 2021
Inflation Expectations are again highest in
Tasmania and are now lowest in South Australia On a State-based level Inflation Expectations are highest in Tasmania
at 4.6%, an increase of 1.2% points since the low-point of August 2020.
Tasmanians go to the polls in three weeks for a State Election called by
Premier Peter Gutwein nearly a year earlier than was expected. Inflation Expectations in Queensland are also significantly higher
than the national average at 4.3% (up 0.9% points since August 2020) and are
4% (up 1.3% points) in Western Australia. There has been less movement in other States since the low-point in
August 2020 with Inflation Expectations now at 3.8% (up 0.6% points) in
Victoria and 3.6% (up 0.3% points) in New South Wales. South Australia has the lowest Inflation Expectations at 3.3%, up by
only 0.1% points since August 2020. As well as increasing Inflation Expectations the ANZ-Roy
Morgan Consumer Confidence Rating has continued to recover and was at 110.9
for the month of March 2021, an increase of 21.8pts (+24.5%) since August
2020. Consumer Confidence for March was the highest monthly figure for the
rating since the month of November 2019 (111.2) more than a year ago. Inflation Expectations Index long-term
trend – Expected Annual Inflation in next 2 years
See below for a comprehensive list of RBA interest rate changes
during the time-period charted above. “Inflation Expectations continued their
upward trajectory in March 2021, up by 0.1% points to 3.8% and are now up
0.6% points over the last seven months since reaching a low of 3.2% in August
2020. “This is the most sustained trend of
increasing Inflation Expectations for over a decade since the index increased
from 5.5% in June 2010 to 6.6% in January 2011 - an increase of 1.1% points
over a seven month period during the height of the mining boom. “There continues to be a considerable
‘gender gap’ between women and men when it comes to their expectations of
price increases over the next two years with women expecting annual inflation
of 4.3% per year compared to only 3.4% for men. “This gap is apparent across all age groups
though is largest for people aged 50-64. Women in this age group expect
annual inflation of 4.8% over the next two years – significantly higher than
any other age group compared to only 3.3% for men of the same age – a gap of
1.5% points. “The smallest gap between the two genders
is 0.5% points and is for younger people aged 25-34. Women of this age expect
annual inflation of 4.1% over the next two years compared to 3.6% for
similarly aged men. “The persistent ‘gender gap’ on Inflation
Expectations shows how the two largest segments of the population – men and
women – are experiencing the current economy in a significantly different
way. Women, who are more likely to be grocery shoppers and visiting the local
supermarkets on a frequent basis, can see prices rising at faster rate than
men who tend to be less likely to have this day-to-day interaction with fast
moving consumer goods. “There are many other prices to keep an eye
on when assessing economy-wide inflation such as the prices of services such
as housing prices, gas, electricity, internet, health-care, insurance,
schooling, transport, clothes and entertainment but many of these types of
goods and services are bought on a far more infrequent basis than the weekly
grocery spend. “One factor that is also important to note
is that Inflation Expectations for both genders have increased significantly
since the low-point of August 2020 and men’s Inflation Expectations have
actually increased faster over the last seven months. “Since hitting a low of only 2.6% in August
2020 men’s Inflation Expectations have increased by 0.8% points to 3.4% while
women’s Inflation Expectations are up by 0.5% points to 4.3% meaning the gap
between the two has narrowed. “The largest Government stimulus packages
such as the $100 billion JobKeeper wage subsidy have now ended and the
trajectory of Inflation Expectations can act as a pointer towards the health
of the Australian economy on a weekly and monthly basis. Inflation
Expectations averaged 4% in 2019 (pre-pandemic) and 4.3% from 2015-2018 and
at this stage still remain significantly below these levels.” The data for the Inflation Expectations series is drawn from the Roy
Morgan Single Source which has interviewed an average of 5,997 Australians
aged 14+ per month over the last decade from April 2010 – March 2021 and
includes interviews with 5,997 Australians aged 14+ in March 2021. The questions used to calculate the Monthly
Roy Morgan Inflation Expectations Index. 1) Prices: “During the next 2 years, do you think that
prices in general will go up, or go down, or stay where they are now?”
The Roy Morgan Inflation Expectations Index is a forward looking
indicator unlike the Consumer Price Index (CPI) and is based on continuous
(weekly) measurement, and monthly reporting. The Roy Morgan Inflation
Expectations Index is current and relevant.
RBA interest rates changes
during the time period measured: 2010-2020. (Roy Morgan) April 12 2021 Source: https://www.roymorgan.com/findings/8677-australian-inflation-expectations-march-2021-202104120640 MULTICOUNTRY
STUDIES
686-43-19/Poll 59% Expect Being Able To Return To Something Like Their Normal
Pre-Covid Life Within The Next 12 Months
Washington, DC, April 12th, 2021
—A new Ipsos survey for the World Economic Forum
finds that, on average across 30 countries and markets surveyed, 59% expect
being able to return to something like their normal pre-COVID life within the
next 12 months, including 6% who think this is already the case, 9% who think
it will take no more than three months, 13% four to six months, and 32% seven
to 12 months (the median time). About one in five think it will take more
than three years (10%) or that it will never happen (8%). At a global level, expectations about how long it will take before one’s
life can return to its pre-COVID normal and how long it will take for the
pandemic to be contained are nearly identical. These findings suggest that
people across the world consider that being able to return to “normal” life
is entirely dependent on containing the pandemic.
Similar to life returning to pre-COVID normal, 58% on average across
all markets surveyed expect the pandemic to be contained within the next
year, including 13% who think this is already the case or will happen within
3 months, 13% between four and six months and 32% between seven and 12 months
(the median time in most markets). Change in emotional and mental health since
beginning of the pandemic about a year ago On average across the 30 countries and markets surveyed, 45% of
adults say their emotional and mental health has gotten worse since the
beginning of the pandemic about a year ago, three times the proportion of
adults who say it has improved (16%) Change in emotional and mental health since
beginning of 2021 Adults who say their emotional and mental health has improved
outnumber those who say it has worsened by at least 40 percentage points in
China (51 points) and India (41 points). (Ipsos South Africa) 12 April 2021 686-43-20/Poll 4 In 10 French People Say They Have Suffered A Loss Of Income As A
Result Of The Crisis
The study conducted in 2019 by BNP Paribas Cardif identified two main
concerns of citizens: illness and loss of income . Unsurprisingly,
this level of concern has increased significantly with
the Covid-19 crisis: 76% of people surveyed around the world say they are
concerned about the disease (+5 points vs 2019) and 76% about the loss of
income (+ 4 points), significant increases in just two
years. Nevertheless, major disparities are observed depending on the
geographical areas. Before the health crisis, Latin
America already expressed the greatest feeling of vulnerability among
the three continents surveyed. This geographical area having
suffered strong impacts (number
of cases of Covid-19, increase in unemployment), fears concerning the disease (86%,
+8 points vs 2019) or the ability to
maintain income (87%, +5 points) have become stronger. In Asia ,
concerns about loss of income and serious illnesses have also increased significantly: 79% of respondents fear loss of income (vs.
72% in 2019). The share of the population concerned about the disease is
also up by 8 points (to 77%), in just two years. Relatively confident Europeans and notable
disparities in France The Covid-19 crisis seems to have little impact on the level of concern of Europeans . The
level of confidence is relatively
strong in the following countries: France, Belgium, United Kingdom, Germany, Sweden and
the Czech Republic , both on health (despite a sometimes heavy number of deaths
linked to Covid-19) and on subjects economic . This
trend can be explained by the supportive public policies carried out in these
countries, which have helped to contain the rise in unemployment and to
mitigate its consequences. Thus, in France, the list of subjects giving rise to concerns and the
intensity of these have changed little in 2 years. 60% or more of French
people mention 7 areas of concern: serious
illness (67%, +1 point vs 2019), loss of income (65%, -1
point), accident (65%,
+ 3 points) , death (64%
as in 2019), chronic disease (61%,
-1 point), hospitalization (60%,
+3 points) and loss of autonomy (60%,
-2 points). However, disparities appear according to the people
questioned. Thus, the youngest (18-24 years) particularly fear
unemployment (62% of young people against 50% on average) or loss of income
(70% of young people vs. 65% for all French people). Women also express
a high level of concern on several subjects: 69% of them fear loss of income
(vs 62% of men) and 68% of death (vs 59% of men). Paradoxically, the fears of the French who are increasing the most
are not linked to the health crisis and are in the second half of the
ranking: the theft and damage to cars are becoming a growing concern (52%, +6
points vs 2019) while fear of natural
disasters recorded the strongest increase: +8 points (48%) in
just two years. Thus, the pandemic also seems to act as an indicator of risk aversion in general . Significant financial repercussions At the global level, the scale of the crisis also has concrete
consequences on daily life and the ability to form projects . Three
quarters of respondents say they have suffered at least one economic consequence of
the pandemic: 59% have
experienced a loss of income and 44% have had to postpone or cancel a purchase plan . Unsurprisingly,
public support policies in the event of loss of income play a major role . Thus, the
effects of the crisis are less felt at the individual level in countries with developed social assistance systems . Latin America is
the hardest hit continent :
9 in 10 Latin Americans have suffered at least one financial consequence of
the pandemic. The loss of income resulted in the cancellation or
postponement of major purchases for 6-7 out of 10 people. Above all, a
significant portion of the population (30-40%, and even 54% in Colombia)
were, or waits to be, in trouble to pay his bills. In Asia ,
although unemployment rates remain low, the financial impact of the crisis is
real: India is the
country that has been hardest hit: 9
out of 10 people have seen their incomes drop , with
difficulties in pay their bills for half of them. In China , 87% of respondents experienced
loss of income. In Japan , South Korea or Taiwan , 60-75% of respondents have
faced a loss of income, and 30-40% have given up on major purchases, compared
to 62% in China and 71% in India. In Europe , a
large majority of respondents in Poland , Russia and Turkey had to delay or cancel their
purchases (77% of respondents in Russia, for example) and a significant
proportion of them encountered difficulties in honoring their invoices (41%
in Turkey, for example). In France ,
40% of respondents say they have suffered a loss of income as a result of the
crisis, most of the time due to a
temporary reduction in working time or wages . Few of
them (10%) report immediate difficulties in paying their bills. However,
the situation has an impact on the ability to make plans: nearly 4 in 10 French people (39%) have decided to postpone
or cancel major purchases . This phenomenon could have
serious long-term consequences since the
French anticipate a lasting crisis : more than half
(57%) of French people surveyed think that the unemployment rate will not
return to that before the Covid-19 crisis. before at least 3 years (vs 48% of
Europeans). A major impact on the ability to project
oneself The willingness to take risks, especially financial ones, is
necessarily affected and has repercussions
on behavior towards credit . Globally, the share of
borrowers experiencing repayment difficulties has increased, with particularly high levels in Latin America (58%) and
Asia (46%) . The current context is reorienting projects: worldwide, the
proportion of citizens willing to borrow for a real estate project has fallen
by 13 points (60% in 2021 compared to 73% in 2019). The intention
to take out a consumer loan has
also fallen sharply :
46% of respondents would use it to purchase a car ( -11 points vs. 2019) and 21% to
finance vacations ( -9 points vs.
2019). Conversely, a growing share of the population (44%, i.e. +4
points vs. 2019) is willing to use a
loan to finance medical care , especially in Latin America
with 65% of respondents ( +12 points vs.
2019 ). The financing of training Also
on the rise among borrowing motivations (37% vs. 33% in 2019). In France, the purchase of real estate remains the first motivation
to take out a loan, but only 58% of French people mention this project in
2021 ( -18 points vs
2019). Although the French remain more willing to take out a loan for
the purchase of a car than their European neighbors (51% compared to 46%),
this figure is down sharply ( -11 points compared
to 2019). The French also seem very
reluctant to take out a loan to start their own business :
less than a third (30%) would do so, a
drop of 12 points compared to 2019. A different need for protection depending
on the public support policies Paradoxically, in this period of crisis, the study reveals that
globally, respondents are slightly
more numerous than in 2019 to declare themselves “well protected” in the
event of unforeseen events (+3 points vs.
2019). Nonetheless, the demand for increased protection is significant
and aligned with awareness of the
risks . In Latin America ,
more people said they had protections than in 2019 (47%, +7 points vs.
2019). However, the populations express the need for increased coverage , in particular in the
event of serious illness, accident or hospitalization. This trend is
particularly strong in Colombia , Peru and Mexico . In Asia , the
feeling of being sufficiently protected varies from country to
country. It is particularly high in
India where nearly half of respondents (49%) consider themselves “very well
protected” , family solidarity being able to explain this
perception. The desire for better protection is major across the
continent, but the fields to prioritize vary greatly from one country to another. Europe is
aware that it benefits from developed public policies and protection
systems. The majority of the
population (67%) feel well protected , a figure on the rise
(+ 5 points vs
2019). However, only a minority of
Europeans feel “very well protected” (11%). More French people than in
2019 consider themselves well covered (75% in 2021 vs 68% in
2019). However, only 10% believe they are “very well”
protected. Here again, differences
appear according to the respondents: 27% of women do not feel
sufficiently protected compared to 23% of men. In addition, a
sensitivity to certain risks is emerging: 34% of French people want
more protection against loss of
autonomy (vs. 24% on average in Europe) and nearly a quarter
of respondents (23%) want better coverage against natural disasters (+4
points vs. 2019). Special attention paid to the risk of unemployment Globally, the risk of job loss deserves special attention as it
impacts the overall feeling of protection. Globally, unemployment is the third risk against which
populations would like more protection , after illness and
accident. Of course, the expressed needs vary from country to country,
depending on the level of unemployment and public policies on the subject. Thus, the countries of Latin
America are the
most demanding of increased protection against unemployment (57%
of respondents in Colombia, for example). While demand is a little less strong in Asia , this is the continent where
the need for protection against unemployment has increased the most: +9 points in just 2 years . In
Japan, 35% of respondents want better protection in the event of job loss
(+12 points compared to 2019). In Europe, the differences are quite marked, with countries in high
demand such as Spain (46%,
+9 points), the Czech Republic (44%,
+9 points) and Poland (43%,
+7 points) . Demand is weaker in France (26%) but it logically remains
stronger there than in Germany (19%). (Ipsos France) April 13, 2021 686-43-21/Poll An Average Of 59% Of Consumers Indicate That Their Shopping Habits
Have Changed As A Result Of The Pandemic
YouGovs International FMCG
report 2021: Consumer goods in a crisis is an
in-depth analysis of consumers' attitudes to grocery shopping in 17 global
markets. The White Paper is based on more than 18,000 interviews and
examines, based on a wide range of parameters, how the COVID-19 crisis has
affected the grocery sector worldwide. The report shows that the pandemic has caused
changes in purchasing habits globally - however, the degree varies greatly
from region to region.
An average of 59% of consumers indicate that their
shopping habits have changed as a result of the pandemic. Globally,
Mexico is the country where most people have changed their habits (83%),
followed by India (81%) and the United Arab Emirates (75%). In Europe, the figures are generally lower, but
more and more consumers answer that they have changed their shopping habits
than they have not. At the top of the scale, 60% of Britons and Swedes
state that they have changed their routines, while Denmark is at the bottom
with 44%. There are also marked differences between these two extremes. Germany and France - two major
neighboring economies in the EU - for example, have experienced almost the
same increase in the proportion of consumers who have changed their shopping
habits (47% and 46% respectively), while the proportion is significantly
higher in Spain (57%) and Italy (54 %). We spend more money on fruit and vegetables - and
less on cosmetics and care products Our data show that consumers have reacted
differently to different product categories during the corona
crisis. For example, consumption of fruit and vegetables has increased,
while consumption of cosmetics and care products has fallen.
In all 17 markets, barely four out of ten (38%)
answer that they eat more fresh fruit and vegetables, while only 6% eat less. At
the same time, the consumption of junk food has remained fairly stable: 27%
state that they buy more, while 28% buy less. Consumption of dairy
products has increased for 24% of consumers (decreased by 6%), while
consumption of pastries has also increased (22% compared with a decrease of
13%). Regarding alcohol consumption, a quarter (26%)
state that they have drunk more alcohol, while a fifth (20%) state that they
have drunk less. Cosmetics and care products are - perhaps not
surprisingly - the category that has been hardest hit during the
pandemic. One third (32%) therefore answer that they have spent less
money on cosmetics and care products during 2020. In addition to this, the consumption of dry goods
and canned food - e.g. canned pasta, rice and vegetables - increased for
30% of consumers globally. There has also been an increase in the
consumption of frozen goods - most in Hong Kong, where more than half (55%)
have bought more frozen goods, and least in Denmark, where only 9% apply. From
a European perspective, the consumption of frozen goods has increased most in
Spain (31%) and Italy (30%). (YouGov Norway) April 14, 2021 Source: https://yougov.no/news/2021/04/14/internasjonal-undersokelse-forbruk-i-en-krisetid/ 686-43-22/Poll The Impact Of The Pandemic On Food Consumption Habits
The COVID-19 health crisis has had a strong impact on the purchasing
habits of populations in the food sector. With the successive lockdowns,
many consumers have been tempted to go to stores to stock up on food and
drinks. There are also significant changes in the type of food
purchased, including an increase in demand for fresh fruits and vegetables,
dairy products and junk food. In a recent international study, YouGov analyzed the evolution of
food consumption habits of populations in 17 countries. This international report on the FMCG sector highlights the evolution of online shopping and
reveals the impact of the
pandemic on purchasing behavior . Evolution of the consumption of fresh
fruits and vegetables and dairy products Many consumers have reported snacking more regularly during the
pandemic and our junk food data accurately describes the extent of this
phenomenon. Consumption of this type of food has increased notably in
Australia, France, the United Kingdom and the United States, almost at the
same rate as the demand for fresh fruits and vegetables. (YouGov France) Source: https://fr.yougov.com/news/2021/04/15/impact-pandemie-habitudes-consommation-alimentaire/ 686-43-23/Poll A Global Market Average Of 7 In 10 (69%)
Agree That, “I Understand What Action I Need To Take To Play My Part In
Tackling Climate Change”
Despite high concern about climate change, and high confidence that
we know what to do in our own lives to combat it, misperceptions are rife,
and on the specifics many often just don’t know.
What do we think we know? A Global Market Average of 7 in 10 (69%) agree that, “I understand
what action I need to take to play my part in tackling climate change.”
Confidence is highest in Peru (85%), Colombia (83%), Mexico and Chile (both
82%) and lowest in Japan (40%) and Russia (41%).
Behavioural perceptions Looking at well-known ‘green’ actions, how does the public rank
potential greenhouse gas savings from each? When asked to identify from a
list the top three options that would most reduce the greenhouse gas
emissions of an individual living in one of the world’s richer markets,
people around the world were most likely to choose recycling as much as
possible (59%), buying energy from renewable sources (49%) and replacing a
typical car with an electric or hybrid vehicle (41%).
Impacts of climate change Climate change already displaces more people than conflict, according
to research. Globally, though, people underestimate the level of internal
displacement caused by climate change. Two in five (43%) believe conflict to be
the greater cause of internal displacement, while a third (32%) chose climate
and weather-related disasters. In reality, 9.8 million people were displaced
due to changes in weather or climate in the first 6 months of 2020, compared
with 4.8 million displaced by conflict.
Climate change and diet According to research, going to a plant-based diet makes more of a
difference to your carbon footprint than eating local, but the public guess
this is the other way around. Almost 6 in 10 people around the world (57%)
say eating a locally produced diet, including meat and dairy products, is a
better way to reduce an individual’s greenhouse gas emissions while only 20%
say eating a vegetarian diet with some imported products is more effective. (Ipsos Egypt) 17 April 2021 Source: https://www.ipsos.com/en-eg/ipsos-perils-perception-climate-change |
|||||||||||||||||||||||||||||||||||||||||||||||||||||||||||||||||||||||||||||||||||||||||||||||||||||||||||||||||||||||||||||||||||||||||||||||||||||||||||||||||||||||||||||||||||||||||||||||||||||||||||||||||||||||||||||||||||||||||||||||||||||||||||||||||||||||||||||||||||||||||||||||||||||||||||||||||||||||||||||||||||||||||||||||||||||||||||||||||||||||||||||||||||||||||||||||||||||||||||||||||||||||||||||||||||||||||||||||||||||||||||||||||||||||||||||||||||||||||