|
BUSINESS & POLITICS IN THE WORLD GLOBAL OPINION REPORT NO. 689-691-691 Week:
May 03 –May 23, 2021 Presentation:
May 28, 2021 Source:
http://www.asahi.com/ajw/articles/14346249 Japan’s
Population Of Children Under 15 Shrank By 190,000 From A Year Earlier 44
Percent Of Japanese People Are In Favor Of Revisions In Constitution Two
In Five (19%) Indians Have Shown Willingness To Buy Pre-Owned/Second-Hand
Cars New
Prime Minister Of South Korea Kim Bu-Gyeom "Conformity" 38% Vs
"Nonconformity" 26% Public
Verification Of Personnel Hearings, 'Morality' 76 Percent Vs 'Policy Ability
Only' 19 Percent 3
In 10 Pakistanis Concerned About Digitally Sharing Their Personal Information MENA
Advertiser Of The Month (April): Vimto 87
Percent Mauritians Think Social Media Makes People More Informed About
Current Affairs 63
Percent Gambians Get News From Television And 55 Percent Get From Social
Media Half
Of Tunisian Citizens 49 Percent Are In Favor Of Press Freedom Three
In Four (76%) Religious People Indicated A Likelihood To Donate To A
Charity One
In Eleven NHS Workers Plan To Leave Healthcare Sector After Pandemic 41%
Of 18-24 Year Olds Now Say Britain Should Have An Elected Head Of State Home
And EDC Are Real Estate Chains Get The Most Attention In Denmark Every
Third German Feels More Stressed In 2021 Than Before Corona, People With
Children Most Often Every
Second Cyclist Wears A Protective Helmet At Least Now And Then When Cycling 26
Percent Germans Praised The Government's Handling Of The Crisis In April 2021 A Quarter
Of 18-25 Years Old Say They Have Had Suicidal Thoughts Since The Start Of The
Crisis (27%) 9
May, Europe Day: The European Union In The Perception Of Italians 8
Out Of 10 Italians And Italians Agree: Excess Doses Of The Anti-Covid 19
Vaccine Must Be Shared Only
one in five Hungarians is vaccinated 70%
Of U.S. Social Media Users Never Or Rarely Post Or Share About Political,
Social Issues About
Six-In-Ten Americans Say Abortion Should Be Legal In All Or Most Cases Around
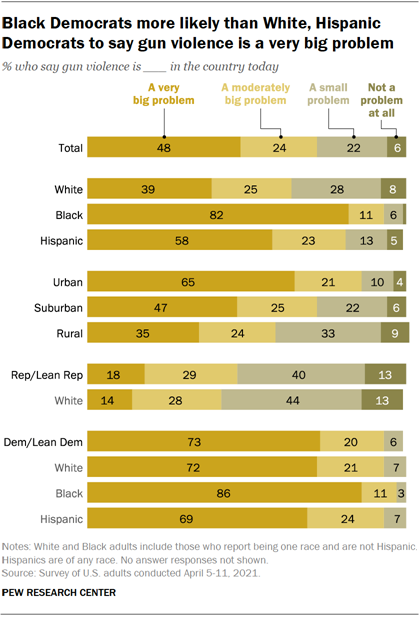
Half Of Americans (48%) See Gun Violence As A Very Big Problem In The Country
Today About
Four-In-Ten (41%) Americans Say News Organizations Are Growing In
Their Influence A
Third Of Large US Newspapers Experienced Layoffs In 2020, More Than In 2019 Liberals
(38%) in the Driver’s Seat over Conservatives (29%) as Vaccination Rollout
Hits its Stride New
Zealand Government Lead Over Opposition Down To 14% In April – Smallest Lead
Since January 2020 A
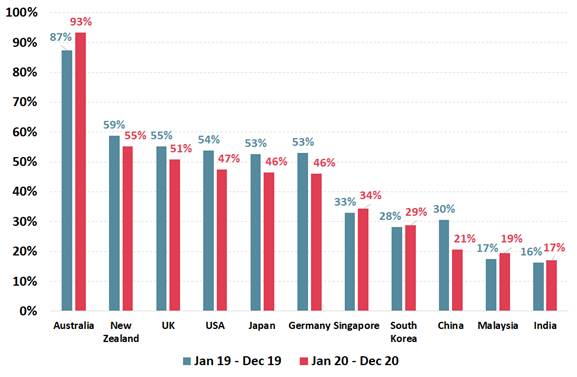
Huge Majority Of 93% Of Australians Said They Are More Likely To Buy Products
Made In Australia Nearly
Half (46%) Of Consumers In 17 Global Markets Use Zoom To Communicate
Regularly In
UAE And Saudi, The Intent To Travel Domestically Or Within The MENA Region
Increased Slightly 45%
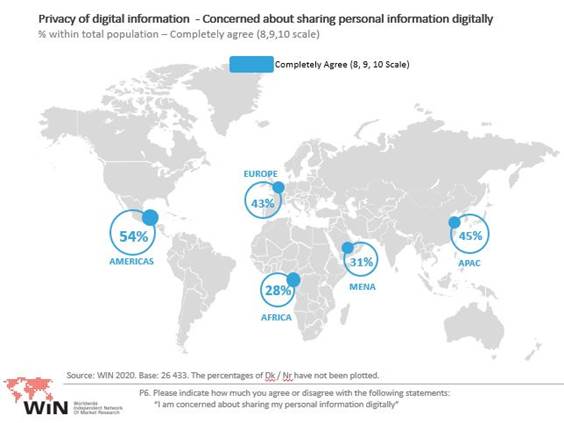
Of The Global Population Is Concerned About Sharing Their Personal
Information Digitally INTRODUCTORY NOTE
689-691-43-68/Commentary:
Japan’s
Population Of Children Under 15 Shrank By 190,000 From A Year Earlier
Japan’s
population of children under 15 shrank by 190,000 from a year earlier to an
estimated 14.93 million as of April 1, the 40th consecutive year of decline,
internal affairs ministry data showed. Children in
that age group account for 11.9 percent of the entire population, the lowest
level in the world, according to the ministry. The figure was 0.1 percentage
point down from the previous year. The
percentage has now dropped for 47 straight years. On the other
hand, people 65 or older account for 28.9 percent of the population, up 0.3
percentage point from the previous year. Although the
government has long vowed to battle the demographic change, the numbers show
that Japan’s declining birthrate and the graying of society have progressed
further. The ministry
released the numbers to mark Children’s Day, a national holiday, on May 5. Among those
under 15 years old, 7.65 million are boys and 7.28 million are girls. Japan has
3.24 million children between 12 and 14, and 2.65 million who are 2 years old
or younger, the data showed. The younger
the age, the smaller the ratio of the overall population. In 1950,
children under 15 accounted for 35.4 percent of the population because of the
first baby boom. But the
ratio started declining. In 1997,
people 65 or older made up 15.7 percent of the population, exceeding the 15.3
percent for those under 15. The ministry
compared Japan’s ratio of children with those in other countries with
populations of 40 million or more. Japan’s
percentage was the lowest, although the ministry said it was difficult to do
a strict comparison because the timing of the countries’ population surveys
was different. South
Korea’s ratio was the second lowest, at 12.2 percent as of July 1, 2020,
followed by Italy, at 13.3 percent as of July 1, 2018, and Germany, at 13.6 percent
as of Jan. 1, 2019. (Asahi
Shimbun) May 5, 2021 Source: http://www.asahi.com/ajw/articles/14342995 689-691-43-69/Country Profile
SUMMARY
OF POLLS
ASIA (China) The Population Of China Increased By 5.38 Percent To 1.41 Billion
In 2020 Census Compared With An Increase Of 5.84 Percent To 1.34 Billion In
The 2010 Census With growth having slowed ever since a
one-child policy was introduced in the late 1970s, the 2020 results of the
country’s once-a-decade census, published on Tuesday, showed the population
of mainland China increased 5.38 percent to 1.41 billion. That compared with
an increase of 5.84 percent to 1.34 billion in the 2010 census, and
double-digit percentage rises in all of China’s previous six official population
surveys dating back to 1953. (Asahi Shimbun) May 11, 2021 (Japan) Japan’s Population Of Children Under 15 Shrank By 190,000
From A Year Earlier Japan’s population of children under 15
shrank by 190,000 from a year earlier to an estimated 14.93 million as of
April 1, the 40th consecutive year of decline, internal affairs ministry data
showed.Children in that age group account for 11.9 percent of the entire
population, the lowest level in the world, according to the ministry. The
figure was 0.1 percentage point down from the previous year.The percentage
has now dropped for 47 straight years. (Asahi Shimbun) May 5, 2021 44 Percent Of Japanese People Are In Favor Of Revisions In
Constitution The Asahi Shimbun began the annual survey
on how the public views proposals for amending the Constitution, a key agenda
pushed by Shinzo Abe, who was prime minister from December 2012 to September
2020. The ruling Liberal Democratic Party, led by Prime Minister Yoshihide
Suga, is also seeking revisions. The Constitution, drafted during the
U.S.-led postwar occupation of Japan, has never been revised since it went
into force in 1947. (Asahi Shimbun) May 3, 2021 (India) Two In Five (19%) Indians Have Shown Willingness To Buy
Pre-Owned/Second-Hand Cars As the vaccination drive began in India and
Covid was believed to be under control early this year, three in ten (29%)
urban Indians said they were planning to buy a car, the data reveals.
However, the second wave of the pandemic has disrupted their planning and
only one in five (22%) out of them are likely to go ahead with their plan of
buying a car, while some (13%) have completely given up their plan or have
switched the category of the vehicle; to a two-wheeler now instead of a car
(10). (YouGov India) May 11, 2021 Nearly Two-Thirds Of Urban Indians (64%) Are Worried They
May Become Seriously Unwell Or Die Due To COVID YouGov’s Covid19 Public Monitor has been
tracking the public sentiment around the virus since last year when the
pandemic first broke out in the world. In May 2020, at the outset of
the pandemic, only 45% of urban Indians were worried about their personal
health getting affected due to covid. A year later as India faces a much
deadlier wave of the virus with limited healthcare facilities; this number
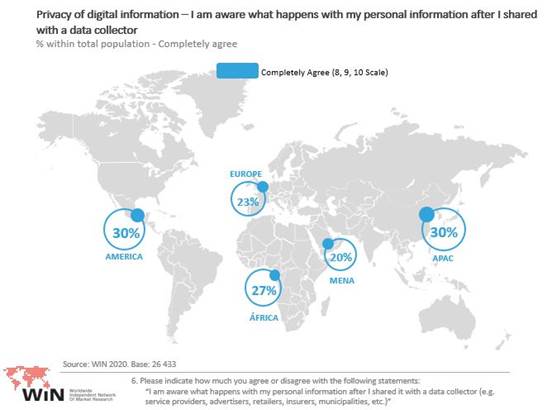
has gone up to 64%. (YouGov India) (Pakistan) 3 In 10 Pakistanis Concerned About Digitally Sharing Their
Personal Information According to a Gallup Pakistan Survey in
Pakistan (and similar surveys done by WIN International across the world),
30% Pakistanis agreed that they are concerned about sharing their personal
information. When asked about the necessity of sharing personal information,
24% Pakistanis think that sharing personal information is necessary nowadays.
43% Pakistanis (27% globally) are not fine with the privacy practices of most
data collectors asking for their personal information. As far as awareness
about digital rights and personal data privacy is concerned, 46% Pakistanis
are not aware of what happens with their personal information after they
share it with a data collector. (Gallup Pakistan) May 18, 2021 (South
Korea) New Prime Minister Of South
Korea Kim Bu-Gyeom "Conformity" 38% Vs "Nonconformity"
26% As a result of a survey of 1,000 adults on
the 11th to 13th days before the appointment of Prime Minister Kim, by Gallup
Korea (±3.1% points in the 95% confidence level of
the sample error), 38% of respondents said that Prime Minister Kim is
suitable for the post of Prime Minister. More than 26% of respondents said
they didn't. 36% declined to comment. The response that it was
appropriate both before and after the personnel hearing was more than the
response that it was inappropriate. In the April 20-22 survey
immediately after the Prime Minister's nomination, 34% of'conformity' and 18%
of'nonconformity'. In this survey, after the personnel hearing, opinion
reservations decreased, and both conformity and nonconformity consensus
increased. (Gallup Korea) 2021.05.14 Public Verification Of Personnel Hearings,
'Morality' 76 Percent Vs 'Policy Ability Only' 19 Percent Only 19% of respondents chose'private
verification for morality and public verification for policy capabilities'.5%
reserved their opinion. When asked whether morality and policy ability should
be prioritized when verifying candidates at the personnel hearing,'morality'
and'policy ability' were tied at 47% each. In particular, those in their 20s
and 30s who gave priority to'policy ability' were 65% and 62%, respectively,
higher than those of other age groups. (Gallup Korea) 2021-05-14 MENA (Kingdom
of Saudi Arabia) MENA Advertiser Of The Month (April): Vimto This Ramadan, Vimto came up with a campaign
that helped the brand win YouGov's Advertiser of the Month. Data from
YouGov BrandIndex shows the percentage of adults in KSA who saw
Vimto’s ad during the month of April shot up by 11 points from 19%
(April 1) to 30% (April 30). The campaign attracted participation
from across KSA which helped the Ad Awareness score of the
brand to shoot up from 19% on April 1 to 30% on
April 29. (YouGov MENA) (UAE) Global Village Has Emerged As The Top Mover This Year, With
A Change In Score Of +14.2 Compared To Ramadan 2020 In UAE YouGov BrandIndex data shows Global Village
has emerged as the top mover this year, with a change in score of +14.2
compared to Ramadan 2020. Despite ongoing Covid19 operating procedures in
place, Global Village decided to extend its open season into Ramadan this
year. This extension, coupled with it being the silver jubilee (25th year)
season, saw it promote its 25th world record-breaking event,
which clearly reached a wide audience in Ramadan. (YouGov MENA) AFRICA (Mauritius) 87 Percent Mauritians Think Social Media Makes People More
Informed About Current Affairs While a small share of citizens believe
that the use of social media such as Facebook, Twitter, and WhatsApp makes
people more susceptible to fake news and intolerance, a large majority say
social media informs them about current events and helps them have an impact
on political processes. The share of Mauritians who use social media every
day has more than doubled over the past six year, from 32% in 2014 to 69% in
2020. Overall, citizens believe the effect of social media on society is
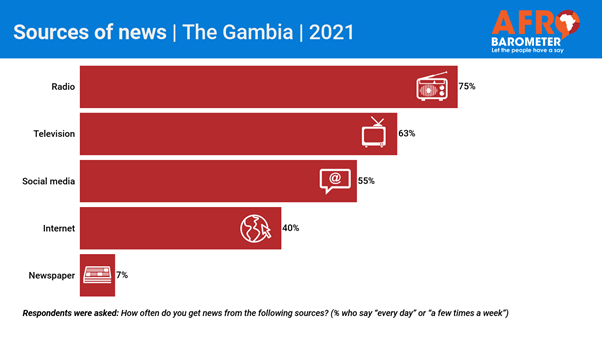
positive. (Afrobarometer) 5 May 2021 (Gambia) 63 Percent Gambians Get News From Television And 55 Percent
Get From Social Media An overwhelming majority of Gambians say
the media is in fact free to do its work without government interference. The
Gambia’s media environment has become somewhat less restrictive in recent
years, including a 2018 Supreme Court decision that the criminalization of
defamation is unconstitutional. The 2021 World Press Freedom Index ranked the
Gambia 85th out of 180 countries in media freedom, up two spots from the previous
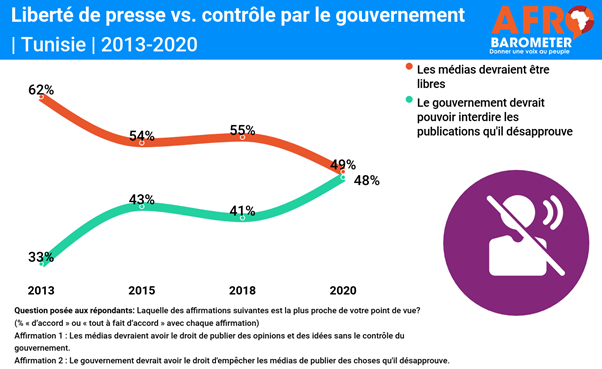
year. (Afrobarometer) 4 May 2021 (Tunisia) Half Of Tunisian Citizens 49 Percent Are In Favor Of Press
Freedom According to the survey, most citizens are
in favor of filtering press publications when they are false or hateful in
nature. The survey therefore revealed that most citizens believe that
the media and journalists“sometimes” or even
“often” disclose information which they know to be false. Yet half
of citizens believe that the government should be able to ban any publication
of content that it disapproves of, though a downward trend. (Afrobarometer) May 7, 2021 WEST
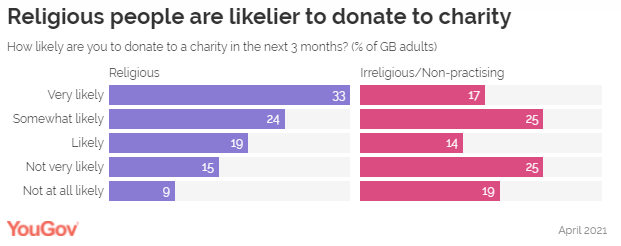
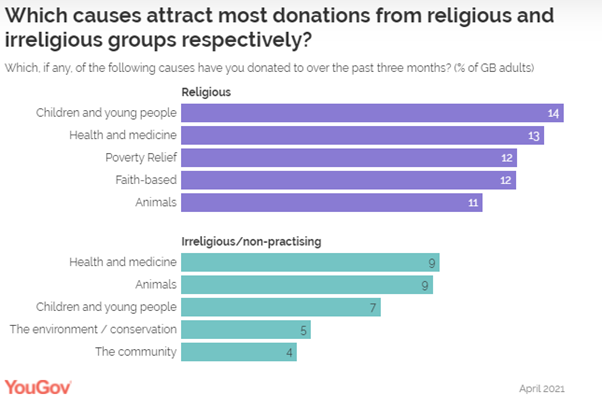
EUROPE (UK) Three In Four (76%) Religious People Indicated A Likelihood
To Donate To A Charity Asked about their likelihood to donate to a
charity in the next three months, three in four (76%) religious people
indicated a likelihood to do so, demonstrating a significantly higher
propensity than the irreligious and non-practising group (56%). The
difference may be at least partially explained by the fact that 17% of people
in the religious group cited their religious belief as a motivation towards
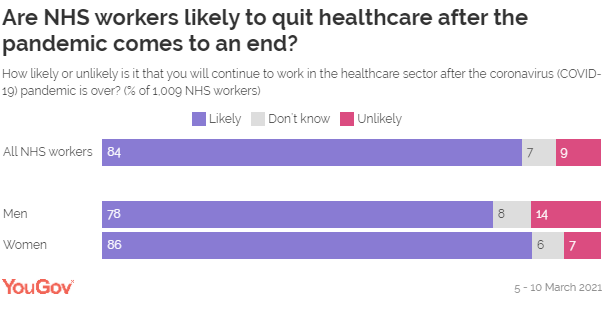
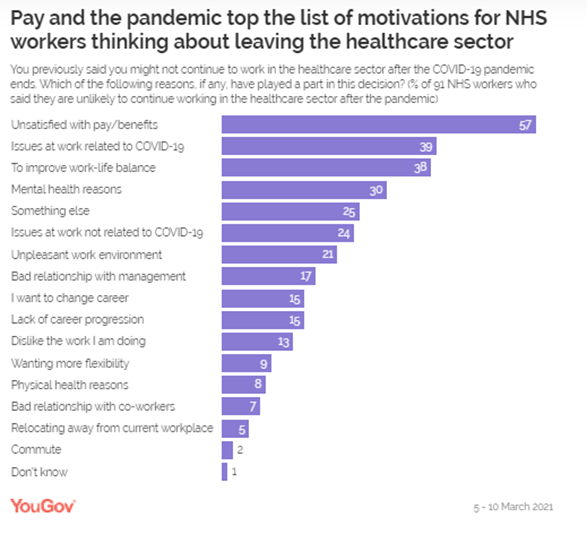
donating directly to a charity. (YouGov UK) May 05, 2021 One In Eleven NHS Workers Plan To Leave Healthcare Sector
After Pandemic YouGov’s research shows little difference
between roles within the NHS, with 9% of staff in patient-facing roles saying
it is unlikely for them to remain in the sector, as do 8% of those in
non-patient-facing positions. However, the figure is higher among male NHS
workers, one in seven of whom (14%) think it is unlikely they will work in
the healthcare sector when the pandemic ends, twice that of women (7%) who
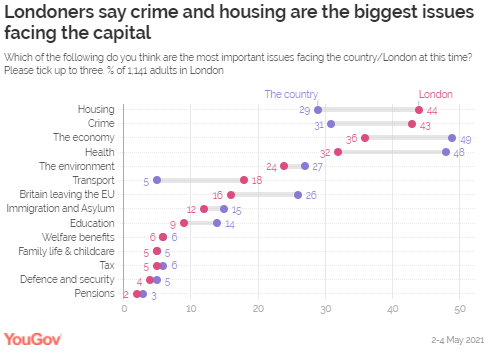
said the same. (YouGov UK) May 05, 2021 Two In Five People Point To Housing (44%) And Crime (43%)
As The Most Urgent Problems To Be Tackled By New Mayor Londoners are heading to the ballot boxes
today to elect or re-elect the next mayor. YouGov data shows that two in five
people point to housing (44%) and crime (43%) as the most urgent problems to
be tackled, while just over a third (36%) say it’s the economy. These issues
are followed by health (32%), the environment (24%) and transport (18%).
These issues largely match the main candidates’ pledges, with current mayor
Sadiq Khan promising to build more council homes, crack down on crime and
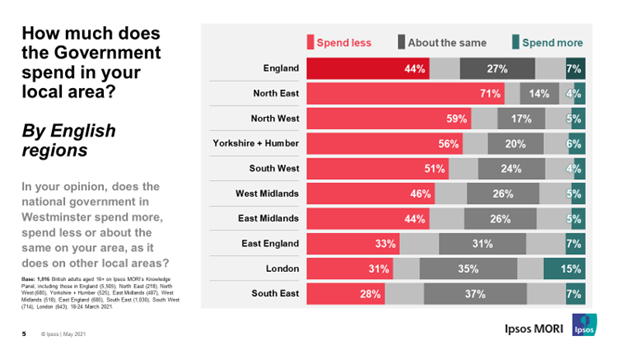
lower the cost of commuting. (YouGov UK) May 06, 2021 Four In Ten Britons Satisfied With Their Local Council, But
Most In The North Of England Feel They Get Less National Spending Than Other
Areas Britons are more likely to say they’re
satisfied than dissatisfied with the way their local council runs things,
according to a new Ipsos MORI poll. The poll was conducted with 8,352 people
aged 16+ across the United Kingdom. The survey reveals that two in five (40%)
say that they’re satisfied with the way their local council runs things while
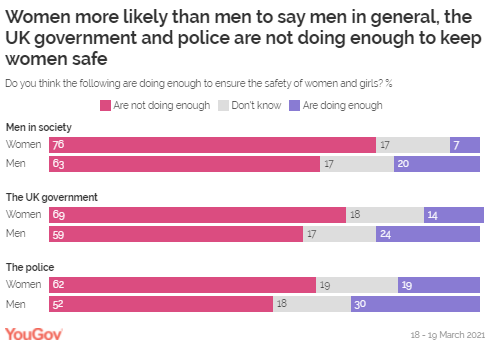
a quarter (25%) say they’re dissatisfied. (Ipsos MORI) 7 May 2021 Three Quarters Of British Women (76%) Say Men In Society
Don’t Pull Their Weight In Keeping Women And Girls Safe Three quarters of women (76%) say men in
society don’t pull their weight in keeping women and girls safe. Men tend to
agree (63%), although a fifth (20%) consider their gender overall to be doing
enough – almost three times the number of women who think so (7%). Seven in
ten women (69%) also say the government’s efforts are lacking, compared with
59% of men. A majority of women (62%) similarly feel the police aren’t doing
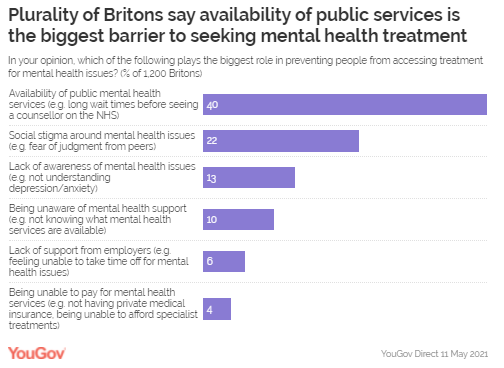
enough, while around half of men (52%) agree. (YouGov UK) May 10, 2021 Towards The End Of Last Year, Over Half Of The Public (53%)
Said The Covid-19 Pandemic Had Negatively Affected Their Mental Wellbeing Data from YouGov Direct conducted during
Mental Health Awareness Week 2021 reveals that Britons are most likely to
believe that low availability of public services play the biggest role in
preventing people from accessing treatment. Two in five say capacity issues
such as long wait times (40%) are the largest barrier to seeking help, with
social stigma coming a distant second (22%). NHS England data from April
2021 revealed that the number of people on
waiting lists for all NHS treatment was at 4.7 million people – the highest number since records
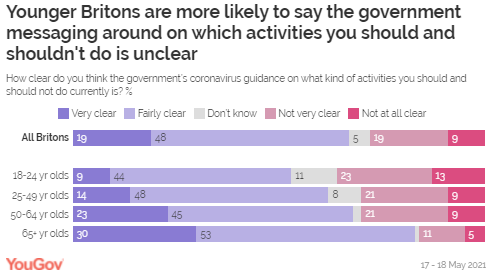
began in 2007. (YouGov UK) May 14, 2021 Three In Ten Britons Feel Less Certain
About Government’s Guidance For Which Activities You Should And Shouldn’t Do
And Say It’s Either Not Very (19%) Or Not At All Clear (9%) Critics are now attacking Boris Johnson for
a reopening approach marked by “confusion”, which includes allowing travel but
ministers saying you shouldn’t do it, and legalising hugging but advising “cautious cuddling”. But are the Britons as confused as
commentators insist? Not according to the public themselves. Two thirds of
people say the government’s guidance for which activities you should and
shouldn’t do is very (19%) or fairly (48%) clear. Around three in ten feel
less certain, however, and say it’s either not very (19%) or not at all clear
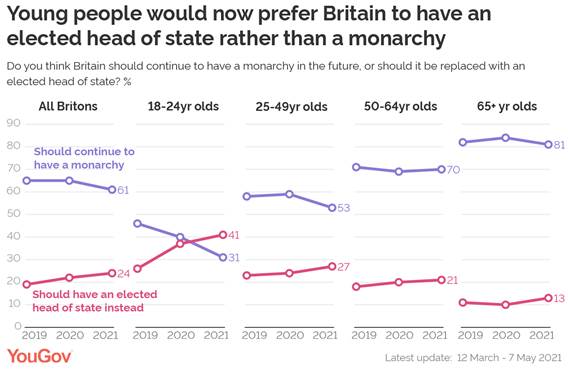
(9%). (YouGov UK) May 20, 2021 41% Of 18-24 Year Olds Now Say Britain Should Have An Elected
Head Of State Attitudes among young people to the
monarchy have changed substantially since 2019. YouGov data from a number of
our 2021 polls on the monarchy so far shows that 41% of 18-24 year olds now
say Britain should have an elected head of state, while only 31% would like
to see the monarchy continue. The results, which are likely to be cause for
concern for Buckingham Palace, come after a turbulent start to 2021, with
Harry and Meghan’s controversial Oprah interview in March and Prince Philip’s passing
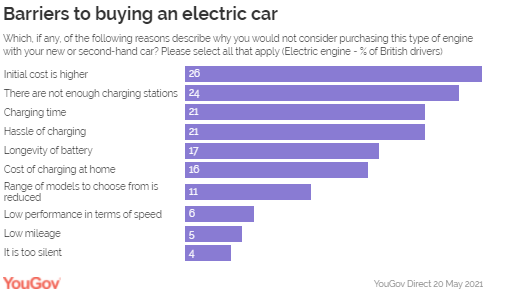
in April. (YouGov UK) May 21, 2021 Charging An Electric Car Vs Refuelling A Petrol Car, 14%
Think It’s Better; 13% Think It’s The Same, And 64% Think It’s Worse For all the positivity around the features
of electric cars, a major sticking point for Britons when it comes to EVs is
the hassle associated with charging a car compared to filling it up with
petrol. A comfortable majority of the public thinks battery-powered vehicles
are more inconvenient to run than petrol cars (64%), while just 14% think
petrol cars are worse in this area. This extends to aesthetics: in terms of
exterior design, three-quarters say they look the same or better (76%); when
asked about interior design, four in five (80%) think they’re superior, while
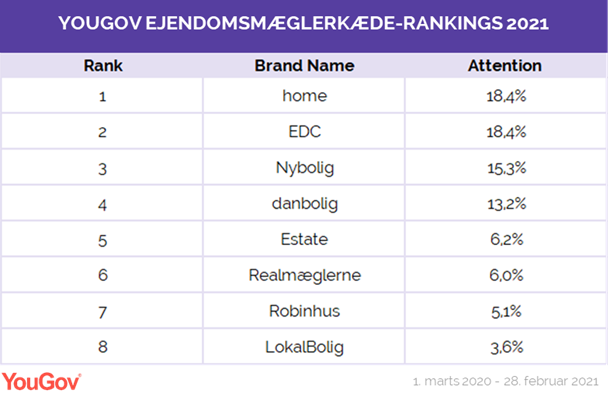
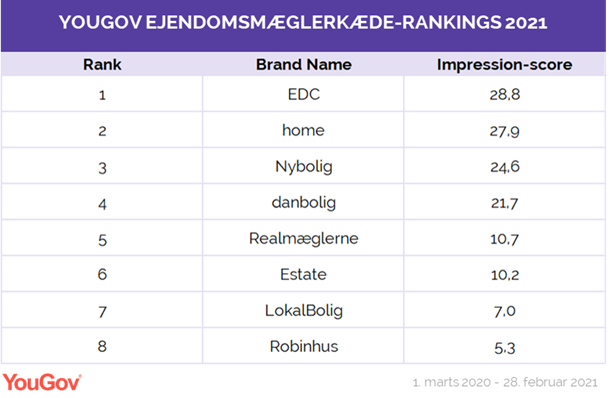
just 7% think they look inferior. (YouGov UK) May 21, 2021 (Denmark) Home And EDC Are Real Estate Chains Get The Most Attention
In Denmark When it comes to attention, home and EDC
share first place. An average of 18.4% of Danes have thus heard positive
or negative mention of these chains through advertising, news, word-of-mouth
or friends and family over the past year. In third and fourth place are
Nybolig (15.3%) and danbolig (13.2%). From the four big real estate
chains, there is a distance down to chains like Estate and Realmæglerne,
which are fighting for fifth place with an attention score of resp. 6.2%
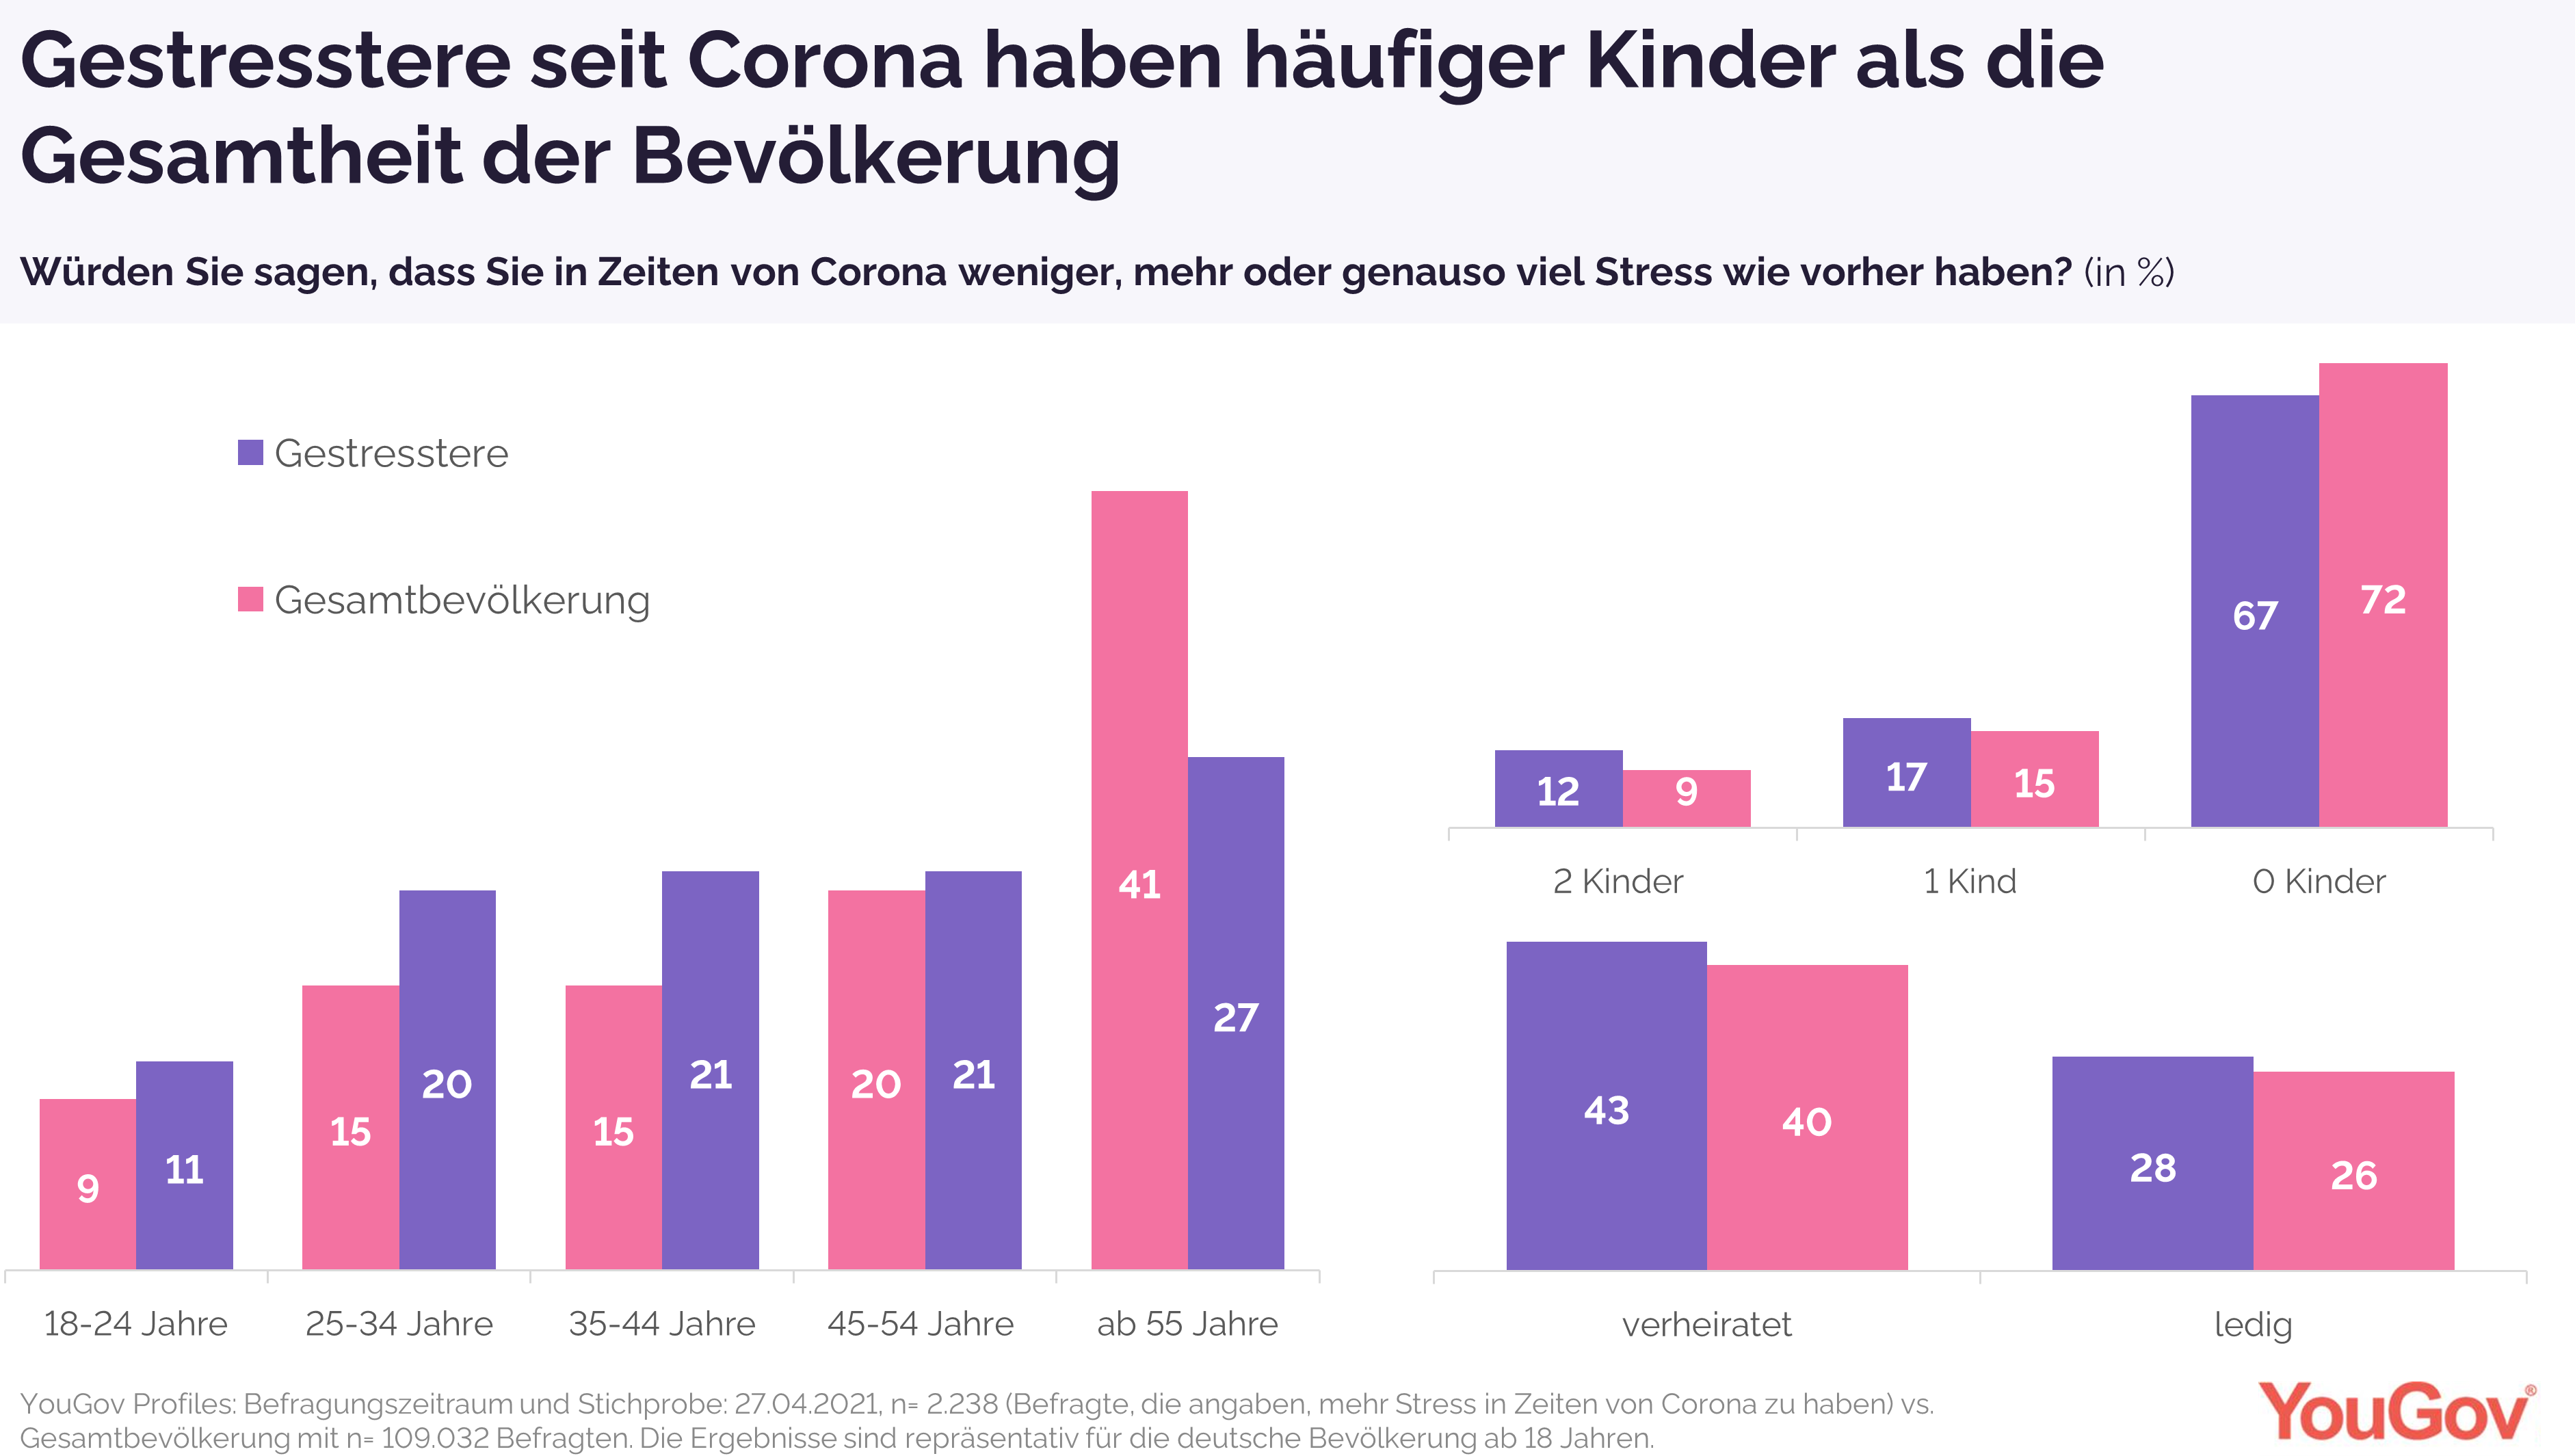
and 6%. (YouGov Denmark) (Germany) Every Third German Feels More Stressed In 2021 Than Before
Corona, People With Children Most Often A survey from the end of April 2021,
compared to April 2020, showed that people in times of Corona feel more
stressed this year than they did a year ago. At that time, 17 percent
said they felt more stressed than before, in 2021 31 percent said they were
more stressed, 14 percentage points more than a year ago. 51 percent
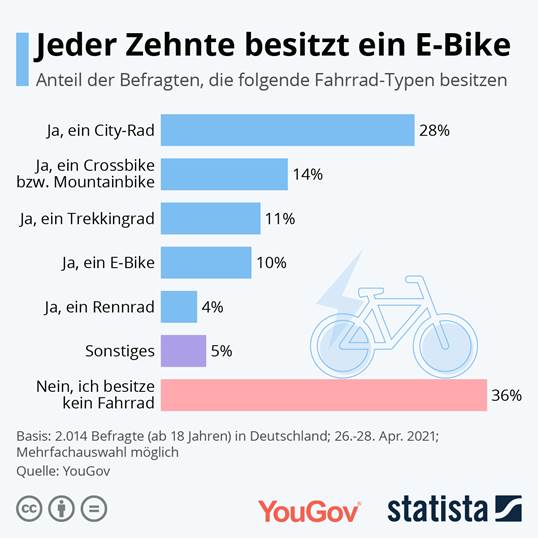
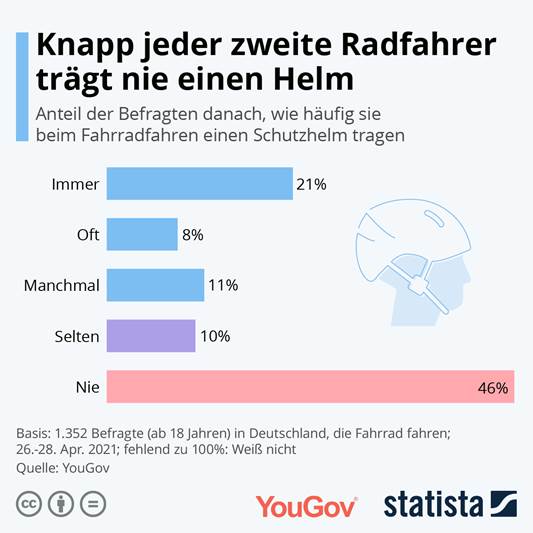
currently do not notice any change in their stress level due to Corona. (YouGov Germany) May 7, 2021 Every Second Cyclist Wears A Protective Helmet At Least Now
And Then When Cycling Spring and summer are just around the
corner - time to cycle again more often. The majority of Germans (63
percent) have their own bike, most of them a city bike (28 percent), and 14
percent own a cross bike or mountain bike. 10 percent of the German
respondents state that they own an e-bike. 36 percent of Germans do not
own a bicycle, including more women (40 percent) than men (31
percent). This was the result of a current survey in cooperation with
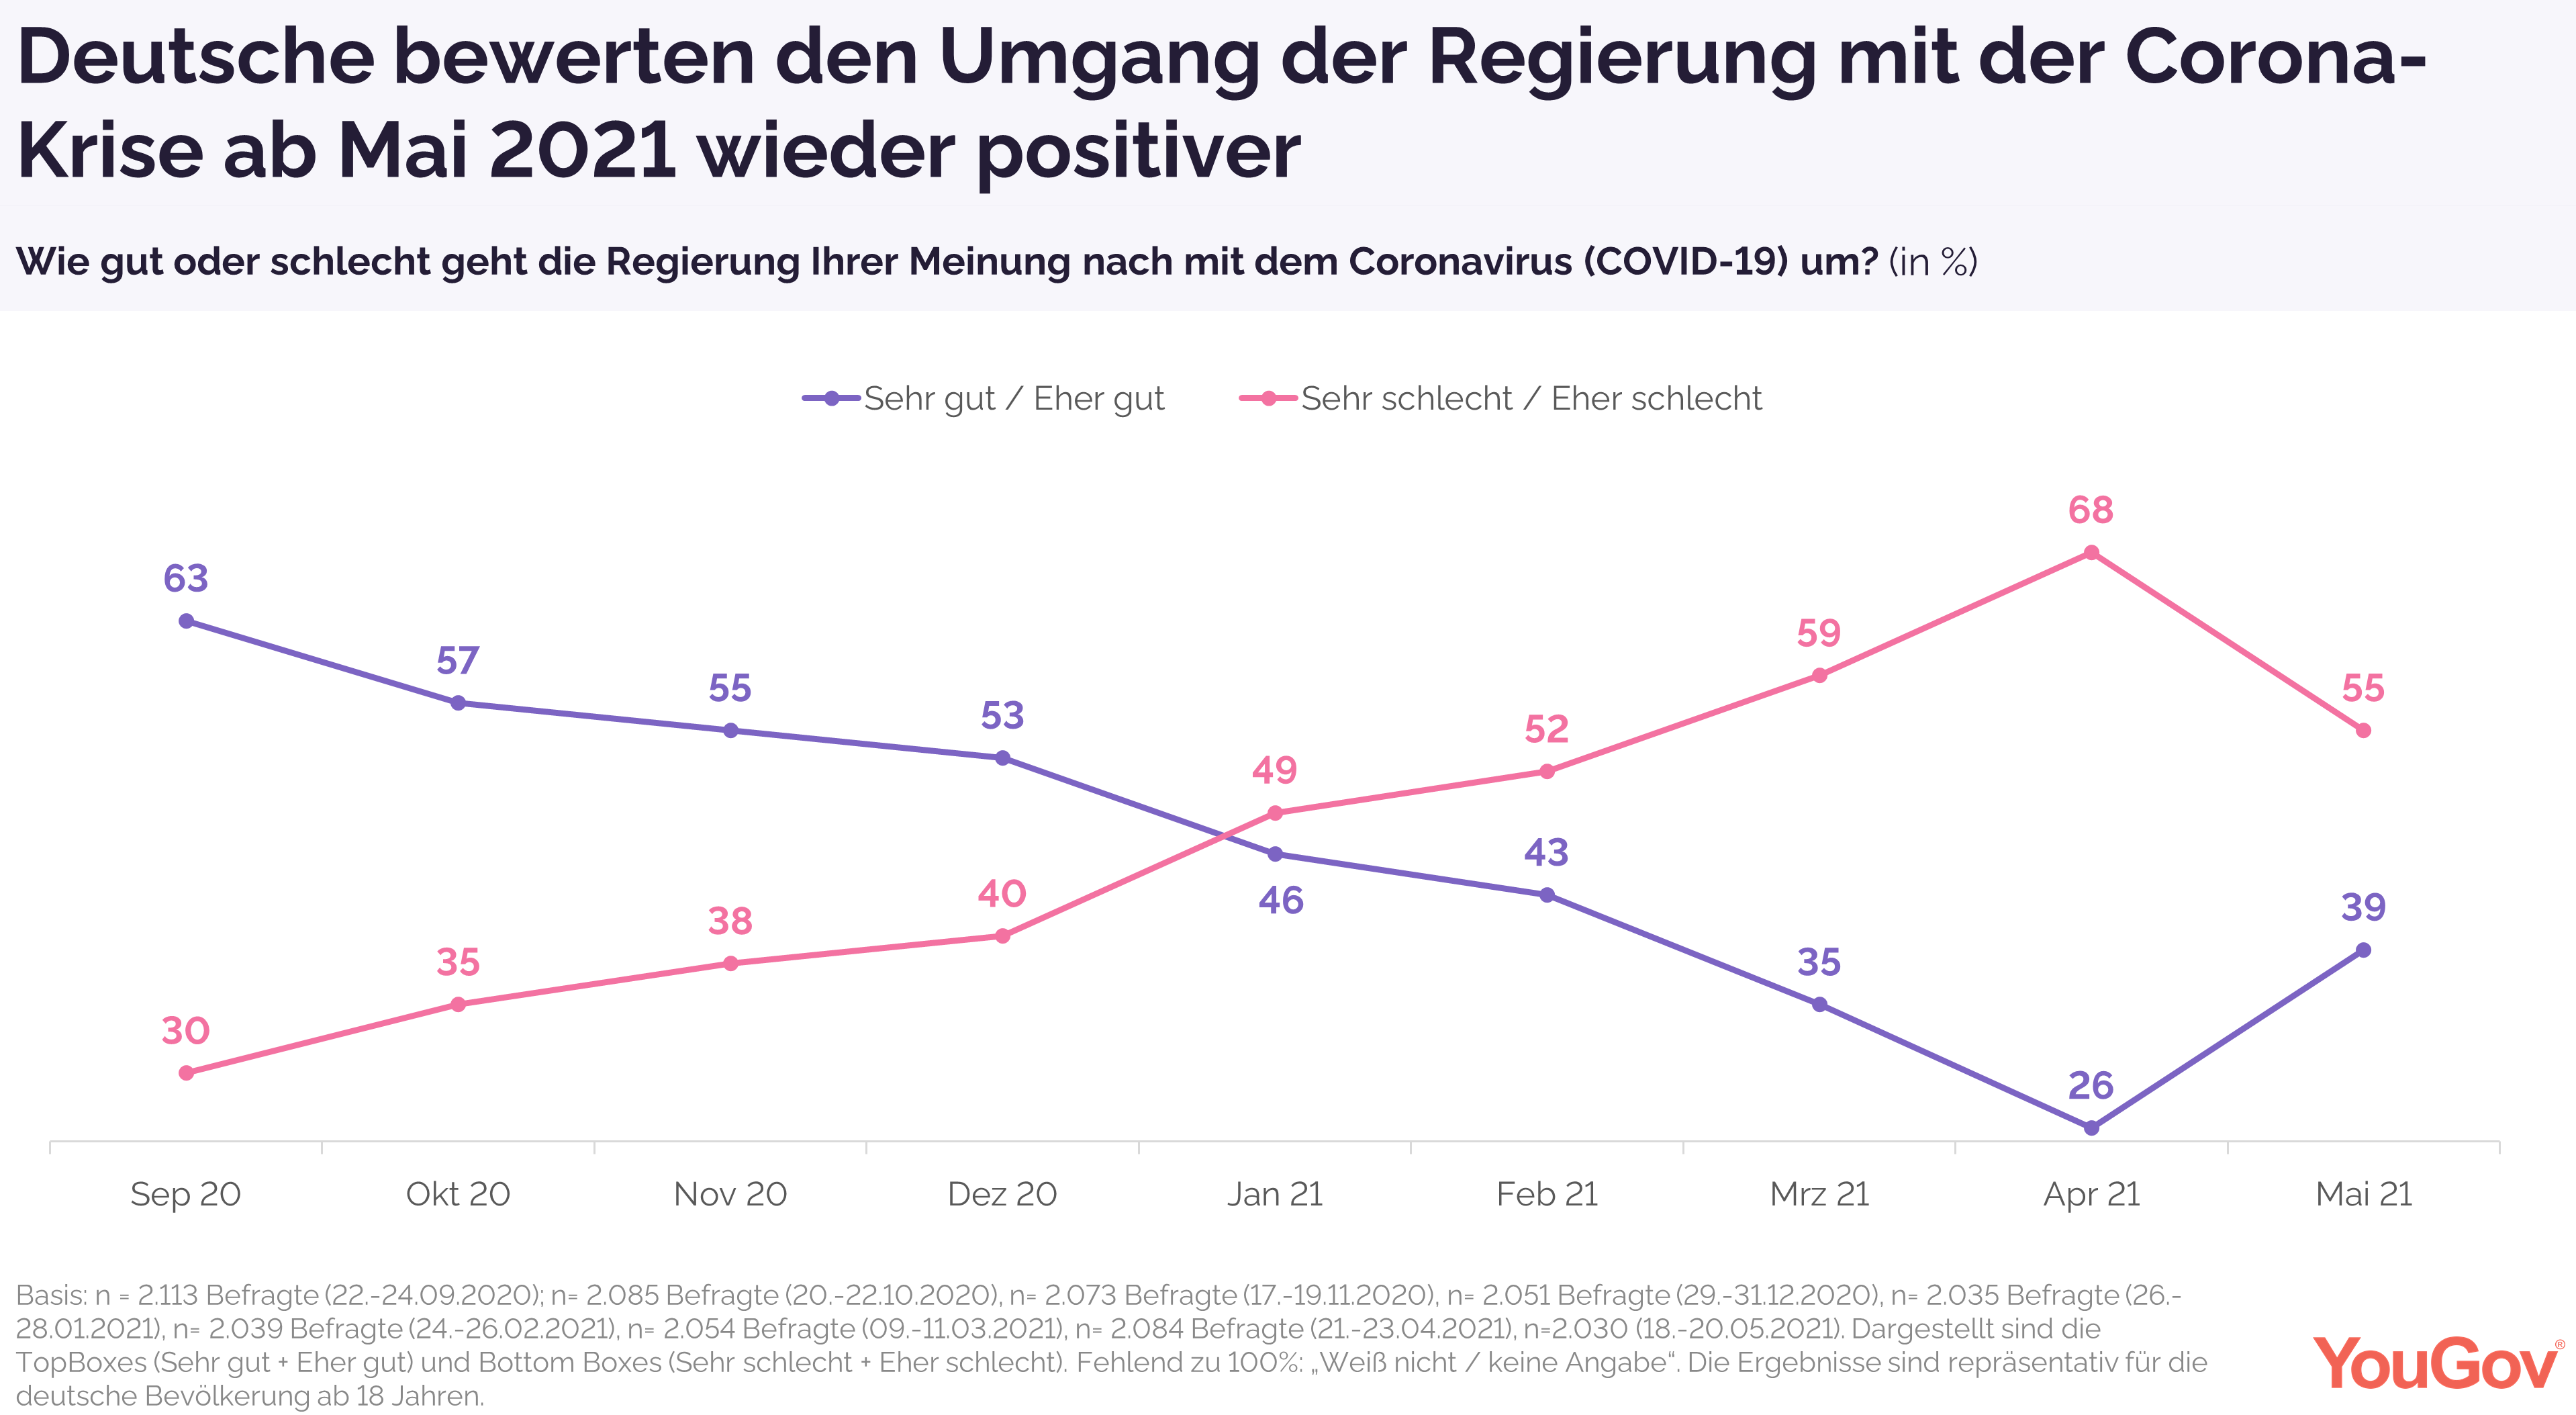
Statista. (YouGov Germany) May 5, 2021 26 Percent Germans Praised The Government's Handling Of The
Crisis In April 2021 At the beginning of 2021, the proportion of
those who rated the federal government's handling of the crisis negatively
was higher than the proportion of those who voted positively for the first
time: in January 2021, 49 percent had a negative and 46 percent a positive
image. According to current YouGov Corona Tracker data, a reversal of
this trend can currently be seen: After only a quarter of all respondents (26
percent) praised the government's handling of the crisis in April 2021, the
lowest value since the tracker began, attested in May 39 percent of the
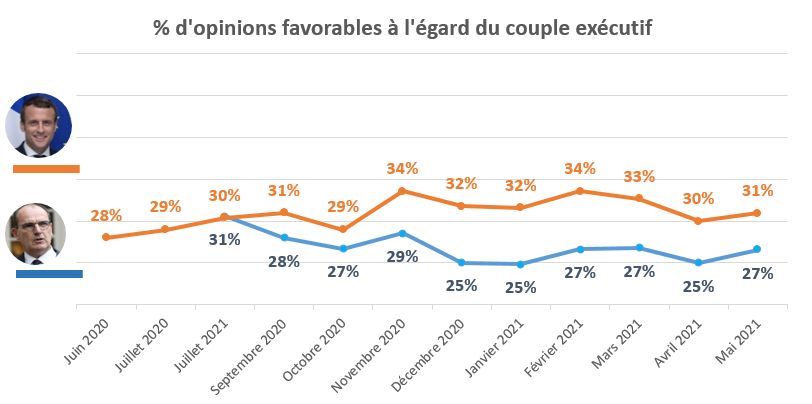
government is good practice. (YouGov Germany) (France) This Month, The President Of The France Recovers 1 Point Of
Favorable Opinions From The French (31% Of Favorable Opinions) This month, the President of the Republic
recovers 1 point of favorable opinions from the French (31% of favorable opinions) . In
detail, the Head of State is making progress with all fringes of opinion
except the moderate Left and the Far Right. Indeed, Emmanuel Macron
gains 10 points from supporters of the Far Left (18% of favorable opinions),
5 points from supporters of the Center (82% of favorable opinions) and 2
points from supporters of the moderate Right. (36% favorable
opinions). It loses, on the other hand, 2 points with sympathizers of
the moderate Left (29% of favorable opinions) and of the Far Right (8% of favorable
opinions). (YouGov France) May 7, 2021 A Quarter Of 18-25 Years Old Say They Have Had
Suicidal Thoughts Since The Start Of The Crisis (27%) This distress experienced by young people
since the start of the health crisis is all the more worrying as more than a quarter of them say they have had suicidal thoughts
since the start of the crisis (27%), a proportion that has
increased from 4 points in 9 months. Students and young people currently
looking for a job appear to be particularly concerned (31% and 35%
respectively). (Ipsos France) May 10, 2021 45% French Believe That Major Beauty Brands Do Not
Care Enough About The Diversity Of Their Consumers In terms of offer, consumers are largely
satisfied with the diversity of the
beauty sector , 77% of
them saying they easily find products that match their physical
characteristics. When it comes to communication, things are
more complicated: 51% are
not represented in brand communication ,
especially men ( 59% of
them), undoubtedly because they are targeted by far fewer products, but also
the oldest ( 62% of
55- 75 years old) 45% believe
that major beauty brands do not care enough about the diversity of their
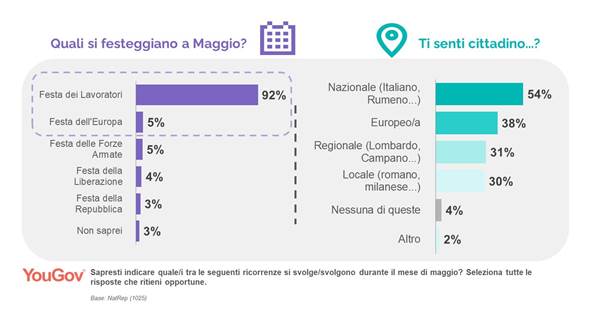
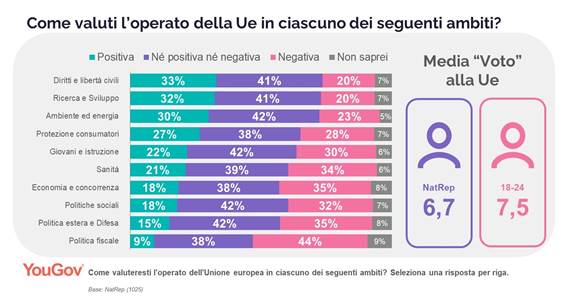
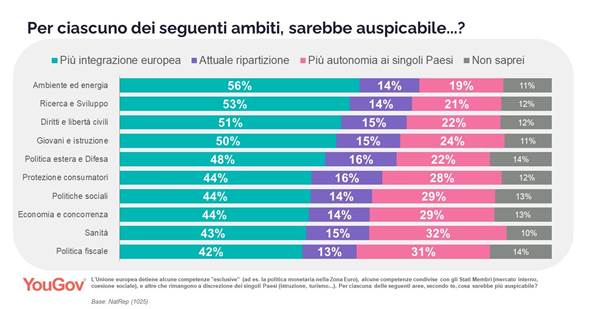
consumers. (Ipsos France) May 18, 2021 (Italy) 9 May, Europe Day: The European Union In The Perception Of
Italians On 9 May the European Union celebrates
Europe Day , in memory of the Schumann
Declaration, which set the tone for the first European Coal and Steel
Community (ECSC). More than seventy years later, this anniversary remains unrecognized in Italy: only
5% of Italians know how to place this day among the May
holidays (against over 90% who know how to place the Labor Day), a percentage
that rises however 11% among young
people aged 18-24. Only 10% say they are generally aware
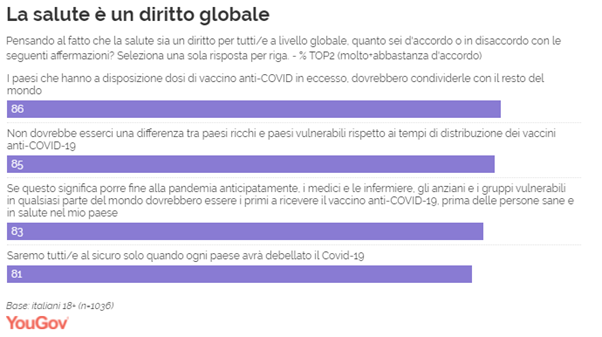
of Europe Day and its meaning, plus 25% who have heard of it. (YouGov Italy) May 7, 2021 8 Out Of 10 Italians And Italians Agree: Excess Doses Of
The Anti-Covid 19 Vaccine Must Be Shared 8 out of 10 Italians and Italians agree:
excess doses of the anti-COVID 19 vaccine must be shared, because only by
eradicating the virus everywhere will the pandemic be put to an
end. This emergency situation requires a response that goes beyond
borders and national income differences (85%), with immunization that gives
priority to the categories of people most vulnerable and at risk in the face
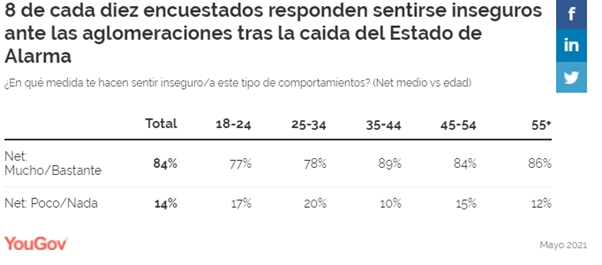
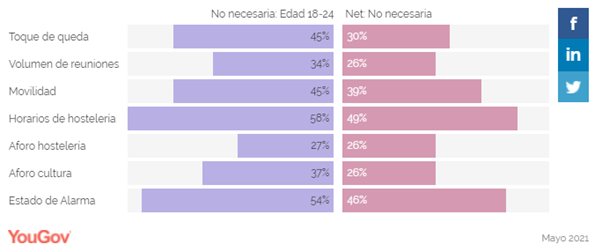
of the threat of the virus (83%). (YouGov Italy) (Spain) 40% Of Spaniards Do Not Agree With The Changes In The
Measures Implemented In Their City After The Fall Of The State Of
Alarm Young people between 18 and 34 years old
are the group of the population that is most in favor of the changes in the
measures (42% in both cases), compared to the rest of the population, where
the most negative age group towards the arrival of This new normal would be
between 45 and 54 years of age (46% do not agree with the new
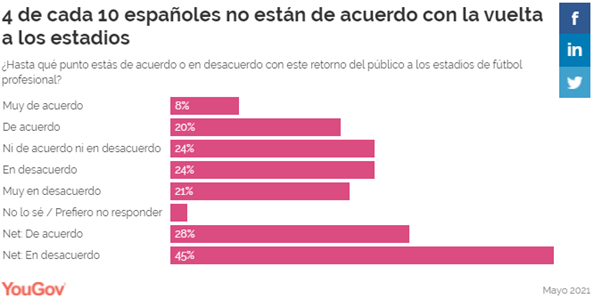
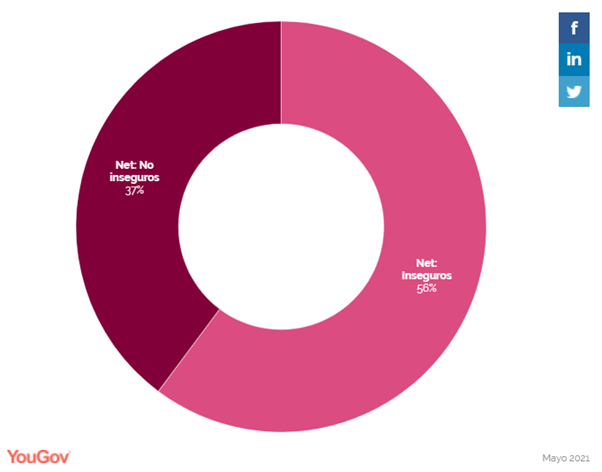
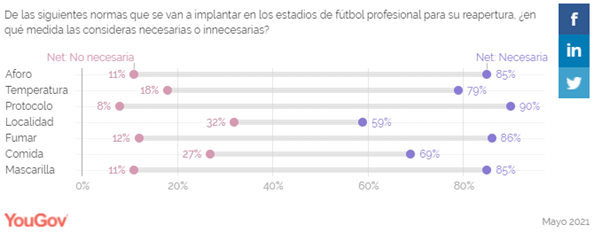
measures). (YouGov Spain) Four Out Of Every Five Spanish Respondents (45%) Rejects
The Fact That They Can Return To Stadium Fans Last Wednesday, May 12, the return of the
public to the stands of the professional football stadiums was
approved. This measure will be valid only for communities in phase 1,
with a cumulative incidence of less than 50 cases per 100,000 inhabitants in
the last 14 days. With this new measure, stadiums will be able to accommodate
30% of their capacity as long as they do not exceed 5,000 spectators, they
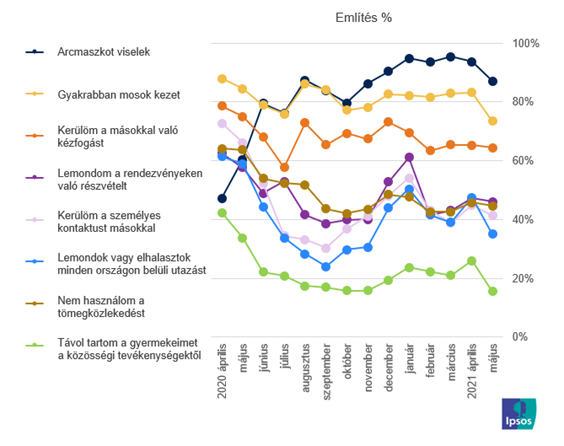
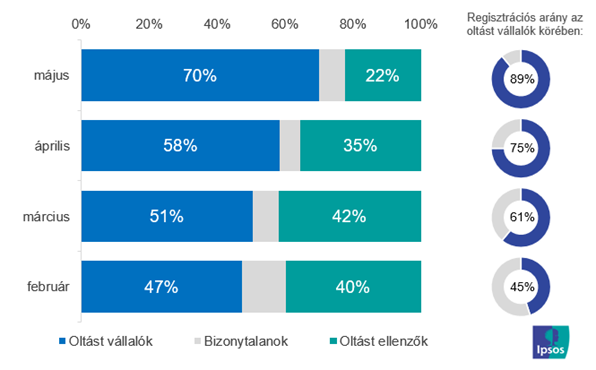
must wear a mask and maintain a safety distance, among other rules. (YouGov Spain) May 20, 2021 (Hungary) Only one in five Hungarians is vaccinated Thanks to improving epidemic data and
rising vaccination rates, the population is moving more freely and letting
their children into the community, interacting with others. The rate of
wearing a face mask was 87%, with a lower level most recently seen in
November. The 73% mention of frequent hand washing against infection is
the lowest in the history of the research series . The outlook for public
transport and the event market is mild, with domestic tourism improving
significantly over the past month. (Ipsos Hungary) May 20, 2021 NORTH AMERICA (USA) Three-Quarters Of White Evangelical Protestants (75%) Say
They Disapprove Of The New
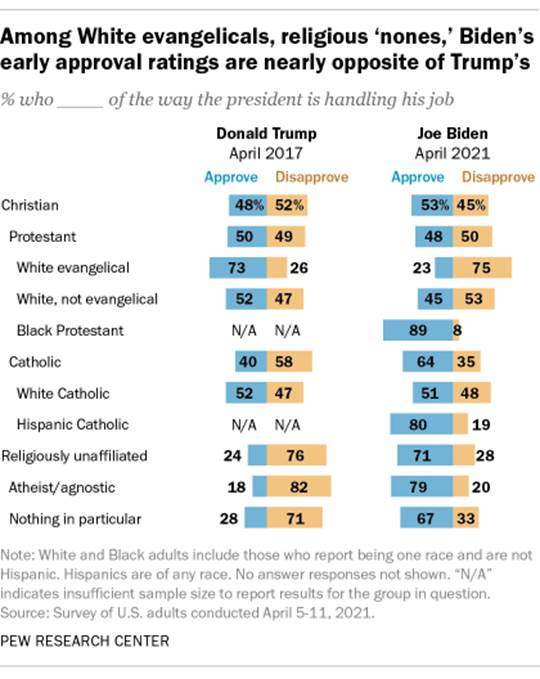
President’s Performance So Far Seven-in-ten religiously unaffiliated
adults (71%) say they approve of how Biden is handling the job of president,
compared with three-quarters (76%) who said they disapproved of Trump’s performance in
April 2017. At the other end of the spectrum, three-quarters of White
evangelical Protestants (75%) say they disapprove
of the new president’s performance so far, which is about equal to the share
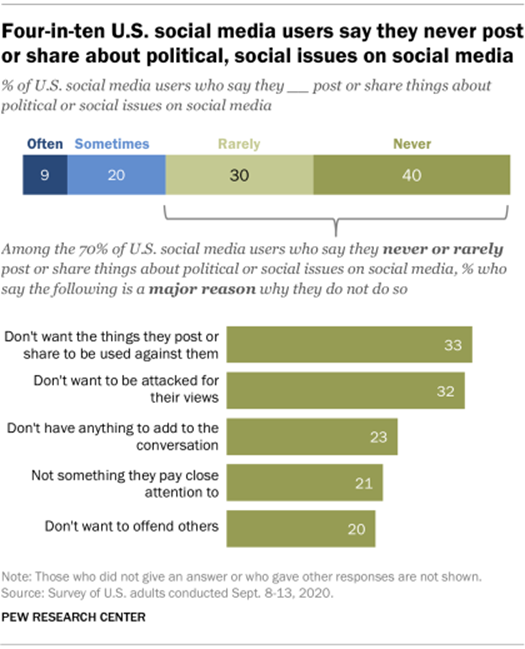
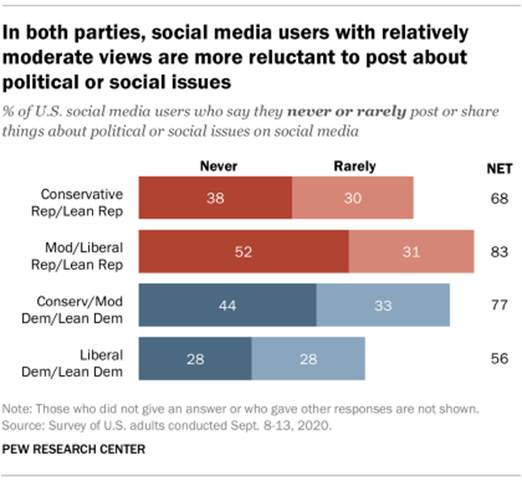
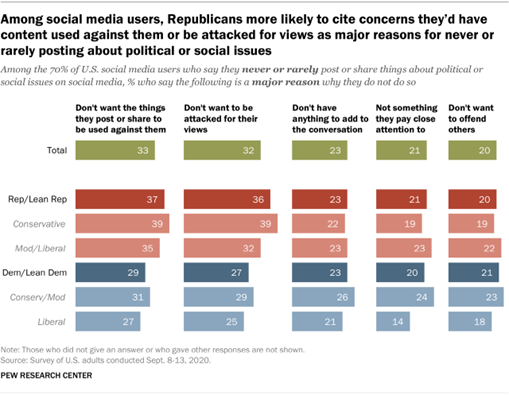
who approved of Trump’s performance four years ago (73%). (PEW) MAY 4, 2021 70% Of U.S. Social Media Users Never Or
Rarely Post Or Share About Political, Social Issues Only 9% of adult social media users say they
often post or share things about political or social issues on social media,
according to newly released results from a Pew Research Center survey of U.S.
adults conducted Sept. 8-13, 2020. Some 70% of social media users say they
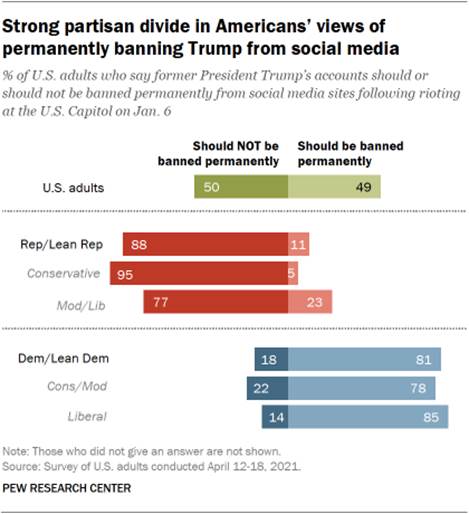
never (40%) or rarely (30%) do so. (PEW) MAY 4, 2021 Just 11% Of Republicans And
Republican-Leaning Independents Say Trump’s Accounts Should Be Permanently
Banned From Social Media Americans are split on whether former
President Donald Trump should be barred from social media. Some 49% of U.S.
adults say Trump’s accounts should be permanently banned from social media,
while half say they should not be. But views are deeply divided along
partisan lines, according to a new Pew Research Center survey. And then
– just like today – most Republicans (78%) said social media companies’
decisions to ban Trump’s accounts following the riots were the wrong thing to
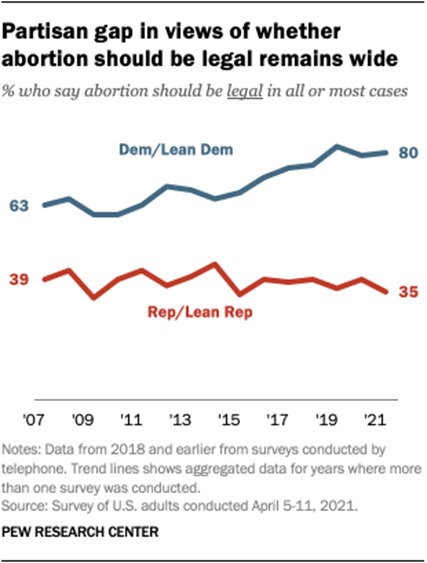
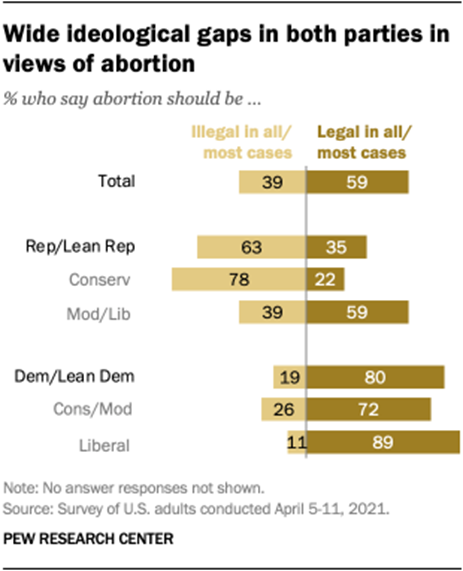
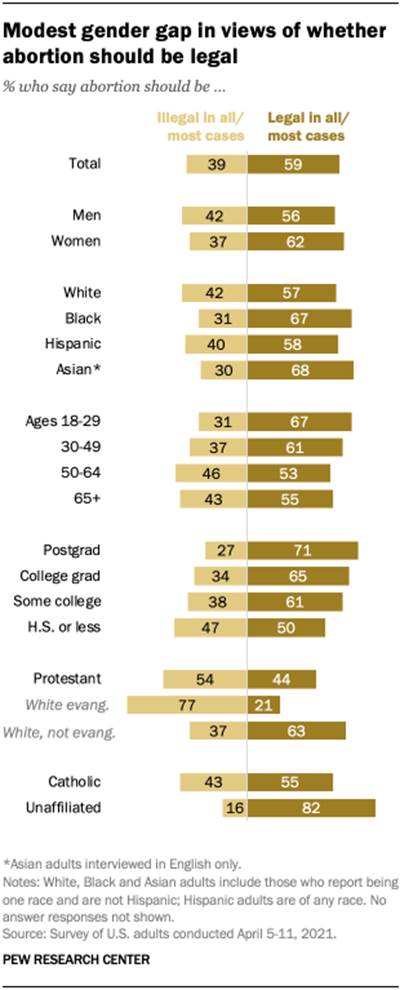
do, while a vast majority of Democrats (89%) supported these decisions. (PEW) MAY 5, 2021 About Six-In-Ten Americans Say Abortion
Should Be Legal In All Or Most Cases Today, a 59% majority of U.S. adults say
abortion should be legal in all or most cases, while 39% think abortion
should be illegal in
all or most cases. These views are relatively unchanged in the past few
years. The latest Pew Research Center survey, conducted April 5 to 11, finds
deep disagreement between – and within – the parties over abortion. In fact,
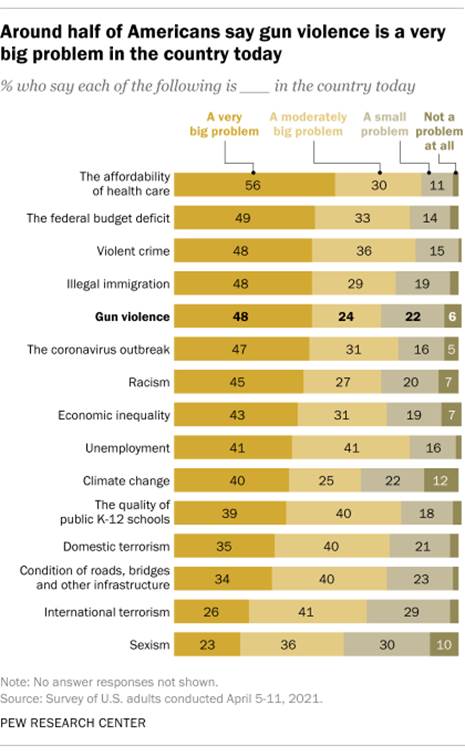
the partisan divide on abortion is far wider than it was two decades ago. (PEW) MAY 6, 2021 Around Half Of Americans (48%) See Gun
Violence As A Very Big Problem In The Country Today According to a Pew Research Center survey conducted in April 2021. That’s
comparable to the share who say the same about the federal budget deficit
(49%), violent crime (48%), illegal immigration (48%) and the coronavirus
outbreak (47%). Only one issue is viewed as a very big problem by a majority
of Americans: the affordability of health care (56%). Another 24% of adults
say gun violence is a moderately big problem. About three-in-ten say it is
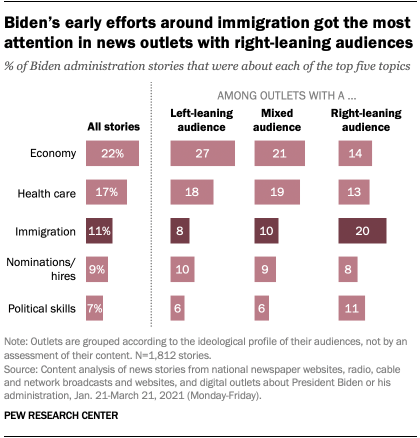
either a small problem (22%) or not a problem at all (6%). (PEW) MAY 11, 2021 Immigration Was A Top Focus Of Early Biden
Coverage, Especially Among Outlets With Right-Leaning Audiences The topic of immigration (which included
all references to immigration, including broader trends and changes in law,
as well as stories about the border with Mexico) accounted for about twice as
many stories from outlets with right-leaning audiences (20%) as from news
outlets with left-leaning audiences (8% of stories) and those with
ideologically mixed audiences (10%). (Details about how news outlets were
grouped can be found here.) Indeed, among those outlets with
right-leaning audiences, immigration was the No. 1 topic among stories
related to the new administration, well ahead of both the economy (14%) and
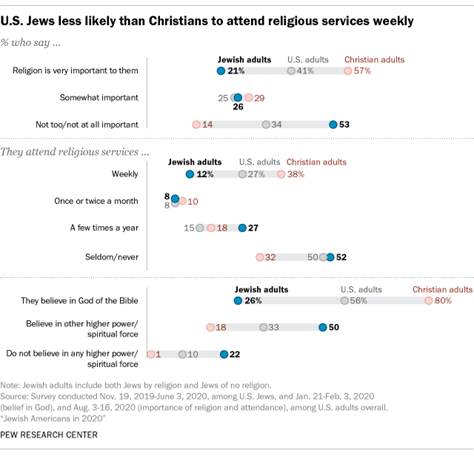
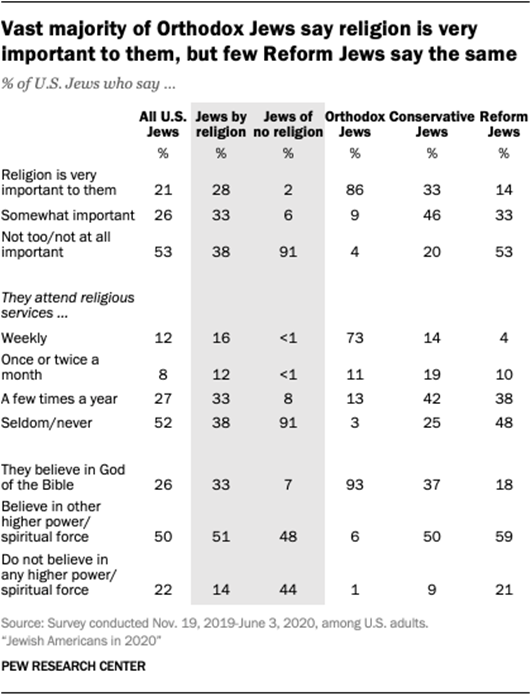
health care (13%). (PEW) MAY 12, 2021 12% Of Us Jewish Adults Say They Attend
Religious Services Weekly Or More Often, Compared With 27% Of The General
Public And 38% Of Us Christians 12% of U.S. Jewish adults say they attend
religious services weekly or more often, compared with 27% of the general
public and 38% of U.S. Christians. And 21% of Jewish adults say religion is
very important in their lives, compared with 41% of U.S. adults overall and
57% of Christians. Orthodox Jews – who make up 9% of all U.S. Jews – are a
notable exception. They are among the most highly religious groups in U.S.
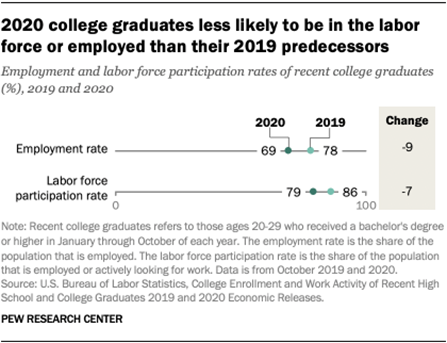
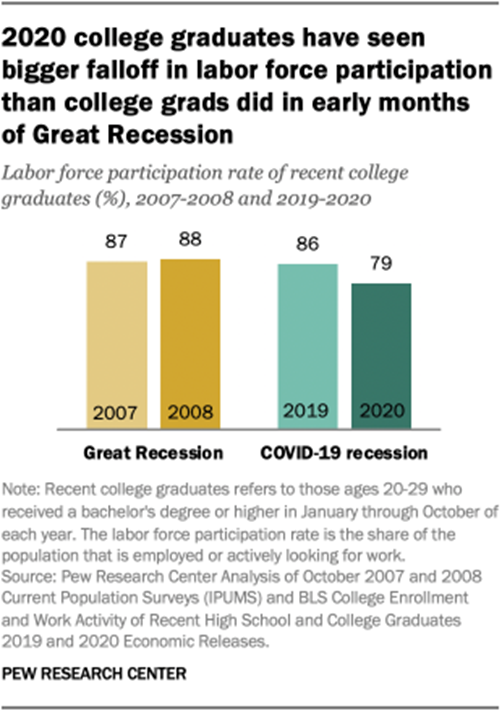
society by these measures. (PEW) MAY 13, 2021 69% Of Adults Ages 20 To 29 Who Had Graduated
From College During The Previous Spring Were Employed, Lower Than The Share
Of 2019 Graduates Who Were Employed In October Of That Year (78%) The labor force participation rate for
recent college graduates – or the share of people employed or actively
looking for a job – also dropped from 86% to 79% during this one-year period.
As has been widely documented, the broader labor market took a
significant hit during the pandemic. Among all Americans ages 16 and older,
the employment rate declined from 61% in October 2019 to 58% in October 2020,
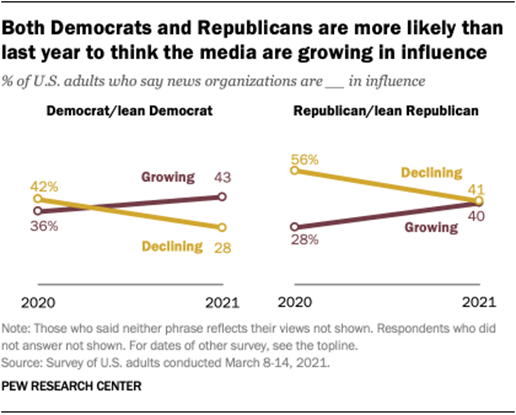
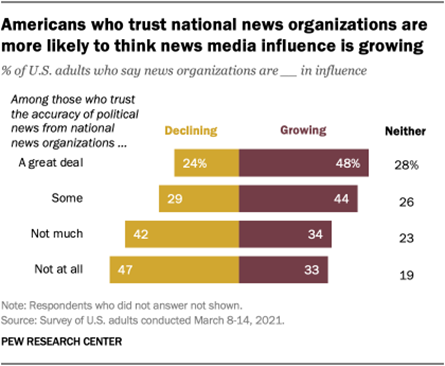
and the labor force participation rate declined from 63% to 62%. (PEW) MAY 14, 2021 About Four-In-Ten (41%) Americans Say News
Organizations Are Growing In Their Influence When Americans were asked to evaluate the
media’s standing in the nation, about four-in-ten (41%) say news
organizations are growing in their influence, somewhat higher than the
one-third (33%) who say their influence is declining, according to a Pew
Research Center survey conducted March 8-14, 2021. The remaining one-quarter
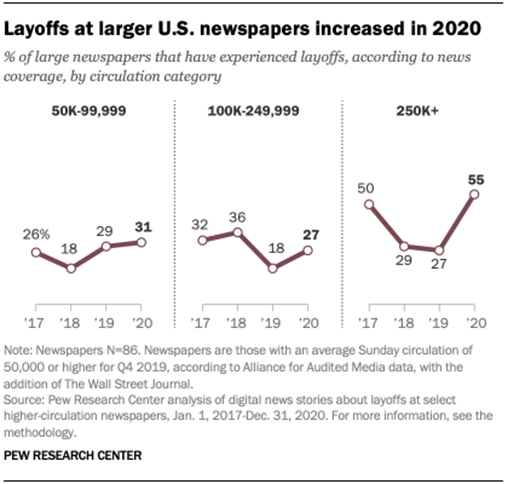
of U.S. adults say they are neither growing nor declining in influence. (PEW) MAY 17, 2021 A Third Of Large US Newspapers Experienced
Layoffs In 2020, More Than In 2019 Large-market newspapers – those with a
Sunday circulation of 250,000 or more – were the most likely to suffer
layoffs in 2020, with more than half of them experiencing staff cuts. That is
unlike 2019, when cuts were roughly similar across the different tiers of
circulation groups studied. Meanwhile, digital-native news outlets saw a slight uptick in
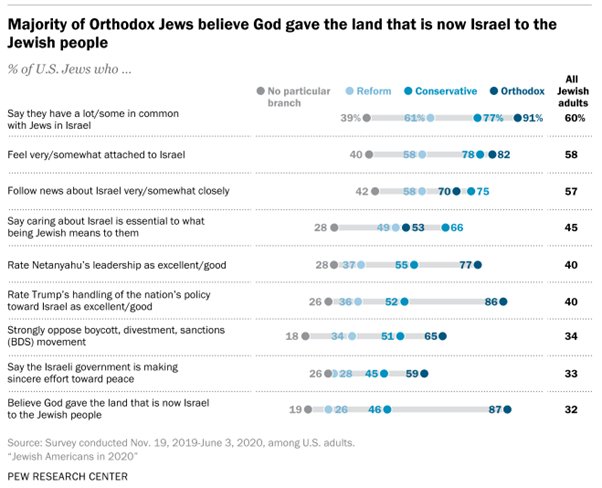
layoffs in 2020 compared with 2019. (PEW) MAY 21, 2021 45% Of US Jewish Adults, And An Additional
37% Say Caring About Israel Is Important, But Not Essential Israel, the world’s only Jewish-majority
country, is a subject of special concern to many Jews in the United States.
Caring about Israel is “essential” to what being Jewish means to 45% of U.S.
Jewish adults, and an additional 37% say it is “important, but not
essential,” according to a new Pew Research Center survey that was fielded from Nov. 19, 2019,
to June 3, 2020 – well before the latest surge of violence in the region. Just 16% of U.S. Jewish adults say that
caring about Israel is “not important” to their Jewish identity. (PEW) MAY 21, 2021 (Canada) Liberals (38%) in the Driver’s Seat over
Conservatives (29%) as Vaccination Rollout Hits its Stride If the election were held tomorrow, 38% of
decided voters would vote for the Liberal Party led by Justin Trudeau,
unchanged since Ipsos/Global News post-budget survey last month. Three in ten
(29%) would vote for Erin O’Toole’s Conservative Party, up 2 points since
last month. Two in ten (21%) decided voters would cast their ballot for their
local NDP candidate, led by Jagmeet Singh, also up 2 points. Yves-Francois
Blanchet and the Bloc would receive 6% of the vote nationally, down 1 point
(or 30% of the popular vote within in Quebec). (Ipsos Canada) 18 May 2021 Seven In Ten (70%) Canadians Believe Summer
2021 Will Be A Disappointment Given The Ongoing Covid Restrictions Given the ongoing COVID-19 restrictions
that have been implemented throughout the country, a strong majority (70%) of
Canadians agree (21% strongly/49% somewhat) that this summer will be a
disappointment, according to a new Ipsos poll conducted on behalf of Global
News. Those residing in Ontario and Atlantic provinces are the most likely to
agree that summer 2021 will be a disappointment, while those in Quebec are
least likely to agree (75%, 75% vs 62%). Perhaps not surprising, those who
have not been
vaccinated are more likely to agree that this summer will be a disappointment
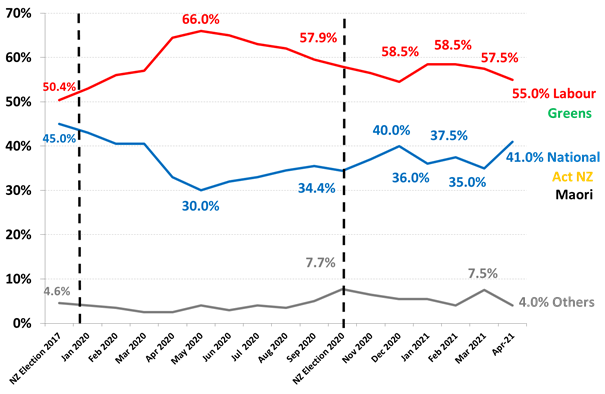
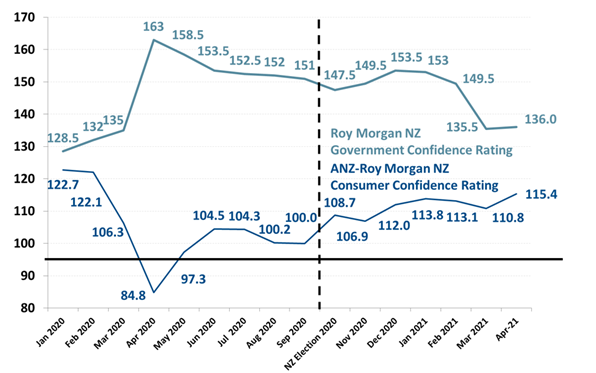
compared to those who have been vaccinated (74% vs 67%). (Ipsos Canada) 20 May 2021 AUSTRALIA (New Zealand) New Zealand Government Lead Over Opposition Down To 14% In
April – Smallest Lead Since January 2020 The governing parties are now 14% points
ahead of the Parliamentary opposition National/Act NZ/Maori Party on 41%, up
6% points since March. Support for National has now recovered to its highest
since last year’s election, up 6.5% points to 29.5%, and is the highest for
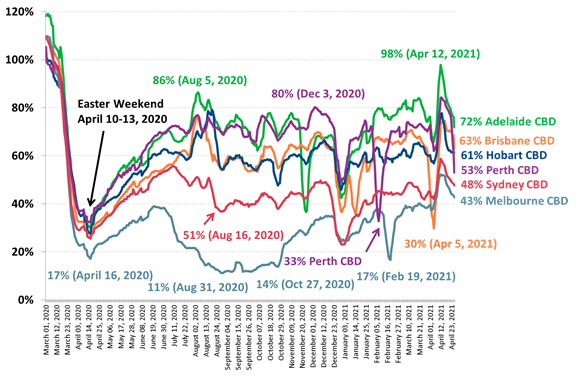
exactly a year since April 2020 at the start of the COVID-19 pandemic. (Roy Morgan) May 03 2021 (Australia) Movement In The Sydney, Melbourne And Adelaide Cbds Drops
In Late April After Hitting Covid-19 Highs Over The Easter Holidays Since school holidays ended average 7-day
movement levels have declined across all Capital City CBDs including the
Melbourne CBD (down 9% points to 43%), Sydney CBD (down 11% points to 48%),
Brisbane CBD (down 12% points 63%) and Hobart CBD (down 16% points to 61%).
The largest declines in average movement were seen in the Adelaide CBD
(26%-point decline to 72%) and the Perth CBD which experienced a sharp 31%-point
decline to 53% average movement as the city entered a snap three-day lockdown
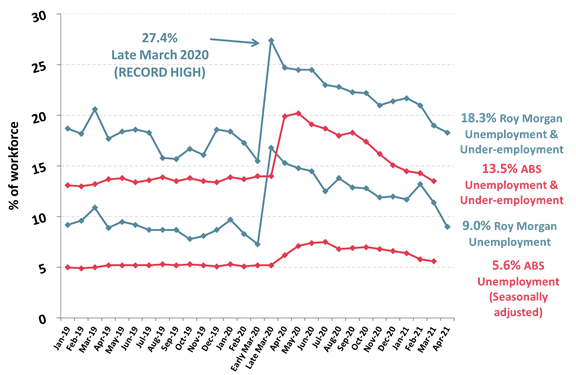
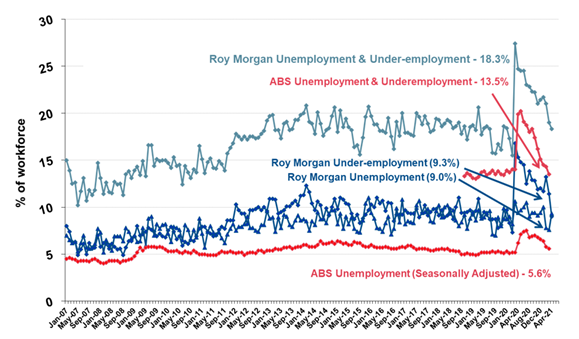
over the three-day ANZAC Day weekend. (Roy Morgan) May 03 2021 Australian Employment Hits A Record High
Above 13 Million In April – Unemployment Down, But Offset By Rising
Under-Employment 13,291,000 Australians were employed, up
542,000 from March driven by an increase in part-time employment, up 413,000
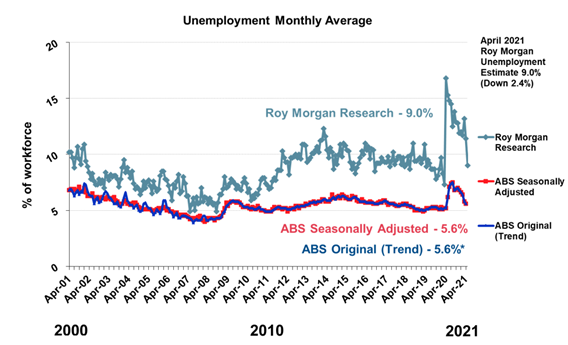
to a record high 4,757,000. Full-time employment was up 129,000 to 8,534,000. Unemployment dropped in April to its lowest since
early March 2020 (pre-pandemic): 1,307,000 Australians were
unemployed (9.0% of the workforce),
down 332,000 from March. There were fewer people looking for both full-time
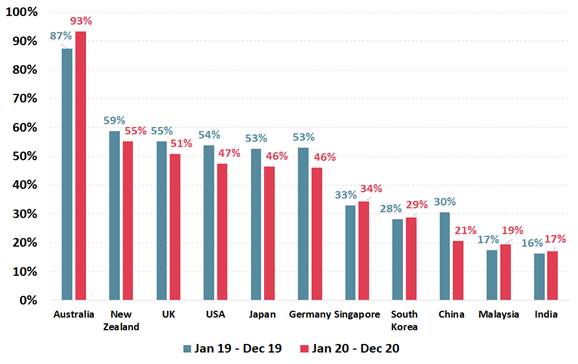
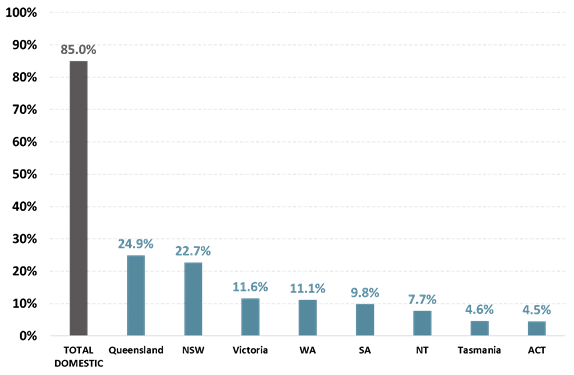
work (down 75,000 to 593,000), or part-time work (down 257,000 to 714,000). (Roy Morgan) May 06 2021 A Huge Majority Of 93% Of Australians Said
They Are More Likely To Buy Products Made In Australia A huge majority of 93% of Australians said
they are more likely to buy products made in Australia – up from 87% a year
earlier. The big ‘loser’ during 2020 was Chinese-made goods with only 21% of
Australians saying they’d be more likely to buy products made in China, a 9%
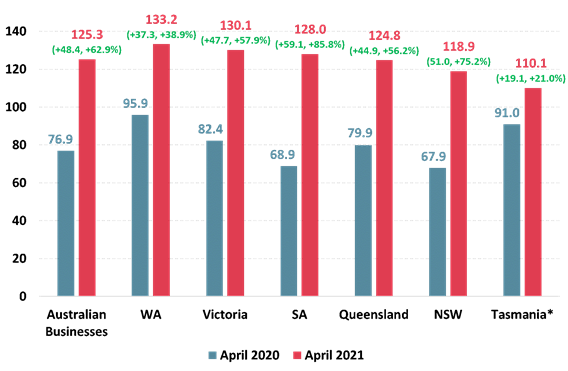
points drop from 2019. (Roy Morgan) May 10 2021 Roy Morgan Business Confidence Hits 7-Year
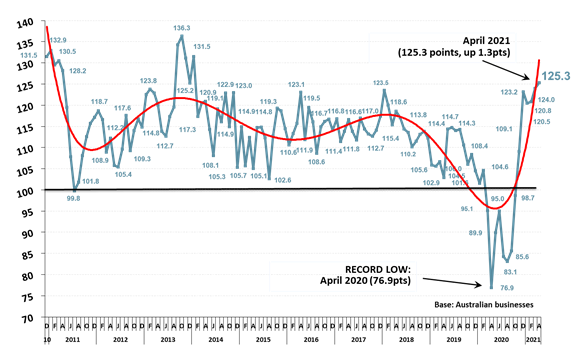
High Of 125.3 In April – Up 48.4 Pts (+62.9%) On A Year Ago Business Confidence is now 11.6pts above
the long-term average of 113.7 and nearly two-thirds, 65%, expect ‘good
times’ for the Australian economy over the next 12 months and an increasing
majority of 59.5% of businesses said the next 12 months is a ‘good time to
invest in growing the business’. Business Confidence has now averaged 122.7
during the first four months of 2021, the best start to a year for the Index
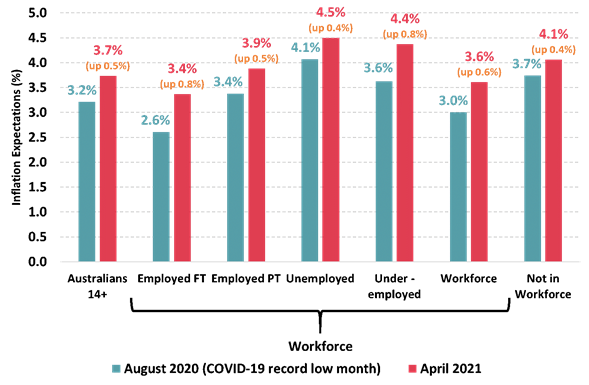
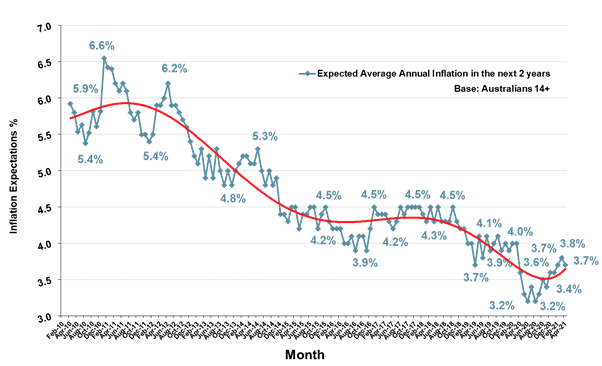
for a decade since 2011 – during the middle of the ‘Mining Boom’. (Roy Morgan) May 11 2021 Inflation Expectations Virtually Unchanged
At 3.7% In April – Far Higher For Unemployed (4.5%) Than Full-Time Employees
(3.4%) Inflation Expectations are now 1% point
below their long-term average of 4.7% but have increased by 0.5% points since
reaching a record low of only 3.2% in August 2020. This is far higher than
Australians employed either part-time on 3.9% (up 0.5% points) or full-time
on 3.4% (up 0.8% points). Interestingly, Australians who are employed
part-time but want more work, the under-employed, have Inflation Expectations
of 4.4% (up 0.8% points) – almost as high as the unemployed. (Roy Morgan) May 11 2021 5.68 Million Australians (26.9% Of Those
Aged 14+) In The March Quarter 2021, Intend To Take A Holiday During The Next
12 Months Of these travellers there were 5.24 million
set on taking a domestic holiday and a further 340,000 planning an overseas
holiday – although according to this week’s Federal Budget the international
borders are set to remain closed for holidaymakers until early next year.
There were a small number of prospective travellers who couldn’t decide
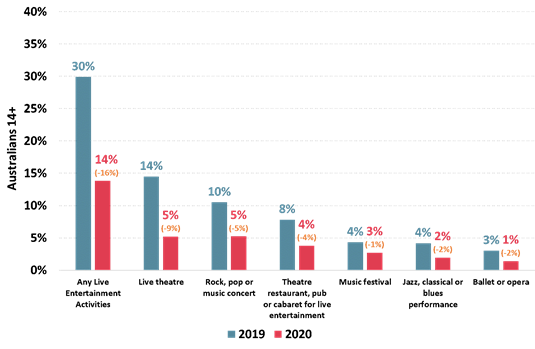
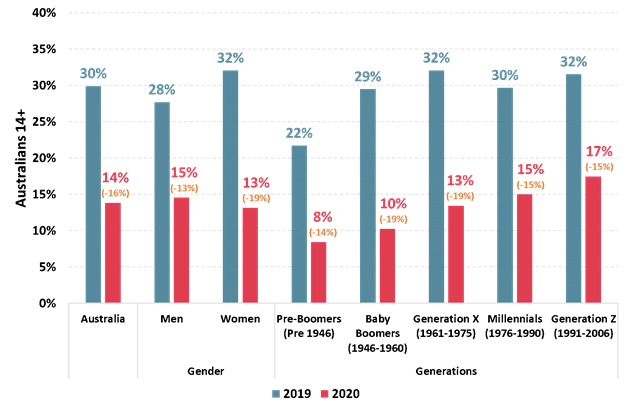
whether their holidays would be domestic or international. (Roy Morgan) May 14 2021 In 2020 Just 14% Of Australians Aged 14+ Attended Live Entertainment
Activities Such As Theatre, Rock, Pop Or Music Concerts Only 5% of Australians attended live
theatre in an average three months in 2020, down from 14% in 2019, and just
5% went to rock, pop or music concerts, compared to 10% in 2019. Attendance
at other activities including theatre restaurants, music festivals, jazz,
classical, blues, ballet or opera performances also plunged during 2020. The
re-opening of Australia that has occurred in 2021 and the rollout of the
COVID-19 vaccines this year should lead to a boost in attendance at live
entertainment activities although the threat of outbreaks means it is
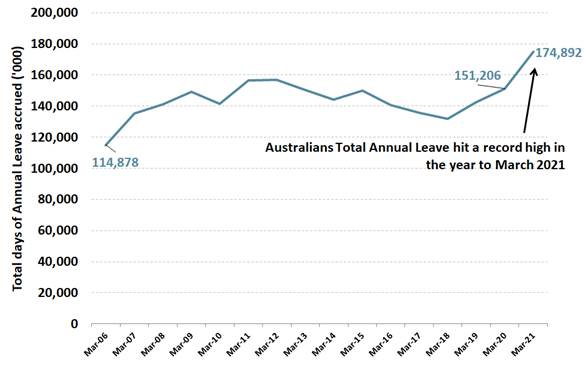
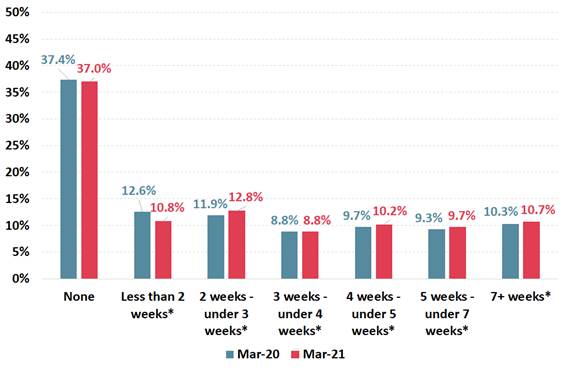
unlikely to approach the levels of 2019 just yet. (Roy Morgan) May 18 2021 Australians Have Nearly 175 Million Days Of
Annual Leave Due – Up Over 23 Million Days From Early 2020 The accrued annual leave of nearly 175
million days is a record high total of accrued annual leave and represents an
increase of 23.7 million (+15.7%) on the 151.2 million days of accrued annual
leave Australians had available prior to the COVID-19 pandemic. Now over 6.69
million Australians (52.2% of paid workers) have at least 2 weeks of annual
leave due, up from 6.14 million prior to the pandemic, while fewer than 1.38
million (10.8%) have less than 2 weeks due compared to over 1.54 million
(12.6%) pre-pandemic. (Roy Morgan) May 18 2021 In 2020 Only 24% Of Australians Said They’d
Be More Likely To Buy Clothes If They Knew The Clothes Were ‘Made In China’,
Down 7% Points From 2019 In 2020 only 24% of Australians said they’d
be more likely to buy clothes if they knew the clothes were ‘Made in China’,
down 7% points from 2019. The same trend was evident for Chinese-made
electrical goods with 23% (down 5% points from 2019) of Australians saying
they’d be more likely to buy the product if they knew it was ‘Made in China’,
mobile phones on 22% (down 4%), footwear on 17% (down 6%) and sporting goods
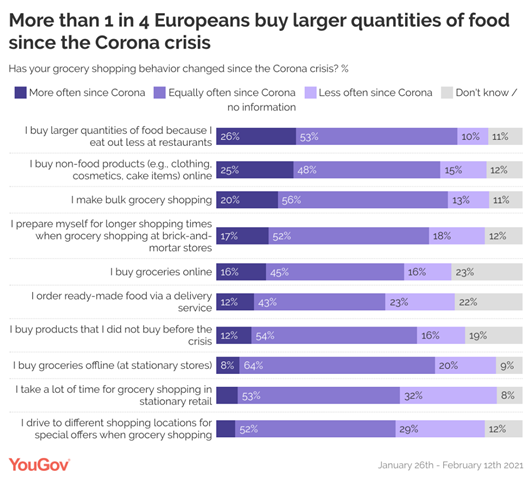
on 14% (down 3%). (Roy Morgan) May 18 2021 MULTICOUNTRY STUDIES A Closer Look At The European Criteria For Grocery Purchases
Shows That The Main Criteria Are Product Quality (88%) And Good Prices (82%) A closer look at the European criteria for
grocery purchases shows that the main criteria are product quality (88%) and
good prices (82%). Sustainable development is less important (53%), but
there are differences between countries. Italians (72%), Turks (72%) and
Spaniards (70%) consider the sustainability of products more important, while
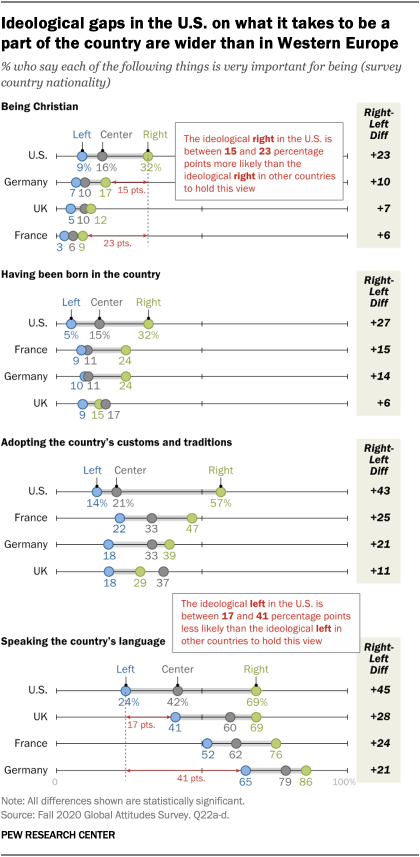
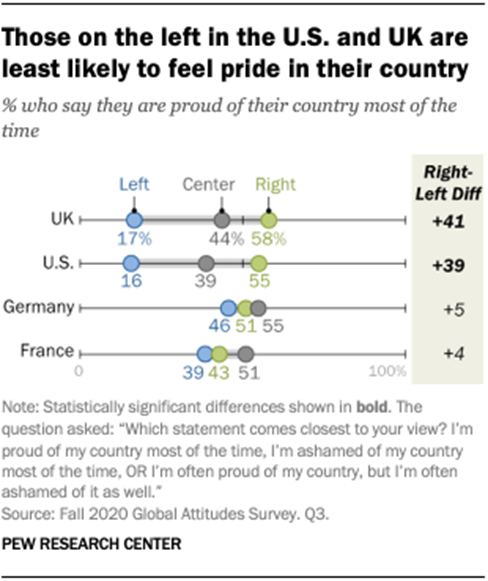
Norwegians (29%), Danes (39%) and Finns (41%) consider it less important. (YouGov Finland) May 4, 2021 Source: https://yougov.fi/news/2021/05/04/eurooppalaiset-kuluttajat-ovat-muuttaneet-ostotott/ Ideological Divisions Over Cultural Issues
Are Far Wider In The U.S. Than In The UK, France And Germany When it comes to the importance of
being born in the
country, around a third on the U.S. right (32%) think it is very important
for being American, compared with no more than 24% of those on the right in
any other country. Similarly, those on America’s ideological right (57%) are
more likely than their counterparts in France (47%), Germany (39%) and the UK
(29%) to say that sharing national customs and traditions is very important
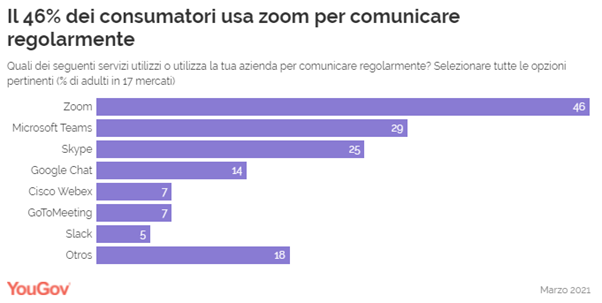
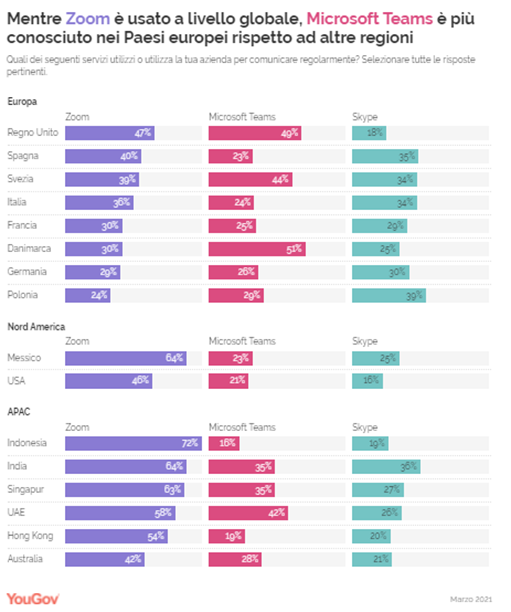
to national identity. (PEW) MAY 5, 2021 Nearly Half (46%) Of Consumers In 17 Global
Markets Use Zoom To Communicate Regularly Since the advent of COVID-19, Zoom has
become more than just a workmate, becoming in some markets even a verb
(“Let's Zoom!”) Or a real synonym for “video call”. Now, as parts of the
world slowly emerge from restrictions and more people return to the office,
YouGov data shows just how popular Zoom is and how it compares to other
competing services. Nearly half (46%) of consumers in 17 global markets
use Zoom to communicate regularly, while about three in ten (29%) use
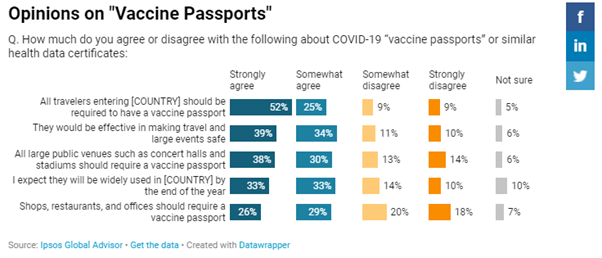
Microsoft Teams and a quarter (25%) use Skype. (YouGov Italy) May 10, 2021 Source: https://it.yougov.com/news/2021/05/10/global-data-la-popolarita-di-zoom-rispetto-ad-altr/ About Three Out Of Four Adults Globally
Agree That In Order To Enter Their Country, Travelers Are Required To Have
Covid-19 Vaccine Passports 78% agree that travelers must have a
vaccine passport in order to travel into their country. The countries
that agree most are Malaysia (92%) and Peru (92%).73% agree that vaccine
passes would be effective in making travel and major events safe; a
majority in each country agrees - from 84% in China and Argentina to 52% in
Hungary. 55% agree that vaccine passports should be required in shops,
restaurants and offices in all countries. Those who support this most
are India, where 78% agree, and those who support it least are in Poland
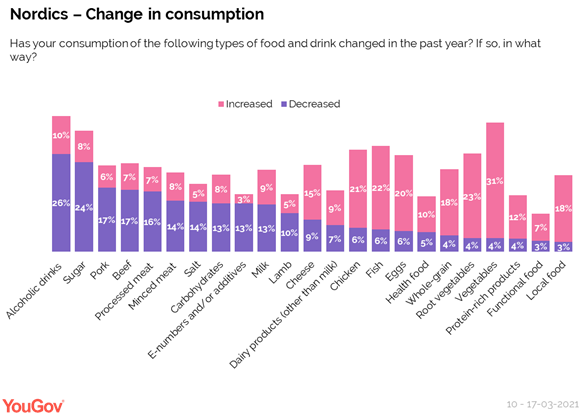
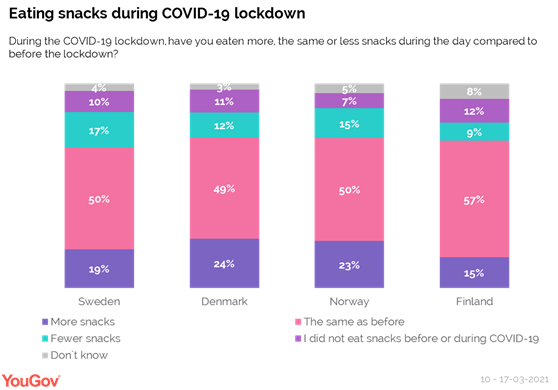
(55%), the United States (52%) and Belgium (52%). (Ipsos Denmark) 11 May 2021 Source: https://www.ipsos.com/da-dk/den-globale-befolkning-stotter-op-om-coronapas-til-internationale-rejser The Majority Of Nordic Countries State That
They Eat Healthier In The Form Of More Vegetables (31%) And Less Alcohol
(26%) And Sugar (24%) Across the Nordic countries, the majority
state that they eat healthier, eg in the form of more vegetables (31%) and
less alcohol (26%) and sugar (24%), Many have also cut back on meat -
primarily beef (17%), pork (17%) and processed meat (16%). In all four
countries, the intake of snacks has increased - but mostly in Denmark and
Norway, where a quarter (24% and 23% respectively) state that they have eaten
more snacks during lockdown. It is especially women, the younger part of
the population and households with children who have increased their snack
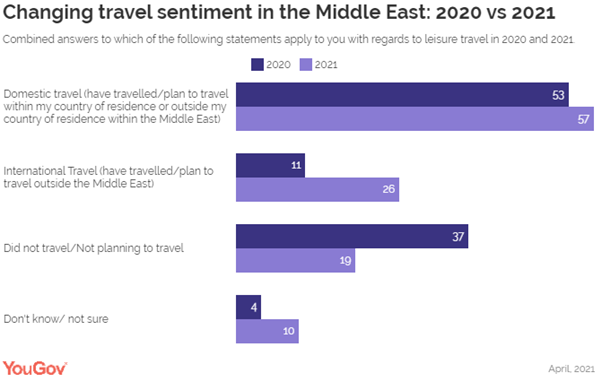
intake. (YouGov Denmark) May 16, 2021 Source: https://yougov.dk/news/2021/05/16/hvordan-har-et-ar-med-corona-pavirket-vores-madvan/ In UAE And Saudi, The Intent To Travel
Domestically Or Within The MENA Region Increased Slightly Data from the study shows six in ten
surveyed respondents (59%) in the UAE and Saudi Arabia said they took a
leisure trip (domestic or international) in 2020. In 2021, an appetite for
travel has improved, and more than seven in ten (72%) residents said they
have already or intend to travel this year. This is one of the highest rates
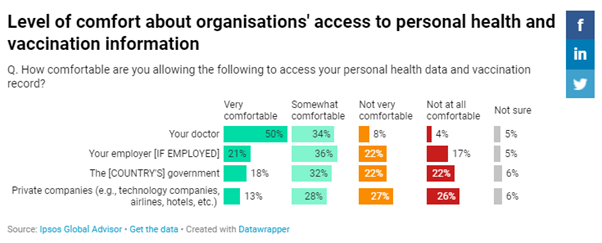
in the world. (YouGov MENA) Source: https://mena.yougov.com/en/news/2021/05/17/appetite-travel-recovers-middle-east-majority-resi/ 45% Of The Global Population Is Concerned
About Sharing Their Personal Information Digitally More than half of people in the American
continent (54%) feel concerned about sharing their information digitally. The
share of concerned people in other areas of the world remains significant: in
the APAC region, 45% are concerned about sharing personal information
digitally, and in Europe 43%. Interestingly, the Africa region experienced a
very significant drop of 22 points compared to last year (from 50% to 28%). (WIN) Globally, About Three In Four
Adults (78%) Are In Favor Of Requiring A Vaccination
Passport For Travelers Globally, about three in four adults (78%) are in
favor of requiring a vaccination
passport for travelers wishing
to enter their country. They are slightly less numerous in France: seven
out of ten are in favor (including 40%
'very favorable') , a similar proportion with the United
States and the Germans. A majority is in any case convinced of its
effectiveness in making travel and major events more secure in terms of
health (73% worldwide - France is a
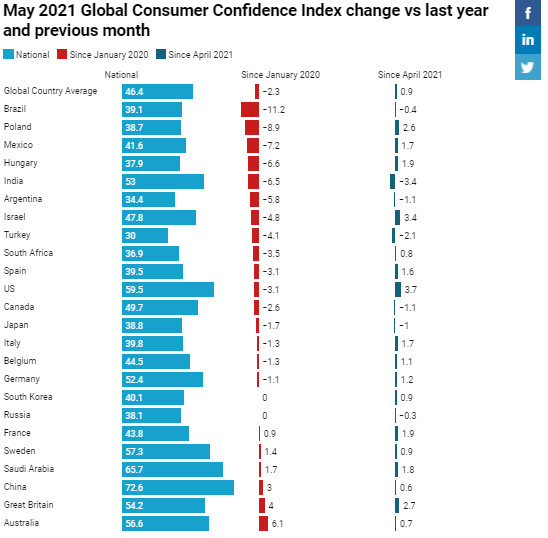
little below 65%) . (Ipsos France) May 17, 2021 Ipsos’s Global Consumer Confidence Index
Shows A Month-To-Month Gain Of Nine-Tenths Of A Point, Sitting Just 2.3
Points Below Its Pre-Pandemic Level Of January 2020 Eight countries have a National Index above
50: China (72.6), Saudi Arabia (65.7), the U.S. (59.5), Sweden (57.3),
Australia (56.6), Great Britain (54.2), India (53.0) and Germany (52.4). Only
two countries have a National Index below 35: Turkey (30.0) and Argentina
(34.4). Once again, the three countries in the survey showing the highest
levels of month-over-month growth (the U.S., Israel, and Great Britain) are
also those leading in vaccination rollout as per Oxford University data. (Ipsos Egypt) 19 May 2021 Source: https://www.ipsos.com/en-eg/global-consumer-confidence-eighth-month-row About Six-In-Ten American Adults (62%),
Including Majorities In Nearly Every Demographic Group, Support Increasing
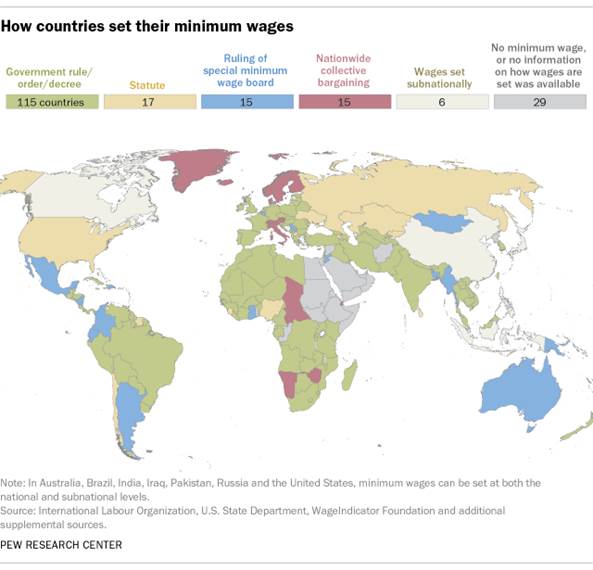
The Minimum Wage To $15 An Hour Most Americans favor raising the federal
minimum wage, which has been $7.25 an hour since 2009. About six-in-ten
adults (62%), including majorities in nearly every demographic group, support
increasing the minimum wage to $15 an hour. Even among the 38% of Americans
who oppose a $15 minimum, most say they’d support a smaller increase,
according to an April Pew Research Center survey. (PEW) MAY 20, 2021 ASIA
689-691-43-01/Poll The
Population Of China Increased By 5.38 Percent To 1.41 Billion In 2020 Census Compared
With An Increase Of 5.84 Percent To 1.34 Billion In The 2010 Census
BEIJING--China’s population growth in the
decade to 2020 slumped to the least in official records dating back to the
1950s, fueling pressure on Beijing to ramp up incentives to couples to have
more children and avert an irreversible decline. With growth having slowed ever since a
one-child policy was introduced in the late 1970s, the 2020 results of the
country’s once-a-decade census, published on Tuesday, showed the population
of mainland China increased 5.38 percent to 1.41 billion. That compared with an increase of 5.84
percent to 1.34 billion in the 2010 census, and double-digit percentage rises
in all of China’s previous six official population surveys dating back to
1953. The number meant China narrowly missed a
target it set in 2016 to boost its population to about 1.42 billion by 2020.
In 2016, China replaced its one-child policy--initially imposed to halt a
population explosion at the time--with a two-child limit. In recent months, China’s state media has
been increasingly bleak on the outlook, saying the population may start to
shrink in the next few years. The United Nations predicts the number of
people living in mainland China will peak in 2030 before declining. But in late April, the Financial Times
newspaper said the population actually fell in 2020 from a year earlier,
citing unidentified people familiar with the matter. The 2020 number was actually slightly
higher than the 1.4005 billion in 2019 estimated in a smaller official survey
released in February last year. China has long worried about its population
growth as it seeks to bolster its economic rise and boost prosperity. One bright spot in the census data was an
unexpected increase in the proportion of young people--17.95 percent of the
population was 14 or younger in 2020, compared with 16.6 percent in 2010. FALLING BIRTH RATE From 2016 to 2019, the annual birth rate
mostly declined with the exception of 2016. China has yet to disclose the
birth rate for 2020. “A sharp decline in the number of births is
a sure thing, and all kinds of evidence support this claim,” said Huang
Wenzheng, a demography expert at the Center for China and Globalization, a
Beijing-based think-tank. “It doesn’t take published census data to
determine that China is facing a massive drop in births,” Huang said. Even if
China’s population didn’t decline in 2020, the expert said, “it will in 2021
or 2022, or very soon.” Urban couples, particularly those born
after 1990, value their independence and careers more than raising a family
despite parental pressure to have children. Surging living costs in China’s big cities,
a huge source of babies due to their large populations, have also deterred
couples from having children. According to a 2005 report by a state
think-tank, it cost 490,000 yuan ($74,838) for an ordinary family in China to
raise a kid. By 2020, local media reported that the cost had risen to as high
as 1.99 million yuan--four times the 2005 number. “Having a kid is a devastating blow to
career development for women at my age,” said Annie Zhang, a 26-year-old
insurance professional in Shanghai who got married in April last year. “Secondly, the cost of raising a kid is
outrageous (in Shanghai),” she said, in comments made before the 2020 census
was published. “You bid goodbye to freedom immediately after giving birth.” (Asahi Shimbun) May 11, 2021 Source: http://www.asahi.com/ajw/articles/14346249
689-691-43-02/Poll Japan’s
Population Of Children Under 15 Shrank By 190,000 From A Year Earlier
Children in
that age group account for 11.9 percent of the entire population, the lowest
level in the world, according to the ministry. The figure was 0.1 percentage
point down from the previous year. The
percentage has now dropped for 47 straight years. On the other
hand, people 65 or older account for 28.9 percent of the population, up 0.3
percentage point from the previous year. Although the
government has long vowed to battle the demographic change, the numbers show
that Japan’s declining birthrate and the graying of society have progressed further. The ministry
released the numbers to mark Children’s Day, a national holiday, on May 5. Among those
under 15 years old, 7.65 million are boys and 7.28 million are girls. Japan has
3.24 million children between 12 and 14, and 2.65 million who are 2 years old
or younger, the data showed. The younger
the age, the smaller the ratio of the overall population. In 1950,
children under 15 accounted for 35.4 percent of the population because of the
first baby boom. But the
ratio started declining. In 1997, people
65 or older made up 15.7 percent of the population, exceeding the 15.3
percent for those under 15. The ministry
compared Japan’s ratio of children with those in other countries with
populations of 40 million or more. Japan’s
percentage was the lowest, although the ministry said it was difficult to do
a strict comparison because the timing of the countries’ population surveys
was different. South
Korea’s ratio was the second lowest, at 12.2 percent as of July 1, 2020,
followed by Italy, at 13.3 percent as of July 1, 2018, and Germany, at 13.6
percent as of Jan. 1, 2019. (Asahi
Shimbun) May 5, 2021 Source: http://www.asahi.com/ajw/articles/14342995 689-691-43-03/Poll 44 Percent Of Japanese People Are In Favor
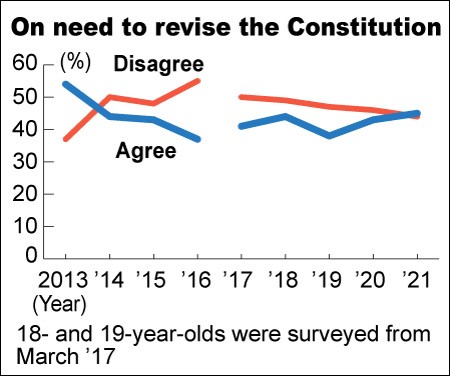
Of Revisions In Constitution
Voters were
nearly equally divided on whether the Constitution should be revised,
according to a survey by The Asahi Shimbun. The survey,
conducted ahead of Constitution Day on May 3, showed 45 percent backed
constitutional revisions, up from 43 percent in last year’s survey, while 44
percent said changes were unnecessary, down from 46 percent. The gap
between the two camps was the narrowest since the 2013 survey. The Asahi
Shimbun began the annual survey on how the public views proposals for
amending the Constitution, a key agenda pushed by Shinzo Abe, who was prime
minister from December 2012 to September 2020. The ruling Liberal Democratic
Party, led by Prime Minister Yoshihide Suga, is also seeking revisions. The
Constitution, drafted during the U.S.-led postwar occupation of Japan, has
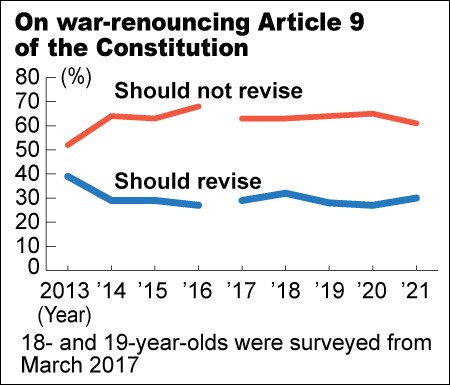
never been revised since it went into force in 1947. War-renouncing
Article 9 of the Constitution has long been a target of those who want
changes, including Abe. According to
the survey, 61 percent supported the article as it is, more than double the
30 percent who were in favor of revising it. In the 2020
survey, 65 percent were opposed to revising Article 9, while 27 percent
backed an amendment. Fifty-five
percent of voters in their 30s were in favor of constitutional revisions, the
largest group by age. Voters in their 70s or older were the least
enthusiastic about amendments, with only 35 percent backing revisions. In the
survey, respondents were asked to choose up to three reasons from among eight
provided. Among
pro-revision voters, the most common reason selected for their stance
was “a lack of sufficient provisions concerning defense,” at 58 percent,
followed by the Constitution is “getting old,” at 46 percent, and “it does
not reflect the national characteristic because it was imposed by the United
States,” at 35 percent. The three
most common answers chosen by respondents against revisions were: “the
Constitution brought peace to Japan,” at 71 percent; “there is no major
problem with the Constitution that needs to be revised,” at 41 percent; and
“the Constitution has taken root among the public,” at 40 percent. Asked if
they thought about the supreme law in their daily life, 68 percent of all respondents
chose “not at all” or “not so much,” while 30 percent chose “often” or
“sometimes,” the survey showed. It also
found that 61 percent of respondents in favor of revisions do not give much
thought or pay close attention to the Constitution, while 39 percent said
they do. The survey
also showed the text of Article 9 and asked the voters for their views. In the 2013
survey, 52 percent were opposed to revising Article 9, while 39 supported
changes. But in the
following surveys, including the latest one, more than 60 percent of
respondents rejected amendments to the article. Asked to
choose from among four answers to the question of whether momentum is
building for revisions, 19 percent chose “significantly” or “to some extent.” In
comparison, 76 percent picked the remaining two answers: “not at all” or “not
so much.” The ratio of
respondents who think momentum is gathering for constitutional revisions was
22 percent in 2019, 21 percent in 2020 and 19 percent in 2021. The
comparable figures for those who feel otherwise was 72 percent in 2019, 76
percent in 2020 and 76 percent in 2021. The LDP
is pushing to add an article to the Constitution that allows the Cabinet to
issue a directive under a state of emergency and temporarily restrict
people’s rights during contingencies, rather than waiting for the Diet to
enact a law. When voters
were asked about the emergency article for the first time in the 2019 survey,
and given three answers to choose from, 55 percent picked Japan should
“respond to emergencies without revising the Constitution.” The figure
in the latest survey was 54 percent. Thirty-three
percent chose “the Constitution should be revised to deal with emergencies,”
up from 28 percent in 2019. Six percent
in the latest survey selected “there is no need to revise the Constitution in
the first place” in relation to emergencies. The survey
was conducted between early March and mid-April by sending questionnaires to
3,000 eligible voters selected randomly across the nation. Valid answers were
received from 2,175 respondents, or 73 percent of the total. (Asahi
Shimbun) May 3, 2021 Source: http://www.asahi.com/ajw/articles/14342228 689-691-43-04/Poll Two In Five (19%) Indians Have Shown
Willingness To Buy Pre-Owned/Second-Hand Cars
The
coronavirus-induced economic slowdown impacted many industries and
businesses, including the automotive sector. India's second COVID
wave might derail the country’s economic recovery, adding to the worries
of carmakers. YouGov’s latest study looks into the impact of the pandemic on
the auto industry and reveals how car purchase plans have changed post the
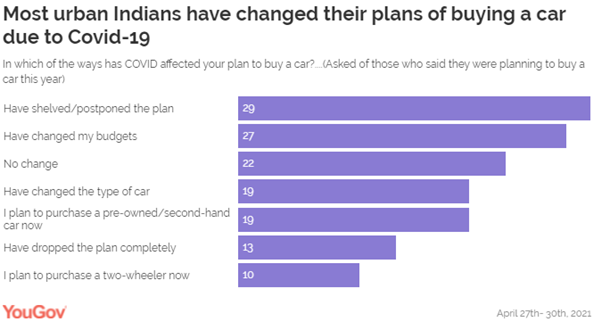
second wave. As the
vaccination drive began in India and Covid was believed to be under control
early this year, three in ten (29%) urban Indians said they were planning to
buy a car, the data reveals. However, the second wave of the pandemic has
disrupted their planning and only one in five (22%) out of them are likely to
go ahead with their plan of buying a car, while some (13%) have completely
given up their plan or have switched the category of the vehicle; to a
two-wheeler now instead of a car (10). Others
experienced changes in the form of postponement of their plan to buy a car
(29%), change in their budget (27%) or change in the car type that they
planned to buy (19%). Interestingly, two in five (19%) respondents have shown
willingness to buy pre-owned/second-hand cars, which is a positive sign for
pre-owned car dealers.
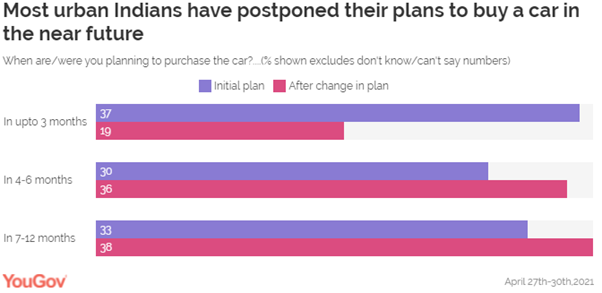
Not only
plans, but the second wave of the pandemic has also even disrupted the
timelines to buy a car. Initially, almost two in five (37%) consumers were
planning to make a purchase within three months. However, with the second
wave hitting the country, this number has fallen to 19%. Most people
seem to have pushed their car buying decisions to a later period and are
looking to purchase a car somewhere between 4-6 or 7-12 months from now.
Likewise,
there have been changes in the car types that people want to purchase now,
with many turning towards more value-conscious options. Before the second
wave, hatchbacks were the most popular cars people wanted to buy, followed by
premium hatch cars. Preferences
have changed post the second wave of the pandemic and entry-level sedans
(Dzire, Amaze, Tigor, Altroz, etc) have seen the greatest shift in demand
between the two periods. From 13% who were planning to buy this model earlier
this year to 21% looking to buy this type of car now. On the other hand,
premium sedans have seen a decline (from 11% to 5%). Premium
hatchbacks and MUVs have also seen a growth in preference by 3% each.
Within the
SUV segment, the demand for compact (11%) mid (7% vs 6%) & premium SUVs
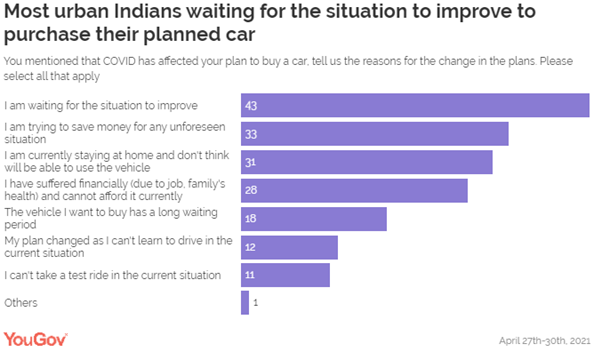
(6%) remained static. Although
people admit to their plans getting affected by the pandemic, their reasons
to change their plans vary. A large majority of people are waiting for the
situation to improve (43%), hence, delaying their plans to buy a car by few
months. 28% have
suffered financially (job/health) to stick with their planned purchase while
a third are holding back as they want to save money for unforeseen situations Some (31%)
have voiced their inability to use a vehicle because of staying home for an
extended period as the reason to change their plan.
Commenting
on this, Sanjeev Jha of YouGov India,
said, “The pandemic has brought about marked changes in consumers’ car
buying plans in India. The outbreak has affected customers’ finances, driving
a conservative outlook in them and diverting them to more immediate needs. As
consumers wait for the situation to improve, auto manufacturers will have to
understand changing consumer preferences and devise innovative strategies to
offer cost-effective or better financing options to them. Regular
understanding of the changing plans of customers will help the automakers
efficiently plan their production and inventory management at the dealers’
end. The players in the pre-owned car market should reach out to the
prospective customers aggressively and offer the safety of a car at a
pocket-friendly price.” (YouGov
India) May 11, 2021 Source: https://in.yougov.com/en-hi/news/2021/05/11/most-urban-indians-wanting-buy-car-have-delayed-th/ 689-691-43-05/Poll New Prime Minister Of South Korea Kim
Bu-Gyeom "Conformity" 38% Vs "Nonconformity" 26%
As a result
of a survey of 1,000 adults on the 11th to 13th days before the appointment
of Prime Minister Kim, by Gallup Korea (±3.1%
points in the 95% confidence level of the sample error), 38% of respondents
said that Prime Minister Kim is suitable for the post of Prime Minister. More
than 26% of respondents said they didn't. 36% declined to comment. The response
that it was appropriate both before and after the personnel hearing was more
than the response that it was inappropriate. In the April 20-22 survey
immediately after the Prime Minister's nomination, 34% of'conformity' and 18%
of'nonconformity'. In this survey, after the personnel hearing, opinion
reservations decreased, and both conformity and nonconformity consensus
increased. It is also
peculiar that the opinion of'conformity' is predominant in the
characteristics of most respondents. The response that it is suitable
for all regions and age groups predominated. In particular, Gallup
pointed out that "public opinion in Gwangju, Jeolla, Daegu, and
Gyeongbuk is often opposed, but for candidate Kim Bu-gyeom, it is remarkable
that 40% of candidates are suitable for both regions." The
characteristics of the respondents with the predominance of nonconformity
were the support of the people (45%), ideological conservative tendencies
(37%), and negative evaluators for the performance of the presidential duties
(38%). At 29%, it was not a pattern that was largely focused on inadequacy. 76% of
"personnel hearings need to be publicly verified not only of abilities
but also of morality" Together
with Democratic Party representative Song Young-gil, speaking at the Supreme
Council Meeting held at the National Assembly in Yeouido, Seoul on the
14th. Representative Song insisted that the personnel hearing should be
a two-track verification of competence and morality, but the public opinion
surveyed that 71% opposed it. News 1 Responding
to the proposal that "a two-track personnel hearing should be conducted
to verify the candidate's ability to be public and morality to be privately
verified," 76% of the survey respondents indicated that "the
candidate's morality and policy ability should both be publicly
verified." 19% of respondents said, "Let's keep the morality
verification private and the policy capability verification public." The
two-track proposal for a personnel hearing was discussed with the opposition
parties at the end of last year, and President Moon Jae-in also expressed
similar opinions in the recent 4th anniversary special speech. However,
unlike the political world, this proposal is far from the sentiment of the
people. In the same
questionnaire,'morality' and'policy ability' were tied at 47%, respectively,
to the question of whether morality and policy ability should be prioritized
when verifying candidates at a personnel hearing. However,
even if only those who answered that competency verification should be
prioritized over morality in this question, 69% of the respondents said that
"morality should also be publicly verified" for the personnel
hearing method was found to be far more dominant. (Gallup
Korea) 2021.05.14 Source: https://www.hankookilbo.com/News/Read/A2021051412010000940 689-691-43-06/Poll Public Verification Of Personnel Hearings, 'Morality'
76 Percent Vs 'Policy Ability Only' 19 Percent
When Gallup
Korea asked 1,000 men and women over the age of 18 on the 11th to 13th of the
year, 76% of respondents chose'open verification of both morality and policy
capabilities'. Only 19% of
respondents chose'private verification for morality and public verification
for policy capabilities'.5% reserved their opinion. In the same
survey in November of last year, 71% of'open verification of all policies'
and 23% of'public verification of policy capabilities only' yielded similar
results. When asked
whether morality and policy ability should be prioritized when verifying
candidates at the personnel hearing,'morality' and'policy ability' were tied
at 47% each. In
particular, those in their 20s and 30s who gave priority to'policy ability'
were 65% and 62%, respectively, higher than those of other age groups. New Prime Minister Kim Bu-gyeom goes to work (Seoul = Yonhap
News) Reporter Seung-Doo Kim = New Prime Minister Kim Bu-gyeom is on the
morning of the 14th to work at the Sejong-ro Government Complex in
Seoul.President Moon Jae-in approved the appointment of Prime Minister Kim at
7 am on the same day.2021.5.14 kimsdoo@yna.co.kr When asked
about the suitability for the appointment of the new Prime Minister Kim
Bu-gyeom, 38% of the voters answered that it is'suitable' and 26% answered
that it is'not suitable'.36% declined to comment. The margin
of error for this survey is ±3.1%
with a 95% confidence level. (Gallup
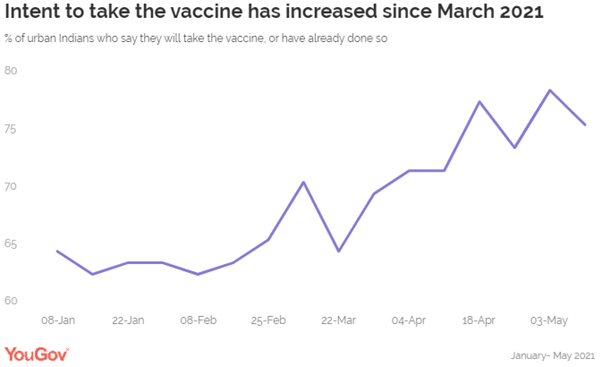
Korea) 2021-05-14 Source: https://www.yna.co.kr/view/AKR20210514062000001?input=1195m 689-691-43-07/Poll Nearly Two-Thirds Of Urban Indians (64%)
Are Worried They May Become Seriously Unwell Or Die Due To COVID
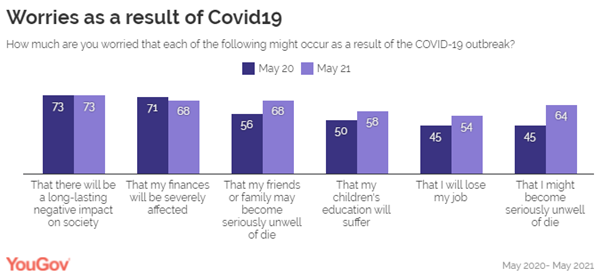
Nearly
two-thirds of urban Indians (64%) are worried they may become seriously
unwell or die due to Covid, YouGov’s latest data reveals. YouGov’s
Covid19 Public Monitor has been tracking the public sentiment around the
virus since last year when the pandemic first broke out in the world.
In May 2020, at the outset of the pandemic, only 45% of urban Indians were
worried about their personal health getting affected due to covid. A year
later as India faces a much deadlier wave of the virus with limited
healthcare facilities; this number has gone up to 64%.
With more
people contracting the virus this year, concerns over personal health have
intensified over the year; with a 19-percentage point increase between the
two periods (from 45% in May’20 to 68% in May 21). Similarly, fear about
losing a loved one has also increased by 12- percentage points during this
time. Given the current situation, it seems there is a greater focus on
worries surrounding one’s family and personal health than concerns over one’s
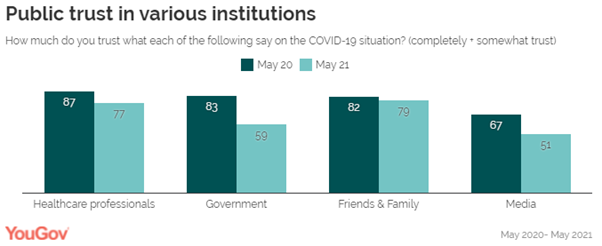
finances or job. This
increase in worry corresponds with the public’s failing confidence in the
government and health system.
Desperate to
battle the crisis, citizens have turned towards vaccines. Data from YouGov’s
Public Monitor shows 67% felt comfortable taking the vaccine in January when
it was first rolled out. After the second wave hit the country in February,
there has been an increase in the number of people who either have already or
are willing to take the vaccine- at 76% as of May 2021.
(YouGov
India) Source: https://in.yougov.com/en-hi/news/2021/05/21/concerns-about-personal-health-soar-india-battles-/ 689-691-43-08/Poll 3 In 10 Pakistanis Concerned About
Digitally Sharing Their Personal Information
According to
a Gallup Pakistan Survey in Pakistan (and similar surveys done by WIN
International across the world), 30% Pakistanis agreed that they are concerned
about sharing their personal information. When asked about the necessity of
sharing personal information, 24% Pakistanis think that sharing personal
information is necessary nowadays. 43% Pakistanis (27% globally) are not fine
with the privacy practices of most data collectors asking for their personal
information. As far as awareness about digital rights and personal data
privacy is concerned, 46% Pakistanis are not aware of what happens with their
personal information after they share it with a data collector. WIN
International, the world’s leading association in market research and
polling, has published the Annual WIN World Survey (WWS – 2020) exploring the
views and beliefs of 26,433 individuals among citizens from 34 countries
across the globe about the privacy of digital information. The survey
for Pakistan was conducted by Gallup Pakistan during 5th to
15th November 2020. The sample size was 1103 respondents and
CATI methodology was used. (Gallup
Pakistan) May 18, 2021 Source: https://gallup.com.pk/post/31737 MENA
689-691-43-09/Poll MENA
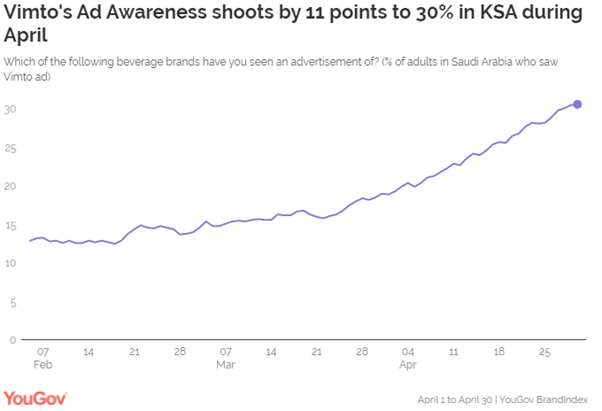
Advertiser Of The Month (April): Vimto
Vimto is a drink that has been dear
to many Arab hearts for years, especially during Ramadan. It is the
choice for many who prefer Vimto for breaking their fasts
at Iftar. Vimto is also known for its innovations in flavours, including
dates-flavoured drink, and ads - sharing videos of
celebrating Ramadan virtually with family during the
lockdown. This Ramadan, Vimto came up with a campaign
that helped the brand win YouGov's Advertiser of the Month. Data from
YouGov BrandIndex shows the percentage of adults in KSA who saw
Vimto’s ad during the month of April shot up by 11 points from 19%
(April 1) to 30% (April 30).
The campaign attracted participation from
across KSA which helped the Ad Awareness score of the
brand to shoot up from 19% on April 1 to 30% on
April 29. As Vimto's marketing brains would
wish, the campaign appeared to also have a positive
impact on the brand’s Impression and Recommendation scores
too. At the start of the month, 16% of adults in KSA indicated they had
a positive impression of Vimto – that figure shot up to 24% by April
30. Vimto’s recommendation score, which tracks the percentage of people
who would recommend a brand to others, rose to 22% (April 30) from 14% (April 1). (YouGov MENA) Source: https://mena.yougov.com/en/news/2021/05/10/mena-advertiser-month-april-vimto/ 689-691-43-10/Poll Global
Village Has Emerged As The Top Mover This Year, With A Change In Score Of
+14.2 Compared To Ramadan 2020 In UAE
Ramadan 2020, the first Ramadan in the
midst of the ongoing global pandemic saw reduced marketing activity from many
brands as budgets were slashed. By comparing Ad Awareness scores for the
Ramadan period this year vs the previous year, YouGov have identified some
interesting trends in terms of whose communications are reaching more of the
adult population in the country. The top 10 list has been compiled using the
Ad Awareness score- which measures whether a respondent has seen any
advertising for the brand in the past 2 weeks. YouGov BrandIndex data shows Global Village
has emerged as the top mover this year, with a change in score of +14.2
compared to Ramadan 2020. Despite ongoing Covid19 operating
procedures in place, Global Village decided to extend its open season into
Ramadan this year. This extension, coupled with it being the silver jubilee
(25th year) season, saw it promote its 25th world
record-breaking event, which clearly reached a wide audience in Ramadan. The Ramadan campaign had a positive impact
on the brand’s Ad Awareness, raising its score from 20.6 during Ramadan 2020
to 34.8 during Ramadan 2021. Notably, the list of top movers is
dominated by destinations and leisure & entertainment venues all vying to
attract customers back to their properties after a challenging year. Given
Ramadan typically sees families spending more time together, it’s not
surprising that these family destinations have been pushing their message to
visit out strongly during this period. Additionally, online retailer, Noon.com was the second-best improver, with a
change in score of +11.1. Aligning with the spirit of Ramadan, the e-retail
giant extended daily deals and discounts, giving up to 75% off on groceries
and household items, especially useful for households hard hit by the
pandemic. It seems UAE residents have responded to
the communications as the brand noted a significant improvement in its Ad
Awareness this festive season vs the previous year. Talabat.com is the third-best improver, with an
Ad Awareness bump of +7.9. The leading food-delivery platform partnered with
the Dubai Culture and Arts Authority (Dubai Culture) to launch ‘Ramadan
Heroes’ campaign with the aim of providing iftar meals to those in need. The
virtual charity endeavor struck a chord with people and helped the brand
enhance its Ad Awareness this Ramadan. Similarly, Starbucks joined the festivities
by introducing Ramadan cups as a seasonal edition. The holiday cups seem to
have attracted customers’ attention, raising the brand’s Ad Awareness by +6.7
compared to last Ramadan. Swedish retail giant IKEA and ADNOC also
made the top ten list- at sixth (6.6) and seventh (6.4), respectively. (YouGov MENA) Source: https://mena.yougov.com/en/news/2021/05/20/yougov-brandindex-data-reveal-top-ten-year-year-mo/ AFRICA
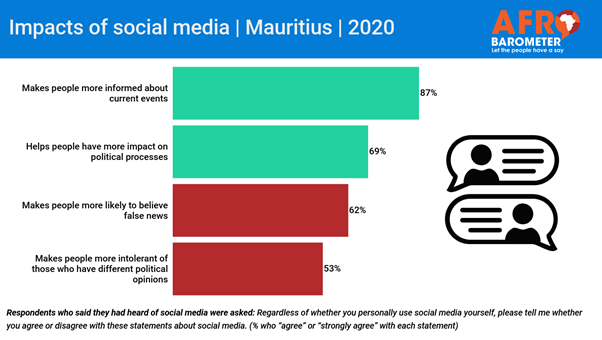
689-691-43-11/Poll 87 Percent
Mauritians Think Social Media Makes People More Informed About Current
Affairs
A majority of Mauritians want unrestricted
access to the Internet and social media, Afrobarometer’s recent national
survey finds. While a small share of citizens believe
that the use of social media such as Facebook, Twitter, and WhatsApp makes
people more susceptible to fake news and intolerance, a large majority say
social media informs them about current events and helps them have an impact
on political processes. The share of Mauritians who use social
media every day has more than doubled over the past six year, from 32% in
2014 to 69% in 2020. Overall, citizens believe the effect of social media on
society is positive. (Afrobarometer) 5 May 2021 689-691-43-12/Poll 63 Percent
Gambians Get News From Television And 55 Percent Get From Social Media
Most Gambians support media freedom in
principle but endorse government interference to prevent the publication of
false news, hate speech, and views that criticize or insult the president,
the latest Afrobarometer survey shows. An overwhelming majority of Gambians say
the media is in fact free to do its work without government interference. Most Gambians get their news from the radio
and television, the survey shows, but social media and the Internet are also
major sources of regular news. At the same time, a majority of citizens blame
social media users for knowingly spreading false news. The Gambia’s media environment has become
somewhat less restrictive in recent years, including a 2018 Supreme Court
decision that the criminalization of defamation is unconstitutional. The 2021
World Press Freedom Index ranked the Gambia 85th out of 180 countries in
media freedom, up two spots from the previous year. (Afrobarometer) 4 May 2021 689-691-43-13/Poll Half Of
Tunisian Citizens 49 Percent Are In Favor Of Press Freedom
The majority of Tunisians believe the media
are free, according to Afrobarometer's most recent survey. Yet half of citizens believe that the
government should be able to ban any publication of content that it
disapproves of, though a downward trend. Support for press freedom has improved in
Tunisia - half of citizens are in favor - since Afrobarometer last asked
their opinion on this issue in 2018. According to the survey, most citizens are
in favor of filtering press publications when they are false or hateful in
nature. The survey therefore revealed that most citizens believe that
the media and journalists This Afrobarometer survey is all the more
relevant as it presents the opinion of citizens in a context where Tunisia is
losing one place in the global press freedom ranking conducted by Reporters
Without Borders for the year 2021. . (Afrobarometer) May 7, 2021 WEST
EUROPE
689-691-43-14/Poll Three In Four (76%) Religious People Indicated A Likelihood To Donate
To A Charity
Charity is one of the foundational principles of religions worldwide.
But does that make people who practise a religion likelier to give to charity
compared to those who don’t? Looking at adults in the UK, data from YouGov Profiles reveals that
people who practise a faith with any amount of regularity (from major holiday
observers to regular worshippers) do show a higher tendency to be charitable
when compared to their non-practising or irreligious counterparts. Asked about their likelihood to donate to a charity in the next three
months, three in four (76%) religious people indicated a likelihood to do so,
demonstrating a significantly higher propensity than the irreligious and
non-practising group (56%).
Aside from being more likely to give, are there differences in
the types of good
causes religious people support? The data suggests that there are. They are more likely to support all popular causes than irreligious
or non-practising believers – but they also have different priorities too.
For example, children and young people come out top for the former group but
only third for non-practisers, who prioritise health and medicine charities.
Poverty relief is the third most popular cause for the religious group, but
doesn’t feature at all for the wider group. On the flipside,
environmental/conservation charities feature in the top five causes for this
group but they aren’t one of the five most popular causes among the religious.
(YouGov UK) May 05, 2021 689-691-43-15/Poll One In Eleven NHS Workers Plan To Leave Healthcare Sector After
Pandemic
The COVID-19 pandemic has been tough on all, but perhaps none more so
than frontline NHS
staff. Now, following the news of the government’s planned 1% pay rise
for NHS staff, the Royal College of Nursing has threatened
strike action – but are NHS staff considering leaving the healthcare
sector? YouGov research among 1,009 NHS workers shows that one in eleven (9%)
are considering leaving the sector – including 12% of nurses and midwives.
This represents no statistical difference from when we asked this question in
April 2020, when 7% of NHS workers said they were unlikely to remain in the
healthcare sector when the pandemic ended.
YouGov’s research shows little difference between roles within the
NHS, with 9% of staff in patient-facing roles saying it is unlikely for them
to remain in the sector, as do 8% of those in non-patient-facing positions.
However, the figure is higher among male NHS workers, one in seven of whom
(14%) think it is unlikely they will work in the healthcare sector when the
pandemic ends, twice that of women (7%) who said the same. Why are some NHS workers considering
leaving the sector? With the row over the 1% pay rise for NHS workers still
ongoing, being unsatisfied with pay and benefits (57%) was listed as the
most common factor playing a role in the decision of those who intend to
leave. Unsurprisingly, pay is closely followed by issues surrounding the
COVID-19 pandemic (39%).
(YouGov UK) May 05, 2021 689-691-43-16/Poll Two In Five People Point To Housing (44%) And Crime (43%) As The Most
Urgent Problems To Be Tackled By New Mayor
Londoners are heading to the ballot boxes today to elect or re-elect
the next mayor. YouGov data shows that two in five people point to housing
(44%) and crime (43%) as the most urgent problems to be tackled, while just
over a third (36%) say it’s the economy. These issues are followed by health
(32%), the environment (24%) and transport (18%). These issues largely match the main candidates’ pledges, with current
mayor Sadiq Khan promising to build more council homes, crack down on crime
and lower the cost of commuting. His opponent, Conservative candidate Shaun
Bailey, also promises to make the streets safer, improve transport and to
sell 100,000 homes for £100,000 each.
Generally, Londoners have different opinions on what the most
pressing issues facing the capital and the country are. Around half say the
economy (49%) and health (48%) are top of the list for the country as a
whole, which is much higher than when asked about London. And while a quarter
(26%) say Britain leaving the EU is among the most urgent issues for the UK,
only 16% say it’s the most vital thing to sort out for London. People in inner London care about housing,
while those in outer London worry about crime Age and location play a big factor in which issues are seen as the
most important. People in inner London feel more strongly about housing than
those in outer London at 50% vs 41%. But approaching half of people in the
suburbs (46%) believe crime is among the biggest threats to the capital,
compared with just over a third of those living more centrally (36%).
The same split is clear across generations, with half of Londoners
aged 65+ (52%) worrying about crime, compared with a third of 18- to
24-year-olds (35%). In contrast, two in five older capital dwellers (39%) say
the economy is the most prominent issue facing London, while only a quarter
of 18- to 24-year-olds in the city share the same worry. And while a quarter
of those aged 65+ (23%) list immigration and asylum as one of the top issues,
only 3% of young people do the same. 689-691-43-17/Poll Four In Ten Britons Satisfied With Their Local Council, But Most In
The North Of England Feel They Get Less National Spending Than Other Areas
Britons are more likely to say they’re satisfied than dissatisfied
with the way their local council runs things, according to a new Ipsos MORI
poll. The poll was conducted with 8,352 people aged 16+ across the United
Kingdom. The survey reveals that two in five (40%) say that they’re satisfied
with the way their local council runs things while a quarter (25%) say
they’re dissatisfied. There is little difference when looking at residents in England,
where local elections are taking place this Thursday, with 41% saying they’re
satisfied and 24% dissatisfied, however, when looking closer at the regions
across England some differences are revealed. Those in the South West are the
most satisfied with how their local council runs things with just under half
(47%) saying they’re satisfied (21% dissatisfied) while those in the West
Midlands, London and the North West are the areas with the least amount of
residents satisfied (35%, 36% and 36% respectively). While there is little
difference in council satisfaction levels between 2019 Conservative and
Labour voters (41% vs. 39% respectively saying they’re satisfied), Liberal
Democrats are the most likely to say they’re satisfied with their local
council (47%). Other findings the poll reveals are:
Kelly Beaver, Managing Director of Public
Affairs at Ipsos MORI said: With elections taking place across England
for councils and mayors, Ipsos MORI finds that there are clear regional
differences in how people perceive the national government in Westminster
spends money regionally, with those in the North East by far the most likely
to feel the national government spends less there than on other local areas.
Whether this impacts on how people vote in the local elections in the North
East will be an interesting point of analysis once all the votes are counted. (Ipsos MORI) 7 May 2021 689-691-43-18/Poll Three Quarters Of British Women (76%) Say Men In Society Don’t Pull
Their Weight In Keeping Women And Girls Safe
Sarah Everard’s killing in March prompted vigils, protests, and
debates on women’s safety. New YouGov data shows that women overwhelmingly
feel not enough is being done to ensure their safety and that men in
particular should do more. Three quarters of women (76%) say men in society don’t pull their
weight in keeping women and girls safe. Men tend to agree (63%), although a
fifth (20%) consider their gender overall to be doing enough – almost three
times the number of women who think so (7%). Seven in ten women (69%) also say the government’s efforts are
lacking, compared with 59% of men. A majority of women (62%) similarly feel
the police aren’t doing enough, while around half of men (52%) agree.
Tougher sentencing? Better lighting? More
CCTV? What would make the UK safer for women The debate on women’s safety has encompassed everything from
tongue in cheek suggestions to impose 6pm curfews on men to
the government’s
plans to increase the presence of undercover cops in nightclubs. But women are most likely to say imposing tougher sentencing for
sexual harassment, sexual assault and domestic violence would be effective at
89%, including 69% who say it would be “very effective”. While three quarters
of men (76%) agree it would help, only around half (48%) believe it
would very effective.
Making the police take reports of sexual harassment more seriously is
also regarded as likely to be effective among 88% of women and 79% of men.
But there’s a big difference between how many men and women expect it to
be very impactful at
61% vs 42%. The issue came under scrutiny after officers
allegedly failed to help a woman after a man flashed her as she made
her way home from the vigil for Sarah Everard. In response to Everard’s death, the government announced £25m for
better street lighting and CCTV in addition to a pilot scheme involving plain
clothes officers in pubs and clubs. Some 85% of women and 77% of men believe better-lit streets could
help improve safety for women, while increased CCTV coverage in public places
is also regarded as effective (78% of women vs 65% of men). But the public are split on the effectiveness of having undercover
police in bars and clubs, with 49% of women and 37% of men saying it would be
effective. That is not to say such a policy is unpopular, however. A
YouGov poll for ITV Peston showed that a large majority – 67% –
would back having cops in clubs. Should women or men adapt their behaviour
to make the streets safer for women? Much of the debate around women’s safety has centred on whether women
or men should be the ones to adapt
their behaviour. While previous YouGov research shows that many
women are
already taking numerous measures to avoid men sexually assaulting
them, 62% of women and 58% of men believe that better education for women on how
to do so would help. But this view is much more common among the older generations. Seven
in ten women aged 55+ (72%) see merit in it, compared with only a third of
women aged 18-24 (32%). The same pattern is clear among men, with two thirds
of men aged 55+ (64%) convinced in the use of extra education, compared with
only a third of those aged 18 to 24 (24%).
Meanwhile, women are much more likely than men to see the benefit of
making schools teach boys about acceptable and respectable behaviour towards
females. While four in five women (81%) and 69% of men see value in the
initiative overall, 61% of women say it would be very effective, compared with only
42% of men. The same split is clear when it comes to men doing more to criticise
their male friends for bad behaviour towards women. While four in five women
say it would very (54%) or fairly (32%) effective, men are less inclined to
say so (33% very, 35% fairly), (YouGov UK) May 10, 2021 689-691-43-19/Poll Towards The End Of
Last Year, Over Half Of The Public (53%) Said The Covid-19 Pandemic Had Negatively Affected Their Mental
Wellbeing
Mental Health Awareness Week 2021 runs from May 10-16, and
it comes at a time when people may be more keenly aware of their
psychological state than usual. Towards the end of last year, over half of
the public (53%) said the COVID-19 pandemic had negatively
affected their mental wellbeing. But when it comes to getting people better, how important is
“awareness” next to material concerns such as access to treatment? Data from YouGov Direct conducted during Mental Health Awareness Week
2021 reveals that Britons are most likely to believe that low availability of
public services play the biggest role in preventing people from accessing
treatment. Two in five say capacity issues such as long wait times (40%) are
the largest barrier to seeking help, with social stigma coming a distant
second (22%). NHS England data from April 2021 revealed that the number of
people on waiting lists for all NHS treatment was at 4.7 million people –
the highest number since records began in 2007.
Poor awareness of mental health issues ranked lower down the list.
Just 13% say personal ignorance of mental health issues was the most
important factor stopping people from getting treatment, while one in ten
cite poor awareness of mental health support services (10%). Along gender lines, women are half as likely as men to say that low
awareness of illnesses such as depression or anxiety do more to stop people
from seeking treatment than anything else (Women: 18%; Men: 9%). Female
Britons were also 13 percentage points more likely to say that availability
of services was the highest barrier to treatment (women: 46%; men 33%). Both
genders are most likely to say that low availability outweighs any other
factor. (YouGov UK) May 14, 2021 689-691-43-20/Poll Three In Ten Britons Feel Less Certain About Government’s Guidance
For Which Activities You Should And Shouldn’t Do And Say It’s Either Not Very
(19%) Or Not At All Clear (9%)
Don’t go to work. Go to work. Go outside. Don’t go outside. It’s not
the first time the government’s COVID-19 guidance has attracted criticism for
its muddled messaging. Critics are now attacking Boris Johnson for a
reopening approach marked by “confusion”,
which includes allowing travel but ministers saying you
shouldn’t do it, and legalising hugging but advising “cautious
cuddling”. But are the Britons as confused as commentators insist? Not according
to the public themselves. Two thirds of people say the government’s guidance
for which activities you should and shouldn’t do is very (19%) or fairly
(48%) clear. Around three in ten feel less certain, however, and say it’s
either not very (19%) or not at all clear (9%).
Younger people are more likely to say the guidance lacks clarity,
with over a third of 18-to 24-year-olds finding it not very (23%) or not at
all (13%) clear. In contrast, only one in six people aged 65+ are of the same
opinion, including one in twenty (5%) saying it’s not clear at all. Which activities is the government telling
us to do or avoid? People disagree The guidance that seems to be causing the most confusion is around
travel to countries which the government lists as green in their traffic
light system, meaning you’re allowed to go without quarantining upon
returning. A third of Britons (33%) say the government is encouraging the public
to go on holiday to these destinations, while around three in ten (28%) say
it’s discouraged. Another 30% say it’s neither. Five million people have already booked trips to European
destinations this summer, despite one minister saying that all foreign breaks
are ‘dangerous’.
And while several ministers have said holidays to amber destinations – which
require you to isolate at home when returning – are okay,
Boris Johnson has overruled them. But despite the amber ambiguity, three in five Britons (60%) say this
type of travel is discouraged, while only 12% believe it’s encouraged. Around
one in five people (18%) say it’s neither.
The advice around hugging also seems to be creating some confusion,
with two in five people (41%) saying the public is being told to hug, while
three in ten (30%) believe we’re advised to not hug. And while the government’s
working from home advice is still in place, two fifths of Britons
(38%) say workers are encouraged to go into offices, while around a quarter
believe the opposite (27%). While sitting inside at pubs and restaurants is allowed again as of
this week, several Sage
scientists have warned against it if not vaccinated. Half of Britons
(48%) feel encouraged to sit inside, while only 17% feel dissuaded.
Meanwhile, two thirds say they feel encouraged to get socialise outside in
hospitality venues. (YouGov UK) May 20, 2021 689-691-43-21/Poll 41% Of 18-24 Year Olds Now Say Britain Should Have An Elected Head Of
State
Attitudes among young people to the monarchy have changed
substantially since 2019. YouGov data from a number of our 2021 polls on the
monarchy so far shows that 41% of 18-24 year olds now say Britain should have
an elected head of state, while only 31% would like to see the monarchy
continue. The results, which are likely to be cause for concern for Buckingham
Palace, come after a turbulent start to 2021, with Harry and Meghan’s controversial
Oprah interview in March and Prince Philip’s passing in April. Young Britons were still clearly in favour of the monarchy as
recently as two years ago. Across our polls in 2019 – the year of Prince
Andrew’s catastrophic
Newsnight appearance – approaching half of 18-24 year olds (46%)
were in favour of the monarchy. Only a quarter (26%) preferred an elected
state head.
By 2020, however, the share of 18-24 year olds in favour of the
monarchy slipped to 40%, while support for an elected head of state rose to
37% – an increase of 11 points. This was another rocky year for the Royal
Family, with the Sussexes
announcing their resignation and further allegations that Prince
Andrew had misled Emily Maitlis about details relating to his
friendship with convicted sex offender Jeffrey Epstein. Older Britons still strongly support the
monarchy While young people’s views of the monarchy as an institution appear
to be souring, changes among the population as a whole have been more subtle.
Three in five Britons (61%) still support the monarchy, while a quarter (24%)
would prefer an elected head of state. This is a small change from 2019, when
two thirds (65%) were behind the firm, and a fifth (19%) would rather get rid
of it. Opinions among people aged 25 to 49 have also only shifted very
slightly, with half (53%) now in favour of a monarchy – down from 58%. About
a quarter (27%) would like to opt for an elected state head, up 4 points. Older age groups remain firm in their views. Seven in ten 50-64 year
olds (70%) still support the monarchy, which is the same as in 2019 (71%).
The same goes for those aged 65 and above, with 81% in favour – similar to
two years previously (82%). (YouGov UK) May 21, 2021 689-691-43-22/Poll Charging An Electric Car Vs Refuelling A Petrol Car, 14% Think It’s
Better; 13% Think It’s The Same, And 64% Think It’s Worse
The UK recently replaced France as Europe’s
second-largest electric car market. But how do Britons feel about these
vehicles compared to those that run on petrol? Data from YouGov Direct indicates that the general public feel that
electric cars outperform petrol cars in a number of key areas – except when
it comes to convenience.
For all the positivity around the features of electric cars, a major
sticking point for Britons when it comes to EVs is the hassle associated with
charging a car compared to filling it up with petrol. A comfortable majority
of the public thinks battery-powered vehicles are more inconvenient to run
than petrol cars (64%), while just 14% think petrol cars are worse in this
area. The British public is more likely to say they are superior in every
other area we asked about. In terms of acceleration, three in five believe
they perform the same or better (59%), while just a fifth say they are worse
(19%). When it comes to handling, more than three in five (62%) say electric
cars handle at similar or superior levels, with just 12% saying they are
inferior. This extends to aesthetics: in terms of exterior design,
three-quarters say they look the same or better (76%); when asked about
interior design, four in five (80%) think they’re superior, while just 7%
think they look inferior.
Britons are also more likely to think that electric cars represent a
better investment on a day-to-day basis than petrol cars. Half of the public
think electric cars cost less to run than petrol cars (51%) – although a
fifth (18%) think they cost about the same and 16% say they cost more. But when you ask drivers about the barriers to buying an electric
car, the major problems do tend to revolve around convenience and charging.
YouGov Profiles shows that, while the top challenge for Britons with a
driving license is the initial cost (26%), half of the top ten reasons to
avoid buying an electric car all have to do with charging the battery.
A quarter think there aren’t enough charging stations (24%), while a
fifth think charging takes too long or is too much hassle (21%). Nearly as
many (17%) say that the battery doesn’t last long enough or that the cost of
charging at home presents a problem (16%). “Range anxiety” – the fear that you’ll run out of charge if you get
too far from a station – is a well-documented concern among EV owners, and
it’s one that has cut through to the wider public. It’s a problem the
government has recognised through initiatives such as the electric vehicle
homecharge scheme, which provides
a 75% contribution to the cost of a home charging point and its installation
for people with off-street parking and a qualifying vehicle. As the UK automotive market becomes increasingly electric, it’s a
problem automakers may wish to keep in mind – by heightening awareness of
incentives and subsidies, offering help with home-charging installation (or
even providing it as part of the purchase cost as some brands do), or
otherwise making it easier for British drivers to power their electric cars.
(YouGov UK) May 21, 2021 689-691-43-23/Poll Home And EDC Are Real Estate Chains Get The Most Attention In Denmark
During the corona crisis, the Danish housing market has boomed, and
several real estate chains have
felt the “corona
effect” , where the corona crisis has acted as a trigger for people
who have already considered a home purchase. YouGov has taken a closer
look at which real estate chains have received the most attention over the past
year.
When it comes to attention, home and EDC share first place. An
average of 18.4% of Danes have thus heard positive or negative mention of
these chains through advertising, news, word-of-mouth or friends and family
over the past year. In third and fourth place are Nybolig (15.3%) and danbolig
(13.2%). From the four big real estate chains, there is a distance down
to chains like Estate and Realmæglerne, which are fighting for fifth place
with an attention score of resp. 6.2% and 6%.
However, the coverage has not been stable throughout the
year. While EDC was highest in the spring and early summer of 2020, home
received the most publicity in the fall and further into the winter of 2021. The Danes have the best impression of EDC
If you look at which real estate chains the Danes have the overall
best impression of, EDC takes the prize with a score of 28.8. The
overall impression is calculated by asking which brands you have an overall
positive impression of and which ones you have a negative impression
of. The net score is calculated as positive minus negative indications. Home follows right on the heels of EDC with a score of 27.9, while
Nybolig takes third place (24.6), and danbolig runs with fourth place (21.7). About the ranking In Denmark, BrandIndex compares more than 450 brands. Every day,
YouGov BrandIndex interviews 200 people representative of the general
population and asks them about their attitudes towards different brands. The impression score is calculated by asking which brands you have an
overall positive impression of and which ones you have a negative impression
of. The net score is calculated as positive minus negative share. The attention score is calculated by asking the respondents if they
have heard anything positive or negative about a particular brand over the
past two weeks through advertising, news, word-of-mouth or friends and
family. The net score is calculated as a positive minus negative
share. Data are from March 1, 2020 to February 28, 2021. (YouGov Denmark) Source: https://meet.google.com/xgs-nsix-qzy?authuser=1 689-691-43-24/Poll Every Third German Feels More Stressed In 2021 Than Before Corona,
People With Children Most Often
A survey from the end of April 2021, compared to April 2020, showed
that people in times of Corona feel more stressed this year than they did a
year ago. At that time, 17 percent said they felt more stressed than
before, in 2021 31 percent said they were more stressed, 14 percentage points
more than a year ago. 51 percent currently do not notice any change in
their stress level due to Corona.
It is noticeable that younger Germans in particular feel more
stressed in 2021. Currently 39 percent of 18-24-year-olds and 41 percent
of 25-34-year-olds state that they are more stressed in times of
Corona. In comparison, only 26 percent of those over 55 say that. PEOPLE WITH CHILDREN ARE MORE STRESSED IN
TIMES OF CORONA - THE PROFILE OF THOSE WHO ARE STRESSED Those who say they will be more stressed in 2021 than before the
corona pandemic are more often between 35 and 44 years old (21 percent vs. 15
percent of the general population). Among the more stressed, only 27
percent are older than 55 years (vs. 41 percent of the general
population). They are married somewhat more often (43 percent vs. 40
percent of the total population) and more often have children under the age
of 18 in their own household: 17 percent of those who are stressed by Corona
in 2021 (vs. 15 percent of all Germans) have one child and 12 percent have
two children (vs. 9 percent of all Germans).
(YouGov Germany) May 7, 2021 Source: https://yougov.de/news/2021/05/07/jeder-dritte-deutsche-fuhlt-sich-2021-gestresster-/ 689-691-43-25/Poll Every Second Cyclist Wears A Protective Helmet At Least Now And Then
When Cycling
Spring and summer are just around the corner - time to cycle again
more often. The majority of Germans (63 percent) have their own bike,
most of them a city bike (28 percent), and 14 percent own a cross bike or
mountain bike. 10 percent of the German respondents state that they own
an e-bike. 36 percent of Germans do not own a bicycle, including more
women (40 percent) than men (31 percent). This was the result of a
current survey in cooperation with Statista.
Half of German cyclists (50 percent) state that they wear a
protective helmet. One in five of them (21 percent) always wears it, 8
percent often, 11 percent sometimes and 10 percent rarely. It is
noticeable that men wear a bicycle helmet at least occasionally more often
than women (53 percent vs. 46 percent of women). 46 percent of all
cyclists in Germany never wear a protective helmet when cycling. Younger
Germans are more safety-conscious than older people when it comes to this
question: while 49 percent of those over the age of 55 state that they never
wear a bicycle helmet, only 36 percent of those aged 18-24 say so. FOR MOST GERMANS, THE NUMBER OF CYCLE PATHS
IS INADEQUATE According to 54 percent of Germans, cities and municipalities do not
do enough for the safety of cyclists. 63 percent think that the bike
paths in cities and towns could still be expanded.
(YouGov Germany) May 5, 2021 Source: https://yougov.de/news/2021/05/05/jeder-zweite-radfahrer-tragt-beim-fahrradfahren-zu/ 689-691-43-26/Poll 26 Percent Germans Praised The Government's Handling Of The Crisis In
April 2021
At the beginning of 2021, the proportion of those who rated the
federal government's handling of the crisis negatively was higher than the
proportion of those who voted positively for the first time: in January 2021,
49 percent had a negative and 46 percent a positive image. According to
current YouGov Corona Tracker data, a reversal of this trend can currently be
seen: After only a quarter of all respondents (26 percent) praised the
government's handling of the crisis in April 2021, the lowest value since the
tracker began, attested in May 39 percent of the government is good practice. In connection with this, 68 percent said in April 2021 that the
government was dealing badly with the crisis, in May this value improved
again to 55 percent.
GERMANS RECOGNIZE THE IMPROVEMENT IN THE
CORONA SITUATION IN GERMANY The recently resolved lifting of vaccination prioritization and the
nationwide falling incidence figures are possible reasons why Germans are
currently talking about an improvement in the corona situation in their own
country: only 30 percent said in April that the situation in Germany is
improving. Meanwhile, in mid-May, the value rose to 73 percent.
These are the results of the regularly updated COVID-19 tracker from
the international Data & Analytics Group YouGov, for which around 2,000
people were surveyed using standardized online interviews from September 2020
to May 2021. The results are weighted and representative for the German
population aged 18 and over. (YouGov Germany) Source: https://yougov.de/news/2021/05/21/umgang-der-regierung-mit-der-corona-krise-wieder-p/ 689-691-43-27/Poll This Month, The President Of The France Recovers 1 Point Of Favorable
Opinions From The French (31% Of Favorable Opinions)
This month, the President of the Republic
recovers 1 point of favorable opinions from the French (31% of favorable
opinions) . In detail, the Head of State
is making progress with all fringes of opinion except the moderate Left and
the Far Right. Indeed, Emmanuel Macron gains 10 points from supporters
of the Far Left (18% of favorable opinions), 5 points from supporters of the
Center (82% of favorable opinions) and 2 points from supporters of the
moderate Right. (36% favorable opinions). It loses, on the other hand, 2
points with sympathizers of the moderate Left (29% of favorable opinions) and
of the Far Right (8% of favorable opinions). As usual, Prime Minister Jean Castex
follows the President's trend but goes up further (27% of favorable opinions,
+ 2 points). The tenant of Matignon, recorded a
strong increase among supporters of the Moderate Left (33% favorable
opinions, + 10 points). In addition, it has increased by 4 points among
voters in the Center (62%, +4 points) and the Far Left (15%, +3 points). However,
the head of government loses 1 point with supporters of the Far Right (12% of
favorable opinions) and 2 points with supporters of the moderate Right (32%
of favorable opinions).
This month, insecurity returns to first place in the concerns of French
people in politics (22%, +8 points). For their part, unemployment and
social protection go down one place. Thus, unemployment and employment
occupy second place (16%, stable) and social protection completes the podium
with 14% (-1 point). Like the executive couple, the government
is also recording an increase this month. The government is making up for last
month's drop and is up 3 points this month (27% favorable opinions). In
detail, the government performs better with all fringes of opinion, except
for the Far Right (6% favorable opinions, -2 points). The government
gained 10 points from supporters of the Far Left (15% of favorable opinions),
9 points from supporters of the moderate Left (31% of favorable opinions), 9
points from supporters of the Center (75% of 'favorable opinions) and finally
1 point among supporters of the moderate Right (33% favorable opinions). Unlike last month, the government records
mixed scores this month on the items tested. In
detail, still just over 4 in 10 French people believe that the government is
"ready to take unpopular decisions if they are good for the
country" (45%, +1 point). However, now, less than 4 in 10 French
believe that he "has good intentions, even if [they] do not always agree
with his positions" (38%, -5 points). Behind, less than a third of
the French believe that it "addresses the whole population, not only its
voters" (32% -4 points), that it has "a clear line, which he does
not budge. ”(32%, +5 points) and that it“ goes ahead, and proposes modern
measures ”(29%, +1 point). Finally, less than a quarter of the French
believe that it is "made up of competent people" (25%, +1 point), For its part, the evolution of items for
the National Gathering is also up and down.Indeed, 4
out of 10 French people believe that he has “a clear line from which he does
not budge” (40%, stable), that he is “ready to take unpopular decisions if
they are good for the country” (40 %, -2 points) and that he "has good
intentions, even if [they] do not always agree with his positions" (38%,
stable). Behind, a little more than a third of the French consider, that
it "is addressed to the whole population, not only to its voters"
(35%, +2 points). In addition, around 3 in 10 French people believe that
it "protects the interests of people like [them]" (31%, +3 points),
that it "is moving forward, and proposes modern measures" (29 %, +3
points). Finally, around a quarter of French people consider that
"the society that [he] advocates is overall the one in which [they] want
to live" (27%, stable). (YouGov France) May 7, 2021 Source: https://fr.yougov.com/news/2021/05/07/barometre-yougov-france-le-huffpost-mai-2021/ 689-691-43-28/Poll A Quarter Of 18-25 Years Old Say They Have Had
Suicidal Thoughts Since The Start Of The Crisis (27%)
Since the 1st measurement carried out in June 2020, it is clear that the health of young people is
deteriorating: now more than three quarters of them say they
have been affected at the psychological, emotional or physical level (76%, +
3pts ) since the start of the health crisis in March 2020, a proportion that
has risen to 83% (+4 pts) among students. This distress experienced by young people since the start of the
health crisis is all the more worrying as more than a quarter
of them say they have had suicidal thoughts since the start of the crisis (27%),
a proportion that has increased from 4 points in 9 months. Students and
young people currently looking for a job appear to be particularly concerned
(31% and 35% respectively). Financial difficulties persist after a full
year of crisis ... While the issue of student insecurity has remained for many years, it
has never been more prevalent than since the start of the health
crisis. At the start of the epidemic, nearly three quarters (72%) of young people said they had encountered
financial difficulties. A year later, the situation is the
same and the situation has not changed. ... and students exercising a remunerated
activity in parallel with their studies are particularly concerned On the aspect of student precariousness or that of mental health,
salaried students have suffered the full effects of the crisis. Thus, 66% (+17 pts compared to non-salaried students) of them believe
that they had financial difficulties to obtain a healthy and balanced diet,
52% had to give up medical acts or medication (+ 18 pts compared to
non-salaried students). This renunciation of care is explained for financial
reasons and this for 56% of them. More generally, 82% of students with paid employment have
encountered financial difficulties since the start of the health crisis in
March 2020. They also testify to greater psychological
distress: 79% of them felt the need to be listened to or to
confide in someone. In the last two weeks before the survey, 87% of
students with a salaried activity in parallel felt sad, depressed or
desperate, that is to say 13 points more than the students without salaried
activity. Even more worrying, 40%
of these students have had suicidal thoughts since the start of the health
crisis. After a year of crisis, students appear to
be deeply impacted in their daily lives and in their future prospects After a difficult year, more than nine out
of ten students consider that the health crisis has caused their studies to
drop out (94%; + 10pts). Among them, 6 out
of 10 even consider this dropout "very" or "somewhat"
important. In June 2020, three months after the start of the crisis, it
was “only” 38% to share the same observation, that is to say an increase of
22 points, in 9 months, an evolution which clearly illustrates the difficulty
of the students to maintain the course in their course. Even more than this feeling of having
dropped out, many are now also expressing fears for the recognition of the
value of their diploma. While a minority of
students shared this concern last June (45%), more than two-thirds of
students now fear that their diploma will lose value as a result of this
pandemic (67%, + 22pts). The difficult pursuit of an orientation and
professional project is the perfect illustration of this: many
more students saw their project impacted compared to last June (61%; +
9pts). A quarter of them have revised it down (23%; + 8pts) or have
chosen to reorient themselves (14%; + 5pts). There are many reasons for
this: they are significantly linked to the health crisis (30%), to financial
reasons (27%), to the cancellation or postponement of an internship in a
company (21%) or even a trip to the foreigner compromised (20%). As a result, 1 in 2 students
are now in demand for human support to guide them in their orientation ,
whether face-to-face (30%) or remotely (28%). This demand is all the
stronger among students who have seen their orientation and professional plan
modified or interrupted (71%). (Ipsos France) May 10, 2021 689-691-43-29/Poll 45% French Believe That Major Beauty Brands Do Not Care Enough
About The Diversity Of Their Consumers
In terms of offer, consumers are largely satisfied with the
diversity of the beauty sector , 77% of them saying they easily find
products that match their physical characteristics. When it comes to communication, things are more complicated:
An initiative such as removing the word “normal” from the packaging of a
major cosmetics brand is welcomed: 63% consider
it a good thing because “everyone is
different and normal does not exist” . A figure that
rises to 84% among 16-24 year olds . It
is an unexpected reversal of the original meaning of the word, when the most
widespread situation is reinterpreted as possible discrimination pointing to stigmatize
categories of consumers who do not conform to basic standards. In any
case, it testifies to the growing importance of expectations of singularity and recognition of each
person's identity and echoes the movements of#bodypositivity very present on social networks. (Ipsos France) May 18, 2021 Source: https://www.ipsos.com/fr-fr/beaute-normal-vous-avez-dit-normal 689-691-43-30/Poll 9 May, Europe Day: The European Union In The Perception Of Italians
On 9 May the European Union celebrates
Europe Day , in memory of the Schumann
Declaration, which set the tone for the first European Coal and Steel
Community (ECSC). More than seventy years later, this anniversary remains unrecognized in Italy: only
5% of Italians know how to place this day among the May
holidays (against over 90% who know how to place the Labor Day), a percentage
that rises however 11% among young
people aged 18-24. Only 10% say they are generally aware
of Europe Day and its meaning, plus 25% who have heard of it. Despite the difficulty of this anniversary in spreading nationally, a
good percentage of Italians feel
themselves to be European citizens: 38% of the interviewees
declare that they identify with this concept; a percentage not very high
in absolute terms, but to be contextualized in the fragmentation of the
belonging of those who live in our country: only 54% say they consider themselves national citizens ,
while about a third of respondents
identify themselves at a regional or local level (31 and 30
%, respectively. Belonging to the European demos is therefore relatively felt.
However, a positive opinion of the European Union as a whole does not
mean approval of its policies. Given
10 areas in which the EU has competences, in fact, in 7 of these the negative
opinions outweigh the positives , in particular by rejecting
the economy and tax policy; a positive role is instead recognized in the
sphere of civil liberties
and rights , Research & Development , Environment and Energy. In
absolute terms, however, most of the respondents are not unbalanced, with a
percentage always around 40% who claim to have a neutral position.
What seems to emerge is that, while many Italians are interested in
the continental dimension of major issues, Europe Day does not seem to play a
role in promoting this dimension, still remaining unknown to most. (YouGov Italy) May 7, 2021 Source: https://it.yougov.com/news/2021/05/07/9-maggio-giornata-delleuropa-lunione-europea-nel-p/ 689-691-43-31/Poll 8 Out Of 10 Italians And Italians Agree: Excess Doses Of The
Anti-Covid 19 Vaccine Must Be Shared
8 out of 10 Italians and Italians agree:
excess doses of the anti-COVID 19 vaccine must be shared, because only by
eradicating the virus everywhere will the pandemic be put to an end. This
emergency situation requires a response that goes beyond borders and national
income differences (85%), with immunization that gives priority to the
categories of people most vulnerable and at risk in the face of the threat of
the virus (83%).
Among those who responded, 9
out of 10 Italians and Italians think that, to put an end to the pandemic,
vaccines must be effectively distributed around the world. This
finding is in contrast to the current reality, where only a small fraction of
the doses administered globally have gone to people living in low-income
countries. ONE has calculated that all
G7 countries have purchased an amount of vaccines not only needed to
inoculate and protect their entire population, but also to set aside
over 1
billion excess doses as a spare. Martina Nuti, ONE Italia advocacy manager, said: “ The pandemic will not end with the COVID 19
vaccine, but when everyone, everywhere will have access to it. Italians
and Italians clearly understand the need for a global response to address
this crisis: without widespread immunization, the virus will continue to
mutate and evolve, extending the duration of this emergency crisis and
causing more than double the deaths currently recorded. World leaders
must not only coordinate strategically, but also make the necessary resources
available to finance a global response, which supports existing multilateral
initiatives ”. The data show that the
majority of Italians and Italians (88%) agree on the need for greater
international collaboration , on a global scale, to respond
to the current pandemic and similar threats in the future. Martina Nuti continued: “ 2
out of 3 Italians believe that Italy must demonstrate greater solidarity with
the most vulnerable countries through international cooperation. The
Italian government must respond to the call of its citizens. In its role
as presidency of the G20, Italy must act ambitiously and concretelyso that
the distribution of vaccines does not follow a setback and the Global Health
Summit, to be held in Rome next week, will be an opportunity to do
so. We expect the world leaders who find themselves there to take action
to ensure herd immunity on a global scale within the next year. This
means that Italy must increase funding to ensure global access to vaccines
and treatments for COVID-19 globally, and draw up a plan to share excess
vaccine doses, timed and operable in parallel with immunization on national
scale to ensure the distribution of these stocks by the end of this year
".
Source: https://it.yougov.com/news/2021/05/11/yougov-one-la-condivisione-dei-vaccini-anti-covid-/ 689-691-43-32/Poll 40% Of Spaniards Do Not Agree With The Changes In The Measures
Implemented In Their City After The Fall Of The State Of Alarm
On May 9, the extension of the State of Alarm in Spain ended,
declared on October 25, 2019 to stop the spread of the virus in the
country. After this, the autonomous communities were in charge of
deciding which were the preventive measures implemented in each
area. Since then, several cities have experienced large crowds of people
celebrating the fall of the curfew or the recent opening and extension of
hospitality hours. Therefore, from YouGov, we have carried out a study on the perception
of the Spanish population in the face of the withdrawal and reduction of some
of the measures against the pandemic, together with a study on the fear that
the agglomerations that occurred in some cities could arouse in the Spanish
. 40% of Spaniards do not agree with the
changes in the measures implemented in their city after the fall of the state
of alarm Young people between 18 and 34 years old are the group of the
population that is most in favor of the changes in the measures (42% in both
cases), compared to the rest of the population, where the most negative age
group towards the arrival of This new normal would be between 45 and 54 years
of age (46% do not agree with the new measures).
More than 8 out of 10 respondents (84%)
feel insecure in the face of crowds that occurred after the withdrawal of the
State of Alarm Among the most insecure is the population between 35 - 44 years old
(89% state that they feel very insecure or quite insecure) compared to the
younger population, despite this also showing a high number of insecurity
(77% of those surveyed respond to feeling very insecure). unsafe or quite
unsafe)
On the other hand, the majority of those surveyed answered that they were
in favor of restricting the capacity for both culture (67%) and hospitality
(68%) and reducing the number of people allowed in a meeting (68%) if the
health situation worsened. The opinion about mobility and time restrictions is similar, since
65% of those surveyed would be in favor of reintroducing a curfew and more
than half of the population (57%) in favor of returning to the limits of
mobility. The results are more equitable towards re-establishing a State of
alarm (49% in favor VS 46% against) On average, young people are the ones who show a more reluctant
attitude to the reimplantation of measures. 45% do not see the need for
the return of the curfew, even though the situation worsened (compared to 30%
of the average). The same occurs with other measures such as the limits
of people in meetings (34% compared to 26% of the population that does not
agree to reinstate this measure), the modification of hospitality hours (58%
of young people, compared to 49% of the average) or the capacity at cultural events
(37% of young people, compared to 26% in general).
Source: https://es.yougov.com/news/2021/05/13/que-piensan-los-espanoles-sobre-el-fin-del-estado-/ 689-691-43-33/Poll Four Out Of Every Five Spanish Respondents (45%) Rejects The Fact
That They Can Return To Stadium Fans
Raimon Bassas - The stadiums have become another of the places
affected by the pandemic and the measures to avoid contagion. It has
been more than a year, since the beginning of March 2020, that the public has
not been able to enjoy a game live. Last Wednesday, May 12, the return of the public to the stands of the
professional football stadiums was approved. This measure will be valid
only for communities in phase 1, with a cumulative incidence of less than 50
cases per 100,000 inhabitants in the last 14 days. With this new measure, stadiums will be able to accommodate 30% of
their capacity as long as they do not exceed 5,000 spectators, they must wear
a mask and maintain a safety distance, among other rules. From YouGov Spain we have analyzed, once the new regulations were
announced, the opinion of the Spanish population about the return to the
stadiums. What do the Spanish think of the return to
the stadiums? First, less than a third of the population (28%) is in favor of these
measures, while four out of every five respondents (45%) are directly against
these measures. Although there is practically a quarter of the
population (24%) that does not speak out, the majority of the Spanish population
rejects the fact that they can return to stadium fans. This feeling of rejection is reflected in the sense of security
perceived by those surveyed, not within the facilities themselves, but in the
community or city where the games would be played. 56% of Spaniards
(more than half) state that at least they would feel “quite” unsafe in the
event of the reopening of professional football stadiums in their community. On the other hand, we have also analyzed the opinion of the Spanish
population about the measures implemented to make this stadium reopening
possible: The limit of hosting 30% of capacity provided that they do not exceed
5,000 spectators is considered necessary by 85% of Spaniards. In other
words, within the limited predisposition of the Spanish population to reopen
stadiums, capacity control is a key issue. Taking the temperature before entering the stadium also generated
consensus among 4 out of 5 Spaniards (79%) who also consider it a necessary
measure. The entry and exit protocol with a safety distance (1.5m) is also a
necessary policy for 9 out of 10 Spaniards. On the other hand, 6 out of
10 Spaniards also coincide with the capacity policies as long as the local
team is public. The ban on smoking in stadiums is a measure that generates consensus
among 86% of Spaniards when it comes to reopening stadiums. Along the
same lines, 69% of Spaniards would understand the prohibition of eating in
the stadiums and, being water the only food or drink allowed inside the
enclosure. Finally, another issue with broad consensus would be the obligation
to wear a FFP2 mask without a valve within the stadiums, since up to 85% of
Spaniards consider it necessary. (YouGov Spain) May 20, 2021 Source: https://es.yougov.com/news/2021/05/20/la-vuelta-los-estadios-en-espana/ 689-691-43-34/Poll Only one in five Hungarians is vaccinated
The last summer causing the readings of Ipsos in May Covi-19
omnibus research. Thanks to improving epidemic data and rising
vaccination rates, the population is moving more freely and letting their
children into the community, interacting with others. The rate of
wearing a face mask was 87%, with a lower level most recently seen in
November. The 73% mention of frequent hand washing against infection is
the lowest in the history of the research series . The outlook for public transport and
the event market is mild, with domestic tourism improving significantly over
the past month. FIGURE: Which of the following activities
is true for you? (on the basis of adult population, N = 1,000 persons /
month)
With the above
results, the special situation has arisen in Hungary that the most vaccinated
and at the same time the most vaccinated sections of the population, instead
of boldly resuming their usual lives, are still much more cautious than the
insecure or vaccine-refusing social segments. Overall vaccination propensity reached 70% after an increase of four months . With an 8% uncertain stratum, the
rejection rate is 22%. Half of the adult population (51%) had undergone
at least the first vaccination, a further 11% had registered for the vaccine
but had not yet been invited or had rejected the vaccine offered. FIGURE: Would you vaccinate yourself with
the coronavirus vaccine currently available in Hungary? (on the basis of
the adult population, N = 1,000 persons / month)
The best vaccinated age group is still over 60 years of age, while
vaccine protection is also estimated to be above average among those with
higher education and in large cities. Vaccine rejection remains high in
the Northern Great Plain and Western Transdanubia (above 35%), and in line
with this, the measured registration rate also lags behind the rest of the
country (51% vs. 63%). We had been
relying on the free summer for a month, but most are currently only waiting
for the full opening in September. 40% of Hungarians believe that the restrictions introduced in Hungary
due to the epidemic will end by August, while the majority of 60% guess at a
later date or are unsure of the answer. FIGURE: In your opinion, when can the
restrictive measures end in Hungary and everything can return to its previous
order? (on the basis of the adult population, N = 1,000 people)
FIGURE: In your opinion, when can the
restrictive measures end in Hungary and everything can return to its previous
order? (on the basis of the adult population, N = 1,000 persons / month)
(Ipsos Hungary) May 20, 2021 Source: https://www.ipsos.com/hu-hu/csak-minden-otodik-magyar-oltasellenes NORTH
AMERICA
689-691-43-35/Poll Three-Quarters Of White Evangelical Protestants (75%) Say They Disapprove Of The New President’s
Performance So Far
America’s religious groups are deeply divided about President Joe
Biden’s performance so far, just as they were about President Donald Trump
throughout his term. In fact, Biden’s approval ratings today are nearly a
mirror image of Trump’s four years ago.
Religious groups that tended to disapprove of Trump’s performance as
president, including Hispanic Catholics, Black Protestants and the
religiously unaffiliated, mostly approve of Biden’s performance now,
according to a Pew
Research Center survey of U.S. adults conducted April 5-11. By
contrast, groups that approved of Trump in his early days, primarily White
evangelicals, now rate Biden negatively. For example, seven-in-ten religiously unaffiliated adults (71%) say
they approve of how Biden is handling the job of president, compared with
three-quarters (76%) who said they disapproved
of Trump’s performance in April 2017. At the other end of the spectrum, three-quarters of White evangelical
Protestants (75%) say they disapprove
of the new president’s performance so far, which is about equal to the share
who approved of Trump’s performance four years ago (73%). Catholics are not quite as unified. Around two-thirds of Catholics
(64%) say they approve of Biden’s handling of his job, driven by strong
support from Hispanic Catholics, 80% of whom grade Biden favorably. White
Catholics are almost evenly divided in their approval of Biden, much as they
were in their early evaluations of Trump. Biden’s strongest supporters are Black Protestants, 89% of whom say
they approve of the job he is doing so far. The April 2017 survey did not
include enough interviews with Black Protestants or Hispanic Catholics to
provide an early read on their evaluations of Trump, but their backing of
Biden so far has aligned
with broader partisan patterns, and they were consistently
among the religious groups least approving of Trump over the course
of his presidency. Black Protestants, Hispanic Catholics and religiously unaffiliated
Americans – also known as religious “nones” because they describe themselves,
religiously, as atheist, agnostic or nothing in particular – have long
been staunchly
Democratic constituencies. White evangelical Protestants are among
the most solidly and consistently Republican religious group in the U.S., and
they have grown even more uniformly Republican in recent decades. White
Catholics and White Protestants who are not evangelical also have shifted in
a Republican direction in recent years. Biden is Catholic and often talks about his faith, but his fellow
Catholics are divided
along party lines in their views about his religious beliefs.
Biden said
in 2020 that the Supreme Court’s Roe v. Wade decision establishing a
woman’s right to abortion nationwide should be upheld, which has prompted
some Catholics to argue that he should be denied
Holy Communion. Abortion isn’t the only divisive issue for Biden. Among White
Christians in particular, fewer express solidarity with Biden’s positions on
policy issues than did so with Trump’s. For instance, whereas 43% of White
Catholics say they agree with Biden on many, almost all or all issues, 58%
said same about Trump in February 2020 (before the coronavirus was
declared a pandemic). Among White Protestants who are not evangelicals,
one-third (34%) say they generally agree with Biden on the issues, compared
with 56% who said this about Trump. And whereas just 15% of White evangelical
Protestants say they agree with Biden on many, almost all or all issues,
fully three-quarters (76%) said they backed Trump on many or all issues. However, traditionally Democratic groups like Black Protestants and
religious “nones” are indeed far more likely to say they agree with Biden on
many or all issues than to have said this about Trump. Job ratings and issue positions aside, Biden is doing better than
Trump among most religious groups when it comes to views about his conduct.
Across all the religious groups analyzed – aside from White
evangelical Protestants – more people say they like the way Biden conducts
himself as president than said this about Trump when Pew Research Center last
asked this question in February 2020. This pattern is most pronounced among traditionally Democratic
groups: The share of Black Protestants who say they like the way Biden
conducts himself is 75 percentage points higher than the share who said the
same about Trump in February 2020 (81% vs. 6%), and the share of religious
“nones” who say they like Biden’s conduct is 47 points higher (55% vs. 8%). But even less traditionally Democratic groups give Biden higher marks
for his conduct. The difference among White Catholics, for instance, is 22
points in favor of Biden (46% vs. 24%), and among White Protestants who are
not evangelical it is 16 points (36% vs. 20%). White evangelical Protestants are the major exception to this
pattern. Only 14% of White evangelicals say they like the way Biden conducts
himself, compared with 31% who said this about Trump in February 2020. White
evangelical Protestants were Trump’s strongest supporters throughout
his four-year term. (PEW) MAY 4, 2021 689-691-43-36/Poll 70% Of U.S. Social Media Users Never Or Rarely Post Or Share About
Political, Social Issues
Only 9% of adult social media users say they often post or share
things about political or social issues on social media, according to newly
released results from a Pew Research Center survey of U.S. adults conducted
Sept. 8-13, 2020. Some 70% of social media users say they never (40%) or
rarely (30%) do so.
When asked about five potential reasons for why they do not post
about these topics, the top two reasons users cite are concerns that the
things they post or share will be used against them and not wanting to be
attacked for their views. About a third of those who never or rarely post or
share about these issues say that each statement is a major reason. Roughly a fifth of those who never or rarely post about these issues
say that among major reasons for this are not having anything to add to the
conversation, not paying close attention to political or social issues, or
not wanting to offend others. How we did this Answers to these questions – asked of Americans last fall as the 2020
presidential election approached – vary by political party and ideology.
Among social media users, Republicans and those who lean toward the
Republican Party say they post about political or social issues less
frequently – 74% say they never or rarely do so – compared with a smaller
share (66%) of Democrats and Democratic leaners who say the same. Some 44% of
Republican social media users and 36% of Democratic social media users say
they never do this.
The newly released results also reflect a pattern seen in other Center
explorations of political posts on
social media and other
political activities such as voting and activism. Those toward the
center of the ideological spectrum (that is, self-described conservative or
moderate Democrats, and liberal or moderate Republicans) are more likely to
be reluctant about engaging on social media than those at the edges of the
spectrum (liberal Democrats or conservative Republicans). Among social media users, Republicans who identify as moderate or
liberal are 15 percentage points more likely than conservative Republicans to
say they never or rarely post or share about political or social issues (83%
vs. 68%). Similarly, roughly eight-in-ten conservative or moderate Democrats
who use social media (77%) say they never or rarely post this type of
content, compared with a smaller share of liberal Democrats (56%). These new results are consistent with other Pew Research Center
findings about the relatively modest prevalence of political posts on social
media. For example, a Center analysis
of tweets posted by U.S. adults with public accounts from June
2018-June 2019 found that only 13% of tweets mentioned national politics.
Just 6% of these users were classified as “prolific political tweeters”
(posting at least 10 tweets during that period, with at least a quarter of
those tweets being about national politics). This pattern is not just
specific to politics: A
2020 analysis found that a minority of users produce the vast
majority of tweets more generally. Still, in a separate study during the
recent election season, 55% of Americans said they were worn
out by political posts on social media, with Republicans more likely
to say this than Democrats. There are also numerous ways social media users can be politically or
socially active on social media, and these can vary
based on current events. Some 14% of U.S. adults reported they had used a
hashtag related to a political or social issue in the past year when asked
about these issues in
a 2018 survey, and 18% had changed their profile picture to show support
for a cause in that same time frame. In
a June 2020 survey conducted in the wake of global protests against
racial injustice, roughly one-in-five social media users (18%) said they had
used such a hashtag in the past month, while about a third (36%) had posted a
picture to show their support for a cause. Several potential reasons for not posting
or sharing content about political or social issues are cited as major ones
by similar shares of Democrats and Republicans in this new survey. There are
other areas, however, where partisan and ideological differences stand out.
For instance, Republicans who use social media but post about these
issues infrequently are more likely than their Democratic counterparts to say
concern that this content could be used against them is a major reason they
don’t post in this way (37% vs. 29%). They are also more likely to say a
major reason is that they don’t want to be attacked for their views (36% vs.
27%) – and conservative Republicans are more likely than moderates or
liberals within the party to cite this as a major reason for rarely if ever
posting. Other Center research has examined political discourse and perceived
harassment both offline and online: For example, Republicans reported a less
“comfortable” environment for expressing their views in a 2019
Center study on political discourse, and another
recent study revealed that half of Americans who have experienced
harassing behaviors online think this was a result of their political views. When it comes to other major reasons someone might not post about
political or social issues, similar shares of Democratic and Republican social
media users who never or rarely do so cite not wanting to offend others, not
paying close attention to these issues or not having anything to add to the
conversation. Among Democratic social media users, however, infrequent
posters who identify as conservative or moderate are more likely to say the
latter two reasons are major ones, compared with their liberal counterparts. (PEW) MAY 4, 2021 689-691-43-37/Poll Just 11% Of Republicans And Republican-Leaning Independents Say
Trump’s Accounts Should Be Permanently Banned From Social Media
Americans are split on whether former President Donald Trump should
be barred from social media. Some 49% of U.S. adults say Trump’s accounts
should be permanently banned from social media, while half say they should
not be. But views are deeply divided along partisan lines, according to a new
Pew Research Center survey. The survey, fielded April 12 to 18, was conducted before Facebook’s
independent oversight board upheld for now the
suspension of Trump’s account that was instituted in the wake of the
violent riots at the U.S. Capitol on Jan. 6. Several social media
companies acted
against Trump after the attack, claiming he violated their terms of
use and that his rhetoric could result in more violence.
Republicans and Democrats hold deeply contrasting views of a lifetime
ban for Trump. Just 11% of Republicans and Republican-leaning independents
say Trump’s accounts should be permanently banned from social media, while
88% say they should not be. By comparison, 81% of Democrats and Democratic
leaners say his accounts should be banned permanently. Roughly one-in-five
Democrats (18%) do not support this type of ban on Trump’s accounts. While most Republicans do not support permanently barring Trump from
social media, there are some ideological differences within the party. More
than nine-in-ten conservative Republicans (95%) believe Trump’s accounts
should not be permanently banned from social media, but that share is lower
among moderate and liberal Republicans (77%). Among Democrats, liberals (85%)
are somewhat more likely than conservatives and moderates (78%) to favor a
permanent ban, though large majorities in both ideological groups favor it. The Center’s new poll follows a January
survey that gauged public reactions to the initial bans that social
media companies imposed on Trump after the Capitol riots. In that survey, 58%
of adults said they thought social media companies’ decisions to ban Trump’s
accounts in the wake of the riots were the right thing to do, while 41%
believed those decisions were the wrong thing to do. And then – just like today – most Republicans (78%) said social media
companies’ decisions to ban Trump’s accounts following the riots were the
wrong thing to do, while a vast majority of Democrats (89%) supported these
decisions. Facebook created
its oversight board in 2019 to be the final arbiter of important,
controversial content decisions made by the platform. It began making
decisions earlier
this year. The board recently ordered Facebook to reinstate
a post that accused Indian Prime Minister Narendra Modi of
participating in efforts to kill the country’s Sikh religious minority. (PEW) MAY 5, 2021 689-691-43-38/Poll About Six-In-Ten Americans Say Abortion Should Be Legal In All Or
Most Cases
Abortion has long been a contentious issue in the United States, and
it is one that sharply divides Americans along partisan, ideological and
religious lines. Today, a 59% majority of U.S. adults say abortion should be legal in
all or most cases, while 39% think abortion should be illegal in all or most cases. These
views are relatively unchanged in the past few years. The latest Pew Research
Center survey, conducted April 5 to 11, finds deep disagreement between – and
within – the parties over abortion. In fact, the partisan divide on abortion
is far wider than it was two decades ago. In the latest survey, Democrats and Democratic-leaning independents
are 45 percentage points more likely than Republicans and Republican leaners
to say abortion should be legal in all or most cases (80% vs. 35%). This gap
is little changed over the last few years, but the current divide is wider
than it was in the past. For instance, as recently as 2016, there was a
33-point gap between the shares of Democrats (72%) and Republicans (39%) who
supported legal abortion in all or most cases.
This wider gap is mostly attributable to a steady increase in support
for legal abortion among Democrats. In 2007, roughly two-thirds of Democrats
and Democratic leaners (63%) said abortion should be legal in all or most
cases. Support among Democrats has risen by nearly 20 points since then, and
80% now say abortion should be legal in all or most cases. Views among Republicans have remained relatively steady during this
period. In 2007, around four-in-ten Republicans (39%) said abortion should be
legal in all or most cases; today, 35% say this.
There are ideological differences within both parties over abortion,
though the divide is starker within the GOP. Among Republicans and
Republican-leaning independents, 59% of moderates and liberals say abortion
should legal in all or most cases, compared with just 22% of conservative
Republicans. While liberal Democrats are 17 percentage points more likely than
conservative and moderate Democrats to say abortion should be legal in all or
most cases, wide majorities of both groups (89% and 72%, respectively) say
this. Support for legal abortion varies by race and ethnicity, education
and religious affiliation.
Majorities of adults across racial and ethnic groups say abortion
should be legal in all or most cases. White adults and Hispanic adults,
however, are slightly less likely to say this than Black and Asian adults.
Nearly six-in-ten White (57%) and Hispanic adults (58%) say abortion should
be legal in all or most cases, compared with larger majorities of Black (67%)
and Asian (68%) adults. Support for legal abortion is greater among those with higher levels
of education. Those with postgraduate (71%) and bachelor’s (65%) degrees are
more likely than those with less education to support legal abortion in at
least most cases. Adults with no more than a high school education are
divided on the issue: Half say abortion should be legal in at least most
cases, while 47% say abortion should be illegal in
all or most cases. White evangelical Protestants continue to be opposed to abortion in
all or most cases. Around three-quarters of White evangelicals (77%) say it
should be illegal in all or most cases, while 21% say it should be legal in
at least most cases. In contrast, a majority of White Protestants who are not
evangelical (63%) say abortion should be legal in all or most cases. Religious “nones” – those who are religiously unaffiliated –
overwhelmingly support legal abortion. Around eight-in-ten (82%) say it
should be legal in all or most cases, while just 16% say it should be
illegal. Among the public overall, there is a modest gender divide in views of
whether abortion should be legal: 56% of men and 62% of women say it should
be legal in at least most cases. Within both parties, the views of men and
women are largely aligned: 80% of Democratic women and 79% of Democratic men
say abortion should be legal in all or most cases; similarly, 32% of
Republican men and 39% of Republican women say the same. (PEW) MAY 6, 2021 689-691-43-39/Poll Around Half Of Americans (48%) See Gun Violence As A Very Big Problem
In The Country Today
Guns are deeply ingrained in American society and the nation’s
political debates. The Second Amendment to the U.S. Constitution gives Americans the
right to bear arms, and about a third of U.S. adults say they personally own
a gun. At the same time, President Joe Biden and other policymakers have
proposed new
restrictions on firearm access in an effort to address gun violence
ranging from rising murder rates in some major cities to mass shootings. Here are some key findings about Americans’ attitudes about gun
violence, gun policy and other subjects, drawn from recent surveys by Pew
Research Center and Gallup.
Around half of Americans (48%) see gun
violence as a very big problem in the country today, according
to a Pew
Research Center survey conducted in April 2021. That’s comparable to
the share who say the same about the federal budget deficit (49%), violent
crime (48%), illegal immigration (48%) and the coronavirus outbreak (47%).
Only one issue is viewed as a very big problem by a majority of Americans:
the affordability of health care (56%). Another 24% of adults say gun violence is a moderately big problem.
About three-in-ten say it is either a small problem (22%) or not a problem at
all (6%). Attitudes about gun violence differ widely
by race, ethnicity, party and community type. About
eight-in-ten Black adults (82%) say gun violence is a
very big problem – by far the largest share of any racial or ethnic
group. By comparison, about six-in-ten Hispanic adults (58%) and 39% of White
adults view gun violence this way. (Due to sample size limitations, data for
Asian Americans is not available.)
Democrats and Democratic-leaning independents are far more likely
than Republicans and GOP leaners to see gun violence as a major problem (73%
vs. 18%). And nearly two-thirds of Americans who describe their community as
urban (65%) say the same, compared with 47% of suburbanites and 35% of those
who live in rural areas. Roughly half of Americans (53%) favor
stricter gun laws, a decline since 2019, according
to the April
2021 survey. Smaller shares say these laws are about right (32%)
or should be less strict (14%). The share of Americans who say gun laws
should be stricter has declined from 60% in September 2019. Current opinions
are in line with what they were in March 2017.
Among Republicans and Republican-leaning independents, views have
shifted. Republicans are currently more likely to say gun laws should be less
strict (27%) than stricter (20%). In 2019, by comparison, a larger share of
Republicans favored stricter gun laws than less strict laws (31% vs. 20%).
Both years, roughly half of Republicans said current gun laws were about
right. Today, a large majority of Democrats and Democratic-leaning
independents (81%) say gun laws should be stricter, though this share has
declined slightly since 2019 (from 86%). Americans are divided over whether
restricting legal gun ownership would lead to fewer mass shootings. Debates
over the nation’s gun laws have often followed recent mass shootings. But Americans are
split over whether legal changes would lead to fewer mass
shootings, according to the spring 2021 poll. About half of adults (49%)
say there would be fewer mass shootings if it was harder for people to obtain
guns legally, while about as many either say this would make no difference
(42%) or that there would be more mass shootings (9%). The public is even more divided about the effects of gun ownership on
crime overall. Around a third (34%) say that if more people owned guns, there
would be more crime. The same percentage (34%) say there would be no
difference in crime, while 31% say there would be less crime. There is broad partisan agreement on some
gun policy proposals, but most are politically divisive, the spring
2021 survey found. Majorities in both partisan coalitions favor two
policies that would restrict gun access: preventing those with mental
illnesses from purchasing guns (85% of Republicans and 90% of Democrats
support this) and subjecting private gun sales and gun show sales to
background checks (70% of Republicans, 92% of Democrats). Majorities in both
parties also oppose allowing
people to carry concealed firearms without a permit.
Other proposals bring out stark partisan rifts. While 80% or more of
Democrats favor creating a federal database to track all gun sales and
banning both assault-style weapons and high-capacity ammunition magazines
that hold more than 10 rounds, majorities of Republicans oppose the
proposals. Most Republicans, on the other hand, support allowing people to carry
concealed guns in more places (72%) and allowing teachers and school
officials to carry guns in K-12 schools (66%). These proposals are supported
by just 20% and 24% of Democrats, respectively. Americans in rural areas typically favor
more expansive gun access, while Americans in urban places prefer more
restrictive policies, according to the April
2021 survey. Even though rural areas tend to be more
Republican and urban communities more
Democratic, this pattern holds
true even for those who identify with the same political party. For
example, 71% of rural Republicans favor allowing teachers and other school
officials to carry guns in K-12 schools, compared with 56% of Republicans
living in urban places. Conversely, about half of Republicans who live in
urban communities (51%) favor bans on assault-style weapons, compared with
31% of those living in rural areas.
Democrats favor more gun restrictions regardless
of where they live, but there are still some differences by community
type. A third of rural Democrats (33%), for instance, support allowing
teachers and other school officials to carry guns in K-12 schools, compared
with 21% of those in urban areas. More than four-in-ten U.S. adults (44%) say
they live in a household with a gun, including about a third (32%) who say
they personally own one, according to a Gallup
survey conducted in October 2020. There are differences in gun ownership rates by political party
affiliation, gender, geography and other factors. For instance, half of
Republicans say they personally own a gun, compared with 18% of Democrats.
(Independents are counted separately in the Gallup survey. Among
independents, 29% say they personally own a gun.) Men are more than twice as likely as women to own a gun (45% vs.
18%), and 48% of those living in towns or rural areas report owning a
firearm, compared with about a quarter of those living in suburbs (25%) or
cities (23%). Federal data suggests that gun sales have risen in recent years,
particularly during
the coronavirus pandemic. In 2020, the number of monthly federal
background checks for gun purchases was at least 20% higher than in the same
month in 2019, according to the FBI’s National
Instant Criminal Background Check System. The largest percentage increase
occurred in July 2020, when about 3.6 million background checks were
completed – a 44% increase from July 2019. Personal protection tops the list of
reasons why gun owners say they own a firearm. In
a separate Gallup survey in August 2019, gun owners were most likely to cite
personal safety or protection as the reason they own a firearm.
Roughly six-in-ten (63%) said this in an open-ended question. Considerably
smaller shares gave other reasons, including hunting (40%), nonspecific
recreation or sport (11%), that their gun was an antique or family heirloom
(6%) or that the gun was related to their line of work (5%). A Pew Research Center survey conducted in 2017 found
similar patterns in firearm owners’ stated reasons for owning a gun,
as well as in the overall share of Americans with a gun in their home. (PEW) MAY 11, 2021 Source: https://www.pewresearch.org/fact-tank/2021/05/11/key-facts-about-americans-and-guns/ 689-691-43-40/Poll Immigration Was A Top Focus Of Early Biden Coverage, Especially Among
Outlets With Right-Leaning Audiences
As more migrants arrive at the U.S.
southern border, the politically polarized issue
of immigration was one of the most dominant topics in the coverage
of President Joe Biden’s early days in the White House.
Immigration was one of the five topics most covered by 25
major news outlets, according to a Pew
Research Center study of news coverage of the first 60 days of the
Biden administration, accounting for 11% of all stories. It was topped only
by health care (17%) and the economy (22%). (References to COVID-19
were coded
separately from topics.) But the amount of attention paid to Biden’s handling of immigration
issues varied significantly across media outlets – a finding borne out by the
content analysis and a survey of 12,045 U.S. adults. The topic of immigration (which included all references to
immigration, including broader trends and changes in law, as well as stories
about the border with Mexico) accounted for about twice as many stories from
outlets with right-leaning audiences (20%) as from news outlets with
left-leaning audiences (8% of stories) and those with ideologically mixed
audiences (10%). (Details about how news outlets were grouped can
be found here.) Indeed, among those outlets with right-leaning audiences,
immigration was the No. 1 topic among stories related to the new
administration, well ahead of both the economy (14%) and health care (13%). Four years earlier, with Donald Trump pushing a
crackdown on illegal immigration, the issue accounted for 14% of the
stories about his first days in office, according to a similarly
conducted study
in 2017. The difference between then and now is that Trump’s immigration
coverage was much more evenly distributed across outlets with left-leaning
audiences (12%), mixed audiences (15%) and right-leaning audiences (also
15%).
The study also finds that the assessments of the Biden administration
in stories about immigration during these first 60 days were more negative
than the coverage overall. Across all stories studied, the tone of coverage
of Biden’s new presidency was modestly more negative than positive – 32% of
the stories carried a negative assessment, 23% carried a positive one and a
plurality (45%) were neither positive nor negative. But the assessments of the Biden administration’s handling of
immigration were far more negative – about half of these stories (51%) had a
negative assessment, compared with 15% that were positive and 34% that were
neither. The only other topic among the top five to generate as much negative
coverage was Biden’s political skills, at 53%. But there were also more
positive stories on that topic (25%) and fewer that were neither (22%). Americans who turn to outlets with
right-leaning audiences most likely to have heard a lot about immigration and
want to hear more
A companion
survey of U.S. adults was conducted March 8-14 to add context to the
content analysis, which had found that media outlets with right-leaning
audiences were the most heavily focused on the immigration issue in Biden’s
first days in office. About one-third of all Americans (30%) said they had heard a lot
about the administration’s efforts around reforming immigration policy. That
trailed far behind those who said they heard a lot about the passage of the
economic stimulus bill (77%), the distribution of the COVID-19 vaccine (74%)
and Biden’s use of executive actions to overturn some of Trump’s policies
(52%). But 45% of those who only got political news in the past week from
outlets with right-leaning audiences said they had heard a lot about Biden’s
efforts to reform immigration policy. That is significantly higher than the
31% of Americans overall who had a more mixed news diet, and roughly double
the 21% who got news only from outlets with left-leaning audiences. (Find
details about the survey
and media diet groupings here.) Overall, 11% of all Americans say the topic their main news sources
paid the most attention to was immigration. But that number roughly triples
to 34% among those whose media diets are only on the right. In stark
contrast, just 5% of those who use only outlets with left-leaning audiences
say their main sources paid the most attention to immigration.
In a separate question about which initiatives had received too much,
too little or the right amount of attention in the news, a plurality of U.S.
adults (43%) said immigration had received too little attention, compared
with 18% who said too much and 37% who said the right amount. But nearly six-in-ten (59%) who got political news only from outlets
with right-leaning audiences said the subject of immigration warranted more
coverage. That compares with 44% of those with a more mixed media diet and
37% of those who got political news only from outlets with left-leaning
audiences. (PEW) MAY 12, 2021 689-691-43-41/Poll 12% Of Us Jewish Adults Say They Attend Religious Services Weekly Or
More Often, Compared With 27% Of The General Public And 38% Of Us Christians
From Passover Seders to Jewish foods and life-cycle milestones such
as bar and bat mitzvahs, some aspects of Jewish religious life and culture
are widespread among American Jews. But other religious expressions – such as
regular attendance at synagogue services and belief in God as described in
the Bible – are much less common, according to a new Pew
Research Center survey. In fact, based on these more traditional measures of religious
observance, Jews in the United States are far less religious than U.S.
Christians and Americans overall. For example, 12% of U.S. Jewish adults say they attend religious
services weekly or more often, compared with 27% of the general public and
38% of U.S. Christians. And 21% of Jewish adults say religion is very
important in their lives, compared with 41% of U.S. adults overall and 57% of
Christians.
There are even bigger gaps when it comes to belief in God. About a
quarter of Jews (26%) say they believe in God as described in the Bible,
compared with more than half of U.S. adults overall (56%) and eight-in-ten
Christians. Jews are more likely
than U.S. adults overall (50% vs. 33%) to say they believe in some other
spiritual force or higher power, but not in God as described in the Bible.
Jewish adults also are twice as likely as the general public to say they do
not believe in any kind
of higher power or spiritual force in the universe (22% vs. 10%). Orthodox Jews – who make up 9% of all U.S. Jews – are a notable
exception. They are among the most highly religious groups in U.S. society by
these measures. For example, 86% of Orthodox Jews say religion is very
important in their lives, as do 78% of Black Protestants and 76% of White
evangelical Protestants, two of the most highly religious Christian
subgroups. Orthodox Jews (93%) also are about as likely as White evangelicals
(94%) and Black Protestants (88%) to say they believe in God as described in
the Bible.
Conservative and Reform Jews, who together make up 54% of U.S. Jews,
are much less religious than Orthodox Jews by these measures. A third of
Conservative Jews and 14% of Reform Jews say religion is very important in
their lives. Moreover, 37% of Conservative Jews and 18% of Reform Jews
believe in God as described in the Bible. In analyzing the survey results, Pew Research Center also
distinguished between two sets of respondents: those who say their religion
is Jewish (referred to as “Jews by religion”) and those who describe
themselves religiously as atheist, agnostic or nothing in particular, but who
have a Jewish parent or were raised Jewish and still identify as Jewish in
ways other than religion, such as culturally, ethnically or because of their
family background (referred to as “Jews of no religion”). By these
definitions, 73% of U.S. Jews are Jews by religion, while 27% are Jews of no
religion. Not surprisingly, Jews of no religion are much less religious than
Jews by religion, at least by some standard measures. Fewer than 1% of Jews
of no religion say they attend religious services at least weekly, compared
with 16% of Jews by religion. And while 6% of Jews of no religion say
religion is very important to them, the share is much higher (33%) among Jews
by religion. The fact that U.S. Jews as a whole are less likely than Americans
overall to say religion is very important to them does not necessarily mean
their Jewish identity is not meaningful to them. In fact, twice as many Jews
say “being Jewish” is very important to them as say their religion is very
important to them (42% vs. 21%). More than half of Jews by religion (55%) say
being Jewish is very important to them, compared with just 7% of Jews of no
religion.
Both Jews by religion and Jews of no religion are more likely to
engage with Judaism in other ways. Roughly six-in-ten Jewish Americans
overall say they held or attended a Passover Seder in the year prior to the
survey, including 74% of Jews by religion and 30% of Jews of no religion.
Similar shares in both groups say they observed a life milestone such
as a bar or bat mitzvah during that period. And about eight-in-ten Jews by
religion (78%) say they often or sometimes cook or eat traditional Jewish
foods, while roughly half of Jews of no religion (54%) say this. Eating traditional Jewish foods is not to be mistaken with keeping
kosher: Just 17% of U.S. Jews say they keep kosher in their homes, including
22% of Jews by religion and 3% of Jews of no religion. The vast majority of
Orthodox Jews (95%) keep kosher at home, compared with 24% of Conservative
Jews and 5% of Reform Jews. (PEW) MAY 13, 2021 689-691-43-42/Poll 69% Of Adults Ages 20 To 29 Who Had Graduated From College During The
Previous Spring Were Employed, Lower Than The Share Of 2019 Graduates Who
Were Employed In October Of That Year (78%)
From their virtual commencements, the class of 2020 graduates looked
out into a very different economic future than their predecessors the year
before – one upended by a recession caused by a
pandemic that has been particularly hard
on young workers. The challenges of a pandemic economy are evident in the
labor market outcomes of 2020 college graduates, who have experienced a
downturn in employment and labor force participation, according to a new Pew
Research Center analysis of data from January to October collected by
the Bureau of
Labor Statistics.
In October 2020, 69% of adults ages 20 to 29 who had graduated from
college with a bachelor’s degree or higher during the previous spring were
employed, lower than the share of 2019 graduates who were employed in October
of that year (78%). The labor force participation rate for recent college
graduates – or the share of people employed or actively looking for a job –
also dropped from 86% to 79% during this one-year period. As has been widely
documented, the broader labor market took a significant hit during the
pandemic. Among all Americans ages 16 and older, the employment rate declined
from 61% in October 2019 to 58% in October 2020, and the labor force
participation rate declined from 63% to 62%.
While it is too early to compare the long-term impacts of the
COVID-19 recession and the Great Recession on recent college graduates, there
is evidence that the outcomes for these young adults have differed in the
months following their graduation. The labor force participation rates for
the classes of 2007 and 2008 were relatively unchanged, whereas the class of
2020 saw a marked decline compared with the class of 2019. Class of 2020 high school graduates – young adults ages 16 to 24 who
graduated from high school in the previous spring – faced their own
challenges as they made decisions about entering the labor market or
enrolling in college, among other options. Overall, college enrollment rates
are largely unchanged for the class of 2020 compared with the class of 2019.
However, an earlier
analysis looking at the share of all 18- to 24-year-olds enrolled in
college showed that there was a slight decline in enrollment among certain
demographic groups, including Black and Asian young adults. Among high school graduates who were not enrolled in college in the fall after graduation,
the employment rate was similar in 2019 and 2020. However, there was a
notable drop among women in this group: 65% were employed in 2019 vs. 54% in
2020 (there was no change among men in this group). (PEW) MAY 14, 2021 689-691-43-43/Poll About Four-In-Ten (41%) Americans Say News Organizations Are Growing
In Their Influence
Americans’ views about the influence of the media in the country have
shifted dramatically over the course of a year in which there was much
discussion about the news media’s role during the election and post-election
coverage, the COVID-19
pandemic and protests
about racial justice. More Americans now say that news organizations are
gaining influence than say their influence is waning, a stark contrast to
just one year ago when the reverse was true. When Americans were asked to evaluate the media’s standing in the
nation, about four-in-ten (41%) say news organizations are growing in
their influence, somewhat higher than the one-third (33%) who say their
influence is declining, according to a Pew Research Center survey conducted
March 8-14, 2021. The remaining one-quarter of U.S. adults say they are
neither growing nor declining in influence. By comparison, Americans in early 2020 were far more likely to say
the news media were
declining in influence. Nearly half (48%) at that time said this,
compared with far fewer (32%) who said news organizations were growing in
influence. The 2021 figures more closely resemble responses from 2011 –
the next
most recent time this was asked – and before, in that more Americans
then said the news media were growing in influence than declining. Views
could have shifted in the gap between 2011 and 2020, but if so, they have now
shifted back. (It should be noted that prior to 2020, this question was asked
on the phone instead of on the web.) What’s more, this shift in views of the media’s influence in the
country occurred among members of both political parties – and in the same
direction.
Republicans and Republican-leaning independents are about evenly
split in whether they think news organizations are growing (40%) or declining
in influence (41%). This is very different from a year ago, when Republicans
were twice as likely to say their influence was declining than growing (56%
vs. 28%). And Democrats and Democratic leaners are now much more likely to say
news organizations are growing (43%) than declining in influence (28%), while
a year ago they were slightly more likely to say influence was declining (42%
vs. 36% growing). Overall, then, Republicans are still more likely than Democrats to
say the news media are losing standing in the country, though the two groups
are more on par in thinking that the media are increasing in their influence.
(Democrats are somewhat more likely than Republicans to say news
organizations are neither growing nor declining in influence – 29% vs. 19%.)
Trust in media closely ties to whether its influence is seen as
growing or declining. Those who have greater trust in national news
organizations tend to be more likely to see the news media gaining influence,
while those with low levels of trust are generally more likely to see it
waning. Americans who say they have a great deal of trust in the accuracy of
political news from national news organizations are twice as likely to say
the news media are growing than declining in influence (48% vs. 24%,
respectively). Conversely, those who have no trust at all are much more
likely to think that news organizations are declining (47% vs. 33% who say
they are growing).
Black Americans are far more likely to think that the news media are
growing in influence rather than declining (48% vs. 19%, respectively), as
are Hispanic Americans though to a somewhat lesser degree. White Americans,
on the other hand, are about evenly split in thinking the news media are
growing or declining in influence (39% vs. 37%, respectively). And while men
are about evenly split (39% growing vs. 38% declining), women are more likely
to say news organizations are growing (43%) than declining (29%) in
influence. (PEW) MAY 17, 2021 689-691-43-44/Poll A Third Of Large US Newspapers Experienced Layoffs In 2020, More Than
In 2019
Staff layoffs continued to pummel the beleaguered U.S. newspaper
industry in 2020. A third of papers with an average Sunday circulation of
50,000 or more experienced layoffs last year, a period complicated by the
impact of the coronavirus
pandemic, according to a new Pew Research Center analysis which examined
news articles that cited staff layoffs at these outlets. These 2020 layoffs exceed the roughly one-quarter of papers in the
same circulation range that experienced layoffs in 2019 (many were the same
papers) as employment
within the newspaper industry continued to fall precipitously in
recent years. Large-market newspapers – those with a Sunday circulation of 250,000
or more – were the most likely to suffer layoffs in 2020, with more than half
of them experiencing staff cuts. That is unlike 2019, when cuts were roughly
similar across the different tiers of circulation groups studied.
Meanwhile, digital-native
news outlets saw a slight uptick in layoffs in 2020 compared with
2019. During the coronavirus pandemic, many small and medium-sized
newspaper companies were able to apply for federal aid through the CARES
Act, a federal coronavirus aid package designed to help small businesses
pay employees and other expenses. However, due to rules surrounding this loan
program, many local newspapers owned
by larger companies such as Gannett or McClatchy were not eligible
to apply. This analysis examines layoffs at large newspapers and digital-native
news outlets during the 2017-2020 calendar years, but does not include
other cost-cutting measures. During early days of the COVID-19 outbreak, many
news media companies either
delayed or avoided layoffs by first instituting cost-cutting
measures such as furloughs or pay cuts. About one-in-ten newspapers experienced
multiple rounds of layoffs in 2020 Of the one-third of newspapers with an average Sunday circulation of
50,000 or higher that experienced layoffs in 2020, roughly one-in-ten (11%)
experienced more than one publicly reported layoff, according to the study.
By comparison, while fewer newspapers experienced layoffs in 2019, nearly a
quarter (24%) of those that did have them expereniced multiple rounds of
layoffs that year. Nearly half of newspapers (46%) that experienced layoffs in 2020 also
had layoffs in 2019, indicating that many of the same papers have been forced
to implement layoffs multiple times in recent years. These findings come amid reports that many small
newspapers have closed due to the coronavirus pandemic and many more
have sought
federal aid in order to stay afloat. Medium- and large-market newspapers saw an
increase in layoffs in 2020 from 2019
Medium- and large-market newspapers – those with average Sunday
circulations of 100,000 to 249,999 and 250,000 or above, respectively –
experienced more layoffs in 2020 compared with 2019. Roughly three-in-ten medium-market newspapers (27%) had publicly
announced layoffs in 2020, compared with 18% in 2019. Among larger-market
newspapers (those with a circulation of at least 250,000), more than half of
those studied (55%) experienced layoffs in 2020. In 2019, about a quarter
(27%) of larger-circulation newspapers experienced layoffs. Smaller-market newspapers, those with a circulation between 50,000
and 99,999, experienced about the same proportion of layoffs in 2020 as 2019
(31% vs. 29%). Layoffs at U.S. digital-native news outlets
increased in 2020
Among the largest digital-native news outlets – those with a monthly
average of at least 10 million unique visitors – 18% went through layoffs in
2020, up from 11% in 2019. In 2020, no digital-native news outlet that was
studied experienced multiple rounds of layoffs. While the percentage of digital-native outlets experiencing a layoff
was higher in 2020 than the two years prior, it is similar to 2017, when 20%
of digital-native outlets had at least one publicly announced layoff. It is worth noting that most of the layoffs that occurred at
digital-native news outlets in 2020 occurred in the latter half of the year,
after the COVID-19 pandemic gripped the U.S. During the early part of the
outbreak, many digital news outlets postponed
or avoided layoffs entirely by first
implementing pay cuts and furloughs. (PEW) MAY 21, 2021 689-691-43-45/Poll 45% Of US Jewish Adults, And An Additional 37% Say Caring About
Israel Is Important, But Not Essential
Israel, the world’s only Jewish-majority country, is a subject of
special concern to many Jews in the United States. Caring about Israel is
“essential” to what being Jewish means to 45% of U.S. Jewish adults, and an
additional 37% say it is “important, but not essential,” according to a
new Pew
Research Center survey that was fielded from Nov. 19, 2019, to June
3, 2020 – well before the latest surge of violence
in the region. Just 16% of U.S. Jewish adults say that caring about
Israel is “not important” to their Jewish identity. However, the survey found that Jewish Americans – much
like the U.S. public overall – also hold widely differing views on
Israel and its political leadership. Most Jewish Americans identify
as Democrats or lean toward the Democratic Party, and more than half
gave negative ratings at the time of the survey both to Israeli Prime
Minister Benjamin Netanyahu and to then-President Donald Trump’s handling of
U.S. policy toward Israel. But Orthodox Jews – 75% of whom are Republican or
lean Republican – generally rated both Netanyahu and Trump positively. Orthodox Jews were also more likely than Jews in other denominations
to say that the Israeli government was making a sincere effort to reach a
peace settlement with the Palestinians and that God gave the land that is now
Israel to the Jewish people. By contrast, most Jewish Americans said they did
not think that either the Israeli government or Palestinian leaders
were sincerely
seeking peace. And most Jewish adults took
the position that God “did not literally give” the land of Israel to
the Jewish people (42%) or said they do not believe in God or a higher power
at all (24%). This analysis looks at the size of the gaps among U.S. Jews on a
range of questions about Israel depending on differences in Jewish
denomination, political party and age. More than half of all U.S. Jews belong to the two long-dominant
branches of American Judaism: 37% identify as Reform and 17% as Conservative.
Roughly one-in-ten (9%) describe themselves as Orthodox. Other branches, such
as the Reconstructionist movement and Humanistic Judaism, total about 4%, and
due to small sample sizes cannot be analyzed separately. One-third of Jewish
adults (32%) do not identify with any particular stream or institutional
branch of Judaism.
And while 60% of Jews overall say they have a lot or some in common
with Jews in Israel, Orthodox Jews (91%) are more likely than Conservative
Jews (77%), Reform Jews (61%) or those who don’t identify with any branch
(39%) to express this feeling. On some political and theological questions in the survey, the
differences across denominations are starker. There is an especially large
gap on whether God gave the land that is now Israel to the Jewish people. The
vast majority of Orthodox Jews (87%) say they believe God gave the land that is
now Israel to the Jewish people, compared with 46% of Conservative Jews,
about a quarter of Reform Jews and about one-in-five of those who don’t
affiliate with any branch of American Judaism. Party affiliation is another clear dividing line in Jewish Americans’
views on Israel. About seven-in-ten Jewish Republicans and independents who
lean Republican (72%) say they are very or somewhat attached to Israel,
compared with about half of Democratic and Democratic-leaning Jews (52%).
There are similar gaps across the political aisle in the percentages of Jews
who closely follow news about Israel and feel they have at least some things
in common with Jews in Israel.
Similarly, Jewish Republicans were roughly four times as likely as
Jewish Democrats to rate Trump’s handling of U.S. policy toward Israel as
excellent or good (89% vs. 21%). And Jewish Republicans were much more likely
than Jewish Democrats to say they had heard
of the boycott, divestment, sanctions (BDS) movement, and that they
strongly oppose it. Another way of examining differences among Jewish Americans is to
look at age gaps. While Orthodox Jews tend to be relatively
young and feel a
strong attachment to Israel, younger Jews – as a whole – are less attached to
Israel than their older counterparts. Two-thirds of Jews ages 65 and older
say that they are very or somewhat emotionally attached to Israel, compared
with 48% of those ages 18 to 29. In addition, Jewish Americans 65 and older are more likely than the
youngest adults to say that caring about Israel is essential to what being
Jewish means to them, to follow news about Israel at least somewhat closely,
and to know about and strongly oppose BDS.
(PEW) MAY 21, 2021 Source: https://www.pewresearch.org/fact-tank/2021/05/21/u-s-jews-have-widely-differing-views-on-israel/ 689-691-43-46/Poll Liberals (38%) in the Driver’s Seat over Conservatives (29%) as
Vaccination Rollout Hits its Stride
Toronto, ON, May 18, 2021 – Canadians
are continuing to reward the federal Liberals with their intended vote
support as approval for the Prime Minister remains high. According to a new
Ipsos poll conducted exclusively for Global News, the Liberals remain in the
driver’s seat with a strong lead over the Conservatives in each of Canada’s
most-populous provinces, which would likely secure them a majority
government. If the election were held tomorrow, 38% of decided voters would vote
for the Liberal Party led by Justin Trudeau, unchanged since Ipsos/Global
News post-budget survey last month. Three in ten (29%) would vote for Erin
O’Toole’s Conservative Party, up 2 points since last month. Two in ten (21%)
decided voters would cast their ballot for their local NDP candidate, led by
Jagmeet Singh, also up 2 points. Yves-Francois Blanchet and the Bloc would
receive 6% of the vote nationally, down 1 point (or 30% of the popular vote
within in Quebec). Annamie Paul and the Green Party, would receive 5% of the vote (down
2 points), while the rest of the vote would go to the People’s Party (1%) or
some other party (<1%). Two in ten Canadians would either not vote (6%) or
remain undecided (15%). All told, four in ten (41%, down 3 points since last month) Canadians
believe the Trudeau government has done a good job and deserves re-election,
a figure which typically tracks very closely to the percentage of the popular
vote the incumbent receives on election day. This figure, along with the fact
that 50% of Canadians approve (11% strongly/39% somewhat) of the performance
of the Liberal government under Justin Trudeau (down 1 point), give the
Liberals a very good shot at a majority government, should the vote
composition fall out favourably for them – which it does. The Liberals have a strong lead among decided voters in each of
Canada’s three most-populous provinces, which would be the key to delivering
Trudeau a majority government:
Not only do the Liberals lead in all the seat-rich regions of the
country, but also among all of the key demographic voting blocks which drive
the overall results:
(Ipsos Canada) 18 May 2021 689-691-43-47/Poll Seven In Ten (70%) Canadians Believe Summer 2021 Will Be A
Disappointment Given The Ongoing Covid Restrictions
Toronto, ON, May 20, 2021 – Given
the ongoing COVID-19 restrictions that have been implemented throughout the
country, a strong majority (70%) of Canadians agree (21% strongly/49%
somewhat) that this summer will be a disappointment, according to a new Ipsos
poll conducted on behalf of Global News. Those residing in Ontario and
Atlantic provinces are the most likely to agree that summer 2021 will be a
disappointment, while those in Quebec are least likely to agree (75%, 75% vs
62%). Perhaps not surprising, those who have not been vaccinated are more
likely to agree that this summer will be a disappointment compared to those
who have been vaccinated (74% vs 67%). While a majority sees the upcoming summer as a disappointment, many
believe it will still be better than last year’s summer: six in ten (61%)
Canadians agree (10% strongly/51% somewhat) that they are confident summer
2021 will be better than the summer of 2020. This opinion is more pronounced
among those aged 18-34 (66% of those aged 18-34 vs 61% of those aged 55+ vs
56% of those aged 35-54). Additionally, those residing in Quebec are more
likely to agree than the other provinces (75% Quebec vs 67% BC, 57% Atlantic,
56% Alberta, 54% Ontario, 53% Saskatchewan/Manitoba). Hesitation around Travel Remains Despite vaccination efforts ramping up across the country, only one
quarter (26%) of Canadians agree (6% strongly/20% somewhat) that they plan on
traveling outside of their province this summer. Men are more likely to
travel (31% vs 21% women), as are those aged 18-34 (38% vs 26% 35-54, 18%
55+). Looking at a regional breakdown, those residing in Alberta and
Saskatchewan/Manitoba are more likely to agree that they plan on traveling
outside of their province this summer (43% Alberta, 40% Saskatchewan/Manitoba
vs 26% Quebec, 22% Ontario, 22% Atlantic, 21%
BC). The hesitation towards travel is more present when it comes to
travelling abroad (not surprising given the border restrictions still in
place), with only one in eight (15%) Canadians agreeing (4% strongly/11%
somewhat) that they plan on traveling outside of Canada this summer. When it
comes to venturing outside Canada’s borders, similar demographics seem more
willing to be on the move: men (18% vs 12% women) and those aged 18-34 (23%
18-34 vs 14% 35-54 vs 10% 55+) are more likely to say they’ll travel outside
of Canada this summer. Although the United States has a higher proportion of fully
vaccinated residents, Canadians remain wary of the border re-opening, with
only a quarter (25%) agreeing (9% strongly/16% somewhat) that it is now safe
to re-open the Canada-US border to travelers. Again, men (31% vs 19% women)
and those aged 18-34 (34% 18-34 vs 24% 35-54 vs 20% 55+) are more likely to
agree that it is now safe for the border to re-open to travelers. Indoor Events Still a No-Go for Most
Canadians When it comes public events, fewer than half (45%) of Canadians agree
(13% strongly/31% somewhat) that they would feel safe attending an outdoor public festival or event this
summer. Men (49% vs 41% women) and those aged 18-34 (56% 18-34 vs 45% 35-54,
35% 55+) are more likely to agree that they would feel safe attending an
outdoor public event this summer. As well, Conversative party voters are more
likely to agree (54% Conservative party voters vs 41% Liberal party voters,
35% NDP voters). Notably, those who have not been vaccinated are more
likely to feel safe attending an outdoor public event this summer compared to
those that have been vaccinated (49% vs 41%), but this is likely a function
of age as most younger people are still waiting to get vaccinated. There is more hesitation regarding indoor events, with only a third (28%) of Canadians agreeing
(8% strongly/20% somewhat) that they would feel safe attending an indoor
public festival or event this summer. Following a similar pattern, men (34%
vs 23% female) and those aged 18-34 (43% 18-34, 25% 35-54, 20% 55+) are more
likely to agree that they would feel safe attending an indoor public festival
or event this summer. As well, Conservative party voters are more likely to
agree (35% Conservative voters vs 24% Liberal party, 23% NDP voters).
Similarly to outdoor events, those who have not been
vaccinated are more likely to agree that they would feel safe attending an
indoor public event this summer compared to those who have been vaccinated
(35% vs 23%), once again being driven by younger people are seemingly less
cautious than their older counterparts. (Ipsos Canada) 20 May 2021 AUSTRALIA
689-691-43-48/Poll New Zealand Government Lead Over Opposition Down To 14% In April –
Smallest Lead Since January 2020
The governing parties are now 14% points ahead of the Parliamentary
opposition National/Act NZ/Maori Party on 41%, up 6% points since March.
Support for National has now recovered to its highest since last year’s
election, up 6.5% points to 29.5%, and is the highest for exactly a year
since April 2020 at the start of the COVID-19 pandemic. The recovery in support for National has come from both the Labour
Party and fellow Opposition Party Act NZ, now on 9%, down 2% points from
March. Support for the Maori Party has increased and is up by 1.5% points to
post-election high of 2.5% in April. This latest New Zealand Roy Morgan Poll on voting intention was conducted
by telephone – both landline and mobile – with a New Zealand-wide
cross-section of 933 electors during April. Electors were asked: “If a New Zealand Election were held today which
party would receive your party vote?” Of all electors surveyed
there were 6% (up 1.5% points) who didn’t name a party. Labour/Greens (55%) lead over opposition
National/Act NZ/Maori (41%) cut to 14% points In April 55% of electors supported the Labour/Greens governing
partnership, down 2.5% points on March. The governing parties are now 14%
points ahead of the Parliamentary opposition National/Act NZ/Maori Party on
41%, up 6% points since March. This is the narrowest lead for the Labour-led Government for over a
year since January 2020 when Prime Minister Jacinda Ardern’s Government led
53% cf. 43% over the National-led Opposition. A small minority of 4% of electors support other minor parties
outside Parliament with support for NZ First down 1.5% points to 1% and The
Opportunities Party (TOP) down 1.5% points to 0.5% in April. New Zealand Government Confidence Rating
virtually unchanged at 136 in April In April a slightly increased majority of 62.5% of New Zealand
electors (up 1% point) said New Zealand was ‘heading in the right direction’
compared to just over a quarter, 26.5% (up 0.5% points) who said New Zealand
was ‘heading in the wrong direction’. “The long-awaited travel bubble between New
Zealand and Australia finally opened on April 19 but the re-opened borders
haven’t provided a boost to the Ardern Government with other issues
dominating the discussion in recent weeks. “Opposition Leader Judith Collins has
criticised the Government’s proposed reforms to New Zealand’s Health System
which will scrap the existing 20 District Health Boards (DHBs) to be replaced
with by a single national authority known as ‘Health NZ’. “Health NZ will operate four regional
divisions and there will be a separate Maori Health Authority (MHA) empowered
to develop health policy and commission health services specifically for
Maori. Collins has criticised the proposal as she claims health issues stem
from poverty rather than race and segregating the health system along racial
lines will not address these issues. “Also in the headlines has been New
Zealand’s stance on China and its contrast with its allies in the Five Eyes
alliance including the US, UK, Australia and Canada. Foreign Minister Nanaia
Mahuta said New Zealand was uncomfortable using the Five Eyes intelligence
and security network to define New Zealand’s relationship with China and stated
that New Zealand needs to ‘maintain and respect the particular customs,
traditions and values’ held by China. “There has been pushback from MPs in close
allies the UK and Australia on Mahuta’s statement particularly as it relates
to alleged human rights abuses by the Chinese Government against the Uyghur
minority in Xinjiang. The opposition Act NZ party is set to introduce a
resolution to Parliament in early May that declares China’s oppression of the
Uyghurs in Xinjiang as an ‘act of genocide’ which will put a further
spotlight on the Government’s position on the issue. “These issues have clearly dented support
for the Labour/Greens coalition and the latest Roy Morgan New Zealand Poll
shows they have the support of 55% of electors in April, down 2.5% points
from March and only 14% points ahead of the National-led Opposition on 41% -
the narrowest margin since January 2020 pre-pandemic.” New Zealand Party Vote: 2020-21 New Zealand Party Vote: NZ Govt. v
Parliamentary Opposition
Roy Morgan NZ Government Confidence Rating
vs. ANZ-Roy Morgan NZ Consumer Confidence
Voting Intention Summary The following table compares the latest New Zealand Roy Morgan Polls
on Voting Intention with the result from the September 23, 2017 General
Election:
*The 1996 Election was the first New
Zealand Election contested via MMP (Mixed Member Proportional). At the 1996
Election the Greens Party contested as part of the “Alliance” political
grouping with four other political parties. Two-Party Preferred: Labour Party-led
Government vs. Parliamentary Opposition Parties
*At the 2020 NZ Election the Labour party
secured 50.01% of the vote which was enough to govern in their own right but
Labour opted to sign a ‘Cooperation Agreement’ with the Greens, who won 7.86%
of the vote. There were three Parties elected to Parliament not in Government
led by National (25.58%), Act NZ (7.59%) and the Maori Party (1.17%). (Roy Morgan) May 03 2021 Source: https://www.roymorgan.com/findings/8699-nz-national-voting-intention-april-2021-202105030601 689-691-43-49/Poll Movement In The Sydney, Melbourne And Adelaide Cbds Drops In Late
April After Hitting Covid-19 Highs Over The Easter Holidays
Since school holidays ended average 7-day movement levels have
declined across all Capital City CBDs including the Melbourne CBD (down 9%
points to 43%), Sydney CBD (down 11% points to 48%), Brisbane CBD (down 12%
points 63%) and Hobart CBD (down 16% points to 61%). The largest declines in average movement were seen in the Adelaide
CBD (26%-point decline to 72%) and the Perth CBD which experienced a sharp
31%-point decline to 53% average movement as the city entered a snap
three-day lockdown over the three-day ANZAC Day weekend. In the week after Easter through to April 12 average 7-day movement
levels were at pandemic highs in several Capital City CBDs including the
Sydney CBD (59% of pre-COVID-19 levels), Melbourne CBD (52%), Perth CBD (84%)
and Adelaide CBD (98%) – a record high for any Australian Capital City CBD
since the COVID-19 pandemic began. However, the week after Easter was right in the middle of school
holidays for most of Australia and the high levels of movement seen that week
have not been sustained in the following two weeks with the kids back in
school. The figures illustrate the ongoing issue facing Capital City Lord
Mayors striving to return city office workers to the office rather than
continuing to work from home – as many prefer to do. Australian Capital City CBDs average 7-day
movement levels March 1, 2020 – April 26, 2021:
Roy Morgan has partnered with leading technology innovator UberMedia
to aggregate data from tens of thousands of mobile devices to assess the
movements of Australians as we deal with the restrictions imposed in response
to the COVID-19 pandemic. The interactive dashboard available on the website tracks the
movement data for those visiting the Capital City CBDs during 2020 and 2021,
excluding the CBD residents of each city. Movement data from several key
locations around Australia is also available to view by using the interactive
dashboard.
“The recent Easter school holidays brought
life back into Australia’s Capital Cities quite literally – average movement
levels in the week after Easter hit their highest since the COVID-19 pandemic
began in four Capital City CBDs: Adelaide CBD (98% of pre-COVID-19 levels),
Perth CBD (84%), Sydney CBD (59%) and Melbourne CBD (52%). “However, the movement spike during the
Easter school holidays was short-lived and average movement levels have
largely returned to their levels prior to the Easter holidays in the CBDs. “Average movement levels in the Perth CBD
fell more sharply than elsewhere and down to a 7-day average of only 53% of
pre-COVID levels in the week to April 26 as the city entered a second short
lockdown over the three-day ANZAC weekend. “The end of school holidays also led to
steep falls in movement levels in other cities as well with average movement
levels falling 26% points in the Adelaide CBD, down 12% points in the
Brisbane CBD, down 11% points in the Sydney CBD and down 9% points in the
Melbourne CBD. “On a comparative level the average
movement level in the Adelaide CBD was at 72% of normal in the last week and
higher than anywhere else ahead of the Brisbane CBD (63% of normal), Perth
CBD (53%), Sydney CBD (48%) and Melbourne CBD (43%). “The latest results show Capital City CBDs
are still operating at levels well below those they were used to before the
COVID-19 pandemic began in March 2020. The large number of office workers
continuing to work from home, as well as the ongoing lack of international
tourists, continue to place added pressure on businesses in Capital City CBDs
that rely on passing foot traffic. “The latest news out of India, which is
dealing with a surge in COVID-19 cases, shows how important it is for
Australia’s population to be vaccinated against the virus before
international borders can be re-opened. “However, the flexibility of
working-from-home is likely to remain a key point of appeal for many office
workers and provides an ongoing challenge for Inner City Councils looking to
revitalise their cities and return activity closer to pre-COVID ‘normality’.” (Roy Morgan) May 03 2021 689-691-43-50/Poll Australian Employment Hits A Record High Above 13 Million In April –
Unemployment Down, But Offset By Rising Under-Employment
Roy Morgan’s unemployment figure of 9.0%
for April is over 3% points higher than the current ABS estimate for March 2021 of 5.6%.
However, the ABS figure for March counts as employed an additional 57,000
Australians who were working zero hours for ‘economic reasons’. If these
non-workers are added back the ABS unemployment estimate for March increases
to 835,000 (6.0%). The ABS also claims there are 1.1 million Australians
(7.9%) under-employed for a total of 1.93 million unemployed or
under-employed (14.0% of the workforce).
Compared to early March 2020, before the
nation-wide lockdown was implemented, in April 2021 there were over 500,000
more Australians either unemployed or under-employed (+2.7% points).
For the second straight month unemployment dropped in all six States
in April. The end of the JobKeeper wage subsidy had little impact as
employment increased in all six States with the largest increases in new jobs
in Queensland (up 256,000) and New South Wales (up 152,000).
Roy Morgan Unemployment &
Under-employment (2019-2021)
Michele Levine, CEO Roy Morgan, says the
end of the JobKeeper wage subsidy and winding back of JobSeeker payments have
been vindicated with employment rising and unemployment down in all six
States in April: “Australia’s employment markets have
powered through the end of the Federal Government’s $90 billion JobKeeper
wage subsidy program with employment increasing by 542,000 in April to a new
record high of 13,291,000 – up 420,000 on the employment numbers in early
March 2020. “In April there were increases to full-time
employment, up 129,000 to 8,534,000 and part-time employment, up 413,000 to
4,757,000. Part-time employment is now at a new record high while full-time
employment is at its highest since February 2020 prior to the COVID-19
pandemic. “The growing employment market has led to
declines in unemployment across the board. The unemployment rate dropped 2.4%
points to 9.0% in April, the lowest it has been since early March 2020 and
unemployment rates declined in all six States for the second month in a row.
Despite the removal of Government support at the end of March the
unemployment rates in all six States are now below 10% for the first time in
nearly a decade since November 2011. “Although there was a lot of good news in
the April employment figures there is still a large cohort of 2.66 million
Australians (18.3% of the workforce) who are either unemployed or
under-employed. This under-utilised cohort is 500,000 higher than pre-pandemic
when there were 2.16 million Australians unemployed or under-employed (15.6%
of the workforce). “A big driver of this increase is the
higher participation rate today than prior to the COVID-19 pandemic. Now
69.1% of Australians aged 14+ are in the workforce (14,598,000) and are
either employed (13,291,000) or unemployed (1,307,000) compared to 67.1% in
the workforce (14,087,000) a year ago in February 2020 when there were
12,913,000 employed and 1,174,000 unemployed Australians. “Compared to the employment market
pre-pandemic there is now a larger workforce which includes increases in both
employment and unemployment as well as higher under-employment in an economy
with a record amount of part-time employment. “Overall, the economy has taken the ending
of the JobKeeper wage subsidy in its stride and on Tuesday the Treasurer Josh
Frydenberg is set to deliver his third Federal Budget which will set the tone
for the Government’s economic and policy priorities in the lead-up to the
next Federal Election due either later this year or early in 2022.” This Roy Morgan survey on Australia’s unemployment and ‘under-employed’* is based on weekly
face-to-face interviews of 751,605 Australians aged 14 and over between
January 2007 and April 2021 and includes 5,758 telephone and online
interviews in April 2021. *The
‘under-employed’ are those people who are in part-time work or freelancers
who are looking for more work. Roy Morgan Unemployed and ‘Under-employed’*
Estimates
*Workforce
includes those employed and those looking for work – the unemployed.
Source: Roy Morgan Single Source October 2006 – April 2021.
Average monthly interviews 4,000. Roy Morgan Research cf. ABS Unemployment
Estimates
Source: Roy Morgan Single Source January 2000 – April
2021. Average monthly interviews 4,000.
Source: Roy Morgan Single Source April 1995 – March 2021.
Average monthly interviews 4,000. (Roy Morgan) May 06 2021 Source: https://www.roymorgan.com/findings/8702-australian-unemployment-estimates-april-2021-202105060606 689-691-43-51/Poll A Huge Majority Of 93% Of Australians Said They Are More Likely To
Buy Products Made In Australia
A huge majority of 93% of Australians said they are more likely to
buy products made in Australia – up from 87% a year earlier. The big ‘loser’
during 2020 was Chinese-made goods with only 21% of Australians saying they’d
be more likely to buy products made in China, a 9% points drop from 2019. Australian consumers are more likely to buy goods manufactured in
nearest neighbour New Zealand on 55% than any other foreign country, despite
a fall of 4% points from 2019. Right behind New Zealand is the UK on 51%
(down 4% points), USA on 47% (down 7% points), Japan on 46% (down 7% points)
and Germany on 46% (down 7% points). Of Australia’s top
ten two-way trading partners in 2019-20* preferences for goods rose
for four countries all in the Asia-Pacific region in 2020 led by Singapore on
34% (up 1% point on 2019), South Korea on 29% (up 1% point), Malaysia on 17%
(up 2% points) and India on 17% (up 1% point). Overall, of twenty-one countries Australians were asked this question
about, preference for goods rose for ten countries, fell for another ten
countries, and was unchanged for only one country – Spain.
Source: Roy Morgan Single Source (Australia), Jan-Dec 2019,
n=50,422 and Jan-Dec 2020, n=61,294. Respondents were asked to indicate
whether they would be more likely or less likely to buy products made in each
of the following countries: Australia, Canada, Chile, China, France, Germany,
India, Indonesia, Italy, Japan, Korea, Malaysia, New Zealand, Singapore,
South Africa, Spain, Sweden, Thailand, UK, USA and Vietnam. Michele Levine, CEO, Roy Morgan, says
Australian-made goods enjoyed a surge in popularity during 2020 as
international travel was cut-off while Chinese-made goods experienced the
steepest decline in preference of any country: “Australian-made products have experienced
a surge in support during 2020 with a large majority of 93% of Australians
more likely to buy a product that is ‘made in Australia’, up 6% points from 2019.
Less than 1% of Australians say they are less likely to buy a product that is
‘made in Australia’ unchanged on a year ago. “The closure of international borders and
restrictions on travel around the world appears to have helped increase
support for Australian-made goods at the expense of overseas products. “Unsurprisingly it is Chinese-made goods
which have fallen the most in preference and only 21% of Australians say they
would be more likely to buy a product that is ‘made in China’ – down 9%
points from 2019. In addition, a clear majority of 58% of Australians say
they would be less likely to buy a product that is ‘made in China’ – up 15%
points from 2019. “Over the last year relations between
Australia and China have deteriorated despite the fact over 30% of
Australia’s two-way trade valued at $264 billion in 2019/20[1] is with China. In
response to Australian requests for an investigation into the origins of
COVID-19 the Chinese Government has slapped tariffs and import restrictions
on a range of Australian goods including wine, barley, lobsters, coal,
timber, red meat and cotton. “However, Australia’s largest export to
China – iron ore – has remain untouched by any restrictions and the price of
the key commodity has surged to a record of over $200 USD per tonne – around
$260 AUD per tonne. The surging price of iron ore, and other commodities such
as copper, silver and agricultural products, has contributed to record
Australian trade surpluses over the last year and supported growth in the
Australian economy despite the pandemic. “Although the preference for
Australian-made goods is very high across all age groups it is Baby Boomer
(96%) and Generation X (94%) who are even more likely to prefer
Australian-made products than other generations.” (Roy Morgan) May 10 2021 Source: https://www.roymorgan.com/findings/8701-australian-made-country-of-origin-may-2021-202105100230 689-691-43-52/Poll Roy Morgan Business Confidence Hits 7-Year High Of 125.3 In April –
Up 48.4 Pts (+62.9%) On A Year Ago
Business Confidence is now 11.6pts above the long-term average of
113.7 and nearly two-thirds, 65%, expect ‘good times’ for the Australian
economy over the next 12 months and an increasing majority of 59.5% of
businesses said the next 12 months is a ‘good time to invest in growing the
business’. Business Confidence for April is now 13.7pts (+12.3%) above the
latest ANZ-Roy
Morgan Consumer Confidence of 111.6 for May 8/9, 2021. Business Confidence has had its best start
to a year for a decade – since 2011 Business Confidence has now averaged 122.7 during the first four
months of 2021, the best start to a year for the Index for a decade since
2011 – during the middle of the ‘Mining Boom’. During the first four months of 2011 Business Confidence averaged a
record high 130.3. The ending of the $90 billion JobKeeper wage subsidy
scheme in March has not led to a fall in Business Confidence as many had
feared would happen. Roy Morgan Monthly Business Confidence --
Australia
Business Confidence highest in WA and
Victoria and lagging in Tasmania pre-election Business Confidence is significantly higher in all six Australian
States than this time a year ago and Western Australia is again higher than
anywhere else at 133.2, up 37.3pts (+38.9%) on April 2020. Western Australians handed WA Premier Mark McGowan a record election
victory in mid-March with McGowan’s Labor Party winning nearly 70% of the two-party
preferred vote compared to just over 30% for the Liberal Opposition. The
nation-leading Business Confidence in WA comes despite the Greater Perth
region enduring a short three-day lockdown over the recent ANZAC Day weekend. Business Confidence in Victoria has also rebounded strongly and is up
47.7pts (+57.9%) from a year ago to 130.1. This is the highest Business
Confidence in Victoria for over seven years since January 2014 when the
rating was at 134.3. The biggest increase in Business Confidence over the last year is in
South Australia which saw a massive increase of 59.1pts (+85.8%) to 128.0 in
April 2021. Slightly below the national average is Queensland on 124.8, up
44.9pts (+56.2%) on a year ago and now at its highest for three years since
April 2018. Business Confidence in NSW slipped slightly in April and is now at
118.9, but this still represents an increase of 51pts (+75.2%) on a year ago. Lagging the other States is Tasmania, now with a Business Confidence
of 110.1, an increase of 19.1pts (+21%) on a year ago. It is worth keeping in
mind that Tasmania spent the month of April in political limbo as Premier
Peter Gutwein called an early election for last weekend. ‘Gutwein’s gamble’
paid off though with the Liberal Party re-elected to a historic third term in
Government in the Apple Isle. Business Confidence by State in April 2020
vs. April 2021
Top 10 industries led by Public
Administration & Defence, Wholesale, Agriculture and Retail Public Administration & Defence is clearly the most confident
industry in March-April 2021 with a Business Confidence of 157.9, up a
massive 51.9pts (+49.9%) on the same period a year ago. Following behind are
Wholesale on 145.2 (up 65.3pts, +81.9%), Agriculture on 144.3 (up 52pts,
+56.4%), Retail on 137.9 (up 64pts, +86.5%) and Education & Training on
135.7 (up 53.1pts, +64.3%). Other industries with Business Confidence above the national average
include Community Services on 133.9 (up 50.8pts, +61.1% on a year ago),
Administrative & Support Services on 131.6 (up 36.6pts, +38.5%),
Transport, Postal & Warehousing on 130.7 (up 23.1pts, +21.4%),
Information, Media & Telecommunications on 130.6 (up 66.2pts, +102.6%)
and Property & Business Services on 125.8 (up 32.6pts, +34.9%). There are only two industries, Electricity, Gas & Water and the
Mining industry, which are currently in negative territory with Business
Confidence ratings below the neutral level of 100 in March-April 2021. Business Confidence for Top 10 Industries
in March-April 2021
A majority of businesses expect ‘good
times’ for the economy over the next 12 months and five years and say the
next 12 months is a ‘good time to invest in growing the business’
Michele Levine, CEO of Roy Morgan, says
Business Confidence increased to a new seven year high in April as businesses
‘shrugged off’ the end of the JobKeeper wage subsidy program: “Business Confidence is at 125.3 in April,
up a massive 48.4pts (+62.9%) on a year ago, when the first nation-wide
lockdown began. One year ago Business Confidence hit a COVID-19 pandemic
record low of only 76.9 in April 2020. “Australian businesses are very confident
about the next 12 months with nearly two-thirds, 65%, expecting ‘good times’
for the Australian economy over the next 12 months – the highest rating for
this indicator since September 2014. In addition, a solid majority of 59.5%
of businesses say the next 12 months is a ‘good time to invest in growing the
business.’ “The worries that many held about how the
Australian economy would deal with the end of the $90 billion JobKeeper wage
subsidy in March appear to have been over-stated with businesses at their
most confident since the 2014 Federal Budget nearly seven years ago. “That 2014 Federal Budget led to an
immediate plunge in Business Confidence and Consumer Confidence and Treasurer
Josh Frydenberg will be mindful of repeating the mistakes made by his
predecessor Joe Hockey when he hands down his third Budget on Tuesday. “Already the Federal Government has
announced a $1.7 billion increase in support for young families to help pay
for childcare. This support will make it easier for working parents, and
especially working mothers, to re-join the workforce after the birth of a new
child. “On a State-based level it is the
post-election Western Australia which had the highest Business Confidence at
133.2. WA Premier Mark McGowan secured a record victory winning nearly 70% of
the two-party preferred vote in mid-March and his re-election appears to have
been welcomed by the West Australian business community – despite a recent
lockdown over the ANZAC Day weekend. “On an industry basis the most confident
industries are again Public Administration & Defence (157.9), Wholesale
(145.2), Agriculture (144.3) and Retail (137.9). Retailers have experienced a
year of record sales although the ending of the Government’s JobKeeper wage
subsidy and the reduction in the Jobseeker payment at the end of March likely
spells the end of the sales boom. “Although there are many positive signs for
the Australian economy there are continuing concerns about the vibrancy of
Australia’s Capital City CBDs. The latest Roy Morgan UberMedia movement figures for the late
April show movement in
the five major Capital City CBDs dropped sharply in late April and remains
well below the average levels seen prior to the COVID-19 pandemic.” (Roy Morgan) May 11 2021 Source: https://www.roymorgan.com/findings/8693-roy-morgan-business-confidence-april-2021-202105100713 689-691-43-53/Poll Inflation Expectations Virtually Unchanged At 3.7% In April – Far
Higher For Unemployed (4.5%) Than Full-Time Employees (3.4%)
Inflation Expectations are now 1% point below their long-term average
of 4.7% but have increased by 0.5% points since reaching a record low of only
3.2% in August 2020. Inflation Expectations are heavily influenced by someone’s employment
status and unemployed Australians consistently have higher Inflation
Expectations than people who are employed or not in the workforce. Unemployed Australians had Inflation Expectations of 4.5% in April,
an increase of 0.4% points since August 2020 when the measure hit a record
low. This is far higher than Australians employed either part-time on 3.9%
(up 0.5% points) or full-time on 3.4% (up 0.8% points). Interestingly,
Australians who are employed part-time but want more work, the
under-employed, have Inflation Expectations of 4.4% (up 0.8% points) – almost
as high as the unemployed. Those Australians not in the workforce who may be retired, on home
duties, studying or not working and not looking for work have Inflation
Expectations of 4.1% - right in the middle of the employed and unemployed. Inflation Expectations by Employment
Status: August 2020 cf. April 2021
Inflation Expectations are again highest in
Tasmania and are now lowest in Queensland On a State-based level Inflation Expectations are again highest in
Tasmania at 4.4%, although this is down 0.2% points from March. The measure
has ‘run hot’ in Australia’s smallest State and been higher than any other
State in every month so far this year. Last week Tasmanians went to the polls and re-elected the Tasmanian
Liberal Government now led by Premier Peter Gutwein for an unprecedented
third term. This is the first time in Tasmania’s history the Liberal Party
has won three State Elections in a row. Inflation Expectations are now slightly higher than the national
average in NSW at 4% (up 0.4% points from March), WA at 3.8% (down 0.2%
points) and SA at 3.8% (up 0.5% points). Victorian Inflation Expectations are again in line with the national
average at 3.7% in April, down 0.1% points from March while Queensland has
the lowest Inflation Expectations at 3.5%, down by 0.8% points. The ANZ-Roy
Morgan Consumer Confidence Rating has continued to recover and was at 112.1
for the month of April 2021, an increase of 23pts (+25.8%) since August
2020. Consumer Confidence for April was the highest monthly figure for the
rating since the month of September 2019 (112.8) more than a year ago. Inflation Expectations Index long-term
trend – Expected Annual Inflation in next 2 years
See below for a comprehensive list of RBA interest rate changes
during the time-period charted above. “Inflation Expectations have stabilised at
an average of 3.7% so far during 2021, an increase of 0.2% points on the 2020
annual average of 3.5% - a new record low. Although down slightly in April
Inflation Expectations are also up year-over-year for the first time since
June 2018. “The end of the JobKeeper wage stimulus in
March as well as the winding back of the ‘boosted’ COVID-19 JobSeeker
supplement may have contributed to the small fall in Inflation Expectations
in April as the withdrawal of Government support has been a concern for many. “However, the good news is that despite
Government support being reduced the Australian economy appears to be on
solid footing with Roy Morgan Business Confidence hitting a seven-year
high of 125.3 in April and
the latest Roy Morgan unemployment figures showing
unemployment falling to its lowest since the COVID-19 pandemic began with a record number of Australians now
employed. “Looking at the measure by employment
status shows Inflation Expectations have increased across the board since
hitting record monthly lows in August 2020. In April Australians employed
full-time still have the lowest Inflation Expectations of any employment
category at only 3.4%, but this represents an increase of 0.8% points since
August 2020 – the largest increase of any employment category. “As we have seen consistently when looking
at Inflation Expectations it is unemployed Australians who perceive prices as
rising faster than anyone else. Their Inflation Expectations are now at 4.5%,
an increase of 0.4% points since mid-2020. “If the economic momentum seen in recent
months can be maintained in the months ahead we would expect to see Inflation
Expectations continue to increase. However, there are clear dangers to this
positive outlook with the recent outbreaks of COVID-19 in both Perth and
Sydney illustrating that there is the ever-present risk of further border
closures and city shutdowns that would reduce prosperity.”
The questions used to calculate the Monthly
Roy Morgan Inflation Expectations Index. 1) Prices: “During the next 2 years, do you think that
prices in general will go up, or go down, or stay where they are now?”
The Roy Morgan Inflation Expectations Index is a forward looking
indicator unlike the Consumer Price Index (CPI) and is based on continuous
(weekly) measurement, and monthly reporting. The Roy Morgan Inflation
Expectations Index is current and relevant.
RBA interest rates changes during the time
period measured: 2010-2020. RBA – Interest rate increasing cycle
(2010): 2010 RBA – Interest rate cutting cycle
(2011-2013, 2015-2016 & 2019-2020): 2011 2012 2013 2014 2015 2016 2017 2018 2019 2020 (Roy Morgan) May 11 2021 Source: https://www.roymorgan.com/findings/8704-australian-inflation-expectations-april-2021-202105100720 689-691-43-54/Poll 5.68 Million Australians (26.9% Of Those Aged 14+) In The March
Quarter 2021, Intend To Take A Holiday During The Next 12 Months
Of these travellers there were 5.24 million set on taking a domestic
holiday and a further 340,000 planning an overseas holiday – although
according to this week’s Federal Budget the international borders are set to
remain closed for holidaymakers until early next year. There were a small
number of prospective travellers who couldn’t decide whether their holidays
would be domestic or international. For those planning a holiday of at least three nights Queensland is
now the top destination for 24.9% of travellers just ahead of New South Wales
(22.7%) with Victoria (11.6%) and Western Australia (11.1%) significantly
further behind. Other holiday makers have opted for another domestic
destination, an international destination (which will have to be reconsidered
with borders set to remain closed), or do not yet have any particular
destination in mind at all. In 2019 prior to the pandemic New
South Wales had been the top domestic destination for holidays of at least
three nights chosen by 17.2% of travellers just ahead of Queensland
(16.4%) and Victoria (15.3%). These are the latest findings from the Roy Morgan Single Source
survey, derived from comprehensive in-depth interviews with 1,000 Australians
each week or over 50,000 each year. Domestic destinations of next long holiday
of three or more nights – March Quarter 2021
The COVID-19 pandemic has led to the
closure of Australia’s international borders and forced travellers to choose
a domestic destination with Queensland emerging as the top choice according
to Roy Morgan CEO Michele Levine: “The latest Roy Morgan data on holiday
travel intentions shows Queensland over-taking NSW during 2020 to become the
preferred domestic destination for holidays of at least three nights. Now
24.9% of travellers taking a longer holiday are choosing Queensland as their
next destination just ahead of NSW (22.7%) and well ahead of both Victoria
(11.6%) and WA (11.1%). “Prior to the pandemic NSW had been the
leading domestic destination for longer holidays of at least three nights
picked by 17.2% of travellers just ahead of both Queensland
(16.4%) and Victoria (15.3%) in late 2019. “However, Queensland’s excellent handling
of COVID-19 over the last year has seen the State overtake its two domestic
rivals as the preferred destination after many years trailing the two.
Despite now being in second place NSW has also increased its share of
intending travellers with Victoria losing out as the State suffered
significantly during 2020 from a second wave of COVID-19. “The approach taken to the pandemic by the
Queensland Government was endorsed at last year’s Queensland State Election
with the Government of Premier Annastacia Palaszczuk returned with an
increased majority and these results show other Australians are also
endorsing the State as a good place for a longer holiday as long as the
international borders remain closed. “As the vaccine rollout continues around
Australia and vulnerable populations are inoculated against COVID-19 the
domestic tourism operators will be hoping that any future outbreaks of the
virus are dealt with as swiftly and effectively as they have been over the
last year. “The closure of the international borders which
is set to continue into mid-2022 provides an unprecedented opportunity for
Australian holiday-makers to explore their own country over the next year as
international tourists remain ‘locked out’.” (Roy Morgan) May 14 2021 Source: https://www.roymorgan.com/findings/8689-691-australian-long-domestic-holidays-may-2021-202105140217 689-691-43-55/Poll In 2020 Just 14% Of Australians Aged 14+ Attended Live Entertainment
Activities Such As Theatre, Rock, Pop Or Music Concerts
In 2020 just 14% of Australians aged 14+ attended live entertainment
activities such as theatre, rock, pop or music concerts, theatre restaurants,
cabaret, music festivals, jazz, classical, blues, ballet or opera
performances in an average three months, down from 30% a year earlier in
2019. Only 5% of Australians attended live theatre in an average three
months in 2020, down from 14% in 2019, and just 5% went to rock, pop or music
concerts, compared to 10% in 2019. Attendance at other activities including theatre restaurants, music
festivals, jazz, classical, blues, ballet or opera performances also plunged
during 2020. The re-opening of Australia that has occurred in 2021 and the
rollout of the COVID-19 vaccines this year should lead to a boost in
attendance at live entertainment activities although the threat of outbreaks
means it is unlikely to approach the levels of 2019 just yet. The data comes from Roy Morgan Single Source, the nation’s largest
and longest-running program of research into consumer behaviour and
attitudes, continuously conducted year-round. Live entertainment activities attended:
2019 vs. 2020
Generation Z were most likely to attend
live entertainment activities in 2020 The onset of the COVID-19 pandemic during 2020 changed the
composition of audiences at live entertainment activities with Generation Z
overtaking Generation X as the generation most likely to attend a performance
– although both were down significantly on 2019. In 2020 attendance at live entertainment activities was heavily
correlated to age with younger Australians the most likely to attend. Over
1-in-6 people in Generation Z (17%) attended a live entertainment activity
during 2020, down from 32% in 2019, but higher than any other generation. Next most likely to attend live entertainment activities were
Millennials on 15% (down from 30% in 2019). However, the biggest declines in
attendance in 2020 were for Generation X on 13% (down from 32%) and Baby
Boomers on 10% (down from 29%). Only 8% of Pre-Boomers attended a live entertainment activity in 2020,
down from 22% in 2019. Women were less likely than men to attend live entertainment
activities in 2020 with attendance at only 13%, down from 32% in 2019 – a
decline of 19% points. Attendance by men declined less steeply to be at 15%,
down from 28% in 2019 - a drop of 13% points. Attendance at live entertainment activities
by Gender & Generation in 2020
“Attendance at live entertainment
activities plummeted during 2020 as the COVID-19 pandemic led to the closure
of venues for months on end and forced cancellations of many events such as
music festivals and tours, and jazz, classical, blues, ballet and opera
performances. “Only 2.9 million Australians attended live
entertainment activities in 2020 representing around 14% of the population
aged 14+, down from over 6.2 million (30%) in 2019 prior to the pandemic. “The biggest declines in 2020 were for Baby
Boomers and Generation X – those born from 1946-1975 and aged 44-74 years old
during 2020. Prior to the pandemic over 32% of people in Generation X (born
from 1961-1975) attended live entertainment activities – higher than any
other generation. However, in 2020 only 13% of Generation X attended live
entertainment activities – a drop of 19% points on 2019. “In 2020 it was younger Australians in
Generation Z who were more likely to attend live entertainment activities
than older generations. Just over 1-in-6 of those in Generation Z (17%)
attended a live entertainment activity in 2020 down from just under 32% in
2019. “The Roy Morgan data illustrates how
vaccinating older Australians is vital to returning audiences at live
entertainment activities to their pre-pandemic levels of well over 6 million
people. Older Australians are far more hesitant about attending events which
involve coming into contact with hundreds, or even thousands, of strangers
than their younger counterparts. “Given the mortality statistics surrounding
COVID-19, which presents a far greater danger to older people and those with
significant existing health issues, this is no surprise. However, these
results emphasise the importance of a successful vaccination program in
Australia to many live entertainment activities. “Prior to the pandemic activities such as
live theatre, ballet, opera and jazz, classical and blues performances were
all more likely to be attended by Australians in Generation X, Baby Boomers
or Pre-Boomers – those aged 40+, rather than younger Millennials or
Generation Z.” (Roy Morgan) May 18 2021 Source: https://www.roymorgan.com/findings/8708-live-entertainment-december-2020-202105170719 689-691-43-56/Poll Australians Have Nearly 175 Million Days Of Annual Leave Due – Up
Over 23 Million Days From Early 2020
The accrued annual leave of nearly 175 million days is a record high
total of accrued annual leave and represents an increase of 23.7 million
(+15.7%) on the 151.2 million days of accrued annual leave Australians had
available prior to the COVID-19 pandemic.
Source: Roy Morgan Single Source
(Australia), April 2005 – March 2021. Average annual interviews for each 12
months period, n=8,035. Now over 6.69 million Australians (52.2% of paid workers) have at
least 2 weeks of annual leave due, up from 6.14 million prior to the
pandemic, while fewer than 1.38 million (10.8%) have less than 2 weeks due
compared to over 1.54 million (12.6%) pre-pandemic. There have been slight increases in annual leave due tor periods
greater than 2 weeks compared to a year ago. Now over 1.63 million
Australians (12.8% of paid workers) have 2-3 weeks of annual leave due – the
most common time period of annual leave due, up from 1.45 million (11.9%) In addition, there are now 1.37 million Australians (10.7% of paid
workers) who have at least 7 weeks of annual leave due, up from 1.26 million
a year ago (10.3%). A large cohort of 4.74 million Australians (37.0% of paid workers)
have no annual leave due, up slightly from the 4.60 million (37.4%) without
any annual leave due pre-pandemic. The higher level of employment now compared
to pre-pandemic means although there are now more paid workers with no annual
leave entitlements this constitutes a smaller share of the overall number of
employed Australians. For more detail see Roy Morgan’s employment estimates on the latest
trends in Australia’s employment markets: ‘Australian
employment hits a record high in April 2021’. Annual leave owed to Australia’s paid workers by length of time (2021
vs. 2020)
Source: Roy Morgan Single Source (Australia), April 2019 –
March 2021, average annual interviews n=16,053. Base: Australians 14+ in
paid employment. *Annual leave owed is calculated based on (working) days
owed. Less than 2 weeks: 1-9 days; 2 weeks – under 3 weeks: 10-14 days; 3
weeks – under 4 weeks: 15-19 days; 4 weeks – under 5 weeks: 20-24 days; 5
weeks – under 7 weeks: 25-34 days; 7+ weeks: 35+ days. These results are from the Roy Morgan Single Source survey, derived
from comprehensive in-depth interviews with over 1,000 Australians each week
and around 50,000 Australians per year.
“The COVID-19 pandemic has had a huge
impact on the Australian economy and continues to heavily impact the local
travel and tourism industry with international borders set to remain closed
for another year according to the recent Federal Budget. “The reliance on domestic tourists to power
the industry over the next year means understanding the amount of annual
leave Australians have due is now more important than ever. The latest Roy
Morgan figures show over 6.69 million Australians have at least two weeks
annual leave, up from 6.14 million prior to the pandemic – a significant
increase. “There have been increases in the number of
Australians with annual leave due for all time periods longer than two weeks
– and over 1.37 million Australians now have at least 7 weeks of annual leave
due – up from 1.26 million a year ago. “The growth in the amount of annual leave
due is evident when looking at the total amount of annual leave days due –
now at a record high of nearly 175 million days – up 23.6 million days
(+15.7%) from a year ago pre-pandemic. “The increasing numbers of Australians with
long periods of annual leave due is likely directly related to the closure of
international borders. Traditionally Australians are more likely to take
shorter domestic holidays whereas overseas travel can last for many weeks, or
even months. “The fact Australia’s international borders
are set to remain closed for another year presents a real opportunity for
domestic travel agencies to appeal to the 6.69 million Australians with at
least two weeks annual leave due to seriously consider taking a longer
holiday in Australia – there will likely never be a better chance to
see Australia than over the next 12 months. “The latest Roy Morgan Holiday Travel Intention Leading
Indicator Report shows
it is Queensland (24.9% of Australians intending to take
a holiday of at least 3+ nights) and NSW (22.7%) that are the top destinations for Australians
planning on taking a longer holiday.” (Roy Morgan) May 18 2021 Source: https://www.roymorgan.com/findings/8696-annual-leave-holidays-march-2021-202105170711 689-691-43-57/Poll In 2020 Only 24% Of Australians Said They’d Be More Likely To Buy
Clothes If They Knew The Clothes Were ‘Made In China’, Down 7% Points From
2019
The largest declines were for clothes, electrical goods, mobile
phones, footwear and sporting goods. In 2020 only 24% of Australians said they’d be more likely to buy
clothes if they knew the clothes were ‘Made in China’, down 7% points from
2019. The same trend was evident for Chinese-made electrical goods with 23%
(down 5% points from 2019) of Australians saying they’d be more likely to buy
the product if they knew it was ‘Made in China’, mobile phones on 22% (down
4%), footwear on 17% (down 6%) and sporting goods on 14% (down 3%). There were a number of products for which sentiment barely changed
from a year ago but which only a minority of Australians indicated they’d be
more likely to buy if they knew the product was ‘Made in China’. These
products included motor vehicles on 10% (unchanged from 2019), food on 7%
(unchanged), cosmetics and skin care products both on 7% (up 1%) and wine on
5% (up 1%). These results are from the Roy Morgan Single Source survey, derived
from comprehensive in-depth interviews with over 1,000 Australians each week
and around 50,000 Australians per year. % of people more likely to buy each product
if it was made in China: 2019 vs. 2020
China is easily Australia’s largest two-way
trading partner but recent tensions between the two countries have seen
attitudes towards Chinese-made goods plummet during 2020 as the world
grappled with the COVID-19 pandemic says Roy Morgan CEO Michele Levine: “Australians are a patriotic lot –
particularly during times of crisis – with 93% of Australians in 2020 saying they would
be more likely to buy a product if they knew it was ‘Made in Australia’ – an increase of 6% points on 2019. “However the tendency to turn to home-grown
products during the last year has come at the expense of products from
Australia’s largest trading partner China – now only 21% of Australians say
they would be more likely to buy a product they knew was ‘Made in China’ –
down 9% points on a year earlier. “Looking at discrete product categories
shows the most popular consumer goods from China have seen the biggest
declines in preference among Australian consumers. Now only 24% of
Australians would be more likely to buy clothes they knew were ‘Made in
China’ – down 7% points from 2019. “There have been similarly large drops in
preference amongst Australians for electrical goods – down 5% points to 23%,
mobile phones – down 4% points to 22%, footwear – down 6% points to 17% and
sporting goods – down 3% points to only 14%. “The two-way trading relationship between
the two countries is heavily weighted in Australia’s favour. Australian
exports to China (including Hong Kong) amounted to $177.3 billion in
2020, while Australia imported $87 billion in return: a trade surplus of over
$90 billion – which is larger than the two-way trade between Australia and
any other country by itself. “The tensions between the two countries are
tied to Australian requests for an investigation into the origins of COVID-19
made early in the pandemic. In response to this request the Chinese
Government put tariffs and import restrictions on a range of Australian goods
including wine, barley, lobsters, coal, timber, red meat and cotton. “However, the huge declines amongst
Australians for a range of Chinese-made goods suggest, even if the
differences between the two Governments can be resolved, there will remain
something of an image problem for Chinese products in Australia over the next
few years.” (Roy Morgan) May 18 2021 MULTICOUNTRY
STUDIES
689-691-43-58/Poll A Closer Look At The European Criteria For Grocery Purchases Shows
That The Main Criteria Are Product Quality (88%) And Good Prices (82%)
We interviewed more than 10,000 people from 9 different European
countries about their views on food, grocery shopping and sustainable
development. We also asked Europeans how increased hygiene considerations during
COVID-19 have affected their shopping habits. What is the priority for Europeans when
buying groceries? A closer look at the European criteria for grocery purchases shows
that the main criteria are product quality (88%) and good prices (82%). Sustainable development is less important (53%), but there are
differences between countries. Italians (72%), Turks (72%) and Spaniards
(70%) consider the sustainability of products more important, while
Norwegians (29%), Danes (39%) and Finns (41%) consider it less
important. For 57% of Europeans, social and environmental responsibility is an
important criterion. 63% mention locally produced products - this is
particularly the case for Italians (80%) and Spaniards (79%). How are Europeans' attitudes towards
sustainable development reflected in their daily lives? In the European reference framework, people in Turkey (77%), Italy
(77%) and France (67%) are most sensitive to the impact of sustainable
development and environmental issues on their food and shopping
behavior. In the Nordic countries, this is much less the case - 63% of
Norwegians and 50% of Danes report that taking sustainable development into
account has no effect on their food and shopping behavior. The effects of the corona pandemic on the
purchase of groceries During the pandemic, many consumers have changed their shopping
behavior. A quarter of Europeans report buying larger quantities of food
(26%) and buying non-food products (eg clothing, cosmetics and care products)
more often online (25%) after the outbreak of the corona epidemic. In the 9 countries of the survey, 32% of respondents who tend to
spend long periods of time shopping for groceries in physical stores also
reported spending less time there now. Surprisingly, there are more consumers among respondents who report
ordering fewer ready meals after a pandemic than those who report ordering
meals more often: 23% vs. 12%.
Differences between countries A closer look at the individual countries in the study reveals large
differences between them. Turks are at the top of the list across the board when looking at
doing the following more often: buying groceries online (39%), ordering ready
meals (22%), buying larger batches (38%), buying larger quantities of food
(because the restaurant eats less) (47%) and buying non-food products online
(49%). Compared to the European average, French (24%) and Spanish (20%) are
more likely to report buying groceries less often online due to the
corona. The same applies to ready meals, which 32% and 31%
(respectively) report buying less, and to the purchase of non-food products
online (25% and 27%).
(YouGov Finland) May 4, 2021 Source: https://yougov.fi/news/2021/05/04/eurooppalaiset-kuluttajat-ovat-muuttaneet-ostotott/ 689-691-43-59/Poll Ideological Divisions Over Cultural Issues Are Far Wider In The U.S.
Than In The UK, France And Germany
When it comes to key cultural issues, Americans are significantly
more divided along ideological lines than people in the United Kingdom,
France and Germany, according to a
new Pew Research Center analysis of surveys conducted in the four
countries in fall 2020. Across 11 questions on cultural subjects ranging from nationalism to
political correctness, the gap between the ideological left and right in the
United States – or liberals and conservatives, in the common U.S. parlance –
is significantly wider than the ideological gaps found in the European
countries surveyed. In some cases, this is because America’s conservatives
are outliers. In other cases, it’s because America’s liberals are outliers.
In still other cases, both the right and left in the U.S. hold more extreme
positions than their European counterparts, resulting in ideological gaps
that are more than twice the size of those seen in the UK, Germany or France. Below, we explore these trends in more detail. ‘What it takes to be one of us’ and
immigration
On issues of “belonging” or what it takes to truly be part of a
country (e.g., to be “American” or “French”), those on the ideological right
in all four countries are more likely than those on the left to say being
Christian, speaking the national language, sharing the country’s customs and
traditions and being born in the country are “very important.” Across all four items, though, the ideological gap in the U.S. is
larger than in other countries. This is often – but not always – because the
views of America’s conservatives stand out. (The U.S. survey was fielded in
November and December 2020, after the presidential election but before the
inauguration of Joe Biden.) For example, around a third of U.S. adults who place themselves on
the ideological right (32%) say being Christian is very important for being
American, but no more than 17% on the right in any other country say the
same. When it comes to the importance of being born in the country, around a third
on the U.S. right (32%) think it is very important for being American,
compared with no more than 24% of those on the right in any other country.
Similarly, those on America’s ideological right (57%) are more likely than
their counterparts in France (47%), Germany (39%) and the UK (29%) to say
that sharing national customs and traditions is very important to national
identity. The pattern is somewhat different when it comes to speaking the
country’s language. While the overall ideological gap is again wider in the
U.S. than in the other three countries, America’s liberals are notably less likely than their counterparts
in other nations to see speaking English as critical to being American. Only
around a quarter of the left in the U.S. (24%) say it’s very important to
speak English to be truly American, whereas at least four-in-ten of those on
the left in every other country say the same about speaking their national
languages. The ideological left in the U.S. also stands out in its views of
whether immigrants want to adopt the country’s customs and way of life.
Around eight-in-ten Americans on the left (79%) say this, compared with
around two-thirds or fewer in the other countries. Pride and tradition
In all four countries, those on the ideological right are
consistently more likely than those on the left to say their nation will be
better off if it sticks to its traditions and ways of life, rather than if it
is open to changes. Yet the gap between right and left in the U.S. is more
than twice as wide as the gap in other countries. Around two-thirds of those
on America’s ideological right (65%) think the U.S. should stick to its
traditions, compared with just 6% on the left.
People in the U.S. and the UK are similarly divided along ideological
lines when it comes to having pride in the country. A majority of those on
the right in both countries say they are proud of their country most of the
time, while only around one-in-six on the left in each country say the same.
In fact, people on the left in both the U.S. and UK are as likely to describe
themselves as ashamed of
their country most of the time as they are to say they are proud of their
country most of the time. (The remainder describe themselves as being both
ashamed and proud.) In France and Germany, on the other hand, pride in the
country is not an ideological issue; those on the left and right are about
equally likely to describe themselves as proud most of the time. Political correctness and discrimination When it comes to “PC culture,” those on the ideological right tend to
be more likely than those on the left to say people today are too easily
offended. Those on the left, in turn, are often more likely to say people
should be more careful what they say.
On this question, too, the ideological gap in the U.S. is more than
twice as large as that found in any of the European countries surveyed, with
both the American right and left standing out from their counterparts
overseas. On the American right, around three-quarters (76%) say people are too
easily offended – significantly higher than the share of those on the right
in any of the European countries. Meanwhile, Americans on the left (32%) are
somewhat less likely
than those on the left in Germany (38%), the UK (41%) and France (46%) to
describe people as too easily offended these days.
Americans are also extraordinarily divided when it to comes to
perceptions about which is the bigger problem: people seeing discrimination
against ethnic and racial minorities where it does not exist, or people not seeing such discrimination
where it really does exist. Around six-in-ten on the U.S. right (62%) say the
greater problem is people seeing discrimination where it does not exist,
while only 9% on the left agree. Elsewhere, the ideological gap on this
question is much narrower. When it comes to religious discrimination, in particular, Americans
are far more divided than people in the other countries in their perceptions
of whether Christians and Muslims each face bias. The ideological right in
the U.S. is substantially more likely than the right in other countries to
say Christians face a lot of discrimination – and less likely to say the same about
Muslims. Meanwhile, those on the ideological left in the U.S. are more likely than their counterparts
on the European left to say Muslims face a lot of discrimination. There are no significant ideological differences in any of the four
countries on the issue of whether Jews face a lot of discrimination or not. (PEW) MAY 5, 2021 689-691-43-60/Poll Nearly Half (46%) Of Consumers In 17 Global Markets Use Zoom To
Communicate Regularly
Since the advent of COVID-19, Zoom has become more than just a
workmate, becoming in some markets even a verb (“Let's Zoom!”) Or a real
synonym for “video call”. Now, as parts of the world slowly emerge from
restrictions and more people return to the office, YouGov data shows just how
popular Zoom is and how it compares to other competing services. Nearly half (46%) of consumers in 17 global markets use Zoom to
communicate regularly, while about three in ten (29%) use Microsoft Teams and
a quarter (25%) use Skype.
Microsoft Teams, well positioned as a Skype heir and secure platform
for video calling, maintains a strong user base: our data shows that it is
more prevalent than Zoom in some European countries, particularly the UK
(where 49% of workers do uses regularly), Sweden (44%), and Denmark (51%) and
Poland (29%).
Skype, also owned by Microsoft, still holds high numbers, and is the
preferred video calling service in Poland (39%) and Germany
(30%). However, Microsoft has given Skype for Business Online users a
strict deadline to migrate to Teams, before the service is discontinued in
July 2021. As for other services, YouGov highlights that 14% of consumers
globally regularly use Google chat, while 7% use Cisco Webex or GoToMeeting
and 5% Slack. There is no doubt that the pandemic will change jobs in the long
run. For some, this may mean working permanently from home or a hybrid
of remote and office work, suggesting that video conferencing will remain a
daily necessity even after restrictions are lifted. (YouGov Italy) May 10, 2021 Source: https://it.yougov.com/news/2021/05/10/global-data-la-popolarita-di-zoom-rispetto-ad-altr/ 689-691-43-61/Poll About Three Out Of Four Adults Globally Agree That In Order To Enter
Their Country, Travelers Are Required To Have Covid-19 Vaccine Passports
On average, about three out of four adults agree that in order to
enter their country, travelers are required to have COVID-19 vaccine
passports. This will be effective in making travel and major events
safe. About two out of three say that vaccine passes should be a
requirement for access to large public venues. Many expect that this
requirement will be widely used in their country. On the other hand,
only about half agree that they should be required for shops, restaurants and
offices.
Globally, we find that
Overall, older people tend to be more comfortable letting their
doctor access their health and vaccination information than younger
people. In contrast, younger people tend to be more comfortable giving
their employer, their government, and private companies access to their
personal health information. How long must a vaccine certificate or
passport be required for activities and travel?
(Ipsos Denmark) 11 May 2021 Source: https://www.ipsos.com/da-dk/den-globale-befolkning-stotter-op-om-coronapas-til-internationale-rejser 689-691-43-62/Poll The Majority Of Nordic Countries State That They Eat Healthier In The
Form Of More Vegetables (31%) And Less Alcohol (26%) And Sugar (24%)
YouGov has published the annual Food
& Health report , which for 15 years has measured Nordic consumers'
attitudes towards food, climate and health. During the last year of the
corona crisis, health has been a global main focus, and the report shows that
the pandemic has affected the health of Nordic consumers in several areas. Across the Nordic countries, the majority state that they eat
healthier, eg in the form of more vegetables (31%) and less alcohol (26%) and
sugar (24%), Many have also cut back on meat - primarily beef (17%), pork (17%)
and processed meat (16%). We talked more during the lockdown
During the corona pandemic, several people in the Nordic countries
have tended to skip meals and resort to snacks more often. In all four countries, the intake of snacks has increased - but
mostly in Denmark and Norway, where a quarter (24% and 23% respectively)
state that they have eaten more snacks during lockdown. It is especially
women, the younger part of the population and households with children who
have increased their snack intake. Corona-kiloene Between one third and one quarter (from 32% in Denmark to 24% in
Finland) of the population in the Nordic countries state that they have
gained weight over the past year - most likely so-called corona kilos as a
consequence of the more sedentary everyday during lockdown. This figure
is significant compared to the last four years, when just about a fifth
(20-22%) indicated that they had taken on. Locally produced food hits even more than
before
Locally produced goods have been a global trend over the last few
years - a trend that has accelerated during the pandemic due to border
closures, closed foreign factories and a general willingness to support local
businesses in a time of pressure. In all four countries, consumption of locally produced food has
increased between one-fifth and one-quarter over the past year (from 17% in
Denmark to 24% in Finland). The climate aspect also seems to be a driving force in the Nordic
region, where a larger proportion consider buying more locally produced as
more efficient than buying more organic or sustainable products when it comes
to reducing harmful effects on the climate and the environment. (YouGov Denmark) May 16, 2021 Source: https://yougov.dk/news/2021/05/16/hvordan-har-et-ar-med-corona-pavirket-vores-madvan/ 689-691-43-63/Poll In UAE And Saudi, The Intent To Travel Domestically Or Within The
MENA Region Increased Slightly
As vaccinations rolled out and travel reopened in certain parts of
the world, people could finally fulfil their wanderlust and start making
further travel plans in the coming months. Since October last year, YouGov’s Global Travel Profiles (GTP), an
international daily travel survey, has been tracking consumer sentiment and
attitudes towards travel across 25 countries. A new recontact study to Global
Travel Profiles was undertaken in April to compare travel trends of the
Middle East population in 2020 vs 2021 and to see the key shifts in travel
preferences. Data from the study shows six in ten surveyed respondents (59%) in
the UAE and Saudi Arabia said they took a leisure trip (domestic or
international) in 2020. In 2021, an appetite for travel has improved, and
more than seven in ten (72%) residents said they have already or intend to
travel this year. This is one of the highest rates in the world. In both the UAE and Saudi, the intent to travel domestically or within
the MENA region increased slightly, too, compared to last year (53% in 2020
and 57% in 2021). However, intent to travel abroad has more than doubled
since last year (from 11% to 26%). Roughly a fifth of consumers in both of these countries are unlikely
to travel in 2021 (19%), a number which nearly halved since 2020 when it
stood at 37%, indicating a recovering appetite for travel among residents. Interestingly, we found significant differences among these two
neighbouring markets. Domestic travel is likely to be more popular among the
Saudi residents than amongst the UAE public this year (61% vs 54%), with the
latter keener on taking international trips (33% vs 19%). Motivation to travel in 2021 Among those who have or expect to travel in 2021, visiting family and
friends emerged as the biggest motivation to travel this year (as said by
50%). This motive is much stronger among those planning to travel abroad this
year, especially residents from the UAE, as compared to those planning to
take domestic trips (59% vs 48%). With a considerable proportion of expats
residing in these countries, the desire to reconnect with friends and family
is one of the key drivers to travel abroad this year. After family, many residents in both countries want to travel to
enjoy the scenic beauty of their selected destination (44%) or go back to the
places they love or like (34%). Some want to travel to enjoy food & drinks popular at a
destination (28%), experience the culture of a place (28%), learn a new skill
in a new destination (25%) or know about the history of a place (21%). When asked about their budget, two in five respondents in both
countries (42%) said they are willing to spend more than the amount they
spent on leisure trips in 2019, while a third (33%) plan to spend the same
amount of money. Although a fifth (19%) intend to spend less than earlier on leisure
travel in 2021, this number is notably higher among international travellers
(planning to travel abroad in 2021) as compared to domestic travellers (25%
vs 17%). Most popular destinations Looking at their preferences using YouGov destination Index, which
tracks public perceptions of destinations across 16 metrics, we see Dubai as
the first choice for a holiday among UAE residents. The Maldives is the second
option for people planning a vacation. Abu Dhabi is also a popular selection.
With travel bouncing back globally and many countries easing travel
restrictions, we see more international destinations making it to the
wishlist of the UAE travellers. Along with Maldives, Switzerland, Singapore,
Canada, the USA and Japan are some of the other destinations currently being
considered by UAE residents for their next holiday. On the other hand, Saudi residents choose to stay close to home, and
the top four destinations being considered are domestic locations- either
within the country or the region. Saudi Arabia is the top choice of KSA
residents. Outside the country, UAE is the most popular option, particularly
Dubai and Abu Dhabi. Many are also considering Egypt for a vacation. Some
international destinations are also on travellers’ minds; however currently
the focus is more on domestic travel. (YouGov MENA) Source: https://mena.yougov.com/en/news/2021/05/17/appetite-travel-recovers-middle-east-majority-resi/ 689-691-43-64/Poll 45% Of The Global Population Is Concerned About Sharing Their
Personal Information Digitally
Overall, 45% of the global
population is concerned about sharing their personal information digitally, a
percentage that decreases only by two points compared to last year. Among
women, the percentage decreases from 49% to 47%, and among men from 46% to
43%.
Necessity of sharing personal information On a global level, the perception of how necessary it is to share
personal information nowadays is consistent compared to last year (22%),
while 30% of respondents do not
consider it necessary, + 3% points compared to 2019. Fine with the privacy practices of most
data collectors asking for my personal information Almost a third of the surveyed population
disagrees with the privacy practices of most data collectors,
and people aged 55 and over are those who express their disagreement the
most. What happens with personal information
after it is shared with a data collector? Even though people seem to have strong opinions on whether it is
necessary to share personal information online, it is different to truly
understand what happens after it is shared with data collectors. When asked
about it, 27% of the population admit knowing what happens with their data,
but another 27% don’t know how it will
be used or where. People
who are less aware of how data collectors use their data are 3% more than
last year.
(WIN) 689-691-43-65/Poll Globally, About Three In Four Adults (78%) Are In Favor
Of Requiring A Vaccination Passport For Travelers
Globally, about three in four
adults (78%) are in favor of requiring a vaccination passport for travelers wishing to enter their
country. They are slightly less numerous in France: seven out of ten are
in favor (including 40% 'very
favorable') , a similar proportion with the United States and
the Germans. A majority is in any case convinced of its effectiveness in
making travel and major events more secure in terms of health (73% worldwide - France is a little below 65%) . In what cases could the passport be required and more
accepted? In priority to access the
main public places such as concert halls or stadiums for two
out of three people in the world (67%) . In
contrast, only half of those surveyed (55%) think
it should be mandatory in stores, restaurants and offices. In France, opinions are more divided: only 53% are in favor of requiring the
vaccination passport to access large public places and 47% are in favor of introducing the
compulsory vaccination passport to access shops, offices, restaurants, even
if this track has was ruled out by the government at the end of April. 43% of French people nevertheless
share the idea that only people who have been vaccinated should be allowed to
participate in certain activities: cultural / sporting events, taking the
plane and public transport ... And 57% are
against it (world average: 46% ). The French most worried about the issue of
medical data "The implementation of this potential
vaccine passport raises a real problem of access to medical data, a
particularly difficult point in France since only 32% of French people are
comfortable with the idea that the government has access to their data.
medical, much less than the world average (50%). The worst for
them? May their employers have access to it! » Emphasizes Amandine Lama , Research Director of
the Public Affairs department at Ipsos in France. The French are indeed the most
opposed in the world to their employer having access to their
medical data ( only 27% say
they are in favor, against 56% in
the world average). Their tension is similar with regard to private
companies, in the transport sector, the hotel industry or new technologies
... Only 19% of French
people are comfortable with the idea that their medical data can be shared with
these companies ( 21 points below the
world average). Asked about the durability of the vaccine passport, the majority of
French people questioned (37%) think
that it should be used during the fall in contamination, estimated at a few
months. 26% believe
that this tool should be in place until the end of the year, and 24% believe that it should be
necessary for a few more years. The French in favor of the definitive implementation of the
vaccination passport are much rarer (13%) ! (Ipsos France) May 17, 2021 689-691-43-66/Poll Ipsos’s Global Consumer Confidence Index Shows A Month-To-Month Gain
Of Nine-Tenths Of A Point, Sitting Just 2.3 Points Below Its Pre-Pandemic
Level Of January 2020
Washington, DC, May 19, 2021 —Ipsos’s
Global Consumer Confidence Index shows a month-to-month gain of nine-tenths
of a point, sitting just 2.3 points below its pre-pandemic level of January
2020. Of note, this month’s Expectations Index, indicative of consumers’
outlook on their local economy, financial situation, and employment, is back
to its pre-pandemic level and slightly above its 11-year historical
average. National Index Trends The Global Consumer Confidence Index reads at 46.4, up from 45.5 in
April, marking six straight months of gains.
Expectations, Jobs, and Investment Index
Trends For the third month in a row, the Expectations, Jobs, and Investment
Indices all display month-on-month gains. Six countries see significant gains
(at least 1.5 points) across all three indices: Great Britain, Israel,
Poland, Saudi Arabia, Spain, and the U.S. Meanwhile, India and Turkey record
significant drops on all three.
(Ipsos Egypt) 19 May 2021 Source: https://www.ipsos.com/en-eg/global-consumer-confidence-eighth-month-row 689-691-43-67/Poll About Six-In-Ten American Adults (62%), Including Majorities In
Nearly Every Demographic Group, Support Increasing The Minimum Wage To $15 An
Hour
Most Americans favor raising the federal minimum wage, which has been
$7.25 an hour since 2009. About six-in-ten adults (62%), including majorities
in nearly every demographic group, support increasing the minimum wage to $15
an hour. Even among the 38% of Americans who oppose a $15 minimum, most say
they’d support a smaller increase, according to an
April Pew Research Center survey. But popular support doesn’t necessarily translate into government
action. Proposals to raise the federal minimum wage have stalled
out repeatedly in Congress over
the past decade. While the Center surveyed the general public rather than
lawmakers, the findings suggest that partisan divisions among legislators
reflect those of Americans as a whole. More than seven-in-ten Republicans and
GOP-leaning independents (72%) oppose raising the wage to $15 an hour,
including 45% who strongly oppose it, while 87% of Democrats and Democratic
leaners say they favor such an increase (including 61% who strongly favor
it). Such sharp partisan divides matter because the federal minimum wage
is set out in statute (the Fair
Labor Standards Act of 1938, to be specific), meaning it can only be
changed if Congress passes a bill to do so and the president signs it (or
Congress overrides his veto). Putting minimum wage policy directly in the
hands of lawmakers is just one of several ways in which the U.S. approach
stands apart from most other countries. How we did this We examined 197 countries and self-governing territories to see how
(and whether) they set and adjust minimum wages, and to get a sense of just
how much of an outlier the United States is in this area. We identified 173
with some sort of generally applicable minimum-wage system, defined as one
that covers all or most of a country’s adult private-sector workers. Here’s what we found: The U.S. is one of a handful of countries
where the legislature has primary responsibility for setting minimum wages. Only 17 countries (about 10% of those with minimum-wage systems) set
their rates by statute, which (as U.S. experience demonstrates) can make them
more difficult to update.
In at least 115 countries, the central government (or an official
such as a labor minister) sets minimum wages by regulation, order or decree,
typically pursuant to some authorizing law. In about three-quarters of those
countries, government action is supposed to come only after input from
workers’ and employers’ organizations – ranging from unspecified
“consultations” to formal recommendations from structured minimum wage boards
or commissions. (The International Labour Organization’s 1970
Minimum Wage Fixing Convention, which 54 nations have ratified, calls for
such dialogue, which may help explain its prevalence.) Minimum wage commissions typically include representatives of workers
and employers, often joined by government officials (in which case they’re
called “tripartite”), and sometimes independent economic experts or representatives
of civil society (“tripartite-plus”). In at least 15 countries, such bodies
are themselves authorized to set minimum wages, if they can come to consensus
on them. Fifteen countries – 10 European and five African – rely on collective
bargaining between unions and employers’ organizations to set wage levels,
including minimum wages. Such negotiations typically take place at the sector
or industry level, and the resulting agreements generally have the force of
law. Unlike many countries, the U.S. has no
legal requirement to periodically review and, if necessary, adjust its
minimum wage. At least 80 countries where minimum wages are set either by or
pursuant to national law have an explicit requirement to revisit them every
so often – in most cases annually or once every two years. Fifty countries have no explicit requirement for periodic review, and
in 22 cases we couldn’t find any definite information either way. Even so,
indications are that most countries revisit their minimum wages more
frequently than the U.S. does: Between 2010 and 2019, according to a 2020
International Labour Organization report, 134 countries adjusted their
minimum wages no less frequently than every three to five years. In the U.S. – unlike in most countries –
states, counties and cities can set their own minimum wage rates. In the great majority of countries – 145, by our reckoning – minimum
wages are the exclusive domain of the national government, a national minimum
wage board or some other central authority. The U.S. is one of only seven
countries where states, provinces, cities or other subnational governments
have concurrent authority to set their own minimum wages (so long as they’re
not below the national minimum). In six countries, minimum wages are the
exclusive responsibility of subnational entities. Generally speaking, the countries that do give subnational units
minimum-wage authority are large and complex (China, India, Indonesia), have
long traditions of decentralized power (Canada, Australia), and/or have
strong regional identities (Iraq, Bosnia and Herzegovina). Nearly half (83, or 48%) of all countries with minimum wage systems
have a single, broadly applicable national minimum. We don’t count the U.S.
in this group because the $7.25 federal minimum wage is actually used in
just 21
of the 50 states, which together account for about 40% of U.S. wage and
salary workers. The other 29 states, as well as the District of Columbia and
several cities and counties, have higher minimums. (The highest local minimum
wage, $16.84 an hour, is in Emeryville, Calif.) India was supposed to get its first
nationwide floor wage in 2020, but the government deferred it
indefinitely due to the ongoing COVID-19
pandemic.
Ninety other countries have at least two and up to several dozen
minimum wages, which can vary by region, industry, occupation, experience or
a combination of those factors. For instance, Panama, a country of about 4.2
million people, has minimum wage scales in 20 different sectors.
Within each sector, minimums vary by region (there are two) and by type of
business within each region. (Public-sector workers, interestingly, are exempt
from minimum wage rules, and generally earn less than their
private-sector counterparts.) One thing rapidly became clear from our review: No two countries have
exactly the same minimum wage systems, and many have combinations of features
that defy easy categorization. A few examples:
On the other hand, 21 countries have no generally applicable minimum
wage at all, though some have set minimums for specific occupations or
industries. In five countries that have national minimum wage systems, we
could find no reliable information on how they function. Finally, there were
three countries (North Korea, Syria and Vatican City) for which we could find
no reliable, current information on their minimum wage systems, or indeed if
any even exist. (PEW) MAY 20, 2021 |
|||||||||||||||||||||||||||||||||||||||||||||||||||||||||||||||||||||||||||||||||||||||||||||||||||||||||||||||||||||||||||||||||||||||||||||||||||||||||||||||||||||||||||||||||||||||||||||||||||||||||||||||||||||||||||||||||||||||||||||||||||||||||||||||||||||||||||||||||||||||||||||||||||||||||||||||||||||||||||||||||||||||||||||||||||||||||||||||||||||||||||||||||||||||||||||||||||||||||||||||||||||||||||||||||||||||||||||||||||||||||||||||||||||||||||||||||||||||||||||||||||||||||||||||||||||||||||||||||||||||||||||||||||||||||||||||||||||||||||||||||||||||||||||||||||||||||||||||||||||||||||||||||||||||||||||||||||||||||||||||||||||||||||||||||||||||||||||||||||||||||||||||||||||||||||||||||||||||||||||||||||||||||||||||||||||||||||||||||||||