|
Gilani’s
Gallopedia© Gallopedia From Gilani Research
Foundation October 2020, Issue # 659* |
|
|
Gilani’s
Gallopedia is a weekly Digest of Opinions in a globalized world |
|
|
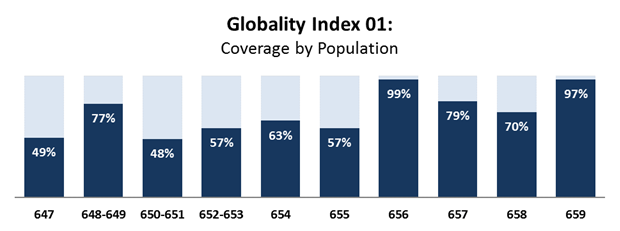
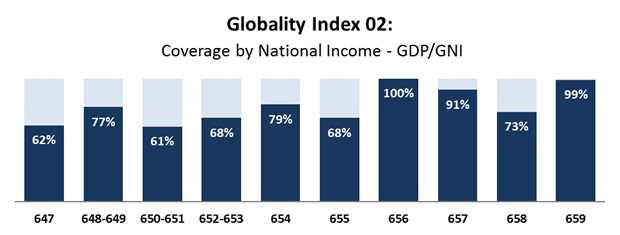
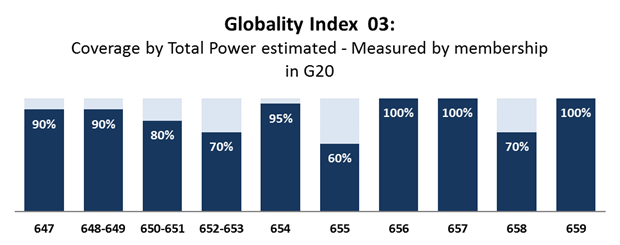
This issue scores 97
out of 100 on Gilani-Gallopedia's Globality Index, showing coverage of world
population, and 99 out of 100 on the world income (prosperity) Index. Click for Details |
|
|
Contact
Details: Asra Malik Senior
Research Analyst, Gallup Pakistan Email: asra@gallup.com.pk This WEEKLY
REPORT consists of 25 national
& multi country surveys 8 polling
organizations have been represented. India (Media, Entertainment),
KSA(Consumer
Confidence) – 03 national polls South Africa (New
Media) – 01 Spain(Social Problems),
France(Social
Problems), Sweden(Consumer Confidence), Norway(Consumer
Confidence), UK(Social Problems, Regional Organisations, Health, Health, Social
Problems), USA(Health, Elections, Employment Issues, Health, Health, Elections, Health, Media), Australia(Health) – 18 national
polls |
Ipsos – 27 Countries (Social Problems) YouGov – 08 Countries
(Elections) Gallup USA
– 142
Countries (Poverty) 54% of Indians tired
of watching TV news How
focus groups informed our study about nationalism and international
engagement in the U.S. and UK |
|
659-01 54% of Indians tired of watching TV news (Click for Details)
October 14, 2020 4.6 Society
» Media/ New Media |
|
|
659-02 During
Covid, people still thinking about
vacation. India’s preferred holiday destinations revealed (Click for Details) (India) New data released today by
YouGov reveals the destinations which holiday-makers in India are next
planning to visit. Despite the chilling effect that travel restrictions are
having on the travel industry, people are still spending time thinking about
their next trip, as the ranking reveals. The ranking shows where people are
most likely to visit when they are next in the market to plan a holiday –
even if that could be some way off yet. (YouGov) October 13, 2020 4.16 Society » Entertainment |
|
|
|
|
|
659-03 Riyad bank creates greatest Ad Awareness in Saudi Arabia in September (Click for
Details) (KSA) During September, Riyad
Bank achieved the highest uplift in Ad Awareness of any brand in Saudi
Arabia. Riyad Bank, one of the largest financial institutions in Saudi
Arabia, enjoyed the greatest improvement in Ad Awareness of any brand during
September. The uplift coincides with the brands Blood Donation drive as well
as their 75th National day campaign both of which appear to have resonated
with the public. (YouGov) October 07, 2020 3.2 Economy » Consumer Confidence/Protection |
|
|
|
|
|
659-04 Few Basotho support government regulation of access to Internet and
social media, Afrobarometer survey shows (Click for
Details)
October 09, 2020 4.6 Society » Media/ New Media |
|
|
|
|
|
659-05 Only 38% of Spaniards claim to be happy (Click for Details) (Spain) Happiness in Spain
has decreased by 8 points compared to 2019. We are the country with the
highest percentage of the population that claims not to be happy at all, with
13%. Physical and mental health ranks as the greatest source of happiness for
6 out of 10 Spaniards. Happiness is for most people the ultimate goal to
aspire to, the ultimate goal of all decisions made during life. However, to
quote the philosopher Nietzsche, ' the destiny of men is made of happy
moments, all life has them, but not of happy times.' (Ipsos) October 08, 2020 4.13 Society » Social Problems |
|
|
659-06 Despite the crisis and uncertainty, the French are keeping their spirits (Click for Details) (France) While 2020 will
remain in everyone's minds a complicated year, the new wave of the Ipsos
Global Advisor study “The Global Happiness Index” gives another perspective
to these recent months so special. The study, conducted in twenty-seven
countries around the world, asked citizens whether they felt happy and sought
to find out the reasons for their happiness. If in many countries, the
happiness index has experienced a significant decline, the French are
meanwhile 78% to declare themselves happy, a figure down only 2 points
compared to last year, despite health difficulties. and economic experiences
in the country. (Ipsos) October 08, 2020 4.13 Society » Social Problems |
|
|
659-07 What makes Swedes boycott a brand? (Click for Details)
October 14, 2020 3.2 Economy » Consumer Confidence/Protection |
|
|
659-08 What makes Norwegians boycott a brand? (Click for Details) (Norway) When a
brand is the subject of a scandal or negative publicity, it usually goes
beyond consumer confidence, at least for a while. YouGov has investigated
what causes consumers in 10 European countries to boycott a brand permanently
or temporarily. When looking at Europe, it turns out that it is especially
Spaniards (50%) and Danes (45%) who are inclined to turn their backs on a
brand as a result of a scandal or negative publicity. At the other end of the
scale, we find countries such as Austria (30%), Sweden (29%) and Norway
(28%), where less than a third have boycotted a brand after a scandal or
negative publicity. (YouGov) October
14, 2020 3.2 Economy » Consumer Confidence/Protection |
|
|
659-09 What do Britons make of alternative asylum policies? (Click for Details) (UK) Brits believe the current system works badly but they aren’t convinced
by different options either. Home Secretary Priti Patel has made headlines in
recent weeks with alternatives for how asylum seekers arriving in the UK
might be handled, including suggestions of overseas processing centres and
using ferries to house those making claims for asylum in the UK. But what do
Brits make of both the current system and the alternatives recently
suggested? (YouGov) October
06, 2020 4.13 Society »
Social Problems |
|
|
659-10 Brexit: Brits least confident in Europe of UK negotiating strength (Click for Details)
October 08,
2020 2.8 Foreign Affairs & Security »
International / Regional Organizations |
|
|
659-11 Which Brits are drinking bottled water every day? (Click for Details) (UK) We used YouGov Profiles to compare the
Brits who drink bottled water every day with those that never do. Some people
swear by it while others think you should just use the tap – but how do
bottled water drinkers and bottled water abstainers differ? Our data shows
that around a third (35%) of British adults drink bottled water once a month
or less. However, a fifth (22%) never do it at all while a similar proportion
are at the other end of the scale and drink it every day (18%). But who are
they? (YouGov) October
08, 2020 4.11 Society » Health |
|
|
659-12 Majority of Britons support local lockdowns, even if it impacts them directly (Click for Details) (UK) New Ipsos MORI poll shows seven in ten
support local lockdowns in areas where coronavirus is rising. A new Ipsos
MORI poll finds that seven in ten (73%) Britons support local lockdowns in
areas where coronavirus is rising and 68% of people support implementing local
lockdowns where they live if needed.
Support remains strong for the “rule of six” and six in ten people
would also support banning all travel in and out of the country. (Ipsos) October
11, 2020 4.11 Society » Health |
|
|
659-13 Demand for business leaders to speak out on social and political issues
rises, amid growing alarm about climate change and coronavirus (Click for Details)
October
08, 2020 4.13 Society » Social Problems |
|
|
|
|
|
659-14 Americans' Readiness to Get COVID-19
Vaccine Falls to 50% (Click for
Details) (USA) Americans' willingness to be vaccinated
against the coronavirus has dropped 11 percentage points, falling to 50% in
late September. This sharp decline comes after the percentage dwindled from
66% in July to 61% in August. Americans' willingness to be vaccinated to prevent
COVID-19 if it was available right now at no cost since July. Currently, 50%
say they are willing but prior to now, readings have been between 61% and 66%.
(Gallup USA) October
12, 2020 4.11 Society » Health |
|
|
659-15 Americans View Biden as Likable, Honest; Trump, as Strong (Click for Details) (USA) Among eight character dimensions,
Americans' perceptions of President Donald Trump and Joe Biden differ most on
likability: 66% of U.S. adults believe Biden is likable, while 36% say Trump
is. Americans are also more likely to perceive Biden than Trump as being
honest and trustworthy and as caring about the needs of people like them.
Trump surpasses Biden only when it comes to being a strong and decisive
leader. (Gallup USA) October
12, 2020 1.1 Domestic Politics » Elections |
|
|
659-16 COVID-19 and Remote Work: An
Update (Click for Details)
October
12, 2020 3.3 Economy » Employment Issues |
|
|
659-17 Mask Use Linked to More Accurate
Perceptions of COVID-19 (Click for
Details) (USA) Despite ongoing debate over the
politicization of face mask use, the vast majority of Americans -- 80% -- now
say they would be highly likely to wear a mask tomorrow if they were out of
their house and in an indoor space. Democrats are somewhat more likely than
Republicans, 87% to 74%, to say they would be highly likely to wear a mask
outside the home. Eight in 10 Americans would be "highly likely" to
wear masks tomorrow if out of the house and in an indoor space. 74% of
Republicans, as well as 87% of Democrats and 78% of Independents would be
"highly likely" to wear masks tomorrow if out of the house and in
an indoor space. (Gallup
USA) October
07, 2020 4.11 Society » Health |
|
|
659-18
45% of Parents Very Worried Kids Will Get COVID-19 at School (Click for
Details) (USA) Almost half (45%) of U.S.
parents report they are "very worried" that their children will
contract COVID-19 at school or in childcare facilities. Twenty-seven percent
report they are "somewhat worried," 13% are "not too worried"
and 9% are "not at all worried." Parents whose child or children
are enrolled in schooling (93% of all parents with children from birth to 18
years of age) were asked what type of schooling they currently want their
child's school to offer. Most parents who have one or more children enrolled
in school would prefer that their child's school have some level of in-person
learning, either full time or part time, with some distance learning. (Gallup USA) October
07, 2020 4.11
Society » Health |
|
|
659-19
Majority Trust Biden to Lead
Healthcare System Amid COVID-19 (Click for
Details)
October
07, 2020 1.1
Domestic Politics » Elections |
|
|
659-20
Republicans who rely most on Trump for COVID-19 news see the outbreak
differently from those who don’t (Click for
Details) (USA) Attitudes about the
coronavirus outbreak differ widely by party in the United States. But among
Republicans, opinions also differ considerably by source of news, according
to a recent Pew Research Center survey. Republicans and GOP-leaning
independents who rely most on President Donald Trump and his coronavirus task
force for news about COVID-19 – one of 10 news sources the Center asked about
– stand out in several ways in their attitudes about the outbreak. (PEW) October
12, 2020 4.11
Society » Health |
|
|
659-21
Partisans in the U.S. increasingly divided on whether offensive content online
is taken seriously enough (Click for Details) (USA) Americans are divided on
whether offensive content online is taken seriously enough and on which is
more important online: free speech or feeling safe. Republicans and Democrats
have grown further apart when it comes to these issues since 2017. Overall,
55% of Americans say many people take offensive content they see online too
seriously, while a smaller share (42%) say offensive content online is too
often excused as not a big deal, according to a new Pew Research Center
survey of U.S. adults conducted in early September 2020. (PEW) October
12, 2020 4.6
Society » Media/ New Media |
|
|
|
|
|
659-22
Victorians now against Stage 4 Covid Restrictions (Click for
Details)
October
05, 2020 4.11
Society » Health |
|
|
659-23 The state of happiness in a COVID
world (Click
for Details) Global Happiness 2020 survey shows happiness
has receded in many, but not all countries since last year. Six in ten adults
across 27 countries (63%) are happy, according to the latest Ipsos survey on
global happiness. Despite the COVID-19 pandemic, the prevalence of happiness
at an aggregate level is nearly unchanged from last year. However,
year-over-year, the incidence of happiness shows significant shifts in many
countries: it has declined by eight points or more in Peru, Chile, Mexico,
India, the United States, Australia, Canada, and Spain, while it has
increased by more than eight percentage points in China, Russia, Malaysia,
and Argentina. (Ipsos) October 07, 2020 4.13 Society » Social Problems |
|
|
659-24 Who do people in APAC want to
win the US presidential election? (Click for Details) Last week YouGov revealed that major European
countries all wanted Joe Biden to win the US presidential election. This week
a look at a selection of eight countries and regions in the Asia-Pacific area
reveals a more mixed picture. Unlike in Europe where every country favoured
the Democratic challenger, President Trump does find himself ahead in one
place in APAC: Taiwan, where he leads by 42% to 30%. However, Taiwan is the
only place in the study where this is the case. Trump’s next strongest base
is in Hong Kong, where he is preferred by 36% of people to Joe Biden’s 42%. (YouGov) October 15, 2020 1.1 Domestic Politics » Elections |
|
|
659-25 More Than Half of the World Worries
About Food, Water Safety (Click for Details)
October 09, 2020 3.5 Economy » Poverty |
|
|
54% of Indians tired of watching TV news
While about 55 percent of the surveyed
males agreed that they were tired of watching Indian news channels, nearly 52
Interestingly, it was people from the
northeast (59.3 percent) that were most tired of watching Indian news
channels while 47.6 percent of people from Union Territories felt the same
way. When it came to north India, at least
57.9 percent of the respondents felt that they were done watching new
channels while nearly 48 percent from the south and 53.6 percent from west
India felt the same way. Among the different income groups,
52.4 percent of the lower-income group felt tired of news channels, while the
figures for the middle-income group and higher income group were 54.4 percent
and 58 percent, respectively. On educational levels, 52.2 percent of
the lower education group felt that they are tired of watching the news
channels while 56.4 percent of people from higher education groups felt
likewise. A slight difference of opinion on the
same question was also observed in respondents from rural and urban India.
While 55.5 percent of people from urban India shared the tiredness of new
channels, 52.8 percent of rural India felt likewise. On an age basis, among those in the
age group from 18 years to 55 years and above, the percentage ranged from
52.4 percent to 55 percent. Talking specifically, in the age group
between 18 years to 24 years, 52.4 percent said that they are tired of
watching Indian news channels, while the level was 55.9 percent among those
aged between 25 to 34 years and 52.3 percent among the age group from 35 to
44 years. The figure for those aged 55 and above was 52 percent. The sample size of the survey,
conducted in the last week of September and the first week of October across
India covering all districts in all states and representing the demographic
profile according to the latest census figures, was 5,000 plus. The MoE
(margin of error) is +/- 3 percent at the national level and +/- 5 percent at
regional levels. (CVoter
India) October 14, 2020 Source: http://www.cvoterindia.com/indians-tired-of-watching-tv-news/ |
|
|
Pew Research
Center surveys regularly reveal divergent opinions about globalization,
national identity and international engagement, both in the United States
and other countries.
Political affiliation and ideological orientation help explain some of these
differences in opinion, but we wanted to explore more fully how local context
and national identity also shape opinions about globalization. To do this,
we designed a cross-national, comparative qualitative research project. We
recruited 232 people to participate in 26 focus groups in seven cities in the
United States and United Kingdom. We asked participants about their views of
local, national and international issues. Unlike in our surveys — where
respondents typically answer closed-ended questions — we asked open-ended
questions, allowing participants to discuss their responses in more depth.
And being in a focus group allowed participants to engage with one another
and the topics posed. After the focus groups concluded, we developed a
strategy to systematically analyze verbatim transcripts by theme. We then
assembled a matrix of distinct, yet sometimes intersecting, frames of
reference that people employed when discussing the nature and consequences of
globalization, national identity and international engagement. In addition to
forming the basis of our analysis for a data essay published today, the findings of the focus groups helped guide us in developing
survey questions which will be fielded soon in the U.S. and UK, as well as
other countries. In this post,
we’ll explain how we developed and carried out this research project, and
what we learned. To navigate directly to the different components of this
analysis, you can use the links below: · Developing a discussion guide Designing the project From the
start, we planned to use the focus group findings to inform future opinion
surveys. Our research design aimed to depart from the structured interview
format of quantitative surveys, while maintaining a systematic, rigorous
approach to analyzing the focus group transcripts. The number and composition
of focus groups in the U.S. and the UK were intended to exhaust the range of
views on globalization, international engagement and national identity —
providing us with enough disparate opinions about these topics from people in
different walks of life, geographies and more that we achieved a “saturation”
of sorts. Saturation is a difficult standard to demonstrate; however, we can
report that over the course of the study we did observe an increasing
repetition of themes, if not experiences, and gradually fewer views that
could be described as novel or innovative. This suggests that the research
design did, in fact, achieve a reasonably robust degree of saturation. Building our focus groups We drew on
extensive background research and expert consultations to organize focus
groups in the U.S. and UK using similar but distinct criteria and variables,
such as party affiliation, ideology, vote in the referendum to leave or
remain in the European Union, and 2016 U.S. presidential vote. Focus group
composition in each country was designed to maximize variability — e.g.,
across different political ideologies — while creating optimal conditions for
open, active engagement by participants — e.g., speaking with “leavers” in
one group and “remainers” in another. Importantly, we found that people with
certain characteristics in common were more likely to feel comfortable
speaking openly about their opinions.
United States In the U.S.,
research indicates that partisanship plays a role in how people feel about
the themes we wanted to explore, but that the experience of being a
Republican in a primarily “blue state” might vary from that of a Republican
in a “red state.” As a result, we selected three cities — Seattle, Houston
and Pittsburgh — in states that can generally be described as
Democratic-leaning (Washington), Republican-leaning (Texas) or a
“battleground” (Pennsylvania). Our research
also suggested that Americans’ views about globalization and immigration
differ by their community type — rural, suburban or urban — as well as by
their race and ethnicity. But we’ve learned from our past focus groups on
this topic that it’s important to create homogeneous racial and ethnic groups so as to
minimize participants’ discomfort speaking about sensitive issues and
encourage more open sharing of personal experiences and perspectives. To that
end, we created one focus group with each of three distinct racial and ethnic
communities: a group composed of Asian and Pacific Islander Americans in
Seattle, one comprised of Hispanic Americans in Houston and one consisting of
Black Americans in Pittsburgh. All other groups were comprised of White
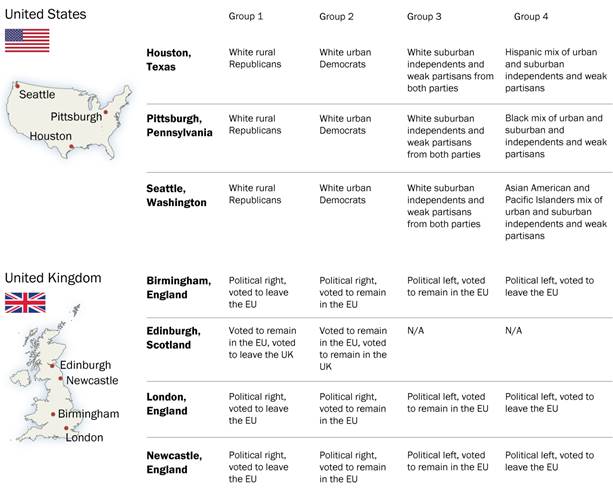
Americans exclusively. Taking all of
these factors into account, we organized a total of four focus groups in each
city: 1) a group of White Republicans and Republican-leaning independents
living in rural areas surrounding each city; 2) a group of suburban White
independents; 3) a group of ethnic minority independents who hailed from
suburban or urban locations; and 4) a group of White urban Democrats and
Democratic-leaning independents. As an
additional “screen,” or question we used to help sort participants into
particular groups, we asked every participant a previously used survey question that related to our topic of interest: whether America’s
openness to people from all over the world is “essential to who we are as a nation,”
or ”makes us risk our identity as a nation.” We wanted to ensure that
everyone had an opinion on this question and that Groups 1 and 4, as
described above, were of like mind about it (the former saying America risks
losing its identity, the latter saying openness is essential) and that Groups
2 and 3 had some variation. United Kingdom In the UK, we
again focused on geography and ideology, but the Brexit vote also played a
key role. In particular, we wanted to include two cities that largely voted
to remain in the EU and two that largely voted to leave, while also capturing
the diversity of views among people living in those areas. We chose
London and Edinburgh because they voted resoundingly to remain in the EU —
and Edinburgh, specifically, to understand the Scottish perspective and
explore the attitudes of those who do and do not support Scottish
independence. We chose Birmingham and Newcastle because both voted to leave
the EU and were historic manufacturing hubs, while Newcastle also offered a northern perspective. Using a seven-point left-right ideological orientation scale, we created four focus groups in each of the three cities in
England: 1) those on the ideological right who voted to leave the EU; 2)
those on the ideological left who voted to leave; 3) those on the ideological
right who voted to remain; and 4) those who on the ideological left who voted
to remain. In addition, all of the ideologically left-leaning focus groups
included at least two participants from racial and ethnic minority groups,
while the right-leaning focus groups were entirely White Britons. Participants
were also asked to what degree they identified with their local area, their
city, with England or Scotland (depending on the location of the group), with
the UK, as European, or as a global citizen, each using a 10-point scale,
where 0 meant not at all and 10 meant very strong identification. People were
then recruited into different groups based on whether they gave higher values
to being European or a global citizen or whether they gave higher values to
local areas or their country. Other variables The variables
we considered when putting these groups together are not the only ones that
affect attitudes toward globalization and national identity. Things like
education, gender, employment and age are also prisms through which views
about these issues can be forged, and while these were not necessarily the
primary variables we considered when putting our groups together, we did consider
them. Some of the
groups had specific education cut-offs. In the U.S., no one in the White
rural Republican groups attended college, while all other groups were
comprised of a mix of educational attainment. And in the UK, different groups
in different cities had different educational cut-offs. For example, the
“remain”-voting groups in London and Newcastle all had an undergraduate
degree or less education, while the participants in the “remain”-voting
groups in Birmingham all completed undergraduate degrees or pursued graduate
degrees. We took a similar approach for the “leave”-voting groups, with those
in London and Newcastle having undergraduate degrees or more education and
those in Birmingham having undergraduate degrees or less education. And in
Scotland, the people we spoke with who supported Scottish independence had
less education, while those who favored staying in the UK had more. We did
this to examine how education might affect attitudes within each type of
group. With regard
to gender and age, we made sure that all groups were roughly balanced, with
about half of participants men and half women (there were no gender nonbinary
or non-conforming individuals in our sample), and that all groups had a mix
of adults ages 18 and older. Developing a discussion guide Our
discussion guide — essentially a list of topics we planned to cover —
included questions that aimed to explore our research interests and prompt
conversations that examined the impacts of globalization and national
identity at the local, national and international levels. Since our
screening questions already identified whether people were more nationally or
internationally oriented, we included questions designed to uncover why people felt as they did, the
crux of qualitative research. We wanted to see how they described and reacted
to change affecting their community, their country and the world. Asking about
the local effects of globalization At the local
level, we asked the following questions: · Describe
where you live. · How has
your neighborhood changed? · Is your
neighborhood closely knit? · Are there
opportunities for people where you live? · How would
you describe the kind of place where you’d like to live? Asking about
the national effects of globalization At the
national level, we asked the following questions (not all questions included
in the focus group moderator guides were analyzed in the final report, but
analyses of some of these data may be released at a later date): · What does
it mean to be American/British? · What things
make you proud to be American/British? · What makes
you embarrassed or ashamed to be American/British? · When was
the U.S./Britain at its best? · Can people
from other cultures be American/British? · Is what it
means to be American/British the same today as it was in the past? · To what
extent to you feel at home in the U.S./Britain today? · Where is a
quintessentially American/British place? · Who is a
patriot/someone with a strong British identity? · Who is a
cosmopolitan? · Is there
common ground between patriots/people with strong British identities and
cosmopolitans? · What are
the issues facing our country today? Asking about
the international effects of globalization At the
international level, we asked the following questions: · What is globalization? · Has our
country benefited from globalization? · Who or what
has benefited in particular? · What are
the biggest problems with individual countries working together? · Is our
country open or closed to people from other countries? · What would
be the impact of our country having fewer connections with other countries? Analyzing the data Once the
focus groups wrapped up, we were left with 26 roughly 40-page transcripts,
totaling over 1,000 pages of text. And even though our researchers had
attended the focus groups, debriefed about them with moderators and had
access to the transcripts, we sought to develop a method to identify key
themes in a systematic way without needing to pore over more than a thousand
pages.
To do this,
we used a multistep method of data reduction. First, a team of researchers
entered short-form text from the transcripts into a spreadsheet, or data
display. In this display, the discussion guide questions were columns and
individual participants were rows. Researchers entered short-form text deemed
relevant to each discussion guide question into a cell. This short-form text
was either a direct quote or paraphrased statement that we considered to
directly answer the questions the participant was responding to, related to
the key themes we initially set out to study or related to new themes we
identified. If a respondent did not discuss the topic, we left the cell
blank. We created a separate column of “coder’s notes” for researchers to
note any patterns or themes within the group. We also bolded and color-coded
paraphrased text or direct quotes that captured the themes that occurred
across multiple questions. Quality control We conducted
a number of quality control checks during this data entry phase. To ensure
the essence of each data reduction spreadsheet captured the same general
information, each researcher initially coded the same transcript. We noted
and discussed any discrepancies (such as omitted key quotations, missing
responses by participants, insufficiently condensed text, or significant
paraphrases or direct quotations that were not bolded and/or color-coded).
After coding the same transcripts, each researcher then proceeded to enter
data onto a separate spreadsheet for each group on their own. Each researcher
had at least two of their displays checked for errors by another researcher.
No researcher entered data for more than eight transcripts. After we
entered all the transcript data, we combined the spreadsheets for each group
into one “master” display for each country. At this stage, we completed an
additional quality control check to ensure that the data in each cell
properly aligned with others (i.e., that each column contained only data
relevant to the discussion guide question “variable” header). Creating ‘toplines’ After the
quality assurance measures had been finalized, a team of three researchers
further reduced the data displays into outlines or summaries, akin to the
“toplines” we use to summarize quantitative data. Each researcher was
assigned a section of the focus group instrument — either local, national or
global — and outlined the key themes identified under each question in that
section. They also noted any differences in the themes that came up between
groups or between certain demographics within groups (e.g., groups consisting
of people who voted to leave the EU were less likely to see multiculturalism
in a positive light). These toplines were also careful to note when certain
questions were not asked in all groups to indicate that there are limitations
to the findings from these questions. Key takeaways We believe
this qualitative research project was effective at exploring and
understanding some of the key frames of reference people employ when
answering questions about globalization, international engagement and
national identity. Over the course of 26 focus groups, our guided discussions
gradually achieved a high level of “saturation,” leading us to feel confident
with the depth and breadth of the study’s findings. These findings, in turn,
suggest new ways for us to ask about and engage survey respondents on topics
related to the experience and consequences of increasing global
interconnectedness. For example, we learned a great deal about how ideas of
political correctness, national history and law and order factor into how
people conceptualize their national identities. Without conducting these
groups, we may not have known to ask questions on these topics when exploring
people’s views of globalization. But in
addition to helping us better conceptualize how to ask questions about the
topics we explored, we also learned about why people felt certain ways — adding a richness to
our bread-and-butter quantitative work. However, we
also recognize the challenges of qualitative research. The process of
developing this project, collecting the data, cleaning the data and
conducting the analysis was extremely time consuming for our team. While we
can typically write a survey and identify a sample, conduct fieldwork, and
analyze our data within the span of less than a year (and sometimes,
within less than six months),
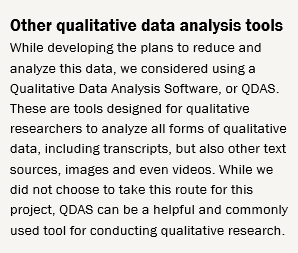
this project was over a year in the making. In addition,
when we conduct a survey, we have processes in place to manage its progress,
from questionnaire development to reporting. But for this project, we were
creating new systems. If we pursue this kind of project again, we now have a
stronger foundation to build on, in addition to some new strategies we
explored, such as using a QDAS, that may help truncate our timeline. Beyond
the time costs, there are monetary costs to doing enough focus groups to feel
like one has reached “saturation” and heard about perspectives from enough
different types of people, especially if one is interested in cross-national,
comparative work. Despite these
challenges, the research team is excited about the findings from this project
— both on their own and
in terms of how they can inform our future survey work — and we believe they
were valuable enough to justify the costs. (PEW) October 05,
2020 |
|
|
|
|
|
|
|
|
Disclaimer:
Gilani’s Gallopedia is a not for profit activity and every effort has been
made to give attribution to respective polling organizations. All material
presented here is available elsewhere as public information. Readers may
please visit the original source for further details. Gilani Research
foundation does not bear any responsibility for accuracy of data or the
methods and does not claim any proprietary rights benefits or
responsibilities thereof. *Archives: Gilani’s Gallopedia has
been compiled on a weekly basis since January 2007. Previous material is
available upon request. Please contact asra@gallup.com.pk |
|