BUSINESS AND POLITICS IN THE MUSLIM WORLD
Global Opinion Report No. 219
Week: April 08-14, 2012
Presentation: April 18, 2012
|
INTRODUCTORY NOTE |
2 |
|
SUMMARY OF POLLS |
2 |
|
MIDDLE EAST & NORTH AFRICA |
|
|
Palestinians Frustrated of Hamas Fateh Conflict |
6 |
|
SOUTH EAST ASIA |
|
|
Indonesian Consumer Confidence up in March |
12 |
|
Filipinos Satisfied with Their Most of Political Leadership |
14 |
|
NORTH EAST ASIA |
|
|
Low Level of Support for Noda Government in Japan |
17 |
|
EAST EUROPE |
|
|
Presidential Elections: Afterword |
21 |
|
Move From Russia? No More! |
23 |
|
Why People Leave Russia? Opinion Of Potential Migrants |
24 |
|
WEST EUROPE |
|
|
Energy For All: EU Support For Developing Countries (Eurobarometer) |
27 |
|
The Charter of Fundamental Rights of The European Union (Eurobarometer) |
29 |
|
UK: Energy Profits: Consumers Not Happy |
30 |
|
German Firms Deeply Unhappy With Hungary Policy Drift-Survey |
31 |
|
Sarkozy's Comeback Hopes Crumble, Polls Show |
32 |
|
Economic Confidence Falls to Single Digits in Britain |
33 |
|
NORTH AMERICA |
|
|
Americans Favor "Buffett Rule" by 60% to 37% |
33 |
|
Americans Split on Whether China's Economy Is Good for U.S. |
35 |
|
Romney's Challenge: Midwestern, Young, Highly Religious GOP |
39 |
|
In U.S., Economic Indicators Signal Positive Momentum |
42 |
|
Americans Endorse Various Energy, Environment Proposals |
45 |
|
Obama's Monthly Job Approval Edges Higher in March |
49 |
|
Worry About U.S. Water, Air Pollution at Historical Lows |
56 |
|
U.S. Young Adults Admit Too Much Time on Cell Phones, Web |
59 |
|
Over Half of Americans Have Cut Back on Products and Services Because of
High Gas Prices |
62 |
|
Despite Intense Negative Media Focus, Americans Still Believe the Benefits
of Natural Gas Outweigh the Risk |
66 |
|
Two Years Later, Health Care Reform Continues to Polarize Views in the U.S. |
69 |
|
LATIN AMERICA |
|
|
Mexico's Pena Nieto Extends Lead Over Main Rival |
70 |
|
Falklands War: Britain and Argentina (Multi-country) |
71 |
|
MULTI-COUNTRY STUDIES |
|
|
Nearly One in Four Worldwide Thriving |
72 |
|
More Than One in 10 "Suffering" Worldwide |
77 |
|
Global Internet Users Manage Finances (59%), Shop (51%) and Look for Jobs
(41%) Online |
80 |
|
CYBER WORLD |
|
|
USA: Over Half Of Tablet And Smartphone Time Is Shared With TV Viewing
Latest Results Of A Gfk Survey |
81 |
INTRODUCTORY NOTE
This week
report consists of thirty surveys. Six of these are multi-country studies while
the rest of twenty four are national surveys from various countries.
219-31:
Commentary: US Young Adults Admit Too Much Time on Cell
Phone, Web
Overall, Americans most likely to say television occupies too much of their time
April 12, 2012
 PRINCETON,
NJ -- By their own admission, many young Americans, aged 18 to 29, say they
spend too much time using the Internet (59%), their cell phones or smartphones
(58%), and social media sites such as Facebook (48%). Americans' perceptions
that they spend "too much" time using each of these technologies decline with
age. Conversely, older Americans are most likely to say they spend too much time
watching television, and among all Americans, television is the most overused
technology tested.
PRINCETON,
NJ -- By their own admission, many young Americans, aged 18 to 29, say they
spend too much time using the Internet (59%), their cell phones or smartphones
(58%), and social media sites such as Facebook (48%). Americans' perceptions
that they spend "too much" time using each of these technologies decline with
age. Conversely, older Americans are most likely to say they spend too much time
watching television, and among all Americans, television is the most overused
technology tested.
These results are based on answers to questions included in Gallup Daily
tracking interviewing conducted April 9-10, asking Americans if they spend too
much time on five activities involving "screens" -- using cell phones or
smartphones, doing email, using social media sites such as Facebook, using the
Internet, and watching television. Not all Americans engage in each of these
activities, of course, which may help explain why older Americans are not likely
to say they spend too much time on Internet-, social media-, and cell
phone-related pursuits.
Forty-seven percent of Americans, including 78% of those aged 18 to 29, report
owning a smartphone, and of these, 48% say they spend too much time using it.
Email appears to be less of a time concern to Americans overall than using cell
phones or using the Internet more generally. Twenty percent of those under 30
say they spend too much time with emails; this drops to 4% among those 65 and
older.
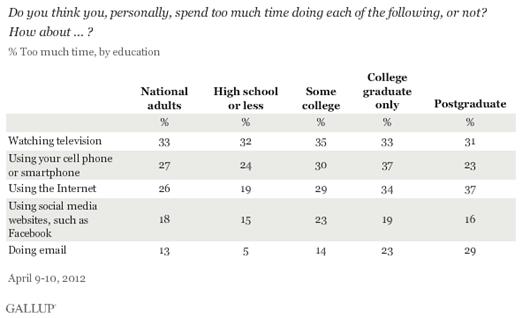
Highly Educated Most Likely to Report Too
Much Time Spent Using Email, Internet
Highly educated Americans are more likely to say they spend too much time doing
email and on the Internet than are those with less education. Education is not
highly related to the other three activities.
Overall, 33% of all U.S. adults report spending too much time watching
television, 27% too much time on cell phones and smartphones, and 26% too much
use of the Internet -- with fewer than two in 10 saying they spend too much time
on social media sites or doing email.
Americans' concern about spending too much time watching television is not a new
phenomenon. A Gallup poll conducted in 1990, using a somewhat different question
wording, found that 42% of Americans said they spent too much time watching
television -- and in that survey, 13% said they were addicted to television.
Implications
Most new technologies have good and bad dimensions. The Internet, email, cell
phones and smartphones, and social media sites have opened up entirely new ways
in which Americans go about their daily personal and work lives -- and are no
doubt considered indispensable by many Americans who use them. These
technologies have also, of course, spawned whole new industries and have been
the basis for some of the fastest-growing companies in the world.
At the same time, it is apparent that many in the U.S., mostly younger
Americans, have become aware that these technologies may have a downside, namely
that they use up too much time.
It is possible that younger Americans -- concerned about their use of time --
will attempt to scale back their use of the new technologies. This could affect
the exponential growth of the industries built on the technologies in the
future. On the other hand, recognition of negative aspects of engaging in
certain activities doesn't necessarily mean people are able to stop doing them
-- as witnessed by those who would like to quit smoking but can't, and those who
would like to lose weight but don't.
All in all, the fact that six in 10 18- to 29-year-olds say they spend too much
time using their phones and using the Internet suggests at least the potential
of a backlash of sorts, which in turn could have unknown but possibly
significant consequences in the years ahead.
Survey
Methods
Results are based on telephone interviews conducted as part of Gallup Daily
tracking April 9-10, 2012, with a random sample of 1,051 adults, aged 18 and
older, living in all 50 U.S. states and the District of Columbia.
For results based on the total sample of national adults, one can say with 95%
confidence that the maximum margin of sampling error is ±4 percentage points.
Interviews are conducted with respondents on landline telephones and cellular
phones, with interviews conducted in Spanish for respondents who are primarily
Spanish-speaking. Each sample includes a minimum quota of 400 cell phone
respondents and 600 landline respondents per 1,000 national adults, with
additional minimum quotas among landline respondents by region. Landline
telephone numbers are chosen at random among listed telephone numbers. Cell
phone numbers are selected using random-digit-dial methods. Landline respondents
are chosen at random within each household on the basis of which member had the
most recent birthday.
Samples are weighted by gender, age, race, Hispanic ethnicity, education,
region, adults in the household, and phone status (cell phone only/landline
only/both, cell phone mostly, and having an unlisted landline number).
Demographic weighting targets are based on the March 2011 Current Population
Survey figures for the aged 18 and older non-institutionalized population living
in U.S. telephone households. All reported margins of sampling error include the
computed design effects for weighting and sample design.
In addition to sampling error, question wording and practical difficulties in
conducting surveys can introduce error or bias into the findings of public
opinion polls.
219-32:
USA

SUMMARY OF POLLS
MIDDLE
EAST & NORTH AFRICA
Palestinians Frustrated of Hamas Fateh Conflict
A recent
Palestinians survey shows that a majority of Palestinians are pessimist about
the Doha agreement for reconciliation between Fateh and Hamas. A majority of
about six in ten believe that the only way to pressurize both parties for
reconciliation is to arrange sit ins in the streets of Gaza and West Bank. (An
Najah University)
April 10,
2012
SOUTH
EAST ASIA
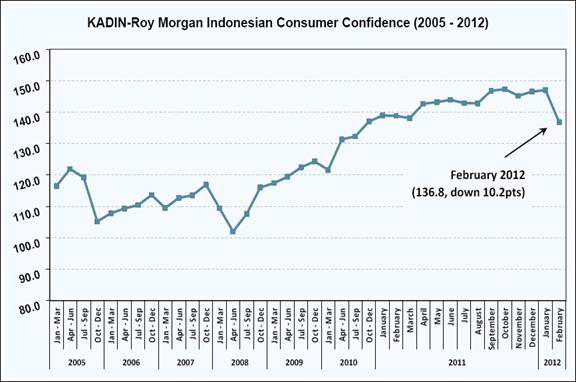
Indonesian
Consumer Confidence up in March
Indonesian
Consumer Confidence is at 142.5 (up 5.7pts in March). It is now 4.4pts higher
than it was a year ago in March 2011 (138.1). This month’s rise was driven by
increasing confidence across all components of the survey and particularly
people’s expected financial positions this time next year. (Roy Morgan)
April 16,
2012
Filipinos
Satisfied with Their Most of Political Leadership
The First
Quarter 2012 Social Weather Survey, conducted from March 10-13, 2012, found 79%
satisfied and 9% dissatisfied with the performance of Vice-President Jejomar
Binay, 69% satisfied and 13% dissatisfied with Senate President Juan Ponce
Enrile, 39% satisfied and 21% dissatisfied with Speaker Sonny Belmonte, and 22%
satisfied and 51% dissatisfied with Chief Justice Renato Corona. (SWS)
April 13,
2012
NORTH
EAST ASIA
Low Level
of Support for Noda Government in Japan
A recent
survey shows that Noda government in Japan enjoys only a low level of public
support. In the case of elections, Democratic Party of Japan and Liberal
Democratic Party of Japan will go neck and neck. (Asahi Shimbun)
March 2012
EAST
EUROPE
Presidential Elections: Afterword
Every
tenth Russian changed his/her voting decision during presidential election
campaign (10%). The firmest voters were supporters of V.Zhirinovsky (only 5%
recognized that they were planning to vote for another candidate in the
beginning). On the contrary, the most effective campaign to attract new
followers was the campaign of M.Prokhorov: 36% of those who voted for him were
originally planning to vote for another candidate. (Russian Public Opinion
Research Center)
March 29,
2012
Move From
Russia? No More!
After the
June surge in emigration moods the share of those who would like to move
permanently has twice decreased (from 22 to 11%). The current figure is even
lower than in 1991 (16%). At the same time, the share of those who do not want
to leave Russia is increasing (from 75 to 88%). (Russian Public Opinion Research
Center)
March 26,
2012
Why People
Leave Russia? Opinion Of Potential Migrants
As before,
most of Russians willing to leave Russia say they want to improve their living
conditions (46%). Such aspects as self-realization (14%), order in the country
(13%) and liking for a particular state (11%) are less important. The least
important reasons are the willing to move to relatives or friends (6%), to live
in a safe country (5%). At the same time, 19% of Russians do not know the exact
reason behind their desire to move. (Russian Public Opinion Research Center)
March 26,
2012
WEST
EUROPE
Energy For
All: EU Support For Developing Countries (Eurobarometer)
A majority
of respondents say that when people don’t have access To affordable energy in
developing countries, this causes the biggest Problems for cooking, preserving
food (58%) and having access To healthcare (52%). 77% of Europeans think that
the main future energy source for People in the developing world should be
renewable energy. Few people advocate fossil energy (7%), nuclear energy (6%),
or Biomass (4%). (TNS Political & Social)
April 2012
The
Charter of Fundamental Rights of The European Union (Eurobarometer)
A recent
survey of European Union shows that 64% of EU residents have heard of the EU
Charter of Fundamental Rights, this is an increase of 16 percentage points as
compared to 2007. However, knowledge of the Charter is generally low across
countries - with Spain having the highest knowledge levels at 20%, and France
the lowest at 3%. (TNS Political & Social)
April 2012
UK: Energy
Profits: Consumers Not Happy
Recent
research has found that over eight in ten (84%) UK consumers agree that energy
suppliers maximise profits at the expense of customers. And over half of
consumers (59%) agree with the statement ‘energy suppliers treat people with
contempt’. (Yougov)
April 12
2012
German
Firms Deeply Unhappy With Hungary Policy Drift-Survey
A recent
survey shows that two thirds of German and Austrian companies in Hungary are
"strongly dissatisfied" with government economic policy and its rating as a
destination for investment has slumped. (Reuters)
Apr 16,
2012
Sarkozy's
Comeback Hopes Crumble, Polls Show
French
President Nicolas Sarkozy defended his economic record on Friday as a slew of
opinion polls suggested his prospects of re-election were crumbling just over a
week from round one of a vote where Socialist Francois Hollande is the clear
frontrunner. (CSA/Reuters)
April 14,
2012
Economic
Confidence Falls to Single Digits in Britain
People in
Britain are particularly downtrodden about the country’s current financial
standing, a new Angus Reid Public Opinion poll has found. By a 4-to-1 margin,
respondents are more likely to expect a decline in economic conditions than an
improvement. (Angus Reid)
April 14,
2012
NORTH
AMERICA
Americans
Favor "Buffett Rule" by 60% to 37%
Six in 10
Americans favor Congress' passing the so-called "Buffett Rule," which would
mandate a minimum 30% tax rate for Americans with a household income of $1
million or more per year. Majorities of both Democrats and independents favor
the policy, while a majority of Republicans oppose it. (Gallup USA)
April 13,
2012
Americans
Split on Whether China's Economy Is Good for U.S.
Many
Americans say the U.S. and China should cooperate more on economic and energy
issues; however they are divided on whether China's growing economy is a good
thing or a bad thing for the U.S., according to a Gallup-China
Daily USA study conducted in November and December 2011. U.S. opinion
leaders are more likely than the American public to think China's burgeoning
economy is good for the U.S., at 61% and 45%, respectively. (Gallup USA)
April 12,
2012
Romney's
Challenge: Midwestern, Young, Highly Religious GOP
As Mitt
Romney pivots his campaign to the general election, he faces the challenge of
building enthusiasm and, hence, turnout among certain key groups of Republicans
among whom he has done less well during the primary contests so far. These
include Midwestern, young, highly religious, and conservative Republicans.
(Gallup USA)
April 12,
2012
In U.S.,
Economic Indicators Signal Positive Momentum
Gallup's
key U.S. economic indicators tell a consistent story of improving economic and
behavioral conditions. Americans' self-reported employment status, personal
spending, and workplace hiring trends were all better in March than in February,
and were improved over March 2011, although still below pre-recession levels.
(Gallup USA)
April 11,
2012
Americans
Endorse Various Energy, Environment Proposals
Americans
as a whole favor a wide-ranging set of proposals for dealing with the nation's
energy and environment situations, but support varies markedly across party
lines. Republicans are more likely than Democrats to favor opening up federal
lands for drilling, and expanding the use of nuclear energy. Democrats are more
likely to favor each of six different proposals, including emissions-control
measures, spending government money on alternative sources of energy, and
increasing enforcement of environmental regulations. (Gallup USA)
April 9,
2012
Obama's
Monthly Job Approval Edges Higher in March
President
Barack Obama's job approval rating averaged 46% in March, up from 45% in January
and February, and significantly improved over his term-low 41% monthly averages
recorded last summer and fall. (Gallup USA)
April 9,
2012
Worry
About U.S. Water, Air Pollution at Historical Lows
Americans
currently express record-low concern about both air pollution and pollution of
drinking water. Thirty-six percent say they worry a great deal about air
pollution and 48% about pollution of drinking water. Both figures are down more
than 20 percentage points from the year 2000. (Gallup USA)
April 13,
2012
U.S. Young
Adults Admit Too Much Time on Cell Phones, Web
By their
own admission, many young Americans, aged 18 to 29, say they spend too much time
using the Internet (59%), their cell phones or smartphones (58%), and social
media sites such as Facebook (48%). Americans' perceptions that they spend "too
much" time using each of these technologies decline with age. Conversely, older
Americans are most likely to say they spend too much time watching television,
and among all Americans, television is the most overused technology tested.
(Gallup USA)
April 12,
2012
Over Half
of Americans Have Cut Back on Products and Services Because of High Gas Prices
According
to a new Harris Poll, over half of Americans who own a vehicle (55%) say
they have cut back on products and/or services in order to pay for the increased
price of gasoline. As might be expected, those with lower household incomes are
more impacted. (Harris Poll)
April 12,
2012
Despite
Intense Negative Media Focus, Americans Still Believe the Benefits of Natural
Gas Outweigh the Risk
In a year
of intense media scrutiny on hydraulic fracturing, the manner in which most oil
and natural gas companies access natural gas, two-thirds of Americans (66%) say
they believe the benefits of natural gas outweigh the risks while 17% say the
risks outweigh the benefits. (Harris Poll)
March 21,
2012
Two Years
Later, Health Care Reform Continues to Polarize Views in the U.S.
Americans
remain at odds on the effect that the health care legislation signed into law by
U.S. President Barack Obama in 2010 will ultimately have on their medical
services, a new Angus Reid Public Opinion poll has found. Respondents are more
likely to call for the repeal of the new legislation than to wish for it to
remain in place.
April 10,
2012
LATIN
AMERICA
Mexico's
Pena Nieto Extends Lead Over Main Rival
Mexican
presidential front-runner Enrique Pena Nieto has widened his big lead over
struggling ruling party candidate Josefina Vazquez Mota, with just 2 1/2 months
to go until the July 1 election, an opinion poll showed on Sunday. (BGC Mexico)
Apr 16,
2012
Falklands
War: Britain and Argentina (Multi-country)
A joint
Yougov Ibarómetro poll shows that most Argentinians have a negative view of the
1982 invasion, and think the then dictatorship did it to solve their own
political reasons while 52% of Britons think it was right to retake the islands
by force. (Yougov/ Ibarómetro)
April 10
2012
MULTI-COUNTRY STUDIES
Nearly One
in Four Worldwide Thriving
Nearly
one-quarter of adults worldwide (24%) are "thriving," according to Gallup
surveys in 146 countries in 2011. The percentage rating their current and future
lives positively enough to be considered thriving ranged from a high of 74% in
Denmark to a low of 2% in Cambodia. (Gallup USA)
April 10,
2012
More Than
One in 10 "Suffering" Worldwide
An average
of 13% of adults worldwide rated their lives poorly enough to be considered
"suffering," according to Gallup surveys in 146 countries in 2011. The
percentage rating their current and future lives poorly enough to be considered
suffering was as high as 45% in Bulgaria and as low as 1% or less in the United
Arab Emirates, Netherlands, Luxembourg, Canada, Thailand, and Brazil. (Gallup
USA)
April 13,
2012
Global
Internet Users Manage Finances (59%), Shop (51%) and Look for Jobs (41%) Online
A majority
of citizens in 24 countries who use the internet say they do so to check their
bank accounts (59%), half (48%) shop for products online and four in ten (41%)
have surfed to look for jobs in the last three months, finds a new poll by
global research company Ipsos for Reuters News. (Ipsos/Reuters)
April 13,
2012
CYBER
WORLD
USA: Over
Half Of Tablet And Smartphone Time Is Shared With TV Viewing Latest Results Of A
Gfk Survey
As
advertisers and marketers look for the best ways to take advantage of an
explosion in smartphone and digital tablet use, a new GfK analysis provides
crucial new details on simultaneous use of these devices and other media. Among
adults 35 to 49, two-thirds of all tablet minutes occur in front of a TV.
April 12,
2012
MIDDLE
EAST & NORTH AFRICA
219-43-1. Palestinians Frustrated of Hamas Fateh Conflict
Results
of Palestinian Public Opinion Poll
No. 44
6-8
April 2012
Background
A
reconciliation agreement was signed in Doha under Qatari auspices between
President Mahmoud Abbas and Mr. Khalid Mishal but the agreement has not been
implemented despite the fact that it was signed more than two months ago. Among
the precepts of the agreement is the formation of a national reconciliatory
government from among the independent intellectual experts headed by Mahmoud
Abbas whose mission is to facilitate presidential and legislative elections and
which would begin the restoration of Gaza. Such government has not been formed
yet and both Fateh and Hamas lay the blame on each other for the failure so far
to implement the reconciliation agreement and to achieve the formation of a
national unity government The Government of Dr. Salam Fayyad revealed a deficit
in the budget of the Palestinian Authority (PA) which exceeds one billion
dollars and declared that some procedures are going to be implemented to reduce
the deficit.
The
Results
Following
are the results of the Palestinian Public Opinion Poll no. 44 conducted by the
Center for Opinion Polls and Survey Studies at An-Najah National University
during the period from 6-8 April 2012. The University sponsors all polls
conducted by its Center. Palestinian Public Opinion Poll no. 44 undertakes
Palestinian public opinion in the emerging political realities on the
Palestinian scene including the Palestinian reconciliation and the possibilities
of the implementation of the Doha agreement. This poll also undertakes the
economic situation in the Palestinian territories, the possibility of conducting
presidential, legislative and city council elections in addition to the
political affiliations of Palestinian people.
The sample
included 1361 persons whose age group is 18 and above and who have the right to
vote. The enclosed questionnaire was distributed on 800 persons from the West
Bank and 500 persons from the Gaza Strip. The sample was drawn randomly and the
margin of error is about ±3%; still 2.7% of the members of the sample refused to
answer the questionnaire.
The
opinions represented in the results reflect those of the study; they do not, by
any
means,
represent the opinion of An-Najah National University.
The
General Results:
• 31.6% of
respondents believed that the Doha agreement which was signed between President
Mahmoud Abbas and Mr. Khalid Mishal to end the Palestinian division will
succeed; 61.3% believed that it will fail.
• 31.7% of
respondents believed that the Doha agreement which was signed between President
Mahmoud Abbas and Mr. Khalid Mishal to end the Palestinian division is possible
to implement; 62.1% believed that it is not.
• 38% saw
that Hamas is the responsible party for deferring the implementation of the
reconciliation agreement which was signed between Fateh and Hamas in Doha; 12.3
% saw that Fateh is the responsible party
• 59.7% of
respondents believed that some Arab countries seek preventing the implementation
of the Doha agreement
• 37.9% of
respondents believed that Hamas is the part which benefits most from deferring
the implementation of the reconciliation agreement; 16.3% believed Fateh is the
party which benefits most
• 35.9% of
respondents believed that Hamas is not concerned with implementing the
reconciliation agreement while 10.4% believed that it is Fateh which is not
concerned.
• 38.1% of
respondents said that they are optimistic towards the prospects of implementing
the reconciliation agreement in the near future; 57.2% said that they are
pessimistic.
• 43.3% of
respondents believed that the sides of the Palestinian dialogue, particularly
Fateh and Hamas, are not concerned with ending the Palestinian division
• 58.9% of
respondents believed that a successful implementation of the reconciliation
agreement will influence them personally in a positive way.
• 41.1% of
respondents believed that deferring the implementation of the reconciliation
agreement is the result of some decision makers’ endeavor to achieve personal
interests, 33.7% believed that it is the result of decision makers’ endeavors to
achieve certain interests for their parties and political movements, 20.1%
believed that it is the result of endeavors to achieve regional interests.
• 13% of
respondents believed that the delay in the implementation of the reconciliation
agreement is the result of some Arab pressure on some Palestinian parties, 25.1%
believed that the delay is the result of regional pressure, 25.7% believed that
it is the result of the factional interests of Hamas and Fateh, 8.7% believed
that it is the result of personal economic interests, and 22.9% believed that it
is the result of personal political interests.
• 40.9% of
respondents believed that the implementation of the Palestinian reconciliation
agreement will speed and support the peace process; 34.6% believed that it will
hinder and delay the peace process.
• 57.5% of
respondents said that the most capable procedure to end the Palestinian division
is for Palestinian people to go down to the streets and to hold sit ins in the
West Bank and the Gaza Strip, 21.2% said that the most capable procedure is
pressure exerted by the Palestinian movements and organizations, 4.7% said it is
pressure exerted by trade unions, and 8.7% said it is pressure exerted by civil
society institutions.
• 64.4% of
respondents said that the most powerful method to end the Palestinian division
comes from pressure exerted by the Palestinian public, 15.7% said that it comes
from Arab political pressure, and 17.2% said that it comes from foreign
political pressure.
• 25.4% of
respondents believed that the Palestinian reconciliation can only be achieved by
Palestinian internal dialogue; 11.8% said that it can only be achieved by some
intervention from Arab countries to bring together the two points of view of
Fateh and Hamas.
• 33% of
respondents believed that the “Arab Spring” will speed up the Palestinian
reconciliation.
• 13.3% of
respondents believed that the “Arab Spring” serves Fateh better in helping her
to achieve her conditions to end the Palestinian division; 24.5% believed that
the “Arab Spring” serves Hamas better.
• 69.6% of
respondents believed that the surrounding Arab and international circumstances
necessitate achieving reconciliation between Fateh and Hamas.
• 79.9% of
respondents are in favor of a national reconciliation government formed from
among experts as stated in the Doha agreement.
• 11.3% of
respondents believed that it is Fateh that hinders the formation of a national
reconciliation government: 38.2% believed that it is Hamas
• In order
for the national reconciliation to succeed, 6.5% preferred that the
reconciliation government be formed from persons belonging to Fateh and Hamas,
56% preferred a government formed from qualified independent persons, and 33.5%
preferred a government formed from qualified persons from Fateh and Hamas.
•
According to the points of view of respondents, it is possible to reduce the
deficit that the Palestinian National Authority suffers from by:
- 38.6%
Giving early retirement to some employees
- 9%
Increasing taxes and imposing new taxes
- 61.2%
Going back to peace negotiations so that the PA can get aids from foreign
countries
- 88.1%
Asking the Arab countries to pay their dues to the PA
• Dr.
Salam Fayyad’s government announced a series of rough measures to curb the
deficit in the general budget. The respondents’ support to these measures were
as follows:
- 9.6%
Raising income tax
- 39.2%
Early retirement to employees who spent more than 15 years in their jobs
- 23.4%
Limiting new employments
- 76.1%
Regulating the appointment of councilors according to the new civil service law
- 87.5%
Regulating the use of government vehicles
- 85.2%
Reducing travel allowances and travel per diem
- 52.3%
Stopping supervision allowances and allowances given to hazardous jobs
•
Respondents believed that increasing the income tax on the private sector
according to the new financial policy of Dr. Salam Fayyad’s government will lead
to the following:
- 26.5%
Increasing investment
- 63.4%
Drainage of funds outside
- 61.2%
Increase in tax revenues
- 76.8%
Increase in unemployment
•
According to respondents the minimum wage in Palestine must be 2386 NIS.
Responses ranged between 1000 NIS and 3000 NIS.
• 28.4% of
respondents considered themselves optimistic; 67.2% considered themselves
pessimistic.
• 79.9% of
respondents said that they will participate in the coming presidential
elections. From among those who said they will participate, 39.7% said that they
will give their votes to Fateh's candidate; 10.5% said they will give their
votes to Hamas' candidate.
•
Respondents were asked to write the name of the person whom they give their
votes to in case presidential elections are conducted and they are given open
choice. They said they will give their votes to:
- 41.3%
Mahmoud Abbas
- 15.9%
Marwan Bargouthi
- 8.8%
Ismael Hanyia
- 5.0%
Salam Fayyad
- 3.1%
Sa’ib Erikat
• In case
presidential elections are conducted and a list of candidates is given to
respondents, they said they will give their votes to
- 42.0%
Mahmoud Abbas
- 18.3%
Marwan Bargouthi
- 9.7%
Ismael Hanyia
- 5.4%
Salam Fayyad
- 3.2%
Sa’ib Erikat
• In case
presidential elections are held and Mr. Mahmoud Abbas does not run and a list of
candidates is given to respondents, they said they will give their votes to
- 40.8%
Marwan Bargouthi
- 10.9%
Salam Fayyad
- 9.4%
Ismael Hanyia
- 7.1%
Sa’ib Erikat
- 2.9%
Khalid Mishal
• 83.3% of
respondents said that they will participate in the coming legislative elections.
From among those who said they will participate, 42% said that they will give
their votes to Fateh's candidates; 11.9% said they will give their votes to
Hamas' candidates.
• If PLC
elections are to be conducted, 47.7% of respondents expected the winning of
Fateh movement; 10.9% expected the winning of Hamas.
• 84.3% of
respondents said that they will participate in the coming municipality and local
council elections. From among those who said they will participate, 34.9% said
that they will give their votes to Fateh’s candidates, 11.3% said they will give
their votes to Hamas' candidates and 10.1% said they will give their votes to
the representative of their family or clan.
• 51.2% of
respondents believed that if elections are conducted in the Palestinian
Territories at the present time, they will be fair and unbiased.
• 16.3% of
respondents believed that Hamas refused to allow the Central Elections Committee
to register voters in the Gaza Strip because Hamas fears that it will not win in
the coming elections; 12.4% said that they refused to register voters because,
they do not desire to achieve national reconciliation, and 53.9% said that Hamas
refused to register voters for both of the above reasons.
• 40.3% of
respondents said that the current political, security and economic circumstances
compel them to desire emigrating.
• 50.2% of
respondents expressed fear for their lives under the present circumstances.
• 68% of
respondents said that they are pessimistic of the general Palestinian situation
at this stage.
• 75.8% of
respondents said that they neither feel safe for themselves nor for their
families and properties under the current circumstances.
SOUTH
EAST ASIA
219-43-2. Indonesian Consumer Confidence up in March
KADIN-Roy Morgan Indonesian Consumer Confidence up in March
142.5 points (up 5.7 points)
|
Article No. 1637 - The monthly KADIN-Roy Morgan Indonesian Consumer
Confidence Rating is based on 2,106 face-to-face interviews conducted
throughout Indonesia, not just a handful of cities. The survey includes the
Top 21 cities, smaller cities and towns as well as many more villages in the
rural hinterland, reflecting all of Indonesia. Men and women aged 14 and
over were randomly selected during the month of March 2012.: April 16, 2012 |
Indonesian
Consumer Confidence is at 142.5 (up 5.7pts in March). Consumer Confidence is now
4.4pts higher than it was a year ago in March 2011 (138.1).
This
month’s rise was driven by increasing confidence across all components of the
survey and particularly people’s expected financial positions this time next
year.
Now 60%
(up 6%) of Indonesians expect their family to be ‘better off’ financially this
time next year (the highest ever recorded) compared to only 5%
(down 2%) that expect to be ‘worse off’ financially.
A large
majority of Indonesians 87% (up 5%) expect Indonesia will have ‘good times’
economically over the next five years compared to 13% (down 4%) that expect ‘bad
times’ economically.
In terms
of personal finances 40% (up 3%) of Indonesians say their family is ‘better off’
financially than a year ago compared to 17% (down 1%) that say their family is
‘worse off’ financially than a year ago.
A slight
majority of Indonesians 53% (up 2%) say ‘now is a good time to buy’ major
household items compared to 43% (down 3%) that say ‘now is a bad time to buy’
major household items.
In terms
of the economy, now 75% (up 1%) of Indonesians expect Indonesia will have ‘good
times’ financially during the next twelve months compared to 25% (down 1%) that
say we’ll have ‘bad times’ financially.
Suryo
Sulisto, Chairman of KADIN says:
"The
remarkable recovery from the previous month’s plunge in confidence is proof of
the Indonesian consumer’s instinctive understanding of realpolitik. When it
looked like there was a good chance of fuel prices going up, confidence crashed
in protest. The twists and turns of the political parties in response to cries
from the public told most Indonesians that a compromise would be reached. The
postponement of the decision to raise prices was taken for granted The will of
the people is as powerful as the fuel that powers the economy. In real terms
very little has been achieved by this postponement.”
The
monthly KADIN-Roy Morgan Indonesian Consumer Confidence Rating is based on 2,106
face-to-face interviews conducted throughout Indonesia, not just a handful of
cities. The survey includes the Top 21 cities, smaller cities and towns as well
as many more villages in the rural hinterland, reflecting all of Indonesia. Men
and women aged 14 and over were randomly selected during the month of March
2012.
Margin of Error
The margin of error to be allowed for in any estimate depends mainly on the
number of interviews on which it is based. The following table gives indications
of the likely range within which estimates would be 95% likely to fall,
expressed as the number of percentage points above or below the actual estimate.
The figures are approximate and for general guidance only, and assume a simple
random sample. Allowance for design effects (such as stratification and
weighting) should be made as appropriate.
|
Sample Size |
Percentage Estimate |
|
|
40%-60% |
25% or 75% |
10% or 90% |
5% or 95% |
|
1,000 |
±3.0 |
±2.7 |
±1.9 |
±1.4 |
|
2,000 |
±2.2 |
±1.9 |
±1.3 |
±1.0 |
|
5,000 |
±1.4 |
±1.2 |
±0.8 |
±0.6 |
|
10,000 |
±1.0 |
±0.9 |
±0.6 |
±0.4 |
219-43-3. Filipinos Satisfied with Their Most of
Political Leadership
13 April
2012
First
Quarter 2012 Social Weather Survey Net Satisfaction Ratings:
Vice-Pres. Binay +70, Senate Pres. Enrile +56,
Speaker
Belmonte +18, and Chief Justice Corona -28;
Record-high ratings for Senate and House of Representatives
Social Weather Stations
The First
Quarter 2012 Social Weather Survey, conducted from March 10-13, 2012, found 79%
satisfied and 9% dissatisfied with the performance of Vice-President Jejomar
Binay, 69% satisfied and 13% dissatisfied with Senate President Juan Ponce
Enrile, 39% satisfied and 21% dissatisfied with Speaker Sonny Belmonte, and 22%
satisfied and 51% dissatisfied with Chief Justice Renato Corona [Table 1].
Compared
to the previous quarter, Vice-President Binay's net satisfaction rating (% satisfied minus
%dissatisfied) stayed at an excellent +70, just 4 points below his
personal record-high of +74 in March 2011 [Chart 1, Table 2].
It rose
from good to very good for Senate President Enrile, up by 20
points from net +36 in the previous quarter to a personal record-high of net +56
now [Chart 2, Table 3].
It rose
from neutral to moderate for Speaker Belmonte, up by 10 points
from net +8 to a personal record-high of net +18 [Chart 3, Table 4].
It stayed poor for
Chief Justice Corona, but fell by 14 points from net -14 in the previous quarter
to a record-low -28 now [Chart 4, Table 5].
Record-high net satisfaction ratings for the Senate and House of Representatives
Public
satisfaction rose for the top four government institutions, with new record-high
net satisfaction ratings recorded for the Senate and the House of
Representatives.
The net satisfaction rating of the Senate rose from good to very good,
up by 14 points from +44 (59% satisfied, 15% dissatisfied) in December 2011 to a
record-high +58 (71% satisfied, 13% dissatisfied) in March 2012. This surpasses
the previous record-high of net +51 in November 2010 [Table 6, also Chart 5,
Table 7].
It rose
from moderate to good for the House of Representatives, up by 13
points from net +27 (46% satisfied, 19% dissatisfied) in the previous quarter to
a record-high net +40 (56% satisfied, 16% dissatisfied) now, surpassing the
previous record-high of net +33 in November 2010 [Chart 5, Table 7].
It stayed moderate for
the Supreme Court, up by 6 points from net +21 (46% satisfied, 25% dissatisfied)
in the previous quarter to net +27 (50% satisfied, 22% dissatisfied, correctly
rounded) now [Chart 6, Table 8].
It stayed moderate for
the Cabinet as a whole, up by 4 points from +22 (43% satisfied, 20%
dissatisfied, correctly rounded) to +26 (45% satisfied, 20% dissatisfied,
correctly rounded).
Survey
Background
The March
2012 Social Weather Survey was conducted from March 10-13, 2012 using
face-to-face interviews of 1,200 adults in Metro Manila, the Balance of Luzon,
Visayas, and Mindanao (sampling error margins of ±3% for national percentages,
±6% for area percentages).
The area
estimates were weighted by National Statistics Office medium-population
projections for 2012 to obtain the national estimates.
The
quarterly Social Weather Surveys on public satisfaction with the Vice-President,
Senate President, Speaker of the House of Representatives, the Chief Justice of
the Supreme Court, and the top government institutions are not commissioned, but
are done on SWS's own initiative and released as a public service, with first
printing rights assigned to BusinessWorld.
[SWS
terminology for Net Satisfaction Ratings: +70 and above, "excellent"; +50 to
+69, "very good"; +30 to +49, "good"; +10 to +29, "moderate", +9 to -9,
"neutral"; -10 to -29, "poor"; -30 to -49, "bad"; -50 to -69, "very bad"; -70
and below, "execrable"]
SWS
employs its own staff for questionnaire design, sampling, fieldwork,
data-processing, and analysis, and does not outsource any of its survey
operations.
#
Table 1
Chart 1
Table 2
Chart 2
NORTH
EAST ASIA
219-43-4. Low Level of Support for Noda Government in
Japan
Asahi
Shimbun Regular Public Opinion Poll (3/13/2012)
Dates
Conducted
Conducted
March 10 and 11, 2012
Released
March 13, 2012 (Morning Edition)
Methodology
Throughout
March 10th and 11th, Asahi surveyed voters nationwide
(excluding a part of Fukushima prefecture) using the ‘Asahi RDD’ method in which
the surveyor makes phone calls to the numbers chosen at random by a computer.
3360 cases were household telephone numbers. 1892 people made valid answers.
Response rate was 56%.
The
numbers represent percentages. Numbers following decimal points are rounded
off. Some questions and answers are omitted.
◆:
Questions addressed to everyone.
◇:
Concerns follow-up questions. Numbers within are percentages relevant to the
whole. Numbers in parentheses mark results from a previous Poll taken on
February 11thand 12th.
Key
Issues
-Political
party support
-Tax hike
-Earthquake preparedness and response
-Nuclear
energy
Disclaimer
The
Mansfield Foundation is responsible for the translation of this Asahi Shimbun
poll, subject to the Mansfield Foundation Terms
of Use
◆Do
you support the Noda Cabinet?
|
Support |
27(27) |
|
Do not
support |
48(49) |
Why?
(Answers on the left list reasons from the supporting 27%; Answers on the right
list reasons from the non-supporting 48%)
|
Noda
is the PM |
29
〈8〉 |
1〈1〉 |
|
DPJ-centered
cabinet |
19〈5〉 |
10〈5〉 |
|
Policy
Aspect |
27〈7〉 |
33〈16〉 |
|
Executive Aspect |
14〈4〉 |
51〈25〉 |
◆
Which political party do you currently support?
|
Democratic Party of Japan |
18(17) |
|
Liberal Democratic Party |
13(12) |
|
New
Komeito |
3(2) |
|
Japan
Communist Party |
1(2) |
|
Kizuna
Party |
0(0) |
|
Social
Democratic Party |
0(1) |
|
Your
Party |
2(2) |
|
The
People’s New Party |
0(0) |
|
New
Party Daichi – True Democratic Party of Japan |
0(0) |
|
The
SunriseParty of Japan |
0(0) |
|
The
New Party Nippon |
0(0) |
|
New
Renaissance Party |
0(0) |
|
Other
party |
2(2) |
|
Do not
support any party |
47(53) |
|
No
answer/Do not know |
14(9) |
◆If
you were to elect a member to the House of Representatives, what party would you
vote for in a proportionate representation?
|
Democratic Party of Japan |
20(20) |
|
|
Liberal Democratic Party |
21(22) |
|
|
New
Komeito |
3(3) |
|
|
Japan
Communist Party |
3(3) |
|
|
Kizuna
Party |
0(0) |
|
|
Social
Democratic Party |
1(1) |
|
|
Your
Party |
5(7) |
|
|
The
People’s New Party |
0(0) |
|
|
New
Party Daichi – True Democratic Party of Japan |
0(0) |
|
|
The
Sunrise Party of Japan |
0(0) |
|
|
The
New Party Nippon |
0(0) |
|
|
New
Renaissance Party |
0(0) |
|
|
Other
party |
4(3) |
|
|
No
answer/Do not know |
41(43) |
|
◆In
order for the government to manage finances for social security, there is a plan
to raise consumption taxes to 8% in April 2014 and to 10% in October 2015. Do
you agree with this plan?
|
Agree |
41(40) |
|
Disagree |
46(46) |
◆Did
you assess the government’s measurements this year in regards to the Tohoku
Earthquake and Tsunami recovery?
|
Assessed |
19 |
|
Didn’t
assess |
67 |
◆If
another earthquake similar to March 11th, were to occur, do you think
you can expect proper response from the government and municipality?
◆Do
you feel you are adequately prepared in the event of another great earthquake?
Do you
live in any of these 3 prefectures: Iwate, Miyagi orFukushima?
◇
(Addressed to the 95% who answered “No”) Do you agree to dispose of any debris
caused by the disaster, which fall below radiation safety standards the
government sets?
|
Agree |
64〈61〉 |
|
Disagree |
24〈22〉 |
◆This
question concerns those who have not withdrawn or deposited money in a savings
account for more than 10 years. The government is considering using money funds
from savings accounts to help with the recovery from the Tohoku Earthquake and
Tsunami. Do you agree with this?
◆Do
you agree to decreasing the dependency on nuclear energy and abolishing the
nuclear plants in the future?
|
Agree |
70(66) |
|
Disagree |
17(23) |
◆Do
you agree to the reopening of nuclear plants that have been suspended due to
periodic inspection?
◆How
concerned are you regarding the influence of suspension of nuclear power plants
on the economy?
|
Very
concerned |
20 |
|
Moderately concerned |
55 |
|
Not
very concerned |
19 |
|
Not
concerned at all |
4 |
◆To
what degree are you confident that all the measures the government has taken to
ensure the safety of nuclear power plants?
|
Very
confident |
2 |
|
Moderately confident |
17 |
|
Not
very confident |
52 |
|
Not
confident at all 44 |
28 |
◆Due
to the increase in cost of fuel, affected by the suspension of nuclear power
plants, the Tokyo Electric Power Company is considering increasing household
electricity bills. Do you consent to this price raise?
EAST
EUROPE
219-43-5. Presidential Elections: Afterword
Only
10% of Russian voters changed their preferences during election campaign.
Most of them ended up voting M.Prokhorov.
MOSCOW, March 29, 2012. Russian
Public Opinion Research Center (VCIOM) presents the data describing how Russian
voters` decision-making was changing during election campaign.
Every
tenth Russian changed his/her voting decision during presidential election
campaign (10%). The firmest voters were supporters of V.Zhirinovsky (only 5%
recognized that they were planning to vote for another candidate in the
beginning). On the contrary, the most effective campaign to attract new
followers was the campaign of M.Prokhorov: 36% of those who voted for him were
originally planning to vote for another candidate.
As to
V.Putin, only 8% of his electorate recognized that they decided to do so during
election campaign and they were not going to vote for him in the
beginning. Given that the total number of voters who cast their vote for Putin
was more than half of all Russians, Putin attracted much more new followers than
any other rival.
What was
behind the voters` decision to change their minds? More than two-thirds of those
who originally wanted to vote for Zyuganov supported Putin on March 4th
(68%). The remainder mainly voted for Prokhorov (14%).
Most of
those who wanted to vote for Mironov changed their decision and cast
their ballot for Putin (61%) and Prokhorov (22%).
Those who
were planning to vote for Zhirinovsky were equally divided: half of them
voted for Prokhorov and half – for Putin (33% for each). Other 20% supported
Zyuganov.
Those who
wanted to vote for Putin ended up voting for Prokhorov (45%) and Zyuganov (32%).
Prokhorov
was also supported by those Russians who were planning to vote for candidates
who failed to take part in presidential race such as Yavlinsky, Mezentsev and
others (58%). However, one–quarter of respondents in this group voted for
Putin (25%).
The
initiative Russian opinion polls were conducted March 10-11, 2011. 1600
respondents were interviewed at 138 sampling points in 46 regions of Russia.
The margin of error does not exceed3.4%.
|
Did
you change your preferences during presidential election campaign?
(close-ended question , one answer, % of those who took part in the voting) |
|
|
Total |
Voted
for Prokhorov |
Voted
for Mironov |
Voted
for Zyuganov |
Voted
for Putin |
Voted
for Zhirinovsky |
|
Yes |
10 |
36 |
14 |
10 |
8 |
5 |
|
No |
88 |
60 |
86 |
89 |
91 |
91 |
|
Hard
to tell |
2 |
4 |
|
1 |
1 |
4 |
|
Did
you participate in the 2012 presidential elections? If yes, who did you vote
for? (close-ended question , one answer, % column, % of those who took
part) |
| |
Who
did you want to vote for in the beginning (before you changed your
decision)? |
|
Planned to vote for Zhirinovsky |
Planned to vote for Zyuganov |
Planned to vote for Mironov |
Planned to vote for Prokhorov |
Planned to vote for Putin |
Other
(Yavlinsky, Mezentsev et cet.) |
I do
not remember |
|
Voted
for Zhirinovsky |
0 |
0 |
0 |
5 |
5 |
8 |
5 |
|
Voted
for Zyuganov |
20 |
0 |
17 |
18 |
32 |
8 |
14 |
|
Voted
for Mironov |
0 |
7 |
0 |
0 |
18 |
0 |
5 |
|
Voted
for Prokhorov |
33 |
14 |
22 |
0 |
45 |
58 |
5 |
|
Voted
for Putin |
33 |
68 |
61 |
77 |
0 |
25 |
55 |
|
I
spoiled the ballot, threw it out |
0 |
0 |
0 |
0 |
0 |
0 |
5 |
|
I do
not remember |
13 |
11 |
0 |
0 |
0 |
0 |
14 |
219-43-6. Move From Russia? No More!
Emigration moods are left behind. Now only 11% of Russians want to move
permanently.
MOSCOW, March 26, 2012. Russian
Public Opinion Research Center presents the data describing how many Russians
would like migrate, as well as when they are going to do that. After
the June surge in emigration moods the share of those who would like to move
permanently has twice decreased (from 22 to 11%). The
current figure is even lower than in 1991 (16%). At the same time, the share of
those who do not want to leave Russia is increasing (from 75 to 88%).
Potential
migrants are basically adherents of M.Prokhorov (25%), youth (25%), and active
internet users (19%). Those who do not want to leave Russia are supporters of
Putin (93%) and elderly respondents (98%).
Thirty-nine percent of those who would like to go abroad do not know when they
will do that. Most of them are 25-34-year-old and 45-59-year-old
respondents. The share of those who know when they will leave Russia is 44% (59%
among young respondents): 11% are planning to move in next two or three years,
13% - in next three or five years, 11% - in next six or nine years, and 8% are
not going to move in next ten years.
The
initiative Russian opinion polls were conducted March 10-11, 2011. 1600
respondents were interviewed at 138 sampling points in 46 regions of Russia.
The margin of error does not exceed3.4%.
|
Would you like to move to another country permanently? (close-ended
question, one answer) |
|
|
1991 |
June
2011 |
March
2012 |
|
Rather
yes |
16 |
22 |
11 |
|
Rather
no |
70 |
75 |
88 |
|
Hard
to tell |
14 |
3 |
2 |
|
Would you like to move to another country permanently? (close-ended
question, one answer)ответ) |
| |
Total
respondents |
Supporters of Zhirinovsky |
Supporters of Zyuganov |
Supporters of Mironov |
Supporters of Prokhorov |
Supporters of Putin |
I
would not take part in elections |
|
Rather
yes |
11 |
18 |
13 |
19 |
25 |
6 |
16 |
|
Rather
no |
88 |
78 |
87 |
77 |
73 |
93 |
81 |
|
Hard
to tell |
2 |
3 |
0 |
5 |
2 |
1 |
3 |
|
Would you like to move to another country permanently? (close-ended
question, one answer) |
|
|
Total
respondents |
Aged
18-24 |
Aged
25-34 |
Aged
35-44 |
Aged
45-59 |
60 and
above |
|
Rather
yes |
11 |
25 |
14 |
13 |
7 |
1 |
|
Rather
no |
88 |
73 |
84 |
87 |
91 |
98 |
|
Hard
to tell |
2 |
2 |
2 |
1 |
2 |
1 |
|
Did
you think of the time when you would move from Russia? If yes, when?
(close-ended question, one answer, % of those who would like to move to
another country permanently) |
|
|
Total
respondents |
Aged
18-24 |
Aged
25-34 |
Aged
35-44 |
Aged
45-59 |
60 and
above |
|
In
next two or three years |
11 |
15 |
8 |
11 |
8 |
14 |
|
In net
three or five years |
13 |
18 |
14 |
14 |
5 |
14 |
|
In
next six or nine years |
11 |
18 |
8 |
8 |
10 |
0 |
|
In ten
years or later |
8 |
8 |
8 |
6 |
10 |
0 |
|
No, I
did not think about it |
39 |
35 |
42 |
39 |
45 |
29 |
|
I
thought about that, but I do not know when it will be possible due to
circumstances |
17 |
6 |
20 |
22 |
23 |
43 |
219-43-7. Why People Leave Russia? Opinion Of Potential
Migrants
Those
who want to leave Russia say they want to improve living conditions. The number
of those who want to migrate to live in a safe country is small.
MOSCOW, March 28, 2012. Russian Public Opinion Research Center (VCIOM) presents
the data describing why Russians would like to move to another country
permanently, and what exactly they do for that.
As before, most of Russians willing to leave Russia say they want to improve
their living conditions (46%). Such
aspects as self-realization (14%), order in the country (13%) and liking for a
particular state (11%) are less important. The least important reasons are the
willing to move to relatives or friends (6%), to live in a safe country (5%). At
the same time, 19% of Russians do not know the exact reason behind their desire
to move.
Men (51%)
and Russians aged 25-34 (58%) say they would like to improve their living
conditions. Young Russians want to find new prospects in another state (18%).
Respondents aged 35-44 believe that there will be more order in another country
(22%). Most of 45-59-year-old Russians would like to move to live closer to
friends and relatives (13%).
To get
prepared for moving most of Russians collect information about the country
(21%), learn foreign language (20% versus 16% in September 2011). Sixteen
percent get advice from friends who have had similar experience; 14% - save up
money (9% in September previous year); rarer Russians search for the information
about migration programs (9%) or work abroad (8%). Those who would like to marry
a foreign citizen (4%), or those who search for education program abroad (3%),
who get additional education or those who are employed by a foreign company (2%
for each) are in the minority. 16% of those who are willing to move do not do
anything special.
Whereas
Russians with high level of education often collect information (24%) and search
for special programs (18%), Russians with low level of education learn foreign
languages (25%) or try to find a job abroad.
The
initiative Russian opinion polls were conducted March 10-11, 2011. 1600
respondents were interviewed at 138 sampling points in 46 regions of Russia.
The margin of error does not exceed3.4%.
|
If
you want to move to another country, could you tell us why? (open-ended
question, any number of answers, % of those who want to move) |
| |
September 2011 |
March
2012 |
|
Better
living conditions |
42 |
46 |
|
More
prospects for self-realization |
15 |
14 |
|
I like
that country |
12 |
11 |
|
More
order |
18 |
13 |
|
Safer/calmer |
5 |
5 |
|
Move
to relatives/ friends |
7 |
6 |
|
Other |
2 |
3 |
|
Hard
to tell |
14 |
19 |
|
If
you want to move to another country, could you tell us why? (open-ended
question, any number of answers, % of those who want to move) |
| |
Total |
Men |
Women |
Aged
18-24 |
Aged
25-34 |
Aged
35-44 |
Aged
45-59 |
Aged
60 and above |
|
Better
living conditions |
46 |
51 |
40 |
48 |
58 |
39 |
40 |
14 |
|
More
prospects for self-realization |
14 |
12 |
16 |
18 |
14 |
14 |
10 |
0 |
|
I like
that country |
11 |
8 |
15 |
16 |
6 |
6 |
15 |
14 |
|
More
order |
13 |
15 |
11 |
11 |
10 |
22 |
13 |
14 |
|
Safer/calmer |
5 |
7 |
2 |
8 |
2 |
6 |
3 |
0 |
|
Move
to relatives /friends |
6 |
5 |
7 |
3 |
2 |
8 |
13 |
0 |
|
Other |
3 |
3 |
2 |
3 |
0 |
6 |
3 |
0 |
|
Hard
to tell |
19 |
18 |
20 |
10 |
22 |
17 |
25 |
57 |
|
Do
you do anything to move now, or later? (close-ended question, any number of
answers , % of those who want to move) |
| |
September 2011 |
March
2012 |
|
I am
collecting information about the country where I want to move |
20 |
21 |
|
I get
advice from relatives and friends |
19 |
16 |
|
I am
learning a foreign language |
16 |
20 |
|
I am
searching for a job abroad |
11 |
8 |
|
I am
searching for an education program abroad |
4 |
3 |
|
I am
looking for information about special programs |
8 |
9 |
|
I am
saving up money |
9 |
14 |
|
I
search ways to marry a foreign citizen |
1 |
4 |
|
I am
getting additional education, participating in the courses that will help me
find a job abroad |
2 |
2 |
|
I am
searching ( I am employed) for a job in a foreign company for further moving |
1 |
2 |
|
Other
(Doing nothing) |
20 |
16 |
|
Hard
to tell |
30 |
29 |
|
Do
you do anything to move now, or later? (close-ended question, any number of
answers , % of those who want to move) |
| |
Total |
Elementary, or lower, incomplete secondary education |
Secondary (school, technical college) |
Secondary special (college) |
Incomplete higher (not less than 3 years), higher |
|
I am
collecting information about the country where I want to move |
21 |
0 |
21 |
21 |
24 |
|
I get
advice from relatives and friends |
16 |
8 |
19 |
14 |
18 |
|
I am
learning a foreign language |
20 |
25 |
25 |
14 |
23 |
|
I am
searching for a job abroad |
8 |
17 |
4 |
10 |
8 |
|
I am
searching for an education program abroad |
3 |
0 |
4 |
0 |
5 |
|
I am
looking for information about special programs |
9 |
0 |
6 |
5 |
18 |
|
I am
saving up money |
14 |
8 |
6 |
21 |
15 |
|
I
search ways to marry a foreign citizen |
4 |
0 |
2 |
4 |
6 |
|
I am
getting additional education, participating in the courses that will help me
find a job abroad |
2 |
8 |
4 |
0 |
2 |
|
I am
searching ( I am employed) for a job in a foreign company for further moving |
2 |
8 |
4 |
0 |
2 |
|
Other
(Doing nothing) |
16 |
0 |
19 |
19 |
15 |
|
Hard
to tell |
29 |
42 |
33 |
26 |
27 |
WEST
EUROPE
219-43-8. Energy For All: EU Support For Developing
Countries
Flash
Eurobarometer 348
A.
Methodology
- Survey
conducted by telephone (fixed-line and mobile phone)
-
Fieldwork: 19 - 21 March 2012
-
Population: representative sample of population aged 15+
-
Coverage: 27 Member States of the EU
- Number
of interviews: 13,528
- This
survey was carried out for the European Commission (requested by
Directorate-General Development and Cooperation - EuropeAid (DG DEVCO) and
coordinated by Directorate-General for Communication (DG COMM “Research and
Speechwriting” Unit)).
Key
Findings
A majority
of respondents say that
when
people don’t have access To affordable energy in developing countries, this
causes the biggest Problems for cooking, preserving food (58%) and having access
To healthcare (52%).
77% of
Europeans think that the main future energy source for People in the developing
world should be renewable energy.
Few people advocate fossil energy (7%), nuclear energy (6%), or Biomass (4%).
90%
of
respondents believe that the eu should support Developing countries in their
efforts to improve access to Energy.
83%
believe
that the EU itself benefits from supporting developing Countries in this way
82% of
Europeans believe that the percentage of EU development Aid spent on improving
energy access should be higher than its Current level of 2%.
Having
access to safe drinking water and toilets is regarded As the most important
factor in overcoming poverty in Developping countries, followed by being able to
live in peace And security.
Out of the
factors that are important for development, Access to energy ranks the lowest
but still achieves Very high support: 95% of respondents think that it is
Important,
and among them 61% think it is very important.


219-43-9. The Charter of Fundamental Rights of The
European Union
Main
Findings
General
awareness of the Charter improved since 2007 …
• 64% have
heard of the Charter, this is an increase of 16 percentage points as compared to
2007. However, knowledge of the Charter is generally low across countries - with
Spain having the highest knowledge levels at 20%, and France the lowest at 3%.
•
In
contrast, most respondents think the Charter is legally binding (71%) – one
quarter thinks it is definitely legally binding, and almost half think it
probably is.
… But
precise knowledge of when the Charter does and does not apply is low. The
greatest confusion rests around whether the Charter applies to all actions of
Member States, including matters of national competence….
• Precise
knowledge of when the Charter does and does not apply is low. When given
specific scenarios only 14% of respondents are able to correctly identify in all
3 cases which are true and which are false.
• The
greatest confusion rests around whether the Charter applies to all actions of
Member States, including matters of national competence. The Charter does not
apply in all of these matters, but more than half - 55% - think that it does.
• In
addition, almost one quarter (24%) say that it is false that the Charter applies
to Member States only when they implement EU law, further highlighting this
confusion.
…EU
institutions are perceived as having the same redress function as a national
court
or independent bodies/ Ombudsmen when rights are violated…
•
Respondents were asked to imagine that their Charter rights had been violated,
and they wanted to make a complaint. They were then asked to identify the body
they would turn to first for help, and then any others they would turn to.
• When
asked where they would first turn to if their Charter rights are violated, 21%
responded local courts, closely followed by Ombudsmen/independent bodies (20%)
and EU institutions (19%).
•
Respondents who are aware of the Charter (47%) or state that they know what it
is (49%) are more likely to go to an EU institution when their rights are
violated compared to those who are not aware of the Charter (43%). This
illustrates the frequent misunderstanding on the role of EU institutions when
fundamental rights are violated.
… there
is a general interest in receiving more information that would help citizens
enforce
their rights.
•
Respondents are interested in receiving more information about various aspects
of the Charter. At least six out of ten would like to know more about their
Charter rights, where to go to if their rights are violated, and when the
Charter applies. Fewer express an interest in learning more about the historical
and political context of the Charter, but still 45% would like to know more
about this.
219-43-10. UK: Energy Profits: Consumers Not Happy
April 12 2012
UK consumers discontent: 84% agree
that energy suppliers maximise profits at expense of customers
Recent
research from a report
by YouGov SixthSense has found that over eight in ten (84%) UK
consumers agree that energy suppliers maximise profits at the expense of
customers. And over half of consumers (59%) agree with the statement ‘energy
suppliers treat people with contempt’.
o
In
reaction to the February 2012 price cuts, 56% of UK consumers agreed with the
statement ‘It’s about time – the energy companies make too much profit'
o
Compared
to only 12% of consumers who are very relieved that their bills will drop
o
16% of
consumers feel it will not make real difference as the drop is too small to have
any real impact
o
However,
one in five consumers (22%) say they have difficulty paying their energy bills,
just under a third of UK consumer (31%) have made cutbacks to pay their bills
and over a third (34%) say that their house feels cold
Commenting
on the findings YouGov SixthSense Research Director James McCoy says: ‘The
strength and negativity of feeling regarding the energy companies’ profits is
clearly demonstrated. The findings suggest that many people are more outraged by
the profits being made than by their actual energy bill.’
219-43-11. German Firms Deeply Unhappy With Hungary
Policy Drift-Survey
Apr 16, 2012
* Two-thirds of foreign firms "strongly
dissatisfied" with econ policy-survey
* Hungary slips to 10th place from 4th among CEE investment destinations
* 29 percent of companies would choose to invest elsewhere
BUDAPEST, April 16 (Reuters) - Two thirds of German and Austrian companies in
Hungary are "strongly dissatisfied" with government economic policy and its
rating as a destination for investment has slumped, a survey showed on Monday.
The poll by the German Chamber of Commerce in Hungary showed that overall 87
percent of investors were discontented with two years of aggressive government
policymaking which has slapped huge windfall taxes on several sectors.
Germany has been the biggest
source of foreign investment in Hungary's export-driven economy, now on the
brink of recession, and the country is striving to keep money flowing in as a
legal row with Brussels blocks the start of talks on financing from the IMF and
European Union.
The survey showed that Hungary has slipped back to 10th place on the regional
list of German companies' favourite investment destinations, from a ranking of
fourth only a year ago.
"Practically, none of the (200) participants expressed satisfaction," the
Chamber said in its report. "All business branches share this view, with minor
deviations."
Prime Minister Viktor Orban's conservative government has implemented the EU's
biggest bank levy, windfall crisis taxes on the telecoms, retail and energy
sectors, and a $13 billion nationalization of private pension assets.
A scheme which allowed foreign currency borrowers to repay their mortgages at
exchange rates well below market rates has also caused huge losses to banks,
stifling lending.
The sectors most hit are dominantly foreign-owned.
The German Chamber said about a quarter of the participants in its survey were
from European countries other than Germany, mostly Austria, and they shared the
opinion of German firms.
The Chamber added that the crisis taxes contributed to a 14 percent fall in
investments in the telecoms sector, and an 18 percent drop in investments in the
financial sectors last year.
The automotive industry has not been hit by windfall taxes, and a new 800
million euro factory by Daimler may even help Hungary avoid recession this year.
That came on top of a plant expansion by Audi.
In the survey 71 percent of companies said they would again choose Hungary's as
an investment target, down from 83 percent in 2011, but a record high 29 percent
said they would go to a different country. In the previous survey only 17
percent said they would go elsewhere.
This does not mean that these firms plan to leave the country in the short term
but "is a warning sign... showing that new and new efforts are needed to keep
the country attractive," the Chamber said.
68 percent of participants said Hungary's economic situation was "bad", compared
with 44 percent in 2011.
219-43-12. Sarkozy's Comeback Hopes Crumble, Polls Show
(Reuters) - French President Nicolas Sarkozy
defended his economic record on Friday as a slew of opinion polls suggested his
prospects of re-election were crumbling just over a week from round one of a
vote where Socialist Francois Hollande is the clear frontrunner.
Four polls published in less than 24 hours showed Hollande extending his lead,
with the conservative incumbent's modest gains of the past month starting to
evaporate ahead of a two-round contest taking place on April 22 and May 6.
A CSA poll showed Hollande winning the May 6 run-off with 57 percent of the
vote. Three other polls also indicated that his chances of becoming France's
first left-wing president since Francois Mitterrand were improving.
Sarkozy maintained that he had helped France weather
economic crisis over the past four years far better than countries such as
Greece or Spain, and he renewed warnings of market turmoil if Hollande won
power.
"What fires up the financial markets and speculation is when a country does not
repay its debts, reneges on its commitments and embarks on a path of
ill-considered spending," Sarkozy told TV news channel i>TELE.
"Mr. Hollande, by promising to raise spending without any commitment to
cutbacks, is setting the stage for a confidence problem (in financial markets),"
he said.
Hollande, who says he can slash the public deficit but also promote jobs and
education as he hikes tax on the rich, stuck to his line in three newspaper
interviews published on Friday. He said austerity would be self-defeating if not
accompanied by efforts to promote economic growth in France and Europe.
"This I say clearly: financial markets will not lay down the law in France," he
told the business weekly La Tribune.
CHANGE OF DIRECTION IN EUROPE
Hollande has raised eyebrows in Berlin and other capitals by criticizing a
European Union accord on debt and deficit control - the fiscal compact agreed in
an effort to counter the euro
zone debt crisis - and by saying
he would open talks if elected to amend it with a pro-growth commitment.
"Germany understands
that it cannot remain an island of prosperity in an ocean of recession," he told
Les Echos daily. "The changeover in France will pave the way for a change of
direction in Europe."
The CSA poll showed Hollande taking 57 percent of the vote in the final deciding
round, up from a score of 54 previously.
The other three promising polls for Hollande were published by the BVA, LH2 and
TNS Sofres agencies on Thursday.
The BVA poll showed Hollande winning the runoff with a score of 54 percent, up
two points from a previous sounding. The LH2 poll showed him taking 55 percent
of the vote in the second round. The TNS Sofres poll showed him at 56 percent,
up 1 point.
Sarkozy, who launched his campaign in mid-February, enjoyed a rise in the polls
during mid-to-late March and even overtook his Socialist rival in many poll
estimates of first-round voting scores, although not a single poll in the past
year has shown Hollande losing the second round.
Some analysts and commentators had predicted that a spate of killings by an al
Qaeda-inspired gunman in mid-March would make security fears overshadow economic
concerns as the focus of the campaign, playing to Sarkozy's strengths.
The picture now emerging suggests that whatever gains Sarkozy enjoyed at that
time were short-lived. His first-round score in the TNS Sofres poll dropped 3
points to 26.
But he showed no sign of relenting, telling i>TELE: "Polls and journalists don't
make elections. Voters do."
219-43-13. Economic Confidence Falls to Single Digits in
Britain
(04/11/12) -
By a
4-to-1 margin, respondents are more likely to expect a decline in economic
conditions than an improvement.
People in
Britain are particularly downtrodden about the country’s current financial
standing, a new Angus Reid Public Opinion poll has found.
In the
online survey of a representative sample of 2,231 British adults, only
one-in-ten respondents (9%) rate the economic conditions in the United Kingdom
today as “very good” or “good.” Just over a third of Britons (35%) believe their
own personal finances are in “very good” or “good” shape.
When asked
about the prospects for the UK economy in the next six months, two-in-five
respondents (40%) foresee a decline, while only nine per cent expect to see an
improvement. People in Scotland (5%) and Midlands and Wales (6%) are
particularly despondent in their assessment of the future.
The low
level of economic confidence is accompanied by specific concerns, with 40 per
cent of respondents saying they have worried “frequently” or “occasionally”
about themselves or somebody in their household becoming unemployed, and 30 per
cent feeling anxiety over being able to pay their mortgage or rent.
Inflation
fears are also playing a role in the perceptions of the future, with 92 per cent
of Britons thinking the price of petrol will go up in the next six months, and
87 per cent forecasting more expensive groceries.
Methodology: From April 2 to April 3, 2012, Angus Reid Public Opinion conducted
an online survey among 2,231 randomly selected British adults who are
Springboard UK panelists. The margin of error—which measures sampling
variability—is +/- 2.2%. The results have been statistically weighted according
to the most current education, age, gender and region data to ensure samples
representative of the entire adult population of Great Britain. Discrepancies in
or between totals are due to rounding.
NORTH
AMERICA
219-43-14. Americans Favor "Buffett Rule" by 60% to 37%
Majorities of Democrats, independents in favor; Republicans opposed
April 13,
2012
PRINCETON, NJ -- Six in 10 Americans favor Congress' passing the so-called
"Buffett Rule," which would mandate a minimum 30% tax rate for Americans with a
household income of $1 million or more per year. Majorities of both Democrats
and independents favor the policy, while a majority of Republicans oppose it.
President Barack Obama has pushed this tax policy in recent appearances, and the
U.S. Senate may vote on it next week. Few observers believe it has a chance of
passing the Republican-controlled House to become law before the end of the
year.
The proposed legislation was informally dubbed the "Buffett Rule" after
billionaire investor Warren Buffett asserted that he should not be allowed to
pay a lower tax rate than his secretary. Gallup's question about the proposal,
included in its April 9-12 Economy and Personal Finance survey, asked if
"households earning $1 million a year or more" should pay a minimum of 30% of
their income in taxes. The actual law the Senate will vote on would include more
complex "phase in" clauses for those making between $1 and $2 million per year.
Given President Obama's persistent emphasis this year on the need to increase
taxes on higher-income Americans, and his adoption of a "fair share, fair shot,
equal playing rules" campaign theme, it is not surprising to see that Democrats
favor the Buffett Rule by almost a three-to-one ratio. More than six in 10
independents, a critically important group in an election year, favor the law.
Republicans oppose the law by an 11-point margin, with 54% against and 43% in
favor.
Americans in general say that the distribution of money and wealth in this
country is not fair, and thatmoney
and wealth should be more evenly distributed. Plus, 59% of Americans last
year agreed that households making $250,000 or more per year should
pay higher taxes. The current results reinforce these findings and
underscore the now well-documented conclusion that Americans in general support
various proposals for increasing taxes on higher-income Americans.
Gallup's surveys do not allow the isolation of the very few respondents who
might actually themselves make $1 million per year or more, but the more limited
income categories that are defined show little variation in response to the
Buffett Rule by income. A majority (55%) of those making $100,000 or more in
annual household income favor the Buffett Rule, similar to the level of support
from lower-income Americans.
Implications
Republican politicians oppose the Buffett Rule, and there is little possibility
that it will become law this year. President Obama's intense focus on the policy
and his emphasis on bringing it to a vote in Congress is thus mostly a symbolic
gesture -- underscoring his general presidential campaign themes this year. An
emphasis on millionaires paying higher taxes also helps position the Obama
presidential campaign against his very rich GOP opponent, Mitt Romney.
Perhaps more importantly than the fate of this one policy proposal, the
expiration of the Bush tax cuts at the end of this year means that unless
something is done, taxes will go up for many American taxpayers. Obama is on
record as saying he would let the tax cuts expire for those households making
$250,000 a year and up, but would keep them in place for all others.
Although the public agrees with the idea of increasing taxes on the rich, this
does not appear to be Americans' highest priority. Gallup's April measure of the
most important problem facing the country shows that Americans cite the economy,
jobs, dissatisfaction with government, and the deficit as the top problems,
while very few (1%) mention the gap between the rich and the poor as the top
problem. Previous Gallup research has also shown that Americans
rate reducing the income and wealth gapbetween the rich and the poor as a
lower priority than growing the economy more generally and increasing economic
opportunity.
Survey Methods
Results for this Gallup poll are based on telephone interviews conducted April
9-12, 2012, with a random sample of 1,016 adults, aged 18 and older, living in
all 50 U.S. states and the District of Columbia.
For results based on the total sample of national adults, one can say with 95%
confidence that the maximum margin of sampling error is ±4 percentage points.
Interviews are conducted with respondents on landline telephones and cellular
phones, with interviews conducted in Spanish for respondents who are primarily
Spanish-speaking. Each sample includes a minimum quota of 400 cell phone
respondents and 600 landline respondents per 1,000 national adults, with
additional minimum quotas among landline respondents by region. Landline
telephone numbers are chosen at random among listed telephone numbers. Cell
phone numbers are selected using random-digit-dial methods. Landline respondents
are chosen at random within each household on the basis of which member had the
most recent birthday.
Samples are weighted by gender, age, race, Hispanic ethnicity, education,
region, adults in the household, and phone status (cell phone only/landline
only/both, cell phone mostly, and having an unlisted landline number).
Demographic weighting targets are based on the March 2011 Current Population
Survey figures for the aged 18 and older non-institutionalized population living
in U.S. telephone households. All reported margins of sampling error include the
computed design effects for weighting and sample design.
In addition to sampling error, question wording and practical difficulties in
conducting surveys can introduce error or bias into the findings of public
opinion polls.
219-43-15. Americans Split on Whether China's Economy Is
Good for U.S.
Trade imbalance seen as a major barrier to strong U.S.-China relations
April 12,
2012
This is the second article in a three-part series about Americans'
perceptions of China and U.S.-China relations.
WASHINGTON, D.C. -- Many
Americans say the U.S. and China should cooperate more on economic
and energy issues; however they are divided on whether China's growing economy
is a good thing or a bad thing for the U.S., according to a Gallup-China
Daily USA study conducted in
November and December 2011. U.S. opinion leaders are more likely than the
American public to think China's burgeoning economy is good for the U.S., at 61%
and 45%, respectively.
Americans, Opinion Leaders Uncertain About the Benefit of Chinese
Investment
Americans and opinion leaders are uncertain about the impact of Chinese
investment on the U.S. job market. Nearly one in four U.S. adults (23%) and 30%
of opinion leaders agree with the statement that Chinese investment in the U.S.
brings growth and jobs. About one-third of both groups disagree.
Chinese investment in American businesses topped $5 billion in 2010 and recent
indications from China's commerce minister, Chen Deming, indicated the number
would be much higher if the U.S. would allow it. Minister Chen also strongly
encouraged the United States to ease restrictions on sending exports to China in
order to address the $200 million trade imbalance in favor of China. The U.S.
has expressed concern about a number of trade and economic issues, including
intellectual property rights and market access restrictions that have, thus far,
led to more limited trade between the two countries.
Two-thirds of U.S. adults say the trade imbalance between the U.S. and China is
a major barrier to strong relations between the two countries, according to the
Gallup-China Daily USA study. Opinion leaders are even more likely, at 78%, to
hold this view. Roughly one-fifth of each group perceives the trade imbalance as
a minor barrier.
Americans Are Lukewarm on the Quality of Chinese Goods
U.S. opinion leaders are more likely than the American public to hold positive
views about the quality of goods made in China. About half of opinion leaders
rate the quality of Chinese goods as either "good" (41%) or "very good" (12%)
and just under half say they are either "only fair" (41%) or "poor" (11%). Views
of the American public are somewhat more negative with four in 10 expressing
positive views and 58% expressing negative views about the quality of goods made
in China.
China's currency policy has provoked quite a bit of criticism for its perceived
negative impact on the global economy. About four in 10 Americans (42%) and 48%
of U.S. opinion leaders agree that China's currency is a major contributing
factor to the U.S. economic situation. Far fewer in either group disagree -- 17%
of U.S. adults and 24% of opinion leaders. The rest, totaling 41% of Americans
and 28% of opinion leaders are neutral or say they "don't know" what kind of
effect China's currency has on the U.S. economy.
Implications
China and the U.S. are major trade partners and represent the two largest
national economies in the world. While the American public and U.S. opinion
leaders want more cooperation between the two countries on economic and energy
issues, they have different views about the effect of a strong Chinese economy
on the U.S. The majority of opinion leaders, compared with less than half of
U.S. adults, believe China's growing economy is beneficial to the U.S. Opinion
leaders are also more likely than U.S. adults to agree that Chinese investment
in the U.S. contributes to U.S. job growth, although the majority of both groups
are skeptical on this measure. China's leadership has indicated a desire to
invest more in American business, while also encouraging the U.S. to export more
freely to China. The already substantive trade partnership between these two
countries is likely to swell significantly if U.S. policymakers move in this
direction; however resolution is needed on a number of key trade issues before
this would happen.
Survey Methods
In the first wave of a new research partnership between China Daily USA and
Gallup, 2,007 Americans were interviewed in English only from Nov. 30-Dec. 18,
2011.Gallup surveyed a random sample of adults, aged 18 and older, residing in
landline-telephone households, cell phone-only households, and cell phone-user
households. The data set was statistically adjusted (weighted) using the
following variables: race/ethnicity, gender, education, and age as defined by
the most recent data from the Current Population Survey, conducted by the U.S.
Census Bureau. The final overall results are representative of the U.S. adult
population. For results based on the total sample size of 2,007 adults, one can
say with 95% confidence that the margin of error attributable to sampling and
other random effects is ±2.68 percentage points.
The opinion leader survey included a non-probability sample 250 opinion leaders,
drawn from the ranks of business executives (n=50), government officials (n=50),
think tank leaders (n=50), university faculty (n=50), and the media (n=50). The
opinion leaders sample was collected from Dec. 1-22, 2011.
In addition to sampling error, question wording and practical difficulties in
conducting surveys can introduce error or bias into the findings of public
opinion polls. Click here to
learn more about China Daily USA.
219-43-16. Romney's Challenge: Midwestern, Young, Highly
Religious GOP
He also does less well among conservatives
April 12,
2012
PRINCETON, NJ -- As Mitt Romney pivots his campaign to the general election, he
faces the challenge of building enthusiasm and, hence, turnout among certain key
groups of Republicans among whom he has done less well during the primary
contests so far. These include Midwestern, young, highly religious, and
conservative Republicans.
The data in the accompanying table show Romney's relative positioning among
Republican subgroups as of April 2-8, the final full week of Gallup
Daily tracking of the GOP race. During this time, Romney held a 41% to 25%
advantage over Santorum among all
Republican voters.
Midwesterners
Romney ended up doing well among Republicans in all regions of the country
except the Midwest, where he just managed to tie Santorum at 32% support each in
Gallup's final weekly summary.
The Midwest contains a number of the key swing states that will be pivotal in
the coming general election, including Iowa, Michigan, Ohio, and Wisconsin.
Romney lost the Iowa caucuses by a very small margin to Santorum, and won,
albeit by margins of one to seven percentage points, in Michigan, Ohio, and
Wisconsin.
Romney's relative lack of strength among Midwestern Republicans suggests this
region may present a challenge in terms of motivation and turnout for his
campaign in the general election.
The Young
Romney has a significant problem among younger Republican voters, who up through
last week were almost as likely to support Ron Paul as Romney. Romney's support
among 18- to 34-year-old Republicans was 30%, Paul's was 27%, and Santorum's,
15%. This is the only subgroup in which Paul was a major contender. Romney led
among 35- to 54-year-olds by nine points, and by 22 points among Republicans 55
and older.
Neither Paul nor Romney is a young candidate; Romney is 65 and Paul is 76. But,
despite his advanced age, Paul has captured, and apparently continues to
capture, the hearts and minds of young Republicans across the country. Santorum
is the youngest of the four GOP candidates, at 53, but his failure to do well
among young voters underscores the finding that the actual age of a candidate
does not appear to be the deciding factor when it comes to young Republicans'
allegiance.
Paul continues to campaign for the GOP nomination, making it unlikely that
Romney will get his endorsement anytime soon -- if ever. It's also possible that
Paul will run as a third-party candidate. It's unclear how much of Paul's
unusual appeal to young Republicans would transfer to Romney even if Paul did
exit the race.
Young voters overall tend to identify more strongly with the Democratic Party
than the Republican Party, so it is highly likely that they will break for Obama
in the general election. Romney's challenge is to capture some of the enthusiasm
young Republican voters have for Paul in an attempt to blunt Obama's strength
among this group. Romney's demonstrated lack of appeal to younger Republicans in
the primary season suggests this may be difficult.
Conservatives
Romney had an eight-point lead over Santorum last week among conservatives, well
below the 31-point lead he had among moderate and liberal Republicans. The fact
that Romney leads at all among conservatives is significant. At his worst, in
mid-February, Romney was losing by 18 points to Santorum among conservatives.
When Gallup started Daily tracking of the race in early December, Romney was
losing to Gingrich by 20 points among conservatives.
The Highly Religious
Santorum consistently did well among highly religious Republican voters
throughout his primary campaign, exemplified by his victories over Romney in
Southern states with high concentrations of evangelical Republicans, and by his
relative strength among these voters in Gallup's tracking of national Republican
sentiment over the last two months.
In Gallup's April 2-8 weekly average, Romney was marginally ahead of Santorum
among Republicans who attend church weekly, by 39% to 33%. Among Republicans who
attend church almost every week or monthly, Romney led by 19 points, and among
those who seldom or never attend church, Romney was ahead by 25 points.
Still, Romney's six-point margin over Santorum among weekly churchgoing
Republicans was Romney's largest since late January, a time when Santorum had
only 16% support overall.
Highly religious Republicans have clearly been looking for a candidate who will
specifically and directly address their concerns about social, family, and
values issues. Although weekly churchgoing Republicans disproportionately
favored Santorum -- compared with Republicans who attend church less often --
Romney wound up with a modest edge among this group as the nomination contest
ended. The key challenge for Romney will be capturing at least some of the same
type of motivation and turnout among this group that was generated by his
erstwhile competitor, Santorum.
Bottom Line
Romney, now the almost-certain Republican presidential nominee, is turning his
attention to the general election fight against President Barack Obama. The
success of his campaign will hinge on Romney's ability to attract the vote of
certain groups of key swing voters, mainly independents, and his ability to
generate enthusiasm and, hence, turnout among Republicans and Republican-leaning
independent voters.
Gallup's final week of interviewing Republicans nationally shows that among
Republicans, Romney has less than a 10-point margin over his nearest GOP
competitor among:
·
Midwestern
Republicans
·
young
Republicans (18 to 34) and, to a lesser degree, 35- to 54-year-olds
·
highly
religious Republicans
·
conservative Republicans
These will be the key subgroups of his GOP base among whom Romney will need to
shore up support and create enthusiasm and, hence, turnout.
Still, Romney has quite solid support among older Republicans (55+) -- which
carries with it a tactical advantage since this group reliably turns out to vote
in high numbers. Romney also enjoys strong support among Republicans living in
regions other than the Midwest, liberal and moderate Republicans, and those who
are less religious.
Track every angle of the presidential race on Gallup.com's
Election 2012 page.
Sign up to
get Election 2012 news stories from Gallup as soon as they are published.
Survey Methods
Results for this Gallup poll are based on telephone interviews conducted April
2-8, 2012, on the Gallup Daily tracking survey, with a random sample of 1,440
Republicans and Republican-leaning independents, aged 18 and older, living in
all 50 U.S. states and the District of Columbia, who are registered to vote.
For results based on the total sample of Republican registered voters, one can
say with 95% confidence that the maximum margin of sampling error is ±4
percentage points.
Interviews are conducted with respondents on landline telephones and cellular
phones, with interviews conducted in Spanish for respondents who are primarily
Spanish-speaking. Each sample includes a minimum quota of 400 cell phone
respondents and 600 landline respondents per 1,000 national adults, with
additional minimum quotas among landline respondents by region. Landline
telephone numbers are chosen at random among listed telephone numbers. Cell
phone numbers are selected using random-digit-dial methods. Landline respondents
are chosen at random within each household on the basis of which member had the
most recent birthday.
Samples are weighted by gender, age, race, Hispanic ethnicity, education,
region, adults in the household, and phone status (cell phone only/landline
only/both, cell phone mostly, and having an unlisted landline number).
Demographic weighting targets are based on the March 2011 Current Population
Survey figures for the aged 18 and older non-institutionalized population living
in U.S. telephone households. All reported margins of sampling error include the
computed design effects for weighting and sample design.
In addition to sampling error, question wording and practical difficulties in
conducting surveys can introduce error or bias into the findings of public
opinion polls.
219-43-17. In U.S., Economic Indicators Signal Positive
Momentum
Gallup economic metrics hit recent highs in March, and are holding steady in
April
April 11,
2012
PRINCETON, NJ -- Gallup's key U.S. economic indicators tell a consistent story
of improving economic and behavioral conditions. Americans' self-reported employment
status, personal spending,
andworkplace hiring trends were all
better in March than in February, and were improved over March 2011, although
still below pre-recession levels. In addition, Americans' ratings
of the U.S. economy were at a
four-year high. However, that was prior to last week's disappointing Bureau of
Labor Statistics jobs report and Wall Street's latest downturn. Those events
could spark another reversal like so many others that have occurred since 2009,
but thus far, Gallup indicators suggest otherwise.
All of Gallup's economic indicators -- except economic confidence, which receded
slightly -- improved further in the first week of April, based on interviewing
ending April 8. Gallup Daily tracking in the coming days will reveal whether
consumers' confidence in the economy and willingness to spend have been rattled
by the more recent economic news. In the meantime, it is clear that prior to
now, Gallup's economic metrics have all been pointing in a positive direction.
Employment Slowly Headed in Right Direction
Gallup measures the national labor situation in two ways. One is a direct
measure of U.S. adults' employment status, producing Gallup's national unemployment
and underemployment rates. The second is based on employed Americans'
characterization of whether their workplace is adding or shedding jobs,
summarized in Gallup's Job
Creation Index.
Since the inception of Gallup's unemployment metric in January 2010,
unemployment has been descending at a slow rate from the initial 10.9%, while
workers' reports of net hiring have been inching up. Gallup's measures of unemployment and job
creation improved in March after
deteriorating in February, and are now slightly better than where they stood in
January. They are also significantly higher than they were a year ago, in March
2011.
Both measures show continued positive momentum in early April, with the Job
Creation Index rising
to +20 in Gallup's latest weekly
average, from April 2-8, and unemployment dipping
to 8.2% in Gallup's latest 30-day
average through April 8.
Consumers Loosening Their Wallets
Americans' self-reporting of their own discretionary spending was $74 per day in
March, up from $64 a year ago and the highest Gallup has recorded for March in
four years. It is also near the highest spending for any month since the end of
2008. Still, consumer spending is well short of where it was in 2008, prior to
the Wall Street financial crisis, indicating that consumers are still in a
recovery phase.
Gallup's consumer spending measure is not seasonally adjusted, and spending does
vary to some extent by month, particularly through the holiday season, when it
jumps higher. Thus, year-over-year monthly comparisons are a meaningful
indicator of real changes in spending.
Importantly, the $10-per-day average increase in consumer spending between March
2011 and March 2012 is the largest same-month increase Gallup has recorded since
establishing this measure in January 2008. However, there was a brief period in
mid-2010 when same-month spending rose each month by $6 to $9 per day, and
Gallup documented consistent $5 to $7 increases in the summer and fall of 2011.
Economic Confidence Plateaus at Improved Level
The past 15 months have been volatile for Americans' confidence in the economy.
Confidence started off relatively high in January 2011, spiked in May after the
killing of Osama bin Laden, then descended to near-record lows in the summer
amid the debt ceiling political crisis and related shocks to Wall Street. It has
since shown slow but steady improvement, and in March built on those gains to
reach -20, the highest monthly average for the index in over four years.
Still, confidence is now at a level that has proved a barrier in recent years.
And perhaps consistent with that, confidence receded in the first week of April
to -23, rather than advancing further. This may partly reflect the March BLS
jobs report, released on April 6, and recent turmoil in the stock market, so it
will be important to see how this indicator performs throughout the month.
As an aside, a
recent Gallup analysis finds that
President Barack Obama's overall job approval rating has been closely linked
with Americans' confidence in the economy in recent months. Thus, his ability to
reach 50% approval may depend on whether Gallup's Economic Confidence Index
rises just a bit further, to perhaps -16 to -13.
Bottom Line
The rate of U.S. economic growth in the coming months could largely be
determined by the pace of gains in the labor market. This may depend on
increases in consumer spending, which in turn could be influenced by workers'
perceptions of their job security and consumers' broader confidence in the
economy.
Gallup indicators touching on all four factors remain weak in absolute terms,
and in many cases remain below pre-recession levels, but were at post-recession
highs in March after several months of steady improvement. And the early
indications from April are that, with the exception of economic confidence,
these improved readings are largely holding.
With consumers still fragile from the recent recession, any significant economic
setback -- such as with unemployment, the stock market, or gas prices -- could
cause another rapid reversal in confidence and spending. However, barring that,
Gallup's economic metrics appear poised to finally make a significant break from
their post-recession lows.
219-43-18.Americans Endorse Various Energy, Environment
Proposals
Republicans and Democrats show substantially differing levels of support
April 9,
2012
PRINCETON, NJ -- Americans as a whole favor a wide-ranging set of proposals for
dealing with the nation's energy and environment situations, but support varies
markedly across party lines. Republicans are more likely than Democrats to favor
opening up federal lands for drilling, and expanding the use of nuclear energy.
Democrats are more likely to favor each of six different proposals, including
emissions-control measures, spending government money on alternative sources of
energy, and increasing enforcement of environmental regulations.
Gallup tested these eight proposals in its March 8-11, 2012, Environment poll. A
major takeaway is that Americans generally appear to "want it all." At least a
majority, and in many instances, significant majorities, of Americans say they
favor each proposal. Support ranges from the 52% who favor increased use of
nuclear energy to the 70% who favor setting higher emissions standards for
business and industry.
Gallup finds sizable partisan gaps in support of the proposals, ranging between
23 and 35 percentage points. However, expanding the use of nuclear power is the
only proposal that significantly less than half of either party group (in this
case, Democrats) says it supports.
Support for Many Proposals Down Since 2007
Gallup has tracked seven of the eight proposals periodically since 2001. Support
for all but nuclear energy has declined since last measured in 2007, with the
largest drops seen for spending government money to develop alternative sources
of fuel for automobiles, strengthening enforcement of environmental regulations,
and setting higher auto emissions standards.
These declines could be due to Americans' reduced priority in the last several
years for preserving
the environment at the expense of economic growth, an outgrowth of the
economic downturn. However, they are also likely to stem from heightened public
concern about government spending and regulations specifically, particularly
among Republicans.
For example, Democrats' support for spending government dollars to develop
alternative fuel for automobiles remains above 80% in 2012, as it was in 2007.
However, Republicans' support has fallen to 51% today from 84% in 2007,
resulting in a 20-percentage-point overall drop in public support for the
proposal over the same period.
In similar fashion, Republicans have grown significantly less supportive of more
strongly enforcing federal environmental regulations (47% today vs. 74% in
2007), while Democrats' support has fallen less sharply (80% today vs. 92% in
2007).
At the same time, partisan support for increased use of nuclear energy has not
changed over the past five years, and the 52% of all national adults who favor
it today is essentially the same as the 50% who favored it in 2007.
Bottom Line
President Obama recently said: "We've got to invest in a sustained,
all-of-the-above strategy that develops every available source of energy."
Americans as a whole do support increased drilling on federal lands and the
development of alternative energy sources -- and a slight majority support
increased use of nuclear power.
Americans also support a list of other proposals to help the environment,
including higher emissions standards for business and industry, and more
controls on carbon dioxide emissions.
But the economic problems of the last several years have had a modest impact on
these attitudes, with support for most of the proposals down from 2007, when
Gallup last measured them. And, Gallup trends show that, apart from attitudes
about nuclear power, Republicans' and Democrats' views on these issues have
grown more polarized over the past four years, mirroring the contentious nature
of recent policy discussions in Washington over energy and the environment.
Survey Methods
Results for this Gallup poll are based on telephone interviews conducted March
8-11, 2012, with a random sample of 1,024 adults, aged 18 and older, living in
all 50 U.S. states and the District of Columbia.
For results based on the total sample of national adults, one can say with 95%
confidence that the maximum margin of sampling error is ±4 percentage points.
Interviews are conducted with respondents on landline telephones and cellular
phones, with interviews conducted in Spanish for respondents who are primarily
Spanish-speaking. Each sample includes a minimum quota of 400 cell phone
respondents and 600 landline respondents per 1,000 national adults, with
additional minimum quotas among landline respondents by region. Landline
telephone numbers are chosen at random among listed telephone numbers. Cell
phone numbers are selected using random-digit-dial methods. Landline respondents
are chosen at random within each household on the basis of which member had the
most recent birthday.
Samples are weighted by gender, age, race, Hispanic ethnicity, education,
region, adults in the household, and phone status (cell phone only/landline
only/both, cell phone mostly, and having an unlisted landline number).
Demographic weighting targets are based on the March 2011 Current Population
Survey figures for the aged 18 and older non-institutionalized population living
in U.S. telephone households. All reported margins of sampling error include the
computed design effects for weighting and sample design.
219-43-19. Obama's Monthly Job Approval Edges Higher in
March
Approval high among core supporters; still lags with Hispanics, low-income
adults
April 9,
2012
PRINCETON, NJ -- President Barack Obama's job approval rating averaged 46% in
March, up from 45% in January and February, and significantly improved over his
term-low 41% monthly averages recorded last summer and fall.
Obama's rating in Gallup's three-day rolling averages in April have become even
more positive, includingthe
president's first rating of 50% in nearly a year on
Friday. It remains to be seen, however, whether his support will remain at that
level for any length of time. Obama has not averaged 50% approval for a full
month since last May, after the death of Osama bin Laden, and prior to that, not
since February 2010.
Despite the broad changes in President Obama's overall job approval rating since
he became president, certain subgroups of the population have consistently rated
him better than others, and these patterns continued in March. Blacks,
Hispanics, women, 18- to 29-year-olds, Easterners, postgraduates, Americans
earning less than $24,000 per year, and those who don't regularly attend a place
of worship all show higher support for Obama than their counterparts.
Additionally, most Democrats and liberals approve of Obama's job performance, as
do the slight majority of moderates. His approval rating ranges from 86% among
liberal Democrats to 8% among conservative Republicans, with 33% of pure
independents in the center of the political spectrum approving.
Relative Support From Hispanics, Low-Income Americans Still Reduced
Obama's overall job approval ratings among his core support groups have followed
mostly the same pattern as his overall rating since January 2009, and have thus
stayed consistently above his overall approval rating by about the same margin
from month to month. However, Gallup trends document a narrowing of his
advantage among Hispanics.
The 55% of Hispanics approving of Obama in March was nine percentage points
above the national average, and that gap is typical for Hispanics' approval
relative to the national average over the past year. Prior to that, however,
Hispanics' approval was routinely between 10 and 20 points above average.
By contrast, for most of Obama's presidency, whites' approval has consistently
been about eight or nine points below the national average, and blacks' approval
has been about 40 points above it.
Thus, as Obama's overall approval rating from Americans declined from the 50s
and 60s in his first year to the mid- to high 40s in his second year, and into
the low to mid-40s in his third year, his
support from Hispanics fell at a steeper rate than
was seen among whites or blacks.
A similar pattern is seen among Americans making less than $24,000 per year.
They continue to give Obama the highest approval ratings of any income group;
however, the difference between low-income Americans' approval and everyone
else's narrowed in 2010 and early 2011, although it has since widened somewhat.
Americans with college degrees, including those with postgraduate education,
continue to rate Obama a bit higher than those with some or no college
education. At the same time, however, this education gap has widened slightly
during his presidency. This separation of the two groups' approval ratings
reflects relative improvement over time among those with a college degree and a
slight relative drop among those without a degree.
In March, his approval rating among the combined college graduate group was five
points above his national average approval rating, while college nongraduates'
approval was two points below it.
Bottom Line
President Obama's average monthly job approval rating has been inching up since
last fall, rising from 41% in October to 45% in January, and reaching 46% in
March. As his approval rating has expanded, and despite the variety of issues
that have emerged at different times during his presidency, most of the
demographic patterns of support for Obama seen at the outset of his presidency
remain fixed. Groups that are above average in support for the president have
stayed at roughly the same level above his overall approval rating from month to
month, and those below average have also stayed roughly the same distance below
his overall rating.
Hispanics, however, have shown a disproportionate decline in support for Obama,
and the gap in his higher approval rating between low-income and less
well-educated Americans and these groups' counterparts has grown.
Obama's re-election chances depend to a significant degree on his ability to
increase his overall approval rating to the majority level, and this in turn
will depend in part on his ability to maintain or increase support among
Hispanics and among those with lower socioeconomic status.
Explore President Obama's approval ratings in depth and compare them with
those of past presidents in the Gallup
Presidential Job Approval Center.
Survey Methods
Results are based on telephone interviews conducted as part of Gallup Daily
tracking March 1-31, 2012, with a random sample of 16,037 adults, aged 18 and
older, living in all 50 U.S. states and the District of Columbia.
For results based on the total sample of national adults, one can say with 95%
confidence that the maximum margin of sampling error is ±1 percentage point.
Interviews are conducted with respondents on landline telephones and cellular
phones, with interviews conducted in Spanish for respondents who are primarily
Spanish-speaking. Each sample includes a minimum quota of 400 cell phone
respondents and 600 landline respondents per 1,000 national adults, with
additional minimum quotas among landline respondents by region. Landline
telephone numbers are chosen at random among listed telephone numbers. Cell
phone numbers are selected using random-digit-dial methods. Landline respondents
are chosen at random within each household on the basis of which member had the
most recent birthday.
Samples are weighted by gender, age, race, Hispanic ethnicity, education,
region, adults in the household, and phone status (cell phone only/landline
only/both, cell phone mostly, and having an unlisted landline number).
Demographic weighting targets are based on the March 2011 Current Population
Survey figures for the aged 18 and older non-institutionalized population living
in U.S. telephone households. All reported margins of sampling error include the
computed design effects for weighting and sample design.
The questions reported here were asked of a random half-sample of respondents
for 31 nights on the Gallup Daily tracking survey.
In addition to sampling error, question wording and practical difficulties in
conducting surveys can introduce error or bias into the findings of public
opinion polls.
219-43-20. Worry About U.S. Water, Air Pollution at
Historical Lows
Americans' concerns about environmental threats remain lower than in the past
April 13,
2012
PRINCETON, NJ -- Americans currently express record-low concern about both air
pollution and pollution of drinking water. Thirty-six percent say they worry a
great deal about air pollution and 48% about pollution of drinking water. Both
figures are down more than 20 percentage points from the year 2000.
These results are based on Gallup's annual Environment poll, conducted March
8-11. The trends are part of a broader decline in worry about environmental
threats documented in the poll.
Gallup asked Americans to say how much they worry about each of seven
environmental problems. All show significantly less worry today than in 2000,
when worry was at or near its high point for each item. The declines in concern
about drinking-water pollution and air pollution are the largest for the
problems included in this year's poll.
More broadly, worry about the seven issues is below the historical average for
each. Most of the trends date back to 1989.
Concern about these environmental problems is down among most major subgroups
since 2000. Across the seven items, the percentage worried a great deal is down
an average 16 percentage points among Republicans, 18 points among independents,
and 13 points among Democrats.
Americans Worry Most About Water Contamination, Least About Global
Warming
On a relative basis, Americans tend to worry more about environmental threats to
the nation's water supplies than those that affect other parts of the
environment. The highest levels of worry this year are for contamination of soil
and water by toxic waste, pollution of drinking water, and pollution of rivers,
lakes, and reservoirs.
Concern about global warming is lowest of the seven environmental issues tested,
even though it is up
slightly this year from last year.
The relative rank order of these environmental issues has generally been
consistent over time, with water-related
problems at the top and global warming at the bottom. In fact, the three
water concerns in this year's poll have ranked as the top three concerns over
any other environmental problems nearly every time they have been asked since
1989. Pollution of drinking water has most often been the top concern.
Implications
Americans' concerns about environmental problems have dropped in recent years,
coincident with theirdrop
in support for various environmental policies and
the higher
priority they assign to economic growth than to environmental protection.
There are two likely explanations for the declining concern. First, Americans are
a bit more positive now than they have been in the past about
the quality of the environment. Second, the economic downturn has forced
Americans to focus more on bread-and-butter economic issues than quality-of-life
issues. It may be no coincidence that environmental concern was highest in 2000,
when the U.S. was enjoying one of the strongest economies in recent memory, and
that environmental concern has reached new lows recently, after the worst
financial downturn in the last 25 years.
Survey Methods
Results for this Gallup poll are based on telephone interviews conducted March
8-11, 2012, with a random sample of 1,024 adults, aged 18 and older, living in
all 50 U.S. states and the District of Columbia.
For results based on the total sample of national adults, one can say with 95%
confidence that the maximum margin of sampling error is ±4 percentage points.
Interviews are conducted with respondents on landline telephones and cellular
phones, with interviews conducted in Spanish for respondents who are primarily
Spanish-speaking. Each sample includes a minimum quota of 400 cell phone
respondents and 600 landline respondents per 1,000 national adults, with
additional minimum quotas among landline respondents by region. Landline
telephone numbers are chosen at random among listed telephone numbers. Cell
phone numbers are selected using random-digit-dial methods. Landline respondents
are chosen at random within each household on the basis of which member had the
most recent birthday.
Samples are weighted by gender, age, race, Hispanic ethnicity, education,
region, adults in the household, and phone status (cell phone only/landline
only/both, cell phone mostly, and having an unlisted landline number).
Demographic weighting targets are based on the March 2011 Current Population
Survey figures for the aged 18 and older non-institutionalized population living
in U.S. telephone households. All reported margins of sampling error include the
computed design effects for weighting and sample design.
In addition to sampling error, question wording and practical difficulties in
conducting surveys can introduce error or bias into the findings of public
opinion polls.
219-43-21. U.S. Young Adults Admit Too Much Time on Cell
Phones, Web
Overall, Americans most likely to say television occupies too much of their time
April 12,
2012
PRINCETON, NJ -- By their own admission, many young Americans, aged 18 to 29,
say they spend too much time using the Internet (59%), their cell phones or
smartphones (58%), and social media sites such as Facebook (48%). Americans'
perceptions that they spend "too much" time using each of these technologies
decline with age. Conversely, older Americans are most likely to say they spend
too much time watching television, and among all Americans, television is the
most overused technology tested.
These results are based on answers to questions included in Gallup Daily
tracking interviewing conducted April 9-10, asking Americans if they spend too
much time on five activities involving "screens" -- using cell phones or
smartphones, doing email, using social media sites such as Facebook, using the
Internet, and watching television. Not all Americans engage in each of these
activities, of course, which may help explain why older Americans are not likely
to say they spend too much time on Internet-, social media-, and cell
phone-related pursuits.
Forty-seven percent of Americans, including 78% of those aged 18 to 29, report
owning a smartphone, and of these, 48% say they spend too much time using it.
Email appears to be less of a time concern to Americans overall than using cell
phones or using the Internet more generally. Twenty percent of those under 30
say they spend too much time with emails; this drops to 4% among those 65 and
older.
Highly Educated Most Likely to Report Too Much Time Spent Using Email,
Internet
Highly educated Americans are more likely to say they spend too much time doing
email and on the Internet than are those with less education. Education is not
highly related to the other three activities.
Overall, 33% of all U.S. adults report spending too much time watching
television, 27% too much time on cell phones and smartphones, and 26% too much
use of the Internet -- with fewer than two in 10 saying they spend too much time
on social media sites or doing email.
Americans' concern about spending too much time watching television is not a new
phenomenon. A Gallup poll conducted in 1990, using a somewhat different question
wording, found that 42% of Americans said they spent too much time watching
television -- and in that survey, 13% said they were addicted to television.
Implications
Most new technologies have good and bad dimensions. The Internet, email, cell
phones and smartphones, and social media sites have opened up entirely new ways
in which Americans go about their daily personal and work lives -- and are no
doubt considered indispensable by many Americans who use them. These
technologies have also, of course, spawned whole new industries and have been
the basis for some of the fastest-growing companies in the world.
At the same time, it is apparent that many in the U.S., mostly younger
Americans, have become aware that these technologies may have a downside, namely
that they use up too much time.
It is possible that younger Americans -- concerned about their use of time --
will attempt to scale back their use of the new technologies. This could affect
the exponential growth of the industries built on the technologies in the
future. On the other hand, recognition of negative aspects of engaging in
certain activities doesn't necessarily mean people are able to stop doing them
-- as witnessed by those who would like to quit smoking but can't, and those who
would like to lose weight but don't.
All in all, the fact that six in 10 18- to 29-year-olds say they spend too much
time using their phones and using the Internet suggests at least the potential
of a backlash of sorts, which in turn could have unknown but possibly
significant consequences in the years ahead.
Survey Methods
Results are based on telephone interviews conducted as part of Gallup Daily
tracking April 9-10, 2012, with a random sample of 1,051 adults, aged 18 and
older, living in all 50 U.S. states and the District of Columbia.
For results based on the total sample of national adults, one can say with 95%
confidence that the maximum margin of sampling error is ±4 percentage points.
Interviews are conducted with respondents on landline telephones and cellular
phones, with interviews conducted in Spanish for respondents who are primarily
Spanish-speaking. Each sample includes a minimum quota of 400 cell phone
respondents and 600 landline respondents per 1,000 national adults, with
additional minimum quotas among landline respondents by region. Landline
telephone numbers are chosen at random among listed telephone numbers. Cell
phone numbers are selected using random-digit-dial methods. Landline respondents
are chosen at random within each household on the basis of which member had the
most recent birthday.
Samples are weighted by gender, age, race, Hispanic ethnicity, education,
region, adults in the household, and phone status (cell phone only/landline
only/both, cell phone mostly, and having an unlisted landline number).
Demographic weighting targets are based on the March 2011 Current Population
Survey figures for the aged 18 and older non-institutionalized population living
in U.S. telephone households. All reported margins of sampling error include the
computed design effects for weighting and sample design.
In addition to sampling error, question wording and practical difficulties in
conducting surveys can introduce error or bias into the findings of public
opinion polls.
219-43-22. Over Half of Americans Have Cut Back on
Products and Services Because of High Gas Prices
Three-quarters cutting back on dining out and driving in general, while
two-thirds cutting back on entertainment and weekend or day trips
NEW YORK ,
N.Y. - April 12, 2012 - As
the calendar inches closer to the end of May, there are various things that
Americans start to look forward to. Memorial Day marks the unofficial start of
summer, and with that comes the beginning of the summer driving season. This
means that higher gas prices are going to have an impact, not only on driving,
but also on other things as well. According to a new Harris
Poll, over half of Americans who
own a vehicle (55%) say they have cut back on products and/or services in order
to pay for the increased price of gasoline. As might be expected, those with
lower household incomes are more impacted. Two-thirds (67%) of those with a
household income of less than $35,000 a year have cut back on products or
services because of higher gas prices compared to 37% of those who have a
household income of $100,000 or more.
These are some of the results of The
Harris Poll of 2,451 adults
surveyed online between March 12 and 19, 2012 by Harris
Interactive.
There are many things people are cutting back on in order to pay for the
increased price of gasoline. Three-quarters of those who have cut back have done
so on dining out (75%) and driving in general (73%) while almost two-thirds have
cut back on entertainment (65%) and weekend trips or day trips (65%). Three in
five have cut back on reducing extras, such as luxury items (62%) and vacations
(59%) while over half have cut back on clothing (55%) and movies (54%). Smaller,
but still significant, numbers have cut back on groceries (38%), personal
grooming, such as haircuts or manicures (37%), and auto repairs or upkeep (24%).
Who gets the blame and who can stop rising gas prices?
In looking at who to blame for the rise in gas prices, over one-third of
Americans (37%) say they blame the oil companies the most while one-quarter
(25%) blame unrest in the Middle East. Political figures also are blamed by
some; 17% blame President Obama the most; 5% blame Republicans in Congress the
most; and 4% blame Democrats in Congress the most.
So, who can best stop rising gas prices? Just over one-third of Americans (37%)
say the oil and gas industry while three in ten (30%) believe the federal
government can best stop rising gasoline prices. Fewer people believe consumers
can stop rising gas prices (14%) while 4% say state and local governments can,
2% say the automotive industry, and 14% are not sure.
So What?
"Nearly nine-out-of-ten Americans say they expect gas prices to be higher as we
enter the summer months. The impact of this kind of price hike is nearly
universal and is felt every time an individual gets behind the wheel of their
car. Many Americans are making real cuts in their budget to accommodate for the
increase in the gas they need to get to work, school and run essential errands,"
says Sarah Simmons, Senior Research Executive and Thought Leader. "As our
national economy starts to show signs of recovery, Americans are looking to the
federal government and to the oil and natural gas industry to help find workable
solutions."
TABLE 1
CUTTING BACK ON PRODUCTS OR SERVICES
"Have you cut back on any products or services in order to pay the increased
price of gasoline?"
Base: Owns a vehicle
|
|
Total 2006 |
Total 2011 |
Total
2012 |
Income |
|
$34,999 or less |
$35,000 -
$49,999 |
$50,000 -$74,999 |
$75,000 - $99,999 |
$100,000 or more |
|
% |
% |
% |
% |
% |
% |
% |
% |
|
Yes |
44 |
51 |
55 |
67 |
65 |
55 |
49 |
37 |
|
No |
56 |
49 |
45 |
33 |
35 |
45 |
51 |
63 |
Note: Percentages may not add to 100% due to rounding.
TABLE 2
PRODUCTS OR SERVICES CUT BACK
"What products or services have you cut back on?"
Base: Cut back on products or services
|
|
Total |
|
% |
|
Dining Out |
75 |
|
Driving in general |
73 |
|
Entertainment |
65 |
|
Weekend trips/day trips |
65 |
|
Reducing extras, such as luxury items |
62 |
|
Vacations |
59 |
|
Clothing |
55 |
|
Movies |
54 |
|
Groceries |
38 |
|
Personal grooming, such as haircuts or manicures |
37 |
|
Auto repairs/upkeep |
24 |
|
Something else |
11 |
Note: Multiple responses allowed.
TABLE 3
BLAME FOR RISING GAS PRICES
"While all may be somewhat to blame, who or what do you blame most for the
recent rise in gas prices?"
Base: All adults
|
|
Total |
Region |
|
East |
Midwest |
South |
West |
|
% |
% |
% |
% |
% |
|
Oil companies |
37 |
34 |
40 |
35 |
42 |
|
Unrest in the Middle East |
25 |
29 |
24 |
24 |
24 |
|
President Barack Obama |
17 |
7 |
17 |
17 |
14 |
|
Republicans in Congress |
5 |
5 |
6 |
6 |
5 |
|
Democrats in Congress |
4 |
3 |
4 |
4 |
6 |
|
Not at all sure |
11 |
14 |
10 |
10 |
10 |
Note: Percentages may not add up to 100% due to rounding
TABLE 4
WHO/WHAT CAN STOP RISING GAS PRICES
"In your opinion, who can best stop rising gasoline prices?"
Base: All adults
|
|
Total
2006 |
Total 2011 |
Total
2012 |
Political Party |
|
Rep. |
Dem. |
Ind. |
|
% |
% |
% |
% |
% |
% |
|
Oil and gas industry |
34 |
34 |
37 |
28 |
47 |
37 |
|
The federal government |
29 |
28 |
30 |
41 |
21 |
29 |
|
Consumers |
22 |
19 |
14 |
11 |
15 |
15 |
|
State and local governments |
3 |
4 |
4 |
6 |
3 |
3 |
|
Automotive industry |
3 |
3 |
2 |
1 |
2 |
2 |
|
Not sure |
9 |
12 |
14 |
12 |
12 |
13 |
Note: Percentages may not add up exactly to 100% due to rounding.
TABLE 5
GAS PRICES BY LABOR DAY
"Thinking ahead to the summer, how do you think gas prices on Memorial Day at
the end of May will compare with prices now?"
Base: All adults
|
|
Total |
Political Party |
|
Rep. |
Dem. |
Ind. |
|
% |
% |
% |
% |
|
Higher (NET) |
88 |
90 |
88 |
89 |
|
Much Higher |
41 |
46 |
36 |
42 |
|
Somewhat Higher |
47 |
44 |
52 |
47 |
|
About the same |
9 |
8 |
8 |
8 |
|
Lower (NET) |
3 |
2 |
4 |
2 |
|
Somewhat Lower |
3 |
2 |
4 |
2 |
|
Much lower |
* |
* |
- |
* |
Note: Percentages may not add up exactly to 100% due to rounding. * indicated
less than 0.5% and "-" indicates no response
Methodology
This Harris Poll was
conducted online within the United States between March 12 to 19, 2012 among
2,451 adults (aged 18 and over), of whom 2,172 own a vehicle. Figures for age,
sex, race/ethnicity, education, region and household income were weighted where
necessary to bring them into line with their actual proportions in the
population. Propensity score weighting was also used to adjust for respondents'
propensity to be online.
All sample surveys and polls, whether or not they use probability sampling, are
subject to multiple sources of error which are most often not possible to
quantify or estimate, including sampling error, coverage error, error associated
with nonresponse, error associated with question wording and response options,
and post-survey weighting and adjustments. Therefore, Harris Interactive avoids
the words "margin of error" as they are misleading. All that can be calculated
are different possible sampling errors with different probabilities for pure,
unweighted, random samples with 100% response rates. These are only theoretical
because no published polls come close to this ideal.
Respondents for this survey were selected from among those who have agreed to
participate in Harris Interactive surveys. The data have been weighted to
reflect the composition of the adult population. Because the sample is based on
those who agreed to participate in the Harris Interactive panel, no estimates of
theoretical sampling error can be calculated.
These statements conform to the principles of disclosure of the National
Council on Public Polls.
About Harris Interactive
Harris Interactive is one of the
world's leading custom market research firms, leveraging research, technology,
and business acumen to transform relevant insight into actionable foresight.
Known widely for The Harris Poll and for pioneering innovative research
methodologies, Harris offers expertise in a wide range of industries including
healthcare, technology, public affairs, energy, telecommunications, financial
services, insurance, media, retail, restaurant, and consumer package goods.
Serving clients in over 215 countries and territories through our North American
and European offices and a network of independent market research firms, Harris
specializes in delivering research solutions that help us - and our clients -
stay ahead of what's next. For more information, please visit www.harrisinteractive.com.
219-43-23. Despite Intense Negative Media Focus,
Americans Still Believe the Benefits of Natural Gas Outweigh the Risk
Benefits of coal
slightly ahead of risks for first time
NEW YORK ,
N.Y. - March 21, 2012 - In
a year of intense media scrutiny on hydraulic fracturing, the manner in which
most oil and natural gas companies access natural gas, two-thirds of Americans
(66%) say they believe the benefits of natural gas outweigh the risks while 17%
say the risks outweigh the benefits. Natural gas has maintained a relatively low
price, compared to other fuels with similar uses (like fuel oil and gasoline).
Additionally, it is considered a relatively clean source of energy. For
Americans, these factors seem to outweigh the risks associated with hydraulic
fracturing, the extraction method most associated with gas.
These are some of the results of The
Harris Poll of 2,056 adults
surveyed online between February 6 and 13, 2012 by Harris
Interactive.
There are significant generational differences, however, Echo Boomers (ages
18-35) are less likely to believe the benefits outweigh the risks than Matures
(those 67 and older) are (53% vs. 84%). And, people living in the East are less
likely than those in the West to agree that the benefits outweigh the risks (60%
vs. 71%).
There is also a political difference when it comes to feelings on natural gas.
Three out of four Republicans (74%) believe the benefits of natural gas outweigh
the risks compared to just over three in five Democrats (62%) and over
two-thirds of Independents (69%) who believe the benefits outweigh the risks.
Looking at the reverse, the partisan differences are significant, with larger
portions of Democrats (21%) and Independents (19%) believing the risks outweigh
the benefits than Republicans who believe this (10%).
The close divide over coal
In 2009, two in five Americans (42%) said the risks of using coal outweighed the
benefits while 36% believed the benefits outweighed the risks. In 2011, the view
did not change all that much as 38% said benefits outweighed risks, but 43%
believed the risks outweighed the benefits. This year, the number of people who
say the benefits outweigh the risks continues to inch upward as 42% say that
while 40% currently say the risks outweigh the benefits.
There are some clear regional and generational differences for coal. Almost half
of those in the Midwest (49%) and South (48%) say the benefits outweigh the
risks compared to 35% of those in the East and 33% of those in the West. There
is also a clear age divide as Baby Boomers (ages 48-66) and Matures are more
likely to say benefits of coal outweigh the risks than both Echo Boomers and Gen
Xers (ages 36-47); over half of Matures (54%) and 47% of Baby Boomers say the
benefits of coal outweigh the risks compared to 39% of Gen Xers and 33% of Echo
Boomers.
So What?
At the end of the day, what matters most to Americans is how much they are
paying to heat their homes and fuel their lifestyles. This may explain why
natural gas has maintained a positive position relative to its risks, said Sarah
Simmons, Senior Research Executive and Industry Thought Leader. Natural gas is
inexpensive, clean and accessible. Americans' view of coal suffers, especially
when we look at generational breaks due to environmental factors.
TABLE 1
BENEFITS VERSUS RISKS FOR VARIOUS ENERGY SOURCES
"There are many sources of electric power used in the U.S. To the best of your
knowledge, would you say the benefits of each source outweigh the risks or do
you believe the risks outweigh the benefits?"
Base: All adults
|
|
BENEFITS OUTWEIGH RISKS (NET) |
Benefits strongly outweigh risks |
Benefits somewhat outweigh risks |
RISKS OUTWEIGH BENEFITS (NET) |
Risks somewhat outweigh benefits |
Risks strongly outweigh benefits |
Not at all sure |
|
% |
% |
% |
% |
% |
% |
% |
|
Solar |
2012 |
79 |
63 |
15 |
8 |
4 |
4 |
13 |
|
2011 |
77 |
64 |
13 |
8 |
3 |
6 |
14 |
|
2009 |
82 |
68 |
14 |
5 |
3 |
2 |
13 |
|
Wind |
2012 |
76 |
61 |
16 |
9 |
5 |
5 |
15 |
|
2011 |
75 |
61 |
14 |
10 |
3 |
7 |
15 |
|
2009 |
78 |
62 |
17 |
7 |
4 |
2 |
15 |
|
Natural gas |
2012 |
66 |
34 |
32 |
17 |
12 |
5 |
17 |
|
2011 |
64 |
31 |
34 |
17 |
11 |
6 |
18 |
|
2009 |
66 |
30 |
36 |
14 |
11 |
3 |
20 |
|
Geothermal |
2012 |
53 |
32 |
21 |
10 |
6 |
4 |
37 |
|
2011 |
52 |
33 |
18 |
10 |
5 |
5 |
38 |
|
2009 |
52 |
32 |
20 |
7 |
5 |
2 |
40 |
|
Coal |
2012 |
42 |
15 |
27 |
40 |
23 |
17 |
18 |
|
2011 |
38 |
15 |
23 |
43 |
24 |
18 |
19 |
|
2009 |
36 |
13 |
23 |
42 |
22 |
20 |
22 |
|
Nuclear |
2012 |
40 |
15 |
24 |
41 |
19 |
21 |
20 |
|
2011 |
42 |
20 |
22 |
37 |
18 |
19 |
21 |
|
2009 |
44 |
21 |
23 |
34 |
17 |
17 |
22 |
|
Biomass |
2012 |
30 |
13 |
17 |
12 |
8 |
4 |
58 |
|
2011 |
30 |
14 |
17 |
12 |
7 |
6 |
57 |
|
2009 |
28 |
12 |
16 |
12 |
8 |
4 |
60 |
Note: Percentages may not add up to 100% due to rounding
Methodology
This Harris Poll was
conducted online within the United States between February 6 to 13, 2012 among
2,056 adults (aged 18 and over). Figures for age, sex, race/ethnicity,
education, region and household income were weighted where necessary to bring
them into line with their actual proportions in the population. Propensity score
weighting was also used to adjust for respondents' propensity to be online.
All sample surveys and polls, whether or not they use probability sampling, are
subject to multiple sources of error which are most often not possible to
quantify or estimate, including sampling error, coverage error, error associated
with nonresponse, error associated with question wording and response options,
and post-survey weighting and adjustments. Therefore, Harris Interactive avoids
the words "margin of error" as they are misleading. All that can be calculated
are different possible sampling errors with different probabilities for pure,
unweighted, random samples with 100% response rates. These are only theoretical
because no published polls come close to this ideal.
Respondents for this survey were selected from among those who have agreed to
participate in Harris Interactive surveys. The data have been weighted to
reflect the composition of the adult population. Because the sample is based on
those who agreed to participate in the Harris Interactive panel, no estimates of
theoretical sampling error can be calculated.
These statements conform to the principles of disclosure of the National
Council on Public Polls.
The results of this Harris Poll may not be used in advertising, marketing or
promotion without the prior written permission of Harris Interactive.
J41216
Q905, 910
The Harris Poll ® #30,
March 21, 2012
By Regina A. Corso, SVP, Harris Poll, Public Relations and Youth and Education
Research, Harris Interactive
About Harris Interactive
Harris Interactive is one of the
world's leading custom market research firms, leveraging research, technology,
and business acumen to transform relevant insight into actionable foresight.
Known widely for the Harris Poll and for pioneering innovative research
methodologies, Harris offers expertise in a wide range of industries including
healthcare, technology, public affairs, energy, telecommunications, financial
services, insurance, media, retail, restaurant, and consumer package goods.
Serving clients in over 215 countries and territories through our North American
and European offices and a network of independent market research firms, Harris
specializes in delivering research solutions that help us - and our clients -
stay ahead of what's next. For more information, please visit www.harrisinteractive.com.
219-43-24. Two Years Later, Health Care Reform Continues
to Polarize Views in the U.S.
(04/10/12) -
Respondents are more likely to call for the repeal of the new legislation than
to wish for it to remain in place.
Americans
remain at odds on the effect that the health care legislation signed into law by
U.S. President Barack Obama in 2010 will ultimately have on their medical
services, a new Angus Reid Public Opinion poll has found.
In the
online survey of a representative sample of 1,007 American adults, 72 per cent
of respondents rate the quality of health care that is provided in the United
States as “very good” or “good”, up four points since March 2011.
There is
little fluctuation in the way Americans perceive the health care legislation
signed into law by President Obama two years ago, with 46 per cent of
respondents saying that they supported the idea two years ago, and 44 per cent
acknowledging that they still do so today.
One-in-five Americans (+3 since March 2011) say they expect the quality of
health care in America to improve under the new health care legislation, while
two-in-five (43%, -3) believe it will worsen.
A majority
of respondents (60%) believe the cost of health care in America will increase
under the new guidelines, while only 12 per cent expect it to be lower.
Despite
the recent discussions on what the Supreme Court may do about the health care
legislation, there has been no change on the way Americans feel about the law.
Only three-in-ten (29%) say they would prefer for the legislation to remain in
place, while 44 per cent would like to see it repealed.
Analysis
The views
of Americans on the health care reform implemented by the current president have
not gone through a drastic shift over the past 12 months. Republicans are
particularly forceful in their opposition to the legislation, and in their
belief that it will lead to high costs and poor service. Democrats tend to agree
with the notion that the legislation will be positive, but are not unanimous in
their assessment. In fact, slightly less than half (47%) would like to see the
new health care law remaining in place.
Independents tend to side more with Republicans, with almost half expecting
lower quality and three-in-five foreseeing more expensive bills. This group is
also more likely to call for the repeal of the law (42%) than to endorse its
continuation (25%).
Methodology: From March 30 to March 31, 2012, Angus Reid Public Opinion
conducted an online survey among 1,007 randomly selected American adults who are
Springboard America panelists. The margin of error—which measures sampling
variability—is +/- 3.1%. The results have been statistically weighted according
to the most current education, age, gender and region Census data to ensure a
sample representative of the entire adult population of the United States.
Discrepancies in or between totals are due to rounding.
LATIN
AMERICA
219-43-25. Mexico's Pena Nieto Extends Lead Over Main
Rival
Apr 16, 2012
(Reuters) - Mexican presidential front-runner
Enrique Pena Nieto has widened his big lead over struggling ruling party
candidate Josefina Vazquez Mota, with just 2 1/2 months to go until the July 1
election, an opinion poll showed on Sunday.
The latest voter survey by polling firm BGC for Mexican newspaper Excelsior
showed support for Pena Nieto, a member of the opposition Institutional
Revolutionary Party (PRI), running at 50 percent, according to BGC's Website.
That score was 3 percentage points higher than a previous BGC/Excelsior poll
published on March 26.
Vazquez Mota, the candidate from President Felipe Calderon's conservative
National Action Party (PAN), slipped one point to 29 percent. Third placed
contender and 2006 runner-up, leftist Andres Manuel Lopez Obrador, fell back two
points to 20 percent.
Pena Nieto has led the polls for more than two years and is widely expected to
put the PRI back in power after more than a decade on the sidelines. The
centrist faction ruled Mexico for 71 years straight until the PAN ousted it in
2000.
Pena Nieto, 45, has had his share of troubles along the way.
The ex-governor of the State of Mexico, a populous region flanking the capital
to the north, made a number of gaffes at the end of 2011, most notably when he
struggled to name three books that influenced him.
In January, he admitted he cheated on his first wife, fathering two children out
of wedlock with different women.
But none of this has done lasting damage to his bid, because voters believe he
is more likely to end the violence plaguing Mexico and reinvigorate the economy.
Vazquez Mota is trying to shake off discontent with the PAN, whose reputation
has suffered due to a surge in lawlessness that followed the army-led offensive
Calderon launched against drug gangs shortly after he took office in December
2006.
More than 50,000 people have since been killed in fighting between the gangs and
their clashes with security forces.
Many of the victims have been young people lured by the prospect of quick cash
from the gangs. The PAN has also struggled to create enough jobs for Mexico's
growing population.
Vazquez Mota's campaign has been undermined by squabbling within the PAN, as
well as a number of mishaps on the election trail, including the botched staging
of a major rally last month that left her addressing a half-empty stadium
stands.
Lopez Obrador, the former mayor of Mexico City, is still trying to win back
voters he alienated after his narrow loss to Calderon in 2006. He accused the
PAN of robbing him and declared himself the rightful president of Mexico,
launching massive street protests in the capital that eroded his support.
The latest poll for Excelsior surveyed 1,200 registered Mexican voters from
Monday through Wednesday and had a margin of error of 2.9 percentage points, BGC
said.
219-43-26. Falklands War: Britain and Argentina
April 10 2012
YouGov and Ibarómetro
have together conducted the first parallel polling of the British and
Argentinian public on the Falklands War and future of the Islands
o
Most
Argentinians have a negative view of the 1982 invasion, and think the then
dictatorship did it to solve their own political reasons
o
52% of
Britons think it was right to retake the islands by force
o
Most
Argentinians are opposed to any further military action, British adults are
evenly split on whether Britain should use force to defend the islands
o
British
and Argentinians both think their country has the most legitimate claim over the
Islands
In a joint
project, YouGov polled 1,744 British adults and Ibarómetro polled a parallel
sample of 1,800 Argentinian adults.
The
Argentinian public are more likely than the British public to see their claims
on the Islands as legitimate, and more likely to think that they have the
international community on their side; 89% of Argentinian adults think their
country’s claims to the Falklands are very or fairly legitimate, compared to 62%
of British adults who think the UK’s claims are legitimate. 46% of Argentines
think that the international community backs their claim on the Falklands,
compared to 11% of Britons.
The
majority (56%) of Argentines have a negative perception of the 1982 war, and 77%
of them see it as something that was done by the then dictatorship to prop up
its political position, rather than something the Argentinian people wanted. In
Britain, 52% of people think that the UK government took the right decision to
retake the islands by force, 26% think more effort should have been made to
solve the issue diplomatically.
There is
very little appetite for military action today; 59% of Argentinians would oppose
any military action today, compared to 26% in support. The British public are
evenly split on whether or not they would support using military force to try
and retain the islands – 42% would support it, 39% would oppose it. There is a
significant age difference as respondents over 40, and likely to remember the
1982 war, would support Britain using force to retain the islands, whereas those
under 40 are more likely to oppose it.
More
British people would support opening negotiations with Argentina over the future
of the Falklands than would oppose it – 37% would support negotiations, with 25%
opposed. The overwhelming majority (83%) of Argentinians would support
negotiation.
While both
countries would support negotiation, there is little common ground on what they
would like the outcome to be. 66% of Argentine adults think the Islands should
become Argentinian sovereignty territory, with 21% supporting shared
sovereignty. British opinion is more evenly divided – 37% think the Islands
should remain British and 14% would support shared sovereignty, but 28% think
the fairest outcome would be for the Falklands to become independent from both
countries.
When asked
what outcome people expect to actually happen, a majority (55%) of British
respondents expect that the islands will actually remain British. Argentinian
respondents were more divided – 31% expect the islands to end up remaining
British, 33% expect them to become Argentinian.
MULTI-COUNTRY STUDIES
219-43-27. Nearly One in Four Worldwide Thriving
Majorities in 17 out of 146 countries thriving
April 10,
2012
WASHINGTON, D.C. -- Nearly one-quarter of adults worldwide (24%) are "thriving,"
according to Gallup surveys in 146 countries in 2011. The percentage rating
their current and future lives positively enough to be considered thriving
ranged from a high of 74% in Denmark to a low of 2% in Cambodia.
Gallup classifies respondents as "thriving," "struggling," or "suffering,"
according to how they rate their current and future lives on a ladder scale with
steps numbered from 0 to 10 based on the Cantril
Self-Anchoring Striving Scale. People
are considered thriving if they rate their current lives a 7 or higher and their
lives in five years an 8 or higher.
Majorities
of residents in 17 countries rated their lives well enough to be classified this
way. Denmark clearly led this list, as
it has since 2009, trailed by other wealthy and developed countries
such as Canada (66%) and the Netherlands (66%). The U.S. just missed making the
top 10, with 56% of Americans thriving.
Thriving
generally remained an elusive state of being across much of the world in 2011.
Less than 25% of the adult populations in 87 countries were thriving last year.
African countries generally dominate the list of countries where thriving is
lowest, accounting for more than half of the 28 countries where thriving was 10%
or lower. Still, several countries from other regions also have thriving levels
this low.
Wellbeing
was generally lowest in sub-Saharan Africa, where the median thriving percentage
was 12% across the countries surveyed. Thriving percentages were in the single
digits in many countries, but the region had some bright spots. Thriving was
safely higher than average in Ghana (29%) and Angola (35%).
Across
Regions, Americas Boasts Highest Wellbeing
Wellbeing
was generally highest again in the Americas, where a median of 39% were
thriving. The significant divides among countries in previous years remained,
with thriving ranging from 66% in Canada to 10% in Haiti. Although the 10%
thriving in Haiti is the lowest in the region, 2011 marked the first
time this percentage reached double digits.
In Europe,
the median thriving percentage was lower than in the Americas, but about average
at 24%. The divide between wealthier countries of northern, western, and central
Europe and poorer countries in eastern and southern Europe is apparent in
residents' attitudes toward
their economy and toward
their lives. Thriving ranges from the world high of 74% in Denmark to
a near-world low of 5% in Bulgaria.
In Asia,
where a median of 20% were thriving across the countries surveyed, there were
large gaps between developed and developing Asian countries. Thriving was higher
than 60% in Australia (64%) and New Zealand (60%) and as low as 2% Cambodia.
Thriving Mostly Unchanged in Middle East and North Africa vs. Before Arab Spring
A median
of 20% in the Middle East and North Africa region were thriving -- similar to
what Gallup measured before
the Arab Spring. Nearly two in three (65%) were thriving in Israel --
the highest score in the region -- as were majorities in the relatively wealthy
United Arab Emirates (58%) and Oman (51%). Fewer than one in 10 were thriving in
Egypt (9%) and Yemen (8%), where unrest continued throughout much of 2011.

Wellbeing Gains in a Few Countries
Wellbeing
improved substantially in a few countries between 2011 and 2010, but generally
remained relatively steady across most of the world. The few notable changes
that took place last year further reinforce the idea that wellbeing is a local
phenomenon, and that leaders need to develop polices to improve it with that in
mind. Hopes are understandably higher in countries such as Ghana, for example,
where thriving increased 19 percentage points amid an oil boom in 2011 and
accompanying double-digit economic growth.
Implications
Gallup's
global wellbeing data continue to emphasize the diverse development challenges
worldwide and reveal the wellbeing situation has not changed much for many. This
underscores why it is important for leaders to pay attention to behavioral
metrics such as wellbeing. Significant investments in this area could
potentially pay huge dividends -- not the least of which are peace
and stability.
For
complete data sets or custom research from the more than 150 countries Gallup
continually surveys, please contact SocialandEconomicAnalysis@gallup.com or
call 202.715.3030.
Survey
Methods
Results
are based on face-to-face and telephone interviews with approximately 1,000
adults per country, aged 15 and older, conducted in 2011 in 146 countries.
Results in Russia, Tunisia, Egypt, the United Arab Emirates, Saudi Arabia,
Qatar, Lebanon, Morocco, Jordan, the Palestinian Territories, Bahrain, Yemen,
Comoros, Somaliland region, and Iraq are based on data aggregated from multiple
surveys. For results based on the total samples, one can say with 95% confidence
that the maximum margin of sampling error ranges from ±1.7 percentage points to
±5.7 percentage points. The margin of error reflects the influence of data
weighting. In addition to sampling error, question wording and practical
difficulties in conducting surveys can introduce error or bias into the findings
of public opinion polls.
219-43-28. More Than One in 10 "Suffering" Worldwide
Bulgaria and Yemen lead the world in suffering
April 13,
2012
WASHINGTON, D.C. -- An average of 13% of adults worldwide rated their lives
poorly enough to be considered "suffering," according to Gallup surveys in 146
countries in 2011. The percentage rating their current and future lives poorly
enough to be considered suffering was as high as 45% in Bulgaria and as low as
1% or less in the United Arab Emirates, Netherlands, Luxembourg, Canada,
Thailand, and Brazil.
Gallup
classifies respondents as "thriving," "struggling," or "suffering" according to
how they rate their current and future lives on a ladder scale with steps
numbered from 0 to 10 based on the Cantril
Self-Anchoring Striving Scale. Gallup considers people to be
suffering if they rate their current lives a 4 or lower and their lives in five
years a 4 or lower. The respondents do not label themselves as suffering.
Average global suffering has remained relatively unchanged over the past several
years.
One in
four or more residents in 18 countries rated their lives poorly enough to be
classified as suffering. Bulgaria had the negative distinction of leading the
global suffering list, as
it did last year. Yemen, Armenia, and El Salvador followed closely
behind, with one in three or more residents suffering in each of these
countries.
The
countries where suffering is highest are primarily a mix of European, African,
and Asian nations. This list heavily features several European nations that the
global financial crisis has adversely affected and where leaders have responded
with austerity measures. Several are also former socialist societies, including
Bulgaria, Armenia, and Serbia.
Suffering
spiked in places such as Iran, Afghanistan,
and El Salvador last year -- earning them a spot near the top of the world's
most suffering list.
Suffering
was 3% or less in 24 countries -- most of them wealthier and more developed
countries. Three percent of Americans were suffering in 2011, as has been the
case in past years.
Suffering Lowest in the Americas
A median
of 14% of residents in Europe were suffering last year, followed by 13% in
Africa, and 11% in Asia. Median suffering was lowest in the Americas at 6%.
Still,
within regions, suffering varies greatly. Although median suffering is 14% in
Europe, many European nations boast among the lowest rates of suffering in the
world.
These,
however, are mainly northern, western, and central European countries. Southern
and Eastern Europe does not fare as well. In Africa, suffering is as low as 2%
in Zambia, but climbs as high as 28% in Malawi.
Suffering Relatively Stable in Most Countries
For the
most part, suffering changed little at the country level in 2011 compared with
2010. However, in a handful of nations, Gallup did find shifts in suffering last
year. Suffering increased the most in El Salvador, climbing to 33% in 2011 from
9% in 2010. Suffering declined the most in Macedonia, falling 25 percentage
points last year from 38% in 2010.
Implications
Individuals who are suffering are not only pessimistic about their current
standing in life, but also lack hope about what their future holds. It is clear
in many nations that are struggling economically and politically and where
stability is tenuous, such as in Afghanistan, Iran, and Greece, that sizable
proportions of the population are suffering.
Those who
rate their lives highly enough to be thriving are much more likely to be
healthy, happy, and engaged in society. It is important for leaders in nations
where suffering is highest to take a hard look at what they must change in their
countries to improve how their people perceive their own lives and their future.
As outlined in Gallup's
macroeconomic path to achieving GDP growth, leaders must focus on
ensuring all citizens feel a sense of law and order, have food and shelter,
believe national institutions are functioning properly, and be able to secure
good jobs to increase the wellbeing of residents in their countries.
For
complete data sets or custom research from the more than 150 countries Gallup
continually surveys, please contactSocialandEconomicAnalysis@gallup.com or
call 202.715.3030.
Survey
Methods
Results
are based on face-to-face and telephone interviews with approximately 1,000
adults per country, aged 15 and older, conducted in 2011 in 146 countries.
Results in Russia, Tunisia, Egypt, the United Arab Emirates, Saudi Arabia,
Qatar, Lebanon, Morocco, Jordan, the Palestinian Territories, Bahrain, Yemen,
Comoros, Somaliland region, and Iraq are based on data aggregated from multiple
surveys. For results based on the total samples, one can say with 95% confidence
that the maximum margin of sampling error ranges from ±1.7 percentage points to
±5.7 percentage points. The margin of error reflects the influence of data
weighting. In addition to sampling error, question wording and practical
difficulties in conducting surveys can introduce error or bias into the findings
of public opinion polls.
219-43-29. Global Internet Users Manage Finances (59%),
Shop (51%) and Look for Jobs (41%) Online
11 April
2012
Johannesburg — A majority of citizens in 24 countries who use the internet say
they do so to check their bank accounts (59%), half (48%) shop for products
online and four in ten (41%) have surfed to look for jobs in the last three
months, finds a new poll by global research company Ipsos for Reuters News.
E-Banking Taking Hold
About six in ten (59%) citizens connected on the internet have used the web to
‘check bank account and other financial holdings’ in the last 90 days. The vast
majority of Swedes (88%) are e-banking, as are three quarters in France (76%),
Canada (75%), Australia (74%), Poland (74%), South Africa (74%) and Belgium
(73%). Only one quarter of those in Mexico (23%) are shopping online, joined at
the bottom of the list by Saudi Arabia (29%), Brazil (32%) and Argentina (36%).
Shopaholics in the Virtual World
Half of online-connected citizens around the world have taken their shopping to
cyberspace; 48% say they have used the internet in the past three months to ‘buy
products/services online’. Even more (61%) use the web for the research phase,
saying they ‘visit sites for info on products I am thinking of buying.’
Countries where online shopping has become the norm for online-connected
citizens are among the world’s most developed countries: Germany (74%), Great
Britain (74%), Sweden (68%), United States (65%) and South Korea (62%). Uptake
of online shopping has been least strong in Saudi Arabia (21%), Mexico (23%).
South Africans are dead in line with the global trend of 48% shopping for
products online.
The list is slightly different for those using the web to research products they
wish to buy. Sweden (80%), Turkey (74%), Great Britain (71%), Indonesia (69%),
South Korea (69%) and the United States (68%) lead on this measure, while Saudi
Arabia (36%), Hungary (44%), Mexico (45%), India (53%) and Belgium (55%) round
out the bottom of the list. Interestingly, even those countries at the bottom
have meaningful proportions of internet surfers who use the web for researching
products they want to buy.
Forget the Classifieds, Hit the Web
Four in ten (41%) of online global respondents have used the internet ‘to look
for a job or search job (recruitment) sites’ in the last three months. About six
in ten of those in Poland (61%), Hungary (58%), South Africa (57%) and Mexico
(55%) have logged on to look for a job, while only 17% in Japan, 25% in South
Korea and France, and 26% in Belgium have done so.
Demographic Profile
Those most likely to say they check their bank accounts online are
online-connected global citizens who have a high household income (69%), high
education (66%) and are between the ages of 50-64 (65%). Online shoppers are
mostly high income earners (56%) and highly educated (55%), while those most
likely to look for a job online have a low household income (48%), are under the
age of 35 (47%) and are unmarried (45%).
CYBER
WORLD
219-43-30.
USA: Over Half Of Tablet And Smartphone Time Is Shared With TV Viewing Latest
Results Of A Gfk Survey
New York, April 12, 2012 - As advertisers and marketers look for the best ways
to take advantage of an explosion in smartphone and digital tablet use, a new
GfK analysis provides crucial new details on simultaneous use of these devices
and other media. Among adults 35 to 49, two-thirds of all tablet minutes occur
in front of a TV.
The research by GfK Knowledge Networks shows that 52% of minutes spent with
tablets, and the same percent for smartphones, were shared with TV viewing.
Compared to young adults (ages 18 to 34), Baby Boomers (35 to 49) spent much
more time using tablets and TV simultaneously – 67% of tablet minutes, versus
39% for the younger group.
Simultaneous use of smartphones and TV was about the same for both age groups –
52% of smartphone minutes for the younger group, versus 48% for the older.
"Tablets are the new ‘second screen,’ thanks to their size and inherent
connectivity,” said Robert DeFelice, Vice President (Media) at GfK Knowledge
Networks. "Our research suggests the potential value of ad campaigns and other
applications that take advantage of the roles smartphones and tablets play as
‘co-located’ technologies; these might include researching advertised products,
texting friends about plot twists, visiting TV program websites, and dozens of
similar uses.”
The analysis also shows that women were more likely to combine tablets and TV –
56% of their tablet minutes were spent in front of a television, versus 48% for
men. But the opposite was true for smartphones, with men at 59% and women at
48%.
Compared to non-owners, those who have tablets devoted 42 additional minutes to
the Internet daily, and 52 added minutes to all media. They also spent almost
twice as much time using the Internet via smartphones (40 minutes per day,
compared to 22 minutes for people without tablets).
Further information: David Stanton, +1 908 875-9844,dstanton@knowledgenetworks.com
About the
survey
The new findings come from MultiMedia
Mentor® -- a 14-year-old service tracking use of 8 major media – and are
based on interviews with 2,621 members of KnowledgePanel®,
the only commercially available online panel derived from a statistically
projectable sample of the U.S. population. Interviewing for this latest wave of
Mentor data was conducted between August 2011 and January 2012 with panel
members ages 13 to 64.
In addition to time spent with media, the MultiMedia Mentor research captures
hundreds of consumer characteristics, including use of product categories.
Clients have on-demand, online access to Mentor findings through exclusive
reporting and optimization software.
Knowledge Networks, now part of the GfK, is passionate about research in
marketing, media, health and social policy – collaborating closely with client
teams throughout the research process, while applying rigor in everything we do.
We specialize in innovative online research that consistently gives leaders in
business, government, and academia the confidence to make important decisions.
KN delivers affordable, statistically valid online research through
KnowledgePanel® and leverages a variety of other assets, such as world-class
advanced analytics, an industry-leading physician panel, an innovative platform
for measuring online ad effectiveness, and a research-ready behavioral database
of frequent supermarket and drug store shoppers.