BUSINESS &
POLITICS IN THE MUSLIM WORLD
Global Opinion
Report No. 366
Week:
February 01 – 07, 2015
Presentation:
February 11, 2015
M. Zubair Khan
INTRODUCTORY NOTE 02
SUMMARY OF POLLS 02
WEST
ASIA
·
Public
opinion divided over the possibility of war between India and Pakistan 06
SOUTHEAST ASIA
·
Philippines: 85% says gays and
lesbians should be protected against discrimination 08
·
Philippines: Adult joblessness at
27.0%; 9% lost their jobs involuntarily, 14% resigned 11
SUB-SAHARAN AFRICA
·
Tanzanians see increased
corruption, ineffective fight against it 14
EAST EUROPE
·
Paris Terrorist Attacks: Russian
Assessments 18
·
Ruble Exchange Rate: Fears And
Forecasts 20
·
Protest Actions: Manifestations Of
Democracy Or Crisis? 23
WEST EUROPE
·
Economist/Ipsos MORI January 2015
Issues Index 25
·
Captains of Industry support
Britain being in the EU 27
·
Public perceptions of climate
change in Britain following the winter 2013/14 flooding 31
·
Overwhelming public support for the
‘Gordon’s Fightback’ Campaign 32
·
UK: Voters: time to slim down the royal
family 33
·
Scotland: SNP lead at 21 34
NORTH AMERICA
·
Obama Approval Ratings Still
Historically Polarized 37
·
Majorities in Five States Approved
of Obama in 2014 40
·
Eight-Point Increase in Monthly
Economic Confidence Index 46
·
Gallup Student Poll: Job Confidence
Lower in Higher Grades 49
·
For Banks, Baby Boomers Mean
Lucrative Business 51
·
After Holidays, January U.S.
Consumer Spending Falls to $81 53
·
U.S. Flu Reports Decline in January 56
·
U.S. Small-Business Owners'
Optimism Highest Since 2008 59
·
U.S. Payroll to Population Rate
44.1% in January 61
·
U.S. Job Creation Lingers Near
Seven-Year High 66
·
Investigative Journalists and
Digital Security 69
LATIN AMERICA
·
65% of Brazilians have a positive
view of the UN 73
·
19% of Brazilians do not know better time
to buy tickets or travel package 74
MULTI-COUNTRY
SURVEYS
·
Widespread concerns about extremism
in Muslim nations, and little support for it 76
·
Consumer Mood Brightened Again
Towards End Of Year 78
CYBER WORLD
·
More Australians buying eBooks 80
ANALYSIS TANK
·
America’s ‘middle’ holds its ground
after the Great Recession 82
INTRODUCTORY
NOTE
This week report consists of twenty nine surveys.
One of these is a multi-country survey while the rest of twenty eight are
national surveys from countries across the world.
366-30
Commentary:
Widespread Concerns About Extremism In
Muslim Nations, And Little Support For It
February 05, 2015
Widespread Concerns About Extremism In
Muslim Nations, And Little Support For It
 The horrific murder of Jordanian
pilot Moaz al-Kasasbeh has generated shock and outrage around the globe. And
if recent history is a guide, this brutal act will only deepen opposition to
ISIS, and to violent extremism more generally, in Jordan and other
predominantly Muslim nations.
The horrific murder of Jordanian
pilot Moaz al-Kasasbeh has generated shock and outrage around the globe. And
if recent history is a guide, this brutal act will only deepen opposition to
ISIS, and to violent extremism more generally, in Jordan and other
predominantly Muslim nations.
At the Pew Research Center, we’ve been asking questions related to extremism on our international surveys for over a decade, and what we’ve generally found among Muslim publics is that support for extremism is low, while concerns about it are high.
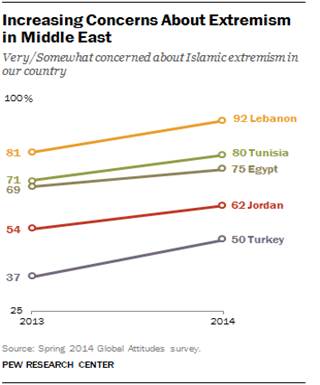
Even before ISIS’s battlefield victories and humanitarian atrocities began capturing international headlines last summer, we found growing worries about extremism in the Middle East. For instance, 62% of Jordanians said they were concerned about Islamic extremism in their country in our spring 2014 poll, up from 54% a year earlier. There were also increases in Lebanon, Tunisia, Egypt and Turkey.
The survey also found mostly negative views toward al Qaeda and other extremist groups in these and many other predominantly Muslim countries. The most positive rating for al Qaeda was in the Palestinian territories, where 25% had a favorable view of the terrorist organization.
One pattern we’ve seen in different parts of the world is that the more people are exposed to terrorist violence, the more they reject it. Jordan is a good example. Early in the last decade, Jordanians expressed relatively high levels of support for suicide bombing and confidence in Osama bin Laden, but this changed after the November 2005 suicide attacks on three hotels in Amman, Jordan’s capital. The bombings, which killed dozens and wounded more than 100, were orchestrated by an al Qaeda affiliate, led at the time by the Jordanian Abu Musab al-Zarqawi.

A few months later, a Pew Research survey found the percentage of Jordanian Muslims saying suicide attacks can often or sometimes be justified had fallen from 57% to 29%. Today, it stands at 15%. Similarly, confidence in bin Laden plummeted from 61% to 24% after the bombings, and by the time of his death just 13% of Jordanians had confidence in the terrorist leader.
Pakistan is another example. The terrible violence Pakistanis have experienced at the hands of the Taliban and other groups over the past decade has led many to reject violent extremism. In 2004, 41% of Pakistani Muslims said suicide bombing can often or sometimes be justified; by 2014 only 3% held this view.
In 2009, when the Taliban occupied Pakistan’s Swat Valley and threatened to drive even closer to the nation’s capital, Islamabad, opposition to the extremist group jumped dramatically. In 2008, just 33% of Pakistanis had an unfavorable view of the Taliban, but this rose to 70% in the 2009 survey. In Pakistan and elsewhere, once terrorist violence and extremist rule has become a reality, people have rejected it.
SUMMARY OF POLLS
WEST
ASIA
Public opinion divided over the possibility of war
between India and Pakistan
According to a Gilani Research Foundation Survey carried out by Gallup Pakistan, 48% Pakistanis believe there is possibility of war between India and Pakistan; 43% believe there is very little possibility. (Gallup Pakistan)
February 3, 2015
SOUTHEAST ASIA
Philippines:
85% says gays and lesbians should be protected against discrimination
Eighty-five
percent of adult Filipinos believe that gays and lesbians have the right to be
protected against any form of discrimination, according to the Social Weather
Survey of June 28-30, 2013. (SWS)
February 06, 2015
Philippines:
Adult joblessness at 27.0%; 9% lost their jobs involuntarily, 14% resigned
The Fourth Quarter
2014 Social Weather Survey, fielded over November 27-December 1, 2014, found
adult joblessness at 27.0% (est. 12.4 million adults). (SWS)
February 04, 2015
SUB-SAHARAN AFRICA
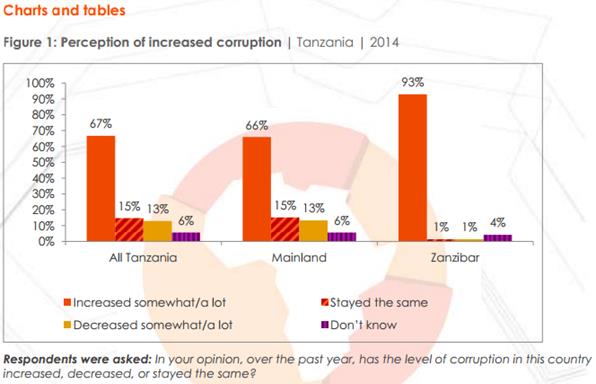
Tanzanians
see increased corruption, ineffective fight against it
A majority of
Tanzanians say that the level of corruption in the country has increased over
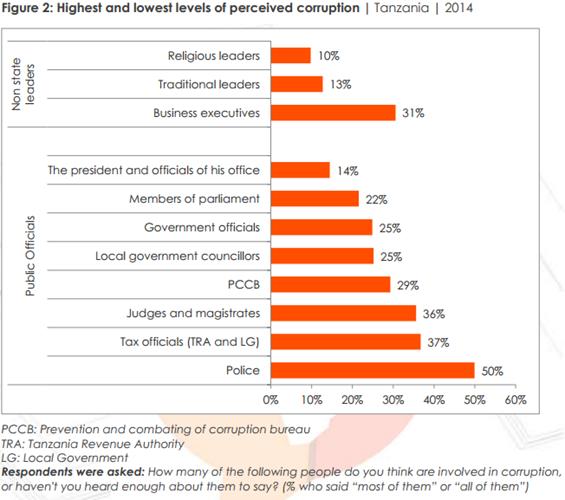
the past year, according to the latest Afrobarometer survey. The police, tax
officials, and judges and magistrates perceived as the most corrupt. Citizens’
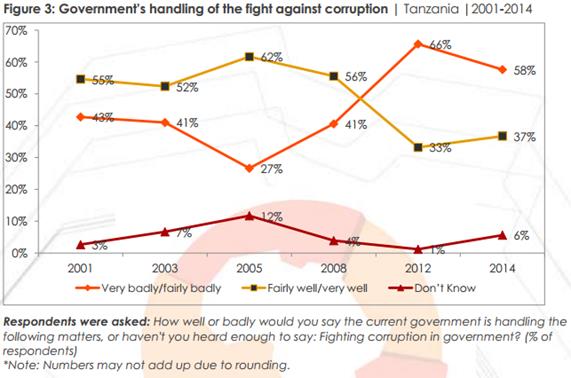
rating of the government’s handling of the fight against corruption has
improved slightly since 2012 but still remains mostly negative. (Afrobarometer)
February 06, 2015
EAST EUROPE
Paris
Terrorist Attacks: Russian Assessments
Russians believe
that Paris
shootings were caused by ineffective migration policies of the French
government and improper behavior of the Charlie Hebdo journalists. (VCIOM)
January 26, 2015
Ruble
Exchange Rate: Fears And Forecasts
Most of Russians are afraid of the
further drop in the ruble`s value; at the same time, one-third of Russians
believe that in the coming months the ruble exchange rate will not change much.
(VCIOM)
January 20, 2015
Protest
Actions: Manifestations Of Democracy Or Crisis?
The level of protest potential of
Russians is still low. Rallies and demonstrations are mainly perceived as
crisis symptoms rather than instruments to solve problems. (VCIOM)
January 23, 2015
WEST EUROPE
Economist/Ipsos
MORI January 2015 Issues Index
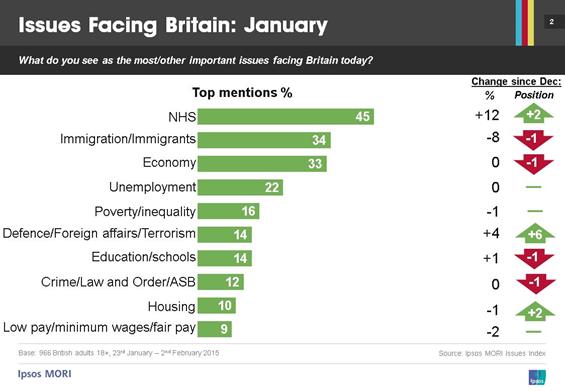
The first
Economist/Ipsos MORI Issues Index of 2015 shows that concern about the NHS has
increased by 12 percentage points since December of last year, and it is now
seen as the most important issue facing Britain – mentioned by almost half
(45%) of the public. (Ipsos MORI)
February 06, 2015
Captains
of Industry support Britain being in the EU
Could British business leaders be
the biggest block to UKIP’s campaign for parliament? The new Ipsos MORI
Captains of Industry survey shows that although 45% of Captains want to return
to being part of an economic community, without political links, just 1% would
be happy to leave it all together. Just under half (45%) want to continue our
relationship with the EU as it stands. (Ipsos MORI)
February 04, 2015
Public
perceptions of climate change in Britain following the winter 2013/14 flooding
A recent Ipsos
MORI survey for Cardiff University updates trend data on public attitudes to
climate change as well as providing new data on how the British public
responded to the flooding last winter. The study tested whether the
public, but particularly those affected by flooding, link the winter 2014
flooding to climate change. (Ipsos MORI)
February 02, 2015
Overwhelming
public support for the ‘Gordon’s Fightback’ Campaign
An Ipsos MORI
Scotland poll for the Gordon’s Fightback campaign shows overwhelming support
for their key objectives. Almost all of those polled (97%) would support the UK
government introducing a new system of fast tracking benefits for those with a
terminal illness, such as motor neurone disease. Support for such a measure is
overwhelming across all groups in the population. (Ipsos MORI)
February 02, 2015
UK: Voters:
time to slim down the royal family
Most British
people say that apart from the core royal family of the Queen, Charles and his
descendants, the rest should no longer receive money from the taxpayer and
royal estates. (YouGov)
February 2015
Scotland:
SNP lead at 21
The Scottish National
Party has retained its lead in Scotland – and on the question of Scottish
independence, Yes leads No by 4 points. (Ipsos Mori)
February 03, 2015
NORTH AMERICA
Obama
Approval Ratings Still Historically Polarized
Throughout
President Barack Obama's sixth full year in office, an average of 79% of
Democrats, compared with 9% of Republicans, approved of the job he was doing.
That 70-percentage-point party gap in approval ratings ties for the
fifth-most-polarized year for a president in Gallup records dating back to
1953. (Gallup USA)
February 06, 2015
Majorities
in Five States Approved of Obama in 2014
Residents of five
states gave President Barack Obama 50% or better job approval ratings in 2014,
with Massachusetts and Hawaii leading the list at roughly 53%. Wyoming
residents were the least approving, at 19.3%. (Gallup USA)
February 02, 2015
Eight-Point
Increase in Monthly Economic Confidence Index
Gallup's U.S.
Economic Confidence Index, which has been positive for each of the past six weeks, finished January
with an average score of +3 -- the first time a monthly average has been in
positive territory since the recession. The monthly index score is up eight
points from December -- the highest
month-to-month increase in more than a year. (Gallup USA)
February 03, 2015
Gallup
Student Poll: Job Confidence Lower in Higher Grades
Gallup Student
Poll students in elementary and middle school are much more optimistic about
their ability to find a good job than are students in high school. The
percentage of students in grades 5 through 12 who strongly agree with the
statement, "I know I will find a good job after I graduate" declines
from 68% in grade 5 to 49% in grade 10, and remains at about that level through
grade 12. (Gallup USA)
February 03, 2015
For
Banks, Baby Boomers Mean Lucrative Business
For banks, baby
boomers stand out among generations as highly attractive and lucrative
customers. (Gallup USA)
February 02, 2015
After
Holidays, January U.S. Consumer Spending Falls to $81
U.S. consumers'
daily self-reports of spending fell to an average of $81 in January, down from
$98 in December. Spending usually drops after the holiday season, falling an
average of $15 each January since 2008. Despite this year's $17 drop, $81 is
one of the highest self-reported averages in any January since 2008. (Gallup
USA)
February 02, 2015
U.S.
Flu Reports Decline in January
The 2014-2015 U.S.
flu season may have peaked early. In January 2015, an average of 3.3% of
Americans reported they "were sick with the flu yesterday." This is
down from 4.0% in December, the highest rate
in any December since Gallup began tracking the flu daily in 2008. Average flu
reports in January are also lower than in January 2013 and January 2014.
(Gallup USA)
February 05, 2015
U.S.
Small-Business Owners' Optimism Highest Since 2008
U.S.
small-business owners are the most optimistic they have been in seven years,
according to the latest Wells Fargo/Gallup Small Business
Index.
The index, at +71, has increased significantly for two consecutive quarters,
and reflects optimism in small-business owners' views of both their current
situation and their expectations for the future. (Gallup USA)
February 05, 2015
U.S.
Payroll to Population Rate 44.1% in January
The U.S. Payroll
to Population employment rate (P2P), as measured by Gallup, was 44.1% in
January. This is statistically similar to the 44.3% measured in December, but
it is the highest measurement of P2P for any January since Gallup began
tracking the metric in 2010. January is typically one of the lowest months for
P2P in any year. (Gallup USA)
February 05, 2015
U.S.
Job Creation Lingers Near Seven-Year High
The hiring climate
at the start of 2015 is similar to where it stood in the second half of 2014,
with Gallup's U.S. Job Creation Index coming in at +28 for the month of
January. This is nearly identical to the +27 found in December, and just below
the seven-year high of +30 reached in September. (Gallup USA)
February 04, 2015
Investigative
Journalists and Digital Security
About two-thirds
of investigative journalists surveyed (64%) believe that the U.S. government
has probably collected data about their phone calls, emails or online
communications, and eight-in-ten believe that being a journalist increases the
likelihood that their data will be collected. (Pew Research Center)
February 05, 2015
LATIN AMERICA
65%
of Brazilians have a positive view of the UN
A survey conducted
by IBOPE Inteligência in Brazil to measure what Brazil´s population knows about
the United Nations (UN) shows that 74% of Brazilians know or have heard of the
UN, and 65% consider the work of the international organization as positive
(22%) or very positive (43%). (Ibope)
February 02, 2015
19% of
Brazilians do not know better time to buy tickets or travel package
To travel economically it is
necessary to plan. The trip planning is essential to ensure the best and
know the best dates for the holidays. According to a survey * of CONECTAí
to Skyscanner, 19% of Brazilians still do not know the best time to purchase
tickets or travel package and 14% still have doubts became the most economical
choice.
(Ibope)
February 06, 2015
MULTI-COUNTRY
SURVEYS
Widespread
concerns about extremism in Muslim nations, and little support for it
The horrific murder of Jordanian pilot Moaz
al-Kasasbeh
has generated shock and outrage around the globe. And if recent history is a
guide, this brutal act will only deepen opposition to ISIS, and to violent
extremism more generally, in Jordan and other predominantly Muslim nations.
(Pew Research Center)
February 05, 2015
Consumer
Mood Brightened Again Towards End Of Year
The mood of
consumers throughout Europe improved again over the fourth quarter of the year.
The indicators for economic and income expectations, as well as willingness to
buy, rose towards the end of the year in almost all countries of the European
Union (EU). The consumer climate for the EU 28 also improved by 1.3 points in
the final quarter, closing the year at 5.5 points. These are the findings of
the GfK Consumer Climate Europe study in 14 European countries. (GFK)
February 04, 2015
CYBER WORLD
More
Australians buying eBooks
Amid recent reports in the UK that the eBook may have had its day, Roy
Morgan Research’s latest figures reveal that this might not be the case in
Australia. In fact, over the past two years, online sales of eBooks have
increased across most age groups — along with the proportion of Aussies reading
novels or non-fiction titles in an average three-month period. (Roy Morgan)
February 02, 2015
ANALYSIS TANK
America’s
‘middle’ holds its ground after the Great Recession
WEST ASIA
366-43-1. Public
opinion divided over the possibility of war between India and Pakistan
GILANI RESEARCH FOUNDATION (GRF POLL)
February 3, 2015
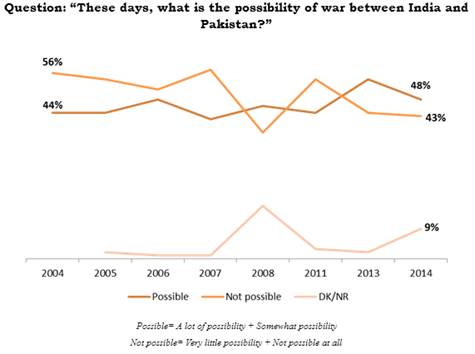
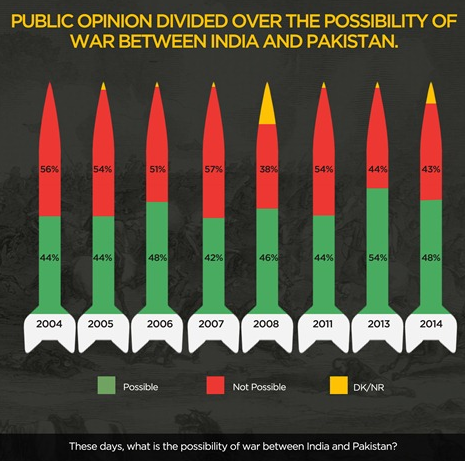
According to a Gilani Research Foundation Survey carried out by Gallup Pakistan, 48% Pakistanis believe there is possibility of war between India and Pakistan; 43% believe there is very little possibility.
A nationally representative sample of adult men and women, from across the four provinces was asked, “These days, what is the possibility of war between India and Pakistan?” In response to this question, 15% respondents said there is a lot of possibility, 33% said there is somewhat possibility, while 43% believe there is very little possibility and 9% did not respond.
This question was also asked previously over the last decade. In 2004, 6% respondents said there was a lot of possibility of war between India and Pakistan, while 38% said there was somewhat possibility and 56% said there was no possibility at all. There were minor fluctuations in public opinion between 2004 and 2007. In 2008 however, there was a sharp decline in the percentage of respondents who thought war was not possible (57% to 38%), corresponding with an increase in individuals refusing to respond to the question (1% to 15%). After 2008, the percentage of those who think war was not possible rose once again (54% in 2011) but sharply declined to 44% in 2013. This was complimented by an increase in those who think war is possible between 2011 and 2013 (44% to 54%) before this percentage also declined slightly to 48% in 2014.
The study was released by Gilani Research Foundation and
carried out by Gallup Pakistan, the Pakistani affiliate of Gallup
International. The recent survey was carried out among a sample of 2442 men and
women in rural and urban areas of all four provinces of the country, during
December 29, 2014 – January 05, 2015. Error margin is estimated to be
approximately ± 2-3 per cent at 95% confidence level.
SOUTHEAST ASIA
366-43-2.
Philippines: 85% says gays and lesbians should be protected against
discrimination
SWS Special Report:
February 06, 2015
Eighty-five percent of adult Filipinos believe that gays and lesbians have the right to be protected against any form of discrimination, according to the Social Weather Survey of June 28-30, 2013.
To the statement, “Just like me, gays and lesbians also have the right to be protected against any form of discrimination [Tulad ko, ang mga bakla, lesbiyana o tomboy ay may karapatan ding proteksyonan laban sa kahit na anong uri ng diskriminasyon]”, 85% agree, 5% disagree, and 10% are undecided [Chart 1].
Out of the six specific statements about gays and lesbians tested in June and September 2013, results showed sympathetic attitude on 5 issues, and unsympathetic on one issue.
The strongest sympathetic attitude was (a) the importance of non-discrimination, followed by (b) the belief that gays and lesbians are just as trustworthy as any other Filipino, (c) the big contribution of gays and lesbians to societal progress, (d) the belief that being gay or lesbian is NOT a form of mental illness, and (e) the belief that being gay or lesbian is NOT contagious.
The only statement where opinions are more on the unsympathetic side was (f) the belief that Acquired Immunodeficiency Syndrome, or AIDS, can be considered as a sickness of gays and lesbians.
Gays and lesbians are trustworthy? 67% agree, 18% disagree
In the September 20-23, 2013 Social Weather Survey, 67% agree and 18% disagree that “Gays or lesbians are just as trustworthy as any other Filipino [Ang mga bakla, lesbiyana o tomboy ay mapagkakatiwalaan tulad rin ng ibang Pilipino]”. The remaining 14% are undecided about this matter [Chart 2].
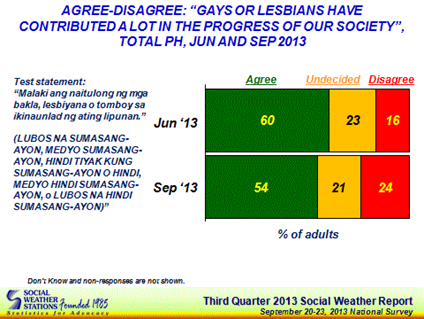
Gays and lesbians have contributed a lot to societal progress? 54% agree, 24% disagree
The September 2013 survey found that 54% agree with the statement, “Gays or lesbians have contributed a lot in the progress of our society [Malaki ang naitulong ng mga bakla, lesbiyana o tomboy sa ikinaunlad ng ating lipunan]”, slightly less than the 60% in June 2013 [Chart 3].
Compared to June 2013, the proportion of those who disagree rose from 16% to 24%, while those who areundecided hardly moved from 23% to 21%.
Is being gay or lesbian a form of mental illness? 54% disagree, 25% agree
In June 2013, 54% disagree and 25% agree that “Being gay or lesbian is a form of mental illness [Ang pagiging bakla, lesbiyana o tomboy ay isang uri ng sakit sa pag-iisip]”. Twenty percent are undecided, and 1% did not give an answer [Chart 4].
Is being gay or lesbian contagious? 45% disagree, 38% agree
To the statement, “Being gay or lesbian is contagious [Nakakahawa ang pagiging bakla, lesbiyana o tomboy]”, the September 2013 survey found that a plurality 45% disagree and 38% agree. Sixteen percent areundecided, and 1% did not give an answer [Chart 5].
Can AIDS be considered a sickness of gays or lesbians? 45% agree, 33% disagree
The September 2013 survey found that a plurality 45% agree and 33% disagree with the statement,“Acquired Immuno Deficiency Syndrome or AIDS can be considered as a sickness of gays and lesbians [Ang Acquired Immuno Deficiency Syndrome o AIDS ay maituturing na sakit ng mga bakla, lesbiyana o tomboy]”. One out of five (21%) are undecided, and 1% did not give an answer [Chart 6].
Survey Background
The Social Weather Surveys of Second and Third Quarters 2013 were conducted on June 28-30, 2013 and September 20-23, 2013, respectively. Both surveys used face-to-face interviews of 1,200 adults nationwide, 300 each in Metro Manila, the Balance of Luzon, Visayas, and Mindanao (sampling error margins of ±3% for national percentages, and ±6% for Metro Manila, Balance Luzon, Visayas, and Mindanao).
The area estimates were weighted by National Statistics Office medium-population projections for 2013 to obtain the national estimates.
In both surveys, the introduction used for each test statement was, “I have here some statements which may reflect how people feel or think about gays or lesbians. Please tell me if you agree or disagree with these statements. You may indicate your answers by placing the card with the statement in the appropriate place in this rating board. (STRONGLY AGREE, SOMEWHAT AGREE, UNDECIDED IF AGREE OR NOT, SOMEWHAT DISAGREE, or STRONGLY DISAGREE)[Mayroon ako ritong mga statements o pangungusap na maaaring maglarawan sa nararamdaman o naiisip ng mga tao ngayon tungkol sa mga bakla, lesbiyana o tomboy. Pakisabi po kung kayo ay sumasang-ayon o hindi sumasang-ayon sa mga statements o pangungusap na ito. Pakilagay lang po ang kard na may pangungusap sa naaangkop na lugar sa rating board na ito. (LUBOS NA SUMASANG-AYON, MEDYO SUMASANG-AYON, HINDI TIYAK KUNG SUMASANG-AYON O HINDI, MEDYO HINDI SUMASANG-AYON, o LUBOS NA HINDI SUMASANG-AYON)]
The Social Weather Survey items on agreement-disagreement with specific positive and negative statements about gays and lesbians were not commissioned, and were done on SWS's own initiative.
The findings in this report were presented in the paper, “Measuring Homophobia in the Philippines”, by Vladymir Joseph Licudine <vlad.licudine@sws.org.ph> and Ma. Leah Czarina Aldave <leah.aldave@sws.org.ph> at the XVII World Congress of Sociology, held in Yokohama, Japan, last July 13-19, 2014. Please contact the authors for inquiries on the paper presented.
SWS employs its own staff for questionnaire design, sampling, fieldwork, data-processing, and analysis, and does not outsource any of its survey operations.
#
Chart 1
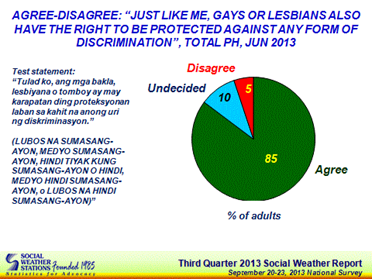
Chart 2
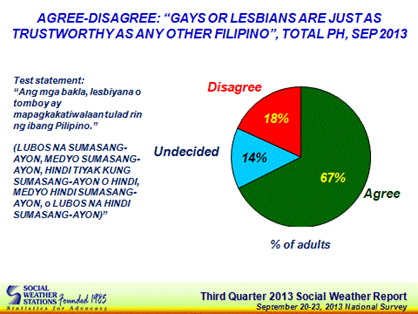
Chart 3
Source: http://www.sws.org.ph/
366-43-3. Adult
joblessness at 27.0%; 9% lost their jobs involuntarily, 14% resigned
February
04, 2015
Fourth Quarter 2014 Social Weather Survey:
The Fourth Quarter 2014 Social Weather Survey, fielded over November 27-December 1, 2014, found adult joblessness at 27.0% (est. 12.4 million adults).
This is 4.1 points above the 22.9% (est. 10.4 million
adults) in September 2014. This brings the 2014 annual average to 25.4%, or
close to the 2013 annual average of 25.2%.
Joblessness was at a record-high 34.4% in March 2012. It has since then been
between 21.7% and 29.4% [Chart 1, Table 1].
The December 2014 adult joblessness rate consisted of 14% (est. 6.5 million adults) who voluntarily left their old jobs, 9% (est. 4.3 million adults) who involuntarily lost their jobs, and 3% (est. 1.5 million adults) who were first-time job seekers [Chart 2].
The survey also found that 36% of adults say the number of available jobs in the next 12 months will increase, 32% say it will not change, and 20% say it will decrease.
This gave a Net Optimism on job availability score of +16 (% more jobs minus % fewer jobs), classified by SWS as fair. This is 4 points above the fair +12 in September 2014 [Chart 3].
The SWS terminology for Net Optimism on job availability: +30 and above - "very high"; +20 to +29 - "high"; +10 to +19 - "fair"; +1 to +9 - "mediocre"; -9 to zero - "low"; -10 and down - "very low".
Profiles of the jobless
Adult joblessness consists of (a) those who voluntarily
left their old jobs, (b) those who lost their jobs due to economic
circumstances beyond their control, termed as the retrenched, and (c) those
seeking jobs for the first time.
The proportion of those who resigned or left their old jobs voluntarily rose by
2 points from 12% in September to 14% in December.
Those who were retrenched rose by 2 points, from 7% in September to 9% in December.
The 9% (correctly rounded) who were retrenched consisted of 6% whose previous contracts were not renewed, 2% whose employers closed operations, and 2% who were laid off.
First-time job seekers stayed at 3%.
Joblessness rose among women, and among 25 up
Compared to the previous quarter, adult joblessness rose sharply among women, from 33.2% in September to 41.7% in December, the highest since 42.5% in August 2012 [Chart 4, Table 2].
It barely moved among men, rising from 14.9% to 15.6%.
By age group, adult joblessness rose among those aged 25-34, from 30% in September to 32% in December [Chart 5, Table 3].
It rose among those aged 35-44, from 18% to 22%.
It also rose among those aged 45 and above, from 15% to 19%.
On the other hand, it fell among 18-24 (youth), from 50% to 48%.
Job availability prospect rose to "fair" +16
On the survey question, "Sa darating na 12 buwan mula ngayon, sa palagay ba ninyo ay DADAMI, HINDI MAGBABAGO, o MABABAWASAN ang trabaho na maaaring pasukan?" ["Twelve months from now, do you think there will be MORE JOBS, NO CHANGE in available jobs, or FEWER JOBS?"], optimism that there will be more jobs rose from 33% in September to 36% in December, while pessimism that there will be fewer jobs fell from 22% to 20%.
The proportion of those who say there will be no change in
job availability hardly changed from 33% to 32%.
This brought the Net Optimism on job availability score (% more jobs minus %
fewer jobs) up by 4 points, from "fair" +12 to "fair" +16.
SWS Joblessness versus Labor Force Survey (LFS) Unemployment
The SWS data on joblessness refer to the population of adults in the labor force. This is because respondents in the standard SWS surveys are those at least 18 years old. On the other hand, the official lower boundary of the labor force has always been 15 years of age.
In the SWS surveys, persons with jobs are those who have a job at present ("may trabaho sa kasalukuyan"), including unpaid family workers. The question does not use any past reference period. The SWS joblessness figures are consistently based on the traditional definition of joblessness as fulfilling two requirements: without a job at present and looking for a job. Those without a job without looking for one, such as housewives, retirees, differently abled, and students, are excluded from the labor force.
On the other hand, the official Labor Force Survey (LFS) definition of employed include all those who, during the week before the interview date, are 15 years and over as of their last birthday and are reported to be either:
a. At work. Those who do any work for at least one hour during the reference week for pay or profit, or work without pay on the farm or business enterprise operated by a member of the same household related by blood, marriage, or adoption; or
b. With a job but not at work. Those who have a job or a business but are not at work because of temporary illness/injury, vacation, or other reasons. Also, persons who expect to report for work or to start operation of a farm or business enterprise within two weeks from the date of the enumerator's visit are considered employed.
Before April 2005, the official definition of the unemployed was those who did not work during the reference week and looking for work. However, from April 2005 onwards, the official definition was refined as follows:not working, looking for work, and available for work. It subtracts those who are looking but not available for work and adds those available but not looking for work for the following reasons: tired/believe no work is available, awaiting results of a job application, temporarily ill/disabled, bad weather, and waiting for rehire/job recall.
This means that if the availability requirement is included, adult joblessness in December 2014 was 17.9% (est. 7.3 million adults). That is, 17.6% (est. 7.2 million adults) who were not working, looking for work, and available for work and 0.2% (est. 90900 adults) who were not working, not looking for work due to the reasons mentioned above, but available for work.
Therefore, among the 12.4 million adults who were jobless and were looking for work, 41% (est. 5.1 million adults) were not available for work at present or in the next two weeks.
Survey Background
The December 2014 Social Weather Survey was conducted from November 27-December 1, 2014 using face-to-face interviews of 1,800 adults nationwide, 300 each in Metro Manila, the Balance of Luzon and Mindanao, and 900 in the Visayas (sampling error margins of ±2% for national percentages, ±6% each for Metro Manila, Balance Luzon and Mindanao, and ±3% for Visayas).
The area estimates were weighted by National Statistics Office medium-population projections for 2014 to obtain the national estimates.
The quarterly Social Weather Surveys on joblessness and job availability are not commissioned, but are done on SWS's own initiative and released as a public service, with first printing rights assigned to BusinessWorld.
SWS employs its own staff for questionnaire design, sampling, fieldwork, data processing, and analysis, and does not outsource any of its survey operations.
The exact SWS questionnaire items on joblessness are as follows:
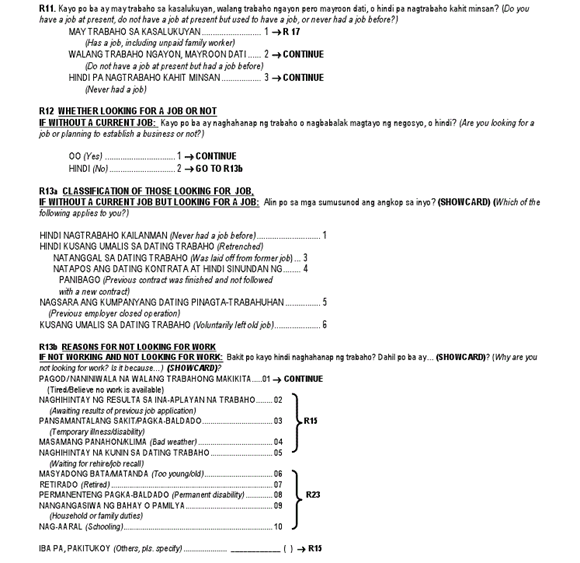
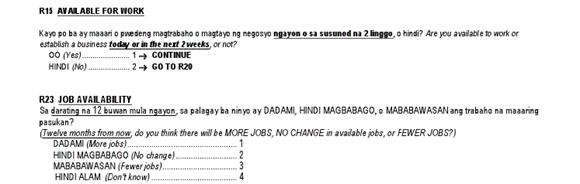
Source: http://www.sws.org.ph/
SUB-SAHARAN AFRICA
366-43-4. Tanzanians see increased
corruption, ineffective fight against it
February
06, 2015
A
majority of Tanzanians say that the level of corruption in the country has
increased over the past year, according to the latest Afrobarometer survey. The
police, tax officials, and judges and magistrates perceived as the most
corrupt. Citizens’ rating of the government’s handling of the fight against
corruption has improved slightly since 2012 but still remains mostly negative –
and far more negative than a decade ago. Tanzanians laud news media’s
effectiveness and show considerable support for the role played by the media in
exposing corruption. These results come at a time when the Tanzanian public is
eagerly monitoring how the government is responding to the latest grand
corruption scandal. Early last year, the media reported that hundreds of
billions of shillings were siphoned from the Tegeta Escrow account at the Bank
of Tanzania, leading to public outcry and suspension of donor assistance to the
Tanzanian government. A parliamentary probe implicated key figures in the
government, and Parliament passed a resolution calling for immediate actions
against them. Key findings Two-thirds
(67%) of Tanzanians say that corruption increased during the past year.
Sub-groups
§
that hold this view the most include people in Zanzibar (93%) (Figure 1) and
urbanites (72%). The more educated a person is, the more likely he or she is to
say corruption increased. Half of
Tanzanians (50%) believe that most or all police are corrupt. More than
one-third say
§
most or all tax officials and judges and magistrates are corrupt. Slightly more Tanzanians than in 2012 say the
government is handling the fight against
§
corruption well or very well (37% vs. 33%). But a majority (58%) rates the government’s
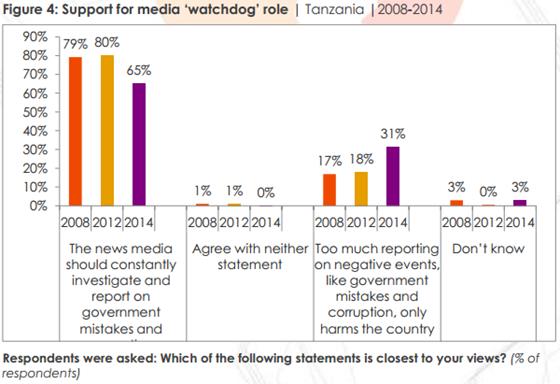
performance as bad or very bad. Amidst
persistent reports of malfeasance in the public sector, 65% of Tanzanians say
that the media should constantly investigate and report on government
corruption and mistakes (Figure 4).
Afrobarometer
Afrobarometer
is an African-led, non-partisan research network that conducts public attitude
surveys on democracy, governance, economic conditions, and related issues
across more than 30 countries in Africa. Five rounds of surveys were conducted
between 1999 and 2013, and Round 6 surveys are currently under way (2014-2015).
Afrobarometer conducts face-to-face interviews in the language of the
respondent’s choice with nationally representative samples of between 1,200 and
2,400 respondents.
The
Afrobarometer team in Tanzania, led by REPOA, interviewed 2,386 adult
Tanzanians between August 26th and September 29th 20141. A sample of this size
yields results with a margin of error of +/- 2% at a 95% confidence level.
Previous surveys have been conducted in Tanzania in 2001, 2003, 2005, 2008. and
2012..
EAST EUROPE
366-43-5. Paris Terrorist Attacks:
Russian Assessments
Paris shootings were caused by
ineffective migration policies of the French government and improper behavior
of the Charlie Hebdo journalists.
MOSCOW, January 26, 2015. Russian Public Opinion Research Center (VCIOM)
presents the results of the survey describing how many Russians are aware of
the terrorist attack on the French weekly newspaper Charlie Hebdo as well as
what they think was the reason behind the shootings.
Seventy-four percent of Russians are
aware of what happened in the offices of the Charlie Hebdo weekly newspaper on
January 7th. Twenty-three percent of Rusians have
seen the Prophet Muhammad cartoons that were published before
the shooting; 51% of Russians heard about the terrorist attack but did not see
any cartoons. Ninety percent of residents of Moscow and St.Petersburg are
informed about the tragedy.
The major reasons behind the Charlie
Hebdo attack are insulting Muslim religious feelings
(30%) and soft mass media policies of the French authorities that allow them
insulting the believers (25%). Eleven percent of Russians oppose them stating
that the main cause is that the French authorities allow immigrants to enter
the country and this creates a huge flow of immigrants. Eight percent believe
that the tragedy happened because of the cruelty of the Muslim extremists; 6%
mention poor work of the French police and security services.
An overwhelming majority of
respondents (87%) condemn the armed attack on the editorial and the killings of
the journalists; at the same
time, 39% say that they can understand why this happened; 48% fail to explain
the reason behind the tragedy.
The VCIOM opinion poll was
conducted on January 17-18, 2015. 1600 respondents were interviewed
in 132 communities in 46 regions of Russia. The margin of error does not exceed 3,5%.
|
Last week the French weekly
newspaper published the cartoons of the Prophet Mohammed that provoked the
attacks on the offices of the newspaper; several journalists were killed.
Have you heard about it/have you seen the cartoons? (close-ended question,
one answer) |
|||||||
|
|
Total respondents |
Moscow and St.Petersburg |
Million cities |
More than 500 ths |
100–500 ths |
Less than 100 ths |
Rural area |
|
Yes, I heard about it and I
have seen the cartoons |
23 |
21 |
21 |
22 |
25 |
18 |
27 |
|
Yes, I know what happened but I
have not seen the cartoons |
51 |
69 |
43 |
36 |
48 |
54 |
50 |
|
I know nothing about it |
22 |
5 |
35 |
38 |
23 |
23 |
19 |
|
Don`t know |
4 |
5 |
1 |
4 |
3 |
4 |
4 |
|
In your opinion, what is the basic
reason behind the shooting? (close-ended question, one answer, % of those who
know what happened) |
|||||||
|
|
Total respondents |
A Just Russia party |
Supporters of LDPR |
Supporters of CPRF |
Supporters of United Russia party |
Supporters of non-parliament
parties |
I would not take part in elections |
|
French journalists who insulted
Muslim religious values |
30 |
23 |
22 |
33 |
33 |
24 |
29 |
|
Policies of the French government
that allows journalists insulting religious values |
25 |
35 |
16 |
19 |
27 |
20 |
24 |
|
Policies of the French government
that allows Muslims entering the country |
11 |
10 |
25 |
13 |
9 |
12 |
11 |
|
Several extremist Muslims whose
response to these cartoons was violence |
8 |
6 |
8 |
8 |
7 |
8 |
9 |
|
Poor work of French police and
security services |
6 |
13 |
6 |
7 |
6 |
4 |
7 |
|
Politics of the self-proclaimed
Islamic State; hatred of the Islamic extremists towards secular society and
freedom of speech |
5 |
3 |
12 |
2 |
5 |
12 |
6 |
|
Other |
3 |
<1 |
2 |
6 |
2 |
8 |
3 |
|
Don`t know |
12 |
10 |
10 |
11 |
12 |
12 |
11 |
|
What are your attitudes towards
people who attacked the French weekly newspaper`s office? (close-ended
question, one answer, % of those who know what happened) |
||||||
|
|
Total respondents |
Aged 18-24 |
Aged 25-34 |
Aged 35-44 |
Aged 45-59 |
60 and over |
|
I do not understand and do not
appreciate such actions |
48 |
43 |
47 |
45 |
49 |
54 |
|
I do not approve of them but
I understand the reasons behind it |
39 |
38 |
41 |
42 |
40 |
35 |
|
I understand and approve of the
actions of such people |
5 |
10 |
5 |
5 |
3 |
3 |
|
Don`t know |
8 |
9 |
7 |
8 |
8 |
8 |
Note: Using materials from the site www.wciom.ru or wciom.com,
as well as distributed by VCIOM, the reference to the source (or hyperlink for
the electronic media) is obligatory!
366-43-6. Ruble Exchange Rate: Fears
And Forecasts
Most of Russians are afraid of the further
drop in the ruble`s value; at the same time, one-third of Russians believe that
in the coming months the ruble exchange rate will not change much.
MOSCOW, January 20, 2015. Russian Public Opinion Research Center (VCIOM)
presents the information describing what currency Russians use to save money;
how much they are concerned about the ruble decline; what they expect to happen
with the ruble in the months to come.
Half of Russians (52%) do not have
savings. An overwhelming majority of those who make savings still
prefer rubles (46%); 4% prefer dollar, 2% choose euro; and less than
1% opt for other foreign currencies.
Russians show high levels of
interest towards foreign currencies:
66% report that they keep an eye on the situation in the currency markets (27%
regularly; 39% - from time to time). Those who keep an eye on the situation
constantly are respondents with high education diplomas (35%) and high
financial income (35%).
Sixty-three percent of Russians are
concerned about the current dollar exchange rate 63% (57% in November 2014). Those who are most concerned are
residents of Moscow and St. Petersburg (73%), respondents with high income
(72%) and students (71%). Thirty-three percent of Russians are not bothered
with the problem.
The reasons behind the drop of ruble
are the policies of western countries and anti-Russian sanctions (18%) and a
decrease in oil prices (17%). Rarely
respondents mention the general economic situation in the country (7%) or the
policies of the Russian authorities (6%). Five percent say that the situation
is artificial, and certain people benefit from that.
Today much less Russians are
negative about the future of the ruble in the near two or three months compared
to November 2014: 27% say that ruble will keep
falling (46% in late 2014). On the contrary, more Russians believe that the
ruble exchange rate will stay at the same level as today (from 24% to 36%).
Only 16% are confident that ruble will strengthen; this share is higher than it
was before.
If the dollar` value keeps
increasing, 77% of Russians will make no moves. Those who will try to do something will invest money
in real property and expensive items (6%). Certain respondents would buy
dollars in exchange for rubles (3%) or euro or other currency (1%). Three percent
of Russians will start spending their savings.
The VCIOM opinion poll was
conducted on January 10-11, 2014. 1600 respondents were interviewed
in 132 communities in 46 regions of Russia. The margin of error does not exceed 3,5%.
|
What
currency do you use for your savings? (close-ended question, not more than 3
answers) |
|||||||||||||||||
|
|
I qrt 08 |
IV qrt 08 |
I qrt 09 |
II qrt 09 |
III qrt 09 |
IV qrt 09 |
I qrt 10 |
II qrt 10 |
III qrt 10 |
IV v qrt 10 |
IV qrt 11 |
II qrt 13 |
III qrt 13 |
IV qrt 13 |
I qrt 14 |
IV qrt 14 |
I qrt 15 |
|
Ruble |
33 |
37 |
33 |
28 |
27 |
30 |
21 |
26 |
25 |
24 |
38 |
55 |
49 |
40 |
40 |
47 |
46 |
|
Dollar |
1 |
1 |
2 |
2 |
3 |
3 |
2 |
3 |
3 |
3 |
5 |
5 |
4 |
5 |
4 |
3 |
4 |
|
Euro |
2 |
1 |
2 |
2 |
2 |
3 |
2 |
2 |
3 |
2 |
4 |
2 |
1 |
3 |
2 |
2 |
2 |
|
Other currency |
<1 |
<1 |
<1 |
<1 |
<1 |
<1 |
<1 |
<1 |
<1 |
<1 |
<1 |
1 |
<1 |
<1 |
<1 |
<1 |
<1 |
|
No savings |
57 |
58 |
61 |
66 |
65 |
64 |
70 |
69 |
70 |
66 |
55 |
38 |
46 |
53 |
54 |
49 |
52 |
|
Don`t know |
7 |
2 |
3 |
2 |
4 |
3 |
7 |
3 |
3 |
8 |
3 |
5 |
2 |
2 |
2 |
2 |
1 |
|
Do you
follow the dollar to ruble exchange rate? (close-ended question, one answer) |
|||||||||||
|
|
IV v 2008 |
IV qrt 2009 |
IV qrt 2010 |
IV qrt 2011 |
IV qrt 2012 |
IV qrt 2013 |
I qrt 2014 |
II qrt 2014 |
III qrt 2014 |
IV qrt 2014 |
I qrt 2015 |
|
Yes, regularly |
17 |
13 |
13 |
13 |
11 |
14 |
16 |
14 |
19 |
27 |
27 |
|
Yes, sometimes |
37 |
37 |
33 |
30 |
31 |
35 |
37 |
37 |
36 |
38 |
39 |
|
No |
43 |
48 |
52 |
55 |
57 |
50 |
46 |
47 |
44 |
34 |
33 |
|
Don`t know |
3 |
1 |
2 |
2 |
1 |
2 |
1 |
1 |
2 |
1 |
1 |
|
Are you
concerned about the dollar exchange rate? (close-ended question, one answer) |
|||||
|
|
February 2002 |
July 2013 |
February 2014 |
November 2014 |
January 2015 |
|
Rather yes |
62 |
29 |
42 |
57 |
63 |
|
Rather no |
34 |
68 |
53 |
39 |
33 |
|
Don`t know |
4 |
4 |
5 |
4 |
4 |
|
The
ruble`s exchange rate against the U.S. is decreasing. What is the reason
behind that? (open-ended question, any number of answers) |
|
|
|
Total respondents |
|
American/western policies,
sanctions |
18 |
|
Drop in oil prices |
17 |
|
Economic situation in the country |
7 |
|
Politics of Russian authorities |
6 |
|
Artificial situation; someone
benefits from that |
5 |
|
Situation in Ukraine |
3 |
|
Central Bank of Russia`s policies
(not supporting ruble) |
2 |
|
Increase of prices |
1 |
|
No domestic production |
1 |
|
Sochi Olympics |
<1 |
|
Russia is losing its positions in
the world |
<1 |
|
Corruption |
<1 |
|
It is seasonal |
<1 |
|
Other |
2 |
|
I do not mention that |
10 |
|
Don`t know |
35 |
|
In your
opinion, how will the ruble`s positions change in recent two or three months?
(close-ended question, one answer) |
||||
|
|
July 2013 |
February 2014 |
November 2014 |
January 2015 |
|
Ruble will be cheaper |
34 |
41 |
46 |
27 |
|
Ruble will stay at the same level |
38 |
33 |
24 |
36 |
|
Ruble will get more expensive |
8 |
5 |
12 |
16 |
|
Don`t know |
19 |
21 |
17 |
21 |
|
If the
dollar exchange rate keeps growing, what will you do? (close-ended question,
not more than two answers) |
|||||
|
|
October 2011 |
July 2013 |
February 2014 |
November 2014 |
January 2015 |
|
Nothing special |
74 |
77 |
75 |
81 |
77 |
|
I will invest money in real
property and other expensive items |
9 |
6 |
8 |
4 |
6 |
|
I will exchange rubles for dollars |
5 |
9 |
7 |
5 |
3 |
|
I will start spending money and
savings* |
- |
- |
3 |
2 |
3 |
|
I will exchange euro (other
currency) for dollars |
2 |
2 |
2 |
1 |
1 |
|
Other |
1 |
2 |
1 |
2 |
3 |
|
Don`t know |
10 |
6 |
6 |
6 |
8 |
*In 2011 and 2013 this answer choice
was not used
Note: Using materials from the site www.wciom.ru or wciom.com,
as well as distributed by VCIOM, the reference to the source (or hyperlink for
the electronic media) is obligatory!
366-43-7. Protest Actions:
Manifestations Of Democracy Or Crisis?
The level of protest potential of
Russians is still low. Rallies and demonstrations are mainly perceived as
crisis symptoms rather than instruments to solve problems.
MOSCOW, January 23, 2015. Russian Public Opinion Research Center (VCIOM)
presents the results of the survey concerning the public and personal protest
potential in Russia.
The protest potential growth that
started in the first quarter of 2014 was mentioned in the first decade of
January 2015: protest potential index* exceeded the previous monthly average and
reached 34 points. Twenty-seven
percent of Russians believe that protests are possible in their community.
However, a relative majority of Russians (66%) still think that the protests
are hardly possible in their cities/rural area.
The index measuring Russians`
readiness to take part in mass rallies has been fluctuating between 23 and 25
points over the recent half a year. In
January the personal protest potential index** made up 25 points. Three quarter
of Russians (77%) report that they will never hold a mass meeting. Only 16% say
they would (the shares of those have low level of education and low income is
23% in each group).
Russians have no desire to take to
the streets to protest against social injustice because they think that rallies
are useless (37%), however today the number of
those who have such a stance is smaller than in was in 2013 (47%). Others are
afraid that the law enforcement officers will use force (28%); that they will
have problems at work (26%), or they will be arrested (25%). Every fifth
respondent (19%) thinks that people worry about their only problems, and they
do not want to deal with social problems. Sixteen percent cite the lack of
information about protest actions (16%); 12% do not like mass gatherings in
general.
For the time being, Russians are
much more negative about rallies than they were three years ago: in 2012, 22%
said that protests were unacceptable and would lead to the collapse; today the
share of such people is 30%. Those
who think so are mainly residents of Moscow and St.Petersburg (42%), rather
than rural area residents (27%). More than one-third of respondents
(38%) say that rallies are manifestations of the systemic crisis (28% in 2012).
At the same time, the share of those who believe that rallies, picketing etc.
are manifestations of democracy and general means to solve problems has
decreased (from 36% to 23%).
*Public protest potential index shows how possible Russians think the mass protests
are. The index is based on the question “In your opinion, are mass protests
against fall in living standards possible in your city/rural area?” If the
answer is “rather possible”, the coefficient is 0,9; “hardly possible” -– 0,1;
“undecided” – 0,5. The index is measured in percentage points and can vary
between 10 and 90. The higher the value of index is, the more confident
Russians are that the protests may happen in their community.
**Personal protest potential index shows the readiness of Russians to take part in mass
protests. The index is based on the question “If mass protests against fall in
living standards happen in our city/rural area will you personally take part or
not?” If the answer is “rather yes”, the coefficient is 0,9; “rather no”
– 0,1; “undecided” – 0,5. The index is measured in percentage points and
can vary between 10 and 90. The higher the value of index is, the more
respondents are ready to take part in the protests.
The VCIOM opinion poll was
conducted on January 10-11, 2015. 1600 respondents were interviewed
in 132 communities in 46 regions of Russia. The margin of error does not exceed 3,5%.
|
In your opinion, are mass protests
against fall in living standards and unfair policies possible to happen in
your city/rural area to protect human rights and freedoms? (close-ended
question, one answer) |
||||||||||||||||
|
|
I.11 |
I.12 |
I.13 |
I.14 |
II.14 |
III.14 |
IV.14 |
V.14 |
VI.14 |
VII.14 |
VIII.14 |
IX.14 |
X.14 |
XI.14 |
XII.14 |
10-11 .I.15 |
|
Rather possible |
30 |
30 |
26 |
24 |
25 |
21 |
19 |
18 |
17 |
19 |
14 |
14 |
18 |
22 |
23 |
27 |
|
Hardly possible |
62 |
64 |
70 |
71 |
70 |
75 |
77 |
78 |
81 |
77 |
81 |
82 |
77 |
73 |
72 |
66 |
|
Don`t know |
8 |
6 |
4 |
5 |
5 |
4 |
4 |
3 |
3 |
4 |
5 |
4 |
5 |
5 |
5 |
7 |
|
Public protest potential* |
37 |
36 |
32 |
31 |
32 |
28 |
27 |
26 |
25 |
27 |
23 |
23 |
26 |
30 |
30 |
34 |
|
If such protests take place, will
you personally take part in them? (close-ended question, one answer) |
||||||||||||||||
|
|
I.11 |
I.12 |
I.13 |
I.14 |
II.14 |
III.14 |
IV.14 |
V.14 |
VI.14 |
VII.14 |
VIII.14 |
IX.14 |
X.14 |
XI.14 |
XII.14 |
10-11 .I.15 |
|
Rather yes |
25 |
21 |
17 |
18 |
19 |
18 |
16 |
16 |
17 |
16 |
14 |
14 |
15 |
18 |
16 |
16 |
|
Rather no |
68 |
74 |
78 |
76 |
76 |
77 |
78 |
79 |
79 |
79 |
82 |
81 |
80 |
77 |
79 |
77 |
|
Don`t know |
7 |
5 |
4 |
6 |
5 |
5 |
5 |
5 |
4 |
5 |
5 |
5 |
5 |
5 |
5 |
7 |
|
Personal protest potential index** |
33 |
29 |
25 |
27 |
27 |
26 |
25 |
25 |
25 |
25 |
23 |
23 |
24 |
26 |
25 |
25 |
|
In your opinion, why do most of
Russians refrain from taking part in protest actions and demonstrations
today? (close-ended question, not more than 5 answers) |
|||||
|
|
III.2011 |
XII.2011 |
I.2012 |
I.2013 |
I.2015 |
|
They are confident that rallies
and demonstrations are useless |
57 |
42 |
39 |
47 |
37 |
|
They are afraid that the
representatives of the law enforcement bodies may use force |
35 |
30 |
26 |
29 |
28 |
|
They are afraid that they may have
problems at work |
36 |
27 |
28 |
29 |
26 |
|
They are afraid of being
imprisoned |
26 |
25 |
23 |
28 |
25 |
|
They are busy with their personal
life; they are not interested in the problems of the country |
25 |
21 |
23 |
21 |
19 |
|
Lack of information about protest
actions |
22 |
22 |
18 |
23 |
16 |
|
Dislike for public gatherings |
8 |
12 |
12 |
16 |
12 |
|
Only loafers and stupid persons
take part in rallies |
8 |
8 |
11 |
9 |
11 |
|
Dislike for the organizers of such
actions |
6 |
7 |
8 |
10 |
8 |
|
They are not satisfied with everything;
no reason to take part in protest actions |
6 |
9 |
8 |
6 |
8 |
|
Fear that no one will come to take
part in the protest action |
9 |
6 |
4 |
5 |
8 |
|
Other |
3 |
2 |
2 |
2 |
5 |
|
Don`t know |
4 |
9 |
12 |
3 |
4 |
|
Which of the following statements
about the rallies and protest actions is closer to yours? (close-ended
question, one answer) |
||
|
|
I.2012 |
I.2015 |
|
Actions and rallies are general
means to solve problems; they are manifestations of democracy |
36 |
23 |
|
Actions and rallies are
manifestation of democracy during systemic crisis; they are extreme measures
that can be used only in exceptional cases |
28 |
38 |
|
Actions and rallies lead to the
collapse; they do not help solving problems; they destabilize the situation
in the country and should be avoided |
22 |
30 |
|
Don`t know |
14 |
9 |
WEST EUROPE
366-43-8. Economist/Ipsos
MORI January 2015 Issues Index
Published:6 February 2015
Fieldwork:23 January - 2 February
Economist/ Ipsos MORI January 2015 Issues index – the NHS replaces immigration as the most important issue facing Britain
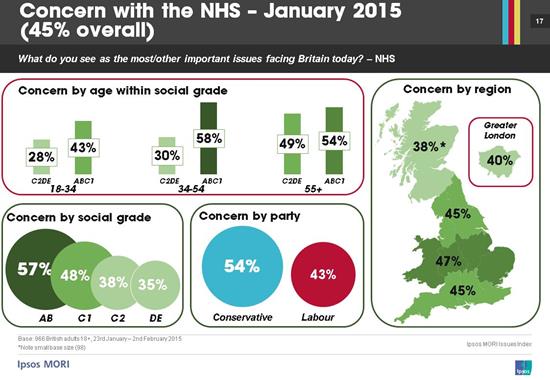
The first Economist/Ipsos MORI Issues Index of 2015 shows that concern about the NHS has increased by 12 percentage points since December of last year, and it is now seen as the most important issue facing Britain – mentioned by almost half (45%) of the public. This is the highest level of concern since April 2006, following an increased political emphasis being placed on healthcare in the runup to the 2015 election, and reports of a winter A&E ‘crisis’.
Looking at different population subgroups, it is clear that older people, and the more affluent are more likely to be concerned about the NHS. Concern rises from a third (35%) of DEs to nearly six in ten (57%) of ABs. Similarly, 35% of those aged 18-34 are concerned compared with three fifths (59%) of those aged 55-64. Over half (54%) of Conservative voters are concerned, a sharp increase of 22 percentage points since December.
Though concern about NHS has increased sharply, and is high, it is worth remembering that historically concern has been much higher in the past – indeed, it peaked at 72% in February 2002. For much of Tony Blair’s tenure in Downing Street it was the most important issue facing Britain, and it will be interesting to see if levels of concern are maintained throughout the year.
A third (34%) mention immigration, the issue which was of most concern to the public between June to December last year, and concern has fallen by 8 percentage points. However, for some, including 18-34 year old C2DEs, it remains the most important issue facing Britain. A similar percentage (33%) mention the economy, and a fifth (22%) mention unemployment, though levels of concern about these issues are unchanged since December.
Elsewhere, just 5% are concerned about inflation/prices, the lowest level of concern in eight years.
366-43-9. Captains
of Industry support Britain being in the EU
Ipsos
MORI's Captains of Industry Survey 2014
Published:4 February 2015
Fieldwork:September - December 2014
Could British business leaders be
the biggest block to UKIP’s campaign for parliament? The new Ipsos MORI
Captains of Industry survey shows that although 45% of Captains want to return
to being part of an economic community, without political links, just 1% would
be happy to leave it all together. Just under half (45%) want to continue our
relationship with the EU as it stands.

Captains like the ease of access to
markets and people that EU membership gives them, but not the accompanying
regulations. The leading business advantages they see are the ease of
cross-border trading (46%), ease of access to EU customers (41%) and being part
of the single market (40%). Recruitment is made easier too for one in three
Captains (34%) with no need for visas for EU workers.

The disadvantages of EU membership
cited by Captains include: the volume of regulations (52%) and the changes to
regulations (55%), which top the table of disadvantages. However, the EU’s
economic outlook also makes it into the top three with just under half (46%) of
Captain’s citing this as a concern.

It isn’t just EU regulation that
concerns industry leaders, 79% consider the level of regulation harmful to the
UK economy. However, the strength of agreement on this point has declined over
the last five years from 44% strongly agreeing in 2010, to 28% at the end of
2014. This may suggest that businesses are either becoming accustomed to
increasing regulation, or that the burden has improved a little in recent
years.

The most requested improvement in
regards to the regulatory burden is for employment legislation to be simplified
(24%). Other suggestions include more harmonisation between UK and EU
regulations (11%), reducing general levels of regulation (8%) and reducing tax
regulation (7%).
Technical note
·
These
are the findings of the 2014 study of Captains of Industry, widely acknowledged
as the authoritative source of opinion on Britain's business elite.
·
Respondents
are executive board-level directors and chairmen
·
Companies
are from:
o top 500 industrials by turnover;
o top 100 financial companies by
capital employed
·
A
total of 108 respondents took part, details of which are provided below
·
Fieldwork
was conducted September – December 2014
·
104
interviews were conducted face-to-face and four by telephone
366-43-10. Public
perceptions of climate change in Britain following the winter 2013/14 flooding
Findings
from research for Cardiff University
Published:2 February 2015
Fieldwork:28 August - 31 October 2014
A recent Ipsos MORI survey for Cardiff University updates trend data on public attitudes to climate change as well as providing new data on how the British public responded to the flooding last winter. The study tested whether the public, but particularly those affected by flooding, link the winter 2014 flooding to climate change.
It shows that the British public’s belief in climate change, and its human causes, rose significantly last year and is now at its highest level since 2005. Most people say they have noticed signs of climate change in their lifetime, particularly changing weather patterns or extreme weather and heavy rainfall or flooding.
Various factors were felt to have contributed to the flooding in winter 2013/14, including climate change, and a majority agreed that "The floods showed us what we can expect in the future from climate change". The survey found that those who lived in flood affected areas and whose property had been directly affected by flood waters were even more convinced that climate change is happening and concerned by it. They were also more likely to see climate change as a key issue facing the UK
Technical Details
·
Two samples were used in this
research:
o A
nationally representative survey of adults aged 16+ in the UK (n=1,002)
o A
boost of approximately 200 interviews in each of five areas that had been
affected by the floods in some way, in order to provide a sample of respondents
with more direct experience of the flooding: Aberystwyth (n=200), Dawlish (n=198),
Gloucester to Tewkesbury (n=198), Hull (n=200) and Sunbury to Windsor (n=199)
o These
five areas combined provide a flooded area sample with n=995. Of these, those
whose property had been directly affected formed the ‘directly affected’ sample
referred to in the report (n=135)
·
All respondents were interviewed
face to face in their home using Computer
Assisted Personal Interviewing (CAPI) between 28
August and 31 October 2014. Quotas were set on age, gender and working status
to ensure the final achieved samples were representative of the GB population
in the case of the national sample and each of the five areas for the flooded
area sample. The data were then weighted after fieldwork to the known
population profiles.
·
The findings from previous years
were from nationally representative in-home quota surveys conducted by Ipsos
MORI in Great Britain. Respondents were aged 15+ and weighted to the profile of
the known population.
o 2013:
Survey took place between 8 and 26 March 2013 (n=961)
o 2010:
Survey took place between 6 January and 26 March 2010 (n=1,822).
o 2005:
Survey took place between 1 October and 6 November 2005 (n=1,491).
366-43-11. Overwhelming
public support for the ‘Gordon’s
Fightback’ Campaign
Published:2 February 2015
Fieldwork:12 - 19 January 2015
An Ipsos MORI Scotland poll for the Gordon’s Fightback campaign shows overwhelming support for their key objectives. Almost all of those polled (97%) would support the UK government introducing a new system of fast tracking benefits for those with a terminal illness, such as motor neurone disease. Support for such a measure is overwhelming across all groups in the population.
Similarly, there is a very high level of support for the UK government increasing the amount of public money spent on research into motor neurone disease. Over three quarters of those interviewed (78%) would support doubling the funding from around £5 million a year to £10 million.
The poll also highlights low public awareness of Motor Neurone Disease compared to other illnesses. A third (32%) of participants know a great deal or a fair amount about Motor Neurone Disease, significantly lower than cancer (79%), diabetes (73%), heart disease (69%) and Alzheimer’s disease (61%).
Mark Diffley, Research director at Ipsos MORI Scotland said:
“In
recent months many of us have been moved by ‘Gordon’s Fightback’, the campaign
dedicated to changing the lives of those with Motor Neurone Disease. This poll
shoes overwhelming public support for the campaign’s objectives of increasing
funding to find a cure for MND and fast-tracking state benefits to those with a
terminal illness. The campaign will now be focussed on ensuring that progress
can be made to achieving these objectives.’
Technical details:
·
Results are based on a survey of
1,001 respondents (adults aged 18+) conducted by telephone
·
Fieldwork dates: 12th January to
19th January 2015
·
Data are weighted by: age, sex and
working status using census data; tenure using Scottish Household Survey data;
and public-private sector employment using Scottish Government Quarterly Public
Sector Employment series data
·
Where results do not sum to 100%,
this may be due to computer rounding, multiple responses, or the exclusion of
“don’t know” categories
·
Results are based on all
respondents (1,001) unless otherwise stated
366-43-12.
UK: Voters: time to slim down the royal family
Most British people say
that apart from the core royal family of the Queen, Charles and his
descendants, the rest should no longer receive money from the taxpayer and
royal estates
In terms of public opinion, the British royal family is enjoying something of a heydey. The Queen has long since recovered from the dark days after Princess Diana's death, Willsand Kate are very popular, and even Prince Charles has enjoyed a turnaround in the past five years. However, new research from YouGov reveals that the extent of the British public's enthusiasm for the royal family is very strictly limited to the 'core' royals in the direct line of succession. The minor royals are not thought to warrant any support from the taxpayer or even the Royal Duchies.
The research asks British people which of the major adult groupings of the royal family should continue to receive public money and revenue from the royal estates. Apart from the core family (the Queen and Prince Philip, Charles and Camilla and Prince William and Catherine; all supported in their current funding setup by a majority), the public think it’s time to cut the others off.
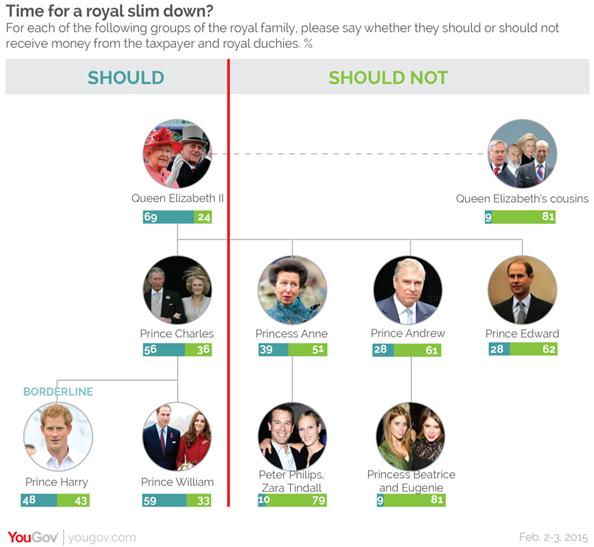
Thought least deserving of preferential funding are the Queen’s cousins, descended from King George V (the Duke and Duchess of Gloucester, Duke and Duchess of Kent, Princess Alexandra and Prince and Princess Michael of Kent), as well as the Queen’s grandchildren (Princess Beatrice and Eugenie, and Peter Phillips and Zara Tindall). Fewer than 10% think these groups should continue with their current financial arrangements.
Only 28% think that Prince Andrew and Prince Edward, two of the Queen’s sons, should be allowed to receive public money and revenue from the royal duchies, while slightly more (39%) think Princess Anne should qualify.
Even Prince Harry, fourth in line to the throne, only narrowly avoids the financial chop. 48% say he should be allowed to receive money by his current means, 43% say he should not.
For 250 years Parliament paid the Queen a fixed amount of money, through the Civil List, insensitive to the rate of inflation. But the Coalition’s spending review of 2010 changed all that, and as of 2013 the Queen has received an inflation-proof 15% cut of revenue from the Crown Estate – a property portfolio with soaring value – through the Sovereign Support Grant.
The cost to the taxpayer of the royal family is around 58p per head per year, or around 0.005% of total public spending. Still, republicans can argue that money raised from the Crown Estate (or in Charles’s case, the Duchy of Cornwall) is strictly hereditary, and benefits from generous tax exemptions.
366-43-13.
Scotland: SNP lead at 21
February
03, 2015
The Scottish National
Party has retained its lead in Scotland – and on the question of Scottish independence,
Yes leads No by 4 points
The recently appointed leader of Scottish Labour, Jim Murphy, made a joint proposal with Gordon Brown yesterday to devolve further powers to Scotland. The powers would go beyond those suggested by the Smith Commission – the report formalising promises made by Westminster leaders shortly before September’s referendum – to give Scotland the final word on the ‘bedroom tax’, and the ability to set benefits in other, non-devolved areas of welfare.
Jim Murphy has been handed the task of restoring Labour’s fortunes in Scotland, but the first YouGov/Times poll of Scottish people conducted wholly after his appointment on December 13 reveals the challenge ahead.
SNP has retained its lead, on 48% in February (up 1% from December). Labour remains at 27%, the same as December and October, but down considerably from its pre-referendum lead in June of 8 (39% to the SNP’s 31%). The results mean Labour could lose up to 30 seats in Scotland in May.
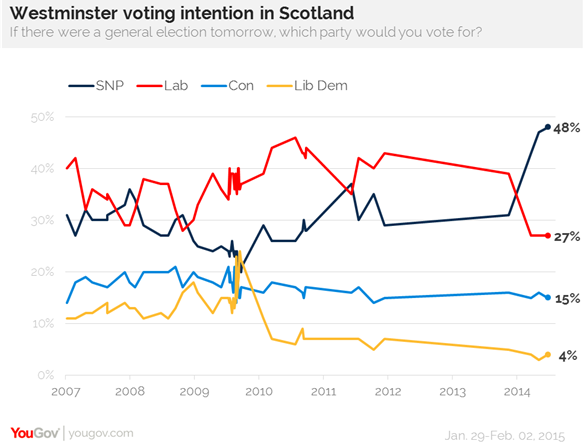
SNP's lead comes in conjunction with renewed support for Scottish independence. The final result on September 18 was Yes 45%, No 55%, however since then the Yes lead has sustained at an all-time high of 52% to the No camp's 48%.
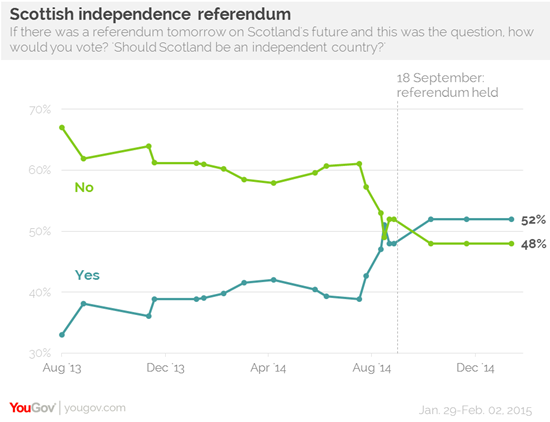
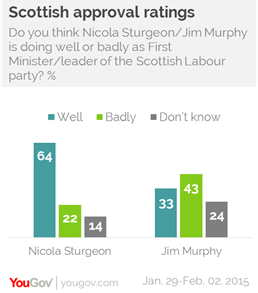
Nicola Sturgeon, Scotland’s first minister and leader of the SNP since November, enjoys the highest approval rating of any of the main party leaders. At net +42 among Scottish people (64% say she is doing well, 22% badly), she outperforms Nigel Farage in Britain-wide surveys (in October, 61% said he was doing well, 26% badly).
Jim Murphy fares around as well in Scotland as David Cameron does in national polls, at -10 (David Cameron's average so far in 2015). However, his approval among Scottish Labour voters (+55) is considerably higher than Ed Miliband’s approval among British Labour voters (+22).
NORTH AMERICA
366-43-14. Obama Approval Ratings Still
Historically Polarized
February
06, 2015
PRINCETON, N.J. -- Throughout President Barack Obama's sixth full year in office, an average of 79% of Democrats, compared with 9% of Republicans, approved of the job he was doing. That 70-percentage-point party gap in approval ratings ties for the fifth-most-polarized year for a president in Gallup records dating back to 1953.
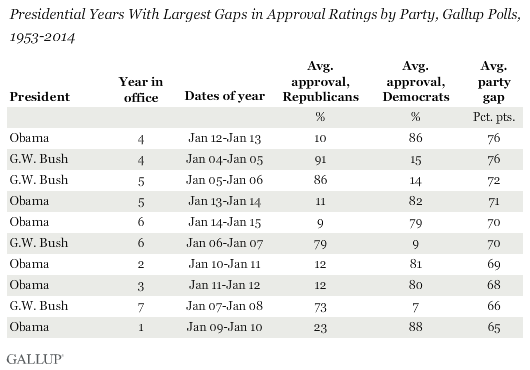
Each of Obama's six years in office rank among the 10 most polarized in the last 60 years, with George W. Bush holding the other four spots. Bush's most polarized years were his fourth through seventh years in office, after the rally in support for him following the 9/11 terror attacks had faded. Clearly, political polarization has reached new heights in recent years, under a Republican and a Democratic president.
Bush's and Obama's approval ratings were most polarized along party lines in their fourth years in office -- which has been the case for most presidents because that is the year they seek re-election. Both Bush and Obama saw their polarization scores ease slightly in their fifth year, and go down a bit more in year six. Bush's polarization score dropped even further in his seventh year, as his overall job approval ratings continued to decline.
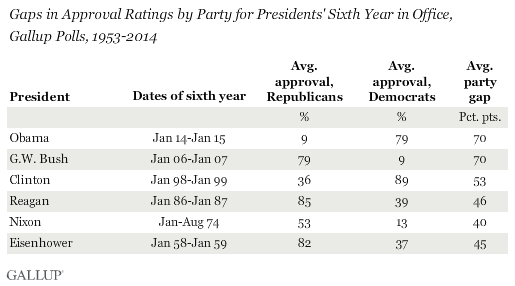
No Other Presidents' Sixth-Year Polarization Close to Bush's, Obama's
The structure of job approval in Obama's and Bush's sixth years in office was remarkably similar -- with 79% approval among supporters of the president's party, and 9% from supporters of the opposition party. Not surprisingly, Bush and Obama had by far the most polarized sixth years for presidents who served into a sixth year. In Bill Clinton's sixth year, there was an average 53-point gap in his approval ratings, 17 points lower than those of his immediate successors. Clinton's polarization score was a bit lower because his overall approval rating in year six, 64%, was much higher than Bush's (37%) or Obama's (43%). The other presidents serving into a sixth year had polarization scores below 50 points -- including Dwight Eisenhower and Ronald Reagan, who were popular at the time, and Richard Nixon, who had historically low approval ratings. Nixon resigned in August 1974, in the middle of his sixth year in office.
Obama on Pace to Have Most Polarized Approval Ratings
So far in his presidency, there has been an average party gap of 70 points in Obama's approval ratings, which, if it continues, would be easily the highest for any president to date. Bush is second with a 61-point gap throughout his presidency, followed by Clinton (56) and Reagan (52). The other presidents had party gaps of no more than 41 points.
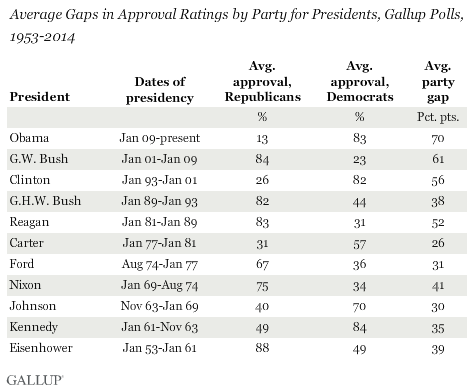
Obama's more polarized ratings are attributable mainly to lower support from the opposition party than his predecessors received. His average 13% approval rating among Republicans is 10 points lower than Bush's 23% approval rating among Democrats and 13 points below Clinton's 26% approval among Republicans. All other presidents had approval ratings of at least 30% from the opposition party.
Obama's approval rating from Democrats, 83%, almost exactly matches the average approval ratings that the prior four presidents received from supporters of their own party.
Implications
Both Bush and Obama were elected with hopes of unifying the country. However, the opposite has happened, at least in the way Americans view the job the president is doing, with presidential evaluations more divided along party lines than ever before. These increasingly partisan views of presidents may have as much to do with the environment in which these presidents have governed as with their policies, given 24-hour news coverage of what they do and increasingly partisan news and opinion sources on television, in print and online.
Operating within this context, Obama is on pace to be the president with the most polarized approval ratings in Gallup's polling history, surpassing Bush. Aside from the initial two months of Obama's presidency, Republicans have consistently rated the job he is doing very negatively -- to this point, far worse than supporters of the opposition party have ever rated a president.
Obama's overall job approval ratings have improved modestly to the high 40s in recent weeks, but if he cannot boost his support among Republicans, it is unlikely that his overall approval ratings can go much above 50%. By comparison, during Clinton's last three years in office, when he averaged better than 60% approval overall, his support among Republicans exceeded 30%.
Survey Methods
Results for this Gallup poll are based on telephone interviews conducted Jan. 20, 2014-Jan. 19, 2015, on the Gallup U.S. Daily survey, with a random sample of 177,032 adults, aged 18 and older, living in all 50 U.S. states and the District of Columbia. For results based on the total sample of national adults, the margin of sampling error is ±1 percentage point at the 95% confidence level.
For results based on the total samples of 53,288 Democrats and 50,022 Republicans, the margin of sampling error is ±1 percentage point at the 95% confidence level. All reported margins of sampling error include computed design effects for weighting.
Each sample of national adults includes a minimum quota of 50% cellphone respondents and 50% landline respondents, with additional minimum quotas by time zone within region. Landline and cellular telephone numbers are selected using random-digit-dial methods.
366-43-15. Majorities in Five States
Approved of Obama in 2014
February 02, 2015
This story is part of Gallup's annual "State of the States" series, which reveals state-by-state differences on political, economic, religion and well-being measures.
PRINCETON, N.J.-- Residents of five states gave President Barack Obama 50% or better job approval ratings in 2014, with Massachusetts and Hawaii leading the list at roughly 53%. Wyoming residents were the least approving, at 19.3%.
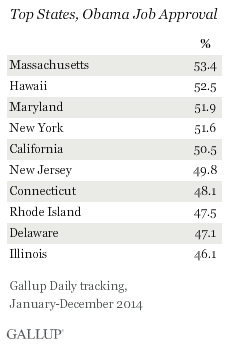
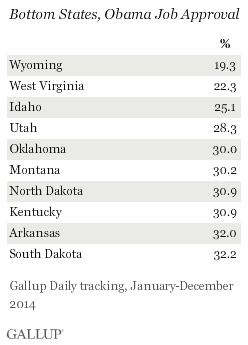
2014 marks the first time in Obama's six years in office that Massachusetts has as much as tied for first in approving of the president's job performance, while Obama's home state of Hawaii has topped the list each year.
Obama's overall rating nationally fell by four points over the same period, from 46.5% in 2013 to 42.4% in 2014. So far in 2015, Obama's approval rating has been better, averaging 46.5% in January. (Note that these averages are based on January to December results and therefore differ slightly from Gallup's other yearly calculation, which uses Obama's inauguration date as the starting point for each yearly average.)
California's fifth-place showing in 2014 is also its highest to date. Meanwhile, Maryland's and New York's appearance in the top four in 2014 is typical for these states.
Wyoming residents have frequently been the least approving of Obama, and repeated that in 2014 -- for the fourth time. Additionally, the three other states where less than 30% of residents approved last year -- West Virginia, Idaho and Utah -- have consistently given Obama some of his worst annual approval ratings by state.
These results are based on 177,034 Gallup Daily tracking interviews conducted nationally from January through December 2014. At least 400 respondents were interviewed in each state, and at least 1,000 were interviewed in 40 states. Each state's sample was weighted to match demographic parameters for that state's adult population.
Residents in Handful of Coastal States Give Obama His Highest Scores
The states can be grouped into five categories according to their average 2014 approval scores.
- Well-above-average
approval = approval ratings exceeding 50%
- Above average
= approval ratings between 46.5% and 50%
- Average =
approval ratings within four percentage points of (above or below) the 42.4%
national average -- or 38.4% to 46.4%
- Below average
= approval ratings between 34% and 38.3%
- Well below
average = approval ratings below 34%
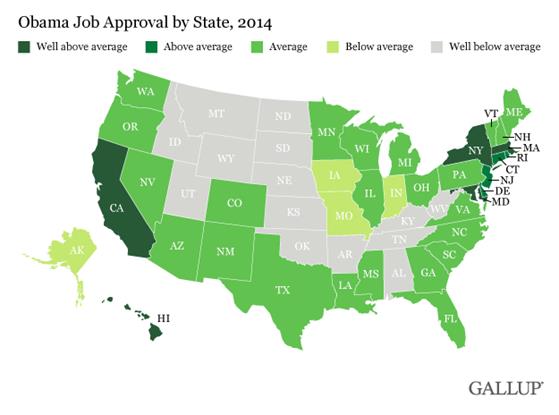
Notably, several of the states where residents give Obama above-average or well-above-average ratings -- California, New York and New Jersey -- are highly populous. By contrast, Obama's lowest ratings tend to be in states with relatively small populations, such as several in the Rocky Mountain and Midwestern regions. The full results by state are shown below.
Relative State Rankings Mostly Steady Over Time
The basic regional pattern of Obama's 2014 state ratings is similar to what Gallup has found throughout his presidency, with his strongest support coming from the Northeast and Pacific regions, and his lowest in the Rockies, and parts of the South and Midwest. Thus, although his overall yearly approval rating has declined considerably since 2009, it has declined relatively proportionally in most states.
In a handful of states, Obama appears to have lost a bit more ground relative to his peak ratings in 2009 and 2012, including West Virginia, North Dakota, South Dakota, Kentucky, Wyoming, Missouri, Indiana and Iowa. In all but Iowa, Obama's ratings have consistently been below the national average, but there was a significant deficit in Iowa in 2013 and 2014, compared with little difference in the earlier years. Notably, several of these states had important senatorial elections in 2014, and those elections saw Republicans score important victories that ultimately helped the GOP win control of the Senate for the first time since 2006.
The declines in these states more than offset the one- to two-point increases in his approval rating in a handful of small states.
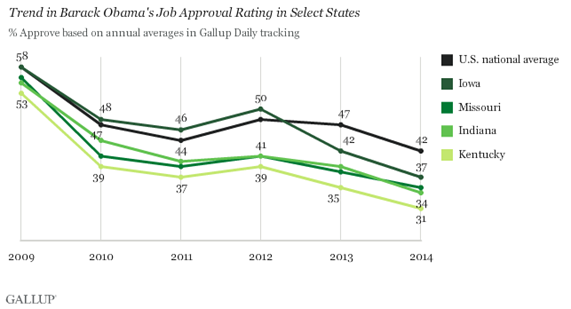
In four states -- Virginia, Florida, Oregon and Georgia -- Obama's state job approval rating has matched the national average, or come within two percentage points, in every year since 2009, making these potentially valuable bellwether states. However, while Obama carried the first three in both presidential runs, he lost in Georgia, suggesting a greater disconnect between general public sentiment and the electorate in that state.
Bottom Line
Obama ran into political and economic headwinds in 2014 that conspired to make his average job approval rating for the year his lowest yet. Because that was reflected in declines in most state ratings, the basic geographic pattern of his strengths and weaknesses remained about the same. However, the handful of states showing greater-than-average declines bear watching in 2015, because if this continues, and if the Democratic standard-bearer inherits these problems, that could have implications for 2016.
Survey Methods
Results for this Gallup poll are based on telephone interviews conducted Jan. 2-Dec. 30, 2014, on the Gallup Daily tracking survey, with a random sample of 177,034 adults, aged 18 and older, living in all 50 U.S. states and the District of Columbia.
For results based on the total sample of national adults, the margin of sampling error is ±1 percentage point at the 95% confidence level.
Margins of error for individual states are no greater than ±6 percentage points, and are ±3 percentage points in most states. The margin of error for the District of Columbia (shown in the table at the end of the report) is ±6 percentage points. All reported margins of sampling error include the computed design effects for weighting.
Interviews are conducted with respondents on landline telephones and cellular phones, with interviews conducted in Spanish for respondents who are primarily Spanish-speaking. Each sample of national adults includes a minimum quota of 50% cellphone respondents and 50% landline respondents, with additional minimum quotas by time zone within region. Landline and cellular telephone numbers are selected using random-digit-dial methods. Landline respondents are chosen at random within each household on the basis of which member had the most recent birthday.
Samples are weighted to correct for unequal selection probability, nonresponse, and double coverage of landline and cell users in the two sampling frames. National samples are weighted to match the national demographics of gender, age, race, Hispanic ethnicity, education, region, population density, and phone status (cellphone only/landline only/both, cellphone mostly, and having an unlisted landline number). Demographic weighting targets are based on the most recent Current Population Survey figures for the aged 18 and older U.S. population. Phone status targets are based on the most recent National Health Interview Survey. Population density targets are based on the most recent U.S. census. State samples are weighted to match state demographics of gender, age, race, Hispanic ethnicity and region. State demographic weighting targets are based on the most recent Nielsen Claritas dataset.
Learn more about how the Gallup U.S. Daily works.
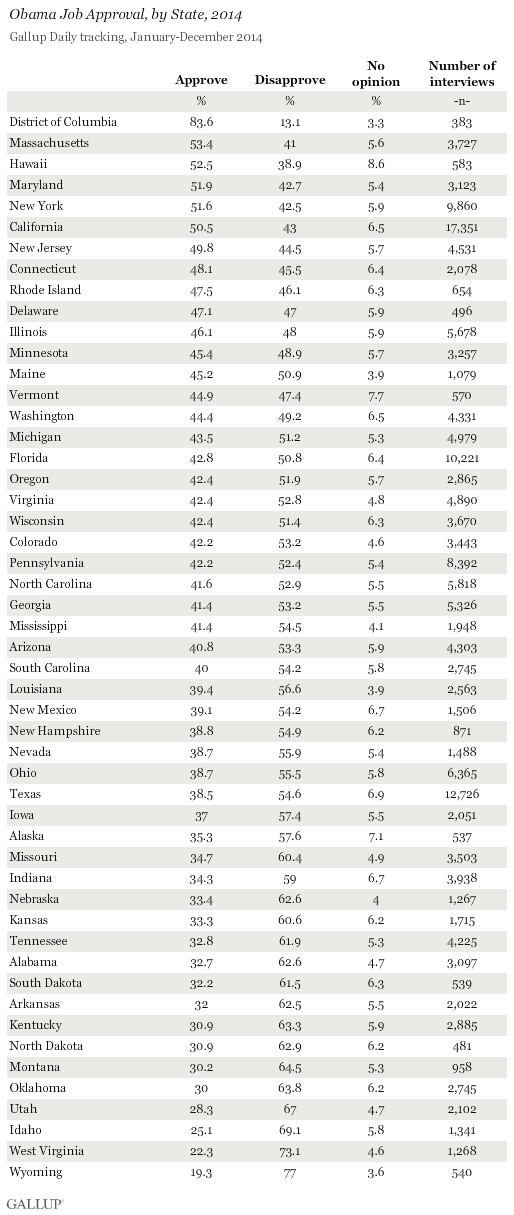
366-43-16. Eight-Point Increase in
Monthly Economic Confidence Index
February
03, 2015
WASHINGTON, D.C. -- Gallup's U.S. Economic Confidence Index, which has been positive for each of the past six weeks, finished January with an average score of +3 -- the first time a monthly average has been in positive territory since the recession. The monthly index score is up eight points from December -- the highest month-to-month increase in more than a year.
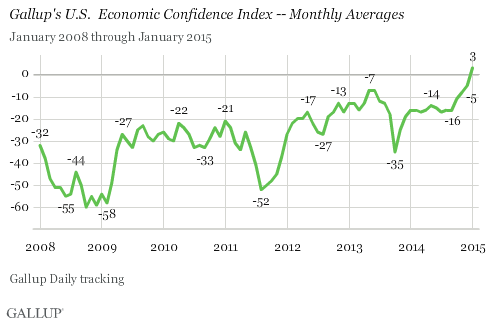
Gallup's Economic Confidence Index is the average of two components, Americans' ratings of current economic conditions and their views on whether the economy is getting better or getting worse. The index has a theoretical maximum of +100, if all Americans thought the economy was excellent or good and getting better; and a theoretical minimum of -100, if all Americans thought the economy was poor and getting worse.
The latest weekly average, for the week ending Feb. 1, is also +3, falling roughly in the middle of the index's -100 to +100 range.
For the entire month of January, 27% of Americans said the economy is "excellent" or "good," while 26% said it is "poor." This results in a current conditions score of +1, up six points from December. Meanwhile, the economic outlook score increased by nine points, reaching +5, based on 50% of Americans saying the economy is "getting better" while 45% said it is "getting worse."
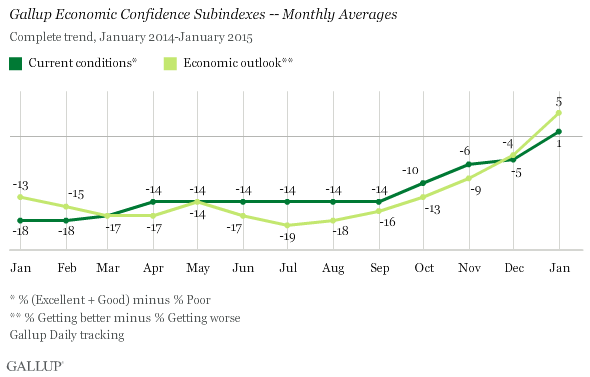
Confidence Among Middle- and Lower-Income Americans Turns Positive
With a score of +1, middle- and lower-income Americans registered a positive reading for the first time in seven years; that score climbed eight points from December.
Upper-income Americans, whose annual household incomes are $90,000 or more a year, reached their highest level of confidence yet, at +15. This is the fourth consecutive positive monthly reading that higher-earning Americans have registered.
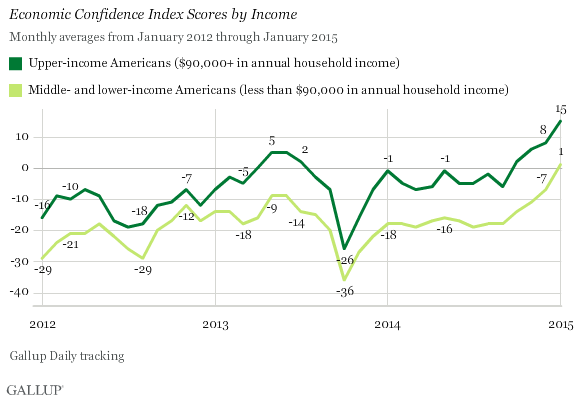
Increases in Confidence for Americans of All Political Identifications
Democrats maintain the highest level of confidence among U.S. political groups, at +25. Democrats have consistently registered positive index scores since February 2012, with the exception of October 2013 during the federal government shutdown. The current score is just short of their high of +30, measured in November 2012.
Neither independents (0) nor Republicans (-19) had index scores in positive territory last month, but both showed significant improvement from December, with scores in each group up eight points. Democrats showed a more modest two-point increase.
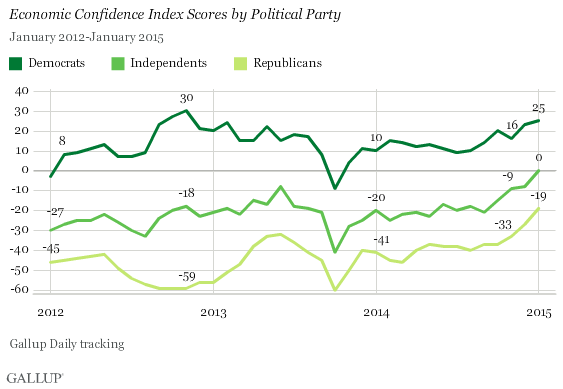
Bottom Line
The New Year has proved a turning point for Americans' confidence in the economy. But future monthly Economic Confidence Index readings will show whether this latest increase is a peak in confidence or a sustainable improvement that can last throughout 2015. Two economic trends have been beneficial to Americans recently: a rising stock market and lower gas prices. But low gas prices finally appear to be rising, and could imperil the January gains by putting downward pressure on economic confidence.
Survey Methods
Results for this Gallup poll are based on telephone interviews conducted Jan. 2-31, 2015, on the Gallup U.S. Daily survey, with a random sample of 14,684 adults, aged 18 and older, living in all 50 U.S. states and the District of Columbia. For results based on the total sample of national adults, the margin of sampling error is ±1 percentage point at the 95% confidence level. All reported margins of sampling error include computed design effects for weighting.
Each sample of national adults includes a minimum quota of 50% cellphone respondents and 50% landline respondents, with additional minimum quotas by time zone within region. Landline and cellular telephone numbers are selected using random-digit-dial methods.
366-43-17. Gallup Student Poll: Job
Confidence Lower in Higher Grades
February
03, 2015
WASHINGTON, D.C. -- Gallup Student Poll students in elementary and middle school are much more optimistic about their ability to find a good job than are students in high school. The percentage of students in grades 5 through 12 who strongly agree with the statement, "I know I will find a good job after I graduate" declines from 68% in grade 5 to 49% in grade 10, and remains at about that level through grade 12.
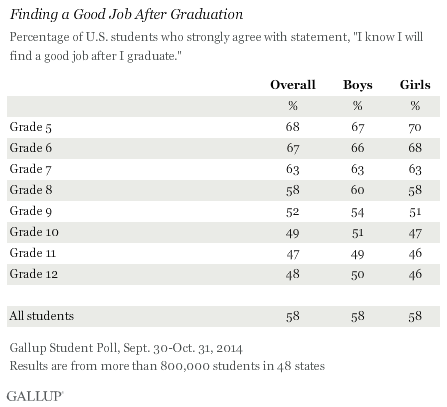
Optimism
about future job pursuits declines over time; however, the decline is a bit
steeper for girls than for boys. Two-thirds (67%) of boys in grade 5 strongly
agree that they will find a good job when they graduate, compared with half of
boys in the 12th grade -- a difference of 17 percentage points. In
contrast, girls are slightly more optimistic in grade 5, with 70% strongly
agreeing that they will find a good job, but this falls 24 points to 46% among
girls in grade 12.
Gallup Student Poll results are based on Web interviews with more than 800,000 public school students in grades 5 to 12 in 48 states (Tennessee, Montana and the District of Columbia are not included). The Gallup Student Poll is offered to all schools at no cost. Gallup does not randomly select schools or students to participate in the poll, and Gallup does not weight the sample. Thus, while these data reflect the opinions and attitudes of a large amount of students, they are not representative of all students in grades 5 to 12 throughout the U.S.
Bottom Line
All people want a good job. Most students believe a good job is in their future, but Gallup Student Poll respondents' optimism wanes for students who are entering high school, and drops further for those in 10th grade. There could be many reasons that confidence in job prospects dips at this point in a student's education -- but regardless, the trend is clear. Given that "college and career" readiness are hallmark goals of the U.S. education system, leaders of all kinds -- from education to government to business -- need to consider building a stronger connection between education and employment to try to keep students' job optimism high as they advance in school.
Gallup-HOPE Index research indicates that less than 10% of students in grades 5 to 12 are currently interning with a local employer. And Gallup-Purdue Index research from college and university graduates indicates that less than one-third had a job or internship during college in which they applied what they were learning. Those who did were more likely to be employed full time and more than twice as likely to be engaged in their work. Therefore, American educational institutions and employers have room to improve by providing more real-world work experiences for students.
Survey Methods
Results for this Gallup Student Poll are based on Web-based interviews conducted Sept. 30-Oct. 31, 2014, with a convenience sample of 867,541 students in grades 5 to 12, living in 48 states (Tennessee, Montana and the District of Columbia are not included).
Gallup does not randomly select schools for participation in the annual poll, charge to administer the poll or give incentives, apart from providing school-specific data to participating schools. Gallup does not weight the Student Poll samples because the samples are not randomly drawn from a larger population; they are instead a convenience sample of participating schools and students.
366-43-18. For Banks, Baby Boomers Mean
Lucrative Business
February
02, 2015
This article is part of an ongoing series analyzing how baby boomers -- those born from 1946-1964 in the U.S. -- behave differently from other generations as consumers and in the workplace. The series also explores how the aging of the baby-boom generation will affect politics and well-being.
For banks, baby boomers stand out among generations as highly attractive and lucrative customers.
Fully half of baby boomers report over $100,000 in investable personal assets, compared with 37% of Generation Xers and 14% of millennials. Nearly one in five boomers are even more well off, with over half a million dollars in investable assets, and 37% report having more than $50,000 in deposits at their banks. What makes boomers particularly valuable as customers is that they're actively borrowing, spending and investing their wealth, which means they're looking for financial services that meet their needs.
But baby boomers are challenging customers for banks because they tend to invest their assets in many different financial institutions. Among boomers with mortgages, for example, nearly four in 10 (38%) say they have mortgages with the same institution that handles their primary banking; slightly more than two in 10 boomers with investment accounts (21%) say they use their primary bank for investment services. The upshot is that when it comes to investing their wealth, the vast majority of boomers aren't working with their primary bank.
Just One in Three Boomers Are Fully Engaged With Their Bank
Banks would have much to gain if they could convince baby boomers to consolidate their accounts with them. Gallup's study of customer engagement among boomers, though, suggests that banks must overcome considerable customer indifference if they want to capitalize on these relationships. Not all boomers hate their banks; one in three are fully engaged with their primary banking provider. But two in 10 are actively disengaged, and nearly half (46%) are indifferent toward their primary financial institution.
Banks that overcome this challenge and engage their boomer customers can reap substantial benefits, Gallup's analysis shows. Boomers who are fully engaged with their primary bank tend to do more business with this institution. They have a higher percentage of their deposits with their primary bank than with other institutions compared with their actively disengaged counterparts, and they have almost twice the share of investable assets with their primary bank compared with actively disengaged boomers. Fully engaged boomers are 50% more likely to say they have their mortgage and twice as likely to say they have an investment account with their primary bank.
To win more business with baby boomers, banks must resist the temptation to simply sink money into costly technology or short-term promotions. These tactics may temporarily woo new customers, but they're unlikely to foster a long-term emotional connection. Instead, banks must emotionally engage their boomer customers -- an approach more likely to gain customers who will stick around, recommend the bank to their family and friends and consolidate their high-value services there. These customers are also more likely to respond to cross-sell efforts, use additional products and build up their balances.
What Banks Can Do to Engage Boomers
Engaging customers is a proven strategy banks can use to differentiate themselves in the marketplace and attract more high-value accounts, but to get there, most will need to rethink their approach. Here are some tactics banks can use to win new boomer customers and score more business from existing ones:
- Meet baby boomers where they are at in life. Banks should
consider how to meet boomers' banking needs, whether that's by providing
new and easier ways to pay bills or offering simpler ways to manage
spending and retirement funds.
- Devise a top-notch complaint-resolution system. Customer
engagement can quickly sour when banks manage customer problems and gripes
poorly. But when banks handle problems well, engagement
levels soar.
Four times as many actively disengaged boomers (28%) report having a
problem with their bank in the last six months than those who are fully
engaged (7%). And eight in 10 fully engaged boomers are satisfied with how
their bank handles problems, compared with just 6% who are actively
disengaged.
- Manage the everyday branch experience. Managing the
day-to-day
branch experience for baby boomer customers is vital to
engagement, particularly because boomers tend to use branches more often
than their younger counterparts do. About eight in 10 baby boomers have
used a branch in the last six months (81%), and more than four in 10 visit
a branch at least once a month or more often (44%). These visits can give
branches opportunities to engage their boomer customers, but to do so,
they must manage wait times and train tellers and managers to provide consistently
engaging interactions.
- Integrate every channel for seamless service. Boomers
report that they are less likely to use self-service channels like online
and mobile banking and ATMs than tech-savvy Generation Xers or
millennials. Still, banks must provide an engaging experience across
every service channel. Gallup's analysis shows that fully engaged
boomers are satisfied with 90% of their interactions with their primary
bank across all channels, while actively disengaged boomers are satisfied
with 25% of these interactions. Banks must be sure there are no service
hiccups that could frustrate customers as they move from one channel to
another because problems with one area of service can damage a customer's
overall engagement.
- Launch a highly visible financial well-being
program.
About seven in 10 fully engaged boomer customers say that their primary
bank looks out for their financial
well-being
-- but no actively disengaged boomers in this study say the same. If all
customers felt their bank cared about their financial well-being, banks
could dramatically decrease their percentage of actively disengaged
customers. Right now, 27% of boomer customers say their primary bank looks
out for their financial well-being, which offers a tremendous growth
opportunity for financial institutions.
Almost two-thirds of baby boomer customers overall tell Gallup that they're likely to continue doing business with their primary bank, a much higher overall percentage than among Generation Xers (53%) or millennials (54%). Though this is encouraging news, engaging customers could boost that percentage significantly: Gallup analysis shows that nine out of 10 fully engaged customers would continue doing business with their primary bank. In stark contrast, that percentage plummets to less than two in 10 among actively disengaged customers, reinforcing just how essential engagement is in building and maintaining lasting customer relationships.
Fully engaged customers have more products with their primary banks. For this reason, banks that successfully engage their baby boomer customers will win their hearts and more of their banking business.
366-43-19. After Holidays, January U.S.
Consumer Spending Falls to $81
February
02, 2015
WASHINGTON, D.C. -- U.S. consumers' daily self-reports of spending fell to an average of $81 in January, down from $98 in December. Spending usually drops after the holiday season, falling an average of $15 each January since 2008. Despite this year's $17 drop, $81 is one of the highest self-reported averages in any January since 2008.
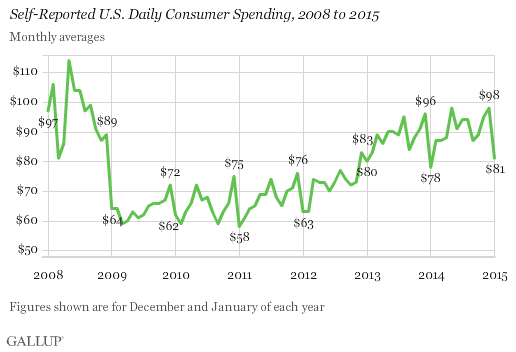
The January 2015 average is based on Gallup Daily tracking interviews with 14,721 U.S. adults. Gallup asks Americans to estimate the total amount they spent "yesterday" in restaurants, gas stations, stores or online -- not counting home and vehicle purchases, or normal monthly bills -- to provide an indication of Americans' discretionary spending.
December daily spending averages are often among the highest of the year because of holiday shopping. The drop in January is largely attributable to less shopping and gift buying after the holidays. However, comparing January 2015 with past Januaries can indicate how comfortable Americans feel with their finances and the level of discretionary money they have. That the daily average in January 2015 is the one of the highest since January 2008 is a good sign for the economy, and helps reinforce other positive economic measures, such as increased job creation and growing economic confidence.
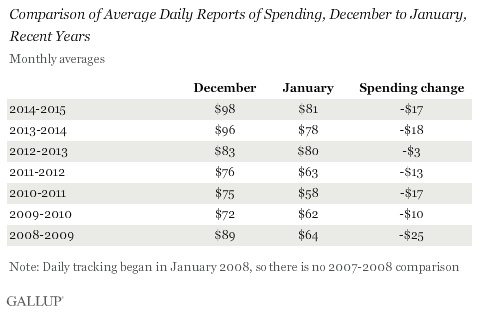
Spending Drops Among Upper- and Lower-Income Americans
Average daily spending fell among upper- and lower-income Americans in January. However, spending dropped more, $40, among the upper-income group (those making at least $90,000 a year) than among the lower-income group (those making less than $90,000), $14.
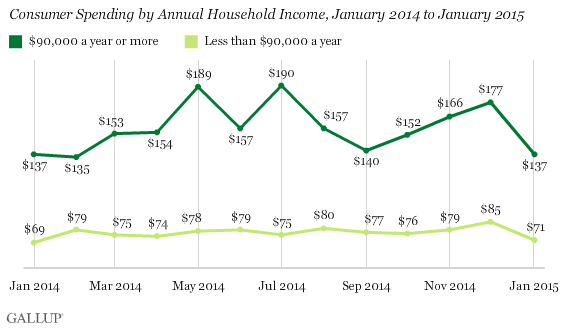
The $40 drop among upper-income Americans is the largest monthly decline seen since January 2011. Among lower-income Americans, the $14 drop is the largest since January 2014. Last month, upper-income Americans reported spending an average of $137 per day, compared with $71 per day among lower-income Americans.
Upper-income Americans, who usually have more disposable income, typically spend more per month than lower-income Americans do. And upper-income Americans' average spending is more likely to vary month to month than lower-income Americans' spending. However, lower-income Americans make up the bulk of U.S. consumers.
Implications
While a drop in reported spending is not usually a good sign for the U.S. economy, it is common and expected in January. Therefore, last month's drop is not especially troubling, especially because it is in line with prior January drops, and because the current monthly average remains well above what Gallup measured from 2009 to 2012.
Low gas prices could leave Americans with more money to spend in other places, although it is not clear whether the drop in gas prices affects net spending. Americans may just use the money they would have spent on one type of purchase (gas) on another (such as retail). Consumers ended 2014 on a strong note, with the Commerce Department on Friday indicating that robust spending drove an estimated 2.6% increase in the U.S. gross domestic product in the fourth quarter.
Survey Methods
Results for this Gallup poll are based on telephone interviews conducted Jan. 2-31, 2015, on the Gallup U.S. Daily survey, with a random sample of 14,721 adults, aged 18 and older, living in all 50 U.S. states and the District of Columbia. For results based on the total sample of national adults, the margin of sampling error is ±1 percentage point at the 95% confidence level. The margin of error for the spending mean is ±$4. All reported margins of sampling error include computed design effects for weighting.
Each sample of national adults includes a minimum quota of 50% cellphone respondents and 50% landline respondents, with additional minimum quotas by time zone within region. Landline and cellular telephone numbers are selected using random-digit-dial methods.
366-43-20. U.S. Flu Reports Decline in
January
February
05, 2015
WASHINGTON, D.C. -- The 2014-2015 U.S. flu season may have peaked early. In January 2015, an average of 3.3% of Americans reported they "were sick with the flu yesterday." This is down from 4.0% in December, the highest rate in any December since Gallup began tracking the flu daily in 2008. Average flu reports in January are also lower than in January 2013 and January 2014.
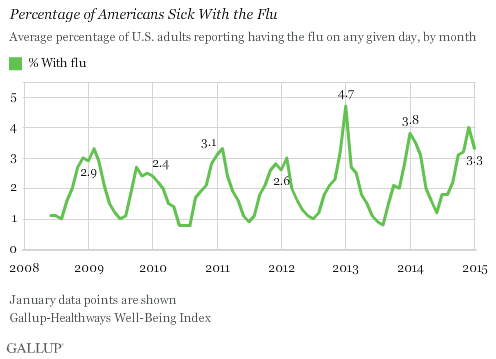
The percentage of Americans sick with the flu on any given day in January 2015 is fairly typical, with Januaries averaging 3.3% between 2009 and 2014. In most years, the flu peaks in January or February. However, this year's flu reports declined in January, indicating that the flu season may have peaked early.
Cold Reports in January on Par With December
While the flu reports are declining, reports of colds remain high. The percentage of Americans who reported being sick with a cold on the day prior to being interviewed was 11.9% in January, similar to 11.6% in December 2014. This is the highest monthly average since Gallup began measuring daily incidence of colds in 2008, topping the peaks found in prior Januaries and Februaries.
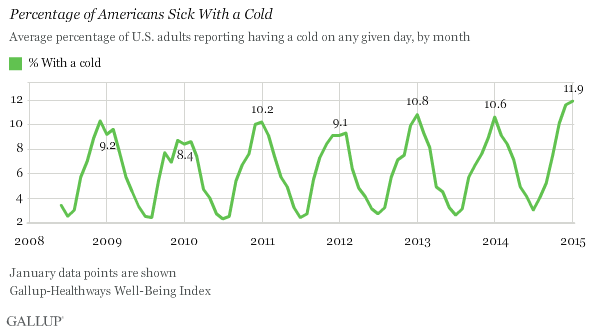
The Gallup-Healthways Well-Being Index asks Americans each day whether they were sick with the flu or a cold "yesterday." It is possible that Gallup's measures of daily cold and flu underestimate the true infection rate because those who were sick the day before may be less likely to respond to a phone survey than those who were not sick. Additionally, it may be difficult for people to accurately self-diagnose the medical distinction between the flu and a cold, given the similarity in the symptoms of both conditions. Still, year-over-year and month-over- month comparisons of these data provide useful information about the relative prevalence of flu and colds in the U.S. population.
Gallup's flu measure differs from the U.S. Centers from Disease Control and Prevention's measure, which uses influenza infections reported by doctors and hospitals. Gallup's data continue to positively correlate with the CDC's data, which show that the number of positive influenza tests decreased from their peak the last week of December.
Bottom Line
Americans' self-reports of being sick with the flu decreased from December and are on par with the average for the month of January, suggesting that the 2014-2015 flu season peaked earlier than usual. Many feared this flu season would be particularly severe because the flu vaccine released in 2014 was less effective than in previous years. Americans' reports of being sick with a cold, however, remain high compared with previous Januaries.
Survey Methods
Results are based on telephone interviews conducted Jan. 2-31, 2015, as part of the Gallup-Healthways Well-Being Index survey, with a random sample of 1,529 adults, aged 18 and older, living in all 50 U.S. states and the District of Columbia. For results based on the total sample of national adults, the margin of sampling error is ±1 percentage points at the 95% confidence level. All reported margins of sampling error include computed design effects for weighting.
Each sample of national adults includes a minimum quota of 50% cellphone respondents and 50% landline respondents, with additional minimum quotas by time zone within region. Landline and cellular telephone numbers are selected using random-digit-dial methods.
366-43-21. U.S. Small-Business Owners'
Optimism Highest Since 2008
February
05, 2015
PRINCETON, N.J. -- U.S. small-business owners are the most optimistic they have been in seven years, according to the latest Wells Fargo/Gallup Small Business Index. The index, at +71, has increased significantly for two consecutive quarters, and reflects optimism in small-business owners' views of both their current situation and their expectations for the future.
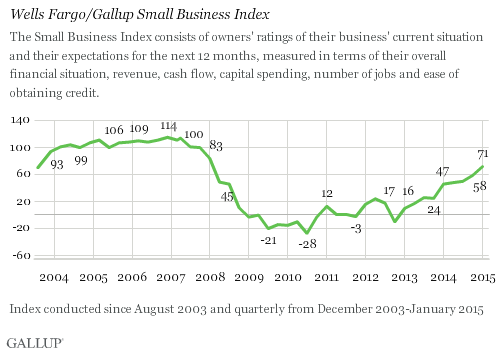
The latest quarterly Small Business Index survey was conducted Jan. 5-9, 2015. The overall Small Business Index score has increased significantly, from +58 in November and +49 in July 2014. While still below pre-recession levels, the index is the highest it has been since January 2008's +83. The Wells Fargo/Gallup Small Business Index measures small-business owners' views of their present situation and future expectations concerning their financial situation, cash flow, revenues, capital spending, hiring and credit availability.
Small-business owners' evaluations of their present conditions increased to +28, up from +21 last quarter. At the same time, the future expectations component continued to climb to +43, up from +37 in November. Both of these dimensions, like the overall index, are at their highest points since 2008.
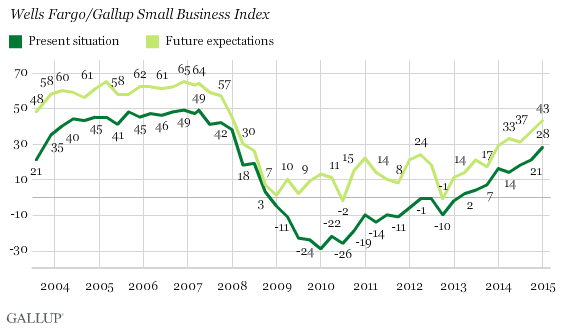
The overall rise in the index reflects more positive readings on a number specific dimensions:
- Small-business
owners are feeling better about their companies' revenues, with nearly
one-half (49%) reporting that their revenues have increased "a
little" or "a lot" over the past 12 months. This is a
seven-percentage-point uptick from Quarter 4, 2014, and represents the
highest reading on this measure since 2007.
- The survey
shows a net positive hiring situation, with more owners reporting hiring
over the last 12 months than decreasing their workforce.
- Thirty-four
percent of small-business owners report that it has been easy for them to
obtain credit, up from 28% a year ago.
- The current
survey shows small increases in owners' positive ratings of 11 of the 12
metrics comprising the overall index.
Bottom Line
Small-business owners' improving views of their revenues and other aspects of their businesses have propelled the overall Wells Fargo/Gallup Small Business Index to its highest level since 2008. This continues the general upward movement seen in the index since it reached its low point in 2010, although it remains below the high points registered in the years prior to the Great Recession. Small-business owners' more upbeat views of their operating environments come at a time of generally positive economic trends in economic growth and unemployment, as measured by the government, as well as year-over-year upticks in Gallup's consumer-based reports on employment, company hiring and consumer spending.
Survey Methods
Results are based on telephone interviews with 603 U.S. small-business owners in all 50 states, conducted Jan. 5-9, 2015. The margin of sampling error is ±4 percentage points at the 95% confidence level.
366-43-22. U.S. Payroll to Population
Rate 44.1% in January
February
05, 2015
WASHINGTON, D.C. -- The U.S. Payroll to Population employment rate (P2P), as measured by Gallup, was 44.1% in January. This is statistically similar to the 44.3% measured in December, but it is the highest measurement of P2P for any January since Gallup began tracking the metric in 2010. January is typically one of the lowest months for P2P in any year.
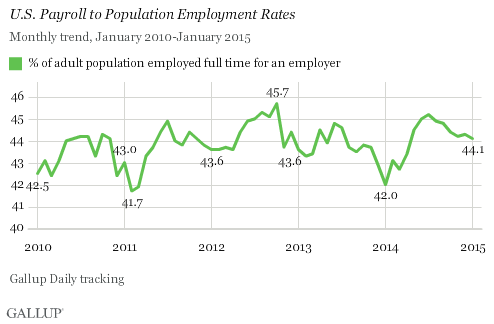
Gallup's P2P metric tracks the percentage of the U.S. adult population aged 18 and older who are employed by an employer for at least 30 hours per week. P2P is not seasonally adjusted. The latest results are based on Gallup Daily tracking interviews with 29,405 Americans, conducted Jan. 2-31 by landline telephone and cellphone. Gallup does not count adults who are self-employed, work fewer than 30 hours per week, who are unemployed or are out of the workforce as payroll-employed in the P2P metric.
Workforce Participation at 66.7%
Workforce participation among U.S. adults rose slightly from 66.3% in December to 66.7% in January. Workforce participation measures the percentage of adults aged 18 and older who are working, or who are not working but are actively looking for work and are available for employment.
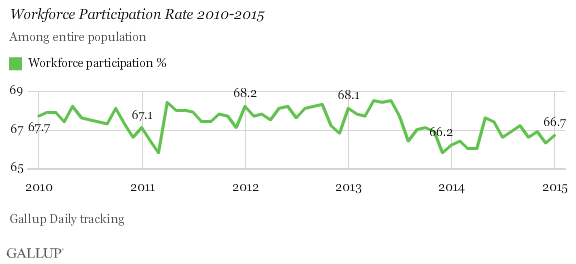
Since January 2010, the workforce participation rate has ranged narrowly between lows of 65.8% and highs of 68.5%, but since mid-2013 has most often registered below 67%. The small uptick this past month may be another positive sign that a strengthening economy is bringing discouraged workers back into the workforce. However, workforce participation does remain below the 2010-2014 average.
Unemployment Up to 7.1%
Gallup's U.S. unemployment rate represents the percentage of adults in the workforce who did not have any paid work in the past seven days, for an employer or themselves, and who were actively looking for and available to work. Gallup's unadjusted U.S. unemployment rate rose 1.3 percentage points to 7.1% in January, similar to the 1.2-point rise last January.
Unlike Gallup's P2P rate, which is a percentage of the total population, traditional employment metrics -- such as the unemployment rates Gallup and the U.S. Bureau of Labor Statistics (BLS) report -- are based on the percentage of the workforce. While both Gallup and BLS data are based on robust surveys, the two have important methodological differences. Additionally, the primary unemployment rate released by the BLS each month is seasonally adjusted. Although Gallup's employment numbers highly relate to BLS rates, Gallup's numbers tend to have more month-to-month variability, and the unemployment rate that the BLS reports each month does not always track precisely with the Gallup estimate.
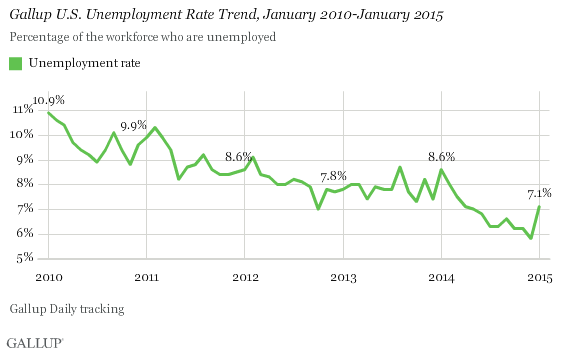
The rise in unemployment that Gallup recorded in January is partly attributable to seasonal effects -- unemployment always rises in January, both in BLS figures and in Gallup's measures since 2011. In January 2015, as in January 2014, 18- to 24-year-olds saw the biggest increase in unemployment, as did those with the lowest reported monthly incomes, typical of more seasonal and part-time workers laid off after the end of the holiday season.
January's rise in unemployment is also partly related to the rise in the number of Americans who were previously considered out of the workforce and who are now looking for new jobs. This is one scenario where a rise in unemployment may be considered "good news" economically, as more of the adult population becomes motivated to seek work even if they may not have found it quite yet. While about half of the rise in unemployment is accounted for by lower rates of part-time work, the other half is accounted for by increased workforce participation. Overall, Gallup saw a surge from December in the percentage of nonworking Americans who said they are looking for work, from 14.9% to 17.5%, and who said they are able to work, from 38.8% to 40.1%.
Underemployment Up at 15.8%
Gallup's measure of underemployment in January is 15.8%, up from the level registered in December, but still lower than what Gallup has measured in prior years. Gallup's U.S. underemployment rate combines the percentage of adults in the workforce who are unemployed (7.1%) and those who are working part time but desire full-time work (8.8%); these two figures add to 15.8% due to rounding. While Gallup's measure of unemployment rose in January, the percentage working part time but who want full- time work fell slightly at the same time, resulting in a smaller half-point increase in the underemployment rate.
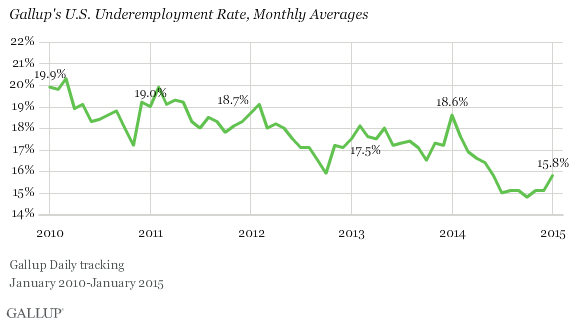
Bottom Line
U.S. employment measures show continued positive signs for the economy in January 2015. Employment growth has been stronger in the past 12 months than in any year since Gallup began tracking these metrics in January 2010. P2P was higher in January in 2015 than in any previous year, hopefully setting the stage for continued strength in the months ahead. Unadjusted unemployment rose by more than a point, but the underlying combination of more workforce participation and lower rates of part-time work that appear to drive this increase make this counterintuitively good news.
In the context of this good news, the headline increase in unemployment underscores why this figure is only one of a number of important indicators of economic health. Gallup's unadjusted unemployment increased in January for seasonal reasons and because of increased workforce participation -- a sign of improving economic health. The real test for whether the U.S. economy is truly improving will be the rate of full-time employment going forward, especially the P2P rate. The U.S. needs many more full-time jobs to regain the ground lost since 2008 and to show real catch-up job growth.
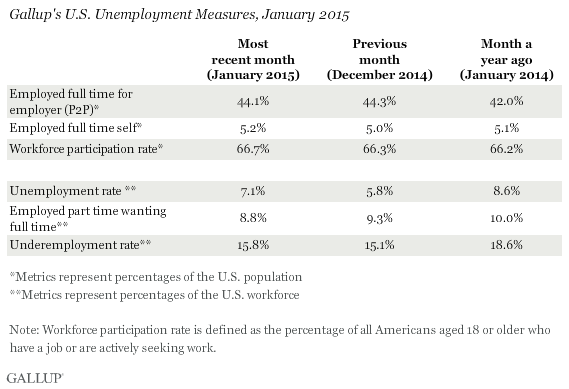
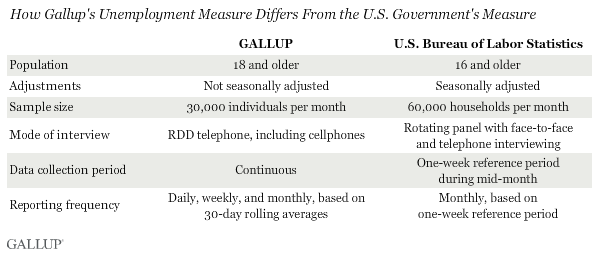
Survey Methods
Results for this Gallup poll are based on telephone interviews conducted Jan. 2-31, 2015, on the Gallup U.S. Daily survey, with a random sample of 29,405 adults, aged 18 and older, living in all 50 U.S. states and the District of Columbia. For results based on the total sample of national adults, the margin of sampling error is ±1 percentage points at the 95% confidence level. All reported margins of sampling error include computed design effects for weighting.
Each sample of national adults includes a minimum quota of 50% cellphone respondents and 50% landline respondents, with additional minimum quotas by time zone within region. Landline and cellular telephone numbers are selected using random-digit-dial methods.
366-43-23. U.S. Job Creation Lingers
Near Seven-Year High
February
04, 2015
WASHINGTON, D.C. -- The hiring climate at the start of 2015 is similar to where it stood in the second half of 2014, with Gallup's U.S. Job Creation Index coming in at +28 for the month of January. This is nearly identical to the +27 found in December, and just below the seven-year high of +30 reached in September.
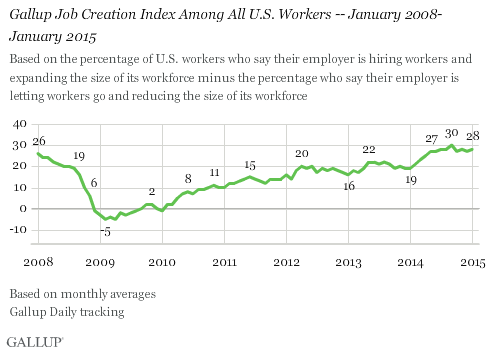
The index has experienced six years of incremental progress after bottoming out at -5 in February and April 2009. This includes sharp improvements in the first half of 2014, with the index increasing from +19 in January to +27 in May and June. Since then, progress has stalled, with the index staying within a narrow four-point range.
Gallup's Job Creation Index is a measure of net hiring activity in the U.S., with the January average based on a nationally representative sample of more than 16,000 full- and part-time workers. January's +28 score is the result of 40% of employees saying their employer is hiring workers and expanding the size of its workforce, and 12% saying their employer is letting workers go and reducing the size of its workforce. Forty-one percent reported no changes in staffing in their workplaces.
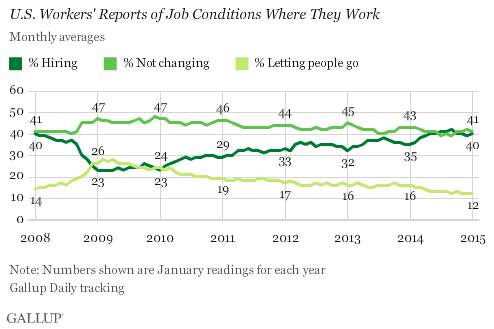
Hiring Flat Among Government and Nongovernment Sectors
Nongovernment employees (+29) continue to report greater levels of hiring than government workers (+19). This has been the case in nearly all monthly readings since Gallup began tracking job creation in 2008.
In January, 41% of nongovernment workers said their employers are hiring, while 12% said they are letting people go. Meanwhile, 36% of government workers reported staff increases and 17%, staff reductions.
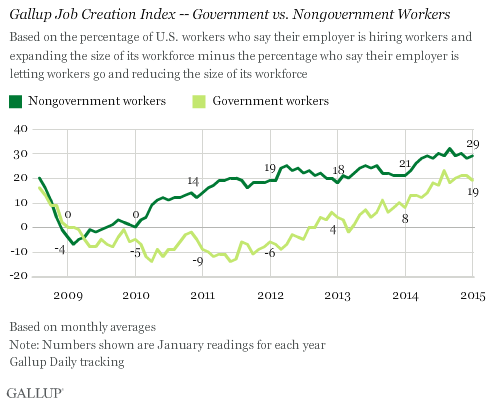
Bottom Line
U.S. workers' perceptions of hiring at their places of employment are the most positive Gallup has recorded in any January since Gallup began tracking this in 2008. But the increase since last January came mostly in the first half of 2014. The index has since stalled, suggesting that the future of the jobs situation in the U.S. remains uncertain. At the same time, at least two other indicators show growing economic optimism: Americans' confidence in the U.S. economy has improved significantly since early December, and over the same period, Americans have become much more optimistic when asked if it is a good time to find a quality job. Whether these sentiments prove to be advance indicators of hiring that is more visible across U.S. workplaces may partly depend on whether they help fuel more consumer spending.
Survey Methods
Results for this Gallup poll are based on telephone interviews conducted Jan. 2-31, 2015, on the Gallup U.S. Daily survey, with a random sample of 16,501 employed adults, aged 18 and older, living in all 50 U.S. states and the District of Columbia. For results based on the total sample of national adults, the margin of sampling error is ±1 percentage point at the 95% confidence level. All reported margins of sampling error include computed design effects for weighting.
Each sample of national adults includes a minimum quota of 50% cellphone respondents and 50% landline respondents, with additional minimum quotas by time zone within region. Landline and cellular telephone numbers are selected using random-digit-dial methods.
366-43-24. Investigative Journalists
and Digital Security
Perceptions of Vulnerability and Changes in Behavior
February
05, 2015
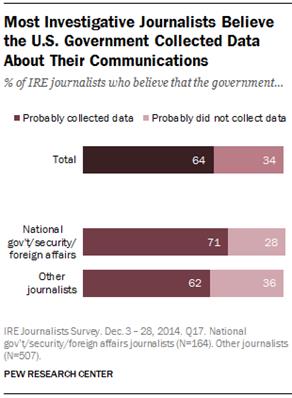
About two-thirds of investigative journalists surveyed (64%) believe that the U.S. government has probably collected data about their phone calls, emails or online communications, and eight-in-ten believe that being a journalist increases the likelihood that their data will be collected. Those who report on national security, foreign affairs or the federal government are particularly likely to believe the government has already collected data about their electronic communications (71% say this is the case), according to a new survey of members of Investigative Reporters and Editors (IRE) – a nonprofit member organization for journalists – by the Pew Research Center in association with Columbia University’s Tow Center for Digital Journalism.1
Thus far, concerns about surveillance and hacking have mostly fallen short of keeping many journalists from pursuing a story or a source; Just 14% say that in the past 12 months, such concerns have kept them from pursuing a story or reaching out to a particular source, or have led them to consider leaving investigative journalism altogether.
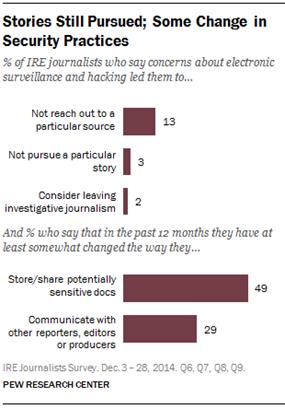
Still, these concerns have led many of these journalists to alter their behavior in the past 12 months. Nearly half (49%) say they have at least somewhat changed the way they store or share sensitive documents, and 29% say the same of the way they communicate with other reporters, editors or producers.
And among the 454 respondents who identify as reporters, 38% say that in the past year they have at least somewhat changed the way they communicate with sources.
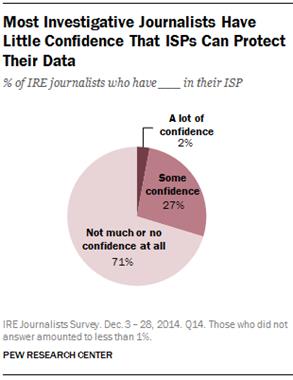
When it comes to external protection from digital threats like surveillance and hacking, these investigative journalists do not put much stock in their internet service providers (referred to as ISPs). Just 2% have “a lot of confidence” their ISP can protect their data from being accessed by unauthorized parties, while 71% have not much or no confidence at all.
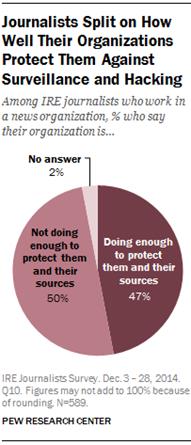
News organizations get mixed reviews for their ability to protect the security of their employees’ communications. Among those who work for news organizations (589 of the 671 journalists surveyed), half say their employer is not doing enough to protect journalists and their sources from surveillance and hacking, while about the same share (47%) says they are doing enough. Just 21% say their organization has taken steps or implemented policies in the past year to protect journalists and their sources, while 36% say their organization has not, and 42% do not know. About half (54%) report getting no formal training or instruction on electronic security issues from professional sources such as journalism associations, news organizations or journalism schools.
Still, other issues are more pressing for the profession than surveillance and hacking. When asked to rank four challenges facing journalists today, an overwhelming majority (88%) of journalists identify decreasing resources in newsrooms as their top concern. No other issue comes close. Following far behind are: legal action against journalists (5%), electronic surveillance by governments or corporations (4%) and hacking targeted at journalists or news organizations (1%). Furthermore, relatively few journalists (27%) have spent at least “some time” in the past 12 months researching how to improve their electronic security.
Overall, these data paint a complex picture in which investigative journalists on the whole feel vulnerable to surveillance and hacking, but not to the degree that most are changing their journalistic practices dramatically or investing energy into figuring out how to do so. And nearly all of those surveyed (97%) say that for today’s journalists, the benefits of digital communication like email and cellphones outweigh the risks. Just 3% say the risks outweigh the benefits.
About
This Survey
The analysis in this report is based on an online survey conducted from December 3-28, 2014, with a representative sample of 671 journalists who are members of Investigative Reporters and Editors, Inc. (IRE). The 671 investigative journalists include a mix of reporters, producers, editors, data specialists, photojournalists and others, and comprise a wide range of coverage areas.
The survey was written and analyzed by Pew Research Center staff, and field work was conducted by Princeton Survey Research Associates International (PSRAI). Email invitations containing individualized survey links to access the online study were sent to 2,723 investigative journalists in the United States who are members of IRE. Journalists also had the option of returning a print version of the survey through the mail. For more detailed information, see the Methodology section.
- For
the purpose of this study, members who were not based in the United
States, or who did not identify themselves as practicing journalists (educators
or students, for instance) were excluded from further sampling. ↩
LATIN AMERICA
366-43-25. 65% of Brazilians have a
positive view of the UN
February
02, 2015
42%
associate the United Nations to humanitarian aid work and 39% say they know it
for its peacekeeping missions
A
survey conducted by IBOPE Inteligência in Brazil to measure what Brazil´s
population knows about the United Nations (UN) shows that 74% of Brazilians
know or have heard of the UN, and 65% consider the work of the international
organization as positive (22%) or very positive (43%).
Social
class and education directly reflect the knowledge about the UN. While 90% of
respondents of A and B classes (upper classes) know the UN, this rate drops to
50% in lower classes (D and E).
Education
level also influences: 89% of Brazilians who have a college degree consider the
UN's work as positive or very positive, while 42% of those who only completed
elementary school evaluate the same way.
This
survey was conducted in 140 Brazilian cities among 2,002 respondents from May
15 to May 19, 2014.
366-43-26. 19% of Brazilians do not
know better time to buy tickets or travel package[1]
02/06/2015
14% still have doubts became the
most economical choice
To travel economically it is
necessary to plan. The trip planning is essential to ensure the best and
know the best dates for the holidays. According to a survey * of CONECTAí
to Skyscanner, 19% of Brazilians still do not know the best time to purchase
tickets or travel package and 14% still have doubts became the most economical
choice.
According to Skyscanner, who plans
to visit the United States can now start thinking about programming, because
the ideal month for the trip is August, end of the American summer and
early-season. At that time, the savings can be up to 12% when compared to
the average price of airline tickets. But it must be planned. In the
case of Orlando, for example, the ideal time to purchase tickets is 15 weeks
before the chosen date.
Have those who dream of the Christmas holidays on American soil, should know
that December is the most expensive month to travel to Miami, New York and
Orlando. The value of tickets for a trip in the week between Christmas and
New Year can leave up to 72% higher compared to the cheapest period of the
year. But if the dream destination is Europe, the ideal time is the month
of March, with the end of the European winter. Going to Rome, London,
Paris, Madrid or Lisbon can leave up to 37% cheaper when compared to the most
expensive period, which is July.
The survey also examined two cities in South America: Buenos Aires and
Santiago. The ideal month to travel to Argentina's capital is August,
although the cheapest week of the year for a visit is precisely the May 2,
where the economy can be up to 31%. Have Santiago is cheaper in the third
week of October, with savings of up to 40% compared to the most expensive week
in April.
Cheapest month to travel 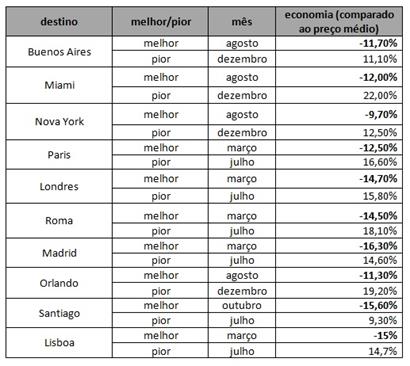
Ideal time to advance
planning 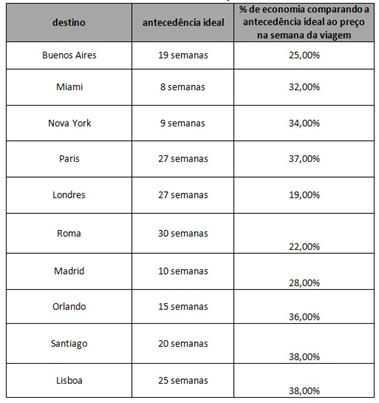
* Research conducted in the online
panel CONECTAí, with 1047 participants from 16 years or more, from all regions
of Brazil.
MULTI-COUNTRY SURVEYS
366-43-27. Widespread concerns about
extremism in Muslim nations, and little support for it
February
05, 2015
The horrific murder of Jordanian pilot Moaz al-Kasasbeh has generated shock and outrage around the globe. And if recent history is a guide, this brutal act will only deepen opposition to ISIS, and to violent extremism more generally, in Jordan and other predominantly Muslim nations.
At the Pew Research Center, we’ve been asking questions related to extremism on our international surveys for over a decade, and what we’ve generally found among Muslim publics is that support for extremism is low, while concerns about it are high.

Even before ISIS’s battlefield victories and humanitarian atrocities began capturing international headlines last summer, we found growing worries about extremism in the Middle East. For instance, 62% of Jordanians said they were concerned about Islamic extremism in their country in our spring 2014 poll, up from 54% a year earlier. There were also increases in Lebanon, Tunisia, Egypt and Turkey.
The survey also found mostly negative views toward al Qaeda and other extremist groups in these and many other predominantly Muslim countries. The most positive rating for al Qaeda was in the Palestinian territories, where 25% had a favorable view of the terrorist organization.
One pattern we’ve seen in different parts of the world is that the more people are exposed to terrorist violence, the more they reject it. Jordan is a good example. Early in the last decade, Jordanians expressed relatively high levels of support for suicide bombing and confidence in Osama bin Laden, but this changed after the November 2005 suicide attacks on three hotels in Amman, Jordan’s capital. The bombings, which killed dozens and wounded more than 100, were orchestrated by an al Qaeda affiliate, led at the time by the Jordanian Abu Musab al-Zarqawi.
A few months later, a Pew Research survey found the percentage of Jordanian Muslims saying suicide attacks can often or sometimes be justified had fallen from 57% to 29%. Today, it stands at 15%. Similarly, confidence in bin Laden plummeted from 61% to 24% after the bombings, and by the time of his death just 13% of Jordanians had confidence in the terrorist leader.
Pakistan is another example. The terrible violence Pakistanis have experienced at the hands of the Taliban and other groups over the past decade has led many to reject violent extremism. In 2004, 41% of Pakistani Muslims said suicide bombing can often or sometimes be justified; by 2014 only 3% held this view.
In 2009, when the Taliban occupied Pakistan’s Swat Valley and threatened to drive even closer to the nation’s capital, Islamabad, opposition to the extremist group jumped dramatically. In 2008, just 33% of Pakistanis had an unfavorable view of the Taliban, but this rose to 70% in the 2009 survey. In Pakistan and elsewhere, once terrorist violence and extremist rule has become a reality, people have rejected it.
366-43-28. Consumer
Mood Brightened Again Towards End Of Year
February 04, 2015
Findings
of the GfK Consumer Climate Europe study for the fourth quarter of 2014
Nuremberg, February 4, 2015 – The mood of consumers throughout Europe improved
again over the fourth quarter of the year. The indicators for economic and
income expectations, as well as willingness to buy, rose towards the end of the
year in almost all countries of the European Union (EU). The consumer climate
for the EU 28 also improved by 1.3 points in the final quarter, closing the
year at 5.5 points. These are the findings of the GfK Consumer Climate Europe
study in 14 European countries.
Looking at economic development of EU countries and the consumer mood in 2014,
the year can be divided into two distinct parts. In the first half of the year,
the economies of virtually all European countries were developing positively.
Consumers were clearly becoming ever more confident that the financial and
economic crisis would finally be behind them in the following months. Between
April and June, the indicators for economic and income expectations as well as
willingness to buy reached record highs almost across the board. The consumer
climate index for the EU 28 was at 9.1 points in June, which is the highest
value since April 2008.
However, in summer and autumn, uncertainty began to increase not only among
consumers, but also in the economy. This is attributable to a number of
different reasons. The conflict in Ukraine reached its peak. Comments from
Russian President Vladimir Putin caused uncertainty, for the most part in
Eastern European countries. In the Middle East, the ongoing conflict between
Israel and Palestine and the advancement of the Islamic State militant group
gripped the world. In addition, the Ebola epidemic shifted global attention to
West Africa. As the first patients were flown to Europe and the USA for
treatment, fears that the virus would spread increased. With regard to the
economic situation, the framework conditions also deteriorated. In many
countries, gross domestic product (GDP) growth has been much slower than had
been predicted. Meanwhile, some countries even recorded a decrease. This was
further affected by an extremely low level of inflation. In particular,
Southern European countries such as Spain battled against deflation. There was
also a risk of negative price development for the EU as a whole. The inflation
rate for the EU 28 was -0.1 percent in December, while the rate in the eurozone
was even lower at -0.2 percent. This is primarily due to the collapse in energy
prices.
These events are all contributing towards a clear increase in anxiety among
European consumers. The indicator values all fell towards the end of the summer
and in autumn, in some cases quite markedly. However, in the fourth quarter, a
sense of optimism once more took hold in most countries. Although many
indicators remain below zero, they are on an upward trend in virtually all
countries.
Nonetheless,
there continue to be risks that may hamper positive economic development over
the coming months. Following the election in Greece, it now remains to be seen
what economic course the next government will take and whether it will keep to
agreements with other European countries and the European Commission.
This
development is also reflected in the GfK consumer climate for the EU 28. Within
the context of the optimistic mood in all EU countries, the index climbed to
9.1 points in June, which is the highest value since April 2008. In September,
it dropped down to 4.2 points. By the end of the year the indicator had recovered
slightly to 5.5 points in December.
About the study
The
findings of the GfK Consumer Climate Europe are taken from a consumer survey
carried out in all countries of the European Union on behalf of the European
Commission. Approximately 40,000 individuals, representing the adult population
in the EU, are surveyed on a monthly basis in 28 countries.
The
GfK indicators of the Consumer Climate Europe are based on monthly surveys
focusing on consumer sentiment. They deal with the general economic situation
in the different countries and the situation of individual households.
The
questions on the GfK Consumer Climate Europe are asked on a monthly basis,
primarily in an omnibus survey. This is a survey dealing with several issues,
conducted either by telephone or in a face-to-face interview.
From the monthly range of 12 questions overall, five questions that play a
decisive role for the consumer climate are selected for the GfK Consumer
Climate Europe.
The selected five indicators – economic expectations, price expectations,
income expectations, willingness to buy and propensity to save – are calculated
as follows:
“Net totals” are used as a basis for calculating the indicators. The share of
consumers who gave a positive response (e.g. the financial situation of the
household will improve (considerably)) is subtracted from the share of those
who gave a negative response (e.g. the financial situation of the household
will worsen (considerably)).
In a further step, this net total is standardized using established statistical
methods and then converted so that the long-term average of the indicator is
zero points and there is a theoretical value range of +100 to -100 points.
However, on an empirical basis, values between +60 and -60 points have
generally been realistic since 1980.
If an indicator is positive, this shows that consumers’ assessment of this
variable is above average in a long-term comparison, and vice versa for
negative values. Standardization makes it easier to compare the indicators of
different countries, as variations in response behavior resulting from
different mentalities are offset, while the fundamental trend of the indicator
remains unchanged.
CYBER WORLD
366-43-29.
More Australians buying eBooks
February 02, 2015
Amid recent reports in the UK that the eBook may have had its day, Roy
Morgan Research’s latest figures reveal that this might not be the case in
Australia. In fact, over the past two years, online sales of eBooks have
increased across most age groups — along with the proportion of Aussies reading
novels or non-fiction titles in an average three-month period.
In the 12 months to September 2014, 7.0% of Australians aged 14+ bought at least one eBook via the internet in an average three months. Australians aged between 35 and 49 are the most likely to have bought eBooks, with 9.1% doing so in an average 3 months, slightly up from the previous year (8.7%). During the same period, the proportion of this age group that read a book (either fiction or non-fiction, print or digital) increased from 55.0% to 56.7%.
The proportion of Australians aged 18-24 buying eBooks online in any given three-month period has also increased, from 3.9% in 2013 to 5.1% in 2014 — despite being the only age group to have seen a decrease in reading incidence (from 55.3% to 53.3%).
eBook purchasing online: 2013 vs 2014
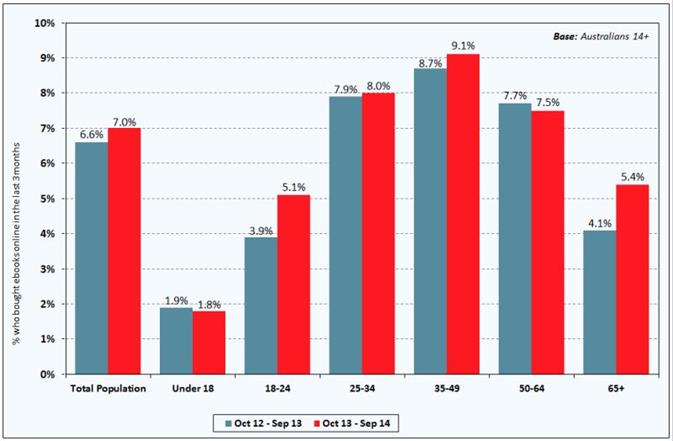
Source: Roy Morgan Single Source (Australia), October
2012-September 2013 (n=19,585) and October 2013 – September 2014 (n=16,176).
Meanwhile, the 65+ age group showed a growing willingness to adopt this new technology, with the proportion purchasing eBooks rising from 4.1% to 5.4% -- a higher proportion than some of the younger age groups that have grown up in the digital age. Reading books in general also increased among this older demographic, from 64.5% to 67.1%.
Angela Smith, Group Account Director, Roy Morgan Research, says:
“Between October 2012 and September 2014, the proportion of Australians 14+ reading books in an average three months grew for the first time in several years. Whether this represents the beginning of an ongoing trend remains to be seen, but it is an encouraging sign for both printed book and eBook retailers.
“Over the same time period, the proportion of us buying eBooks online in any given three months also increased. Ebooks still account for a small proportion of the book market, but are showing no signs of being yesterday’s fad just yet.
“While just over 15% of the population have at least one e-reader in their household, it is also possible to read eBooks on one’s tablet, smart phone or laptop, making them accessible to a much broader audience than one might think.
“Despite what doomsayers have predicted for years, the rise of the eBook will not necessarily result in the death of its hardcopy equivalent — at least, not where online purchasing is concerned. The proportion of Australians buying printed books over the internet in an average three months has also increased.”
ANALYSIS TANK
366-43-30 America’s ‘middle’ holds its ground
after the Great Recession
In the years following the Great Recession, the share of Americans who live in middle-income households held steady at 51% in 2013, the same share as in 2010, according to a new Pew Research Center analysis.
While the muddled recovery has yet to bolster the middle, this flat trend might actually be good news because, for now, it stems a decades-long slide. Back in 1970, 61% of adults lived in middle-income households.
But who, exactly, is middle income? First, we should note that middle income is not necessarily the same thing as middle class. There are many different ways to measure America’s “middle,” including by people’s education, occupation, wealth, social values or some combination of the above. There is no universal definition.

Our analysis is based on household income data from the U.S. Census Bureau. First, we adjust incomes for family size. Incomes of households of below-average size are scaled up (because their dollars go farther), and incomes of households of above-average size are scaled down (because their dollars do not go as far). This process ultimately adjusts household incomes to reflect the standard of living of a three-person household.
Finally, we compute the median of the size-adjusted household incomes. Middle-income households, by our definition, earn as much as twice the median income or as little as two-thirds the median. This results in a range of $40,667 to $122,000 for a middle-income American household of three in 2013.
Now, let’s take a look at our major findings on the trends for America’s lower-, middle- and upper-income households.
1
The share of adults who live in middle-income households has eroded over time, from 61% in 1970 to 51% in 2013. Although the share is unchanged in recent years – it was the same in 2010 – the erosion over the last four decades has been sure and steady, through economic ups and downs. If past trends continue to hold, there is little reason to believe the recovery from the Great Recession will eventually lead to a rebound in the share of adults in middle-income households.
The shrinking in the middle of the income distribution is not all bad news, however. Yes, the share of adults living in lower-income households has increased, up from 25% in 1970 to 29% in 2013. But more adults now live in upper-income households, up from 14% in 1970 to 20% in 2013.
2The narrowing in the middle happened for all major racial and ethnic groups. From 1990 to 2013, the share of adult whites and Asians living in middle-income households decreased the most, from 58% to 53% and from 56% to 50%, respectively. The decline was less pronounced among Hispanics (from 48% to 47%) and blacks (47% to 45%).
Nonetheless, sharp differences persist across racial and ethnic groups in the distribution of adults by income tiers. In 2013, 44% each of Hispanic and black adults were lower income, compared with 23% of whites and 24% of Asians.

At the top, about one-in-four whites and Asian adults are upper income, compared with only about one-in-ten Hispanics and blacks. There is no meaningful change in these gaps in the past two decades. (Consistent data on racial and ethnic categories are only available for 1987 onward.)
3
Incomes of all households are higher today than they were in 1970. Upper-income households saw the most growth, as their median income increased 43% from 1970 to 2013. Middle-income households gained 32% over the same period, and the median income of lower-income households increased 28%. (All incomes are adjusted for household size.)
However, the overall gains mask a lengthy period – a lost decade, and then some – of losses from 2000 to 2013. During this time, the median incomes of lower-, middle- and upper-income households have fallen by 9%, 6% and 6%, respectively. Currently, the incomes of these households are comparable to what they were in 1997.
4Upper-income households command a higher share of the U.S. aggregate household income than ever before. That is because the median income of upper-income households has risen the most, and also because a greater share of adults now lives in upper-income households.
In 2013, upper-income households accounted for 47% of aggregate household income, more than double the share of adults (20%) living in those households. Middle-income households accounted for 44% of aggregate household income, less than the share of adults (51%) living in those households.

Today’s distribution of aggregate income stands in stark contrast to what it looked like four decades ago. In 1970, middle-income households accounted for 62% of aggregate income, similar to the share of the adult population (61%) in those households. Upper-income households held a 29% share in the aggregate income of U.S. households in 1970, and 14% of the adult population lived in those households.
These data points are further confirmation of the nation’s growing economic inequality. A previous analysis by the Pew Research Center using a different data source determined that only upper-income families have experienced significant gains in wealth since the early 1990s. Researchers who focus on consumption have also found evidence of rising inequality, albeit not necessarily to the same degree as the increase in income disparities. Americans are seeing it too. In a January 2014 Pew Research Center survey, 65% of adults said the gap between the rich and everyone else had increased in the past 10 years.