BUSINESS & POLITICS IN THE MUSLIM WORLD
Global Opinion Report No. 381
May 17 - 23, 2015
Presentation: May 27, 2015
M. Zubair Khan
Contents
CSR initiatives can boost UAE companies' performance
Zimbabwe’s opposition distrusted, does not offer viable
policy options.
Ukrainians Deeply Concerned Over Corruption; Remain
Committed to Europe and Democracy
UK: Continued public support for RAF air strikes, but many
worry ISIS is winning
UK: Public opposition to fracking grows
Obama Favorable Rating Up, Best Since September 2013
On Social Ideology, the Left Catches Up to the Right
Negative Views of New Congress Cross Party Lines
Republicans’ Early Views of GOP Field More Positive Than in
2012, 2008 Campaigns
In U.S., Economic Confidence Index Drops Slightly to -7
The Benefits of Pre-Surgery Education
For Patients, Pre-Surgery Education Is Lacking
Americans Still Spending More, Still Not on What They Want
Canadians evenly divided on release of Omar Khadr
Eight out of ten Brazilians consider themselves religious
White out: Aussies opt for fresh over long-lasting milk
On your bike! Cycling participation picks up speed
Family Support in Graying Societies
Job Market Optimism Up Sharply in Northern America, Europe
INTRODUCTORY
NOTE
This week report consists of nineteen surveys. Two of these are
multi-country surveys while the rest of twenty are national surveys from
different states across the world.
381-43-21 Commentary: Family Support in Graying Societies
May 21, 2015.
 Family Support
in Graying Societies
Family Support
in Graying Societies
How Americans, Germans and Italians Are Coping with an Aging
Population
In 2015,
Germany and Italy are already at a level the U.S. may reach in 2050.
The United
States is turning gray, with the number of people ages 65 and older expected to
nearly double by 2050. This major
demographic transition has implications for the economy, government programs
such as Social Security and families across the U.S. Among adults with at least
one parent 65 or older, nearly three-in-ten already say that in the preceding
12 months they have helped their parents financially. Twice that share report
assisting a parent with personal care or day-to-day tasks. Based on demographic
change alone, the burden on families seems likely to grow in the coming
decades.
Germany
and Italy, two of the “oldest” nations in the world, after only Japan, are
already where the U.S. will be in 2050: a fifth of the population in each
country is age 65 or older. Compared with the U.S. today, a higher share of
adults in Germany and Italy report helping their aging parents with basic
tasks, and more in Italy have also provided personal care. However, in both
countries, fewer adults than in the U.S. say they have provided financial assistance
to their aging parents.
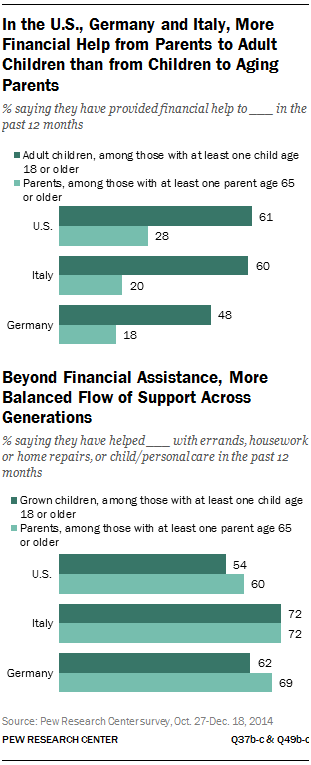
The latter difference underscores that, while Germany and
Italy may provide a window into the demographic future of the United States,
cultural and political factors nonetheless distinguish the three countries.
Nothing speaks to this more than the fact that, compared with Americans, twice
as many Germans and even more Italians think the government should bear the
greatest responsibility for people’s economic well-being in their old age. By
contrast, in the U.S. a majority say that families or individuals themselves
should see to the well-being of seniors.
These are
among the key findings from a new survey by the Pew Research Center that
compares the way families in the U.S., Germany and Italy are coping as more
people enter their senior years and eventually require assistance. Based on
interviews with at least 1,500 adults ages 18 and older in each country,
the survey also finds that many families are facing the dual challenge of
caring for aging parents while also supporting adult children. In the U.S.,
Germany and Italy, about half or more of adults who have at least one child 18
years of age or older say they have provided financial help to an adult child
in the 12 months preceding the survey; at least as many in each country have
assisted grown children in non-monetary ways.
Notably,
in all three countries, financial help is more likely to flow down to adult
children than up to aging parents. However, when it comes to “sweat equity,”
about as many in each country are assisting senior-age parents with their needs
as are helping adult children with child care, errands, housework and other
day-to-day tasks.
Widespread
Concerns About the Future of Social Security
Even as
about half or more of Italians and Germans say the state should be mostly
responsible for ensuring financial stability in old age, many in all three
countries surveyed are skeptical that there will be enough money in their
countries’ social security systems when they retire to provide benefits, even
at a reduced level. All three systems are financed through worker contributions
and, in Europe more than in the U.S., the growing number of older adults along
with a shrinking pool of younger active contributors has made it difficult to
fund pensions for current retirees.
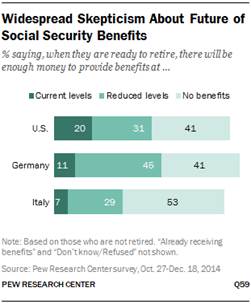
Among those who have not yet retired, only 20% of Americans
expect the Social Security system to have enough money when they are ready to
retire to provide them with benefits at current levels. An additional 31% say
they expect to receive benefits at reduced levels, and 41%
think they will receive no benefits at all.
Germans
and Italians are even more doubtful that their countries’ social security
systems will be able to maintain their current levels of support. In Germany,
11% think they will receive benefits from the Gesetzliche Rentenversicherung
(Germany’s equivalent to the U.S. Social Security system) at current levels,
45% think they will receive benefits at reduced levels, and 41% expect to get
no benefits at all. Among Italians, only 7% believe there will be enough money
in the Previdenza Sociale to provide them with benefits at their current
levels, 29% expect benefits but at reduced levels, and fully 53% think they
will not get any benefits.
Few
Italians Saving for Retirement
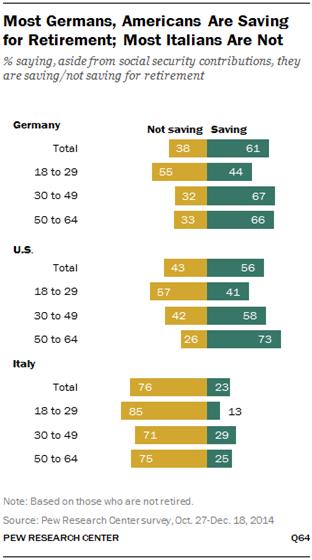
If government benefits are reduced or not available, future
retirees will need to rely even more heavily on their own personal savings. More
than half of Americans (56%) and Germans (61%) who are not retired say they are
putting money in a private retirement plan or other savings account aside from
social security contributions. But in Italy, just 23% say they are doing this;
fully 76% say they are not saving for retirement.
In all
three countries, majorities of young adults ages 18 to 29 say they are not
currently saving for retirement aside from social security contributions.
Still, a substantial share of young adults in Germany (44%) and the U.S. (41%)
say they are saving for retirement. By comparison, only 13% of young adults in
Italy say they are saving for retirement. And even among Italians ages 50 to 64
–those who are closest to retiring – only 25% say they are putting money in a
private retirement plan or other private savings account.
Men and
women are equally likely to say they are saving for retirement, whether in the
U.S., Germany or Italy. And across all three countries, saving for retirement
is highly correlated with financial security. Those who say they live
comfortably are among the most likely to report that they are saving for
retirement beyond what they are contributing to social security, while those
who say they do not have enough money to meet their basic expenses are among
the least likely to be saving.
In fact,
most adults who are not saving for retirement report that this is mainly
because they do not have enough money to save right now, while relatively few
say it is because they have not yet started to think about retirement. About
two-thirds of Americans and Italians who are not currently saving for
retirement say this is mainly because they lack the funds, as do about half in
Germany.
Most
See Helping an Aging Parent as a Responsibility
In
addition to relying more heavily on private savings, future retirees may also
need to turn to family members for support as they age. Majorities across the
three countries believe adult children have a responsibility to provide
financial assistance to an aging parent in need. Many also see providing
financial support for adult children as a responsibility, while far fewer say
the same about providing childcare for grandchildren or saving money to hand down
to their children after they die.
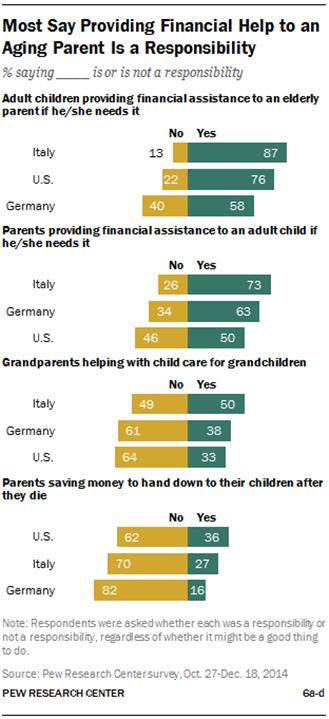
About
three-quarters or more in Italy (87%) and the U.S. (76%) view providing
financial assistance to aging parents in need as a responsibility, as do 58% in
Germany. Young Americans and Germans are more likely than older
people in their countries to say adult children have a responsibility to help
aging parents in need; 86% of 18- to 29-year-olds in the U.S. and 76% in
Germany see this as a responsibility, compared with 64% of Americans and 57% of
Germans ages 65 and older.
Similar
shares of Italians across age groups see helping an aging parent in need as a
responsibility but, unlike in the U.S. and Germany, there are differences in
how younger and older Italians perceive support to grown children. More than
eight-in-ten (85%) Italians ages 65 and older say providing financial support
to an adult child in need is a responsibility, compared with 58% of 18- to
29-year-olds. Overall, 73% of Italians and 63% of Germans say parents have a
responsibility to help an adult child financially if needed; half of Americans
share this view.
When
asked about helping with child care for grandchildren, half of Italians see it
as a responsibility; about four-in-ten (38%) Germans and one-third of Americans
say this is the case. And while Americans are somewhat more likely than
Italians and Germans to say parents have a responsibility to leave behind an
inheritance, relatively few in each country say so (36%, 27% and 16%,
respectively).
More
Are Giving Time Rather than Money to Help Aging Parents
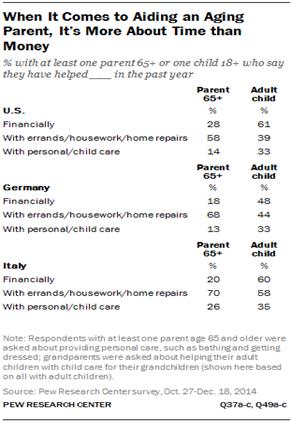
Assistance to aging parents and to adult children takes on
many forms, but in all three countries, more say they are helping their aging
parents with errands, housework or home repairs than say they are providing
financial help or help with personal care, such as helping them bathe or get
dressed. The pattern of support to adult children is less consistent across
countries.1
Seven-in-ten
Italians (70%) say they have helped an aging parent with errands, housework or
home repairs in the 12 months preceding the survey, while about a quarter or
fewer say they have provided help with personal care (26%) or finances (20%).
Similarly, 68% of Germans with an aging parent have helped with errands,
housework or home repairs, but half as many as in Italy have assisted a parent
with personal care; 13% in Germany have done this. As in Italy, about
one-in-five Germans (18%) have helped an aging parent financially.
In the
U.S., about six-in-ten (58%) have assisted an aging parent with errands,
housework or home repairs in the preceding 12 months. About three-in-ten (28%)
say they have helped financially, while half as many (14%) say they have helped
a parent with personal care, such as bathing or getting dressed.
In the
three countries surveyed, more say they have given financial help to an adult
child in the preceding 12 months than say they have similarly helped an aging
parent. About six-in-ten (61%) Americans with at least one grown child say they
have given their children at least some financial support, far more than say
they have helped their children with errands, housework or home repairs (39%)
or with child care (33%).
In Italy
and Germany, about as many say they have helped their children financially as
say they have helped with errands, housework or home repairs. About six-in-ten
Italians with an adult child say they have provided each type of assistance in
the preceding 12 months; among Germans, 48% say they have helped a grown child
financially and 44% say they have helped with errands, housework or home repairs.
About a third of Italians (35%) and Germans (33%) with grown children have
helped with child care.
The
Sandwich Generation
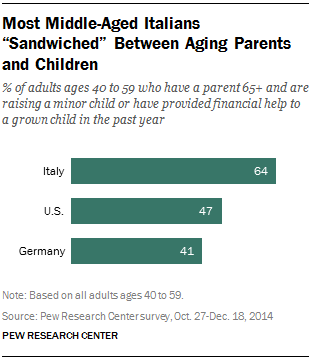
About three-in-ten (31%) adults in Italy, 23% of Americans
and 19% of Germans overall are “sandwiched” between their children and their
parents – that is, they have one or two parents age 65 or older and are either
raising a young child or have provided financial assistance to a grown child in
the preceding 12 months. Among those in their 40s and 50s, much larger shares
are in this situation.
Fully 64%
Italians in their 40s and 50s have a parent age 65 or older and are either
raising a young child or have provided financial assistance to a grown child in
the preceding 12 months. Nearly half of Americans (47%) and 41% of Germans in
the same age group are also sandwiched between their children and aging
parents.
Despite
the added demand on this group, many of whom are providing financial and other
help to both an aging parent and an adult child, those who are part of the
sandwich generation are as likely as other adults to say they are generally
happy with their lives and to express high levels of satisfaction with their
family life, the number of friends they have, the quality of life in their
community and their present housing situation. They are also no more likely
than other adults to say helping an aging parent is stressful. In the U.S.,
however, those who are sandwiched between generations are more likely to say
helping an adult child is stressful than those who have provided financial help
to an adult child but are not part of the sandwich generation; this is not the
case in Germany and Italy.
The
remainder of this report looks at demographic shifts in the U.S., Germany and
Italy and family support for younger and older generations. Chapter 1 examines
the age structures in the three countries and the financial profiles of the
younger and older generations. Chapter 2 looks at public attitudes about the
type of intergenerational support families have a responsibility to provide.
Chapter 3 explores the experiences of American, German and Italian adults ages
65 and older, including what they see as advantages and disadvantages of
getting old. Chapters 4 and 5 focus on people’s personal experiences caring for
aging parents and helping adult children. And Chapter 6 examines the frequency
and modes of communication across generations.
Other
Key Findings
In
the three countries surveyed, more say that helping an aging parent or an adult
child is rewarding than say it is stressful. More
than eight-in-ten adults who are providing help to a parent age 65 or older in
the U.S. (88%), Italy (88%) and Germany (84%) say that doing so is rewarding,
while about a third or less in each country find it stressful. Similarly, among those who are helping their grown
children, 91% in Italy, 89% in the U.S. and 86% in Germany say that it is
rewarding; 12%, 30% and 15%, respectively, say it is stressful.
Many
see upsides to getting older. More than
six-in-ten adults ages 65 and older in the U.S., Germany and Italy say they are
spending more time with their family and on hobbies as they get older. About
half or more also say they are experiencing less stress.
Older
adults who are married are more likely than those who are not currently married
to say they are very satisfied with their family life. This is the case among adults ages 65 and older in the
three countries surveyed, but it is particularly pronounced in Italy and
Germany, where older adults who are married are about twice as likely as those
who aren’t to say they are very satisfied with their family life (50% vs. 26%
in Italy and 70% vs. 35% in Germany).
Nearly
half of Italians say an adult child is living with them in their home for most
of the year. Among
Italians ages 50 to 64, six-in-ten say this is the case. In contrast, 30% of
Americans and 27% of Germans in the same age group say an adult child – or
possibly more than one – lives with them.
Seven-in-ten
Italians say they are in contact at least once a day with their adult children
who don’t live with them. Fewer in
the U.S. (46%) and Germany (32%) say this is the case. Among those who say they
are contact with their children once a month or more frequently, Americans are
more likely than Germans and Italians to use text messages, email and Facebook
or other social networking sites to stay in touch.
SUMMARY
OF POLLS
MENA
CSR initiatives can boost UAE companies'
performance
New YouGov findings reveal that around three-quarters of residents in
the UAE are more likely to purchase from companies that actively contribute to
the community. (YouGov Siraj)
May 2015
SUB-SAHARAN AFRICA
Zimbabwe’s opposition distrusted, does
not offer viable policy options
Trust in political opposition parties in Zimbabwe is considerably low,
with just over one third of the adult population asserting that they trust
opposition political parties. This is according to the results of the most
recent Afrobarometer public opinion survey. (Afrobarometer)
May 21, 2015
EAST EUROPE
Ukrainians Deeply Concerned Over
Corruption; Remain Committed to Europe and Democracy
A new IRI municipal poll conducted in Ukraine found an
overwhelming majority of citizens reporting that corruption and nepotism were
serious problems impacting their daily lives. Importantly, despite their
concerns over corruption and the economy, Ukrainians also showed their strong
support for the country’s decision to align more closely with Europe and the
West. (IRI)
May 19, 2015
WEST EUROPE
UK: Continued public support for RAF
air strikes, but many worry ISIS is winning
Six in ten approve of the anti-ISIS air campaign, but hardly anyone
thinks the terror group is losing its grip and most would back increased
commitment. (YouGov)
May 23, 2015
UK: Public opposition to fracking
grows
With David Cameron’s new all-Conservative cabinet now in place and
Parliament back in session, much of Westminster’s attention will once again
turn back to governing. One major issue facing the next Parliament is Britain’s
future with fracking, the controversial drilling technique credited with the
recent boom in US shale oil and gas drilling. The Conservative party has shown support for
the use of fracking, but it faces opposition from local communities and
environmental groups. (YouGov)
May 19, 2015
NORTH AMERICA
Obama Favorable Rating Up, Best Since
September 2013
Americans' favorable ratings of President Barack Obama now stand at 53%,
up four points from March. This comes after a year in which these ratings were
mostly below 50% and marks the president's highest score since September 2013.
(Gallup USA)
May 21, 2015
On Social Ideology, the Left Catches
Up to the Right
Thirty-one percent of Americans describe their views on social issues as
generally liberal, matching the percentage who identify as social conservatives
for the first time in Gallup records dating back to 1999. (Gallup USA)
May 22, 2015
Negative Views of New Congress Cross
Party Lines
The new Republican-led Congress is drawing harsh reviews from the public
– including most Republicans. Just 23% of Americans say congressional
Republicans are keeping the promises they made during last fall’s campaign,
while 65% say they are not. (Pew Research Center)
May 21, 2015
Republicans’ Early Views of GOP Field
More Positive Than in 2012, 2008 Campaigns
From the start, the Republican presidential field for 2016 has been much
more crowded than the Democratic field. But voters in each party have similar
views of the quality of their party’s candidates. (Pew Research Center)
May 19, 2015
In U.S., Economic Confidence Index
Drops Slightly to -7
Gallup's Economic Confidence Index dropped slightly to -7 for the week
ending May 17, 2015. There have been minor fluctuations in economic confidence
in the last three weeks, but from a longer-range perspective, the key finding
is that Americans' confidence in the economy remains depressed -- down from the
highs it had reached in the period between late December and April. (Gallup
USA)
May 19, 2015
The Benefits of Pre-Surgery Education
To customers, feelings are facts. When the customers are hospital
patients receiving medical device implants, their emotions are influenced by
both the outcomes healthcare providers and medical device companies deliver and
by how these outcomes compare with patients' expectations. Patient education is
the primary way to manage these expectations. (Gallup USA)
May 20, 2015
For Patients, Pre-Surgery Education Is
Lacking
When it comes to pre-surgery education for patients, healthcare leaders
have their work cut out for them. But it's work worth doing. The positive
relationship between patient education and post-surgery outcomes has
significant implications for patients, healthcare providers and medical device
manufacturers. (Gallup USA)
May 21, 2015
Americans Still Spending More, Still
Not on What They Want
A majority of Americans, 55%, say they are spending more than they did
last year on groceries, the area in which Americans continually report spending
more. (Gallup USA)
May 21, 2015
Canadians evenly divided on release of
Omar Khadr
More than a dozen years after he allegedly killed an American soldier in Afghanistan, there is little consensus among Canadians in how
they view Omar Khadr, or in what they think about an Alberta judge’s decision to release him on bail while he waits to appeal his U.S. Military conviction.
(Angus Reid)
May 25, 2015
LATIN AMERICA
Eight out of ten Brazilians consider
themselves religious
In Brazil, eight in ten (79%) people say they are religious
people. This is shown by research Barometer Global Optimism, made by IBOPE
Intelligence in partnership with the Worldwide Independent Network of Market
Research (WIN), held in 65 countries with 63,898 respondents.Those who do not
consider themselves religious totaling 16% of the population and another 2%
claim to be atheists. (Ibope)
May 19, 2015
AUSTRALASIA
White out: Aussies opt for fresh over
long-lasting milk
Although UHT/long life milk is widely consumed
across Europe and Asia, it is yet to take off in Australia, where the
prevailing attitude appears to be ‘fresh is best’. Recent findings from Roy
Morgan Research show that seven out of every 10 Australians 14+ (or 13.6
million people) drink fresh milk in an average seven days, while fewer than two
in 10 (2.9 million people) drink the long-life/UHT variety. (Roy Morgan)
May 20, 2015
On your
bike! Cycling participation picks up speed
As anyone who drives a car would have noticed, the number of cyclists on
Australian roads has sky-rocketed in the past decade. Whereas 13% of the
population (or 2.1 million people) cycled regularly or occasionally in 2005,
the latest findings from Roy Morgan Research show that this has now reached 19%
(or 3.7 million people). Love them or loathe them, there’s no escaping them —
especially in WA, cycling’s heartland…(Roy
Morgan)
May 20, 2015
MULTI-COUNTRY SURVEYS
Family Support in Graying Societies
The United States is turning gray, with the number of
people ages 65 and older expected to nearly double by 2050. This major demographic
transition has implications for the economy, government programs such as Social
Security and families across the U.S. Among adults with at least one parent 65
or older, nearly three-in-ten already say that in the preceding 12 months they
have helped their parents financially. Twice that share report assisting a
parent with personal care or day-to-day tasks. Based on demographic change
alone, the burden on families seems likely to grow in the coming decades.
(Gallup USA)
May 21, 2015
Job Market Optimism Up Sharply in
Northern America, Europe
Although global job prospects remained glum in 2014, slightly more than
one in three adults worldwide (36%) said it was a "good time" to find
a job in their communities, which is up two percentage points from the previous year.
Optimism was highest in Northern America (51%) and lowest in the European Union
(25%). Both regions experienced the largest year-over-year improvements in the
world. (Gallup USA)
May 21, 2015
MENA
CSR initiatives can boost UAE
companies' performance
New YouGov
findings reveal that around three-quarters of residents in the UAE are more
likely to purchase from companies that actively contribute to the community.
The
research, commissioned by social enterprise Consult and Coach for a Cause
(C3), aimed to uncover how much Corporate Social Responsibility (CSR) programs
are influencing UAE residents’ consumer behaviour, and explore the impact that
these programs have among employees. The results show that 72% of the UAE
residents surveyed are more likely to buy products from enterprises that
support social and environmental causes.
The findings
also illustrate the effect CSR initiatives have on employee retention. A total
of 67% of employed UAE residents interviewed say they are more likely to
continue working for companies that allow them to volunteer more during working
hours.
Commenting
on the results, C3 Co-Founder and CEO, Medea Nocentini, declared being
"grateful to YouGov for having proved with statistically significant data
what CSR practitioners and social entrepreneurs have assumed and sensed in
their daily activities: positive contributions to the community make business
sense. At C3 we believe that measuring impact of community-driven initiatives
on society as well as on business organizations’ bottom line is paramount to
drive business responsibility of both corporations and entrepreneurs."
For YouGov’s
UAE Managing Director, Kailash Nagdev, companies can benefit from this
research. "We are delighted to have conducted this study to help shed more
light on perceptions of social enterprise in the UAE. The findings
illustrate there is huge scope for businesses to support worthwhile causes in
the region, and in turn that company giving will help drive company
success", he said.
Since
promoting social entrepreneurship and guiding emerging social entrepreneurs is
C3's purpose, YouGov also interviewed residents about the causes they care most
about, including which causes emirates residents would like to volunteer for
and donate to.
The full
study results will be presented by C3 and YouGov at the 12th annual CSR Summit,
on May 20. The summit is being organised by world-renowned knowledge
provider, Informa and will take place at The Address Hotel, Dubai Marina.
Research
for this study was conducted using YouGov's fast-paced Omnibus online research service amongst 993 residents in the UAE
between 2 and 10 February 2015. Data is broadly representative of the online
population in the UAE.
SUB-SAHARAN AFRICA
Zimbabwe’s opposition distrusted, does
not offer viable policy options
May 21,
2015
Trust in
political opposition parties in Zimbabwe is considerably low, with just over
one third of the adult population asserting that they trust opposition
political parties. This is according to the results of the most recent
Afrobarometer public opinion survey.
The
reasons for this difference in trust in the ruling party versus opposition
parties in Zimbabwe are underpinned by perceptions of their economic and
development policies, the honesty or integrity of party leaders and in the
experience of party leaders. Furthermore, respondents believe that the ruling
party is better equipped to address the problems bedevilling the country; such
as; fighting corruption, controlling prices, creating jobs and improving
health.
However,
opinion concerning whether Zimbabwe’s political opposition presents a viable alternative
vision and plan for the country was divided. This data presents itself in the
aftermath of the July 2013 elections and at a time when the country is reeling
under continuous economic deterioration. The political and economic state of
affairs in Zimbabwe highlights the need for a viable and credible opposition.
Key
findings
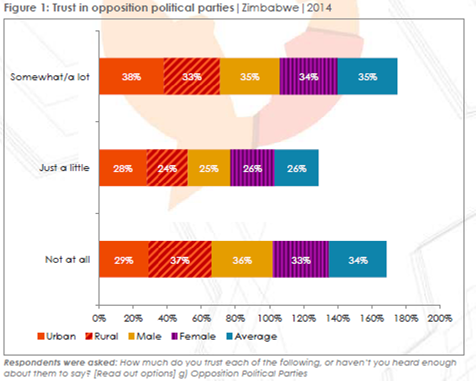
Only 34% of the adult Zimbabwean population trusts opposition political
parties; however this trust varies by location.
Zimbabweans think that variance in economic and development policies (29%), the
honesty or integrity of party leaders (16%) and the experience of party leaders
(15%) are the key features that distinguish the performance of the ruling party
(ZANU-PF) and opposition parties in the country.
Almost six in 10 respondents (57%) think that the ruling party is the most able
to implement price controls, compared to only 24% who believe that the
opposition is best able to deal with this matter. On job creation, a majority
(51%) believes that the ruling party remains most able to deliver, in contrast
to 30% who think that the opposition parties would be better able to facilitate
job creation. On improving basic health services, 57% of adult citizens place
faith in the ruling party to deal with this issue, compared to a mere quarter
of respondents (25%) who believe that opposition political parties can successfully
deal with this task. A similar observation is made with respect to fighting
corruption. Half of the respondents (50%) maintain the view that ZANU-PF is
best able to combat corruption, while 25% were of the opinion that opposition
political parties could do a better job of this.
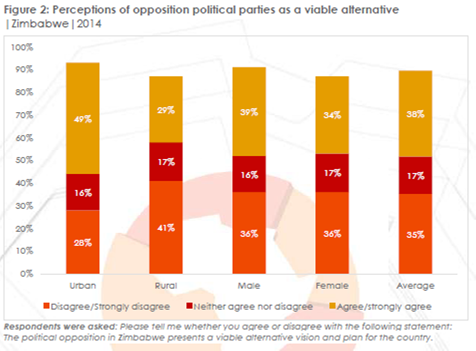
Close to two-fifths (36%) of the Zimbabwe’s voting population believe that
opposition political parties present a viable alternative vision and plan for
the country, while a similar proportion does not (see figure 2).
Concerning the transfer of political power and elections, almost 7 in 10
Zimbabweans (68%) believe that once an election is over, opposition parties and
politicians should accept defeat and cooperate with government to help it
develop the country. This is in contrast with 26% who think that after losing
an election, the role of opposition parties should be to monitor and be
critical of the government in order to hold it accountable.
Afrobarometer
Afrobarometer
is an African-led, non-partisan research network that conducts public attitude surveys
on democracy, governance, economic conditions, and related issues across more than
30 countries in Africa. Five rounds of surveys were conducted between 1999 and
2013, and Round 6 surveys are currently under way (2014-2015). Afrobarometer
conducts face-to face interviews in the language of the respondent’s choice
with nationally representative samples of between 1,200 and 2,400 respondents.
The
Afrobarometer team in Zimbabwe, led by Mass Public Opinion institute,
interviewed 2,400 adult Zimbabweans in November 2014. A sample of this size
yields results with a margin of error of +/-2% at a 95% confidence level.
Previous surveys have been conducted in Zimbabwe in 1999, 2004, 2005, 2009,
2010 and 2012.
Source: http://afrobarometer.org/sites/default/files/press-release/zimbabwe/zim_r6_pr_opposition_parties.pdf
EAST
EUROPE
Ukrainians Deeply Concerned Over
Corruption; Remain Committed to Europe and Democracy
First-Ever IRI Ukraine National Municipal
Poll:
MAY 19, 2015
Kyiv, Ukraine – A new
IRI municipal poll conducted in
Ukraine found an overwhelming majority of citizens reporting that corruption
and nepotism were serious problems impacting their daily lives.
Importantly, despite their concerns over corruption and the economy, Ukrainians
also showed their strong support for the country’s decision to align more
closely with Europe and the West.
Poll Offers Unprecedented Window on Local Governance and
Citizen Attitudes
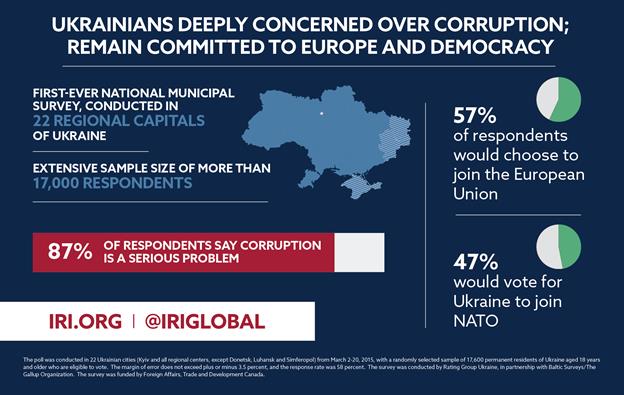
IRI’s poll, the first-ever national municipal survey, was conducted in all 22
regional capitals of Ukraine not under the control of Russian or Russian-backed
forces. It utilized an extensive sample size of more than 17,000
respondents—800 in each city surveyed—and was designed to ascertain views of
local government, municipal services and a wide range of local issues.
“Ukraine is at crossroads in its democratic development,”
said Stephen B. Nix, IRI’s regional director for Eurasia. “This new
survey lays out the challenges facing communities across the country, and
provides tools for citizens and leaders to chart a new course.”
Ukrainians Strongly Concerned About Corruption and
Nepotism
Nationwide, 87 percent of Ukrainians surveyed said that corruption was a
significant or somewhat significant problem for their city. Eighty-three
percent pointed to nepotism as a significant or somewhat significant problem.
Despite these obviously troubling numbers, IRI said it
also sees signs of hope for a democratic renewal. “The Ukrainian
government and donor community should be encouraged that Ukrainians are willing
to acknowledge that corruption is a big problem, and yet they also feel pride
in their communities and are quick to point to reforms and programs that are
working,” said Nix.
Several cities have already made great strides in
improving the transparency and quality of local services. In Ternopil and
Khmelnytsky, for example, more than half of the residents felt that they have
good access to their local authorities. Residents of Kharkiv and
Vinnitsya were also pleased with their cities’ local transportation and
infrastructure. In Chernivtsi, nearly half of all residents surveyed felt
that they had both an accessible local city budget and satisfactory information
on proposed or current legislation from their city council.
“Clearly, there is a long way to go for Ukrainians to
believe that their leaders have fulfilled the promise of the EuroMaidan
movement,” said Nix. “But as we have discussed survey results with
community leaders, we have heard a renewed commitment to tackling corruption
and increasing citizen involvement. At IRI, we stand ready to work with
these and future leaders to build stronger services with increased transparency
and accountability.”
Ukrainians Committed to Move their Country towards the
West
The IRI survey also showed strong support for European integration and a clear
preference for the European Union (EU) over the Russian-led Customs Union in
each city polled. Although support for the EU was highest in western and
central Ukrainian cities, a plurality of respondents in all regions—including
the east and south—support EU membership over Customs Union membership.
The survey also showed strong support for membership in NATO across the
country.
Nix said that these strong numbers, in the face of both
military aggression in eastern Ukraine and a challenging economic situation,
show that citizens are resolved to see that greater democracy and market-based
economic policy come to Ukraine.
Ukrainians Need to Increase Citizen Participation in
Governance
A majority of respondents in all but one city surveyed believed that citizen
participation in community events, such as public hearings and parent meetings
at schools, was important. However, IRI’s data also demonstrated that
current participation in such events was low, with respondents saying that they
have participated in single digits in all 22 cities.
“It’s important that leaders from all parts of Ukrainian
life, from government to civil society, encourage citizens to take charge of
their own future,” said Nix. “Citizens need to embrace their civic
responsibilities if they want to see change. Waiting for government to
address every problem isn’t the right answer.”
Nix said that civic education would be a key part of
IRI’s work in coming months.
Methodology
The poll was conducted in 22 Ukrainian cities (Kyiv and all regional centers,
except Donetsk, Luhansk and Simferopol) from March 2-20, 2015, with a randomly
selected sample of 17,600 permanent residents of Ukraine aged 18 years and
older who are eligible to vote. The margin of error does not exceed plus
or minus 3.5 percent, and the response rate was 58 percent.
The survey was conducted by Rating Group Ukraine, in partnership with Baltic Surveys/The Gallup Organization. The survey was funded by Foreign Affairs, Trade and Development
Canada.
WEST EUROPE
UK: Continued public support for RAF
air strikes, but many worry ISIS is winning
May 23, 2015
Six in ten
approve of the anti-ISIS air campaign, but hardly anyone thinks the terror
group is losing its grip and most would back increased commitment
Days after
an ISIS leader was killed in a risky US special forces raid, the terror group
secured a serious of important strategic and symbolic victories in Iraq and
Syria. The fall of Iraq’s Ramadi and Syria’s Palmyra has stoked concerns about US anti-ISIS strategy, which
relies on local ground forces backed by air strikes from the US-led coalition.
Britain is among the coalition partners, and a recent report revealed that the RAF
had dropped over 200 bombs and missiles on ISIS targets in Iraq, though this
makes up only a “fraction” of the number of US airstrikes.
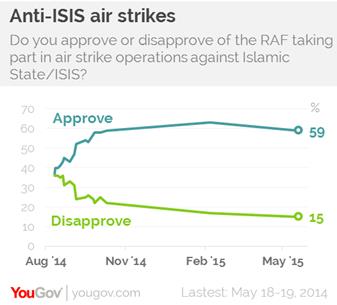 YouGov has tracked public opinion on UK involvement in
the air campaign against ISIS since last summer. In the latest survey, 59%
approve of the RAF participation in the air strikes and only 15% disapprove,
marking little change from October. 26% are undecided. At 15%, disapproval is
at an all-time low.
YouGov has tracked public opinion on UK involvement in
the air campaign against ISIS since last summer. In the latest survey, 59%
approve of the RAF participation in the air strikes and only 15% disapprove,
marking little change from October. 26% are undecided. At 15%, disapproval is
at an all-time low.
The RAF jets
carried out their first combat missions in Iraq in late September 2014. Support
for air strikes increased dramatically after the beheading of several Western
journalists and aid workers by ISIS, including Briton David Haines.
The
majority, 55%, would also favor an increased commitment by Britain, similar to
findings in a February YouGov poll. Only 19% would be opposed.
WINNING OR LOSING?
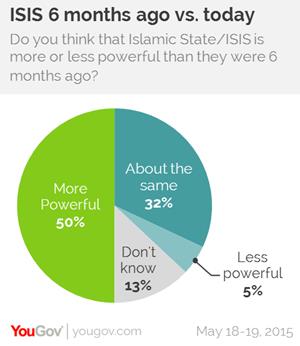 The wide support for greater involvement may be rooted in
anxieties about the current campaign: half the public (50%) believe ISIS is
more powerful than they were 6 months ago. Only 5% think the terror group’s
capabilities have been degraded, while a third (32%) think little has changed.
The survey was conducted after the fall of Ramadi, but before it was reported
that ISIS had gained control of Palmyra and a key Syria-Iraq border crossing.
The wide support for greater involvement may be rooted in
anxieties about the current campaign: half the public (50%) believe ISIS is
more powerful than they were 6 months ago. Only 5% think the terror group’s
capabilities have been degraded, while a third (32%) think little has changed.
The survey was conducted after the fall of Ramadi, but before it was reported
that ISIS had gained control of Palmyra and a key Syria-Iraq border crossing.
Those who
want increased UK commitment to defeating the terror group, which now controls
vast swathes of Iraq and Syria, might also be unsure about the state of
Britain’scurrent involvement.
YouGov’s
latest survey also asked respondents whether, to their knowledge, the RAF is
currently taking part in air strike operations against Iraq. More say yes (33%)
than no (18%), but by far the largest group – 49% – are unsure.
UK: Public opposition to fracking grows
May 19, 2015
In 2013, more favoured than opposed fracking in Britain.
Since then, public sentiment has reversed
With David
Cameron’s new all-Conservative cabinet now in place and Parliament back in
session, much of Westminster’s attention will once again turn back to governing.
One major issue facing the next Parliament is Britain’s future with fracking,
the controversial drilling technique credited with the recent boom in US shale
oil and gas drilling. The Conservative party has shown support for the use of fracking, but it faces
opposition from local communities and environmental groups.
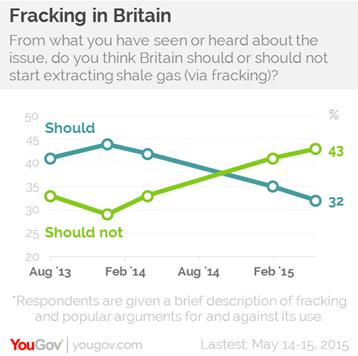 YouGov’s latest research shows that fracking proponents
may be facing an increasingly sceptical public. A new survey conducted for the Sunday Times shows that, provided with a
description of how the process works as well as some of its potential benefits
and risks, opinions now lean against the use of fracking in Britain. 43% say shale
gas extraction should not happen in the country while a third think it should.
YouGov’s latest research shows that fracking proponents
may be facing an increasingly sceptical public. A new survey conducted for the Sunday Times shows that, provided with a
description of how the process works as well as some of its potential benefits
and risks, opinions now lean against the use of fracking in Britain. 43% say shale
gas extraction should not happen in the country while a third think it should.
This
suggests an insignificant shift against fracking since January but a much
larger change from surveys in previous years, when as many as 44% of British
people supported the use of fracking and only 29% were opposed. Since 2013, the
issue has risen in profile and some MPs have called for a fracking ban.
The latest
survey also asked respondents how they would feel about fracking in their own
area, which has been met with particular opposition in the past. This continues to be the
case, with 49% opposed to fracking in “a town or village near you” and 27% in
support. Respondents remain on balance opposed, 44% to 32%, even if £1,000,000
is paid to the local council, and are even slightly opposed, 40% to 36%, when
the sum rises to £10,000,000.
REALLY GREEN?
The new Secretary
of State for Energy and Climate Change, Amber Rudd, has been described as “really green and no-nonsense”. The new poll suggests the public
also remain broadly sympathetic to some “green” concerns, especially relating
to climate change.
Only 12% are
“most supportive” of using fossil fuels to meet Britain’s future energy
generation needs, while 46% prefer renewable energy sources – though 24% back
nuclear power, which has been opposed by some environmentalists.
 58% say the government should encourage the building of
onshore wind farms, but only 37% want the government backing onshore wind. Rudd
has indicated the Conservative party will withdraw government subsidies for onshore wind farms.
58% say the government should encourage the building of
onshore wind farms, but only 37% want the government backing onshore wind. Rudd
has indicated the Conservative party will withdraw government subsidies for onshore wind farms.
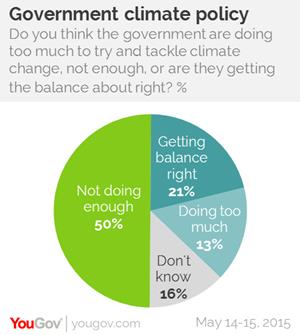
59% believe
in man-made climate change, consistent with past surveys and even a modest
increase from 2013, when around half believed. Half the public (50%) and the
majority of adults under-40 also believe the government should do more to try
and tackle climate change, against a third who say it’s already doing enough
(21%) or too much (13%).
NORTH
AMERICA
Obama Favorable Rating Up, Best Since
September 2013
May 21, 2015
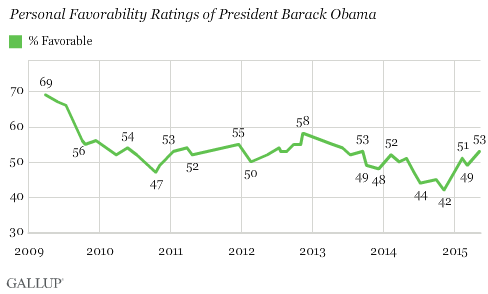
WASHINGTON, D.C. -- Americans' favorable ratings of President Barack
Obama now stand at 53%, up four points from March. This comes after a year in
which these ratings were mostly below 50% and marks the president's highest
score since September 2013.
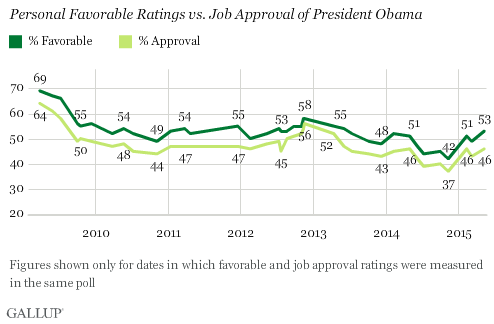
A president's favorable ratings are distinct from approval of his performance; job approval ratings generally tend
to be lower. For the Obama presidency, Gallup trends show the two measures have
changed largely in tandem. As Obama's approval rating has rebounded nine
percentage points from a low of 37% last fall, his favorable rating has
increased 11 points from 42%. The resulting seven-point gap between Obama's
current 46% approval rating and his 53% favorable rating is slightly larger
than the average five-point gap between these ratings for Obama since he took
office.
The gap between job approval and favorable ratings over the course of
Obama's presidency has been as wide as eight points, and as narrow as two
points. The latter took place just after Obama was re-elected, in November
2012, when his favorable rating was 58% and his job approval was 56%.
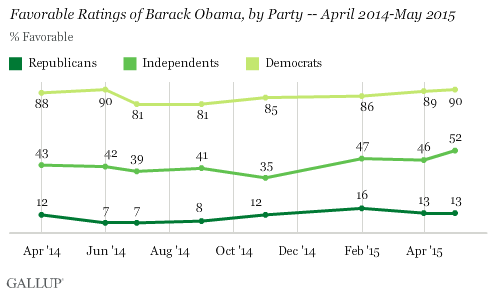
Independents' Favorable Ratings of Obama Surge Since Last
Fall
Obama's favorable rating in the May 6-10 poll reflects increases
compared with November 2014 among Democrats (90%) and independents (52%).
Republicans, on the other hand, continue to be chilly toward the president;
their favorable ratings of Obama have been largely flat at low levels since
last fall.
Bottom Line
Americans in general are more inclined to give Obama a
favorable personal rating than they are to approve of the job he is doing. Obama's favorable and job approval
ratings have each improved this year, and his current 53% favorable rating is
the highest since late 2013.
The recent increase in how Americans view Obama, and likely also his
performance, might have something to do with his attempts to bridge various
communities in recent months -- such as police and racial minorities; Cuba and
the U.S.; and members of Congress from both parties who are pro- and
anti-trade.
As he serves out his seventh year in office, Obama's favorability is
higher than it was in his sixth year, when he received a record-low rating
after the 2014 midterm elections. Excluding his first year, when his favorable
ratings averaged 62%, his favorables have been fairly steady -- as have his job
approval ratings.
Depending on how the final 20 months of his presidency go, Obama's
relatively buoyant favorability might stand in stark contrast to that of his
two predecessors -- President Bill Clinton, whose yearly averages peaked in his
fifth year and dipped thereafter; and President George W. Bush, whose favorable
ratings spiked early on in his presidency and descended rapidly in his second
term.
Survey Methods
Results for this Gallup poll are based on telephone interviews conducted
May 6-10, 2015, on the Gallup U.S. Daily survey, with a random sample of 1,024
adults, aged 18 and older, living in all 50 U.S. states and the District of
Columbia. For results based on the total sample of national adults, the margin
of sampling error is ±4 percentage points at the 95% confidence level. All
reported margins of sampling error include computed design effects for
weighting.
Each sample of national adults includes a minimum quota of 50% cellphone
respondents and 50% landline respondents, with additional minimum quotas by
time zone within region. Landline and cellular telephone numbers are selected
using random-digit-dial methods.
On Social Ideology, the Left Catches Up
to the Right
May 22, 2015
PRINCETON, N.J. -- Thirty-one percent of Americans describe their views
on social issues as generally liberal, matching the percentage who identify as social
conservatives for the first time in Gallup records dating back to 1999.
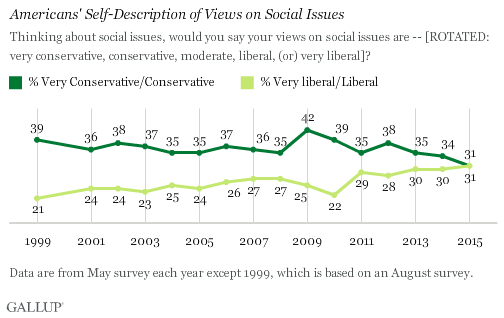
Gallup first asked Americans to describe their views on social issues in
1999, and has repeated the question at least annually since 2001. The broad
trend has been toward a shrinking conservative advantage, although that was
temporarily interrupted during the first two years of Barack Obama's
presidency. Since then, the conservative advantage continued to diminish until
it was wiped out this year.
The newfound parity on social ideology is a result of changes in the way
both Democrats and Republicans describe their social views. The May 6-10 Gallup
poll finds a new high of 53% of Democrats, including Democratic-leaning
independents, describing their views on social issues as liberal.
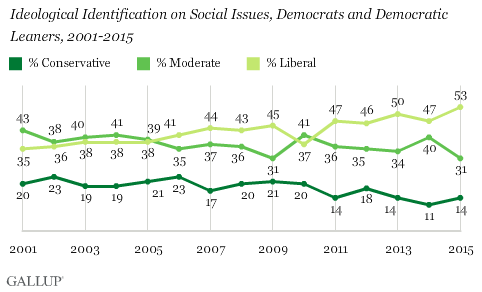
Democrats were more likely to describe their views on social issues as
moderate rather than liberal from 2001 to 2005. Since then, socially liberal
Democrats have outnumbered socially moderate Democrats in all but one year.
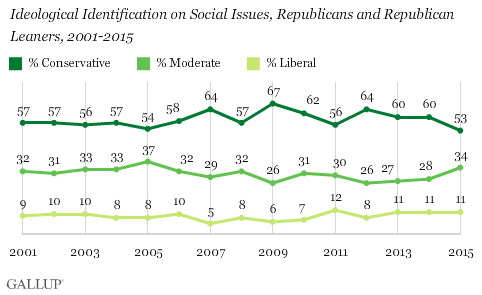
Meanwhile, the 53% of Republicans and Republican leaners saying their
views on social issues are conservative is the lowest in Gallup's trend. The
drop in Republicans' self-identified social conservatism has been accompanied
by an increase in moderate identification, to 34%, while the percentage
identifying as socially liberal has been static near 10%.
These trends echo the pattern in Gallup's overall ideology measure,
which dates back to 1992 and shows increasing liberal identification in recent years. As with the social
ideology measure, the longer-term shifts are mainly a result of increasing
numbers of Democrats describing their views as liberal rather than moderate.
That may reflect Democrats feeling more comfortable in describing themselves as
liberal than they were in the past, as much as a more leftward shift in
Democrats' attitudes on political, economic and social issues.
Conservatives Still Lead Liberals on Economic Issues
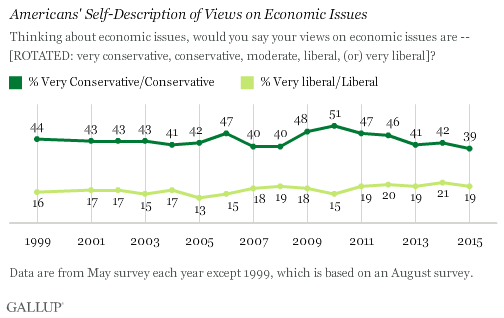
In contrast to the way Americans describe their views on social issues,
they still by a wide margin, 39% to 19%, describe their views on economic
issues as conservative rather than liberal. However, as on social ideology, the
gap between conservatives and liberals has been shrinking and is lower today
than at any point since 1999, with the 39% saying they are economically
conservative the lowest to date.
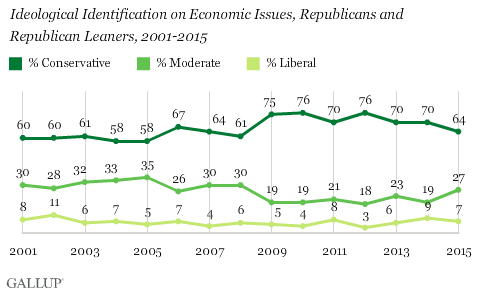
Currently, 64% of Republicans identify as conservative economically,
which is down from 70% the previous two years and roughly 75% in the early
years of the Obama presidency. During George W. Bush's administration,
Republicans were less likely to say they were economic conservatives, with as
few as 58% doing so in 2004 and 2005. The trends suggest Republicans' willingness
to identify as economic conservatives, or economic moderates, is influenced by
the party of the president in office, and perhaps the types of financial
policies the presidential administration is pursuing at the time.
Democrats are also contributing to the trend in lower economic
conservative identification. While the plurality of Democrats have consistently
said they are economically moderate, Democrats have been more likely to
identify as economic liberals than as economic conservatives since 2007. The
last two years, there has been a 15-percentage-point gap in liberal versus
conservative identification among Democrats on economic matters.

Implications
Americans' growing social liberalism is evident not only in how they
describe their views on social issues but also in changes in specific
attitudes, such as increased support for same-sex marriage and legalizing marijuana. These longer-term trends may be
attributable to changing attitudes among Americans of all ages, but they also
may be a result of population changes, with younger, more liberal Americans
entering adulthood while older, more conservative adults pass on. Gallup found
evidence that population replacement is a factor in explaining changes in overall ideology using an analysis of birth cohorts
over time.
The 2016 presidential election will thus be contested in a more socially
liberal electorate -- and a less economically conservative one -- than was true
of prior elections. Economically and socially conservative candidates may still
appeal to the Republican Party base in the primaries, but it may be more
important now than in the past for the GOP nominee to be a bit less
conservative on social issues in order to appeal to the broader general electorate.
And while Americans are less economically conservative than in the past,
economic conservatives still outnumber economic liberals by about 2-to-1. As a
result, Democrats must be careful not to nominate a candidate who is viewed as
too liberal on economic matters if their party hopes to hold the White House
beyond 2016.
Survey Methods
Results for this Gallup poll are based on telephone interviews conducted
May 6-10, 2015, with a random sample of 1,024 adults, aged 18 and older, living
in all 50 U.S. states and the District of Columbia. For results based on the
total sample of national adults, the margin of sampling error is ±4 percentage
points at the 95% confidence level. All reported margins of sampling error
include computed design effects for weighting.
Each sample of national adults includes a minimum quota of 50% cellphone
respondents and 50% landline respondents, with additional minimum quotas by
time zone within region. Landline and cellular telephone numbers are selected
using random-digit-dial methods.
Negative Views of New Congress Cross
Party Lines
Republicans Want GOP Leaders to
Challenge Obama More Often
May 21, 2015
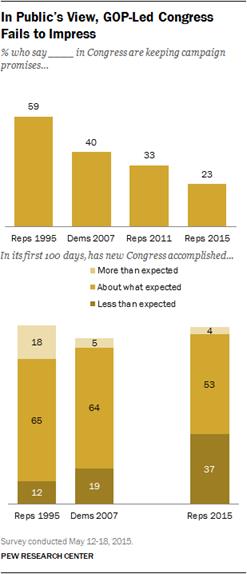
The new Republican-led Congress is drawing harsh reviews
from the public – including most Republicans. Just 23% of Americans say
congressional Republicans are keeping the promises they made during last fall’s
campaign, while 65% say they are not.
Nearly four-in-ten (37%) say the new Congress has
accomplished less than they expected, while 4% say it has accomplished more
than expected. About half (53%) say its accomplishments are in line with what
they expected.
On both measures, the public’s views are far more
negative than they were of the Democratic-led Congress in March 2007, after the Democrats regained control
of both chambers following several years of Republican control. Views are also
much more negative than they were in April 1995, shortly after the GOP had gained
control of the House and Senate for the first time in four decades.
The new national survey by the Pew Research Center,
conducted May 12-18 among 2,002 adults, finds that just 22% approve of the job
performance of Republican congressional leaders, little changed since the
summer of 2011. Ratings for Democratic congressional leaders are somewhat
better (33% approve).
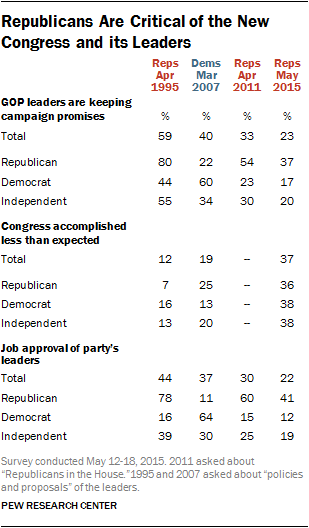 Unlike after some previous partisan turnovers on
Capitol Hill, negative assessments of the new Congress now cross party lines.
Today, just 41% of Republicans approve of the job their party’s leaders in
Congress are doing. By comparison, in April 2011, 60% of Republicans approved
of GOP leaders’ job performance and in April 1995, 78% approved of GOP
leadership’s policies and proposals.
Unlike after some previous partisan turnovers on
Capitol Hill, negative assessments of the new Congress now cross party lines.
Today, just 41% of Republicans approve of the job their party’s leaders in
Congress are doing. By comparison, in April 2011, 60% of Republicans approved
of GOP leaders’ job performance and in April 1995, 78% approved of GOP
leadership’s policies and proposals.
And just 37% of Republicans say their party’s leaders are
keeping their campaign promises, while 53% say they are not. In 2011, after the
party won its House majority, 54% said GOP leaders were keeping promises. And
in April 1995 — as the Republican-led Congress hit the 100-day milestone —
fully 80% of Republicans said this.
Democrats were also relatively upbeat about their party’s
leaders at the 100-day mark in 2007, when 60% said Democratic leaders were
keeping their campaign promises.
Currently, Republicans (36%) are about as likely as
Democrats (38%) or independents (38%) to say Congress is accomplishing less
than they expected.
 To be sure, public views of Congress overall have
been negative for several years, since well before Republicans won control
of the Senate last fall or gained control of the House in January 2011. In March, 22% expressed a favorable opinion of
Congress; in March 2010, when Democrats still controlled Congress, just 26% had
a favorable view.
To be sure, public views of Congress overall have
been negative for several years, since well before Republicans won control
of the Senate last fall or gained control of the House in January 2011. In March, 22% expressed a favorable opinion of
Congress; in March 2010, when Democrats still controlled Congress, just 26% had
a favorable view.
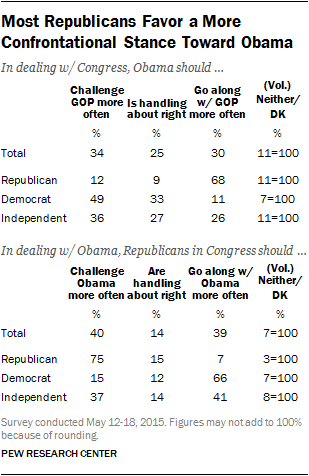
The survey finds deep differences in how Republicans and
Democrats want President Obama and GOP leaders to deal with issues. Fully 75%
of Republicans want GOP leaders to challenge Obama more often; just 15% say
they are handling relations with the president about right and 7% say GOP
leaders should go along with Obama more often.
Fewer Democrats (49%) want Obama to challenge Republicans
more often; 33% say he is handling this about right while 11% want him to go
along with GOP leaders more often.
The survey also finds:
Democrats more positive about party’s
handling of issues. About six-in-ten Democrats and
Democratic leaners (62%) say the Democratic Party is doing a good job
representing their views on same-sex marriage, 51% say the same about the
party’s stance on immigration and 47% think the party does well in representing
their views on government spending.
Republicans and Republican leaners are more critical of
their party on all three issues: 35% say it does well in representing their
views on government spending, 34% on illegal immigration and 29% on same-sex
marriage.
Obama job approval little changed. Currently, 46% approve of Obama’s job
performance, while 48% disapprove. Obama’s job approval is little changed over
the course of 2015: In January, 47% approved and 48% disapproved.
More say jobs are available locally. About three-in-ten Americans (27%)
rate national economic conditions as excellent or good, while 73% say they are
only fair (43%) or poor (30%). Economic attitudes also are little changed since
the start of the year, but positive views have increased 10 points since April
2014. Over the same period, the percentage saying plenty of jobs are available
locally has risen 13 points (from 27% to 40%).
Views of
Congressional Leaders
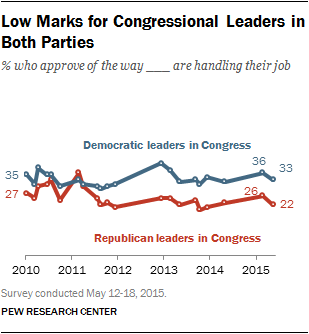 Public evaluations of the
congressional leadership of both parties remain negative. Today, just a third
(33%) say they approve of the job Democratic leaders are doing, while even
fewer (22%) say they approve of GOP Congressional leadership.
Public evaluations of the
congressional leadership of both parties remain negative. Today, just a third
(33%) say they approve of the job Democratic leaders are doing, while even
fewer (22%) say they approve of GOP Congressional leadership.
Ratings for the Congressional leadership of both parties
have been relatively stable over the past few years. Though the job approval
ratings of both GOP and Democratic leadership rose slightly earlier this year,
current ratings are now on par with attitudes last spring.
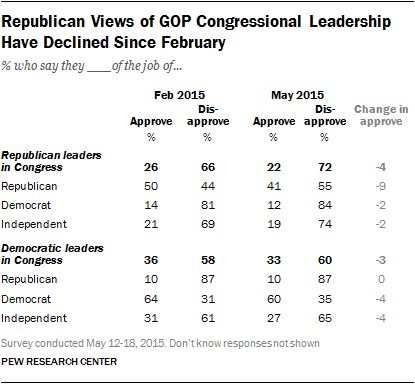 While the overall ratings of Republican
congressional leaders over the last few months have dropped a modest four
points, Republican ratings of their own party’s leadership have moved in a
significantly negative direction over the first few months of a GOP-controlled
Congress.
While the overall ratings of Republican
congressional leaders over the last few months have dropped a modest four
points, Republican ratings of their own party’s leadership have moved in a
significantly negative direction over the first few months of a GOP-controlled
Congress.
Today, more Republicans say they disapprove (55%) than
approve (41%) of the Republican congressional leadership’s job performance. In
February, Republican evaluations were more positive (50% of Republicans
approved of the GOP leadership’s job performance, 44% disapproved). And this
shift in opinion is primarily seen among conservative Republicans: 54% approved
of GOP congressional leaders’ job performance in February, today just 41%
approve. By contrast, Democratic views of their party’s congressional
leadership are substantially more positive and are little changed over this
time. Currently 60% of Democrats approve of the job performance of Democratic
leaders, while 35% disapprove.
Independent views of the two parties largely track those
of the overall public: Just 19% approve of GOP leaders’ job performance, while
27% approve of Democratic congressional leadership.
Partisans Rate
Their Parties on Current Issues
On a set of three current issues – government spending,
illegal immigration and same-sex marriage – rank-and-file Republicans are much
more critical of how their party has dealt with each than Democrats are of
their own party’s performance.
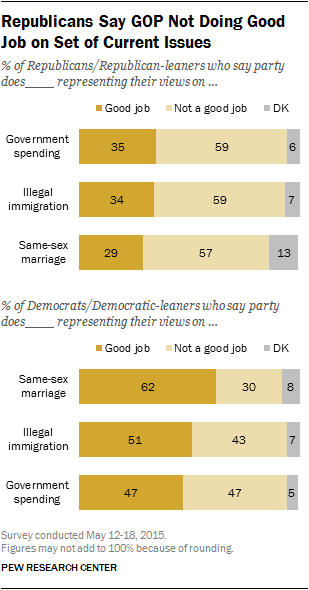 Fewer than four-in-ten Republicans and Republican
leaners say the Republican Party is doing a good job representing their views
on the issues of government spending (35%), illegal immigration (34%) and
same-sex marriage (29%). On all three issues, majorities of Republicans say
their party is not doing a good job representing their views. And there is
little difference in these ratings between conservative Republicans and
moderate and liberal Republicans.
Fewer than four-in-ten Republicans and Republican
leaners say the Republican Party is doing a good job representing their views
on the issues of government spending (35%), illegal immigration (34%) and
same-sex marriage (29%). On all three issues, majorities of Republicans say
their party is not doing a good job representing their views. And there is
little difference in these ratings between conservative Republicans and
moderate and liberal Republicans.
Republican ratings of their party on these issues are no
better than they were in a September 2014 survey, prior to the GOP winning
control of the Senate in the November midterm elections.
By contrast, Democrats are more positive about their own
party’s performance on these three issues than are Republicans. About
six-in-ten Democrats and Democratic leaners (62%) say the Democratic Party is
doing a good job representing their views on same-sex marriage, while just 30%
say they are not doing a good job. Views are more mixed when it comes to
illegal immigration and government spending. Overall, 51% of Democrats say
their party is doing a good job on the issue of illegal immigration, compared
with 43% who say they are not doing a good job. On the issue of government
spending, as many Democrats say their party is doing a good job representing
their views on the issue (47%) as say it is not doing a good job (47%).
Democratic views have shown little change on these measures since the questions
were last asked in September 2014.
Little Change in
Overall Views of Obama
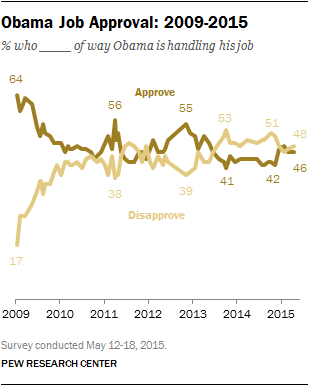 Barack Obama’s overall approval
ratings have been stable over the course of 2015. Currently about as many say
they approve of the way Barack Obama is handling his job as president as say
they disapprove of his job performance (46% vs. 48%).
Barack Obama’s overall approval
ratings have been stable over the course of 2015. Currently about as many say
they approve of the way Barack Obama is handling his job as president as say
they disapprove of his job performance (46% vs. 48%).
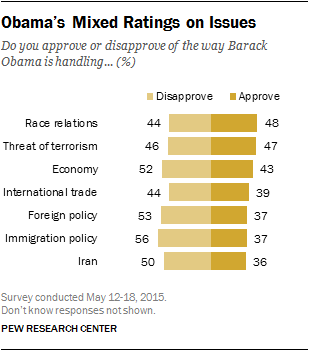 Similar to his overall approval
ratings, the public is about evenly divided in its ratings of how Obama is
handling race relations (48% approve, 44% disapprove) and the threat of
terrorism (47% approve, 46% disapprove).
Similar to his overall approval
ratings, the public is about evenly divided in its ratings of how Obama is
handling race relations (48% approve, 44% disapprove) and the threat of
terrorism (47% approve, 46% disapprove).
But on several other key policy areas, there is more
disapproval than approval of Obama’s performance. Ratings of Obama’s
performance on the economy remain relatively unchanged over the past year: 52%
disapprove, while 43% approve.
And a majority of Americans continue to disapprove (56%)
of how the president is handling immigration policy.
Obama’s ratings on foreign policy and his handling of
Iran are similarly in negative territory. And amid debate over the
Trans-Pacific Partnership trade proposal, 39% of respondents say they approve
of Obama’s handling of international trade, while 44% say they disapprove; 17%
do not offer a rating of his performance on trade.
Obama’s Ratings on
Race Relations Improve
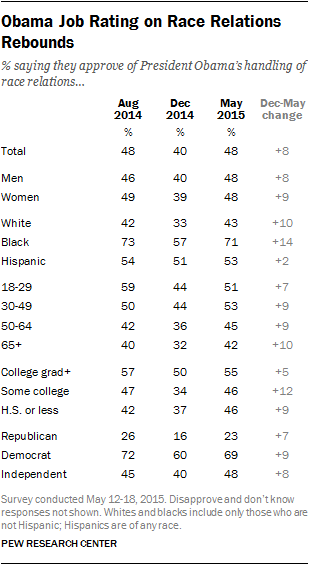 Obama’s handling of race relations is
currently one of his better ratings: 48% approve, while 44% disapprove. This is
up eight points from December, in a poll conducted in the immediate wake of grand jury
decisions not to charge police officers in the deaths of African Americans in
Ferguson, Missouri and New York City and the associated protests. Public
reactions to how the president is handling race relations are now equal to
where they were in August (48% approved).
Obama’s handling of race relations is
currently one of his better ratings: 48% approve, while 44% disapprove. This is
up eight points from December, in a poll conducted in the immediate wake of grand jury
decisions not to charge police officers in the deaths of African Americans in
Ferguson, Missouri and New York City and the associated protests. Public
reactions to how the president is handling race relations are now equal to
where they were in August (48% approved).
Obama’s improved rating is seen across most political and
demographic groups. About seven-in-ten blacks (71%) now approve of his efforts
on race relations, though he ended the year with 57% of blacks giving him a
positive rating and 33% a negative one. His marks among blacks are now on par with
those of August.
The views of whites are more mixed, with 43% today
approving of Obama’s handling of race relations and half (50%) disapproving.
This is an improvement from December when most gave him a negative rating (33%
approved, 57% disapproved).
On balance, Hispanics remain positive toward Obama on
this issue: 53% now approve of his handling of race relations and 37%
disapprove. Hispanic ratings of Obama on this issue have remained relatively
stable since last August.
Democrats continue to rate Obama highly for his handling
of race relations. About seven-in-ten Democrats (69%) – including 80% of
liberal Democrats – approve of how he is handling the issue. As with many
policy areas, far more Republicans disapprove (71%) than approve (23%) of how
Obama handles race relations. The attitudes of independents mirror those of the
public overall.
Views of Job
Availability, National Economy
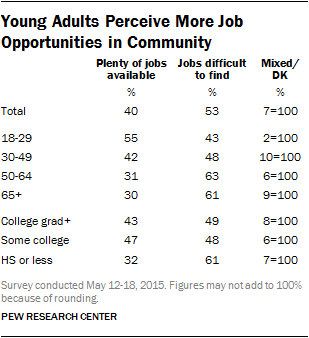 Four-in-ten (40%) currently say there are “plenty
of jobs available” in their community, though 53% still see local jobs as
difficult to find. The current assessments of job availability continue an
upward trend over the last five years and are among the most positive since
2001. In March 2010 — when the unemployment rate was almost 10% — 85% said jobs were difficult to find
and just 10% said plenty of jobs were available.
Four-in-ten (40%) currently say there are “plenty
of jobs available” in their community, though 53% still see local jobs as
difficult to find. The current assessments of job availability continue an
upward trend over the last five years and are among the most positive since
2001. In March 2010 — when the unemployment rate was almost 10% — 85% said jobs were difficult to find
and just 10% said plenty of jobs were available.
Younger adults and those with some college experience are
most likely to be optimistic about job opportunities: 55% of adults 18-29 and
42% of those 30-49 say there are plenty of jobs available, but just 31% of
adults 50 and older say the same. Among those with a college degree, 43% say
there are plenty of jobs available locally, as do 47% of those with some
college experience but who do not have a Bachelor’s degree; by comparison, just
32% of those with a high school degree or less education say there are plenty
of jobs available in their community.
Since April of 2014 there has been a 13-percentage point
rise in the share of the public saying there are plenty of jobs available in
the local communities.
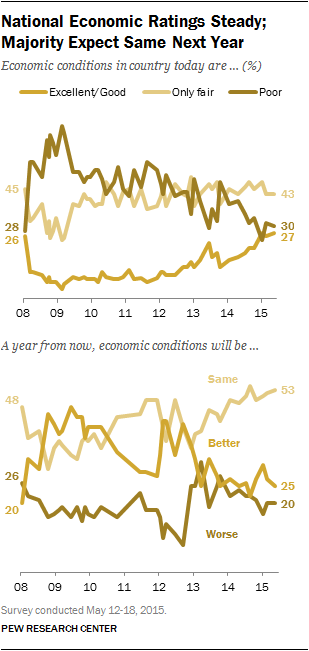 Ratings of the nation’s overall economic conditions
have changed little since the start of 2015 after increasing over the past few
years.
Ratings of the nation’s overall economic conditions
have changed little since the start of 2015 after increasing over the past few
years.
About one-in-four say the U.S. economy is “excellent”
(3%) or “good” (24%). A plurality (43%) continues to rate the economy as “only
fair,” while three-in-ten (30%) say it is poor.
Democrats are about twice as likely as Republicans to
rate the economy positively. Among Democrats, 36% see conditions as excellent
or good and 64% say they are fair or poor; 16% of Republicans say the economy
is at least good and 83% say it is fair or poor. And college graduates and
higher-income adults are somewhat more positive.
Meanwhile, 53% expect the country’s economic conditions
to be the same next year. Somewhat more say the economy will be better (25%)
than worse (20%) a year from now. By comparison, many more were optimistic
about the future of the economy in the depths of the Great Recession in 2008
and 2009.
 Today, people who are positive about the economy
are the most likely to predict that it will improve. Among those who say the
economy is currently excellent or good, 43% say it will be better in a year and
4% say it will be worse (51% predict the same). By comparison, just 12% of
those rating the economy as poor expect improvement and 41% think it will
decline over the next year (45% say it will be the same).
Today, people who are positive about the economy
are the most likely to predict that it will improve. Among those who say the
economy is currently excellent or good, 43% say it will be better in a year and
4% say it will be worse (51% predict the same). By comparison, just 12% of
those rating the economy as poor expect improvement and 41% think it will
decline over the next year (45% say it will be the same).
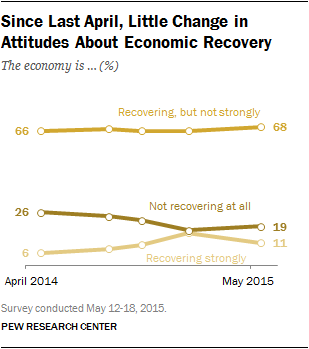
As has been the case for the last year, about two-thirds
of the public (68%) say that the economy is recovering, but not strongly.
Today, about one-in-ten (11%) see a strong economic recovery; roughly
two-in-ten (19%) say the economy isn’t recovering at all.
 The share saying there is a strong
recovery is somewhat lower than it was in January (16% then, 11% today), but
remains higher than in April 2014 (when just 6% said the economy was recovering
strongly).
The share saying there is a strong
recovery is somewhat lower than it was in January (16% then, 11% today), but
remains higher than in April 2014 (when just 6% said the economy was recovering
strongly).
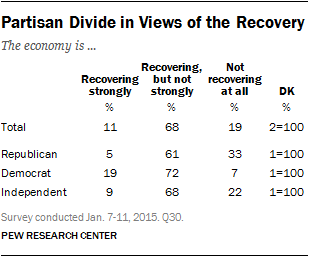
Large majorities across partisan lines say there has been
a less-than-strong recovery, but those in the GOP are more likely than
Democrats to view the situation negatively. One-in-three Republicans (33%) say
the economy isn’t recovering at all, compared with 7% of Democrats. On the
other hand, more Democrats than Republicans think there is a strong recovery
(19% vs. 5%).
Republicans’ Early Views of GOP Field
More Positive Than in 2012, 2008 Campaigns
May 19, 2015
Growing Interest in 2016 Campaign
From the start, the Republican presidential field for
2016 has been much more crowded than the Democratic field. But voters in each
party have similar views of the quality of their party’s candidates.
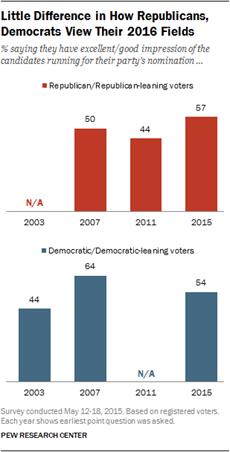 Nearly six-in-ten (57%) Republican and
Republican-leaning registered voters say they have an excellent or good
impression of their party’s presidential candidates. That compares with 54% of
Democratic and Democratic-leaning voters who have positive impressions of the
Democratic Party’s candidates.
Nearly six-in-ten (57%) Republican and
Republican-leaning registered voters say they have an excellent or good
impression of their party’s presidential candidates. That compares with 54% of
Democratic and Democratic-leaning voters who have positive impressions of the
Democratic Party’s candidates.
Republicans are more positive about the GOP field than
they were at nearly comparable points in the past two presidential campaigns.
In May 2011, 44% of Republicans viewed the field of GOP candidates as excellent
or good. In September 2007, 50% gave the presidential candidates positive
marks.
Democrats are less positive about the current group of
candidates than they were in September 2007, at a somewhat later point in the
2008 campaign. At that time, 64% said the Democratic candidates as a group were
excellent or good. Throughout the fall of 2007 and early 2008, Democrats
consistently expressed more positive views about their party’s candidates than
Republicans did about theirs.
In September 2003, just 44% of Democrats and Democratic
leaners gave positive ratings to their party’s field of candidates. At that
time, the Democrats were challenging an incumbent president, as were the
Republicans in 2011.
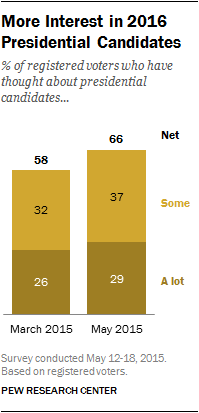 The latest national survey by the Pew
Research Center, conducted May 12-18 among 2,002 adults (including 1,497
registered voters), finds increasing interest in the presidential campaign. The
share of registered voters who say they are giving at least some thought to the
presidential candidates has risen eight points since March, from 58% to 66%.
However, just 29% of registered voters say they are giving “a lot” of thought
to candidates who may be running for president in 2016.
The latest national survey by the Pew
Research Center, conducted May 12-18 among 2,002 adults (including 1,497
registered voters), finds increasing interest in the presidential campaign. The
share of registered voters who say they are giving at least some thought to the
presidential candidates has risen eight points since March, from 58% to 66%.
However, just 29% of registered voters say they are giving “a lot” of thought
to candidates who may be running for president in 2016.
Interest in the presidential candidates has increased
among voters in both parties since March. Currently, 69% of Republican and
Republican-leaning voters say they are giving at least some thought to the
candidates, up from 61% in March. Among Democrats, 65% are giving a lot or some
thought to the candidates, compared with 57% in March.
Voter interest is about the same as it was at a
comparable point in the 2008 campaign. In June 2007, 68% of registered voters
said they were giving a lot of thought (33%) or some thought (35%) to the
presidential candidates in 2008.
The survey finds that Republican voters have generally
positive impressions of six GOP declared or likely candidates. Jeb Bush is the
best known of those included in the survey, but he also has the highest
unfavorable rating: 52% of Republicans and Republican leaners view Bush
favorably, while 35% view him unfavorably.
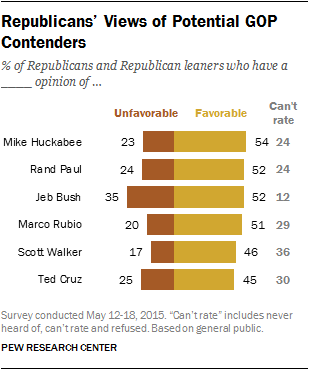 Among other candidates, 54% of
Republicans view Mike Huckabee favorably, while 23% view him unfavorably. Rand
Paul’s favorable ratings are similar (52% favorable, 24% unfavorable).
Among other candidates, 54% of
Republicans view Mike Huckabee favorably, while 23% view him unfavorably. Rand
Paul’s favorable ratings are similar (52% favorable, 24% unfavorable).
About half of Republicans (51%) view Marco Rubio
favorably, compared with 20% who have an unfavorable impression; 29% are unable
to rate the Florida senator. Scott Walker is viewed favorably by 46%, while 17%
rate him unfavorably (36% unable to rate). And 45% view Ted Cruz favorably,
compared with 25% who view him unfavorably (30% can’t rate).
Meanwhile, Hillary Clinton, the clear front-runner for the
Democratic nomination,
is widely popular with Democrats; 77% of Democrats and Democratic leaners view
her favorably.
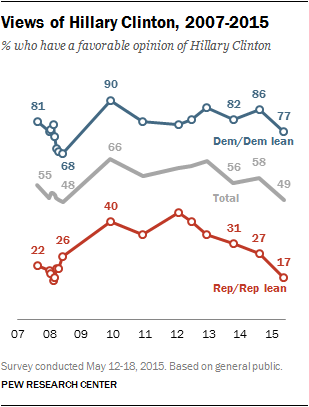 However, Clinton’s favorable ratings
have declined – among the public, as well as Democrats – since last summer.
Currently, 49% of the public has a favorable opinion of Clinton, while 47% view
her unfavorably. Clinton’s overall favorability rating has fallen nine points
from 58% last August. This is Clinton’s lowest favorability mark since the
spring of 2008, during her run for the Democratic nomination. (For more on
Clinton’s favorable ratings since 1992, seethis interactive).
However, Clinton’s favorable ratings
have declined – among the public, as well as Democrats – since last summer.
Currently, 49% of the public has a favorable opinion of Clinton, while 47% view
her unfavorably. Clinton’s overall favorability rating has fallen nine points
from 58% last August. This is Clinton’s lowest favorability mark since the
spring of 2008, during her run for the Democratic nomination. (For more on
Clinton’s favorable ratings since 1992, seethis interactive).
The decline in Clinton’s favorability since August has
come about equally among Democrats and Democratic leaners (from 86% then to 77%
today) and Republicans and Republican leaners (from 27% to 17%).
Bill Clinton’s favorable rating has fallen 10 points
since 2012. Currently, 58% of the public views Bill Clinton favorably, down
from 68% in September of that year. Clinton’s ratings also are at their lowest
point since 2008.
Clinton’s favorable ratings continue to be more positive
than those of another former president, George W. Bush. Currently, 44% have a
favorable opinion of Bush, down seven points from last August, but still higher
than his 37% rating shortly before he left office.
Republicans’ Views
of GOP Candidates
Conservative Republicans are more familiar with the set
of six likely Republican candidates than are moderate or liberal Republicans.
In addition to being more familiar with the candidates, conservative
Republicans generally offer, on balance, more favorable ratings of the
candidates than liberal and moderate Republicans, with the notable exception of
ratings for Jeb Bush.
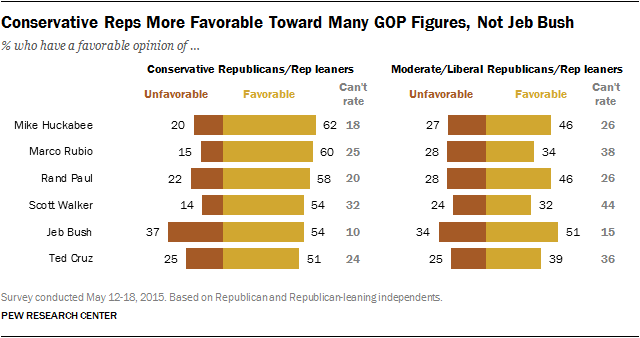
By a 51% to 34% margin, more moderate and liberal
Republicans and Republican leaners say they have a favorable than unfavorable
view of Jeb Bush, while 15% do not offer a rating. Among conservative
Republicans, the balance of opinion is about the same: 54% view Bush favorably,
while 37% view him unfavorable and 10% do not offer a rating.
For the five other declared or likely Republican
candidates included in the survey, ratings are more positive among conservative
than among moderate and liberal Republicans, and this is particularly
pronounced in the ratings of Marco Rubio and Scott Walker. For example, by a
60% to 15% margin, more conservative Republicans hold a favorable than
unfavorable view of Marco Rubio; 25% cannot offer a rating. Rubio’s ratings
among moderate and liberal Republicans are much more mixed (34% favorable, 28%
unfavorable), while as many as 38% cannot offer a rating.
Similarly, Scott Walker is viewed much more positively
among conservative Republicans (54% favorable, 14% unfavorable, 32% can’t rate)
than among moderate and liberal Republicans (32% favorable, 24% unfavorable,
44% can’t rate).
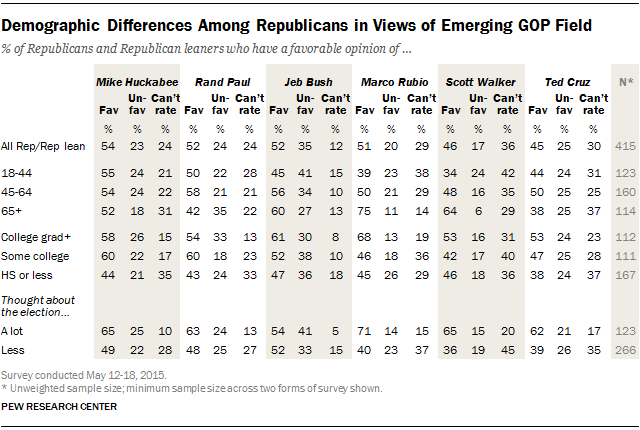
There also are demographic differences in Republicans’
views of these six GOP contenders. Older Republicans and Republican leaners –
those 65 and older – give especially positive ratings to Marco Rubio and Scott
Walker. By an overwhelming 64%-6% margin, older Republicans hold a favorable
view of Wisconsin Governor Scott Walker; 29% cannot offer a rating. And Florida
Senator Marco Rubio is viewed positively by three-quarters of Republicans 65
and older (75%), while just 11% view him negatively (14% do not offer a
rating). Older Republicans also express positive views of Mike Huckabee (52%
favorable, 18% unfavorable) and Bush (60% vs. 27%). By contrast, Republicans
age 65 and over hold more mixed views of Rand Paul (42% favorable, 35%
unfavorable) and Ted Cruz (38% favorable, 25% unfavorable).
Younger Republicans, those under the age of 45, hold
mixed views of Jeb Bush: about as many view him favorably (45%) as unfavorably
(41%), while 15% cannot offer a rating. On balance, younger Republicans view
the five other Republicans included in the survey more favorably than
unfavorably.
Ratings of Jeb Bush also lag those of other GOP
candidates among Republicans who say they have given a lot of thought to the
2016 election. By two-to-one or more, Republicans and Republican leaners who
have thought a lot about 2016 hold more favorable than unfavorable views of
Marco Rubio (71%-14%), Scott Walker (65%-15%), Ted Cruz (62%-21%), Rand Paul
(63%-24%), and Mike Huckabee (65%-25%). By contrast, views of Jeb Bush are more
narrowly positive: 54% view him favorably, while 41% view him unfavorably.
Democrats’ Views of
Clinton
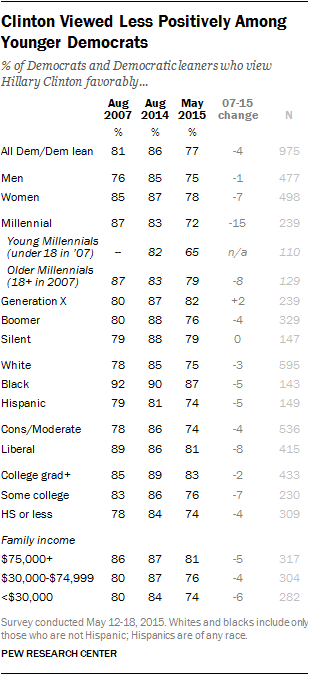 Hillary Clinton remains an overwhelmingly popular
figure with Democrats. Currently, 77% of Democrats and Democratic leaners view
her favorably; that is down slightly from August 2007 (81%), at a somewhat
later point in her last presidential race.
Hillary Clinton remains an overwhelmingly popular
figure with Democrats. Currently, 77% of Democrats and Democratic leaners view
her favorably; that is down slightly from August 2007 (81%), at a somewhat
later point in her last presidential race.
Though wide majorities of Democrats across all
demographic groups view Clinton positively, her favorability rating is lower
among younger Millennials (ages 18-25), who were too young to vote in Clinton’s
2008 race. About two-thirds (65%) of younger Millennial Democrats view Clinton
favorably. That compares with 79% of older Millennial Democrats (those ages
26-34). Among older Democratic age cohorts, 82% of Gen Xers, 76% of Boomers and
79% of Silents view Clinton favorably.
As was the case in August 2007, liberal Democrats view
Clinton more favorably (81%) than do conservative and moderate Democrats (74%).
Unlike eight years ago, there are virtually no gender differences in views of
Clinton among Democrats: 78% of Democratic women and 75% of Democratic men view
her favorably.
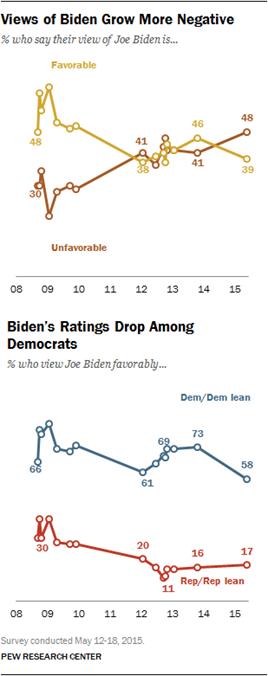 Biden Viewed Less Favorably
Joe Biden’s favorability ratings are now seven points
lower than they were in October 2013, with more Americans now saying they have
an unfavorable opinion of the vice president (48%) than saying they have a
favorable opinion of him (39%); in October 2013, 46% viewed him positively,
while 41% viewed him negatively.
While Biden remains considerably more popular among
Democrats than Republicans, Republican views of Biden are relatively unchanged
over the last few years, while Democratic opinions have become less positive.
Today, 58% of Democrats and Democratic leaners view Biden
favorably, down 15 points from October 2013, when nearly three-quarters (73%)
did so. Just 17% of Republicans and Republican leaners have a favorable opinion
of Biden, a figure that is little changed over the last several years.
_
Opinion of Past
Presidents: Bill Clinton and George W. Bush
Of the two most recent past presidents, Bill Clinton
remains a more popular figure than George W. Bush. Today, 58% of Americans view
Clinton favorably, while 38% have an unfavorable opinion. George W. Bush, by
contrast, is viewed more negatively than positively (44% favorable, 52%
unfavorable).
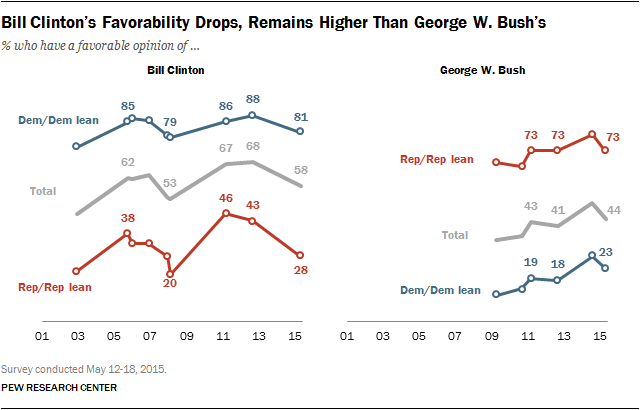
Though views of Bill Clinton remain in positive territory,
they have declined 10 points since 2012. In particular, Clinton is now viewed
far less favorably by Republicans and Republican leaners than he was in
September 2012 (just 28% view him favorably today, down from 43%). And while
about eight-in-ten (81%) Democrats and Democratic leaners view the former
Democratic president favorably today, his ratings among Democrats were slightly
better (88% favorable) in September 2012.
George W. Bush’s ratings have been relatively stable
since early 2011. Currently, nearly three-quarters (73%) of Republicans and
Republican leaners, along with just 23% of Democrats and Democratic leaners
have positive opinions of the former GOP president.
In U.S., Economic Confidence Index Drops
Slightly to -7
May 19, 2015
WASHINGTON, D.C. -- Gallup's Economic Confidence Index dropped slightly
to -7 for the week ending May 17, 2015. There have been minor fluctuations in
economic confidence in the last three weeks, but from a longer-range perspective,
the key finding is that Americans' confidence in the economy remains depressed
-- down from the highs it had reached in the period between late December and
April.
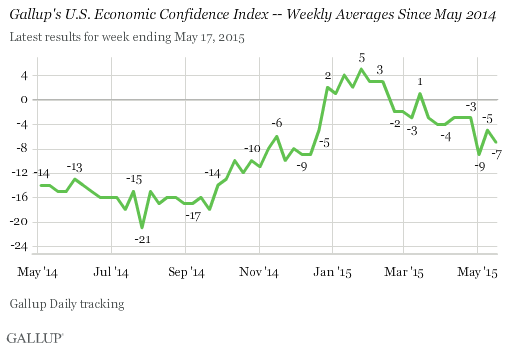
While the Economic Confidence Index was significantly lower as recently
as the fall of last year, it broke out of negative territory for the first time
in over six years in late December. It remained slightly positive in January
and February before losing its forward momentum and beginning its downward
slide.
Gallup's Economic Confidence Index is the average of two components:
Americans' views of current economic conditions and their perceptions of
whether the U.S. economy is getting better or getting worse. The theoretical
maximum for the index is +100, if all Americans say the economy is excellent or
good and getting better. The theoretical minimum is -100, if all Americans say
the economy is poor and getting worse.
The biggest drop this year has been in Americans' views of the future of
the economy, as they have moved from a very optimistic position at the end of
2014 and in the first part of this year to a much more negative forecast.
Americans' assessment of current conditions has remained somewhat more stable.
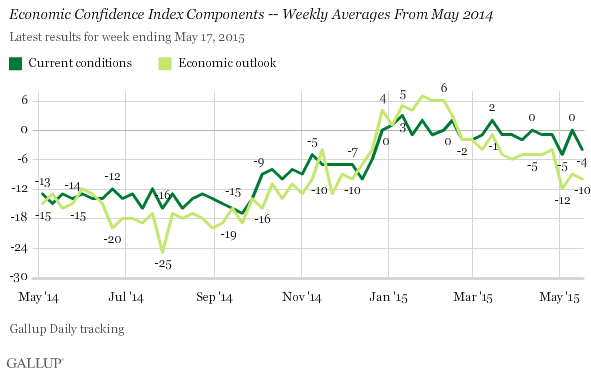
More specifically, Americans' ratings of the current economy dropped to
-4 last week, which ties with two weeks prior to be the lowest found since late
December 2014. This was the result of 25% of Americans saying the current
economy is "excellent" or "good" and 29% saying it is
"poor."
Americans' outlook for the economy was level at -10, similar to the -9
of the week prior. This was the result of 43% of Americans saying they thought
the economy is "getting better" and 53% saying it is "getting
worse."
Americans' economic confidence has rebounded from the drop of approximately
two weeks ago after the U.S. government announced that GDP growth was flat in
the first quarter. However, confidence is still not back to where it was in
March and April. If anything, it fell back slightly this past week after mostly
recovering from the sharper drop in late April/early May. Confidence is also
down further from its recent highs at the end of 2014 and beginning of 2015,
but even the current scores are well above where they were from 2008-2014.
Survey Methods
Results for this Gallup poll are based on telephone interviews conducted
May 11-17, 2015, on the Gallup U.S. Daily survey, with a random sample of 3,545
adults, aged 18 and older, living in all 50 U.S. states and the District of
Columbia. For results based on the total sample of national adults, the margin
of sampling error is ±2 percentage points at the 95% confidence level. All
reported margins of sampling error include computed design effects for
weighting.
Each sample of national adults includes a minimum quota of 50% cellphone
respondents and 50% landline respondents, with additional minimum quotas by
time zone within region. Landline and cellular telephone numbers are selected
using random-digit-dial methods.
The Benefits of Pre-Surgery Education
May 20, 2015
This is the first article in a two-part series.
To
customers, feelings are facts. When the customers are hospital patients
receiving medical device implants, their emotions are influenced by both the
outcomes healthcare providers and medical device companies deliver and by how
these outcomes compare with patients' expectations. Patient education is the
primary way to manage these expectations.
The
education that patients receive before surgery has significant positive effects
on surgery outcomes, Gallup's analysis shows. These results include increased
overall patient satisfaction, reduced problem incidence and improved quality of
life.
The
positive relationship between patient education and post-surgery outcomes isn't
just good news for patients, it also has significant implications for
healthcare providers and medical device manufacturers. For hospitals, reducing
the number of problems could directly reduce costly readmissions, while higher
patient satisfaction levels could contribute to improved Hospital Consumer
Assessment of Healthcare Providers and Systems (HCAHPS) survey scores and a
greater share of incentive payments. For physicians and implant manufacturers,
lower problem incidence could directly reduce costly revision surgeries,
malpractice lawsuits or both.
Even
when healthcare leaders place a high priority on patient education, providing
this effectively to patients and managing their expectations is hard work. A
good place to start is to understand how pre-surgery education affects
outcomes.
Pre-Surgery Education Influences Post-Surgery Outcomes
In
a recent study, Gallup researchers asked patients undergoing medical device
implantation about three important aspects of pre-surgery education. Patients
were asked to rate their levels of agreement with the following statements
using a scale of 1 (strongly disagree) to 5 (strongly agree):
·
I knew what to expect after surgery.
·
I was prepared for my experience
post-surgery.
·
I followed post-surgery instructions, such as
rehabilitation or medication.
The
analysis showed that each of these aspects of pre-surgery education
substantially influenced post-surgery outcomes. Patients who strongly agreed
with just one of these statements had significantly higher satisfaction and
significantly lower problem incidence compared with patients who did not
strongly agree (giving a rating of 1 to 4).
For
example, when patients strongly agreed that "I knew what to expect after
surgery," 72% were extremely satisfied with the surgery results, and only
8% reported problems following the surgery. When patients did not strongly
agree with this item, 39% were extremely satisfied with the surgery results,
and 27% reported problems after the surgery.
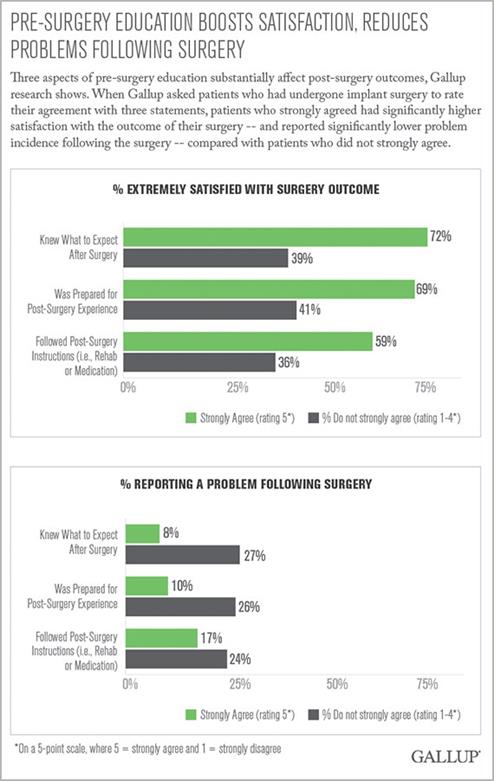
When
patients strongly agreed with two or three of these statements, they
experienced even greater outcome improvements, such as higher overall
satisfaction and lower problem incidence. When patients strongly agreed with
just one of the three patient education items, 46% were extremely satisfied
with the results, and 27% reported a problem following surgery. When patients
strongly agreed with two items, 65% were extremely satisfied with the results,
and 13% reported a problem post-surgery. But when patients strongly agreed with
all three items, 71% were extremely satisfied with their results, and just 8%
reported a problem following surgery.
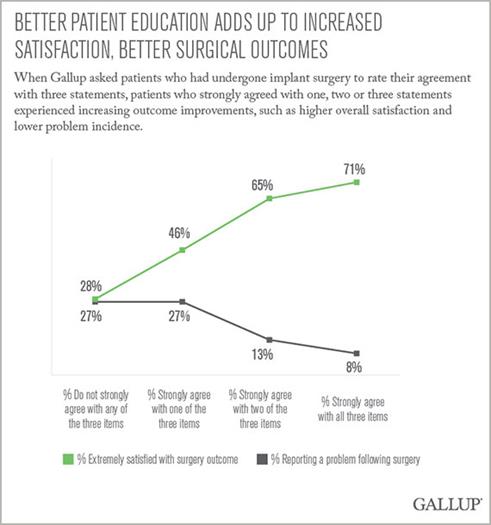
Pre-Surgery Education Affects Patients' Post-Surgery
Well-Being
The
physical and emotional consequences of surgical outcomes go well beyond the
scope of the procedure to affecting patients in five key areas of personal
well-being. Gallup and Healthways have identified five essential elements of
well-being -- purpose, social, financial,
community and physical -- that encompass the most important parts of how
people think about and experience their lives and collectively signify a life
well-lived.
For
each aspect of patient education, patients who strongly agreed with a statement
were about twice as likely to be thriving in all five well-being elements as
patients who did not strongly agree. When patients strongly agreed that "I
knew what to expect after surgery," for example, 10% were thriving in all
five well-being elements, compared with 6% of patients who did not strongly
agree.
These
results suggest that poor surgical outcomes -- regardless of their cause --
have consequences for patients, their friends and families, and their community
that are more far-reaching than providers may realize. Taking the time properly
and fully educate patients can improve both their physical well-being and all
aspects of their life.
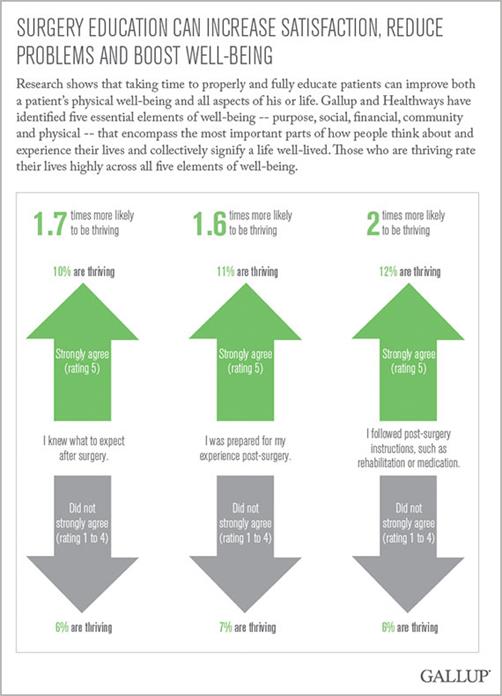
Taking the time to educate patients before a surgical
procedure can have a significant positive effect. Though each of the three key
education elements improves outcomes, these elements influence them in
different ways. In part two of this series, we'll discuss how healthcare
leaders can tailor pre-surgery education to help improve patients' surgical
outcomes.
Survey Methods
Results
are based on a 2014 medical device Gallup Panel Web and mail study completed by
26,128 national adults, aged 18 and older, conducted Aug. 5-Sept. 16, 2014.
Results of the well-being analysis are a combination of four studies: a 2014
medical device study, a 2014 health experience study, a 2014 well-being study
and a 2013 well-being study. The Gallup Panel is a probability-based
longitudinal panel of U.S. adults who Gallup selects using random-digit-dial
phone interviews that cover landline and cellphones. Gallup also uses
address-based sampling methods to recruit Panel members. The Gallup Panel is
not an opt-in panel and panel members do not receive incentives for
participating. In this study, 2,639 respondents reported that they had medical
implants in the last 12 months, which is the total sample for the results
reported in this article. For results based on this sample, one can say that
the maximum margin of sampling error is ±1.9 percentage points, at the 95% confidence
level. Margins of error are higher for subsamples. In addition to sampling
error, question wording and practical difficulties in conducting surveys can
introduce error or bias into the findings of public opinion polls.
For Patients, Pre-Surgery Education Is
Lacking
May 21, 2015
This is the second article in a two-part series.
When
it comes to pre-surgery education for patients, healthcare leaders have their
work cut out for them.
But
it's work worth doing. The positive relationship between patient education and
post-surgery outcomes has significant implications for patients, healthcare
providers and medical device manufacturers.
As
reported in our earlier article, Gallup researchers asked
patients undergoing medical device implantation about three important aspects
of pre-surgery education. Patients were asked to rate their level of agreement
with the following statements using a scale of 1 (strongly disagree) to 5
(strongly agree):
·
I knew what to expect after surgery.
·
I was prepared for my experience post-surgery.
·
I followed post-surgery instructions, such as
rehabilitation or medication.
Gallup's
analysis showed that each of these aspects of pre-surgery education
substantially affected post-surgery outcomes. Patients who strongly agreed with
just one of these statements had higher satisfaction and lower problem
incidence compared with patients who did not strongly agree (giving a rating of
1 to 4). And when patients strongly agreed with two or three of these
statements, they experienced even greater outcomes, including increased overall
satisfaction and lower problem incidence.
Patients
who strongly agreed with two or more statements also experienced physical and
emotional consequences of surgical outcomes that extended well beyond the scope
of the procedure to affecting five key areas of personal well-being. Gallup and
Healthways have identified five essential elements of well-being -- purpose, social, financial,
community and physical -- that encompass the most important parts of how
people think about and experience their lives and collectively signify a life
well-lived. For each aspect of patient education, patients who strongly agreed
with a statement were about twice as likely to be thriving in all five
well-being elements as patients who did not strongly agree.
The
vital finding that healthcare providers should heed is that taking the time to
educate patients before a procedure has significant consequences for patients,
their friends and families, and their community. But before healthcare leaders
take action to improve patient education and communication, they need to know
where the biggest gaps exist in these areas.
Significant Room for Improvement
When
Gallup surveyed hospital patients who had received a medical implant, only 37%
of respondents strongly agreed with all three aspects of patient education,
while 17% strongly agreed with none of them. This finding
suggests that there is significant room to improve patients' pre-surgery
education. For two of the patient education items ("I knew what to expect
after surgery" and "I was prepared for my experience
post-surgery") there are sizable gains to be made, with less than half of
respondents (46%) strongly agreeing with either of these items.
While
all three items improve surgical outcomes, these elements influence them in
different ways. Though it's arguably difficult for healthcare providers or
device manufacturers to influence patient adherence to post-surgery
rehabilitation and medication regimes, Gallup's research indicates that
patients take care of their part: The vast majority (78%) strongly agreed that
they followed post-surgery instructions. Because less than half of patients
strongly agreed with the other two items ("I knew what to expect after
surgery" and "I was prepared for my experience post-surgery")
Gallup's analysis indicates that tailored pre-surgery communication is the key
to successful post-procedure outcomes.
Before
they can adapt pre-surgery education to meet patient needs, healthcare leaders
must know where it is most lacking. Gallup finds the biggest gap between
pre-surgery patient education and post-surgery outcomes among Generation X
males (born 1965-1979) and millennial males (born 1980-1996) who are undergoing
acute procedures (versus elective and cardiac procedures). Though there is room
for improving patient education across the board, hospital leaders could
enhance patient outcomes by reassessing their education strategy and messages
for these key patient segments. By taking steps to understand the education
gaps for various patient groups and demographics, leaders can ensure that they
maintain a strong, proactive approach in education for all patients.
How to Improve Patient Education
Healthcare
providers and medical device companies can improve patient outcomes
significantly by refining patient communication and education. The following
are a few best practices to help leaders make this happen.
What
healthcare leaders should do:
·
Emphasize proactive communication. When patients have
well-informed expectations, they tend to be less anxious before procedures and
less surprised after them. Hospitals can emphasize the importance of proactive
communication by equipping doctors, nurses and staff with knowledge, experience
and materials to meet patients' education needs. They should also implement a
system of accountability to ensure that doctors, nurses and staff are prepared
to talk with patients about their upcoming procedure -- and that patients
receive that education consistently.
·
Use checklists. Following studies and
articles by respected physicians such as Atul Gawande and Peter Pronovost, the
use of checklists during surgery has profoundly reduced surgical and medical
errors. A similar strategy, founded in best practices for when, what and how to
educate patients, can help providers ensure that patients understand crucial
pre- and post-surgical expectations.
·
Tailor communication to each patient. Healthcare providers
should personalize communications to meet each patient's needs, including
individualizing the content and how doctors, nurses and staff deliver it. Focus
groups with former patients can help providers determine how different patient
groups best understand and retain health information. Because Gen X and
millennial males undergoing acute procedures are most likely to benefit from
enhanced education and communication, hospitals should start by revitalizing
communication efforts with these two groups.
What
medical device company leaders should do:
·
Develop and maintain easily accessible
content. Though
healthcare providers are primarily responsible for direct patient education,
medical device companies also have a stake in enhancing communication to
increase patient satisfaction. Company leaders can do their part to further
patient education by developing and maintaining educational content that is
credible and delivered through many types of communication channels, including
traditional and social media. These offerings inform patients about the best
available options, increase brand awareness and build consumer trust,
encouraging consumers to ask for products from a specific company.
·
Understand and accommodate patient-surgeon
disconnects. Providing
patients and surgeons with simple, easy-to-use materials can further enhance
patient comprehension and buy-in. Surgeons will benefit from materials that
make it easy to explain procedures to patients. Patients will benefit from
materials that help them understand the procedure and from surgeons who can
provide additional information if they have questions.
·
Anticipate and answer patient questions. Patients' information
needs change over time, and materials written a year or more ago may already be
outdated. Surgeons and hospital staff will be the first to know when materials
become obsolete because patients' questions will change or increase. Asking
surgeons for feedback on the questions patients ask most often about their
procedures can help companies keep educational content current and relevant as
technology and patient needs change.
Survey Methods
Results
are based on a 2014 medical device Gallup Panel Web and mail study completed by
26,128 national adults, aged 18 and older, conducted Aug. 5-Sept. 16, 2014.
Results of the well-being analysis are a combination of four studies: a 2014
medical device study, a 2014 health experience study, a 2014 well-being study
and a 2013 well-being study. The Gallup Panel is a probability-based
longitudinal panel of U.S. adults who Gallup selects using random-digit-dial
phone interviews that cover landline and cellphones. Gallup also uses
address-based sampling methods to recruit Panel members. The Gallup Panel is
not an opt-in panel and panel members do not receive incentives for
participating. In this study, 2,639 respondents reported that they had medical
implants in the last 12 months, which is the total sample for the results
reported in this article. For results based on this sample, one can say that
the maximum margin of sampling error is ±1.9 percentage points, at the 95%
confidence level. Margins of error are higher for subsamples. In addition to
sampling error, question wording and practical difficulties in conducting
surveys can introduce error or bias into the findings of public opinion polls.
Americans Still Spending More, Still
Not on What They Want
May 21, 2015
PRINCETON, N.J. -- A majority of Americans, 55%, say they are spending
more than they did last year on groceries, the area in which Americans
continually report spending more.
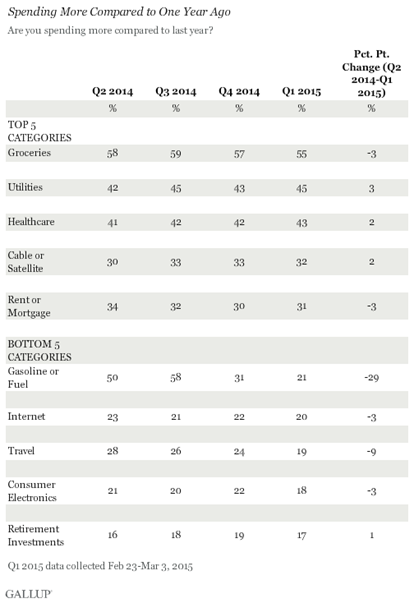
Since last June, the top three categories with the highest percentages
of consumers saying they are "spending more" (groceries, utilities
and healthcare) have stayed in the top five. Of these, only groceries showed a
modest decline in the percentage of Americans saying they are spending more
(three percentage points), while utilities and healthcare both inched up
slightly (three points and two points, respectively). None of these changes,
however, are statistically significant.
Consistent with the steep decline in gas prices over the past year, the
only category to show a major shift in spending is "gasoline or
fuel," in which 21% of Americans in March said they were spending more,
compared with 50% in June 2014. Thirteen percent said they were spending less
on gas last June compared with 55% this March. The net spending difference has
shifted from +37 (spending more minus spending less) to -34.
Over the past nine months, there has been a general but modest decline
in net spending across almost all spending categories, driven by a decreasing
number of Americans saying they are spending more on each category. The
exceptions to this general trend are leisure activities (+3), cable or
satellite (+4), utilities (+5) and healthcare (+3), areas where more Americans
say they are spending more than a year ago and fewer say they are spending
less.
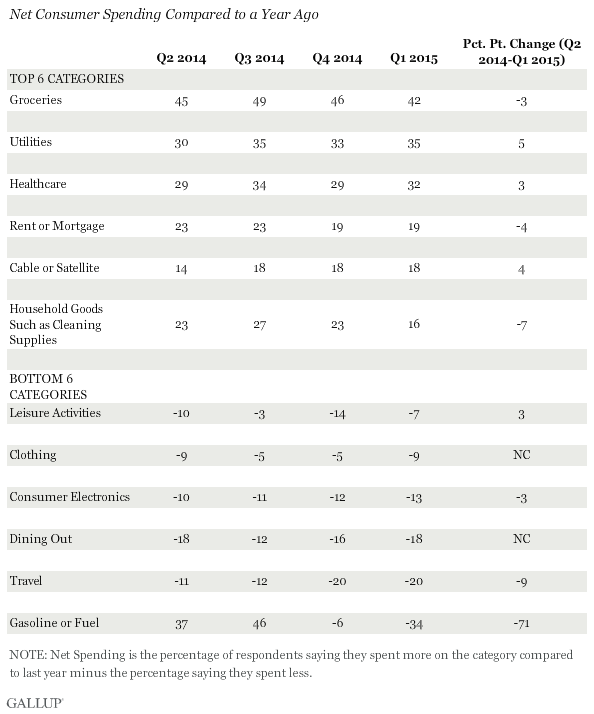
Americans continue to spend more on things they need, but not on things
they want. All five categories of discretionary purchases -- leisure
activities, clothing, consumer electronics, dining out and travel -- continue
to have negative net spending with substantially more Americans saying they are
spending less than last year than those who say they are spending more. As
household essentials claim a larger slice of Americans' spending, less remains
for discretionary purchases.
These data suggest that at least some of the money that is not being
spent on gas is going into discretionary spending categories -- leisure
activities and dining out -- which either showed an increase in net spending or
showed a modest increase in the percentage of those saying they are spending
more today than a year ago. But some of the money that Americans are not
spending on gas is going to other non-discretionary categories -- cable or
satellite, utilities and healthcare. These three categories were among the four
to show increases in net spending over the past nine months.
Americans may be letting their gas savings remain in their bank accounts
or perhaps moving those funds into savings accounts -- rather than actively
redirecting them to other areas of spending. Of course, other uses for this
gas-driven windfall are possible too.
Implications
After nine months of following Americans' self-reported spending
patterns, several conclusions seem warranted. First, net spending -- the
percentage of Americans reporting that they are spending more within a category
minus the percentage saying they are spending less -- seems to be fairly stable
for all categories except gas or fuel. This could be attributable, in part, to
the possibility that self-reports of spending may be less sensitive to actual
spending fluctuations than to dramatic shifts in spending, such as the change
in spending on gasoline. People may simply be inclined to overlook smaller
spending changes when they discuss it. Second, gas prices have actually
declined precipitously over the past nine months, and this decline is clearly
reflected in Americans' perceptions of their spending. Third, net spending
appears to be on a modest downward trend with the percentage of Americans
reporting that they are spending more within a category and the percentage
saying they are spending less moving closer together. Finally, the overall
order of the spending categories based on net spending hasn't changed much
since Gallup began measuring spending in this way. Three of the top four net spending
categories back in June 2014 -- groceries, utilities and healthcare -- all
remain at the top. Four of the bottom five net spending categories remain at
the bottom -- travel, dining out, consumer electronics and clothing.
As the summer travel season begins, it will be interesting to see
whether American consumers report spending more on gas and whether they say
they are spending more on travel and leisure activities.
Survey Methods
Results for this Gallup poll are based on telephone interviews conducted
Feb. 23-March 3, 2015, with a random sample of 1,525 adults, aged 18 and older,
living in all 50 U.S. states and the District of Columbia. For results based on
the total sample of national adults, the margin of sampling error is ±2.5
percentage points at the 95% confidence level. For comparisons between or
within the total sample for each generation, the margin of sampling error is
±5.9 percentage points at the 95% confidence level.
Each sample of national adults includes a minimum quota of 50% cellphone
respondents and 50% landline respondents, with additional minimum quotas by
time zone within region. Landline and cellular telephone numbers are selected
using random-digit-dial methods.
Canadians evenly divided on release of
Omar Khadr
May 25, 2015
More
than a dozen years after he allegedly killed an American soldier in Afghanistan, there
is little consensus among Canadians in how they view Omar Khadr, or in what
they think about an Alberta judge’s decision to release him on bail while he
waits to appeal his U.S. Military conviction.
A
new public opinion poll from the Angus Reid Institute finds divergent opinions
on Khadr – a Canadian citizen who was 15 years old at the time of the incident
– and on his release.
Key
Findings:
- Canadians are evenly divided on
the judicial decision to release Khadr on bail: just over one-third each
agree (38%) and disagree (39%), while one-quarter (23%) are unsure.
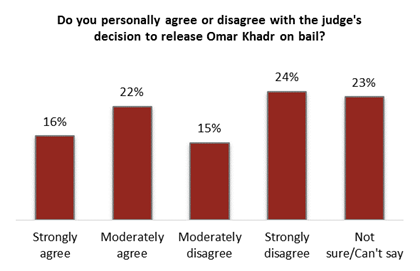
- Two-thirds (67% each) agree
that Khadr “has every right to a proper trial” in Canada and that he was a
“child soldier” who “should have been dealt with accordingly.” Views are
quite split on whether he has “served his time — 13 years is enough” (52%
agree, 48% disagree).
- A slim majority of Canadians
agree that Khadr “remains a potential radicalized threat” (55%).
- Khadr’s case is politically
divisive. A full majority (59%) of those who voted for the Conservative
Party in the last federal election disagree with the judge’s decision,
including 42 per cent who say they “disagree strongly.” Conversely,
roughly half of Liberal (52%) and New Democratic Party (49%) voters agree
with the decision.
Even
split on judge’s decision
Nearly
a quarter of Canadians (23%) aren’t sure how they feel about Khadr’s release.
Those who have an opinion are evenly split, with roughly four-in-ten both
agreeing with the judge’s decision (38%) and disagreeing with
it (39%).
Those
opposed to releasing Khadr feel strongly about the decision. More respondents
(24%) choose “strongly disagree” than any other option offered, and that
quarter of respondents who strongly disagree substantially outnumber the 16 per
cent who strongly agree.
Support
for Khadr’s release is strongest in B.C. where 42 per cent agree with the
judge’s decision versus 34 per cent disagree. Residents of Manitoba and
Saskatchewan are least supportive. Just 28 per cent in those provinces agree
with the judge’s decision, while 54 per cent disagree. In all other major
regions, as observed nationally, public opinion is essentially evenly divided.
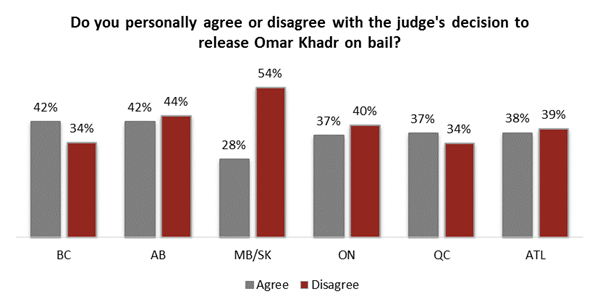
Uncertainty
on ‘fairness’ of Khadr treatment
Asked
whether Khadr has ultimately been treated fairly or unfairly, Canadians’
largest single response was “unsure.” Four-in-ten (40%) chose this option,
while those with an opinion were slightly more likely to say he’d been treated
fairly (33%) than unfairly (28%).
Perhaps
predictably, those who believe Khadr has been treated fairly are more likely to
disagree with his release. Three-quarters (75%) of those who believe Khadr has
been treated fairly say they disagree with the judge’s decision to release him,
compared to 19 per cent who agree.
Similarly,
more than eight-in-ten (85%) of those who believe Khadr has been treated
unfairly say they agree with the judge’s decision, compared to 9 per cent who
disagree.
A
‘potential radicalized threat’ or someone who ‘has served his time’?
In
October 2010, Khadr pleaded guilty to five war crimes charges before a
U.S. military tribunal in Guantanamo Bay, Cuba, where he had been held since
his capture in 2002.
At
the time of the plea, nearly half of Canadians (48%) said in an Angus Reid poll that they believed he had done so
because it was in his best interest, regardless of whether he was actually
guilty. Only about half as many (27%) said they believed Khadr pleaded guilty
because he actually committed all of the crimes of which he was accused.
Khadr
has been in Canada since 2012, when he was transferred from a U.S. prison to serve his sentence
in the country of his birth. He was released on bail earlier this month.
Today,
a slim majority of Canadians agree that Khadr “remains a potential radicalized
threat” (55% agree versus 45% disagree). And views are quite divided with
respect to the sentiment that Khadr “has served his time – 13 years is enough”
(52% versus 48%).
Larger
majorities (67% in each case) agree with the statements “Omar Khadr has every
right to a proper legal trial here in Canada” and that, “at age 15, he was a
‘child soldier’ and should have been dealt with accordingly.”
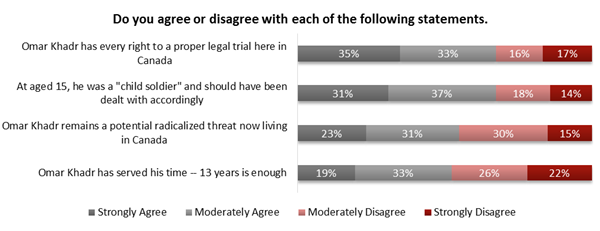
Opinions
on Khadr: the regional picture
There
are significant regional differences in opinion on the threat Khadr poses to
Canada and the idea that he’s served his time, with higher agreement on one
statement tending to correspond with higher disagreement on the other. And of
course, views on these more specific angles vary predictably by people’s
overall perspective on him being released on bail.
Respondents
from British Columbia are the only group to voice less than 50 per cent
agreement with the statement about Khadr remaining a potential radicalized
threat: 46 per cent do so. B.C. also has the highest rate of agreement (60%)
with the statement about Khadr having served his time.
Prairie
residents – those in Manitoba and Saskatchewan – have the opposite perspective.
Two-thirds (65%) agree that Khadr remains a threat, and 37 per cent agree that
he has served his time.
Divergence
is also seen among 18-to-34-year-olds versus other age groups. Younger
respondents are slightly less likely to agree that Khadr remains a threat (48%
do so, compared to 59% of those ages 35-54 and 56% of those over the age of
55).
Younger
respondents are also slightly more likely to agree that Khadr has served his
time. Nearly three-in-five (59%) do so, compared to roughly half of respondents
of other ages (48% of 35-to-54-year-olds and 51% of those over 55).
Political
preferences colour opinions on Khadr case
Opinions
about Khadr are most hardened among Canadians who voted for the Conservative
Party in the last federal election. Just one-quarter (25%) of past Conservative
voters agree with the judge’s decision to grant bail, while fully three-in-five
(60%) disagree, including 42 per cent who do so strongly.
By
contrast, roughly half of those who voted for the Liberal Party of Canada (52%)
or the New Democratic Party (49%) in the last federal election agree with the
judge’s decision, while smaller minorities within each subset disagree (23% of
past Liberal and 30% of past NDP voters).
Along
the major parties, the Conservatives also have the lowest level of uncertainty
regarding Khadr’s release. Only 15 per cent are unsure, compared to 25 per cent
of Liberal and 21 per cent of NDP voters.
On
the issue of fairness, those who voted for the Conservative Party in the last
federal election held a markedly different perspective than those who voted for
other parties. More than half of Conservatives (56%) said Khadr had been
treated fairly. Only 21 per cent of Liberals and 24 per cent of NDP voters said
the same.
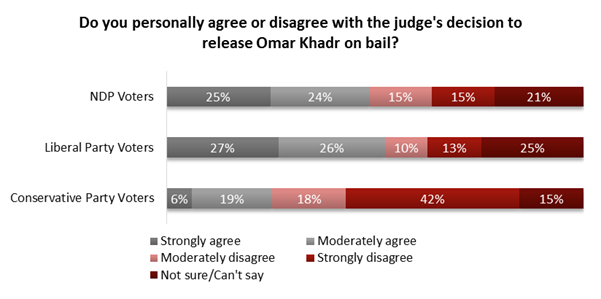
Past
Conservative voters are also far more likely to agree that Khadr remains a
potential radicalized threat. Nearly three-quarters of Conservative voters
(72%) agree with this statement, compared to 46 per cent or less among voters
for all other political parties. (See detailed tables at the end of this
release).
Large
numbers of past CPC voters also disagree with more sympathetic statements about
Khadr, including two-thirds (66%) who disagree that he “has served his time”
and 45 per cent who disagree that he “was a ‘child soldier’ and should have
been dealt with accordingly.”
LATIN AMERICA
Eight out of ten Brazilians consider
themselves religious
Note: You are reading googletranslation of a
Portuguese survey.
May 19, 2015
Those who do not consider themselves
religious totaling 16%
In
Brazil, eight in ten (79%) people say they are religious people. This is
shown by research Barometer Global Optimism, made by IBOPE Intelligence in
partnership with the Worldwide Independent Network of Market Research (WIN),
held in 65 countries with 63,898 respondents.Those who do not consider
themselves religious totaling 16% of the population and another 2% claim to be
atheists.
The
proportion of people who consider themselves religious puts Brazil above the
global average, which is 63%. In contrast, those who do not consider
themselves religious totaling 22% of the world population and 11% claim to be
atheists.
In
Africa and the Middle East, the percentage of those who mention being religious
is, respectively, 86% and 82%. In eastern Europe and the Americas, this
percentage drops to 71% and 66%, respectively. In Asia, 62% of people say
they are religious.
The
populations of Oceania and western Europe are those with the most polarized
opinions. In Oceania, 44% consider themselves religious and 37% are not
considered, while in European countries this proportion is 43% X 37%. It
is also in these two regions and in Asia where the greatest number of atheists:
14% in Western Europe and Asia and 12% in Oceania.
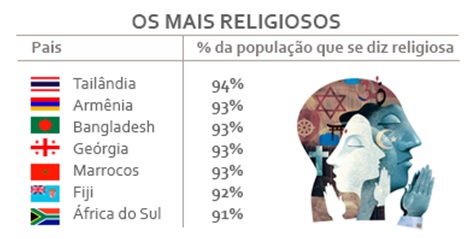
The
less religious - The
country with the least religious people is China, where 61% of the population
claims to be atheist, about twice more than any other country surveyed. In
addition, 29% of Chinese say not to be religious.
Hong
Kong and Japan are the other countries with the greatest number of atheists:
34% and 31%, respectively. In the West, the least religious country is
Sweden, where 74% said not claim to be religious or atheists.
The survey also shows that there is a direct relationship between religion and
age, income and educational level. According to the study, people with
higher levels of education and younger (up to 34 years) tend to be more
religious: 80% and 66%, respectively.
On the other hand, the higher the lower the level of income
religion. Among those with higher income, fewer than 50% say they are
religious, compared with 70% of those with the lowest income. The number
of atheists follow the same path: reaches 25% among those with the highest
yields and is only 5% among people with the lowest earnings.
About the survey
In
total, the study heard 63,898 people in 65 countries. In Brazil, 2,002 interviews
were made between October and November 2014.
AUSTRALASIA
White out: Aussies opt for fresh over
long-lasting milk
May 20, 2015
Although UHT/long life milk is
widely consumed across Europe and Asia, it is yet to take off in Australia,
where the prevailing attitude appears to be ‘fresh is best’. Recent findings
from Roy Morgan Research show that seven out of every 10 Australians 14+ (or
13.6 million people) drink fresh milk in an average seven days, while fewer
than two in 10 (2.9 million people) drink the long-life/UHT variety.
There has
been little change in these figures over the past five years, with an almost
negligible shift in favour of long-life/UHT milk, consumption of which rose
from 14% to 15% of the population between 2010 and 2014. The proportion of
Aussies drinking fresh milk declined from 72% to 70%, and those who drink both
types of milk in an average seven days crept up from 8% to 9% over the same
period.
Long-life/UHT
milk is most likely to be consumed by Aussies from older households (18%) and
least likely to be consumed in households comprised of Young Parents and their
families (12%). Conversely, this latter group has the highest incidence of
fresh milk consumption (75%), while older households (68%) are below average in
terms of their fresh milk consumption.
Fresh vs
long-lasting milk: consumption rates by household life cycle
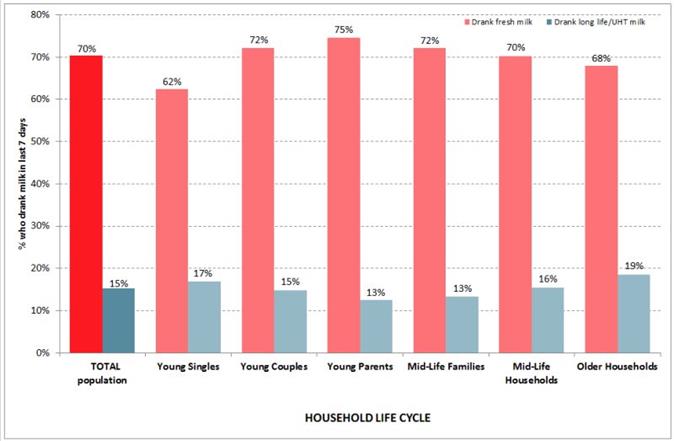
Source: Roy Morgan Single Source (Australia),
January–December 2014 (n=15,944). Base: Australians 14+
Geography
makes little difference to the kind of milk someone drinks, with consumption
incidence fairly consistent between states — except for South Australia, where
18% of residents drink long-life/UHT milk in an average seven days.
Michele
Levine, CEO, Roy Morgan Research, says:
“With
fresh milk affordable and readily available, Australians have not embraced
UHT/long-life milk to nearly the same extent as some European and Asian
countries. Even among sectors of the population with an above-average incidence
of long-life milk consumption, such as older households, fresh milk’s
popularity remains unchallenged.
“Despite
being almost identical to fresh milk in terms of nutritional value and calorie
count, plus having the added bonus of not needing to be refrigerated until it’s
open, UHT/long-life milk has made minimal inroads with Australian consumers
over the past five years. Although UHT milk tends to be cheaper than fresh
milk, the ongoing supermarket ‘milk wars’ mean the price difference is not as
great as it might once have been.
“Tellingly,
young parents and mid-life families are even more likely than the average
Australian to buy fresh milk, and less likely to buy the long-life variety.
This suggests that they believe fresh milk is healthier and therefore better
for their kids.
“In
short, producers of UHT/long-life milk keen to boost their popularity in
Australia have their work cut out for them. Before they can make any progress,
an in-depth knowledge of their current and potential consumers is vital: from
the attitudes behind their purchasing decisions to the life stage of their
household…”
Source: http://www.roymorgan.com/findings/6241-aussies-opt-for-fresh-over-longlife-milk-201505192359
On your bike! Cycling participation
picks up speed
As anyone who drives a car would
have noticed, the number of cyclists on Australian roads has sky-rocketed in
the past decade. Whereas 13% of the population (or 2.1 million people) cycled
regularly or occasionally in 2005, the latest findings from Roy Morgan Research
show that this has now reached 19% (or 3.7 million people). Love them or loathe
them, there’s no escaping them — especially in WA, cycling’s heartland…
Twenty-three
percent of Western Australians aged 14+ ride their bike either regularly or
occasionally, the highest cycling participation rate in the country. Given its
famed climate, a capital city with more sunny days per year than any other
Australian capital, and some truly scenic metropolitan cycle paths, this is not
particularly surprising.
In second
place is Victoria, where 20% of the population cycle. Factor in Melbourne’s
hipster fraternity tootling around the inner-city on their ‘fixies’, a
comprehensive network of urban and regional cycling paths, and a busy events
calendar for enthusiasts, and this also makes sense.
The state of the
cycling nation: cycling participation by state
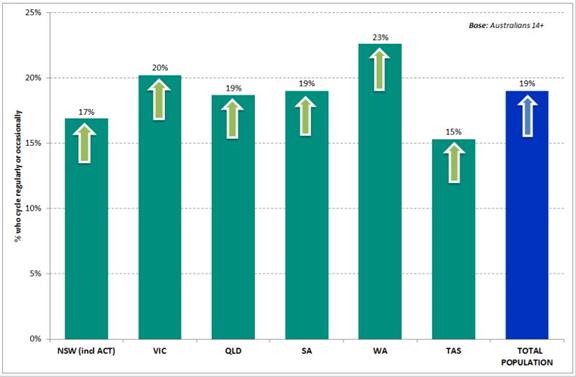
Source: Roy Morgan Single Source (Australia), April 2014–March 2015 (n=15,913).
Residents of
Tasmania (15%) and NSW/ACT (17%) are less likely to cycle, but like the other
states, their participation rates have risen since 2005.
The rise of the MAMIL (middle-aged man in lycra)
It seems
that cycling’s popularity knows no bounds, having risen among men (22%, up from
16%), women (16%, up from 9%), and all age groups except boys aged 14-17 years
old. Once the age group with the highest cycling participation rate (33% rode
their bike either occasionally or regularly back in 2005), the ‘yellow jersey’
now belongs to men aged 34-49!
Did somebody say
MAMIL? Cycling among Aussie men: 2005 vs 2015
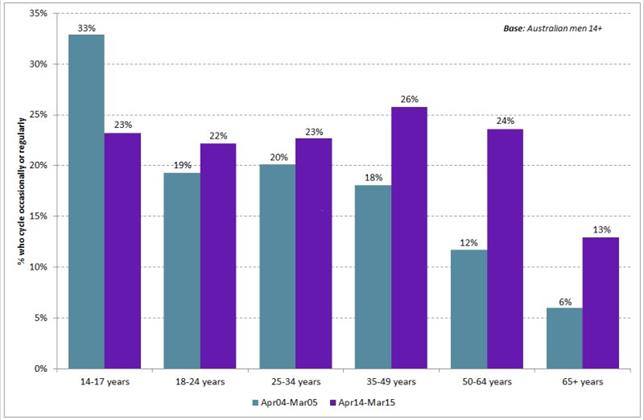
Source: Roy Morgan Single Source (Australia), April 2004–March 2015 (n=9,795) and
April 2014–March 2015 (n=6,712).
Over the
last decade, there has been a surge in more mature male cyclists, with
participation rates rising from 18% to 26% among men aged 35-49 years, doubling
among men aged 50-64 (from 12% to 24%) and more than doubling from 6% to 13%
among men aged 65+.
Norman
Morris, Industry Communications Director, Roy Morgan Research, says:
“Along
with working out at the gym, jogging, swimming and hiking/bushwalking, cycling
is one of Australia’s key growth sports, gaining 1.6 million additional
participants over the last decade. This is almost certainly the result of a
number of factors: soaring petrol prices, congested roads, over-crowded public
transport and Cadel Evans’s 2011 Tour de France victory among them.
“The WA
Government’s recent announcement that cyclists will soon be allowed to ride on
footpaths is an indication of the sport’s popularity in that state, but also
hints that the growing number of cyclists sharing the roads with motorists is
becoming a problem. In fact, many Australian cities are working to accommodate
increased bicycle traffic on their roads, introducing designated cycle lanes
and tougher penalties for ‘car-dooring’ in an attempt to adapt to evolving
traffic trends.
“Meanwhile,
the MAMIL (middle-aged men in lycra) phenomenon shows no sign of abating. With
low impact on joints and a strong social aspect (they often travel in packs!),
cycling’s appeal for this demographic is undeniable.
“Interestingly,
cycling is one of the few sports in which participation comes close to TV
viewing incidence (especially compared with something like Aussie Rules
football, for example). One in five Australians watch cycling on television (up
from 8% in 2005), almost identical to the proportion who participate in the
sport — good news for SBS, which is currently broadcasting the Giro d’Italia
and gearing up for the Tour de France…”
MULTI-COUNTRY
SURVEYS
Family Support in Graying Societies
How Americans, Germans and Italians Are
Coping with an Aging Population
May 21, 2015
The Growing Population of Older People in the
U.S., Germany and Italy
% of population age 65 or older
In 2015,
Germany and Italy are already at a level the U.S. may reach in 2050.
The United States is turning gray, with the number of people
ages 65 and older expected to nearly double by 2050. This major demographic transition has
implications for the economy, government programs such as Social Security and
families across the U.S. Among adults with at least one parent 65 or older,
nearly three-in-ten already say that in the preceding 12 months they have
helped their parents financially. Twice that share report assisting a parent
with personal care or day-to-day tasks. Based on demographic change alone, the
burden on families seems likely to grow in the coming decades.
Germany and Italy, two of the “oldest” nations in the
world, after only Japan, are already where the U.S. will be in 2050: a fifth of
the population in each country is age 65 or older. Compared with the U.S.
today, a higher share of adults in Germany and Italy report helping their aging
parents with basic tasks, and more in Italy have also provided personal care.
However, in both countries, fewer adults than in the U.S. say they have
provided financial assistance to their aging parents.
The latter difference underscores that, while
Germany and Italy may provide a window into the demographic future of the
United States, cultural and political factors nonetheless distinguish the three
countries. Nothing speaks to this more than the fact that, compared with
Americans, twice as many Germans and even more Italians think the government
should bear the greatest responsibility for people’s economic well-being in
their old age. By contrast, in the U.S. a majority say that families or
individuals themselves should see to the well-being of seniors.
These are among the key findings from a new survey by the
Pew Research Center that compares the way families in the U.S., Germany and
Italy are coping as more people enter their senior years and eventually require
assistance. Based on interviews with at least 1,500 adults ages 18 and
older in each country, the survey also finds that many families are facing
the dual challenge of caring for aging parents while also supporting adult
children. In the U.S., Germany and Italy, about half or more of adults who have
at least one child 18 years of age or older say they have provided financial
help to an adult child in the 12 months preceding the survey; at least as many
in each country have assisted grown children in non-monetary ways.
Notably, in all three countries, financial help is more
likely to flow down to adult children than up to aging parents. However, when
it comes to “sweat equity,” about as many in each country are assisting
senior-age parents with their needs as are helping adult children with child
care, errands, housework and other day-to-day tasks.
Widespread Concerns
About the Future of Social Security
Even as about half or more of Italians and Germans say
the state should be mostly responsible for ensuring financial stability in old
age, many in all three countries surveyed are skeptical that there will be
enough money in their countries’ social security systems when they retire to
provide benefits, even at a reduced level. All three systems are financed
through worker contributions and, in Europe more than in the U.S., the growing
number of older adults along with a shrinking pool of younger active
contributors has made it difficult to fund pensions for current retirees.
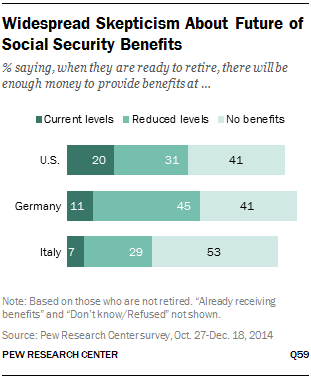 Among those who have not yet retired, only 20% of
Americans expect the Social Security system to have enough money when they are
ready to retire to provide them with benefits at current levels. An additional
31% say they expect to receive benefits at reduced levels, and 41% think they will receive no benefits at all.
Among those who have not yet retired, only 20% of
Americans expect the Social Security system to have enough money when they are
ready to retire to provide them with benefits at current levels. An additional
31% say they expect to receive benefits at reduced levels, and 41% think they will receive no benefits at all.
Germans and Italians are even more doubtful that their
countries’ social security systems will be able to maintain their current
levels of support. In Germany, 11% think they will receive benefits from the
Gesetzliche Rentenversicherung (Germany’s equivalent to the U.S. Social
Security system) at current levels, 45% think they will receive benefits at
reduced levels, and 41% expect to get no benefits at all. Among Italians, only
7% believe there will be enough money in the Previdenza Sociale to provide them
with benefits at their current levels, 29% expect benefits but at reduced
levels, and fully 53% think they will not get any benefits.
Few Italians Saving
for Retirement
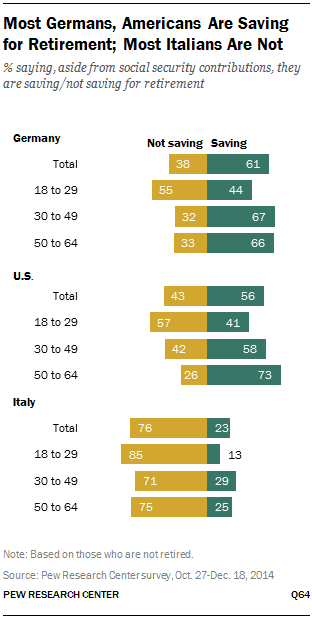 If government benefits are reduced or
not available, future retirees will need to rely even more heavily on their own
personal savings. More than half of Americans (56%) and Germans (61%) who
are not retired say they are putting money in a private retirement plan or
other savings account aside from social security contributions. But in Italy,
just 23% say they are doing this; fully 76% say they are not saving for
retirement.
If government benefits are reduced or
not available, future retirees will need to rely even more heavily on their own
personal savings. More than half of Americans (56%) and Germans (61%) who
are not retired say they are putting money in a private retirement plan or
other savings account aside from social security contributions. But in Italy,
just 23% say they are doing this; fully 76% say they are not saving for
retirement.
In all three countries, majorities of young adults ages
18 to 29 say they are not currently saving for retirement aside from social
security contributions. Still, a substantial share of young adults in Germany
(44%) and the U.S. (41%) say they are saving for retirement. By comparison,
only 13% of young adults in Italy say they are saving for retirement. And even
among Italians ages 50 to 64 –those who are closest to retiring – only 25% say
they are putting money in a private retirement plan or other private
savings account.
Men and women are equally likely to say they are saving
for retirement, whether in the U.S., Germany or Italy. And across all three
countries, saving for retirement is highly correlated with financial security.
Those who say they live comfortably are among the most likely to report that
they are saving for retirement beyond what they are contributing to social security,
while those who say they do not have enough money to meet their basic expenses
are among the least likely to be saving.
In fact, most adults who are not saving for retirement
report that this is mainly because they do not have enough money to save right
now, while relatively few say it is because they have not yet started to think
about retirement. About two-thirds of Americans and Italians who are not
currently saving for retirement say this is mainly because they lack the funds,
as do about half in Germany.
Most See Helping an
Aging Parent as a Responsibility
In addition to relying more heavily on private savings,
future retirees may also need to turn to family members for support as they
age. Majorities across the three countries believe adult children have a
responsibility to provide financial assistance to an aging parent in need. Many
also see providing financial support for adult children as a responsibility,
while far fewer say the same about providing childcare for grandchildren or
saving money to hand down to their children after they die.
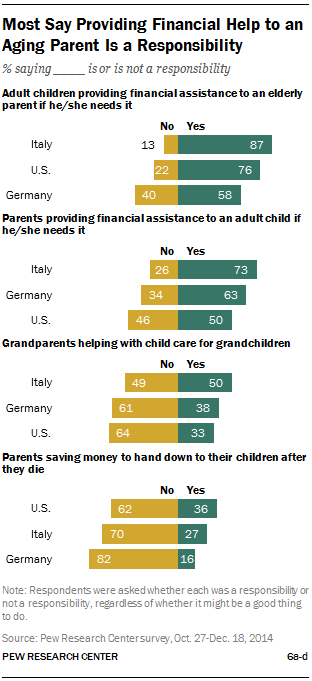 About three-quarters or more in Italy (87%) and the U.S.
(76%) view providing financial assistance to aging parents in need as a
responsibility, as do 58% in Germany. Young Americans and Germans are more
likely than older people in their countries to say adult children have a
responsibility to help aging parents in need; 86% of 18- to 29-year-olds in the
U.S. and 76% in Germany see this as a responsibility, compared with 64% of
Americans and 57% of Germans ages 65 and older.
About three-quarters or more in Italy (87%) and the U.S.
(76%) view providing financial assistance to aging parents in need as a
responsibility, as do 58% in Germany. Young Americans and Germans are more
likely than older people in their countries to say adult children have a
responsibility to help aging parents in need; 86% of 18- to 29-year-olds in the
U.S. and 76% in Germany see this as a responsibility, compared with 64% of
Americans and 57% of Germans ages 65 and older.
Similar shares of Italians across age groups see helping
an aging parent in need as a responsibility but, unlike in the U.S. and
Germany, there are differences in how younger and older Italians perceive
support to grown children. More than eight-in-ten (85%) Italians ages 65 and
older say providing financial support to an adult child in need is a
responsibility, compared with 58% of 18- to 29-year-olds. Overall, 73% of
Italians and 63% of Germans say parents have a responsibility to help an adult
child financially if needed; half of Americans share this view.
When asked about helping with child care for
grandchildren, half of Italians see it as a responsibility; about four-in-ten
(38%) Germans and one-third of Americans say this is the case. And while
Americans are somewhat more likely than Italians and Germans to say parents
have a responsibility to leave behind an inheritance, relatively few in each
country say so (36%, 27% and 16%, respectively).
More Are Giving
Time Rather than Money to Help Aging Parents
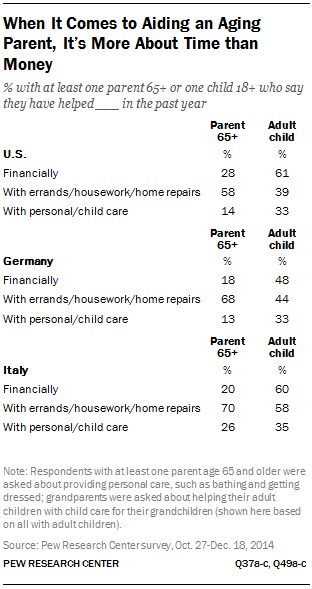 Assistance to aging parents and to
adult children takes on many forms, but in all three countries, more say they
are helping their aging parents with errands, housework or home repairs than
say they are providing financial help or help with personal care, such as
helping them bathe or get dressed. The pattern of support to adult children is
less consistent across countries.1
Assistance to aging parents and to
adult children takes on many forms, but in all three countries, more say they
are helping their aging parents with errands, housework or home repairs than
say they are providing financial help or help with personal care, such as
helping them bathe or get dressed. The pattern of support to adult children is
less consistent across countries.1
Seven-in-ten Italians (70%) say they have helped an aging
parent with errands, housework or home repairs in the 12 months preceding the
survey, while about a quarter or fewer say they have provided help with
personal care (26%) or finances (20%). Similarly, 68% of Germans with an aging
parent have helped with errands, housework or home repairs, but half as many as
in Italy have assisted a parent with personal care; 13% in Germany have done
this. As in Italy, about one-in-five Germans (18%) have helped an aging parent
financially.
In the U.S., about six-in-ten (58%) have assisted an
aging parent with errands, housework or home repairs in the preceding 12
months. About three-in-ten (28%) say they have helped financially, while half
as many (14%) say they have helped a parent with personal care, such as bathing
or getting dressed.
In the three countries surveyed, more say they have given
financial help to an adult child in the preceding 12 months than say they have
similarly helped an aging parent. About six-in-ten (61%) Americans with at
least one grown child say they have given their children at least some
financial support, far more than say they have helped their children with
errands, housework or home repairs (39%) or with child care (33%).
In Italy and Germany, about as many say they have helped
their children financially as say they have helped with errands, housework or
home repairs. About six-in-ten Italians with an adult child say they have
provided each type of assistance in the preceding 12 months; among Germans, 48%
say they have helped a grown child financially and 44% say they have helped
with errands, housework or home repairs. About a third of Italians (35%) and
Germans (33%) with grown children have helped with child care.
The Sandwich
Generation
About three-in-ten (31%) adults in
Italy, 23% of Americans and 19% of Germans overall are “sandwiched” between
their children and their parents – that is, they have one or two parents age 65
or older and are either raising a young child or have provided financial
assistance to a grown child in the preceding 12 months. Among those in their
40s and 50s, much larger shares are in this situation.
Fully 64% Italians in their 40s and 50s have a parent age
65 or older and are either raising a young child or have provided financial
assistance to a grown child in the preceding 12 months. Nearly half of
Americans (47%) and 41% of Germans in the same age group are also sandwiched between
their children and aging parents.
Despite the added demand on this group, many of whom are
providing financial and other help to both an aging parent and an adult child,
those who are part of the sandwich generation are as likely as other adults to say
they are generally happy with their lives and to express high levels of
satisfaction with their family life, the number of friends they have, the
quality of life in their community and their present housing situation. They
are also no more likely than other adults to say helping an aging parent is
stressful. In the U.S., however, those who are sandwiched between generations
are more likely to say helping an adult child is stressful than those who have
provided financial help to an adult child but are not part of the sandwich
generation; this is not the case in Germany and Italy.
The remainder of this report looks at demographic shifts
in the U.S., Germany and Italy and family support for younger and older
generations. Chapter 1 examines the age structures in the three countries and
the financial profiles of the younger and older generations. Chapter 2 looks at
public attitudes about the type of intergenerational support families have a
responsibility to provide. Chapter 3 explores the experiences of American,
German and Italian adults ages 65 and older, including what they see as
advantages and disadvantages of getting old. Chapters 4 and 5 focus on people’s
personal experiences caring for aging parents and helping adult children. And
Chapter 6 examines the frequency and modes of communication across generations.
Other Key Findings
In the three countries surveyed, more say that helping an
aging parent or an adult child is rewarding than say it is stressful. More than eight-in-ten adults who are providing help to a
parent age 65 or older in the U.S. (88%), Italy (88%) and Germany (84%) say
that doing so is rewarding, while about a third or less in each country find it
stressful. Similarly, among those who are helping their grown children, 91% in
Italy, 89% in the U.S. and 86% in Germany say that it is rewarding; 12%, 30%
and 15%, respectively, say it is stressful.
Many see upsides to getting older. More than six-in-ten adults ages 65
and older in the U.S., Germany and Italy say they are spending more time with
their family and on hobbies as they get older. About half or more also say they
are experiencing less stress.
Older adults who are married are more likely than those
who are not currently married to say they are very satisfied with their family
life. This is the case among adults ages 65
and older in the three countries surveyed, but it is particularly pronounced in
Italy and Germany, where older adults who are married are about twice as likely
as those who aren’t to say they are very satisfied with their family life (50%
vs. 26% in Italy and 70% vs. 35% in Germany).
Nearly half of Italians say an adult child is living with
them in their home for most of the year. Among Italians ages 50 to 64,
six-in-ten say this is the case. In contrast, 30% of Americans and 27% of
Germans in the same age group say an adult child – or possibly more than one –
lives with them.
Seven-in-ten Italians say they are in contact at least
once a day with their adult children who don’t live with them. Fewer in the U.S. (46%) and Germany
(32%) say this is the case. Among those who say they are contact with their
children once a month or more frequently, Americans are more likely than
Germans and Italians to use text messages, email and Facebook or other social
networking sites to stay in touch.
Job Market Optimism Up Sharply in Northern America,
Europe
May 21, 2015
WASHINGTON, D.C. -- Although global job prospects remained glum in 2014,
slightly more than one in three adults worldwide (36%) said it was a "good
time" to find a job in their communities, which is up two percentage
points from the previous year. Optimism was highest in Northern
America (51%) and lowest in the European Union (25%). Both regions experienced
the largest year-over-year improvements in the world.
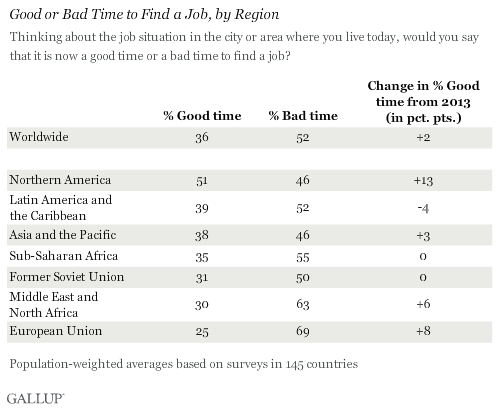
These data were collected throughout 2014 in 145 countries and may not
reflect some of changes that have occurred since that time, such as ongoing
declines in unemployment rates in the U.S. Northern America's 13-point increase
was the largest positive change in the world, followed by the EU's eight-point
increase and the Middle East and North Africa's six-point gain.
Meanwhile, the percentage saying it was a good time to find a job inched
up three points to 38% in Asia and the Pacific region, which was the only
region that didn't have a majority viewing it as a "bad time" to find
a job. The jobs outlook in sub-Saharan Africa and the former Soviet Union
remained unchanged.
Opposing Trends: Big Gains in Northern America While
Latin America Dips
The jobs outlook in Northern America was notably rosier than that in
Latin America and the Caribbean for the first time since the global economic
downturn in 2008, and it marked the first time that a majority of residents in
Northern America said it was a good time to find a job in their areas. In Latin
America and the Caribbean, the four-point decrease in the percentage saying it
was a good time to find a job led to the region's worst jobs outlook since
2010.
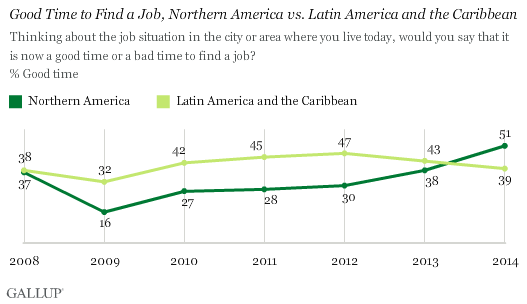
A souring jobs outlook in five of Latin America's six most populous
nations -- Brazil, Mexico, Colombia, Argentina and Venezuela -- largely drove
the dip in the percentage saying it was a good time to find a job in the
region. Majorities of residents in only three Latin American countries had a
positive outlook on job prospects in their areas: Panama (60%), Paraguay (54%)
and Bolivia (51%). In 2013, Panama was the only Latin American nation with a
majority holding this view and saw no change in its figure in the following
year. Paraguay and Bolivia, however, saw seven- and six-point improvements,
respectively, in that time.
Meanwhile, the jobs outlook in Northern America improved significantly.
This is largely attributable to the 14-point increase in the percentage saying
it was a good time to find a job in the U.S., likely reflecting a surging stock
market, economic growth and a falling unemployment rate. Last year marked the
first time in Gallup's tracking that U.S. job market optimism has matched that
in Canada.
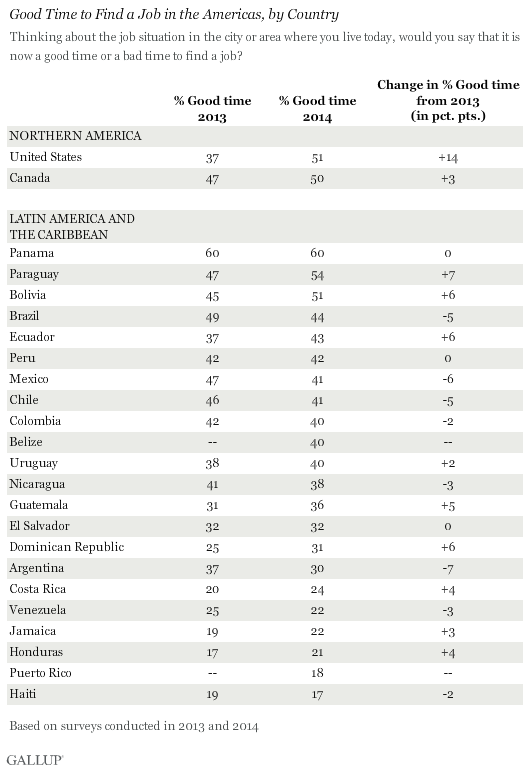
Most EU Nations Experience Improvements in Job Market
Outlook
One in four EU residents said it was a good time to find a job in their
area in 2014 -- the best outlook the region has had since the global economic
collapse in 2008. Double-digit increases in eight countries, led by Ireland
(+30) and the United Kingdom (+26), boosted the "good time"
percentage from a dismal 17% in 2013. There were no declines in any EU member
states, which is also positive news. But in some countries, such as Italy where
3% said it was a good time to find a job, it would have been difficult for
outlooks to have been much worse.
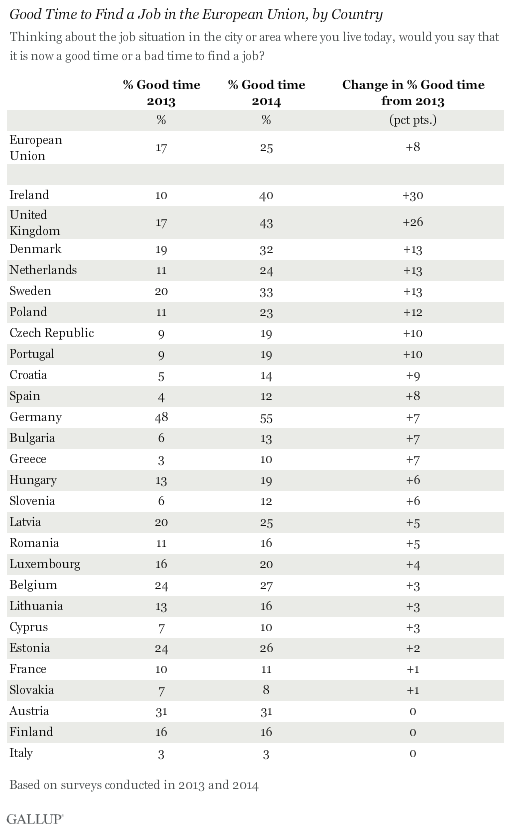
Germans remained the most optimistic in the EU, with the seven-point
boost in 2014 making it the only country where a majority of residents were
optimistic about the current job market. Notably, the jobs outlook in troubled
Greece also improved by seven points. Attitudes in Spain and Portugal, which
also suffered during the recent European sovereign debt crisis, were up eight
and 10 points, respectively.
Bottom Line
Worldwide, the jobs outlook continues to inch slowly higher after
bottoming out at 25% in 2009. Still, a slight majority of people in the world
view the job market pessimistically. Improvements in the employment outlook in
the EU -- which has arguably had nowhere to go but up after years of dour
levels of optimism -- are a welcomed sign that the region is in the process of
recovering.
Northern Americans led the world in job optimism in 2014. Several key
economic factors -- including increased economic confidence and lower
unemployment in the U.S. -- have most likely made Northern American residents
much more hopeful about their jobs outlook into 2015.
The data in this article are available in Gallup Analytics.
Survey Methods
Results are based on face-to-face and telephone interviews with
approximately 1,000 adults, aged 15 and older, conducted throughout 2013 in 130
countries and 2014 in 145 countries. For results based on the total samples
margin of sampling error ranges from ±2.5 percentage points to ±5.2 percentage
points at the 95% confidence level. The margin of error reflects the influence
of data weighting. In addition to sampling error, question wording and
practical difficulties in conducting surveys can introduce error or bias into
the findings of public opinion polls.
With some exceptions, all samples are probability based and nationally
representative of the resident population aged 15 and older.
Exceptions include areas where the safety of interviewing staff is
threatened, scarcely populated islands in some countries, and areas that
interviewers can reach only by foot, animal, or small boat.