BUSINESS & POLITICS IN THE MUSLIM WORLD
Global Opinion Report No. 402
October 11 - 17, 2015
Presentation: October 21, 2015
M.
Zubair Khan
Contents
76% of MENASA residents
would pay more for Halal holidays and the UAE is their destination of choice
Russia: What Do We Know
About The State Of Environment?
UK: Hoverboards look like
fun – but keep them off the pavements
Americans' Desire for
Stricter Gun Laws Up Sharply
Americans' Favorable
Ratings of Pope Up After U.S. Visit
U.S. Employee Engagement
Steady in September, at 32%
Solid Majority Continue
to Support Death Penalty
Boehner Image Slightly
Better After Resignation Announcement
Biden Maintains Positive
Image
In U.S., 59% View Planned
Parenthood Favorably
Brazilian perception of
the crisis is worse in 2015 than in 1999
Internet banking growth
and satisfaction outstrips other channels
One in three across the
world don’t always wash their hands properly after going to the toilet
Ipsos "Sustainable
Future Attitude Survey" Newly Released
Europeans Most Negative
Toward Immigration
New global poll reveals
the top 5 workplace challenges facing G20 women
INTRODUCTORY
NOTE
This week report consists of twenty surveys. Four of these are
multi-country surveys while the rest are national studies from different states
across the world.
402-43-21 Commentary: 76% of MENASA residents would pay
more for Halal holidays and the UAE is their destination of choice
76% of MENASA
residents would pay more for Halal holidays and the UAE is their destination of
choice
October 2015
 Halal tourism is
geared towards Muslim families where leisure destinations offer holidays in
accordance with Islamic beliefs and practices. Despite relatively low awareness
of the Halal holiday concept (only 29% across the Middle East, North Africa and
South Asia), when prompted, three quarters of respondents claim it is important
for their leisure destination to offer a Halal holiday, with 51% claiming it is
‘extremely important’.
Halal tourism is
geared towards Muslim families where leisure destinations offer holidays in
accordance with Islamic beliefs and practices. Despite relatively low awareness
of the Halal holiday concept (only 29% across the Middle East, North Africa and
South Asia), when prompted, three quarters of respondents claim it is important
for their leisure destination to offer a Halal holiday, with 51% claiming it is
‘extremely important’.
According to the YouGov Travel
Oracle, of those that are aware of the concept of Halal tourism, respondents in
Tunisia were the most likely to be aware (54%). Those respondents residing in
Iraq were the least likely to be aware (15%).
The research, which interviewed
22,868 respondents online from across the Middle East, North Africa and South
Asia about their attitudes to Halal tourism, also reveals just over
three-quarters of respondents who are interested in the concept would pay more
for a Halal holiday than a standard holiday that doesn’t accommodate religious
considerations. Residents from Yemen are the most willing to pay more (81%),
followed by Algeria, Pakistan (both 80%) and Sudan (79%).
The popularity of the concept
amongst a population that is largely unaware exposes the essentially un-tapped
market for travel destinations accommodating people’s religious beliefs. Those
most in favor of Halal holidays and who claimed it was 'extremely important' to
them included respondents in Algeria (73%), Sudan (65%) and Yemen (64%). The
concept was least important among those residing in Lebanon, 34% of whom
claimed it was 'extremely unimportant'.
Currently, of those respondents
interested in Halal holidays, the largest proportion claim the country they
most closely associate with the concept is Saudi Arabia, however interestingly
when asked which country they would be most interested to see develop Halal
holiday destinations, the largest proportion chose the UAE - making it the
number one destination of choice for the development of Halal holidays across
the region, followed by Saudi Arabia.
When considering the most
important features of a Halal holiday, 64% of respondents claim that prayer
spaces are the most essential attribute. The provision of Halal food was the
second most essential attribute according to 63% of respondents, followed by
being alcohol-free (51%). Modestly dressed staff and women-only swimming pools
were also highly important according to 35% and 31% of respondents
respectively.
With such a high proportion of
the sample demonstrating their attraction to the concept of Halal tourism, and
only 29% aware of it, this data demonstrates the outstanding potential of
religious-focused holidays in travel destinations looking to appeal to
consumers right on their doorstep. The fact that many see the UAE as a
destination of choice for Halal holidays and a large majority are willing to
dig deeper into their pockets to experience them shows the commercial potential
that could be unlocked by focusing on providing Halal-friendly offerings.
Research conducted online by
the YouGov Travel Oracle among 22,868 respondents in the Middle East, North Africa
and South Asia, between 27th September and 14th October 2015. Data is broadly representative of the adult
urban online population in the Middle East, North Africa and South Asia.
SUMMARY
OF POLLS
MENA
76% of MENASA residents would pay more for
Halal holidays and the UAE is their destination of choice
Halal tourism is geared towards Muslim families where leisure
destinations offer holidays in accordance with Islamic beliefs and practices.
Despite relatively low awareness of the Halal holiday concept (only 29% across
the Middle East, North Africa and South Asia), when prompted, three quarters of
respondents claim it is important for their leisure destination to offer a
Halal holiday, with 51% claiming it is ‘extremely important’. (YouGov
Siraj)
October 2015
SOUTHEAST ASIA
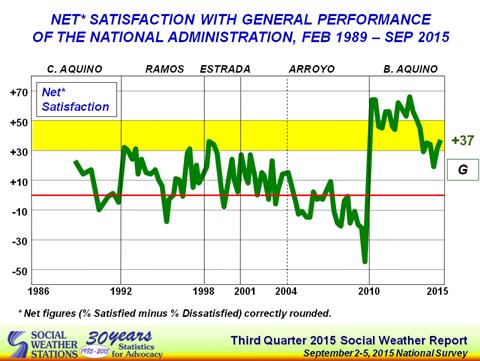
Philippines: Net satisfaction with
National Administration rises to "Good" +37
The Third Quarter 2015 Social Weather Survey, fielded from September
2-5, 2015, found 59% of adult Filipinos satisfied, 18% neither satisfied nor
dissatisfied, and 22% dissatisfied with the general performance of the National
Administration, for a net satisfaction rating of +37 (% satisfied minus %
dissatisfied), classified by SWS as good. (SWS)
October 13, 2015
EAST EUROPE
IRI Ukraine Poll: Interest is High in
October 25 Local Elections Amid Pessimism about Pace of Reforms
A new poll released by IRI found high voter enthusiasm
ahead of the upcoming October 25 local elections, a continuing frustration over
the pace of reforms and a troubling lack of understanding about the reforms
being pursued. The poll also found increased public support for NATO
membership. (Rating group/IRI)
OCTOBER 14, 2015
Russia: What Do We Know About The
State Of Environment?
The level of awareness of Russians concerning the environmental
situation in their communities is extremely low. At the same time, 80% of
respondents express their interest to know more about it. (VCIOM)
October 1, 2015
WEST EUROPE
Food waste and date marking
The majority of Europeans recognise that they themselves have a role to
play in preventing food waste. Over three quarters (76%) of Europeans think
that the individual consumer is one of the actors involved in the prevention of
food waste, compared with less than a half (49%) who consider that the state
has a role to play. (Eurobarometer)
October 2015
UK: Hoverboards look like fun – but
keep them off the pavements
Most British people say ‘self-balancing scooters’ look like good fun
rather than a bit ridiculous – but there is broad support for a ban on public
roads. (YouGov)
October 16, 2015
NORTH AMERICA
Americans' Desire for Stricter Gun
Laws Up Sharply
Fifty-five percent of Americans say they want laws covering the sale of
firearms to be stricter than they are now, a distinct rise of eight percentage
points from 2014. Fewer Americans than last year want the laws to be less
strict, and the proportion who want the laws to stay the same has also declined
slightly. (Gallup USA)
October 19, 2015
Americans' Favorable Ratings of Pope
Up After U.S. Visit
Pope Francis enjoyed a double-digit boost to his favorability after his
September visit to the U.S. Seventy percent of Americans now view him favorably
-- up from 59% in July. The latest rating is closer to the 76% measured in
early 2014. (Gallup USA)
October 16, 2015
U.S. Employee Engagement Steady in
September, at 32%
In the U.S., 32% of workers were engaged in their jobs in September.
While engagement remains higher than it was from 2011-2013, monthly figures
have not wavered since the beginning of 2015 -- consistently trending between
31% and 32%. The lone exception was in February, when the monthly employee
engagement average was 32.9%. (Gallup USA)
October 16, 2015
Solid Majority Continue to Support
Death Penalty
About six in 10 Americans favor the use of the death penalty for a
person convicted of murder, similar to 2014. This continues a gradual decline
in support for the procedure since reaching its all-time high point of 80% in
1994. (Gallup USA)
October 15, 2015
Boehner Image Slightly Better After
Resignation Announcement
Americans' opinions of House Speaker John Boehner are still negative,
but they have improved since he announced last month that he would resign his
position. Currently, 31% of Americans have a favorable opinion of Boehner, up
from 23% in August. This is his best reading since April 2014. (Gallup USA)
October 15, 2015
Biden Maintains Positive Image
As Vice President Joe Biden continues to ponder whether to enter the
2016 Democratic nomination campaign, Americans' views of him are more positive
(49%) than negative (37%). These views are similar to what Gallup found in its
prior update from August and continue to be improved from Americans' divided opinions
of Biden through most of his term as vice president. (Gallup USA)
October 14, 2015
In U.S., 59% View Planned Parenthood
Favorably
A majority of Americans, 59%, view Planned Parenthood favorably.
Although still positive overall, Americans' current opinions of Planned
Parenthood are considerably less favorable than they were in 1993 -- the last
time Gallup asked about the organization -- when 81% viewed it favorably.
(Gallup USA)
October 14, 2015
Canada - Election 2015: Liberals edge
Conservatives as volatile electorate mulls final choice before last campaign
weekend
Election 2015 enters its final weekend with the Liberal Party of Canada
(LPC) holding a four point advantage in popular support over the Conservatives
(CPC) among eligible voters. (Angus Reid)
October 16, 2015
LATIN AMERICA
Brazilian perception of the crisis is
worse in 2015 than in 1999
Estudo compara indicadores econômicos e opiniões da população sobre o
governo federal nos anos de reeleição de FHC e Dilma Study compares economic
indicators and population opinions on the federal government during the Cardoso
years and re-election of Dilma. (Ibope)
October 2015
AUSTRALASIA
Internet banking growth and satisfaction outstrips other channels
The proportion of bank customers using the internet ( both via website
or mobile) to deal with their bank in an average four week period has now grown
to 62.2%, well ahead of the more traditional branch, now only used by 32.3%.
The satisfaction level of internet banking is 90.2%, compared to branches with
88.4%. (Roy Morgan)
October 2015
MULTI-COUNTRY SURVEYS
One in three across the world don’t
always wash their hands properly after going to the toilet
A global survey from WIN/Gallup International, the world’s leading
association in market research and polling shows that 65% of those polled
across 64 countries‘agree’ that washing their hands with soap and water is
something they automatically do – however 26% somewhat agree, while just under
one in ten (8%) disagree. (WIN/GIA)
October 2015
Ipsos "Sustainable Future
Attitude Survey" Newly Released
On the eve of the UN General Assembly, the United Nations will generate
new sustainable development goals, to succeed its Millennium Development Goals.
For this reason, Ipsos launched a survey on foreign aid and sustainable
development goals among people in 17 countries in the world (both traditional
and emerging donors). (Ipsos Mori)
October 09, 2015
Europeans Most Negative Toward
Immigration
Well before the flow of migrants into Europe reached crisis proportions
this year, a Gallup study of attitudes toward immigration in 142 countries
found people in Europe, on average, were the most negative in the world toward
immigration. The majority of residents (52%) said immigration levels in their
countries should be decreased. In every other major region of the world, people
were more likely to want immigration levels in their countries to either stay
at their present level or to increase, rather than to decrease. (Gallup USA)
October 16, 2015
New global poll reveals the top 5
workplace challenges facing G20 women
A new poll by Ipsos MORI carried out across the G20 reveals the top
challenges faced by women in the workplace. The survey, which was conducted on
behalf of the Thomson Reuters Foundation, asked women across G20 countries what
top five challenges they feel they face at work. The results show that
work-life balance is the most mentioned issue. This is followed by equal pay
and having the same career opportunities as men. Harassment by co-workers was
also mentioned key issue in our survey and nearly one in three G20 women say
they have been harassed at work. (Ipsos
Mori)
October 16, 2015
MENA
76%
of MENASA residents would pay more for Halal holidays and the UAE is their
destination of choice
Halal
tourism is geared towards Muslim families where leisure destinations offer
holidays in accordance with Islamic beliefs and practices. Despite relatively
low awareness of the Halal holiday concept (only 29% across the Middle East,
North Africa and South Asia), when prompted, three quarters of respondents
claim it is important for their leisure destination to offer a Halal holiday,
with 51% claiming it is ‘extremely important’.
According to
the YouGov Travel Oracle, of those that are aware of the concept of Halal
tourism, respondents in Tunisia were the most likely to be aware (54%). Those
respondents residing in Iraq were the least likely to be aware (15%).
The research,
which interviewed 22,868 respondents online from across the Middle East, North
Africa and South Asia about their attitudes to Halal tourism, also reveals just
over three-quarters of respondents who are interested in the concept would pay
more for a Halal holiday than a standard holiday that doesn’t accommodate
religious considerations. Residents from Yemen are the most willing to pay more
(81%), followed by Algeria, Pakistan (both 80%) and Sudan (79%).
The
popularity of the concept amongst a population that is largely unaware exposes
the essentially un-tapped market for travel destinations accommodating people’s
religious beliefs. Those most in favor of Halal holidays and who claimed it was
'extremely important' to them included respondents in Algeria (73%), Sudan
(65%) and Yemen (64%). The concept was least important among those residing in
Lebanon, 34% of whom claimed it was 'extremely unimportant'.
Currently,
of those respondents interested in Halal holidays, the largest proportion claim
the country they most closely associate with the concept is Saudi Arabia,
however interestingly when asked which country they would be most interested to
see develop Halal holiday destinations, the largest proportion chose the UAE -
making it the number one destination of choice for the development of Halal
holidays across the region, followed by Saudi Arabia.
When
considering the most important features of a Halal holiday, 64% of respondents
claim that prayer spaces are the most essential attribute. The provision of Halal
food was the second most essential attribute according to 63% of respondents,
followed by being alcohol-free (51%). Modestly dressed staff and women-only
swimming pools were also highly important according to 35% and 31% of
respondents respectively.
With such a
high proportion of the sample demonstrating their attraction to the concept of
Halal tourism, and only 29% aware of it, this data demonstrates the outstanding
potential of religious-focused holidays in travel destinations looking to
appeal to consumers right on their doorstep. The fact that many see the UAE as
a destination of choice for Halal holidays and a large majority are willing to
dig deeper into their pockets to experience them shows the commercial potential
that could be unlocked by focusing on providing Halal-friendly offerings.
Research
conducted online by the YouGov Travel Oracle among 22,868 respondents in the Middle
East, North Africa and South Asia, between 27th September and 14th October 2015. Data is broadly
representative of the adult urban online population in the Middle East, North
Africa and South Asia.
SOUTHEAST
ASIA
402-43-2.
Philippines: Net satisfaction with
National Administration rises to "Good" +37
Third
Quarter 2015 Social Weather Survey:
The
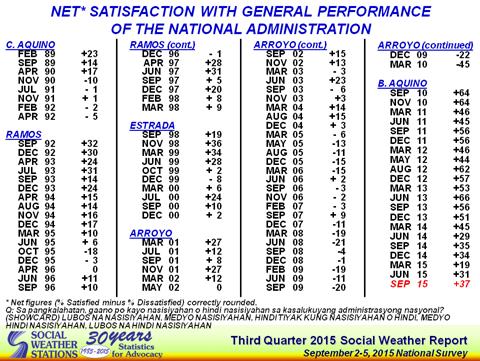
Third Quarter 2015 Social Weather Survey, fielded from September 2-5, 2015,
found 59% of adult Filipinos satisfied, 18% neither satisfied nor dissatisfied,
and 22% dissatisfied with the general performance of the National Administration,
for a net satisfaction rating of +37 (% satisfied minus % dissatisfied),
classified by SWS as good [Chart 1, Tables 1 and 2].
This
is 6 points above the good +31 (55% satisfied, 24% dissatisfied) in June 2015,
and the highest since +45 in March 2014.
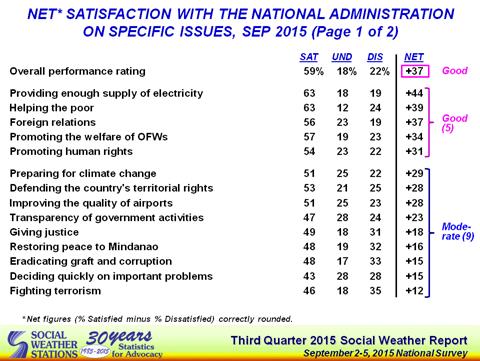
Good on 5 issues, moderate on
9 issues, neutral on 8 issues, and bad on 1 issue
Out
of 23 specific performance issues rated, the National Administration got net
satisfaction ratings of good on 5 issues, moderate on 9 issues, neutral
on 8 issues, and bad on 1 issue.
The
net satisfaction rating of the National Administration was good on: Providing
enough supply of electricity (+44), Helping the poor (+39), Foreign
relations (+37), Promoting the welfare of OFWs (+34), and Promoting
human rights (+31) [Charts 2 to 6].
It
was moderate on: Preparing for climate change (+29), Defending
the country's territorial rights (+28), Improving the quality of
airports (+28), Transparency of government activities (+23), Giving
justice (+18), Restoring peace to Mindanao (+16), Eradicating
graft and corruption (+15), Deciding quickly on important problems
(+15), and Fighting terrorism (+12) [Charts 7 to 14].
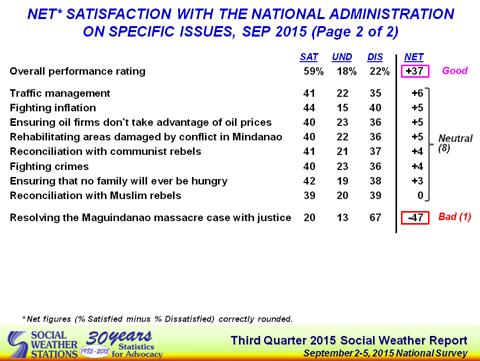
It
was neutral on: Traffic management (+6), Fighting inflation
(+5), Ensuring oil firms don't take advantage of oil prices (+5), Rehabilitating
areas damaged by conflict in Mindanao (+5), Reconciliation with
Communist rebels (+4), Fighting crimes (+4), Ensuring that no
family will ever be hungry (+3), and Reconciliation with Muslim rebels (net
zero) [Charts 15 to 22].
It
was bad on Resolving the Maguindanao massacre case with justice
(-47) [Chart 23].
Government's
net rating rises by one grade on 5 issues, and steady on 15 issues
The
National Administration's net satisfaction rating rose by one grade on 5
specific issues, remained steady on 15 specific issues, and fell by one grade
on 3 specific issues.
Compared
to June 2015, the National Administration's net satisfaction rating stayed good
on Providing enough supply of electricity and Helping the poor,
unchanged from +44 and +39, respectively [Table 3].
It
also stayed good on Foreign relations, hardly moving from +38,
and Promoting the welfare of OFWs, hardly moving from +32.
However,
it fell by one grade from very good to good on Promoting human
rights, down by 19 points from +50 in March 2012.
It
rose by one grade from neutral to moderate on Eradicating
graft and corruption, up by 14 points from +1 in June 2015.
Compared
to June 2015, it stayed moderate on Deciding quickly on important
problems, up by 4 points from +11, Defending the country's territorial
rights, hardly moving from +27, Giving justice, hardly moving from
+19, and Fighting terrorism, hardly moving from +13.
It
stayed moderate on Restoring peace to Mindanao, although down by
7 points from +23 in June 2015.
It
also stayed moderate on Preparing for climate change, unchanged
from +29 in March 2015.
However,
it fell by one grade from good to moderate on Transparency of
government activities, down by 21 points from +44 in August 2012.
Rated
for the first time, the issue on Improving the quality of airports
obtained a moderate +28.
Compared
to June 2015, the National Administration's net satisfaction rating rose by one
grade from poor to neutral on Ensuring oil firms don't take
advantage of oil prices, up by 21 points from -17, and the highest since
the moderate +13 in August 2012.
It
rose by one grade from poor to neutral on Fighting inflation,
up by 16 points from -11, and the highest since the moderate +19 in
August 2012.
It
also rose by one grade from poor to neutral on Ensuring that
no family will ever be hungry, up by 16 points from -12, and the highest
since the moderate +26 in August 2012.
Compared
to June 2015, it stayed neutral on Reconciliation with Communist
rebels and Rehabilitating areas damaged by conflict in Mindanao,
unchanged from +4 and +5, respectively.
It
also stayed neutral on Fighting crimes, hardly moving from +5,
and Reconciliation with Muslim rebels, hardly moving from +1.
However,
it fell by one grade from moderate to neutral on Traffic
management, down by 4 points from +10 in March 2002.
It
rose by one grade from very bad to bad on Resolving the
Maguindanao massacre case with justice, up by 3 points from -50 in June
2015.
Good
in
Balance Luzon, Visayas and Mindanao, Moderate in Metro Manila
Compared
to June 2015, the National Administration's net satisfaction rating rose by one
grade from moderate to good in Balance Luzon. It stayed good
in Mindanao and Visayas, and stayed moderate in Metro Manila.
The
National Administration's net satisfaction rating rose by one grade from moderate
to good in Balance Luzon, up by 15 points from +29 in June to +44 in
September [Chart 24, Table 4].
It
stayed good in Mindanao, unchanged from +34.
It
also stayed good in the Visayas, although down by 10 points from +43 in
June to +34 in September.
It
stayed moderate in Metro Manila, up by 6 points from +18 in June to +24
in September.
Good
in
classes D and E, Moderate in class ABC
Compared
to June 2015, the National Administration's net satisfaction rating rose by one
grade from moderate to good in class D, while it stayed good in
class E. However, it fell by one grade from good to moderate in
class ABC.
It
rose by one grade from moderate to good in class D or the masa,
up by 9 points from +29 in June to +38 in September [Chart 25, Table 5].
It
stayed good in class E, up by 2 points from +38 to +40.
However,
it fell by one grade from by good to moderate in class ABC, down
by 12 points from +33 to +21.
Survey
Background
The
September 2015 Social Weather Survey was conducted from September 2-5, 2015
using face-to-face interviews of 1,200 adults nationwide, 300 each in Metro
Manila, Balance of Luzon, Visayas and Mindanao (sampling error margins of ±3%
for national percentages, and ±6% each for Metro Manila, Balance of Luzon,
Visayas and Mindanao).
The
area estimates were weighted by National Statistics Office medium-population
projections for 2015 to obtain the national estimates.
The
Social Weather Survey items on public satisfaction with the general performance
of the National Administration, and its performance on specific issues, are
non-commissioned. These items were included on SWS's own initiative and
released as a public service, with first printing rights assigned to BusinessWorld.
The
satisfaction rating with the general performance of the National Administration
is based on a single question, and is not an average of answers to separate
questions on specific issues. The general rating is repeated in every quarterly
survey, whereas only a core of the specific issue-ratings are repeated. Many
issue-ratings are either included or excluded depending on their contemporary
salience.
SWS
employs its own staff for questionnaire design, sampling, fieldwork,
data-processing, and analysis, and does not outsource any of its survey
operations.
[SWS
terminology for Net Satisfaction Ratings: +70 and above, "excellent";
+50 to +69, "very good"; +30 to +49, "good"; +10 to +29,
"moderate", +9 to -9, "neutral"; -10 to -29,
"poor"; -30 to -49, "bad"; -50 to -69, "very
bad"; -70 and below, "execrable"]. A single-digit net
satisfaction is considered not significantly different from zero.
#
Chart
1
Table
1
Table
2
Source: http://www.sws.org.ph/
EAST
EUROPE
IRI
Ukraine Poll: Interest is High in October 25 Local Elections Amid Pessimism
about Pace of Reforms
OCTOBER 14, 2015
Kyiv, Ukraine – A new
poll released by IRI found high voter enthusiasm ahead of the
upcoming October 25 local elections, a continuing frustration over the pace of
reforms and a troubling lack of understanding about the reforms being pursued.
The poll also found increased public support for NATO membership.
Interest is High in October 25 Local Elections
On October 25, Ukrainians across the country will go to the polls to elect
mayors and, regional and city councils. These elections are critical as
newly-elected officials will see increased authority if Parliament passes the
proposed decentralization law that is central to President Poroshenko’s reform
efforts.
Seventy-five percent of respondents said they were either
very likely or somewhat likely to vote in the elections, a 10 percent increase
since IRI’s July poll. Voter enthusiasm is highest in
western Ukraine, though strong majorities in eastern and southern Ukraine also
intend to vote (70 percent and 69 percent, respectively).
Continuing Frustration with Pace of Reforms
As in IRI’s previous poll, Ukrainians continued to express frustration with the
pace of change in their country. Sixty-eight percent believed that things
are going in the wrong direction, and only 11 percent approved of the job that
parliament is doing.
One possible explanation is the lack of information on
the contents of the government’s reform packages. When asked to evaluate
their knowledge of the decentralization/local governance amendments to the
constitution, only 12 percent of respondents believed they were well informed
of the reform contents. Similarly, only 12 percent believed the reforms
would improve the situation in Ukraine, compared to 15 percent who believed it
would worsen and 46 percent who believed it would not change anything.
“As with IRI’s July poll, this new poll underscores the
fact that Ukraine is at a critical juncture,” said Stephen Nix, director of
IRI’s Eurasia programs. “People’s frustration continues to grow with the
pace of and lack of information on reforms. If the government is going to
succeed in passing the reforms that so many demanded on the Maidan, they must
do more to reach out to voters and explain the reform package to citizens.”
In contrast to the confusion over the contents of
decentralization reform, the poll indicated overwhelming support for the police
reforms, with 75 percent supporting the introduction of new police in the
cities of Kyiv, Lviv and Odesa. “This is one of the first reforms that
Ukrainians can see and it is a clear example of how positively people respond
to reforms when they see them take effect in their communities,” said Nix.
Increased Support for NATO Membership
IRI’s poll saw the highest level of support for NATO membership in any survey
the Institute has conducted. When asked whether they would vote for
Ukraine to join NATO in a referendum, 48 percent of respondents said they
would—a seven point increase since IRI’s last survey—while only 28 percent said
they would vote against this decision. In addition, a strong majority (57
percent) continue to support Ukraine’s integration with the European Union.
Methodology
The poll was conducted in all regions of Ukraine (with the exception of Crimea
and occupied regions of Donetsk and Luhansk oblasts) from September 7-21, 2015,
with an oversample in the Zakarpattia region (see poll presentation for
methodology). The national survey had a randomly selected sample of 1,200
permanent residents of Ukraine aged 18 and older and eligible to vote. The
margin of error does not exceed plus or minus 2.8 percent, and the RESPONSE RATE was 63.9 percent.
The survey was conducted by Rating Group Ukraine and was funded by the U.S. Agency for International
Development.
Russia:
What Do We Know About The State Of Environment?
The
level of awareness of Russians concerning the environmental situation in their
communities is extremely low. At the same time, 80% of respondents express
their interest to know more about it.
MOSCOW,
October 1, 2015.
Russian Public Opinion Research Centre (VCIOM) presents the results of the
survey describing Russian assessments regarding the environmental
situation and their interest in this topic.
Russians
are divided in their opinions concerning the level of availability of the
environmental information. One-third of them (32%) say that any information can be
easily accessed (41% of residents of Moscow and St. Petersburg; 29% of rural
area residents); one-third (33%) say that information is hardly available or
even lacking. A further 29% say that they are not interested in this matter.
Generally,
Russians express their inertest in environmental state in their communities: an overwhelming majority
of them (86%) would like to get this sort of information (including 51% of
those who are “very interested”). People also want to know more about the state
of environment in their city, region, krai or republic (84%). Fewer Russians
show interest in data concerning the environmental situation in Russia in
comparison with other states (71%); 29% are very interested to see these
figures.
Most
of Russians would like to know information about water (59% of respondents are
interested) and air pollution (54%). Russians are also anxious about landfills
(40%) and soil pollution (32%). Thirty-four percent of respondents want to know
about the radiation levels. Least important information refers to natural
resources and subsoil water (only 6% of respondents).
The
VCIOM opinion poll was conducted September 5-6, 2015; 1600 respondents were
interviewed in 132 settlements in 46 regions of Russia. The margin of error
does not exceed 3.5%.
|
In
your opinion, is the information about the state of environment in your pace
of residence available today? (closed-ended question, one answer, %) |
|||||||
|
|
Total
respondents |
Moscow
and St.Petersburg |
Million
cities |
More
than 500 ths |
100–500
ths |
Less
than 100 ths |
Rural
area |
|
Completely
available |
12
|
14
|
15
|
10
|
8
|
15
|
10
|
|
Rather
available |
20
|
27
|
22
|
23
|
19
|
17
|
19
|
|
Rather
unavailable |
14
|
16
|
11
|
12
|
14
|
16
|
12
|
|
Unavailable
|
19
|
13
|
16
|
15
|
21
|
18
|
22
|
|
I
do not look for this kind of information |
29
|
26
|
26
|
31
|
30
|
28
|
31
|
|
Don`t
know |
6
|
4
|
10
|
9
|
7
|
4
|
5
|
|
How
interested are you in getting information about the state of environment …?
(за closed-ended question, one answer per each line, %) |
|||||
|
|
Very
much |
Likely
interested |
Unlikely
interested |
Absolutely
not interested |
Don`t
know |
|
In
your place of residence / community |
51
|
35
|
5
|
6
|
3
|
|
In
your region/republic/krai/city |
41
|
43
|
6
|
7
|
3
|
|
In
Russia compared with other states |
29
|
43
|
12
|
12
|
4
|
|
What
kind of information about environment are you interested in? Choose not more
than five answers. Are you interested to know about…? (closed-ended
question, not more than 5 answers, %) |
|
|
|
Total
respondents |
|
Water
pollution |
59
|
|
Air
pollution |
54
|
|
Landfills
|
40
|
|
Radiation
level intensity |
34
|
|
Soil
pollution |
32
|
|
Deforestation,
forest disease, forest fires |
27
|
|
Factories,
plants that have negative impact on environment |
26
|
|
Fauna
|
20
|
|
Fish
in reservoirs |
19
|
|
Reserves,
natural and national parks |
14
|
|
Natural
resources and subsoil water |
6
|
|
I
am not interested in environment information / nothing |
11
|
|
Other
|
1
|
|
Don`t
know |
3
|
WEST
EUROPE
Food
waste and date marking
Report
September 2015
INTRODUCTION
The
European Union has identified resource efficiency and waste management as key elements
of EU environmental policy and the Europe 2020 strategy. The Commission is currently
reflecting on the scope of a new, more ambitious Circular Economy package to be
published by the end of 2015 and considers it as a possible opportunity for
further actions aimed at strengthening resource efficiency in the food chain
and preventing food waste.
This
survey seeks to understand citizens’ perceptions, attitudes and practices
related to the management and consumption of food resources, and more
specifically, to investigate the role of date marking found on food labeling in
relation to food waste. Findings from this study will help inform possible
future policy making in this area.
The first
section of the report provides an overview of citizens’ attitudes towards the prevention
of food waste. The first part presents information on citizens’ views about the
general responsibility of specific actors, ranging from the individual to food
producers to public authorities, in helping to reduce food waste. The second
part identifies specific actions that citizens feel would help them reduce the
wasting of food in their own homes.
The rest
of the report focuses on citizens’ attention to, understanding and use of date marking
on the labels of food products. Date marking4 is a widespread and important
tool to help ensure consumer safety, but can, if misunderstood, contribute to
the problem of food waste by encouraging consumers to throw out goods that are
still fit for consumption.
This
section of the report starts by presenting information on the attention
citizens pay to “use by” and “best before” labelling on items of food. It then
examines the extent to which citizens across the Member States correctly
understand the meaning of these dates.
The report
then turns to the issue of the labelling of non-perishable foods. EU food labelling
rules currently define a list of nonperishable foods for which the indication
of a minimum durability (i.e. "best before") date is not required
given that such foods can be consumed safely and their quality does not deteriorate
over time (e.g. vinegar, sugar, salt).
First, it
examines respondents’ attitudes to the necessity of “best before” labelling for
foods which do not significantly deteriorate in quality. Secondly, it presents
information on citizens’ habits concerning the use and possible disposal of
non-perishable food were it not to be labeled with “best before” information.
Finally,
the study examines another aspect of date labelling in relation to food use in
the home; that is how citizens utilise storage guidelines found on food
labelling. Some food manufacturers give guidance to consumers about how long
certain foods can be used after opening. The report examines whether, and to what
extent, citizens act in accordance with these guidelines.
This
survey was carried out by TNS political & social network in the 28 Member
States of the European Union between 1 and 3 September 2015. Some 26,601
respondents from different social and demographic groups were interviewed via
telephone (landline and mobile phone) in their mother tongue on behalf of the
European Commission, Directorate General for Health and Food Safety. The
methodology used is that of Eurobarometer surveys as carried out by the Directorate-General
for Communication (“Strategy, Corporate Communication Actions and
Eurobarometer” Unit)5..
MAIN
FINDINGS
§ The
majority of Europeans recognise that they themselves have a role to play in preventing
food waste. Over three quarters (76%) of Europeans think that the individual
consumer is one of the actors involved in the prevention of food waste,
compared with less than a half (49%) who consider that the state has a role to
play.
§ Europeans
also highlight the important role of economic actors in the food supply chain,
identifying the responsibility of shops and retailers (62%), the hospitality and
food service sectors (62%) as well as food manufacturers (52%).
§ The
majority of Europeans also emphasise individual responsibility when it comes to
ways to reduce food waste, with nearly two thirds (63%) saying that better shopping
and meal planning would contribute to the reduction of waste. Clearer
information regarding date marking and on food labels more generally (e.g. food
storage and preparation) is cited by nearly one in two respondents as a means
of preventing household food waste. However, there are significant differences
between countries on this question.
§ Nearly six
in ten Europeans (58%) state that they always check “use by” and “best before”
labels when shopping and preparing meals, with very few indicating that they
never do (only 3%). Young people are significantly less likely to check these
labels: just over four in ten (44%) of those aged between 15 and 24 do this, compared
with over six in ten (61%) of those aged 55 or over.
§ The
Eurobarometer findings confirm that the meaning of date marking found on food
products is poorly understood. Just under half (47%) of Europeans understand
the meaning of “best before” labelling and somewhat fewer (40%) are aware of
the meaning of “use by”. In both cases, a quarter or more think, incorrectly, that
the meaning of date marking differs according to the type of food for which it is
used.
§ There is significant country-level divergence
in both awareness and conceptual understanding of "use by" and "best
before" labelling. When asked about the meaning of these two types of
dates, in some countries, notably Romania and Greece, a large majority gave the
“use by” definition in both cases, whereas in others, such as Sweden, a
majority gave the “best before” definition in both cases.
§ There are also significant sociodemographic differences
on this question. Those aged between 25 and 39 are more likely than people in
other age groups to know the meaning of “best before” (53%) and “use by” (46%)
dates. The same is true for people who left education at an older age: 53% of
those who left education at the age of 20 or older know the meaning of “best
before”, compared with 36% of those who left education aged 15 years or under.
The difference is less pronounced with respect to knowledge of the meaning of
“use by”, with 43% and 36%, respectively.
§ Less than half (44%) of Europeans say that
they would miss “best before” labelling if it were no longer found on certain
non-perishable foods. Nearly six in ten (58%) respondents in Member States that
entered the EU from 2004 onwards (NMS 13 countries) would prefer "best before"
labelling to remain, compared with only four in ten (40%) in EU15 countries.
§ Over two thirds (70%) of Europeans state that
if they found a package of spaghetti in their kitchen cupboard without
"best before" labelling, they would utilise the food regardless of
the absence of date marking.
§ People are more likely to throw away food without
date marking in countries where there is uncertainty over the meaning of “best
before” dates, such as Greece (50%), Bulgaria (47%) and Cyprus (44%).
§ Most people continue to use opened food products
after the recommended storage period indicated on the label has passed. Nearly
six in ten (59%) give this reply, compared with just under a third (31%) who
throw food away after the stipulated date
UK: Hoverboards
look like fun – but keep them off the pavements
October 16, 2015
Most British people say ‘self-balancing scooters’ look
like good fun rather than a bit ridiculous – but there is broad support for a
ban on public roads
There have
been reports of large numbers of people riding the
streets of Britain on hoverboards – not the kind seen in Back to the Future (set in
October 2015), but a
kind of hands-free Segway, also known as a ‘self-balancing scooter’.
They’ve
become popular among pop singers, rappers and footballers but new YouGov
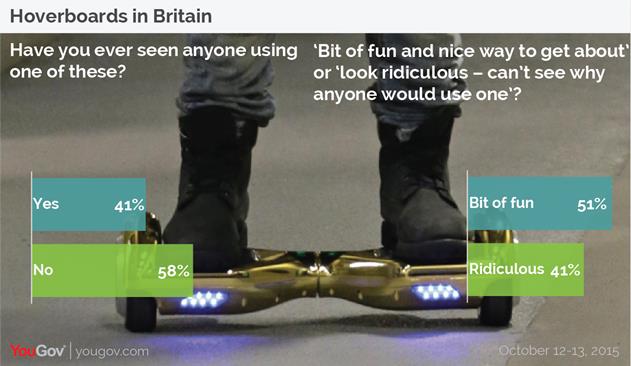
research reveals the huge scale of their use in Britain. We showed British
people a photograph of a hoverboard and 41% said they’ve seen someone using
one, rising to 58% among the 18-24 generation.
You might
expect British people to think the devices, which reach a top
speed slightly above
a brisk walk (6.2 mph), are a bit bizarre. But actually that’s not the case –
most people (51%) say they look like fun, and a nice way to get around, while
41% say they look a bit ridiculous and they can’t see why someone would want to
use one. Among those who have seen someone using one, 57% say they look like
fun.
And
surprisingly it’s young people (47%) who are more likely than over 60s (41%) to
say they look ridiculous.
The police
recently issued a notice reminding people that hoverboards are banned under the
Highways Act 1835, on both roads and pavements.
The largest
group of British people (44%) agree they should be illegal on both roads and
pavements, however a third (33%) say they should be legal on pavements but not
roads. 48% of young people say they should be legal on pavements but not roads,
and 8% say they should be legal on both – a majority of 18-24s support them
being legal on pavements.
NORTH
AMERICA
Americans'
Desire for Stricter Gun Laws Up Sharply
October 19, 2015
WASHINGTON,
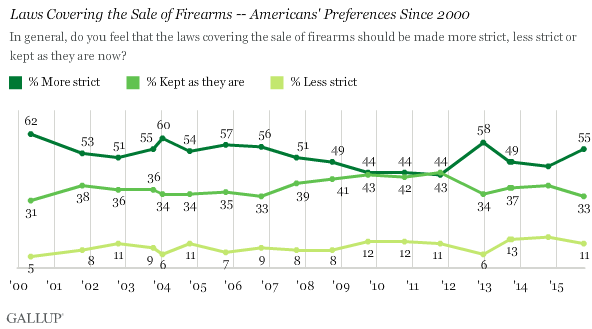
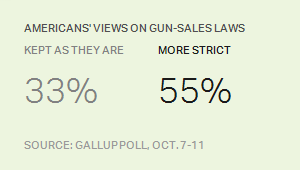
D.C. -- Fifty-five percent of Americans say they want laws covering the sale of
firearms to be stricter than they are now, a distinct rise of eight percentage
points from 2014. Fewer Americans than last year want the laws to be less
strict, and the proportion who want the laws to stay the same has also declined
slightly.
In
2007, the year of the Virginia Tech massacre, the percentage of Americans who
favored stricter laws on gun sales dropped to a bare majority (51%) for the
first time in several years. Since then, support for stricter laws had stayed
under 50%, except in the wake of the Sandy Hook school shootings in Newtown,
Connecticut, in December 2012. At that point, 58% of Americans said they were
in favor of stricter laws on gun sales. Although support for stricter laws
receded after those shootings, in which a young man fatally shot 20 children
and six adults, it has yet to return to the 44% level it was at before that tragedy.
The
latest increase, from the Gallup Crime poll conducted Oct. 7-11, came in the
days after the most recent high-profile mass shooting, at a community college
in Oregon. However, that event seems to have mainly affected Americans' views
about laws on gun sales, but not other topics relating to guns.
Independents,
Democrats Fueling Trend for Stricter Gun Laws
The
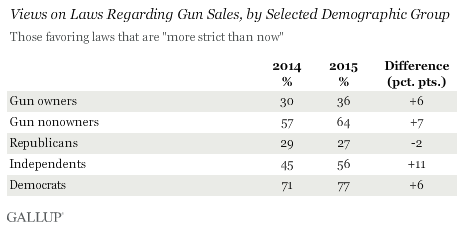
rise in the proportion of Americans who want stricter laws on firearm sales can
be attributed partly to an increase among certain demographic groups. Support
rose among Democrats and especially independents from 2014, and among those who
do not personally own a gun. However, support increased even among those who
say they own a handgun, from 30% in 2014 to 36% this year.
Civilian
Handgun Possession Should Not Be Banned, Americans Say
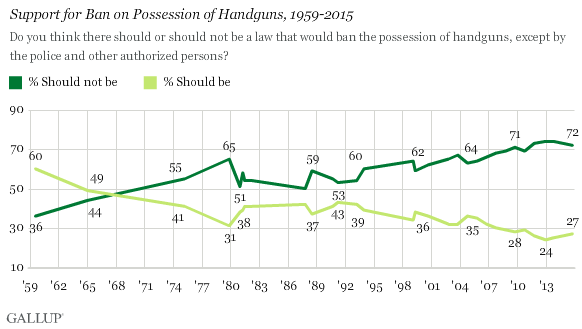
The
percentage of Americans who favor a law providing that only authorized persons
(including the police) would be allowed to possess handguns has remained low
since the 1990s. This year, 27% -- near the record low -- say there should be
this type of ban. This trend has been generally declining since Gallup began
asking this question in 1959, when 60% said such a law should exist.
In
2015, guns are a part of the fabric of American life and much of its discourse.
Overall in the U.S., 43% say they have a gun somewhere in their household, and
28% say they personally own a gun.
Bottom
Line
In
a maelstrom of debate about guns, Americans have clear-cut views of at least
some aspects of the debate. A majority in 2015 say gun sales should be
regulated more strictly than they are now, which represents an uptick from last
fall; however, it is still slightly lower than in December 2012, immediately
after the Newtown school shootings.
But
with mass shootings and individual homicides occurring with regularity, the
debate will continue over whether there should be restrictions or amendments to
firearms purchases or possession. Last week, California's Lt. Gov. Gavin Newsom
said he will introduce a state ballot measure for next year that would require
ammunition buyers to undergo background checks. President Barack Obama also
said he may use executive authority to impose background checks for those
purchasing weapons from high-volume firearms dealers.
These
are just two examples of initiatives that may or may not gain traction with a
public that is disturbed about mass shootings, but evidently divided about how
to solve this persistent problem in the 2010s.
Survey
Methods
Results
for this Gallup poll are based on telephone interviews conducted Oct. 7-11,
2015, with a random sample of 1,015 adults, aged 18 and older, living in all 50
U.S. states and the District of Columbia. For results based on the total sample
of national adults, the margin of sampling error is ±4 percentage points at the
95% confidence level. All reported margins of sampling error include computed
design effects for weighting.
Each
sample of national adults includes a minimum quota of 60% cellphone respondents
and 40% landline respondents, with additional minimum quotas by time zone
within region. Landline and cellular telephone numbers are selected using
random-digit-dial methods.
Source:
http://www.gallup.com/poll/186236/americans-desire-stricter-gun-laws-sharply.aspx?g_source=Social
Issues&g_medium=newsfeed&g_campaign=tiles
Americans'
Favorable Ratings of Pope Up After U.S. Visit
October 16, 2015
WASHINGTON,
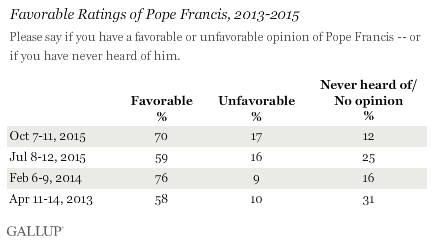
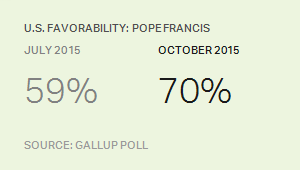
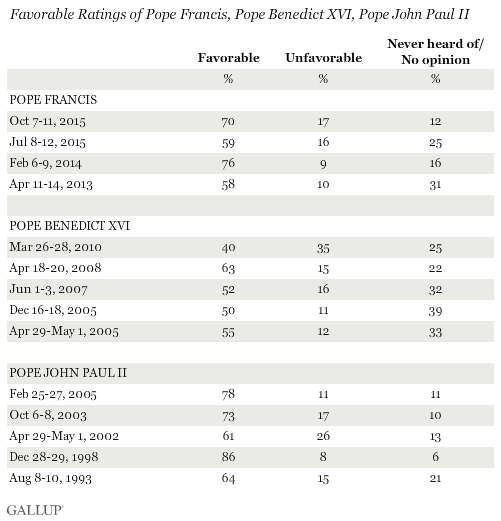
D.C. -- Pope Francis enjoyed a double-digit boost to his favorability after his
September visit to the U.S. Seventy percent of Americans now view him favorably
-- up from 59% in July. The latest rating is closer to the 76% measured in
early 2014.
The pope's
visit to a trio of East Coast cities last month, which included addresses to
Congress and the United Nations General Assembly, was his first to the U.S.
While some observers politicized his calls for action on several controversial
issues, his visit was widely celebrated by Catholics and non-Catholics alike.
The latest bump in his favorable rating suggests that he successfully connected
with Americans during his trip.
After being
elected leader of the 1.2 billion-member Roman Catholic Church in 2013, Francis
enjoyed great popularity in American news media, including being named Time's 2013 Person of the Year. By early
2014, his favorability had swelled to 76%.
The pope's
favorable rating fell from its previous high when Gallup next measured opinions
about him, in July 2015. It's possible that many Americans forgot about him
after that initial burst of positive publicity; the percentage not having an
opinion of the pontiff rose from 16% to 25%. But his unfavorable rating also
climbed during this time, from 9% to 16%, after he weighed in on a variety of
issues that are controversial to Americans, including immigration and climate
change.
Francis'
favorability has rebounded in the latest poll, as more Americans than before
are now familiar with him, but there has been no change in his unfavorable
rating.
Pope
Francis Regains Footing Among Several Demographics
In July, the
pope experienced his largest
drop in favorability among conservatives, although his favorable ratings among liberals and
Catholics themselves also fell substantially. In the latest poll, conducted
Oct. 7-11, Francis regained much of his standing with these groups.
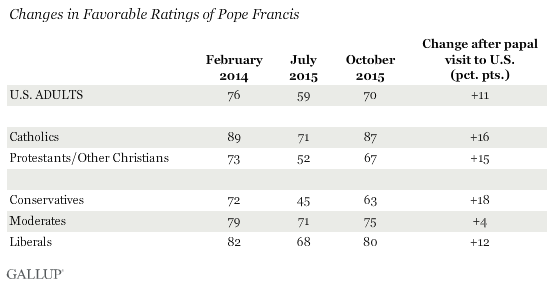
Since July,
the pope's favorability among conservatives has increased 18 percentage points,
higher than the 11-point increase among all Americans. Ratings are also more
positive among the other ideological groups, but they have not increased to the
same degree. The proportionately larger increase among conservatives partly
reflects their lower ratings in the prior poll, meaning conservatives had more
room to improve than moderates or liberals. Less than half of conservatives
viewed the pope favorably over the summer, while a majority (63%) now have a
favorable view of him.
Nearly nine
in 10 of the pope's fellow Catholics view him favorably -- a 16-point increase
from July and nearly back to the 89% from 2014. His favorable rating among
Protestants and other Christians is up 15 points to 67%.
Francis'
Ratings Still Higher Than Benedict's, Lower Than John Paul's
Generally
speaking, Americans rate popes much more positively than negatively. Francis
remains markedly more popular than his predecessor, Pope Benedict XVI, whose
resignation in 2013 led to Francis' election. Benedict's ratings were middling
after his ascension to the papacy in 2005. His favorability climbed to its peak
at 63% in 2008 before dropping sharply to 40% in 2010.
Pope John
Paul II, however, was the most popular among the three most recent popes, with
favorable ratings that ranged from a low of 61% in 2002, after the Catholic
priest sex abuse scandal broke, to a high of 86% in 1998.
Bottom
Line
By and
large, most Americans view Francis favorably, as they have past popes. Among
the relatively small percentage of Americans who don't have a positive opinion
of Francis, nearly half of them simply don't know who he is or don't have an
opinion of him.
Though his
recent visit clearly influenced how Americans view him, solid majorities viewed
him favorably even before he came to the U.S. And like popes before him, his ratings
have fluctuated and likely could continue to fluctuate, depending on his
prominence in the news as well as the policies and calls to action he issues as
leader of the church.
Francis has
made bold statements in his short time in the papacy, and ones that have
rankled some U.S. conservatives. And while some people's views of the pope may
ebb and flow as a result of the statements he makes, his core favorable rating
remains sturdy.
Survey
Methods
Results for
this Gallup poll are based on telephone interviews conducted Oct. 7-11, 2015,
on the Gallup U.S. Daily survey, with a random sample of 1,015 adults, aged 18
and older, living in all 50 U.S. states and the District of Columbia. For
results based on the total sample of national adults, the margin of sampling
error is ±4 percentage points at the 95% confidence level. All reported margins
of sampling error include computed design effects for weighting.
Each sample
of national adults includes a minimum quota of 60% cellphone respondents and
40% landline respondents, with additional minimum quotas by time zone within
region. Landline and cellular telephone numbers are selected using
random-digit-dial methods.
U.S.
Employee Engagement Steady in September, at 32%
October 16, 2015
WASHINGTON,
D.C. -- In the U.S., 32% of workers were engaged in their jobs in September.
While engagement remains higher than it was from 2011-2013, monthly figures
have not wavered since the beginning of 2015 -- consistently trending between 31%
and 32%. The lone exception was in February, when the monthly employee
engagement average was 32.9%.
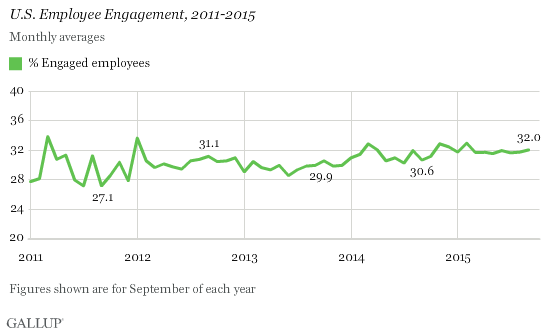
The
September 2015 estimate is based on Gallup Daily tracking interviews conducted
with 6,926 adults working for an employer. Engaged employees are involved in,
enthusiastic about and committed to their work and workplace. Gallup
categorizes workers as "engaged" based on their ratings of key
workplace elements that predict organizational performance outcomes, such as
productivity, profitability and customer engagement. Engaged employees drive
the innovation, growth and revenue that their companies need.
Bottom
Line
Thus far in
2015, employee engagement among all U.S. workers has been steady. Employee
engagement readings are higher than they were just a few years ago, but the
nation's workforce, in aggregate, is seemingly unable to move beyond the 31% to
32% barrier. This static state is aligned with many of the nation's economic
indicators -- job
creation, the Gallup
Good Jobs Index and consumer
spending have all
been flat in recent months.
Survey
Results
Results for
this Gallup poll are based on telephone interviews conducted Sept. 1-30, 2015,
on the Gallup Daily tracking survey, with a random sample of 6,926 U.S. adults
employed full or part time for an employer, aged 18 and older, living in all 50
U.S. states and the District of Columbia. For results based on the total sample
of employed adults, the margin of sampling error is ±1.8 percentage points at
the 95% confidence level. All reported margins of sampling error include
computed design effects for weighting.
Each sample
of national adults includes a minimum quota of 60% cellphone respondents and
40% landline respondents, with additional minimum quotas by time zone within
region. Landline and cellular telephone numbers are selected using
random-digit-dial methods.
Source:
http://www.gallup.com/poll/186212/employee-engagement-steady-september.aspx?g_source=Employee
Engagement&g_medium=newsfeed&g_campaign=tiles
Solid
Majority Continue to Support Death Penalty
October 15, 2015
WASHINGTON,
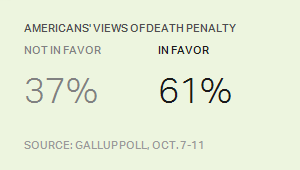
D.C. -- About six in 10 Americans favor the use of the death penalty for a
person convicted of murder, similar to 2014. This continues a gradual decline
in support for the procedure since reaching its all-time high point of 80% in
1994.
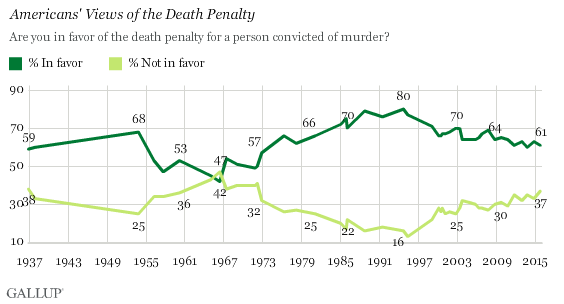
Thirty-seven
percent oppose the death penalty, slightly higher than in recent years, in part
because this year, only 2% of Americans say they have no opinion on the topic.
These
results come from Gallup's annual Crime poll, conducted Oct. 7-11, 2015. While
the public has, with one exception, favored the death
penalty over the 78
years Gallup has asked this question, support for the measure has varied
considerably. The low point for support, 42%, came in the 1960s, with support
reaching its peak in the mid-1990s and generally declining since that point.
Over the past decade, however, there has been minimal fluctuation in the
percentage of adults who favor the death penalty, with support always at or
above 60%.
This
reliably high majority of support belies a powerful current of change in recent
years that has rendered the death penalty a far rarer judicial outcome than
before. In May, Nebraska became the 19th state (along with D.C.) to
ban the death penalty, and the seventh state since 2007. Meanwhile, the number
of death sentences issued in 2014 was the lowest since the reinstatement of the
punishment in 1976, and the number of executions carried out in 2014 was one of
the lowest on record.
Blacks
Far Less Likely to Support Death Penalty
A large gulf
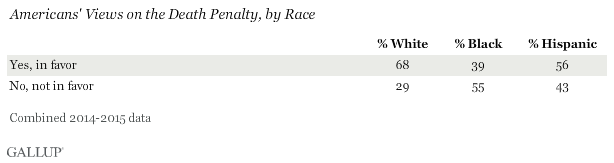
exists between whites and blacks in their support for the death penalty. In a
combined 2014-2015 sample, 68% of whites said they were in favor of the death
penalty, while 29% were opposed. Blacks tilt almost as heavily in the opposite
direction -- 55% oppose the death penalty, compared with 39% in favor. This
pattern is in alignment with previous Gallup findings, including
in 2007. The
opposition among blacks may be related to the disparity between blacks making
up 42% of the current death row population but just 13% of the overall U.S.
population.
The death
penalty remains a divisive issue among political
partisans, with
Democrats (49%) far less likely to be in favor of the punishment than
Republicans (82%).
Majority
Believe Death Penalty Applied Fairly
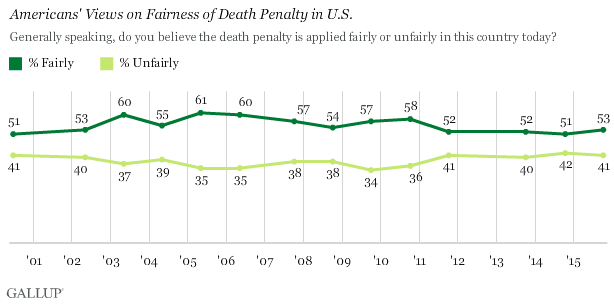
Fifty-three
percent of Americans say that, generally speaking, the death penalty is applied
fairly today in the U.S. While still a majority, this year's rate is below the
high of 61% in 2005. Forty-one percent, meanwhile, say they believe the death
penalty is applied unfairly.
Plurality
of Americans Say Death Penalty Not Imposed Enough
When asked
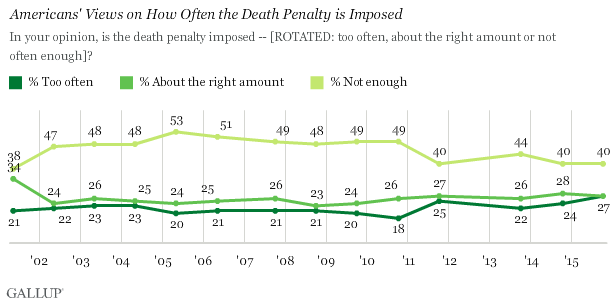
about the frequency with which the death penalty is imposed, 40% of Americans
say it is not imposed enough, with the remainder equally divided between saying
it is imposed "too often" (27%) or "about the right amount"
(27%). The proportion of Americans saying the death penalty is not imposed
enough has fallen from a high of 53% in 2005, just as the number of executions
has generally gone down over that time period.
Bottom
Line
By many
metrics -- the number of states that have banned the death penalty, the number
of executions carried out or the actual population of inmates currently on
death row -- the death penalty appears to be losing popularity in statehouses
and courthouses across the country. But the public at large continues to
support the use of the death penalty. A majority continue to assess the
punishment as applied fairly, and a plurality wish it were applied more often.
But there is
no denying that the death penalty is controversial -- reflected, at least
somewhat, by the deep racial divide it causes. The cascade of exonerations for
once-condemned inmates and the plethora of academic literature exploring the
alleged disparities in the application of the punishment appear to have made
juries less likely to issue a death penalty sentence and legislatures more
likely to ban it.
Survey
Methods
Results for
this Gallup poll are based on telephone interviews conducted Oct. 7-11, 2015,
on the Gallup U.S. Daily survey, with a random sample of 1,015 adults, aged 18
and older, living in all 50 U.S. states and the District of Columbia. For
results based on the total sample of national adults, the margin of sampling
error is ±4 percentage points at the 95% confidence level. All reported margins
of sampling error include computed design effects for weighting.
Each sample
of national adults includes a minimum quota of 60% cellphone respondents and
40% landline respondents, with additional minimum quotas by time zone within
region. Landline and cellular telephone numbers are selected using
random-digit-dial methods.
Boehner
Image Slightly Better After Resignation Announcement
October 15, 2015
PRINCETON,
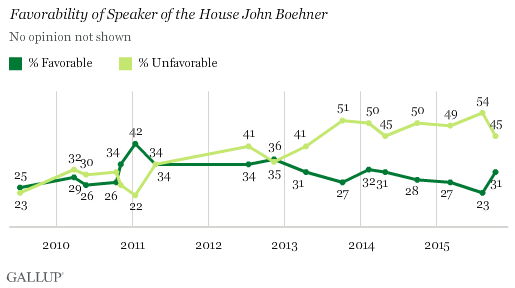
N.J. -- Americans' opinions of House Speaker John Boehner are still negative,
but they have improved since he announced last month that he would resign his
position. Currently, 31% of Americans have a favorable opinion of Boehner, up
from 23% in August. This is his best reading since April 2014.
Last month,
Boehner announced he would step down as speaker at the end of October. Boehner
may hold his position a bit longer, given that Republicans' search for a
replacement is taking longer than expected.
Boehner's
tenure has been a rocky one, as he
leads an unpopular institution and has had trouble pleasing his own party's supporters, let alone
Americans more generally. Often he has had to choose between pursuing
legislation the right flank of his party prefers but that has little chance of
becoming law, or working with Democrats to pass compromise legislation that
disappoints conservatives, but is necessary to keep the government operating.
Apart from a
brief honeymoon period after becoming speaker in 2011, when 42% of Americans
viewed Boehner favorably and 22% viewed him unfavorably, his ratings typically
have been more negative than positive. That is not unusual for speakers,
however, as Nancy
Pelosi and Newt
Gingrich had
net-negative favorable ratings for much of their tenures in the position. The
more low-key Dennis Hastert fared a little better, with more positive than
negative ratings until
the end of his speakership. However, Hastert may have benefited from presiding at a time when
Americans tended to be a bit more
positive toward Congress than is usually the case.
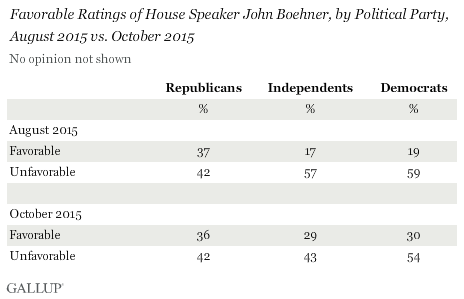
Interestingly,
Republicans' views of Boehner are unchanged since Gallup's last measurement in
August, while independents and Democrats now view him more favorably. This may
be the result of recent attention paid to conservative Republicans' role in
forcing Boehner to step down, perhaps leading some independents and Democrats
to view him as more of an ally. Nevertheless, Democrats and independents still
view him more negatively than Republicans do.
Tea Party Republicans
view Boehner much more negatively than non-Tea Party Republicans do. Thirty-two
percent of Republicans (including Republican-leaning independents) who describe
themselves as supporters of the Tea Party movement view Boehner favorably,
while 59% view him unfavorably. That compares with a more evenly divided
evaluation among Republicans who are not Tea Party supporters -- 34% favorable
vs. 37% unfavorable.
Most
Americans Think New Speaker Will Make No Difference
After
resigning, Boehner warned against "false prophets" in the
conservative wing of the party who advocate legislative moves that have little
to no chance of succeeding, such as the 2013
government shutdown
to block funding of Obamacare or more recent discussions to shut down the
government over Planned Parenthood's federal funding. Some of those same
conservative leaders may see Boehner as the problem and believe a new leader
may help the party better achieve its goals.
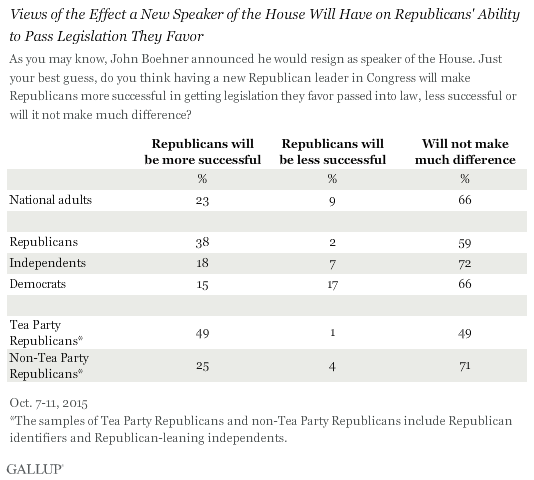
Most
Americans, 66%, do not believe changing leaders will make much difference in
helping Republicans pass legislation they favor, though more do predict the GOP
will have greater success (23%) with someone new than predict it will be less
successful (9%).
The
constituency Boehner was trying to warn, namely Tea Party Republicans, is
divided about what will happen with a new speaker -- 49% think the GOP will be
more successful while most of the rest say it will make no difference. By
contrast, seven in 10 non-Tea Party Republicans -- who outnumber Tea Party
Republicans by about 2-to-1 -- believe Boehner's resignation will make no
difference. Most Democrats and independents also believe having a new speaker
will not change things.
Implications
Boehner's
decision to step down surprised political observers, but given his unpopularity
-- including a negative evaluation within his own party -- it may have been
inevitable. And while the move has led to a softening of Democrats' and
independents' negative image of him, it hasn't affected the way Republicans
rate him.
As of today,
his successor is far from certain after current Majority Leader Kevin McCarthy
announced he would not seek the position and none of the other contenders has
emerged as a clear front-runner.
Regardless
of who succeeds Boehner, the key question is what effect the change will have
on Republicans' ability to accomplish their goals. Republicans' internal
disagreement may be more about tactics than about substance. Most elected
Republicans would probably repeal Obamacare and defund Planned Parenthood if
they could, but the question is whether the Republican caucus should spend time
on those goals if they cannot realistically achieve them.
As Boehner
and like-minded Republicans might argue, the current political environment is
not conducive to success on those issues with a Democratic president and enough
Democrats in the Senate to successfully filibuster any legislation they oppose.
The
Republican Party's image suffered greatly after the 2013 shutdown while not
achieving their aim of thwarting Obamacare, although its image soon
recovered, and a year
later the GOP won control of the Senate and expanded its majority in the House.
But that newfound power has not led to Republicans' achieving some of their
goals, including regulatory reform, approving the Keystone XL pipeline,
reforming taxes and reducing the national debt.
Ultimately,
Americans do not think having a new speaker will make much difference, but Tea
Party Republicans are more optimistic that it will. Whether their hopes are
realized depends on whom the Republicans tap as the new speaker and whether he
or she is inclined to go along with conservatives' wishes, but also how
Congress and the president respond to future GOP proposals.
Survey
Methods
Results for
this Gallup poll are based on telephone interviews conducted Oct. 7-11, 2015,
with a random sample of 1,015 adults, aged 18 and older, living in all 50 U.S.
states and the District of Columbia. For results based on the total sample of
national adults, the margin of sampling error is ±4 percentage points at the
95% confidence level. All reported margins of sampling error include computed
design effects for weighting.
Each sample
of national adults includes a minimum quota of 60% cellphone respondents and
40% landline respondents, with additional minimum quotas by time zone within
region. Landline and cellular telephone numbers are selected using
random-digit-dial methods.
Biden
Maintains Positive Image
October 14, 2015
PRINCETON,
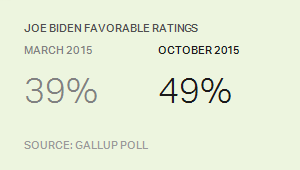
N.J. -- As Vice President Joe Biden continues to ponder whether to enter the
2016 Democratic nomination campaign, Americans' views of him are more positive
(49%) than negative (37%). These views are similar to what Gallup found in its
prior update from August and continue to be improved from Americans' divided
opinions of Biden through most of his term as vice president.
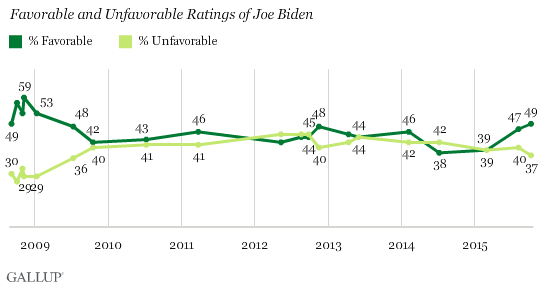
As recently
as March, equal percentages of Americans had favorable (39%) and unfavorable
(39%) opinions of Biden. One reason opinions of Biden have improved in recent
months could be Americans' sympathy for him after his son Beau died of cancer
earlier this year.
Another
reason Biden's favorability may be higher is that many Democrats want to see
Biden enter the presidential campaign. They may think the Democratic Party needs an
alternative to its weakened front-runner, Hillary Clinton, whom Americans
currently view more
negatively than positively. In stark contrast to Biden's rising image since March, Clinton's image
has worsened since
then.
Right now,
Bernie Sanders is Clinton's closest challenger, but given his admitted
socialist leanings, there are questions about his
electability. None of
the three other announced Democrats has emerged as a credible challenger to
Clinton, though that could change in the days after Tuesday's first Democratic
debate.
On only two
other occasions since Biden became vice president has Gallup found significantly
more positive than negative views of him. These include late 2012 after
President Barack Obama and Biden were elected to a second term (48% favorable,
40% unfavorable) and during the "honeymoon phase" of the Obama
administration (48% favorable, 36% unfavorable) in 2009. In fact, Biden's
current +12 net favorable rating ties that June 2009 reading as the best of his
vice presidency.
Prior to his
being sworn in as vice president, in late 2008 and early January 2009, Biden's
image tilted considerably more positive than negative. This included a personal
best 59% favorable rating in a poll conducted in the days after the Obama-Biden
ticket won the 2008 presidential election.
Biden
Image Better Among Most Key Subgroups
Biden's
favorable ratings are higher now than in March among most key subgroups. The
sharpest gains in favorability, all near 20 percentage points, are among
Democrats, nonwhites and Catholics.
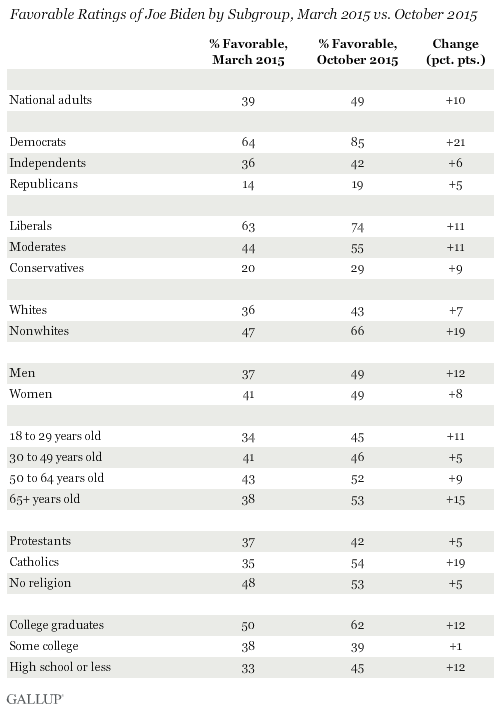
Democrats,
as would be expected, have always viewed Biden positively. But their opinions
of him have become increasingly positive in recent months, now at 85%
favorable, and suggest he likely would be a serious contender for the party's
nomination if he entered the race.
Biden's more
positive ratings among nonwhites are also noteworthy because support among this
group could be decisive in determining the Democratic Party's nominee. While
nonwhite Democrats have
highly positive views of Clinton, this is not the case for Sanders. Thus, Biden likely would be more
competitive with Clinton than Sanders would be among this key Democratic
subgroup.
In addition
to Democrats and nonwhites, most liberals (74%) and college graduates (62%)
view the vice president positively.
Earlier in
the year, 35% of Catholics had a favorable opinion of Biden, similar to the
national average. Catholics' favorable rating increased to 42% in Gallup's
August update, but now sits at 54%. Biden is Catholic, and more Catholics may
be aware of that fact after he attended many of Pope Francis' public events
during the widely covered U.S. papal visit in September.
Implications
Biden is now
viewed as positively among Americans as at any time since he became vice
president in January 2009. If he is considering entering the presidential race,
he would appear to be well-positioned given those relatively positive ratings
and his high public profile.
Among the
announced presidential candidates, only Ben Carson and Carly Fiorina have
significantly higher favorable than unfavorable ratings among all Americans,
according to Gallup's tracking survey. Marco Rubio, Sanders, and John Kasich
have slightly more positive than negative ratings.
To some degree,
though, Biden's relatively positive image may reflect his status as a
non-candidate. If he officially entered the race, Americans might view him in
more strongly political terms. Additionally, the media and his political
opponents would give greater scrutiny to his record, and if some of that
scrutiny is unflattering, it could negatively affect the way Americans feel
about him.
Survey
Methods
Results for
this Gallup poll are based on telephone interviews conducted Oct. 7-11, 2015,
with a random sample of 1,015 adults, aged 18 and older, living in all 50 U.S.
states and the District of Columbia. For results based on the total sample of
national adults, the margin of sampling error is ±4 percentage points at the
95% confidence level. All reported margins of sampling error include computed
design effects for weighting.
Each sample
of national adults includes a minimum quota of 60% cellphone respondents and
40% landline respondents, with additional minimum quotas by time zone within
region. Landline and cellular telephone numbers are selected using
random-digit-dial methods.
In
U.S., 59% View Planned Parenthood Favorably
October 14, 2015
WASHINGTON,
D.C. -- A majority of Americans, 59%, view Planned Parenthood favorably.
Although still positive overall, Americans' current opinions of Planned
Parenthood are considerably less favorable than they were in 1993 -- the last
time Gallup asked about the organization -- when 81% viewed it favorably.
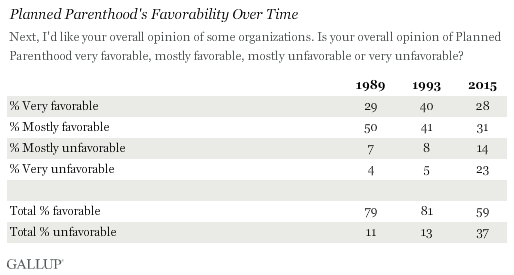
Gallup has
asked Americans about their views of Planned Parenthood three times: in 1989,
in 1993 and in the Oct. 7-11 survey. The most recent poll comes amid
significant focus on the organization in the news and throughout social media.
The organization's president recently testified on Capitol Hill, largely in
response to an anti-abortion group's release of secretly recorded videos that
purported to show Planned Parenthood employees discussing potential sales of
fetal tissue it recovers from abortions. Planned Parenthood denies these
allegations, and has said that the videos were highly edited. The controversy
has led to thus-far-unsuccessful efforts by Republicans in Congress to strip
Planned Parenthood of its federal funding.
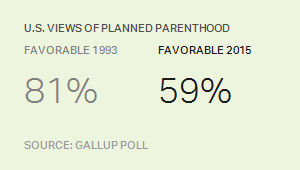
Republicans'
Views of Planned Parenthood Changed Most Significantly
The biggest
shift in views of Planned Parenthood since 1993 has taken place among
Republicans. In 2015, 35% of Republicans say they have a favorable view of the
organization, about half of the 69% who had a favorable view in 1993.
Independents are also significantly less positive today, with favorable views
dropping from 83% to 56%, although independents' views remain more positive
than negative. Views of Planned Parenthood among Democrats have changed far
less, dropping nine percentage points, from 91% to 82%.
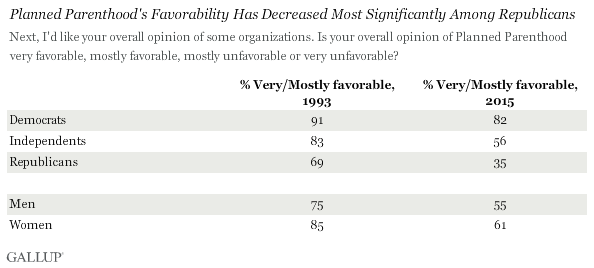
Women have
historically been more likely than men to view Planned Parenthood favorably.
This continues to hold true in 2015, although favorability has dropped among
both groups since 1993.
Opinions of
Planned Parenthood are closely tied to Americans' views on abortion, because
Planned Parenthood provides abortions as well as other reproductive healthcare
and sex education for men and women. Currently, 82% of Americans who describe
themselves as "pro-choice" on the abortion issue view Planned Parenthood
favorably, compared with 33% of those who self-identify as
"pro-life." Gallup did not ask the pro-choice/pro-life item in 1993,
so it is not possible to know how these opinions may have changed.
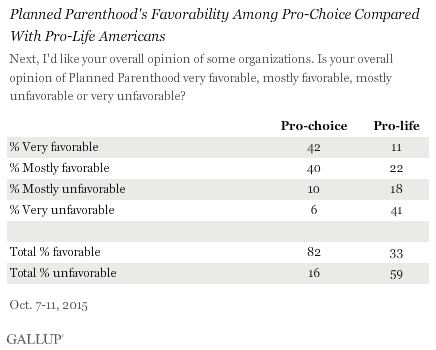
Interestingly,
42% of pro-choice Americans have very favorable views of Planned Parenthood,
almost identical to the 41% of pro-life Americans who have a very unfavorable view -- showing how polarized
Americans with differing views of abortion are about the organization.
Bottom
Line
Planned
Parenthood's image among U.S. adults has worsened since 1993. However, absent a
more recent reading, the precise effect of the current controversy on
Americans' views is unclear. While Republicans have always been less likely
than Democrats to have favorable views of Planned Parenthood, the gap has
widened significantly since the early 1990s.
This may
have been the result of the politicization of Planned Parenthood as well as
increased media attention to proposed changes in U.S. and state abortion laws.
For example, in May 1993, Congress passed a law that legalized fetal tissue
donations after abortions. At the time, many Republicans supported this law.
Today, several of those same Republicans were among those pushing to defund
Planned Parenthood. The organization only recently announced that it would no
longer receive compensation for the medical cost of providing these fetal
tissue donations after abortions.
Gallup has
observed a similar pattern of party polarization on other issues, including attitudes
about global warming
and labor
unions, to name two
examples. While Republican House members and senators' actions and words
regarding Planned Parenthood certainly may resonate with their base, they are
facing a general public that, as a whole, still views the organization more
favorably than unfavorably.
Survey
Methods
Results for
this Gallup poll are based on telephone interviews conducted Oct. 7-11, 2015,
with a random sample of 1,015 adults, aged 18 and older, living in all 50 U.S.
states and the District of Columbia. For results based on the total sample of
national adults, the margin of sampling error is ±4 percentage points at the
95% confidence level. All reported margins of sampling error include computed
design effects for weighting.
Each sample
of national adults includes a minimum quota of 60% cellphone respondents and
40% landline respondents, with additional minimum quotas by time zone within
region. Landline and cellular telephone numbers are selected using
random-digit-dial methods.
Canada
- Election 2015: Liberals edge Conservatives as volatile electorate mulls final
choice before last campaign weekend
October 16, 2015 – Election 2015 enters its
final weekend with the Liberal Party of Canada (LPC) holding a four point
advantage in popular support over the Conservatives (CPC) among eligible
voters.
That
lead narrows to a statistical tie when the vote intention of likely
voters are measured, while in both scenarios – the NDP remains stuck
in third place and losing momentum.
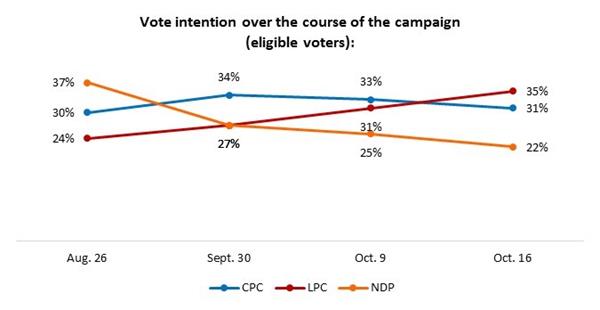
It’s
this stagnation on the part of the New Democrats that may enable the LPC to
pick up yet more backing during the last days of the campaign among those
voters for whom stopping a CPC victory takes precedence over voting for their
party and candidate of choice.
Indeed,
a key narrative of this 42nd federal election has been which
left-of-centre party eligible voters would coalesce around. Indeed, it seems
clear now that they have picked the Liberals.
That
said, this most recent public opinion poll from the Angus Reid Institute also
points to extraordinary volatility among the electorate, with roughly
one-in-six saying they’ve yet to lock in their votes heading into this final
weekend. While the Conservatives appear to have failed to attract or retain
support beyond their traditional base, the commitment of that base and its
relatively older age also leaves opportunity for the incumbent party to
leverage loyal voters.
National Party Standings:
This
ARI poll shows the Liberal Party continuing to build on gains made over the
course of the campaign, moving up another four points this past week to 35 per
cent of decided eligible voters while the Conservatives have slipped two points
to 31 per cent. The contest between the two parties tightens among likely
voters, who have a higher propensity to vote (see notes on methodology at the
end of this release). Among this segment, the parties are essentially tied (34%
Liberal, 33% Conservative). Among both eligible and likely voters, just over
one-in-five indicate a preference for the once-front runners, the NDP (22%).
The Regional Story:
The
data from this survey shows recent national-level gains for the Liberals are
largely coming from Ontario, where the Liberals have surged, taking a
commanding lead in key battlegrounds in the GTA (both within the “416” area and
across the “905” as well). Across the province as a whole, the Liberals lead
the Conservatives by ten points, and open up a whopping two-to-one lead over
the NDP.
The
narrative in Quebec is more complex: support for each of the four main parties,
combined with Canada’s first-past-the-post system, offers the potential for
some unpredictable finishes on election night.
The
good news for the NDP is that after hemorrhaging support over the last several
weeks here – largely due to the niqab debate — the party has stabilized, retaining a
slim lead over the Liberals and a slightly wider one over the Conservatives and
Bloc Quebecois. That said, the NDP’s dominance in Quebec – the factor that
propelled it to Official Opposition status in 2011 – no longer exists.
In
British Columbia the main parties are in a virtual three-way tie among eligible
voters, with the Green Party chosen by about one-in-ten voters here. A closer
look shows that the Liberals are much stronger in the Metro Vancouver area than
in the rest of the province where there is much more of a two-way contest
between the CPC and NDP.
Volatile Electorate:
A
key dynamic the Angus Reid Institute has canvassed over the course of this election
campaign concerns the large segment of volatile and uncommitted voters — and
this remains a potentially major factor as we head into these final days.
Indeed, among those who have yet to vote, fully half admit their party choice
is not yet absolutely certain.
Of
those who haven’t fully ‘locked-in’ their choice, one-in-three (34%) say
they’ll remove any doubt about their final choice this weekend, while almost
half (45%) say they won’t actually lock in until voting day itself. What
remains to be seen is the rate at which these leaning, but unresolved voters will
actually show up at polling stations on October 19 — and of course whether they
stick with who they are currently leaning towards or decide to switch at the
last minute.
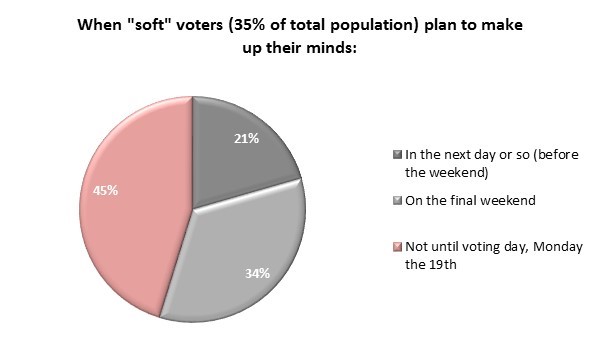
Liberal strengths:
The
biggest advantage the Liberals have going into election day is momentum. While
Conservative support has remained stubbornly consistent since August, and while
NDP support has plummeted, the LPC is the only party on a significant and
steady upward trend as Monday looms:
The
Liberals also have the most appealing leader in Justin Trudeau. More than half
of all Canadians say they find him appealing. On this question, CPC Leader
Stephen Harper runs last, with roughly one-third – a number that corresponds to
his support base – saying they like him (32%).
Trudeau’s
appeal can also be seen in the percentage of people reporting an improved
opinion of him over the last week or so. More than one-quarter of voters (28%)
say they think better of Trudeau now than they did a week ago. That’s virtually
three times the number who report an improved opinion of any other party
leader.
This
difference comes into focus when we create a “momentum score” for each leader
by subtracting the percentage who say their opinion of each leader has worsened
from the percentage who say it has improved. While both Harper and NDP Leader
Thomas Mulcair receive negative momentum scores, Trudeau’s has moved farther
into positive territory since last week:
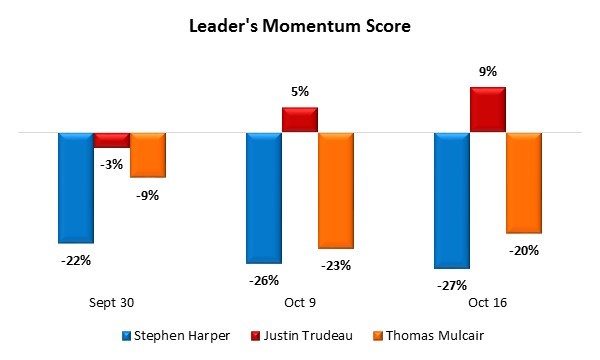
Conservative strengths:
As
has been the case throughout the campaign, the CPC still has the most committed
support base. Roughly two-thirds of Conservative supporters (65%) say they’re
absolutely certain they will vote for the party’s candidate in their riding,
compared to just half of Liberal and NDP supporters who are this firm in their
party support.
Indeed,
this commitment is reflected in the party preference of those who have already
voted in advance polls. Among advance voters, the Conservatives and Liberals
are tied at 34 per cent apiece.
Older
Canadians – long a key component of the CPC base – are primarily responsible
for this result. Those over age 55, and especially those over 65, are
disproportionately likely to have voted at advance polls. They also continue to
disproportionately favour the CPC:
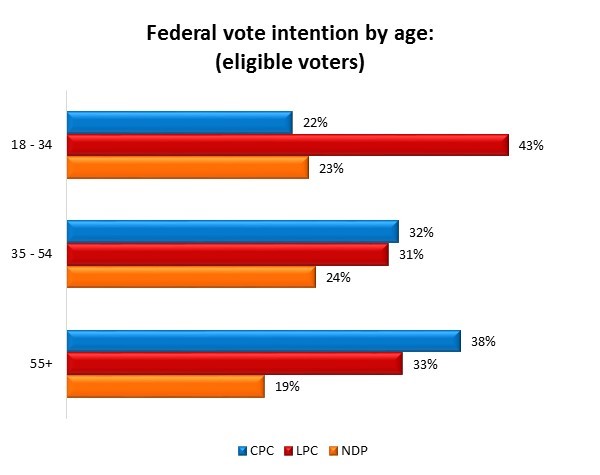
This
older base is one of the Conservatives’ greatest strengths, because actual
voter turnout is historically — and recently — much higher among older voters
than among the younger groups.
Because
of this variation in turnout across age groups, the Angus Reid Institute
reports not only eligible voters’ intentions, but also likely voters (see notes
on methodology at the end of this release).
Using
our likely voter model, we find the Liberals’ lead over the CPC narrows to a
single point. Ultimately, so much will depend on the Liberals’ ability to
deliver its vote – a task made more challenging given their relative youth.
Another
potential rally point for the Conservatives: Harper remains competitive with
Justin Trudeau on the key question of which leader would make the best prime
minister (see the additional discussion later in this release).
Anticipated Election Night Outcomes:
Regardless
of how respondents themselves indicate they’ll vote, their views on which party
they think will win the election are of note.
On
this question, the Liberals again have the momentum. More Canadians think the
LPC will win the election (42%) than the CPC (26%) or the NDP (7%).
The
top two parties have switched positions since ARI asked this question earlier
in October. At that time, one-third (33%) said they expected the Conservatives
to win, while only 27 per cent predicted a Liberal victory and 10 per cent
picked the NDP:
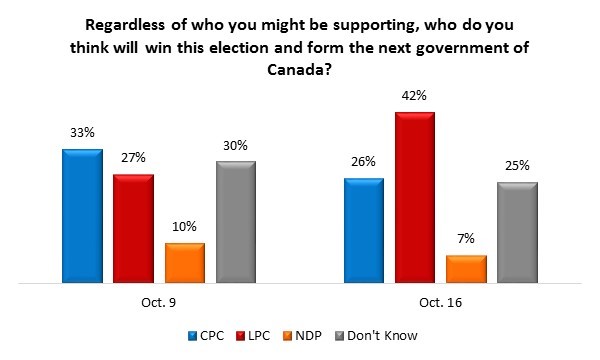
While
opinion on which party will win the election is still somewhat divided, there
is a clear consensus that whichever party wins is not likely to capture a
majority of seats in Parliament. Fully two-thirds (67%) of those predicting a
winner in the election say they expect the victorious party to form a minority
government.
The
following graph shows how respondents view each of the parties’ chances for a
majority or minority:
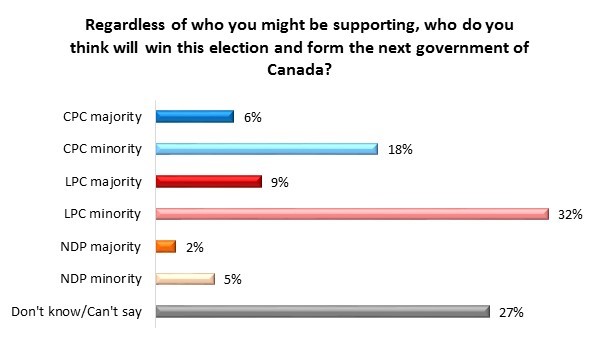
Best Prime Minister:
On
the key measure of best Prime Minister, Justin Trudeau finds himself in a
statistical tie with Stephen Harper – the highest he’s been over the course of
this campaign:
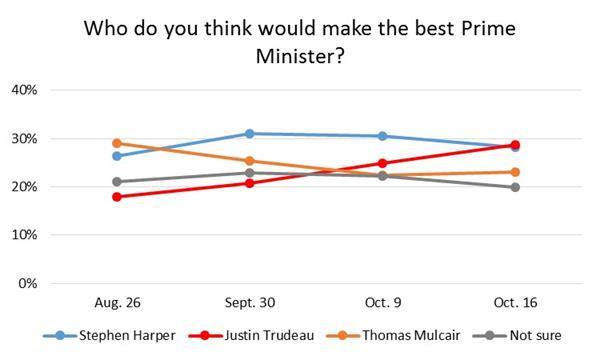
Conclusion:
While
the LPC has the lead and the momentum as voters head to the polls, other
factors may lead to shifts in support over the last 72 hours of the campaign.
Among them:
·
Late breaking events that either galvanize or
turn off voters as they commit to their voting choice. Some examples may be the
resignation of Liberal co-chair Dan Gagnier over allegations ofinappropriate lobbying, or Conservative rallies attended by Rob Ford. While it is arguably getting too close to
the wire for potential scandals or negative reports to create a stampede away
from a party, final days are no strangers to significant shifts in support.
·
Vote efficiency: An “efficient” vote
distribution is one that spreads a party’s total support over the country or a
given region in such a way that it maximizes the number of seats won. Under Stephen Harper, the
Conservatives have had a higher vote efficiency than any other party –
spreading its share of the popular vote over a collection of ridings won by
just a few percentage points more than the runner-up.
·
The “Shy Tory” effect: While many polls –
especially those with live telephone interviewers – show the Liberals with a
substantial lead over the CPC, past elections in Canada and elsewhere (most recently in the U.K. earlier this year) have yielded
higher-than-predicted turnouts for conservative parties. One explanation for
this is that supporters of these parties are reluctant to tell pollsters that
they plan on voting for them. Whether would-be Canadian Conservative voters
have kept mum this time around remains to be seen.
Notes on Methodology
ARI
has analyzed this political polling data through two sets of filters.
The
data from all survey respondents or “eligible voters” uses
standard census-based targets to ensure a national sample that is
representative of the adult Canadian population as a whole by key demographics
such as region, gender, age and education. All survey results are reported for
this total group.
For
the vote projection numbers, we also report on “likely voters” where
we’ve applied a weighting structure that further adjusts our sample to reflect
known variations in voter turnout – specifically across age groups – while also
filtering based on respondents’ own identified reported past voting attendance.
We
have developed this approach because we feel strongly that it is the
responsible thing to do when reporting on electoral projections. With declining
voter turnout, there exists an increasingly important divergence between
general public opinion – which still includes the still valid views of the
almost 40 per cent of Canadian adults who don’t vote — and the political
orientation of the 60 per cent of likely voters whose choices actually decide
electoral outcomes.
Source: http://angusreid.org/election-2015-liberals-edge-conservatives-heading-into-last-campaign-weekend/
LATIN
AMERICA
Brazilian
perception of the crisis is worse in 2015 than in 1999
Note:
You are reading googletranslation of a Portuguese survey.
10.20.2015
Study compares economic
indicators and population opinions on the federal government during the Cardoso
years and re-election of Dilma
Inflation in the Cardoso
government doubled twice, from 1.7% to 3% and 6.3%.
With Dilma, he started from a higher level, but grew proportionally less: from
6.4% to 8.1% and, months later, to 9.5%.
A
study by IBOPE Intelligence compares the 1999 and 2015 crises and points the
reaction of Brazilians in these periods of transition from the first to the
second government of Fernando Henrique Cardoso and Dilma Rousseff. The result
reveals how the perception of population changes in the face of similar
economic scenarios.
In December of the year in
which reelected, both Dilma as FHC experienced a reduction of 0.2% of gross
domestic product (GDP). This
rate reached next March to -2.0% for PT and -2.6% for the toucan. Six months later, worse: -2.5% and -3.3%, respectively.
At the same
time, the bad rates and bad of both increased and exceeded positive ratings. For Cardoso, 15% in December
1998 to 41% in March 1999, and 51% in September. In the case of Dilma, who came from a higher negative level,
growth was similar: 27% (December) to 64% (March) to 69% (September).
In the same period,
inflation under the government of Fernando Henrique doubled twice, from 1.7% to
3% and 6.3%. With Dilma, set off again to a
higher level, but grew proportionally less: from 6.4% to 8.1% and, months
later, to 9.5%. However, pessimism is higher today: those who think that
inflation will increase grow from 72% to 76%. At
the time of FHC, reached 62%, but dropped to 51%.
With unemployment was the opposite: the official rate grew more slowly in
government FHC: from 6.3% to 8.2%, and then fell to 7.4%. With Dilma, it was 4.3% to 6.2% and now reaches 7.6%.
The perception of rising unemployment among Brazilians grew from 68% to 73% in
the Cardoso administration, but then fell to 62%. With Dilma, left 55% but not stopped rising: 67% and now 70%.
In relation to income,
while under Cardoso who bet that would have less money ranged from 22% to 26%
and then fell to 19%, under Dilma the rate of those who are afraid of getting
shot poorest 15% to 39%.
Source: www.ibope.com.br
AUSTRALASIA
Internet
banking growth and satisfaction outstrips other channels
The proportion of bank customers using the internet
( both via website or mobile) to deal with their bank in an average four week
period has now grown to 62.2%, well ahead of the more traditional branch, now
only used by 32.3%. The satisfaction level of internet banking is 90.2%, compared
to branches with 88.4%.
These are the latest findings from Roy Morgan’s
Single Source survey of over 50,000 people pa.
Growth
in internet banking
Over
the last two years, the proportion of bank customers using branches in an
average four week period has declined from 35.5% to 32.3%, while total internet
banking has increased from 58.6% to 62.2%.
Channel
used* to deal with banks
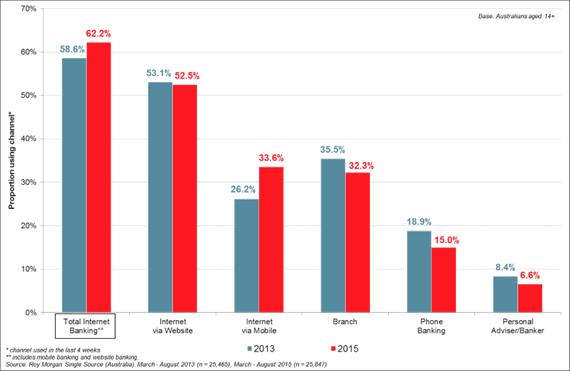
Although
internet banking via the website remains the major channel used, it declined
marginally from 53.1% in 2013 to 52.5% currently. The only area of growth over
the last two years was with mobile banking which has increased from 26.2% in
2013 to 33.6% of the population in 2015. Over this period, phone banking
declined (18.9% to 15.0%) and the use of a personal advisor/banker also
declined (8.4% down to 6.6%).
Internet
banking leads in satisfaction
It
is not surprising that the rapid growth of internet banking is associated with
higher satisfaction levels than for traditional channels.
Internet
banking using a website has the highest satisfaction level of all channels with
90.4%, followed by mobile banking with 89.9%.
Satisfaction
with channel used* dealing with banks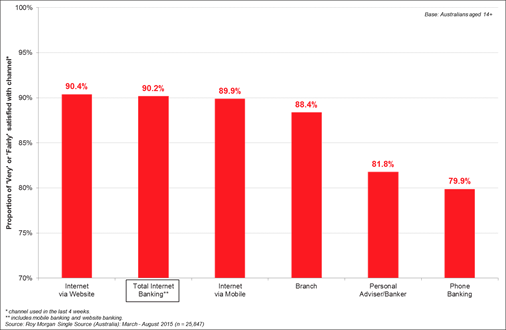
Satisfaction
with branch banking is lower than for the internet with 88.4%, followed by
personal advisor/banker (81.8%) and phone banking (79.9%).
Satisfaction
with internet banking varies between banks
The
satisfaction level with internet banking is over 90% in total and for each of
the major banks it is higher than their overall customer satisfaction levels.
There are differences however between banks in internet customer satisfaction,
with Suncorp having the highest (93.3%), followed by the CBA (92.7%).
Satisfaction
with internet banking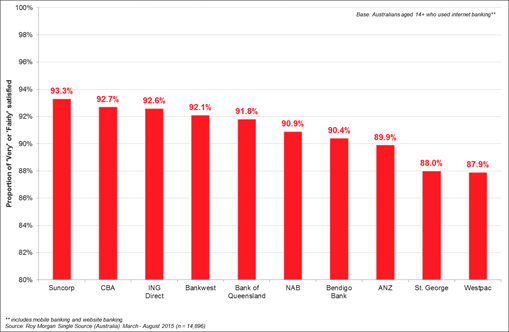
The
only banks to score less than 90% satisfaction were the ANZ (89.9%), St George
(88.0%) and Westpac (87.9%)
Norman
Morris, Industry Communications Director, Roy Morgan Research says:
“With
the rapid growth in internet banking, it will become more important that
satisfaction with this channel will need to be monitored against competitors
and with other methods for dealing with banks if this lead is to be sustained.
“A
great deal of attention is currently being paid to overall satisfaction and
advocacy across the banking industry but this needs to be expanded to looking
at satisfaction at the channel level as this is likely to impact overall
satisfaction.
“It
is worth noting that clearly the highest users of website internet banking are
the high value customer, ie. the top 20% (top quintile) that controls 63% of
the total market value of financial services. Nearly three quarters of this
high potential group conduct internet banking using the website, making it
imperative to understand functionality needs, reliability and satisfaction with
this critical segment.”
MULTI-COUNTRY
SURVEYS
One
in three across the world don’t always wash their hands properly after going to
the toilet
A global survey from WIN/Gallup
International, the world’s leading association in market research and polling
shows that 65% of those polled across 64 countries‘agree’ that washing their
hands with soap and water is something they automatically do – however 26%
somewhat agree, while just under one in ten (8%) disagree.
The survey interviewed a total of 62,398
people across the world and found there are significant differences by region.
Those from China and Japan were significantly less likely to automatically use
soap and water (23% and 30% respectively), while those from Saudi Arabia were
most likely to wash hands with soap and water.
Within Europe, the Greeks reported to be the
cleanest, 85% agreeing that they wash their hands with soap and water automatically,
the Dutch the least likely (50%). In the Americas Colombia proved to be the
cleanest with 93% agreeing that they automatically wash their hands with soap
while Mexico was the least likely to agree with 32% either simply somewhat
agreeing, somewhat disagreeing or disagreeing completely.
Dr Myriam Sidibe, Hygiene and Nutrition
Social mission Director for Unilever, said: “Unilever’s soap brand, Lifebuoy,
has a long legacy in increasing awareness of the importance of hand washing
with soap. We know that there are around 11 occasions in a day where we should
wash our hands with soap, yet soap is only used about 1 to 2 times in a day and
sometimes as little as once in a week. This is the reason why we have set up
the ambition to implement the largest hygiene program in the world reaching 1
billion people by 2020 and already reached 257 million people in 24 countries
and is committed to reaching more children and saving more lives.”
Around the world, 440million school days are
lost every year due to water, sanitation and hygiene related diseases
(WHO/UNICEF 2013). It is estimated that hand washing with soap alone could save
over 650,000 lives each year (Greenland et al 2012)
Jean-Marc Leger, President of WIN/Gallup
International Association, said: “It is estimated that 35% of the global
population has no access to safe bathroom facilities and that an alarmingly
high number of people across the world are not washing their hands with soap
and water, either because of a lack of facilities or bad habits. We are proud
to release this study and to contribute to raising awareness worldwide about
the benefits of handwashing with soap” –
ENDS
NOTES FOR EDITORS
Methodology: The WIN/Gallup International
Survey is an annual tradition initiated by and designed under the chairmanship
of Dr. George Gallup in 1977. It is conducted every year since then. This year
it was carried out by the WIN/Gallup International Association in 64 countries
around the world.
Sample Size and Mode of Field Work:
A total of 62,398 persons were interviewed
globally. In each country a representative sample of around 1000 men and women
was interviewed either face to face (30 countries; n=32258), via telephone (12
countries; n=9784) or online (22 countries; n=20356). Details are attached. The
field work was conducted during September 2014 - December 2014. The margin of
error for the survey is between 2.14 and 4.45 +3-5% at 95% confidence level.
The global average has been computed
according to the share of the covered adult population of the surveyed
countries.
Ipsos
"Sustainable Future Attitude Survey" Newly Released
October 09, 2015
On the eve
of the UN General Assembly, the United Nations will generate new sustainable
development goals, to succeed its Millennium Development Goals. For this
reason, Ipsos launched a survey on foreign aid and sustainable development
goals among people in 17 countries in the world (both traditional and emerging
donors)
In
order to understand the attitudes of people around the world towards foreign
aid, R & D expenditures, the importance of regional development, as well as
who should pay, and how much should be paid and other issues, through a series
of articles, the survey will discuss and reveal: what are the most important
development goals of a country? How to measure and achieve these goals? Why
different countries treat foreign aid so differently? And who shall be
responsible for global development?
In
this study, Ipsos Global Online Survey conducted data collection and research
among people from 17 countries worldwide: Australia, Brazil, Canada, China,
France, Germany, Great Britain, Hungary, India, Japan, Russia, South Africa,
South Korea, Sweden, Turkey, United Arab Emirates and the United States, and
collected representative data from these 17 countries, and obtained the results
after the data being analyzed and calculated by data experts.
According
to the Ipsos' survey among people in 17 countries, people around the world
overwhelmingly support the achieving of sustainable development goals. Then,
how do they think of the importance of the 17 goals related to a sustainable
future?
Europeans
Most Negative Toward Immigration
October 16, 2015
WASHINGTON,
D.C. -- Well before the flow of migrants into Europe reached crisis proportions
this year, a Gallup study of attitudes toward immigration in 142 countries
found people in Europe, on average, were the most negative in the world toward
immigration. The majority of residents (52%) said immigration levels in their
countries should be decreased. In every other major region of the world, people
were more likely to want immigration levels in their countries to either stay
at their present level or to increase, rather than to decrease.
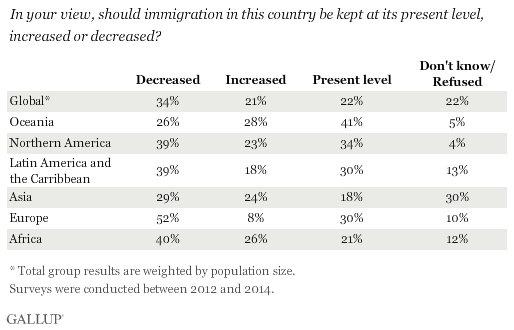
These
findings are among those featured in the International Organization for
Migration's new report, How
the World Views Migration, which is based on Gallup World Poll interviews with more
than 183,000 adults across 142 countries between 2012 and 2014. Adults
worldwide were asked two questions about immigration: "In your view,
should immigration in this country be kept at its present level, increased or
decreased?" and "Do you think immigrants mostly take jobs that
citizens in this country do not want (e.g., low-paying or not prestigious
jobs), or mostly take jobs that citizens in this country want?"
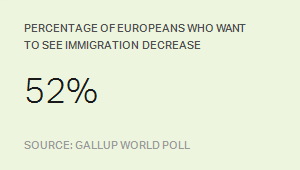
Attitudes
Toward Immigration Vary Throughout Europe
While Europe
overall may be the most negative region in the world in regard to immigration
levels, it's important to note that the regional average is largely affected by
countries with large populations such as the United Kingdom and Russia, where
69% and 70% of their respective publics want immigration levels to decrease.
Britons and
Russians are not alone in their attitudes, but they do not speak for all of
Europe. Of the 40 countries included in the larger European region, residents
in less than half (17 countries) are more likely to want immigration levels decreased
than the other two options combined.
In fact, the
majority of adults in nearly all of the 10 Northern European countries --
except the United Kingdom, Latvia and Lithuania -- would like the levels of
immigration to stay the same or increase.
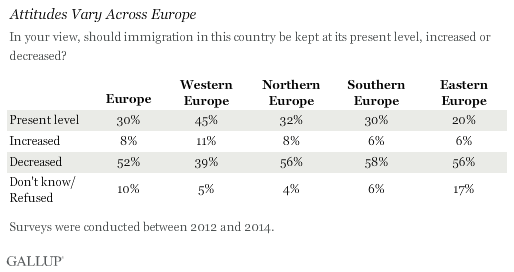
Elsewhere in
Europe, sentiment is negative, if not more so, in many Mediterranean countries
that historically have been the entry points to the continent for many
migrants. In fact, adults in Greece -- one of the main countries of first
arrival on the Eastern Mediterranean route -- are among the most likely in the
world to want immigration levels decreased, with 84% expressing this view. This
sentiment is shared by 56% of residents in Spain, 67% of those in Italy and 76%
of those in Malta.
More
Educated Europeans More Positive Toward Immigration
Negative and
positive opinions toward immigration exist in every region and every country;
however, certain characteristics are consistently associated with favorable or
opposing attitudes toward immigration. The study finds that adults with a
university degree are typically more likely than those with lower levels of
education to want to see immigration kept at its present level or increased in
their countries.
Generally,
in Europe, those with the highest level of education (university degree) are
more likely to be positive toward immigration than those with less education
(secondary or lower education). However, among those with university degrees,
opinions are divided, with 46% favoring increased or stable levels of immigration
and an equal 46% favoring decreased immigration. In contrast, Europeans with
secondary or lower education are solidly more likely to favor decreasing
immigration than to favor increasing it or keeping it the same.
Europe is
interesting because three different scenarios play out across the four major
subregions and the profiles of those who are more positive or negative toward
immigration look different. In Eastern Europe, for example, those with
university degrees are more negative than those with primary education or
lower. This is largely driven by attitudes in large countries such as Russia
and Ukraine, as there are few differences in opinion by education in most of
the other countries in the region. However, different dynamics are at play in
these two countries.
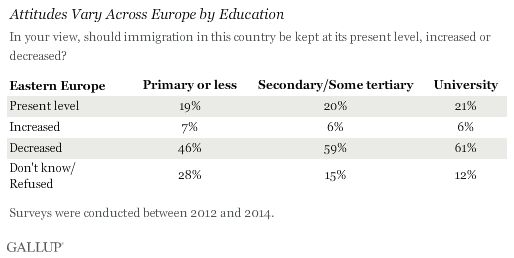
Despite the
economic stagnation in Russia during the global economic downturn, the reasons
Russians want to see less immigration appear to have little to do with the
economy. Russians mostly do not see migrants as competitors for their jobs:
Majorities in the highest education groups (61% of respondents with university
degrees and 55% of those with secondary education) say that migrants take jobs
that regular citizens do not want, as do nearly half (47%) of those with
primary or lower education.
In Ukraine,
whose economy was in near ruins before the revolution in 2014, economics
appears to be a factor in people's attitudes toward immigration. Only 26% in
the most highly educated group say that migrants take jobs that citizens do not
want. The majority say migrants take jobs that Ukrainians want or believe it is
a mix of both situations. This indicates that many native citizens feel
migrants are directly competing with them for jobs.
Implications
These
findings, among many others presented in the new report, represent the first
steps toward understanding the lenses through which people view immigration on
a global level.
Looking at
how most people in the world view immigration, rather than a particular region
or a particular country, it appears that attitudes toward immigration are not
as negative as often suggested. When the surveys were carried out, in every
major region of the world, with the exception of Europe, people were more
likely to want immigration levels in their countries to either stay at the
present level or to increase, rather than to decrease.
At the same
time, the results also reveal that negative and positive opinions toward
immigration exist in every region and every country, illustrating the
challenges that governments face in creating cohesive migration policies that
align with their countries' needs and the public's desires.
Frank Laczko and Marzia Rango of IOM were
contributing authors to the How
the World Views Migration report.
Survey
Methods
Gallup
conducted a total of 183,772 interviews in 2012, 2013 and 2014. Most data for
this report were collected in 2012 and 2013. In 2014, data were collected for
Canada, Australia, Hong Kong, China, Switzerland and Norway. For this report,
typically 1,000 interviews were done per country. A few countries such as India
and China have higher sample sizes (more than 2,500 each), and all former
Soviet Union countries included multiple survey administrations with a minimum
of 1,000 interviews per administration.
With some
exceptions, all country samples are probability based and nationally
representative of the resident population aged 15 and older. The coverage area
is the entire country including rural areas, and the sampling frame represents
the entire civilian, non-institutionalized, aged 15 and older population of the
country. Exceptions include areas where the safety of interviewing staff is
threatened, scarcely populated islands in some countries and areas that
interviewers can reach only by foot, animal or small boat. In Gulf Cooperation
Council countries, at the time of data collection Gallup was able to interview
only nationals and Arab expatriates.
Telephone
surveys are used in countries where telephone coverage represents at least 80%
of the population or is the customary survey methodology. In Central and
Eastern Europe, as well as in the developing world, including much of Latin
America, the former Soviet Union countries, nearly all of Asia, the Middle East
and Africa, an area frame design is used for face-to-face interviewing.
New
global poll reveals the top 5 workplace challenges facing G20 women
Published:15 October 2015
Fieldwork:24 July - 25 August 2015
A new poll by Ipsos MORI carried out across
the G20 reveals the top challenges faced by women in the workplace. The survey,
which was conducted on behalf of the Thomson Reuters Foundation, asked women
across G20 countries what top five challenges they feel they face at work. The
results show that work-life balance is the most mentioned issue. This is
followed by equal pay and having the same career opportunities as men.
Harassment by co-workers was also mentioned key issue in our survey and nearly
one in three G20 women say they have been harassed at work.
The results reveal even more on a country by
country basis. The data show how perceptions of equality at work can vary
greatly, likely because of different cultural expectations. In places like the
UK and France women were much more likely to point out inequality in the
workplace, while in Turkey and India they were more likely to point to other
issues. There were also key findings when comparing age groups: younger G20
women were found to be more upbeat about their future in the workplace than
older women.
·
To
find out more about the results and to download the data, please visit the Thomson
Reuters Foundation website:The 5 key issues facing women working in the
G20.
Technical
note:
The survey was carried out online by Ipsos Global @dvisor
from 24 July– 7 August 2015 and face-to-face in South Africa and Indonesia from
6 August – 25 August 2015. Respondents are aged 18-64 in the US and Canada, and
16-64 in all other countries. Data are weighted to match the population profile
of each country.