BUSINESS & POLITICS IN THE
MUSLIM WORLD
GLOBAL OPINION REPORT NO 471
February 05 – 11, 2017
Presentation: February 15, 2017
Contents
44% of Pinoys believe
that falling in-love with more than one person at the same time is possible
Majority in Russia See
Domestic Violence as Serious Problem
The 2016 Vladimir Putin
Press Conference: First Impressions
Assessment Of Living
Conditions Of The Ukrainian Working-Age Population
Most Brits think the EU
needs the UK at least as much as the UK needs the EU
Nearly one in five Brits
now have a favourable view of Donald Trump
Captains of Industry say
business is already suffering the consequences of Brexit
Government
Dissatisfaction Returns as Most Important Problem
Congress Job Approval
Jumps to 28%, Highest Since 2009
Americans See US World
Standing as Worst in a Decade.
GOP Satisfaction With US
Direction Soars, Democrats' Drops
Americans Mixed on
Secretary of State Rex Tillerson
Digital audience growth
continued to drive newspaper readership higher in 2016
Most NATO Members in
Eastern Europe See It as Protection
How Americans Encounter,
Recall and Act Upon Digital News
INTRODUCTORY NOTE
This week report
consists of nineteen surveys. Two of these are multi-country studies while the
rest are national surveys from different states across the globe.
471-43-20
Commentary:
Most
NATO Members in Eastern Europe See It as Protection
Most NATO Members in Eastern Europe See It as Protection
FEBRUARY
10, 2017
 WASHINGTON, D.C. -- While U.S. President Donald Trump, even
as recently as January, referred to NATO as "obsolete," residents in
many NATO member countries in Eastern Europe associate the alliance with the
protection of their countries. This includes majorities in Poland, Estonia and
Lithuania, where NATO allies, including the U.S., have recently sent troops to
quell security concerns after Russia's actions in Ukraine.
WASHINGTON, D.C. -- While U.S. President Donald Trump, even
as recently as January, referred to NATO as "obsolete," residents in
many NATO member countries in Eastern Europe associate the alliance with the
protection of their countries. This includes majorities in Poland, Estonia and
Lithuania, where NATO allies, including the U.S., have recently sent troops to
quell security concerns after Russia's actions in Ukraine.
Eastern
European Countries' Views of NATO in 2016
Do you
associate NATO with protection of your country, as a threat to your country or
do you see it as neither protection nor a threat?
|
Protection |
Threat |
Neither |
|
|
% |
% |
% |
|
|
Kosovo |
90 |
3 |
6 |
|
Albania |
70 |
3 |
22 |
|
Poland |
62 |
8 |
22 |
|
Lithuania |
57 |
13 |
25 |
|
Estonia |
52 |
17 |
26 |
|
Croatia |
52 |
17 |
19 |
|
Romania |
50 |
8 |
25 |
|
Hungary |
49 |
9 |
25 |
|
Latvia |
49 |
16 |
29 |
|
Czech
Republic |
46 |
13 |
27 |
|
Macedonia |
45 |
13 |
24 |
|
Slovakia |
37 |
19 |
35 |
|
Bosnia
and Herzegovina |
28 |
21 |
38 |
|
Bulgaria |
28 |
20 |
34 |
|
Greece |
23 |
19 |
45 |
|
Montenegro |
21 |
29 |
35 |
|
Serbia |
6 |
64 |
19 |
|
GALLUP |
|||
The U.S.
is a founding member of NATO, but its commitment to the alliance has been
questioned after Trump publicly raised doubts about NATO's relevance and its
funding before he took office. However, according to NATO, Trump agreed on
Sunday to attend a meeting of NATO leaders in May, and he and NATO
Secretary-General Jens Stoltenberg "reconfirmed the importance of the
alliance in troubled times." And on Monday, Trump reaffirmed his support
for NATO on a visit to the headquarters of the U.S. Central Command.
How the
U.S. interacts with NATO has far-reaching consequences overseas, because many
Eastern European countries count on NATO for protection. Last October, the
United Kingdom sent 800 troops to Estonia. And shortly before President Barack
Obama left the White House, the U.S. sent 4,000 troops to Poland to protect it
and neighboring NATO allies Estonia, Lithuania and Latvia from perceived
aggression from neighboring Russia.

Kosovo,
although not a NATO member, received military support from NATO during the
Kosovo War between the former Yugoslavia and the Kosovo Liberation Army (KLA),
and its residents overwhelmingly (90%) look at the alliance as protection. The
same holds true for residents of NATO member Albania (70%) -- which also
supported the ethnic Albanian KLA during the war. Similarly, it is not
surprising that 64% of Serbians in 2016 view NATO as a threat and 6% see it as
protection.
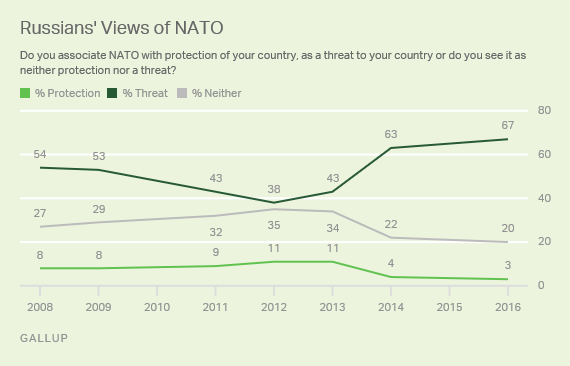
Russia,
Countries in Russia's Sphere of Influence See NATO as a Threat
With
NATO's inclusion of several post-Soviet states after the dissolution of the
Soviet Union, and its rebuking of Russia's involvement in Ukraine, it is no
surprise that Russia is at odds with NATO. Sixty-seven percent of Russians in
2016 view NATO as a threat, which is up 29 percentage points since 2012, and is
the highest number that Gallup has recorded since it started tracking Russians'
views on NATO in 2008.
Residents
of countries in Russia's sphere of influence that are not NATO members tend to
share Russia's views on the alliance, if they have an opinion. Fifty-four
percent of Belarusians view NATO as a threat, a 19-point jump from four years
ago. Along with the Russians and Belarusians, more people in Ukraine (35%),
Kazakhstan (31%), Kyrgyzstan (30%), Moldova (27%), Armenia (20%) and Tajikistan
(34%) view NATO as a threat than as protection.
Views of
NATO in Post-Soviet States
Do you
associate NATO with protection of your country, as a threat to your country or
do you see it as neither protection nor a threat?
|
Protection |
Threat |
Neither |
|
|
% |
% |
% |
|
|
Belarus |
3 |
54 |
30 |
|
Russia |
3 |
67 |
20 |
|
Armenia |
8 |
20 |
38 |
|
Tajikistan |
8 |
34 |
20 |
|
Moldova |
16 |
27 |
38 |
|
Kyrgyzstan |
19 |
30 |
12 |
|
Azerbaijan |
21 |
16 |
44 |
|
Kazakhstan |
25 |
31 |
27 |
|
Ukraine |
29 |
35 |
26 |
|
Georgia |
37 |
8 |
35 |
|
GALLUP WORLD POLL, 2016 |
|||
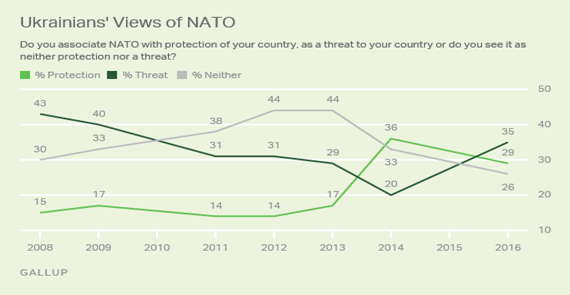
Ukrainians
Sour on NATO
The proportion
of residents of Ukraine -- a potential NATO member state until a few years ago
-- who view NATO as a threat has increased in recent years after years of
steady decline between 2008 and 2014. In 2014, after NATO sanctioned Russia
after it annexed Crimea, Ukrainians for the first time were more likely to see
NATO as protection (36%) than a threat (20%). However, the percentage viewing
it as a threat shot back up to 35% in 2016 as the Ukrainian population has
grown tired of the ongoing conflict between its military and Russian-backed
separatists, as well as a poor economy and rising crime rates. Without a clear
end in sight to the conflict, Ukrainians may be losing confidence in NATO's
ability to help them in this crisis.
Implications
With
Russia's recent military activity in the region, and with many Eastern European
countries relying on the U.S. and NATO for protection, the United States'
future commitment to NATO is at a critical point. If the U.S. were to leave
NATO, Russia would stand to benefit because a NATO without the United States'
full cooperation would be less equipped to curtail any Russian military and
political expansion. It would also strain the United States' relationships with
many European allies, potentially weakening important military and economic
partnerships that are vital to the United States' foreign policy interests.
SURVEY METHODS
Results
are based on telephone interviews conducted throughout 2016 in the countries
included in the analysis with a random sample of approximately 1,000 adults,
aged 15 and older, living in each country. In Russia, the sample size was 2,000
adults. For results based on the total sample of national adults, the margin of
sampling error ranges from ±2.7 percentage points to ±3.9 percentage points at
the 95% confidence level. All reported margins of sampling error include
computed design effects for weighting.
SUMMARY OF POLLS
SOUTHEAST
ASIA
44% of Pinoys
believe that falling in-love with more than one person at the same time is
possible
Forty-four percent of adult Filipinos believe that it is definitely/somewhat possible, while 43% believe that it is somewhat/definitely impossible, to fall in-love with more than one person at the same time, according to the Fourth Quarter 2016 Social Weather Survey, conducted from December 3-6, 2016. (SWS)
February 09, 2017
EAST EUROPE
Majority in Russia See Domestic Violence as Serious Problem
Russian President Vladimir Putin signed a law Tuesday that partially decriminalizes certain types of domestic violence, a step that many Russians may see as in the wrong direction. Majorities of Russians continue to view domestic violence as a serious problem in their country (58%) and say that their government is not doing enough to fight it (51%). Only 22% believe that the government is doing enough. (Gallup USA)
February 09, 2017
The 2016 Vladimir Putin Press Conference: First Impressions
Half of Russians are aware of what the press conference involving Vladimir Putin was about. The level of satisfaction with the presidents’ answers is extremely high this year. (VCIOM)
December 29, 2017
Assessment Of Living Conditions Of The Ukrainian Working-Age Population
According to the research carried out by the Sociological Group "Rating" in December 2016, the lowest level of daily stress among the respondents was caused by family relations, professional activity, and external environment; the highest – exposure to war and military danger, socio-political instability in the country, corruption, and personal financial status. (Ratings)
February 07, 2017
WEST EUROPE
Most Brits think the EU needs the UK at least as much as the UK needs the EU
As the government prepares to negotiate with Brussels, the attitude of the remaining EU nations to the UK’s demands will be vital to the success or failure of negotiations. (YouGov)
February 2017
Nearly one in five Brits now have a favourable view of Donald Trump
Despite outrage at the actions that Donald Trump has taken in his first few weeks as president – some of which provoked mass protests across the United Kingdom – new YouGov research reveals that British people have an increasingly favourable opinion of the new US commander in chief. (YouGov)
February 06, 2017
Captains of Industry say business is already suffering the consequences of Brexit
The annual Ipsos MORI Captains of Industry study finds that at the time of interviewing, 58% of Captains felt that since the referendum the decision to leave the EU has had a negative impact on their business. A third of Captains (31%) didn’t feel that Brexit had made any difference to the business situation for their company and just 11% feel it has made a positive impact. (Ipsos Mori)
February 05, 2017
UK: NHS Pressures Survey
A poll by Ipsos MORI of 1,033 adults for the BBC has suggested three-quarters of adults surveyed would find it acceptable to increase charges for people coming from abroad as a way of raising more money for the NHS. Respondents were asked to rate a number of ways in which some people suggested that funding for the NHS be increased to maintain the current level of care. (Ipsos Mori)
February 06, 2017
NORTH AMERICA
Government Dissatisfaction Returns as Most Important Problem
Dissatisfaction with the government now clearly leads as the issue Americans see as the most important problem facing the U.S. The 19% mentioning the government is up from 11% last month and is now significantly higher than the percentage mentioning any other issue. The next-most-commonly mentioned problems are immigration (13%) and unifying the country (10%) -- both up from last month -- as well as the economy in general (9%). (Gallup USA)
February 9, 2017
Congress Job Approval Jumps to 28%, Highest Since 2009
Congressional job approval jumped to 28% this month from 19% in January. This is the largest month-to-month increase since a 12-percentage-point rise between January 2009, when former President Barack Obama was first inaugurated, and February 2009. The current 28% job approval rating is the highest since early fall 2009 and is close to Gallup's historical average (30%). The increase comes after Donald Trump's inauguration as president gave Republicans control of the presidency and both houses of Congress. (Gallup USA)
FEBRUARY 7, 2017
Americans See US World Standing as Worst in a Decade
Americans believe the world at large sees the U.S. more unfavorably (57%) than favorably (42%), their worst assessment of the country's image in 10 years. A year ago, Americans' perceptions were more positive than negative. (Gallup USA)
FEBRUARY 10, 2017
GOP Satisfaction With US Direction Soars, Democrats' Drops
A majority of Republicans, 55%, are satisfied with the way things are going in the U.S., up sharply from 22% last month before President Donald Trump's inauguration. Democrats' satisfaction dropped from 27% to 13% in the same period. These shifts resulted in a slight uptick in Americans' overall satisfaction, from 26% to 30%. (Gallup USA)
FEBRUARY 10, 2017
Americans Mixed on Secretary of State Rex Tillerson
Recently confirmed Secretary of State Rex Tillerson starts his tenure as the top U.S. diplomat with Americans viewing him about as favorably (36%) as unfavorably (33%). Nearly as many are unfamiliar with him (30%). Republicans view him positively overall, while Democrats are negative. (Gallup USA)
FEBRUARY 10, 2017
AUSTRALASIA
Digital audience growth continued to drive newspaper readership higher in 2016
Alongside a number of success stories in print, just over half of mastheads increased their total cross-platform reach compared with the previous results to September 2016—and readership via websites and apps was again the driving force behind that growth. (Roy Morgan)
February 09, 2017
Over 12 million Australians have jobs for the first time – including over 8 million full-time jobs, but real unemployment now 9.7% (1.295m)
For the first time in January over 12 million Australians are now employed – up 368,000 over the past year. However, a total of 2.402 million Australians, 17.9% of the workforce, were either unemployed (1,295,000) or under-employed (1,107,000) - down 173,000 (down 1.8%) from January 2016. (Roy Morgan)
February 08, 2017
Business Confidence
rises in January to 116.8 (up 2.4%) driven by more confidence in the Australian
economy
Roy Morgan Research’s Business Confidence
rose 2.4% to 116.8 in January driven by increasing confidence about the
Australian economy. The rise in Business Confidence occurred despite the
Australian All Ordinaries falling slightly in January, down 44.1pts (-0.8%) to
5,675 in contrast to the record highs on US indices following Donald Trump’s
victory in the US Presidential Election. (Roy Morgan)
February 08, 2017
MULTI-COUNTRY STUDIES
WIN/GIA 40th Annual
Global End of Year Survey reveals Happiness improves despite Economic
Confidence falling
WIN/Gallup International, the world’s leading
association in market research and polling, has published today its 40th Annual
End of Year Survey exploring the outlook, expectations, views and beliefs of
68,759 people from 69 countries across the globe. (WINGIA)
February 2017
Most NATO Members in
Eastern Europe See It as Protection
While U.S. President Donald Trump, even as
recently as January, referred to NATO as "obsolete," residents in
many NATO member countries in Eastern Europe associate the alliance with the
protection of their countries. This includes majorities in Poland, Estonia and
Lithuania, where NATO allies, including the U.S., have recently sent troops to
quell security concerns after Russia's actions in Ukraine. (Gallup USA)
FEBRUARY 10, 2017
CYBER WORLD
How Americans
Encounter, Recall and Act Upon Digital News
When following links, online news consumers
could recall the name of the news outlet 56% of the time. (Pew Research Center)
FEBRUARY 9, 2017
SOUTHEAST ASIA
471-43-1/POLL
44% of Pinoys believe that falling in-love with more than one person at the same time is possible
55% are very happy with their love lives
Fourth Quarter 2016 Social Weather Survey
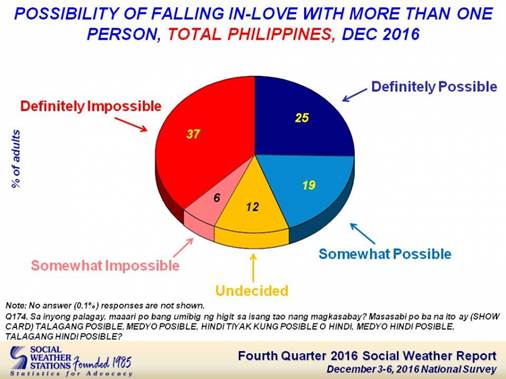
Forty-four percent of adult Filipinos believe that it is definitely/somewhat possible, while 43% believe that it is somewhat/definitely impossible, to fall in-love with more than one person at the same time, according to the Fourth Quarter 2016 Social Weather Survey, conducted from December 3-6, 2016.
The survey asked, “In your opinion, is it possible to fall in-love with more than one person at the same time? (Sa inyong palagay, maaari po bang umibig ng higit sa isang tao nang magkasabay?)"
It found 25% saying that it is definitely possible (talagang posible), 19% somewhat possible (medyo posible), 6% somewhat impossible (medyo hindi posible), and 37% definitely impossible (talagang hindi posible). Twelve percent were undecided if possible or not (hindi tiyak kung posible o hindi) [Chart 1].
This gives a net possibility score (% definitely/somewhat possible minus % somewhat/definitely impossible) of +1, classified by SWS as neutral.
To the follow-up question, “Have you experienced falling in-love with more than one person at the same time? (Naranasan na po ba ninyo na umibig sa higit pa sa isang tao ng magkasabay?)”, about one in five (19%) said that they already had [Chart 2].
The net possibility score of falling in-love with more than one person was a strong +47 (69% possible, 22% impossible) among those who have experienced it, three grades higher than the poor -10 (39% possible, 48% impossible, correctlyrounded) among those who haven’t experienced it [Chart 3].
(The SWS terminology for net possibility: +50 and above, "very strong"; +30 to +49, "strong"; +10 to +29, "moderate"; +9 to -9, "neutral"; -10 to -29, "poor"; -30 to -49, "weak"; -50 and below, "very weak." SWS considers the movement from one classification to another as either an "upgrade" or "downgrade.")
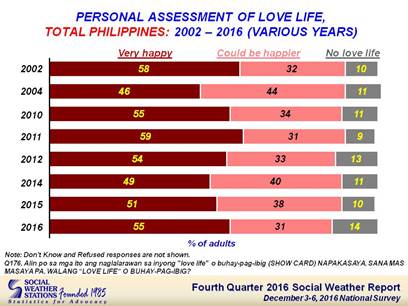
The December 2016 survey also found that 55% say their love life is very happy, 31% say it could be happier, and 14% saythey do not have a love life [Chart 4].
This compares with 51% who said their love life was very happy, 38% who said it could be happier, and 10% who said theydo not have a love life in 2015.
The proportion of those who were very happy (napakasaya) with their love life was 58% when SWS first surveyed it in 2002. It fell to 46% in 2004, and recovered to 50s levels from 2010 to 2012, reaching a record-high 59% in 2011. It declined to 49% in 2014 before bouncing to 51% in 2015 and 55% in 2016.
Since 2002, the proportion of those saying their love lives could be happier (sana mas masaya pa) has been at the 30s, except in 2004 and 2014 when it was at a record-high 44% and 40%, respectively. It reached its lowest percentage of 31% in 2011 and 2016.
The proportion of those who have no love life reached its highest level in 2016 with 14%, 4 points higher than 10% in 2015. It ranged from 9% to 13% from 2002 to 2014.
Neutral net possibility score among singles, married adults, and those with live-in partners
The net possibility of falling in-love with more than one person at the same time is neutral across all civil statuses.
It was +4 (45% possible, 41% impossible) among singles, +2 (46% possible, 44% impossible) among those with live-in partners, and net zero (44% possible, 44% impossible) among married adults [Chart 5].
Net possibility Moderate among men, Neutral among women
In general, the net possibility of falling in-love with more than one person was a moderate +11 (49% possible, 38%impossible) among men, one grade higher compared to the neutral -8 (40% possible, 48% impossible) among women [Chart 6].
In terms of civil status, the net possibility was a moderate +19 (51% possible, 32% impossible) among single men, two grades higher compared to the poor -13 (38% possible, 50% impossible, correctly rounded) among single women.
Among married adults, the net possibility was neutral among both men and women, at +9 (48% possible, 40% impossible, correctly rounded) and -9 (39% possible, 48% impossible), respectively.
Likewise, the net possibility was neutral for both men and women with live-in partners, at +5 (49% possible, 43%impossible, correctly rounded) and net zero (45% possible, 45% impossible), respectively.
Net possibility score by age
Among men, the net possibility of falling in-love with more than one person was moderate among ages 18-24 and 25-34, at +25 (54% possible, 29% impossible) and +10 (51% possible, 40% impossible, correctly rounded), respectively [Chart 7].
On the other hand, the net possibility was neutral among men ages 45-54 at +9 (48% possible, 39% impossible), 35-44 at +8 (47% possible, 39% impossible), and 55 and above at +7 (48% possible, 41% impossible).
As for their female counterparts, the net possibility was neutral among ages 18-24 at +4 (47% possible, 43% impossible), 35-44 at +2 (44% possible, 42% impossible), and 25-34 at -4 (42% possible, 46% impossible).
It was poor among women ages 45-54 at -13 (39% possible, 51% impossible, correctly rounded), and 55 and above at -21 (33% possible, 54% impossible).
Net possibility score by religion
Among religions, Muslims have the highest net possibility score of falling in-love with more than one person at the same time at a moderate +15 (51% possible, 36% impossible), a grade higher than Catholics, Iglesia ni Cristo, and Other religions, which are at a neutral +2 (45% possible, 43% impossible), -6 (40% possible, 47% impossible, correctly rounded), and -7 (40% possible, 47% impossible), respectively. [Chart 8]
Across religions, higher net possibility scores among men than women
Regardless of religion, the net possibility of falling in-love with more than one person at the same time was higher among men compared to women.
Among men, the net possibility was moderate among Muslims, members of Iglesia ni Cristo, and Catholics, at +21 (55%possible, 34% impossible), +14 (50% possible, 36% impossible), and +11 (49% possible, 38% impossible), respectively [Chart 9].
This is one grade higher than the neutral +6 (48% possible, 42% impossible, correctly rounded) among men with Other religions.
Among women, the net possibility was neutral among Muslims and Catholics at +7 (45% possible, 38% impossible), and -8 (40% possible, 48% impossible), respectively.
This is a grade higher than female members of Iglesia ni Cristo at -19 (34% possible, 53% impossible), and Other religions at -18 (34% possible, 51% impossible, correctly rounded), both classified as a poor net possibility.
Higher net possibility scores among those who are very happy and could be happier with their love life
The net possibility of falling in-love with more than one person at the same time was neutral among those who are very happy and could be happier with their love life, at +6 (47% possible, 42% impossible, correctly rounded), and -1 (43% possible, 43% impossible, correctly rounded), respectively [Chart 10].
This is a grade higher than the poor -11 (37% possible, 48% impossible) among those who say they have no love life.
Experience of falling in-love with more than one person is higher among those with live-in partners and singles
Experience of falling in-love with more than one person was 23% among adults with live-in partners and 21% among singles, higher compared to the 17% among married adults [Chart 11].
In general, regardless of civil status, men report having experienced falling in-love with more than one person more frequently than women.
Among those who are single, 25% of men have experienced it, compared to the 17% among women [Chart 12].
Twenty-three percent of married men have experienced it, about twice higher than women (12%).
Twenty-nine percent of men with live-in partners have experienced it, 11 points higher than women (18%).
Across all age groups, more men have also experienced falling in-love with more than one person compared to women [Chart 13].
It was highest among men aged 35-44 (29%), followed by 55 and above (25%), 45-54 (23%), 25-34 (22%), and 18-24 (21%).
Among women, it was highest among those aged 18-24 and 35-44, both with 17%, followed by 25-34 (15%), 45-54 (14%), and 55 and above (11%).
Experience of falling in-love with more than one person is highest among those who are very happy with their love life
By personal assessment of love life, experience of falling in love with more than one person was highest among those who are very happy (21%), followed by those who have no love life (19%), and those whose love life could be happier (16%) [Chart 14].
Married adults have the happiest love life
By civil status, 65% of married Filipinos say they are very happy with their love life, compared to 56% among those with live-in partners, and 28% among singles [Chart 15].
The proportion of those who say their love life could be happier was 44% among those with live-in partners, 33% among married adults, and 16% among singles.
On the other hand, the proportion of those with no love life was 56% among singles and only 1% among married adults. None of the sample with live-in partners said they have no love life.
Majorities of men and women are very happy with their love life
Majorities of 57% of men and 53% of women say they are very happy with their love life.
In terms of civil status, those very happy with their love life was higher among those who are married (Men 66%, Women 65%), compared to those with live-in partners (Men 57%, Women 55%) [Chart 16].
Among those who are single, more men (34%) are very happy with their love life than women (21%).
The proportion of people who say their love life could be happier was higher among those with live-in partners (Men 43%, Women 45%), compared to married adults (Men 32%, Women 34%), and singles (Men 16%, Women 16%).
Among those who are single, more women (63%) say they have no love life than men (50%).
In terms of age, those very happy with their love life was higher among men aged 55 and above (59%) compared to female counterparts (42%).
It was also slightly higher among men aged 35-54, ranging from 58-59%, compared to women aged 35-54, which ranged from 56-57% [Chart 17].
On the other hand, it was slightly higher among women aged 18-34, ranging from 58-59%, compared to the male counterparts, ranging from 52-53%.
Those who say their love life could be happier were highest among men aged 25-34 (37%), followed by 35-44 (31%), 45-54 (30%), 55 and above (28%), and 18-24 (21%).
Among women, it was highest among aged 35-44 (39%), followed by 25-34 (36%), 45-54 (32%), 18-24 (27%), and 55 and above (23%).
Those with no love life was higher among women aged 55 and above (34%) compared to their male counterparts (12%).
It was higher among men aged 18-24 (27%) compared to their female counterparts (14%).
It was slightly higher among men aged 25-54, ranging from 10-12%, compared to their female counterparts, ranging from 5-10%.
Survey Background
The December 2016 Social Weather Survey was conducted from December 3-6, 2016 using face-to-face interviews of 1,500 adults (18 years old and above) nationwide, 600 in Balance Luzon and 300 each in Metro Manila, Visayas and Mindanao (sampling error margins of ±3% for national percentages, ±4% for Balance Luzon, and ±6% each for Metro Manila, Visayas and Mindanao).
The area estimates were weighted by National Statistics Office medium-population projections for 2016 to obtain the national estimates.
The Social Weather Survey items on Valentine are not commissioned, but are done on SWS's own initiative and released as a public service.
The survey questions are as follows:
Q174. Sa inyong palagay, maari po bang umibig ng higit sa isang tao nang magkasabay? Masasabi po ba na ito ay... (SHOWCARD) TALAGANG POSIBLE, MEDYO POSIBLE, HINDI TIYAK KUNG POSIBLE O HINDI, MEDYO HINDI POSIBLE, o TALAGANG HINDI POSIBLE? [In your opinion, is it possible to fall in-love with more than one person at the same time? Would you say that it is… (SHOWCARD)? Definitely possible, Somewhat possible, Undecided if possible or not, Somewhat impossible,or Definitely impossible?]
Q175. Naranasan na po ba ninyong umibig ng higit pa sa isang tao ng magkasabay? (NARANASAN, HINDI NARANASAN) [Have Have you experienced falling in-love with more than one person at the same time? (Have experienced already, Have not yet experienced)]
Q176. Alin po sa mga ito ang naglalarawan sa inyong “love life” o buhay- pag-ibig? (SHOWCARD) NAPAKASAYA, SANA MAS MASAYA PA, o WALANG “LOVE LIFE” O BUHAY-PAG-IBIG? [Which phrase describes your love life? (SHOWCARD) Very happy, Could be happier, or No love life?]
SWS employs its own staff for questionnaire design, sampling, fieldwork, data-processing, and analysis, and does not outsource any of its survey operations.
#
Chart 1

Chart 2
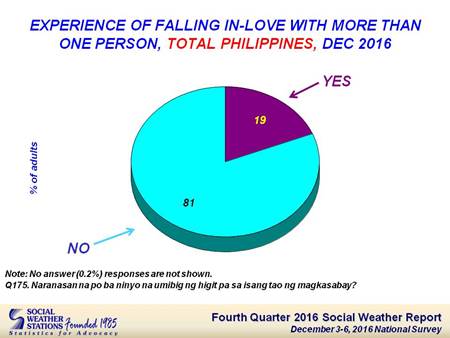
Chart 3
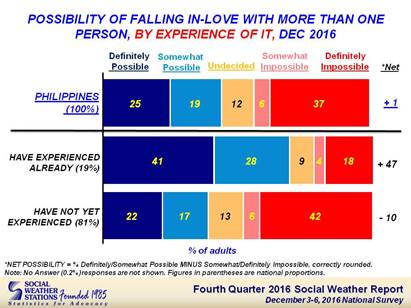
Chart 4
EAST EUROPE
471-43-2/POLL
Majority in Russia See Domestic Violence as Serious Problem
FEBRUARY 9, 2017
WASHINGTON, D.C. -- Russian President Vladimir Putin signed a law Tuesday that partially decriminalizes certain types of domestic violence, a step that many Russians may see as in the wrong direction. Majorities of Russians continue to view domestic violence as a serious problem in their country (58%) and say that their government is not doing enough to fight it (51%). Only 22% believe that the government is doing enough.
Russians' Views of Domestic Violence
|
2009 |
2015 |
|
|
% |
% |
|
|
Domestic violence is a serious problem in Russia |
70 |
58 |
|
Government not doing enough to fight domestic
violence |
58 |
51 |
|
Government doing enough to fight domestic violence |
13 |
22 |
|
GALLUP
WORLD POLL |
||
Russian lawmakers say they are giving the public what it wants with the law, which reduces the punishment for first offenses against family members that do not result in serious injury. But as far back as 2009, majorities of Russians have viewed domestic violence as a serious problem in their country and perceived government efforts to stop it as falling short. Although slightly fewer thought this when Gallup last asked the question in 2015, majorities still feel this way.
Domestic violence is endemic in Russia, and government figures show women account for the majority of the country's victims. The country's interior ministry estimates that 36,000 Russian women are beaten by their husbands every day and that 12,000 Russian women die each year from domestic violence -- one woman every 44 minutes. This helps explain why women in Russia (65%) are significantly more likely than men (50%) to think domestic violence is a serious problem.
Women's and men's opinions do not differ by age. This suggests that domestic violence does not get a "pass" from any generation of Russians, despite the rising popularity of the "return to traditional values" that lawmakers say the new law is supposed to reflect. However, women in rural areas of Russia, which tend to be poorer and have higher incidence of alcoholism that is often linked to domestic violence, are more likely to say domestic violence is a problem (71%) than those in big cities or suburbs (60%). Men's opinions do not change regardless of where they live.
Women More Likely Than Men to See Government Efforts as Lacking
Russian women are not only more likely than men to see domestic violence as a problem, but they are also more likely to say the government is not doing enough to combat it. The majority of Russian women (56%) say the government is not doing enough to fight domestic violence, compared with 44% of men.
Majority of Russian Women Say Government Not Doing
Enough
|
Women |
Men |
|
|
% |
% |
|
|
Government not doing enough to fight domestic
violence |
56 |
44 |
|
Government doing enough to fight domestic violence |
20 |
24 |
|
Don't know/Refused |
24 |
32 |
|
GALLUP
WORLD POLL, 2015 |
||
Both numbers are down slightly from 2009 but reflect the reality that Russia remains one of few countries without specific, separate laws regarding domestic violence, and attempts to pass such laws have failed over the past decade. Fewer than one in four men (24%) or women (20%) say the government is doing enough.
Russians Show Little Tolerance of Multiple Offenses
The recent law in question concerns first offenses of family battery, but in 2009, Gallup asked Russians about what should be done in a hypothetical situation in which a man regularly beats his wife and children and the woman reports the violence to the police. The majority of Russians (66%) say the man should be forcibly evicted from the apartment -- and just 5% say that the man should keep living in the home.
A man regularly beats his wife and children. The
wife reported the violence to police. Should the man be able to keep living in
the same apartment with his family during consideration of the complaint, or
should he be forcibly evicted from his home while pending?
|
Allowed to keep living in same
apartment |
Forcibly evicted |
Don't know/Refused |
|
|
% |
% |
% |
|
|
Russian adults |
5 |
66 |
29 |
|
Russian women |
4 |
74 |
23 |
|
Russian men |
7 |
57 |
35 |
|
GALLUP
WORLD POLL, 2009 |
|||
This majority includes women and men, but women are much stricter than men: 74% of Russian women say the man should be evicted, compared with 57% of Russian men.
Bottom Line
Critics of the new law see this as a step backward for a country that still hasn't signed or ratified the Council of Europe Convention on preventing and combating violence against women and domestic violence that took effect in August 2014. Russians, who already think their government is not doing enough to fight domestic violence and see it as a serious problem, may also see this law in the same way.
SURVEY METHODS
Results are based on face-to-face interviews conducted July 7-Sept. 17, 2015, with a random sample of 2,000 adults, aged 15 and older, in Russia and April 2-June 14, 2009, with 1,025 adults. For results based on the total sample of national adults, the margin of sampling error is ±2.8 percentage points at the 95% confidence level. All reported margins of sampling error include computed design effects for weighting.
471-43-3/POLL
The 2016 Vladimir Putin Press Conference: First Impressions
Half
of Russians are aware of what the press conference involving Vladimir Putin was
about. The level of satisfaction with the presidents’ answers is extremely high
this year.
MOSCOW, December
29, 2016. Russian Public Opinion Research
Center (VCIOM) presents the data of the surveydescribing the Russians’ interest
in the Russian president’s press conference, and their assessments of the
conversation between the president and the journalists.
Fifty-one
percent of Russians are familiar with the content of the presidents’ talk with
journalists (to compare: in 2015 this share was 46%). Eleven percent of Russian
watched the live press conference in full (27% of persons aged 60 and over),
24% - in part; 16% found out the press conference highlights from the TV
newscasts.
One-third
of respondents who learnt the content of the press conference from the
newscasts (36%) consider the presidential talk to be interesting; a further 38%
think that only particular topics were interesting. Every tenth (9%) thinks
that the press conference was interesting but too lengthy. Only 12% have
negative opinions: 8% think that the conversation was boring, 4% were
disappointed with the talk. These figures are similar to the previous year
outcomes.
At the
same time, the general level of satisfaction with the 2016 press conference has
reached its all time high – 88% (across all demographic groups this share
exceeds 80%). Only 9% of respondents who followed the press conference live or
discovered the highlights from the newscasts are satisfied with the way the
president answered the questions of the journalists.
Apart from
the question about the retired persons and pensions (10%), most of Russians
remember foreign policy topics such as the situation in Syria (10%),
relationships with the Western countries (9%) and Ukraine (9%), as well as
Russia’s military capabilities and army expenditures (8%). Fewer respondents
mentioned Putin’s answers to the questions related to the 2018 presidential
elections, possible election rescheduling (6%), country’s economic situation,
inflation (5%), the Kerch Strait Bridge, launch of the gas pipe in Crimea (5%)
et cet.
The
VCIOM survey was carried out on December 24-26, 2016, using
stratified dual-frame random sample based on a complete list of telephone
numbers operating in Russia, and involved 1800 respondents. The data
were weighted according to selection probability and social and demographic
characteristics. The margin of error at a 95% confidence level does not exceed
2.5%. In addition to sampling error, minor changes in question wording and
different circumstances arising during the fieldwork can introduce bias into
the survey.
|
This
week Vladimir Putin answered the questions of the journalists live. Did you
follow this talk or not?* (closed-ended question, one answer, %) |
||||||
|
|
2011 ** |
2012 |
2013 |
2014 |
2015 |
2016 |
|
Yes, I
followed attentively the live dialogue from the beginning to the end |
11 |
11 |
10 |
15 |
13 |
11 |
|
Yes,
I watched particular moments live |
23 |
23 |
19 |
21 |
22 |
24 |
|
Yes, I
found out about the highlights from TV newscasts, newspapers and the Internet |
14 |
18 |
12 |
12 |
11 |
16 |
|
No, I
did not watch the performance |
51 |
47 |
57 |
50 |
53 |
48 |
|
Don’t
know |
1 |
1 |
2 |
2 |
1 |
1 |
* In 2011-2015 there
were household surveys
**In 2011 the
question referred to the D. Medvedev press conference; up
to 2015 the question was “Did you follow the conversation between the
Russian president and the mass media representatives?”
|
Which
of the following statements can best describe your impressions of the recent
presidential performance?* (closed-ended question, one answer, % of those who
followed the press conference personally or found out on the news) |
||||||
|
2011 ** |
2012 |
2013 |
2014 |
2015 |
2016 |
|
|
I was
interested in the entire Putin’s performance |
15 |
17 |
22 |
42 |
36 |
36 |
|
I was
interested in some topics, and not interested in others |
40 |
47 |
46 |
37 |
38 |
38 |
|
The
performance was interesting but too lengthy |
12 |
13 |
10 |
8 |
9 |
9 |
|
It was
boring; the performance did not impress me much |
13 |
11 |
11 |
6 |
8 |
8 |
|
Nothing
but disappointment and irritation |
12 |
8 |
8 |
4 |
5 |
4 |
|
Don’t
know |
8 |
4 |
3 |
3 |
4 |
5 |
* In 2011-2015, there
were household surveys; up to 2015 the question was “Which of
the following statements can best describe your impression of the presidential
press conference?”
**In 2011 the
question referred to the D. Medvedev press conference
|
Are
you generally satisfied with the way V. Putin answered the questions of the
journalists?* (closed-ended question, one answer, % of those who
followed the press conference personally or found out on the news) |
||||||||
|
2006 |
2007 |
2011 ** |
2012 |
2013 |
2014 |
2015 |
2016 |
|
|
Rather
satisfied |
81 |
79 |
58 |
66 |
66 |
82 |
81 |
88 |
|
Rather
not satisfied |
12 |
12 |
27 |
24 |
26 |
13 |
16 |
9 |
|
Don’t
know |
7 |
9 |
15 |
10 |
8 |
5 |
3 |
3 |
* In 2006-2015,
there were household surveys.
**In 2011 the
question referred to the D. Medvedev press conference.
|
What
journalists’ questions and Putin’s answers did you remember and like most?
(open-ended question, more than three answers, % of those who followed
the press conference personally or found out on the news) |
|
|
|
Total
respondents |
|
About
pensions and retired persons |
10 |
|
About
the situation in Syria and Russian involvement in the conflict |
10 |
|
About
relationships with Western countries/ foreign policy |
9 |
|
About
relationships with Ukraine |
9 |
|
About
military expenditures / a statement about Russian high military capabilities |
8 |
|
About
Putin’s plans for presidential elections in 2018, about possible election
rescheduling |
6 |
|
About
Russia’s economic situation / inflation |
5 |
|
About
the Kerch Strait bridge to Crimea, gas pipe launch |
5 |
|
About
accused journalists and political prisoners |
4 |
|
About relationships
with Turkey and the murder of the Russian ambassador in Turkey |
3 |
|
About
Russia’s intervention into the American elections |
3 |
|
About
education and children literature |
3 |
|
About
internal policy / assistance in local problems |
3 |
|
About
corruption and corruption scandals |
3 |
|
About
alcohol addiction in the country / Irkutsk mass poisoning |
3 |
|
About
support for agriculture and small business |
2 |
|
Answers
to foreign journalists |
2 |
|
About
the state of Russian roads |
2 |
|
About
social policy |
1 |
|
About
incomes, salaries in the country |
1 |
|
About
quality of health services and medicines |
1 |
|
About
natural resources: gas, coal, oil |
1 |
|
About
terrorism |
1 |
|
About
environmental issues |
1 |
|
About
tax differentiation |
1 |
|
About
doping scandal |
1 |
|
Aboutjuvenile
judiciary |
1 |
|
About
public utilities rates and capital repairs |
1 |
|
About
the prolongation of sanctions, import substitution |
1 |
|
About
the VDNKh kvas drink |
1 |
|
I liked
everything |
2 |
|
Nothing |
37 |
|
Other |
7 |
|
I cannot
recall them/Don’t know |
5 |
471-43-4/POLL
Assessment Of Living Conditions Of The Ukrainian Working-Age Population
February 07, 2017
According
to the research carried out by the Sociological Group "Rating" in
December 2016, the lowest level of daily stress among the respondents was
caused by family relations, professional activity, and external environment;
the highest – exposure to war and military danger, socio-political instability
in the country, corruption, and personal financial status.
Half of
the respondents considered their family’s financial status to be unsatisfactory
whilst only 15% deemed that they had satisfactory finances for life, and
one-third declared themselves to be at poverty level. The highest number of
poor people being recorded in the East, among older people and those with a low
education level.
Less than
half of respondents considered their housing conditions to be average, more
than one-third – comfortable, one in five – poor.
42% of the
respondents considered that they were fully in control of their lives and were
free to make their decisions, whereas almost the same number stated that they
only felt partly in control of their lives. 19% felt that they hardly
controlled their own destiny, the highest number of these respondents being
recorded in the East, among those over 50, and poor.
Only 18%
of the respondents reported their social status as high. Half of them
considered themselves to be part of the middle social level whereas a quarter
considered themselves to be the lowest level of society, the highest number of
these respondents being recorded in the East, among older people, and
poor.
About
one-third of the respondents were absolutely satisfied with their lives, about
half – quite satisfied, and a quarter – not satisfied. Almost 40% of those not
satisfied being recorded in the East, one-third were over 50 and low-income
respondents.
82% of the
respondents considered that, if needed, they could get emotional support from
other people and 9% - had the opposite opinion. 77% declared that could get
physical support and 13% - could not. 69% of the respondents were optimistic
with respect to financial support whereas 20% considered that they could not
get financial support.
Few of the
respondents mentioned their participation in public organizations. Only 7%
mentioned their membership in religious organizations, 5% – professional
associations, 3% – cultural and non-governmental organizations, 2% –
political parties.
Almost
one-third of the respondents considered that household responsibilities were
distributed equally, a quarter (24%) – performed the majority of the duties
themselves, 20% – reported that the majority of the duties were performed by
the other family member, 14% - all the duties were performed by the respondent,
and only 5% – all the duties were performed by the other family member. There
were four times as many women performing the majority of the duties as
men.
About one-third
of the respondents considered their profession to be prestigious, about half -
average, a quarter – low prestige.
Respondents:
the working-age population of Ukraine – males aged 18-65, females aged 18-60.
The sample is split up into various categories: age, gender, region, and place
of residence. Total: 1580 respondents. Face-to-face formalized
interviews. The margin of error does not exceed 2.5%. Period of the
survey: 1-10 December 2016
Source: http://ratinggroup.ua/en/research/ukraine/emocionalnaya_ocenka_usloviy_zhizni_ukraincev.html
WEST EUROPE
471-43-5/POLL
Most Brits think the EU needs the UK at least as much as the UK needs the EU
As the government prepares to negotiate with Brussels, the attitude of the remaining EU nations to the UK’s demands will be vital to the success or failure of negotiations.
Theresa May’s shopping list is ambitious, and much hinges on whether our soon-to-be former European partners believe Britain is an important enough country and trading partner to indulge in the government’s requests.
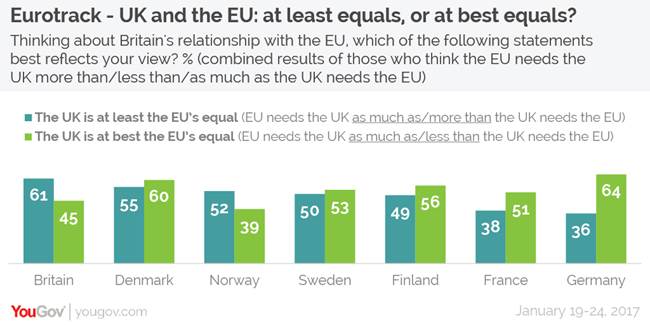
New data from YouGov’s Eurotrack survey suggests that many Britons certainly believe this country is important enough. One third (33%) of Britons think that the EU needs the UK more than the UK needs it. With a further 28% of Brits saying that the EU and UK need each other equally, this means that more than six in ten people think that the EU needs the UK at least as much as the UK needs the EU.
This is important because it shows that a majority of Britons expect that the UK will negotiate the terms of Brexit with the EU as (at least) an equal partner, rather than from a position of weakness.
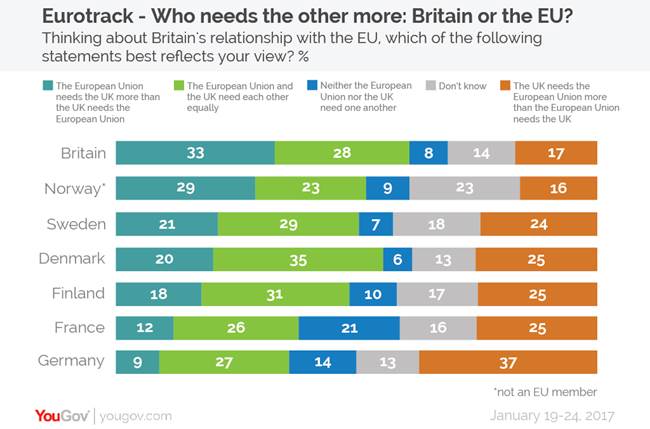
By comparison, just 17% of Brits think that the UK needs the EU more than the EU needs the UK. A further 8% think that neither the EU nor the UK need one another, whilst 14% don’t know.
Whilst Britons may feel optimistic about the government’s Brexit negotiation position, they might have cause to be concerned about the attitudes of people in EU member states towards the UK.
Members of the public in the EU’s two most important countries – Germany and France – are far less convinced of the strength of Britain’s negotiating position. In Germany 37% think that the UK needs the EU more, a level four times higher than the 9% of Germans who think the EU needs the UK more.
Likewise, in France, 25% of people think the EU has the stronger negotiating position, compared to just 12% who think the opposite is the case.
With about a quarter of people in both countries thinking that the EU and UK need each other equally, the results show that the French and German publics are much more likely to think that the UK at best has an equal negotiating position to the EU.
French and German people are also more likely to say that the EU and UK don’t need one another at all (21% and 14% respectively).
Elsewhere in Europe, Scandinavians have a higher opinion of the UK’s level of influence than the French and Germans. Nevertheless, they are still more likely to think that the UK needs the EU more than the EU needs the UK – with the exception of Norway (which is not a member of the European Union).
471-43-6/POLL
Nearly one in five Brits now have a favourable view of Donald Trump
Leave voters, old people and Conservatives have
warmed the most to the new president
February 06, 2017
Despite outrage at the actions that Donald Trump has taken in his first few weeks as president – some of which provoked mass protests across the United Kingdom – new YouGov research reveals that British people have an increasingly favourable opinion of the new US commander in chief.
Last August just 8% of Brits had a favourable impression of The Donald, a figure that increased to 15% in November following his election. Now he is installed in the White House almost a fifth (19%) have either a very favourable (5%) or somewhat favourable (14%) view of the 45th President.
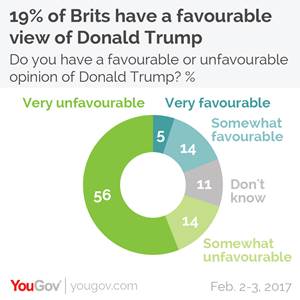
Of course, these figures are still dwarfed by the proportion of people who still have a negative view of Trump. Seven in ten (70%) Britons have an unfavourable opinion of the new president (including 56% who hold a ‘very unfavourable’ view), putting Trump’s net favourability score at -51.
Trump’s favourability has improved across all sections of society, but it has increased the most among Leave voters (34% – up 19 percentage points since August), the over-65s (27% – also up 19 percentage points) and Conservatives (26% – up 18 percentage points since last summer).
UKIP voters remain the group with the most favourable view of the new president, with 46% saying they have either a very or somewhat favourable view of him (up 15 percentage points since August).
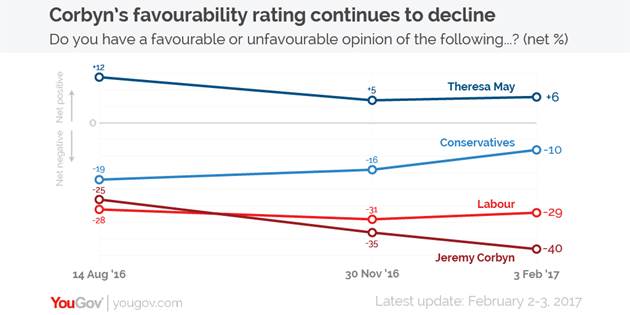
Corbyn
continues to decline
On the domestic front, Theresa May remains the only British politician surveyed that has a net positive favourability score (+6). Slightly under half (46%) of people have a favourable view of the prime minister whilst four in ten (40%) hold an unfavourable opinion.
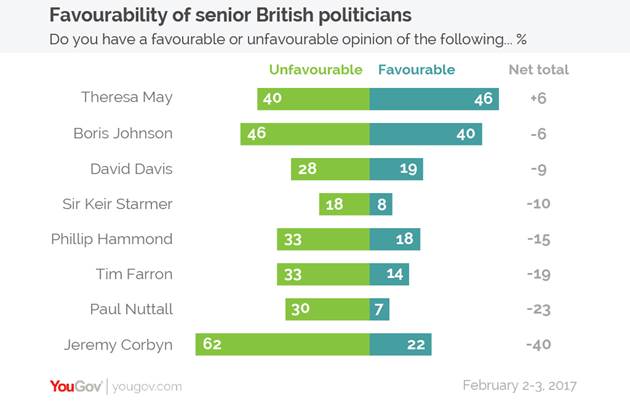
The results are much worse for Jeremy Corbyn, with the Labour leader's favourability ratings falling for the third successive time.
When this question was first asked in August 2016 Corbyn was embroiled in his second Labour leadership election, and his net favourability score was -25. In the six months since, it has declined further to -40. More than six in ten (62%) people now hold an unfavourable view of the Labour leader compared to 22% who have a positive one.
The Conservatives maintain relatively strong favourability scores - 38% of Brits have a positive opinion of the party (although more have a negative view meaning its net favourability score stands at -10). The party’s favourability has been slowly increasing since August, experiencing a notable improvements among 2015 UKIP voters, the over-50s and working class people (i.e. those in the C2DE social grades).
Labour, on the other hand, haven’t seen their favourability ratings change much since August, with the party languishing on a net favourability score of -29.
471-43-7/POLL
Captains of Industry say business is already suffering the consequences of Brexit
Published:5 February 2017
Fieldwork:September - December 2016
The annual
Ipsos MORI Captains of Industry study finds that at the time of interviewing,
58% of Captains felt that since the referendum the decision to leave the EU has
had a negative impact on their business. A third of Captains (31%) didn’t feel
that Brexit had made any difference to the business situation for their company
and just 11% feel it has made a positive impact.
Business
leaders of the FTSE 500 anticipate a more negative business situation in the next
12 months. Two thirds (66%) feel the business situation of their company will
be more negative post Brexit, with only 13% suggesting it will have a positive
impact. However, the data suggests that this could improve in the long term,
with a third of those interviewed (32%) feeling they would see a positive
impact on their business in five years’ time and 45% expected to feel a
negative impact.

84% of
Captains interviewed agreed/strongly agreed that ‘how well the government
actually handles Brexit negotiations is vital to my business’. Although half of
those interviewed (50%) disagreed that they were confident in the ability of
the government to negotiate the best deal possible for UK businesses with the
EU.
Despite
ongoing uncertainty, the majority of business leaders (96%) are confident their
company can adapt to the consequences of leaving the EU. Over two thirds of
Captains have already taken action in response to the Brexit referendum
results. 30% of Captains have currently done nothing as a result of the
decision to leave the EU. Of those businesses who have started to take action
as result of the decision to leave the UK: 14% of Captains mentioned putting
contingency plans in place/analysing the impact of different renegotiation
outcomes, 10% are moving business outside the UK, 7% are looking at currency
changes/stability and a further 7% mentioned providing reassurance to foreign
staff.
Captains
expressed that the most important things for the UK to obtain during
negotiations to leave the EU are: Movement/access of skilled labour (54%),
securing free trade/single market (47%), passporting rights (16%),
controlled/clarity on immigration (13%), continuing being a trading partner
with Europe (9%), tariff agreement (9%).

In order
to be successful in a post-Brexit UK, Captains felt the most important factors
for business were reducing the level/complexity of regulation (86%) and keeping
it easy to recruit EU staff (86%).
Ben
Page, CEO of Ipsos MORI, says:
“Our
annual survey of FTSE 500 business leaders provides a unique insight into what
the business world is thinking ahead of Brexit. Unfortunately, it looks like
business in this country is already feeling the pain of the economic upheaval
of leaving the EU, with 58% of Captains of Industry stating that their business
has suffered negatively since the referendum. According to respondents there is
no sign that this is likely to ease this year, with two thirds saying they
thought their business situation would get worse in the next 12 months.
"However, it is not all doom and gloom. 32% of respondents said they think
their business will start to feel the positive effects of leaving the EU in
five years’ time and the number of Captains that think it will remain a
negative impact reduces to 45% when looking at long range forecast. Businesses
are also ready to adapt in order to survive, and thrive, with 96% of business
leaders feeling confident that their company can adapt to the consequences of
the Brexit outcome.”
Technical note
Ipsos MORI conducted 114 interviews with respondents from the top 500 companies by turnover and the top 100 by capital employed in the UK. Participants were Chairmen, Chief Executive Officers, Managing Directors/Chief Operating Officers, Financial Directors or other executive board directors. Interviews were primarily carried out face to face (8 were carried out over the telephone) between September and December 2016.
471-43-8/POLL
UK: NHS Pressures Survey
Published:6 February 2017
Fieldwork:26 - 29 January 2017
A poll by Ipsos MORI of 1,033 adults for the BBC has suggested three-quarters of adults surveyed would find it acceptable to increase charges for people coming from abroad as a way of raising more money for the NHS. Respondents were asked to rate a number of ways in which some people suggested that funding for the NHS be increased to maintain the current level of care.
40% say a rise in income tax would be acceptable while 50% say it would be unacceptable. 37% say charging for some services would be acceptable while 51% say it would be unacceptable. The public are split on whether the NHS should charge patients with diseases and illnesses caused by their lifestyle: 44% say this would be acceptable while 45% say it would be unacceptable.
Technical note:
·
Fieldwork dates: 26th – 29th
January 2017
·
All figures in percentages
·
Base: All adults aged 18+ in the
United Kingdom
·
Data have been weighted to the
known population profile of the UK
·
Interviews conducted by telephone using Random
Digit Dialling
·
An asterisk represents a
percentage less than 0.5 but greater than 0
·
Numbers may not always add up to
100% due to computer rounding or multiple answers
Source: https://www.ipsos-mori.com/researchpublications/researcharchive/3839/NHS-Pressures-Survey.aspx
NORTH AMERICA
471-43-9/POLL
Government Dissatisfaction Returns as Most Important Problem
February 9, 2017
WASHINGTON, D.C. -- Dissatisfaction with the government now clearly leads as the issue Americans see as the most important problem facing the U.S. The 19% mentioning the government is up from 11% last month and is now significantly higher than the percentage mentioning any other issue. The next-most-commonly mentioned problems are immigration (13%) and unifying the country (10%) -- both up from last month -- as well as the economy in general (9%).
What do you think is the most important problem
facing this country today? [OPEN-ENDED]
Issues mentioned by 3% or more of respondents in
February
|
January 2017 |
February 2017 |
|
|
% Mentioning |
% Mentioning |
|
|
Dissatisfaction with government |
11 |
19 |
|
Immigration |
4 |
13 |
|
Unifying the country |
3 |
10 |
|
Economy (general) |
11 |
9 |
|
Race relations/Racism |
10 |
7 |
|
Unemployment |
8 |
6 |
|
National security |
3 |
5 |
|
Terrorism |
5 |
5 |
|
Healthcare |
9 |
5 |
|
Education |
4 |
3 |
|
GALLUP |
||
Government dissatisfaction -- representing an assortment of complaints about the federal government -- has consistently ranked near the top of the most important problem list over the last few years. However, the last time it was No. 1 on the list by a significant margin over all other issues was in April 2015. Mentions of government have been higher in the past, including several readings in the 20s in 2013 and 2014. The all-time high of 33% occurred in October 2013 during the partial federal government shutdown.
Mentions of "Donald Trump" as the nation's most important problem constitute a substantial proportion of the responses making up the "government dissatisfaction" category this month. Prior to Trump's inauguration, mentions of him fell into the "election" rather than the government category. As a result, the percentage citing the election as the most important problem has dwindled from 8% in January to less than 1% this month, while the percentage mentioning government dissatisfaction has increased by roughly the same amount.
Given that Republicans now control the presidency and both houses of Congress, it is not surprising that Democrats (29%) are much more likely than Republicans (11%) to say the government is the most important problem facing the country. Eighteen percent of independents also name government as the top problem.
Trump has taken swift action to deal with immigration since taking office, including issuing a series of executive orders that suspended the Syrian refugee program, banned entry to the U.S. for nonresidents traveling from seven predominantly Muslim nations and ordered the construction of a wall along the U.S.-Mexico border. Those high-profile actions likely explain this month's increased mentions of immigration on the most important problem list, from 4% in January to 13% currently. Immigration now ranks as the top problem among Republicans, at 18%. Half as many Democrats, 9%, name immigration.
Mentions of immigration have reached double digits on several occasions in the past few years. The last time the percentage exceeded the current 13% was in the summer of 2014, when a flood of Central American women and children immigrated to the U.S.
Also, Trump's provocative nature and controversial actions have sparked protests throughout the country, likely explaining the increased percentage of Americans naming "unifying the country" as the most important problem. The 10% who cite lack of unity as the most important problem is the highest Gallup has measured to date for this issue. No more than 3% of Americans ever mentioned this issue until after the 2016 presidential election, when 6% did. Roughly equal percentages of Democrats (12%) and Republicans (11%) currently mention unifying the country.
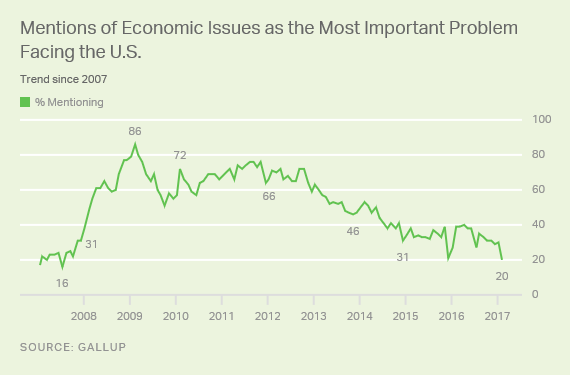
The news media's recent focus on Trump over most other issues, as well as Americans' generally positive evaluations of the economy, may explain why mentions of economic problems as the nation's top problem are down this month. The 20% who mention some economic problem -- including the economy in general, unemployment, the federal budget and others -- is the lowest Gallup has measured since July 2007, when mentions were 16%. That poll was conducted before the economy headed into recession and when the Iraq War was the dominant concern in Americans' minds.
Implications
Americans' perceptions of the most important U.S. problem have changed since Trump became president. Last month, there was no consensus as to the most important problem facing the country. Now, dissatisfaction with government is the clear leader, mostly because Trump has moved from being president-elect to being the chief executive of the federal government.
The Trump administration's early focus on immigration has appeared to increase concerns about that issue. Also, his presidency appears to have created bipartisan concern about the need to unify the U.S. Although party supporters on both sides share concerns about the divided nature of the country, it is possible that Democrats are looking to Trump to modify his behavior and policies to bring both parties together. At the same time, Republicans may believe Trump's opponents should be more open to supporting the president and those who back him.
Historical data are available in Gallup Analytics.
SURVEY METHODS
Results for this Gallup poll are based on telephone interviews conducted Feb. 1-5, 2017, with a random sample of 1,035 adults, aged 18 and older, living in all 50 U.S. states and the District of Columbia. For results based on the total sample of national adults, the margin of sampling error is ±4 percentage points at the 95% confidence level. All reported margins of sampling error include computed design effects for weighting.
Each sample of national adults includes a minimum quota of 70% cellphone respondents and 30% landline respondents, with additional minimum quotas by time zone within region. Landline and cellular telephone numbers are selected using random-digit-dial methods.
471-43-10/POLL
Congress Job Approval Jumps to 28%, Highest Since 2009
FEBRUARY 7, 2017
WASHINGTON, D.C. -- Congressional job approval jumped to 28% this month from 19% in January. This is the largest month-to-month increase since a 12-percentage-point rise between January 2009, when former President Barack Obama was first inaugurated, and February 2009. The current 28% job approval rating is the highest since early fall 2009 and is close to Gallup's historical average (30%). The increase comes after Donald Trump's inauguration as president gave Republicans control of the presidency and both houses of Congress.
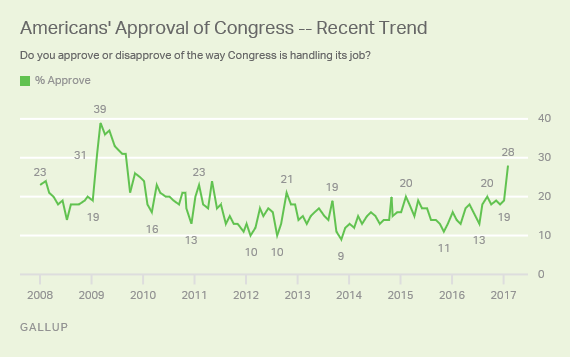
The increase in congressional job approval in February is mainly the result of a surge in Republicans' approval, which more than doubled in the past month, to 50%. Independents' approval increased slightly to 25%, and Democrats' approval dropped eight points to 11%.
This mirrors the pattern seen in February 2009 after Obama took office and gave Democrats control of Congress and the presidency. Democrats' approval rose from 18% to 43% between January and February of that year, while Republicans' approval fell by four points. Independents' approval rose from 17% to 29%.
Congressional Job Approval by Party, 2009 and 2017
% Approve
|
January |
February |
Change |
|||||||||||||||||||||||||||||||||||||||||||||||||||||||||||
|
% |
% |
pct. pts. |
|||||||||||||||||||||||||||||||||||||||||||||||||||||||||||
|
2017 |
|||||||||||||||||||||||||||||||||||||||||||||||||||||||||||||
|
Republicans |
20 |
50 |
+30 |
||||||||||||||||||||||||||||||||||||||||||||||||||||||||||
|
Independents |
17 |
25 |
+8 |
||||||||||||||||||||||||||||||||||||||||||||||||||||||||||
|
Democrats |
19 |
11 |
-8 |
||||||||||||||||||||||||||||||||||||||||||||||||||||||||||
|
2009 |
|||||||||||||||||||||||||||||||||||||||||||||||||||||||||||||
|
Republicans |
23 |
19 |
-4 |
||||||||||||||||||||||||||||||||||||||||||||||||||||||||||
|
Independents |
17 |
29 |
+12 |
||||||||||||||||||||||||||||||||||||||||||||||||||||||||||
|
Democrats |
18 |
43 |
+25 |
||||||||||||||||||||||||||||||||||||||||||||||||||||||||||
|
GALLUP |
|||||||||||||||||||||||||||||||||||||||||||||||||||||||||||||
The current 39-point gap between Republicans' and Democrats' approval is significantly wider than what Gallup found over the past two years -- even with control of both houses in Republican hands during that time. Rank-and-file Republicans' approval of Congress averaged only 15% in both 2015 and 2016, slightly below the 17% and 19% average ratings Democrats gave Congress in those years.
Big Change in Congress Approval Came After Trump's Inauguration
The substantial increases in congressional job approval both this year and in early 2009 straddled the January 20 inauguration of a newly elected president and the resulting unification of power in Washington under the president's party.
As in 2009, political control of Congress did not change this year. Republicans controlled both the House and Senate before the 2016 elections and remained in control after them. In 2009, Democrats controlled both houses before and after the 2008 elections.
Although each new Congress essentially begins work on Jan. 3 when newly elected members of both houses are sworn in, Americans' approval of Congress this year and in 2009 did not change significantly until after the inauguration of the new president.
Therefore, mirroring what occurred with the Democrats in 2009, the installment of a Republican in the White House is likely giving Republicans newfound confidence that the GOP-led Congress will be effective in the ways they want it to be. Or, the jump in approval of the Republican-controlled Congress could be a spillover effect of Republicans' positive feelings about Trump in general.
Implications
The 115th Congress has not passed significant legislation in its first weeks in office, and it has not been involved in many highly publicized activities other than the Senate's vetting and confirming Trump's various Cabinet appointments.
Most of the news focus has been on Trump himself, including his rapid-fire series of executive orders and tweets responding to news media and those who disagree with him. Trump also appears to be the catalyst for Americans -- specifically Republicans -- becoming more positive about Congress than at any point going back to the sixth year of the George W. Bush administration. In similar fashion, Obama appears to have been the catalyst for Democrats becoming more positive about Congress in 2009.
The key to the future may be the developing relationship between Congress and Trump. It is not clear whether GOP leaders in Congress will support all of Trump's initiatives, including repealing and replacing the Affordable Care Act, nor is it clear how fast Congress will act on Trump's promises that require new legislation.
Republicans' views of Congress could sour if they begin to perceive that the House and Senate are not fulfilling their more conservative aspirations for the body, even with their party's president in the White House.
These data are available in Gallup Analytics.
SURVEY METHODS
Results for this Gallup poll are based on telephone interviews conducted Feb. 1-5, 2017, with a random sample of 1,035 adults, aged 18 and older, living in all 50 U.S. states and the District of Columbia. For results based on the total sample of national adults, the margin of sampling error is ±4 percentage points at the 95% confidence level. All reported margins of sampling error include computed design effects for weighting.
Each sample of national adults includes a minimum quota of 70% cellphone respondents and 30% landline respondents, with additional minimum quotas by time zone within region. Landline and cellular telephone numbers are selected using random-digit-dial methods.
471-43-11/POLL
Americans See US World Standing as Worst in a Decade
FEBRUARY 10, 2017
WASHINGTON, D.C. -- Americans believe the world at large sees the U.S. more unfavorably (57%) than favorably (42%), their worst assessment of the country's image in 10 years. A year ago, Americans' perceptions were more positive than negative.
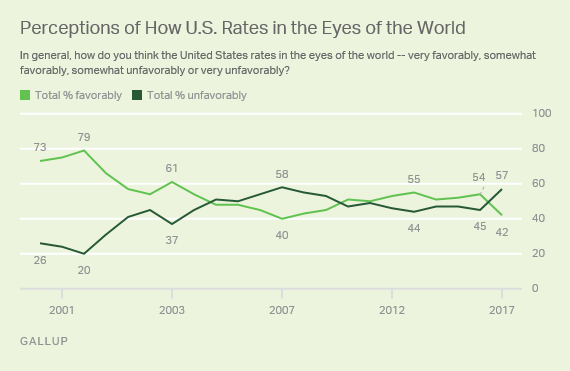
These results are from a Gallup survey conducted Feb. 1-5, about two weeks into Donald Trump's presidency. The 42% favorable rating is one of the lowest since Gallup began asking this question in 2000 and may be attributable to the election of Trump, whose sometimes controversial statements and actions have rankled several world leaders. However, Americans' perceptions of the image of the U.S. abroad were marginally worse in 2007, when 40% thought the world viewed the nation favorably. At the time, the U.S. was embroiled in wars in Iraq and Afghanistan, andPresident George W. Bush was highly unpopular.
The high-water mark for Americans believing the U.S. is viewed favorably was 79% in 2002, in the wake of the 9/11 terrorist attacks in the U.S.
Much of this year's drop in favorable perceptions of how the world views the U.S. is fueled by a precipitous slide among Democrats now that a Republican president is in office. Currently, 31% of Democrats think the world views the U.S. at least somewhat favorably, down from 68% last year. By contrast, Republicans' views have improved this year, to 54% from 39%, but not enough to offset the decline among Democrats.
Few Americans Believe Leaders Worldwide Respect Trump
Fewer than three in 10 Americans (29%) say leaders of other countries have respect for the new president, with 67% saying world leaders do not have much respect for him. When Barack Obama took office in 2009, the results were nearly opposite: 67% of Americans then believed global leaders respected the president, while 20% said leaders did not. At the time of the prior presidential transition in 2001, more Americans also believed George W. Bush was respected than believed he was not.
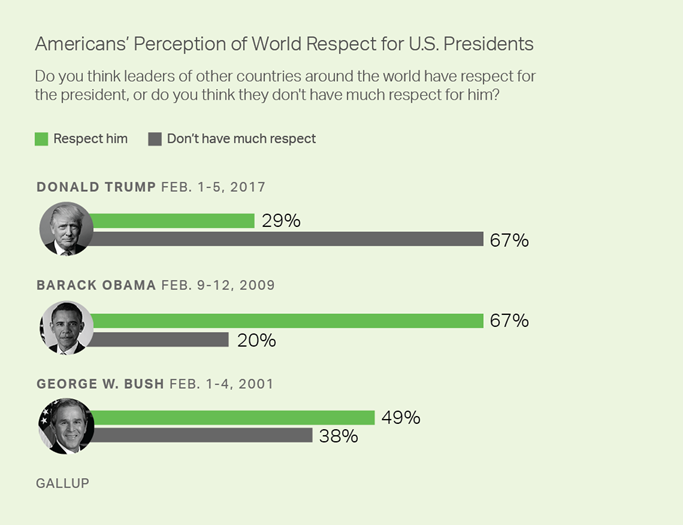
The 29% now believing that world leaders respect the president also represents a sharp drop from one year ago, in the last year of Obama's presidency. At that time, 45% said they believed the president was respected.
One reason for the drop is that fewer Republicans today think Trump is respected (60%) than Democrats in 2016 thought Obama was respected (79%).
Satisfaction With World Position Little Changed From 2016
Despite Americans' depressed perceptions of how world leaders view their new president, Americans' satisfaction with the country's position in the world hasn't changed much from last year -- 32% say they are satisfied with the position of the U.S. worldwide, down slightly from 36% in 2016.
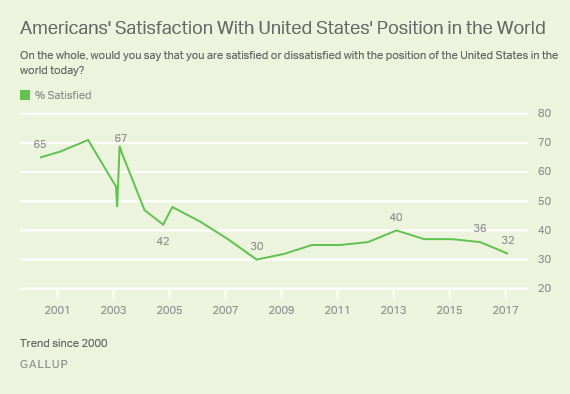
The current reading continues a recent trend of relatively low satisfaction with the nation's global status, something that has persisted since the Iraq War troop surge in 2007.
While the Iraq War may have been a factor a decade ago, satisfaction has remained low even as U.S. involvement has wound down. The rise of the Islamic State and terrorism in general may be contributing to Americans' continued low level of satisfaction with their country's position in the world.Americans' widespread dissatisfaction with the way things are going in the U.S. could also affect their level of satisfaction with the nation's world standing.
Bottom Line
At the beginning of Trump's presidency, Americans' perceptions of how the world views the U.S. and its new president are significantly worse than they were a year ago -- and are on the low end for the past decade. This has been fueled by a sharp decline among Democrats who hold highly negative views of Trump's character and opening job performance.
But even a year ago, when Americans thought the world viewed the U.S. and Obama positively, Americans were still largely unsatisfied with the nation's global standing. This trend has been steadily negative for the past decade. Americans may not put much weight on how the rest of the world perceives the president in assessing whether they are satisfied with the United States' standing in the world. In addition to concerns about international matters such as Syria and terrorism, those views may be influenced by how they think things are going in the U.S., their low confidence in public institutions and their low trust in government. Such factors appear to have a marked effect on how Americans feel when they look beyond their borders.
Historical data are available in Gallup Analytics.
SURVEY METHODS
Results for this Gallup poll are based on telephone interviews conducted Feb. 1-5, 2017, with a random sample of 1,035 adults, aged 18 and older, living in all 50 U.S. states and the District of Columbia. For results based on the total sample of national adults, the margin of sampling error is ±4 percentage points at the 95% confidence level. All reported margins of sampling error include computed design effects for weighting.
Each sample of national adults includes a minimum quota of 70% cellphone respondents and 30% landline respondents, with additional minimum quotas by time zone within region. Landline and cellular telephone numbers are selected using random-digit-dial methods.
471-43-12/POLL
GOP Satisfaction With US Direction Soars, Democrats' Drops
FEBRUARY 10, 2017
WASHINGTON, D.C. -- A majority of Republicans, 55%, are satisfied with the way things are going in the U.S., up sharply from 22% last month before President Donald Trump's inauguration. Democrats' satisfaction dropped from 27% to 13% in the same period. These shifts resulted in a slight uptick in Americans' overall satisfaction, from 26% to 30%.
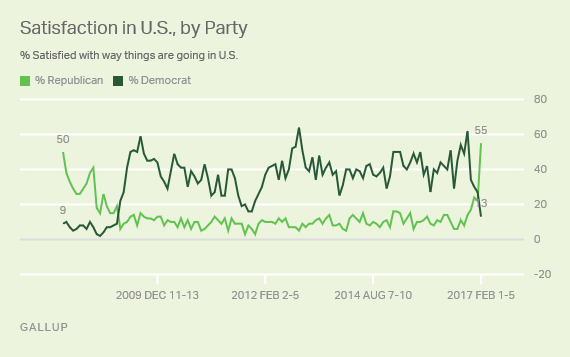
As recently as August 2016, as few as 6% of Republicans were satisfied with the way things were going, and the overall 2016 average before Trump's Nov. 8 election stood at 10%. Satisfaction among Republicans began to rise slowly after Trump's victory, from 17% in mid-November to percentages in the lower 20s in December and January before jumping to 55% this month.
On the other side of the political spectrum, 62% of Democrats were satisfied with the way things were going in the U.S. in early November just before the election. This fell sharply to 34% in mid-November and has continued to drop in the following months.
Though the shift in Republicans' response to this question is historically high, the underlying phenomenon is nothing new. Gallup has observed similar realignments in Democrats' and Republicans' satisfaction with how things are going in the country after a president of a new party takes office.
Changes in Satisfaction After Recent Presidential
Inaugurations, by Party
Figures are percentage satisfied
|
Republicans |
Democrats |
|||||
|
January |
February |
Change |
January |
February |
Change |
|
|
2017 |
22 |
55 |
+33 |
27 |
13 |
-14 |
|
2009 |
19 |
6 |
-13 |
9 |
22 |
+13 |
|
2001 |
58 |
67 |
+9 |
59 |
44 |
-15 |
|
1993 |
43 |
22 |
-21 |
17 |
28 |
+11 |
|
GALLUP |
||||||
Democrats' 14-percentage-point drop in satisfaction from January to February is similar to the 15-point decline in Democratic satisfaction in 2001 when Republican George W. Bush replaced Democrat Bill Clinton in the White House. It is also similar to the 13-point decline in Republicans' satisfaction eight years later when power switched to Democrat Barack Obama.
The recent 33-point increase in Republicans' satisfaction, however, is larger than any change in Gallup's trend. The substantial change could be attributable to Trump's unexpected victory, placing the GOP in full control of the executive and legislative branches for the first time since 2006. This allows the GOP to pursue its policy agenda, which was largely thwarted during the Obama administration.
Notably, the current level of satisfaction among Republicans is close to the average GOP satisfaction rate (60%) in 2006, the last year Republicans controlled both the presidency and Congress simultaneously.
Overall Satisfaction Up Slightly to 30%
Overall, 30% of Americans are now satisfied with the way things are going in the U.S., up slightly from 26% last month. The slight uptick reflects the Republican surge and the Democratic decline. Satisfaction has averaged 24% since 2007, with only a few isolated measurements in the 30s, including 37% right before the 2016 presidential election.
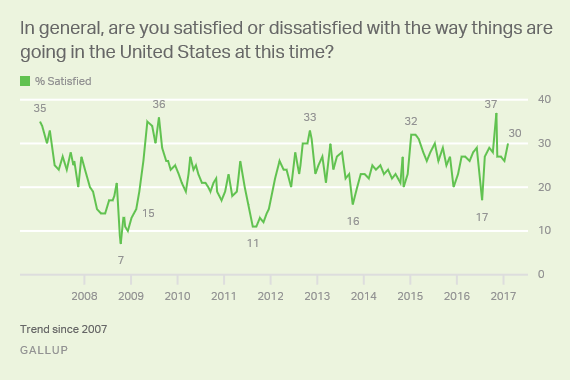
Bottom Line
While Trump's inauguration only modestly affected satisfaction levels in the country as a whole, Republicans' and Democrats' satisfaction have changed dramatically. A shift in the relative satisfaction of party groups is consistent with historical patterns, but the degree to which Republicans' satisfaction surged after Trump took office is not.
Still, satisfaction remains below average from a historical perspective, as it has for the last decade. Given Democrats' overwhelming disapproval of Trump, it is likely that satisfaction will remain at the lower levels in the near future.
Historical data are available in Gallup Analytics.
SURVEY METHODS
Results for this Gallup poll are based on telephone interviews conducted Feb. 1-5, 2017, with a random sample of 1,035 adults, aged 18 and older, living in all 50 U.S. states and the District of Columbia. For results based on the total sample of national adults, the margin of sampling error is ±4 percentage points at the 95% confidence level. All reported margins of sampling error include computed design effects for weighting.
Each sample of national adults includes a minimum quota of 70% cellphone respondents and 30% landline respondents, with additional minimum quotas by time zone within region. Landline and cellular telephone numbers are selected using random-digit-dial methods.
471-43-13/POLL
Americans Mixed on Secretary of State Rex Tillerson
FEBRUARY 10, 2017
WASHINGTON, D.C. -- Recently confirmed Secretary of State Rex Tillerson starts his tenure as the top U.S. diplomat with Americans viewing him about as favorably (36%) as unfavorably (33%). Nearly as many are unfamiliar with him (30%). Republicans view him positively overall, while Democrats are negative.
Favorable Ratings of Secretary of State Rex
Tillerson, by Party
|
Favorable |
Unfavorable |
No opinion |
|
|
% |
% |
% |
|
|
National adults |
36 |
33 |
30 |
|
Republicans |
71 |
5 |
25 |
|
Independents |
27 |
35 |
38 |
|
Democrats |
15 |
59 |
26 |
|
GALLUP,
FEB. 1-5, 2017 |
|||
Gallup's first measure of Tillerson's favorability was recorded Feb. 1-5, in the days after his 56-43 confirmation vote in the U.S. Senate on Feb. 1.
The former ExxonMobil CEO's confirmation was secured with fewer votes than most of his fellow Cabinet members have received to date, and was dogged by concerns about potential conflicts of interest and his record on the environment. Tillerson has also been criticized for his relationship with Russian energy companies and Russian President Vladimir Putin. Ultimately, he was supported by three Democratic senators and one independent, as well as all Republicans voting.
Tillerson spent his first week as secretary of state attempting to ease tensions with several foreign leaders whom President Donald Trump has sparred with in his first weeks in office.
About seven in 10 Republicans (71%) have a positive view of Tillerson -- much higher than his favorable ratings among independents (27%) and Democrats (15%). Democrats' opinions are strongly negative, while independents' views tilt negative.
Tillerson's Favorable Falls Short of Ratings of Past Four Secretaries of State
Tillerson's fairly high "no opinion" rating gives room for his ratings to improve or worsen as Americans become more familiar with him.
But his favorable rating already falls short of those of the past four secretaries of state when they were in the nomination or immediate post-confirmation stage of their job. Tillerson's favorable rating matches Madeleine Albright's in 1997 -- though twice as many Americans were unfamiliar with Albright in the weeks before she assumed the role as they are now with Tillerson. This allowed Albright's favorable rating to nearly double in the year after her confirmation -- a feat that would be difficult for Tillerson, based on where he is starting off with Americans.
Among more recent secretaries of state, Colin Powell in late 2000 (83%) and Hillary Clinton in January 2009 (65%) were viewed mostly positively. Both were also highly familiar to the public before their nominations and enjoyed solid favorable ratings. In early 2005, a majority of Americans (59%) viewed Condoleezza Rice positively in a poll conducted in the first two weeks after her confirmation.
John Kerry's ratings were a bit more tepid than those of his three immediate predecessors, with 44% of Americans viewing him favorably in the early months after his confirmation in 2013. At 21%, Kerry's unfamiliarity was relatively high, especially given that he had run as the Democratic nominee for president in 2004.
Favorable Ratings of Incoming Secretaries of State,
1993-2017
|
Favorable |
Unfavorable |
No opinion |
|
|
% |
% |
% |
|
|
Rex Tillerson (February 2017) |
36 |
33 |
30 |
|
John Kerry (April 2013) |
44 |
35 |
21 |
|
Hillary Clinton (January 2009) |
65 |
33 |
3 |
|
Condoleezza Rice (February 2005) |
59 |
27 |
14 |
|
Colin Powell (December 2000) |
83 |
6 |
11 |
|
Madeleine Albright (January 1997) |
36 |
5 |
59 |
|
GALLUP |
|||
Tillerson's Rating Among His Own Party Is Average for a Secretary of State
While his favorable ratings may not be as positive as his immediate predecessors', Tillerson's 71% favorability among his own party is about at the 74% average for incoming secretaries of state whom Gallup has measured over the years.
Tillerson is less popular among Republicans than Powell (91%) and Rice (81%) were, or than Clinton (93%) was with Democrats. But Tillerson's favorability among Republicans exceeds Kerry's 66% and Albright's 41% among Democrats, though Albright was still largely unknown at the time.
Favorable Ratings of Incoming Secretaries of State
|
Republicans |
Independents |
Democrats |
|
|
% |
% |
% |
|
|
Rex Tillerson |
71 |
27 |
15 |
|
John Kerry |
27 |
38 |
66 |
|
Hillary Clinton |
35 |
61 |
93 |
|
Condoleezza Rice |
81 |
52 |
37 |
|
Colin Powell |
91 |
80 |
80 |
|
Madeleine Albright |
34 |
33 |
41 |
|
GALLUP |
|||
Bottom Line
Tillerson isn't the only member of Trump's orbit whose favorable ratings are balanced out by their unfavorables. But Americans' greater unfamiliarity with the 69th secretary of state gives him a better shot of seeing his favorables improve.
The favorability ratings of most recent secretaries of state haven't varied much over their terms in the office and have typically remained within a single-digit range. Kerry is an exception to this, as his 55% rating in 2014 -- his highest -- was an outlier from the 41% to 48% favorability he received throughout the rest of his time in the role.
The most optimal course for Tillerson's favorability would be the same as Albright's -- not very well known when confirmed, but consistently liked by a majority of Americans once she got to work. But Albright's unfamiliarity was twice as high Tillerson's, her initial unfavorable ratings were much lower and views of her were far less polarized along party lines than Tillerson's are, making it much less likely that his favorability will experience the same trajectory.
Historical data are available in Gallup Analytics.
SURVEY METHODS
Results for this Gallup poll are based on telephone interviews conducted Feb. 1-5, 2017, with a random sample of 1,035 adults, aged 18 and older, living in all 50 U.S. states and the District of Columbia. For results based on the total sample of national adults, the margin of sampling error is ±4 percentage points at the 95% confidence level. All reported margins of sampling error include computed design effects for weighting.
Each sample of national adults includes a minimum quota of 70% cellphone respondents and 30% landline respondents, with additional minimum quotas by time zone within region. Landline and cellular telephone numbers are selected using random-digit-dial methods.
AUSTRALASIA
471-43-14/POLL
Digital audience growth continued to drive newspaper readership higher in 2016
February 09, 2017
Roy Morgan Research today releases the latest Print Readership and Cross-Platform Audience results for Australian Newspapers for the 12 months to December 2016.
Alongside a number of success stories in print, just over half of mastheads increased their total cross-platform reach compared with the previous results to September 2016—and readership via websites and apps was again the driving force behind that growth.
Print Readership Highlights
8,153,000 million Australians aged 14+ (41 percent) read print newspapers in an average week in 2016. This is down 4.3 percent, or just over half a million readers, compared with 2015.
Appetite for print news continues to hold strongest on Saturdays. 4.9 million read Saturday print newspapers in an average week (down 2.7 percent). Sunday titles reach 4.4 million (down 4.3 percent), and Monday to Friday dailies reach a combined 5.7 million readers during the week (down 4.8 percent).
Readers return to weekday national titles
News Corp’s and Fairfax’s national titles have both gained weekday readers. The Australian is up 8.0 percent year-on-year, with 336,000 readers per average Monday to Friday issue in 2016—25,000 more than in 2015. The Australian Financial Review is up 3.1 percent to 201,000 readers.
Melbourne vs Sydney
The Daily Telegraph and Herald Sun each continued to post strong readership results in print on weekdays and Saturdays. The Herald Sunrose 1.0 percent to 850,000 readers for its average Monday to Friday issue, and 5.0 percent on Saturdays to 823,000. The Daily Telegraphwas up 1.4 percent to 639,000 on weekdays, and was steady with 599,000 Saturday readers.
The Age is now once again more widely read in print than the Sydney Morning Herald from Monday to Friday. In 2016, the latter title fell 8.9 percent to 468,000 on weekdays, while its southern stablemate fell just 0.4 percent, holding 473,000 print readers.
Bright lights, small cities
The Illawarra Mercury, Geelong Advertiser, Cairns Post and The Advocate each gained readers for all their average Monday to Friday and Saturday editions, while the Townsville Bulletin and Newcastle Herald posted weekend gains to compensate for weekday declines.
However the Gold Coast Bulletin was far from golden, with double-digit percentage declines across the week—a fate also shared by two Tasmanian titles, The Examiner and the Mercury.
The West isn’t best
Seven West Media’s flagship newspaper masthead had the most weekday readers disappear between 2015 and 2016. 62,000 West Australians stopped reading the weekday issues of their only home-grown print newspaper (down 14.3 percent to 373,000). Meanwhile 56,000 fewer read the Weekend West (down 9.8 percent to 514,000). The Sunday Times, which was acquired from News Corp last year, didn’t fare any better: down 12.7 percent to 370,000 readers.
View the full Newspaper Average Print Issue Readership Results
Newspaper Inserted Magazines
4,823,000 Australians read one or more Newspaper Inserted Magazines in an average week (down 4.1 percent year-on-year).
The inaugural results for Stellar are fine—but not stellar. The new Sunday magazine from News Corp reached an average 878,000 readers per issue over its first few months. This is slightly below its predecessor Sunday Style’s final result of 900,000 readers—despite the benefit of a third host News Corp masthead, Queensland’s Sunday Mail, joining the Sunday Telegraph and Sunday Herald Sun. It will be interesting to watch this space as Sunday newspaper readers discover this new title.
The country’s most-read insert, Good Weekend has made a big comeback, up 10.9 percent to 1,332,000 readers per average issue in 2016—the title’s best readership result since March 2015.
View the full Newspaper Inserted Magazine Readership Results
Cross-Platform Audience
Highlights
The total cross-platform reach of Australian mastheads measured across both print and digital increased to 13.1 million in 2016. Two in three Australians now access these news mastheads across any platform and any device in an average week.
Eight of the 15 publications increased their cross-platform readership, compared with the previous quarterly results for the 12 months to September 2016.
Notably, the total growth for all eight of these mastheads was driven (in most cases entirely) by an increase in digital readership. Conversely, the seven that declined all posted a drop in digital readership as well as print.
Six mastheads reach over two million Australians in an average week, and all of these giants are among the winners. The Sydney Morning Herald continues to lead with 4,238,000 readers per week across print and digital—86 percent of which comes via its website and app. TheDaily Telegraph reached 3,254,000 (67 percent digital), ahead of the Herald Sun (3,050,000, 64 percent digital), The Age (2,924,000, 84 percent digital), The Australian (2,474,000, 71 percent digital) and the Courier-Mail (2,153,000, 62 percent digital).
The two other winners were the Canberra Times (525,000, 86 percent digital), and the regional Weekly Times (310,000, 15 percent digital).
View the full Cross-Platform Audiences Results
Michele Levine, CEO, Roy Morgan Research, says:
“The trustworthiness of
media will be one of the defining issues of 2017. Amid all the talk about ‘fake
news’ and ‘alternative facts’ are reports of erroneous reach figures from
digital publishers. Just as audiences are seeking clarity about what and whom
to believe, so too media agencies and advertisers need a reliable, independent
measure of cross-platform reach. It is up to the publishers to prove
themselves—to the public and the industry.
“Roy Morgan’s latest
Newspaper Readership results to the end of 2016 show that the big are getting
bigger, and the small smaller. The most-read mastheads continue to grow, thanks
to increasing numbers of website and app readers—while some including the
Adelaide Advertiser, West Australian, Newcastle Herald and the Mercury, aren’t
converting their print readers into online audiences.
“Clearly, rather than
making the transition to the digital version of their home newspaper, some
print readers in Adelaide, Perth, Newcastle and Hobart instead read the
national or ‘big city’ mastheads when going online.
“As publishers continue to
evaluate their paywall, metered and freemium revenue models, and the reach
versus reward of distribution through Apple, Facebook and Google, the coming
year may well prove to have long-term impacts on how readers value and use news
media.”
471-43-15/POLL
Over 12 million Australians have jobs for the first time – including over 8 million full-time jobs, but real unemployment now 9.7% (1.295m)
February 08, 2017
For the first time in January over 12 million Australians are
now employed – up 368,000 over the past year. However, a total of 2.402 million
Australians, 17.9% of the workforce, were either unemployed (1,295,000) or
under-employed (1,107,000) - down 173,000 (down 1.8%) from January 2016.
·
Unemployment is less than a year
ago with 1.295 million Australians now unemployed (down 51,000 in a year and
down 0.6% at 9.7%). The Roy Morgan real unemployment figures are substantially
higher than the current
ABS estimate for December
2016 (5.8%);
·
In January the total Australian
workforce increased to 13,414,000 (up 316,000 since January 2016) and for the
first time total employment was above 12 million – 12,120,000 (up 368,000);
·
In further good news over 8
million Australians are now employed full-time for the first time: now
8,085,000 – up 221,000 from a year ago (7,864,000 in January 2016). Part-time
employment also grew strongly, increasing by 147,000 to 4,035,000 from
January 2016 (3,888,000);
·
Under-employment in January is now
8.3% (down 1.1% since January 2016) of the work force and 1,107,000 Australians
(down 122,000 since January 2016) are under-employed.
|
Roy Morgan Unemployed and ‘Under-employed’* Estimate |
||||||||
|
Unemployed or ‘Under-employed’* |
Unemployed |
Unemployed looking for |
‘Under-employed’* |
|||||
|
Full-time |
Part-time |
|||||||
|
2015 |
‘000 |
% |
‘000 |
% |
‘000 |
‘000 |
‘000 |
% |
|
Jan-Mar 2015 |
2,384 |
18.9 |
1,327 |
10.5 |
656 |
672 |
1,057 |
8.4 |
|
Apr-Jun 2015 |
2,359 |
18.7 |
1,263 |
10.0 |
618 |
645 |
1,096 |
8.7 |
|
Jul-Sep 2015 |
2,061 |
16.2 |
1,109 |
8.7 |
518 |
591 |
952 |
7.5 |
|
Oct-Dec 2015 |
2,475 |
19.2 |
1,184 |
9.2 |
603 |
581 |
1,291 |
10.0 |
|
2016 |
||||||||
|
Jan-Mar 2016 |
2,496 |
19.1 |
1,362 |
10.4 |
639 |
723 |
1,134 |
8.7 |
|
Apr-Jun 2016 |
2,322 |
18.1 |
1,317 |
10.2 |
637 |
680 |
1,005 |
7.8 |
|
Jul-Sep 2016 |
2,296 |
17.8 |
1,266 |
9.8 |
574 |
692 |
1,030 |
8.0 |
|
Oct-Dec 2016 |
2,446 |
18.9 |
1,191 |
9.2 |
635 |
556 |
1,255 |
9.7 |
|
Months |
||||||||
|
December 2015 |
2,690 |
20.7 |
1,256 |
9.7 |
722 |
534 |
1,434 |
11.0 |
|
January 2016 |
2,575 |
19.7 |
1,346 |
10.3 |
696 |
650 |
1,229 |
9.4 |
|
February 2016 |
2,480 |
18.8 |
1,319 |
10.0 |
589 |
730 |
1,161 |
8.8 |
|
March 2016 |
2,433 |
18.8 |
1,422 |
11.0 |
631 |
791 |
1,011 |
7.8 |
|
April 2016 |
2,322 |
18.1 |
1,334 |
10.4 |
611 |
723 |
988 |
7.7 |
|
May 2016 |
2,316 |
18.1 |
1,369 |
10.7 |
661 |
708 |
947 |
7.4 |
|
June 2016 |
2,326 |
17.9 |
1,247 |
9.6 |
637 |
610 |
1,079 |
8.3 |
|
July 2016 |
2,536 |
19.5 |
1,365 |
10.5 |
645 |
720 |
1,171 |
9.0 |
|
August 2016 |
2,249 |
17.5 |
1,332 |
10.4 |
544 |
788 |
917 |
7.1 |
|
September 2016 |
2,103 |
16.2 |
1,101 |
8.5 |
532 |
569 |
1,002 |
7.7 |
|
October 2016 |
2,454 |
19.1 |
1,188 |
9.2 |
626 |
562 |
1,266 |
9.9 |
|
November 2016 |
2,299 |
17.6 |
1,199 |
9.2 |
629 |
570 |
1,100 |
8.4 |
|
December 2016 |
2,584 |
20.0 |
1,186 |
9.2 |
650 |
536 |
1,398 |
10.8 |
|
January 2017 |
2,402 |
17.9 |
1,295 |
9.7 |
634 |
661 |
1,107 |
8.2 |
*Workforce includes those employed and those looking for work – the unemployed.
Gary Morgan, Executive Chairman, Roy Morgan Research, says:
“For the first time total
Australian employment exceeded 12 million in January – 12,120,000 (up 368,000
since January 2016) powered by increases in both full-time employment –
8,085,000 (up 221,000) and part-time employment 4,035,000 (up 147,000). January
also marked the first month over 8 million Australians are employed full-time.
“However, despite the
encouraging news, job creation in Australia is still not strong enough to
significantly lower Australia’s real unemployment and under-employment – now
9.7% (1.295 million, down 51,000 from a year ago) Australians are unemployed,
and an additional 8.2% (1.107 million, down 122,000) are under-employed – a
total of 2.402 million (17.9%) looking for work or looking for more work.
“New US President Donald Trump has consistently
outlined the problems with the way unemployment is measured in the United
States. In December Trump claimed the Bureau of Labor
Statistics (BLS) unemployment rate was “totally fiction”. Trump’s
insistence that the BLS severely under-estimates US unemployment is one of the
primary reasons Trump was elected President.
“The BLS estimates US
unemployment of 4.8% in January (U3 measure), although the more accurate U6
measure estimates US unemployment of 9.4%. However, during the Presidential
election campaign Trump claimed real US unemployment was as high as 20%.
“The Australian Government
faces the same problem Trump has called attention to – the ABS unemployment
figure (5.8% for December 2016) severely
under-estimates real Australian unemployment – and the ABS doesn’t even release
a monthly estimate of Australian under-employment.
“The changing nature of
the workforce in Australia, the United States, and for that matter around the
world demands that Governments look seriously at amending the official measures
of employment and unemployment that policymakers rely on to make decisions that
impact millions of their citizens.
“If Governments are to
look after the best interests of their citizens – as they’re elected to do –
the crucial economic indicators like the unemployment estimates must be as
accurate as possible, and not designed to under-state the problem for political
purposes.
“In Prime Minister Malcolm
Turnbull’s case, it is imperative for his own political survival, and that of
his L-NP Government, that an accurate measure of unemployment is used to set
policy to ensure a growing Australian economy provides jobs to the over 2
million Australians looking for work or looking for more work.
“However, there is good
news for the Turnbull Government this week with Victorian crossbench Senator
Derryn Hinch announcing his support for bringing forward the implementation of
the Government’s ABCC Bill which triggered last year’s Federal Election. When
implemented the ‘new’ ABCC building code will significantly lower building
costs if the Building Industry doesn’t give into union pressure as they have
over the last 20+ years.
“Today’s vigorous verbal assault on Opposition Leader
Bill Shorten –
calling the Opposition Leader ‘sycophantic’ and a ‘parasite’ and accusing
Shorten of selling out the jobs and wages of Australian workers – shows
Turnbull’s finally showing initiative by bringing the major issue facing
Australia to the fore – industrial relations and the restrictive Australian IR
laws that stop businesses hiring workers and leads to higher unemployment.”
This Roy Morgan survey on Australia’s unemployment and ‘under-employed’* is based on weekly face-to-face interviews of 517,844 Australians aged 14 and over between January 2007 – January 2017 and includes 3,953 face-to-face interviews in January 2017.
*The ‘under-employed’ are those people who are in part-time work or consultants who are looking for more work. (Unfortunately the ABS does not release this figure in their monthly unemployment survey results).
Margin
of Error
The margin
of error to be allowed for in any estimate depends mainly on the number of
interviews on which it is based. The following table gives indications of the
likely range within which estimates would be 95% likely to fall, expressed as
the number of percentage points above or below the actual estimate. The figures
are approximate and for general guidance only, and assume a simple random
sample. Allowance for design effects (such as stratification and weighting)
should be made as appropriate.
|
Sample
Size |
%
Estimate |
|||
|
|
40%-60% |
25%
or 75% |
10%
or 90% |
5%
or 95% |
|
5,000 |
±1.4 |
±1.2 |
±0.8 |
±0.6 |
|
10,000 |
±1.0 |
±0.9 |
±0.6 |
±0.4 |
|
20,000 |
±0.7 |
±0.6 |
±0.4 |
±0.3 |
|
50,000 |
±0.4 |
±0.4 |
±0.3 |
±0.2 |
Source: http://www.roymorgan.com/findings/7137-australian-unemployment-estimates-january-2017-201702081553
471-43-16/POLL
Business Confidence rises in January to 116.8 (up 2.4%) driven by more confidence in the Australian economy
February 08, 2017
Roy Morgan Research’s Business Confidence rose 2.4% to 116.8 in January
driven by increasing confidence about the Australian economy. The rise in
Business Confidence occurred despite the Australian All Ordinaries falling
slightly in January, down 44.1pts (-0.8%) to 5,675 in contrast to the record
highs on US indices following Donald Trump’s victory in the US Presidential
Election.
This
month’s rise in Business Confidence means Business Confidence is now slightly
above the 6yr average (116.5).
Driving
the increase in Business Confidence was increasing confidence about the
Australian economy. A majority of businesses 51.7% (up 4.3ppts) expect ‘good
times’ for the Australian economy over the next 12 months; a net positive of
11.5% (up 10.8ppts) and now 54.5% (up 1ppt) expect ‘good times’ for the economy
over the next five years. Roy Morgan December Business Confidence results are
based on 1,012 interviews with a cross-section of Australian businesses.
Monthly
Business Confidence -- Australia
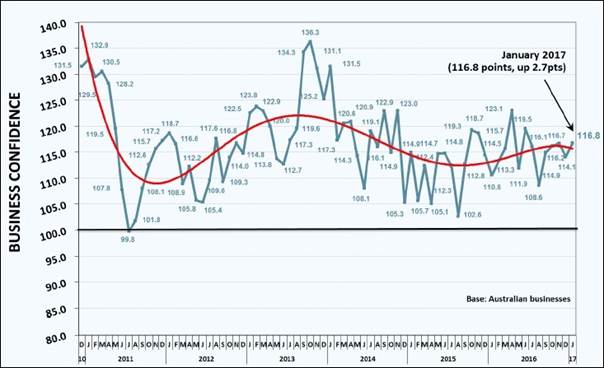
Source: Roy Morgan Business Single Source (Australia),
December 2010-December 2016. Average monthly sample last 12 months = 1,017.
However,
despite a positive viewpoint on the Australian economy, businesses were less
bullish on their own prospects – now 43.3% (down 3.6ppts) of businesses expect
to be ‘better off’ this time next year cf. 15.9% (down 4ppts) that expect to be
‘worse off’ while 52.9% (down 1.9ppts) say the next 12 months are a ‘good time
to invest’ cf. 37.9% (up 1.3ppts) that say the next 12 months are a ‘bad time
to invest’ – so fairly mixed results for these two questions.
Michele
Levine, Chief Executive Officer, Roy Morgan Research says:
“Business
Confidence was up 2.7pts (+2.4%) in January – following seasonal trends which
have seen Business Confidence increase in six out seven years during which this
survey has been conducted. The increase in Business Confidence came after
strong performances on international stock-markets following the victory of
Donald Trump in the US Presidential Election although the Australian All
Ordinaries Index fell 44.1pts (-0.8%) in January to 5,675.
“The
biggest drivers of the improved performance in January were indicators looking at
the performance of the Australian economy with 51.7% (up 4.3ppts) of businesses
now expecting ‘good times’ for the Australian economy over the next 12 months
and an even higher majority, 54.5% (up 1ppt) expecting ‘good times’ for the
economy over the next five years.
“Analysing
the movement of Business Confidence across the States in January shows strong
rises in Victoria, Western Australia, Tasmania and Queensland – now clearly the
highest Business Confidence of the larger States offsetting falls in South
Australia and New South Wales. The fall in New South Wales came after popular
NSW Premier Mike Baird shocked Australia’s political establishment by
announcing his resignation as Premier in mid-January after less than three
years in the State’s top job.
“Analysing
Business Confidence by industry shows Education and training is now Australia’s
most confident industry closely followed by Transport, Postal and Warehousing,
Health care, Construction and Agriculture – even though this last industry has
fallen month-over-month. All five of these industries are far more confident
than the headline figure for January.
“In
contrast, several industries continue to lag in confidence including Wholesale
trade, Arts and Recreational services, Information media and Telecommunications
and Mining – which is again the least confident industry sector in January
despite a better than expected 2016. Australia posted a record trade surplus in
December 2016 largely driven by big jumps in coal exports (up 14%
month-on-month) and iron ore exports (up 10% month-on-month).”
MULTI-COUNTRY STUDIES
471-43-17/Multi-country studies
WIN/GIA 40th Annual Global End of Year Survey reveals Happiness improves despite Economic Confidence falling
WIN/Gallup International, the world’s leading
association in market research and polling, has published today its 40th Annual
End of Year Survey exploring the outlook, expectations, views and beliefs of
68,759 people from 69 countries across the globe.
Headlines
·
68% of the world said that they
feel happy about their lives, an increase from 66% last year;
·
22% are neither happy nor
unhappy, and 9% feel unhappy about their lives.
Net happiness (happy minus unhappy) globally is +59%; an increase from
+56% last year.
·
Fiji and China are the happiest
countries of the world (+89% and +79% net happiness respectively), followed by
Philippines, Vietnam, Indonesia, Panama and Papua New Guinea while Iraq is the
least happy for the third year in a row (less than +1% net happiness).
·
42% of the world is optimistic
about the economic outlook for 2017; 22% are pessimistic and 31% believe the
economy will remain the same. Net economic optimism is at +20%.
·
The most optimistic countries
about economic prosperity in 2017 are Ghana and Bangladesh (+67% net optimistic
each). In contrast, South Korea, Hong Kong and Greece are the most pessimistic
(-62%, -56% and -53% respectively).
Happiness: A happier
world albeit with some stark regional differences Two in three (68%) citizens
of the world report being happy, a figure which has risen 2% from twelve months
ago, despite a year in which the world has seen considerable change and a year
of frequent and bloody terrorist attacks. Of the 68,759 people surveyed, 9%
said that they were unhappy, down from 10% at the end of 2015. Overall this
means that the world is +59% net happy (happiness minus unhappiness). But
regionally the story is very different with those in East Asia and Oceania
significantly happier than those in the Middle East. For example, happiness in
Fiji and China, the net happiest countries of the world (net scores of +89% and
+79% respectively) is in stark contrast to happiness in Iraq, which rates as
the unhappiest of all 69 countries surveyed (net score of less than +1%). The
Beatles wrote “money can’t buy me love” – but the findings suggest it does
however correlate strongly with happiness – those in the bottom quintile of
income record a net happiness score of +33% compared with a score of +75% for
those in the top quintile; irrespective of nations in which they reside.
Economic
Optimism:
Globally high but lower than last year When it comes
to economic outlook despite much of the world largely remaining out of
recession, economic optimism has declined from twelve months ago. The study
shows that 42% of the world is optimistic for the economic outlook in 2017,
almost double (22%) of those who are pessimistic. Net optimism (the percentage
of those saying next year will be one of economic prosperity minus the percentage
who say next year will be one of economic difficulty) has fallen from +23% to
+20%. While globally just over two in five (42%) say next year will be one of
economic prosperity, there are very significant differences across the globe.
European citizens are significantly less optimistic than anywhere else in the
world: EU Europe net score of -26% and Non-EU Europe net score of -20%. The
challenges posed to the very future of the EU project in 2016 may well have
created economic doubt within the world’s largest economic bloc. Within Europe,
economic pessimism is most acutely felt in Italy (net score of -48%), the UK
(net score of -38%) and France (net score of -34%). Only Korea and Hong Kong,
who have witnessed a year of political and economic turmoil, are more
pessimistic (net scores of -62% and -56%). The most optimistic nations when it
comes to the economy were Ghana and Bangladesh (+67% net optimism each). When
it comes to a demographic breakdown, young people prove to be considerably more
optimistic than older generations with 34% under 34 years of age net optimistic
compared to -7% over the age of 55.
Hope: High amongst Middle and Low Income Nations
As most of the world welcomes a New Year, we see a
majority (52%) of the planet feeling that overall 2017 will be better than
2016, although one in seven (15%) feel it will be worse (giving a net score of
+37%, which represents a small drop of 2% points from a year ago). Those living
in some of the fastest growing countries in the world (Bangladesh net +76%,
Ghana net +76%, Ivory Cost +72%, Fiji +62%, China net +56%, India net +55% and
Brazil net +51%) are the most hopeful for the year ahead. However, it is the
economic superblocks of the EU (net score of 1%) and North America (net score
of +11%) which show the least optimism for improvement. With Prime Minister
Renzi losing a referendum this month and with an economic recovery that does
not take off, it is perhaps of no surprise that it is the Italians (net score
of -42%) who are most concerned about the year ahead.
Analysis: Global Income Redistribution drives
national outlooks on Economic Optimism and Pessimism Polling data combined with
World Bank Bigdata on Gross National Income (GNI) shows a clear link between
economic outlook for the year 2017 and global redistribution of Income (GNI)
during the last one decade. During the recent 10 years (2005-15), the Tier One
Rich Countries (30 nations with average annual per capita income of 45,000 US
dollars) lost 10% in their share in global economy. This Group in the opinion
poll is at present the most pessimistic in their economic outlook for 2017
(-17% Net Score). The Tier Two Middle Income Countries (12 nations with average
annual per capita income of 13,000 US dollars) gained 10% in their share in
global economy. This group in the survey is at present the most optimistic in
economic outlook for 2017 (+30%). The Tier Three Low Income countries (175
nations with average annual per capita income of 7,000 US dollars) which
retained its share in global economy during the last decade hangs in between
the Tier One and Tier Two in terms of economic outlook (+26%). See Exhibit 5 on
page 11. Vilma Scarpino, President of WIN/Gallup International Association,
said: “The world is witnessing changing income distribution across nations. The
old rich are losing while the new rich are gaining ground. This transition is
reflected in their outlooks on hope about 2017. Fortunately, happiness is
becoming unrelated to views on economic outlook. The rich nations of the
Western World are happy despite their gloomy outlook on economic prospects. As
a result, the global community as a whole reveals a happy majority, in fact
slightly happier than a year ago.”
Methodology: The WIN/Gallup International survey is
an annual tradition initiated by and designed under the chairmanship of Dr.
George Gallup in 1977. It is conducted every year since then. This year it was
carried out by the WIN/Gallup International Association in 69 countries around
the world. It is the poll’s 40th anniversary. Sample Size and Mode of Field
Work: A total of 68,759 people were interviewed globally. In each country a
representative sample of around 1000 men and women was interviewed either face
to face (26 countries; n=29,713), via telephone (15 countries; n=12,470),
online (25 countries; n=23,947) or through mixed methods (3 countries;
n=2,629). The field work was conducted during October-December 2016. The margin
of error for the survey is between +/-3-5% at 95% confidence level.
471-43-18/Multi-country study
Most NATO Members in Eastern Europe See It as Protection
FEBRUARY 10, 2017
WASHINGTON, D.C. -- While U.S. President Donald Trump, even as recently as January, referred to NATO as "obsolete," residents in many NATO member countries in Eastern Europe associate the alliance with the protection of their countries. This includes majorities in Poland, Estonia and Lithuania, where NATO allies, including the U.S., have recently sent troops to quell security concerns after Russia's actions in Ukraine.
Eastern European Countries' Views of NATO in 2016
Do you associate NATO with protection of your
country, as a threat to your country or do you see it as neither protection nor
a threat?
|
Protection |
Threat |
Neither |
|
|
% |
% |
% |
|
|
Kosovo |
90 |
3 |
6 |
|
Albania |
70 |
3 |
22 |
|
Poland |
62 |
8 |
22 |
|
Lithuania |
57 |
13 |
25 |
|
Estonia |
52 |
17 |
26 |
|
Croatia |
52 |
17 |
19 |
|
Romania |
50 |
8 |
25 |
|
Hungary |
49 |
9 |
25 |
|
Latvia |
49 |
16 |
29 |
|
Czech Republic |
46 |
13 |
27 |
|
Macedonia |
45 |
13 |
24 |
|
Slovakia |
37 |
19 |
35 |
|
Bosnia and Herzegovina |
28 |
21 |
38 |
|
Bulgaria |
28 |
20 |
34 |
|
Greece |
23 |
19 |
45 |
|
Montenegro |
21 |
29 |
35 |
|
Serbia |
6 |
64 |
19 |
|
GALLUP |
|||
The U.S. is a founding member of NATO, but its commitment to the alliance has been questioned after Trump publicly raised doubts about NATO's relevance and its funding before he took office. However, according to NATO, Trump agreed on Sunday to attend a meeting of NATO leaders in May, and he and NATO Secretary-General Jens Stoltenberg "reconfirmed the importance of the alliance in troubled times." And on Monday, Trump reaffirmed his support for NATO on a visit to the headquarters of the U.S. Central Command.
How the U.S. interacts with NATO has far-reaching consequences overseas, because many Eastern European countries count on NATO for protection. Last October, the United Kingdom sent 800 troops to Estonia. And shortly before President Barack Obama left the White House, the U.S. sent 4,000 troops to Poland to protect it and neighboring NATO allies Estonia, Lithuania and Latvia from perceived aggression from neighboring Russia.
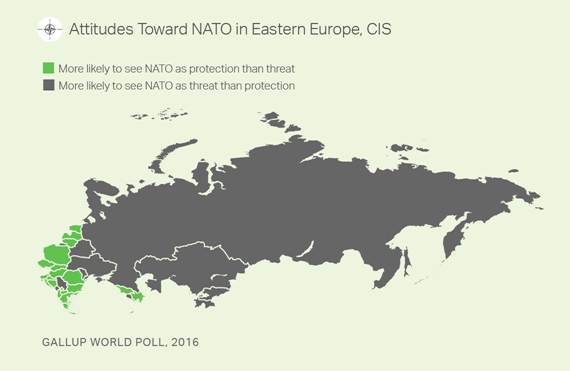
Kosovo, although not a NATO member, received military support from NATO during the Kosovo War between the former Yugoslavia and the Kosovo Liberation Army (KLA), and its residents overwhelmingly (90%) look at the alliance as protection. The same holds true for residents of NATO member Albania (70%) -- which also supported the ethnic Albanian KLA during the war. Similarly, it is not surprising that 64% of Serbians in 2016 view NATO as a threat and 6% see it as protection.
Russia, Countries in Russia's Sphere of Influence See NATO as a Threat
With NATO's inclusion of several post-Soviet states after the dissolution of the Soviet Union, and its rebuking of Russia's involvement in Ukraine, it is no surprise that Russia is at odds with NATO. Sixty-seven percent of Russians in 2016 view NATO as a threat, which is up 29 percentage points since 2012, and is the highest number that Gallup has recorded since it started tracking Russians' views on NATO in 2008.
Residents of countries in Russia's sphere of influence that are not NATO members tend to share Russia's views on the alliance, if they have an opinion. Fifty-four percent of Belarusians view NATO as a threat, a 19-point jump from four years ago. Along with the Russians and Belarusians, more people in Ukraine (35%), Kazakhstan (31%), Kyrgyzstan (30%), Moldova (27%), Armenia (20%) and Tajikistan (34%) view NATO as a threat than as protection.
Views of NATO in Post-Soviet States
Do you associate NATO with protection of your
country, as a threat to your country or do you see it as neither protection nor
a threat?
|
Protection |
Threat |
Neither |
|
|
% |
% |
% |
|
|
Belarus |
3 |
54 |
30 |
|
Russia |
3 |
67 |
20 |
|
Armenia |
8 |
20 |
38 |
|
Tajikistan |
8 |
34 |
20 |
|
Moldova |
16 |
27 |
38 |
|
Kyrgyzstan |
19 |
30 |
12 |
|
Azerbaijan |
21 |
16 |
44 |
|
Kazakhstan |
25 |
31 |
27 |
|
Ukraine |
29 |
35 |
26 |
|
Georgia |
37 |
8 |
35 |
|
GALLUP
WORLD POLL, 2016 |
|||
Ukrainians Sour on NATO
The proportion of residents of Ukraine -- a potential NATO member state until a few years ago -- who view NATO as a threat has increased in recent years after years of steady decline between 2008 and 2014. In 2014, after NATO sanctioned Russia after it annexed Crimea, Ukrainians for the first time were more likely to see NATO as protection (36%) than a threat (20%). However, the percentage viewing it as a threat shot back up to 35% in 2016 as the Ukrainian population has grown tired of the ongoing conflict between its military and Russian-backed separatists, as well as a poor economy and rising crime rates. Without a clear end in sight to the conflict, Ukrainians may be losing confidence in NATO's ability to help them in this crisis.

Implications
With Russia's recent military activity in the region, and with many Eastern European countries relying on the U.S. and NATO for protection, the United States' future commitment to NATO is at a critical point. If the U.S. were to leave NATO, Russia would stand to benefit because a NATO without the United States' full cooperation would be less equipped to curtail any Russian military and political expansion. It would also strain the United States' relationships with many European allies, potentially weakening important military and economic partnerships that are vital to the United States' foreign policy interests.
SURVEY METHODS
Results are based on telephone interviews conducted throughout 2016 in the countries included in the analysis with a random sample of approximately 1,000 adults, aged 15 and older, living in each country. In Russia, the sample size was 2,000 adults. For results based on the total sample of national adults, the margin of sampling error ranges from ±2.7 percentage points to ±3.9 percentage points at the 95% confidence level. All reported margins of sampling error include computed design effects for weighting.
CYBER WORLD
471-43-19/POLL
How Americans Encounter, Recall and Act Upon Digital News
FEBRUARY 9, 2017
When following links, online news consumers could
recall the name of the news outlet 56% of the time
Anyone who wants to understand today’s news environment faces a challenge: How to discern the nuances of digital news habits when Americans’ attention spans are fractured, human memory is naturally limited and news comes at them every which way.
To tackle this complex question, Pew Research Center, in association with the John S. and James L. Knight Foundation, took on the unusual task of staying in touch with more than 2,000 U.S. adults who get at least some news online over the course of a week. The study ran from Feb. 24 to March 1, 2016. Respondents were asked twice a day whether they got news online within the past two hours and, if so, were asked about their experience with that news. This technique was used to improve the chances that respondents would be able to accurately recall their recent news interactions and allowed researchers to ask about sources and behaviors with a high level of detail. This amounted to up to 14 completed surveys per person for a total of 25,602 interviews – 13,086 of which included online news consumption.
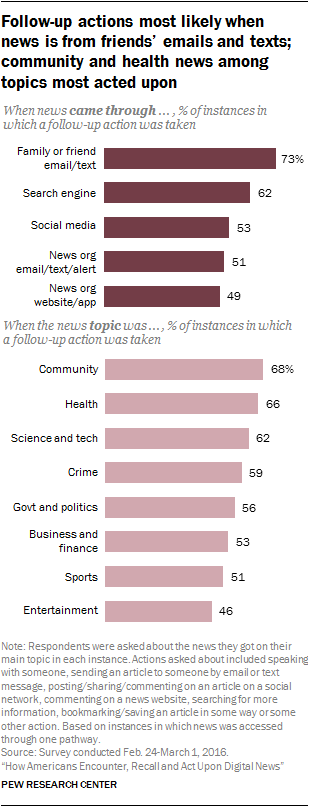 While there are a
number of pathwaysAmericans
use to get news online, two in this study stand out as the most common: social
media and direct visits to news organizations’ websites. When asked how they
arrived at news content in their most recent web interaction, online news
consumers were about
equally likely to get news by going directly to a news website (36% of the
times they got news, on average) as getting it through social media (35%). They
were less likely to access news through emails, text messages or search
engines. And most people favored one pathway over another. Nearly two-thirds
(65%) of online news consumers had one preferred pathway for getting most of
their online news.
While there are a
number of pathwaysAmericans
use to get news online, two in this study stand out as the most common: social
media and direct visits to news organizations’ websites. When asked how they
arrived at news content in their most recent web interaction, online news
consumers were about
equally likely to get news by going directly to a news website (36% of the
times they got news, on average) as getting it through social media (35%). They
were less likely to access news through emails, text messages or search
engines. And most people favored one pathway over another. Nearly two-thirds
(65%) of online news consumers had one preferred pathway for getting most of
their online news.
The study also sheds light on whether people are actually aware of the sources of news they consume – a question all the more relevant in light of the prevalence offabricated news stories during the final weeks of the 2016 election. It reveals that when consumers click on a link to get to news, they can often recall the news source’s name. Individuals who said they followed a link to a news story were asked if they could write down the name of the news outlet they landed on. On average, they provided a name 56% of the time. But they were far more able to do so when that link came directly from a news organization – such as through an email or text alert from the news organization itself – than when it came from social media or an email or text from a friend. It was also the case that 10% of consumers, when asked to name the source of the news, wrote in “Facebook” as a specific news outlet.
Another critical issue facing the industry is identifying which news experiences tend to inspire follow-up actions such as sharing, searching for more information or talking about it with others. This study suggests differences based on both the pathway used to get the news and the topic of news itself. Among the five pathways studied, news instancesspurred by emails and texts from friends or family elicited the most activity; nearly three-quarters (73%) of these instances were acted upon in some way. That outpaced even social media and direct visits to a news organization’s website, where a follow-up action occurred in about half of news instances (53% and 47%, respectively). Overall, talking with someone offline, whether in person or over the phone, was the most common action taken with digital news.
As for the topic of the news, community and health news spurred follow-up action about two-thirds of the time, while entertainment, sports and business news did so only about half the time. The type of follow-up action taken also varied with news topic. Stories about community affairs stand out for their social nature and were shared via social media at a far higher rate than any other topic. Science news, on the other hand, was bookmarked or saved for later or sent to someone via email or text at a higher rate than most other topics. Still, for all pathways and topics studied, speaking with someone offline about the news rises to the top.
It is important to keep in mind that this is self-reported data, and activities even as recent as the last two hours can be hard for some people to recall. At the same time, though, while a repeated survey like this can make people more aware of their online activities, little evidence of this emerged. This unique approach provides a deeper and more tangible window into how Americans learn about current events in the digital age, and speaks to some of the challenges news organizations have in establishing a relationship with digital audiences.
Other interesting patterns that emerged include the following:
§ Just as individuals tend
to favor one digital pathway over others, certain topics in the news are more
likely to be learned about through one method over another. Business and
finance news, for example, is more likely to be accessed by going directly to a
news website. About half of business and finance news instances (53%) occurred
through an individual going directly to a news website or app, compared with
just 12% that came through social media. Community news, on the other hand, was
much more likely to be discovered through social media (53%) than on a news
website (22%).
§ Social media, search
engines and friends’ emails and texts all succeed in engaging news consumers
within the bounds of each venue. About a quarter
(23%) of the instances in which news came through a search engine resulted in
searches for additional information, a higher share than any other pathway.
Similarly, 14% of news instances from friends or family led to sending news via
email or text, compared with 5% or less of the instances from any other
pathway. And when people got news through social media, they went on to
re-share that news on social media one out of four times. On the other hand, no
single digital action stands out for news that came from a direct connection
with a news organization.
§ Younger and older online
news consumers follow news links at the same rate, but younger adults are less
likely to remember the source. When 18- to
29-year-old online news consumers clicked on news links, they remembered the
source about half the time (47%), at least 10 percentage points less than their
elders (57% for 30- to 49-year-olds and 61% for those 50 and older). And these
younger online news consumers got their news through social media 47% of the
time on average, about double the rate of those 50 and older (23%), and about
on par with those ages 30 to 49 (42%). Those 50 and older, on the other hand,
stand out for their heavier reliance on news organizations’ emails, texts and
alerts.
Details
of the study
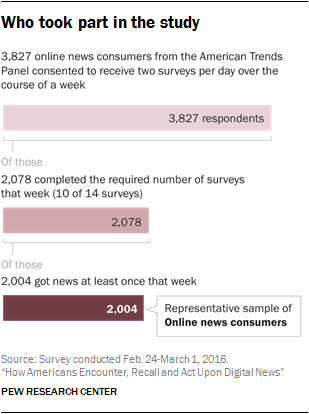 Over the course of one
week (Feb. 24 to March 1, 2016), a nationally representative sample of online
news consumers received two short surveys per day (14 total) asking about the
news they got online, if any, in the past two hours.
Over the course of one
week (Feb. 24 to March 1, 2016), a nationally representative sample of online
news consumers received two short surveys per day (14 total) asking about the
news they got online, if any, in the past two hours.
The respondent pool comes from a survey conducted Jan. 12-Feb. 8, 2016, among 4,654 U.S. adults ages 18 and older who are members of Pew Research Center’s nationally representative American Trends Panel. In this February survey, those who indicated that they get news digitally (on a desktop or laptop computer or mobile device) were asked to participate in a weeklong study of their online news consumption. Of these individuals, 3,827 agreed to participate.
A total of 2,078 respondents completed at least 10 of the 14 mini-surveys during the week, of which 2,004 said that they got news online in at least one survey. These respondents are representative of online news consumers in a given week.
The structure of this study allows for analyses at two
different levels:
1.
![]() Online
news consumer level: Average behavior of the 2,004
online news consumers surveyed over the course of the week. For example, the
report looks at how often, on average, consumers got news by going directly to a
news website versus getting it through social media.
Online
news consumer level: Average behavior of the 2,004
online news consumers surveyed over the course of the week. For example, the
report looks at how often, on average, consumers got news by going directly to a
news website versus getting it through social media.
2.
![]() Instance
level: The characteristics of the
13,086 total news instances that occurred during the week studied. For example,
the report looks at whether news accessed through social media is more likely
to be acted upon than news from a news organization’s website.
Instance
level: The characteristics of the
13,086 total news instances that occurred during the week studied. For example,
the report looks at whether news accessed through social media is more likely
to be acted upon than news from a news organization’s website.
The report is divided accordingly into these two distinct
parts, and the relevant icon – from the two above – appears at the start of
each section to help readers keep the analytical frame in mind.
Source: http://www.journalism.org/2017/02/09/how-americans-encounter-recall-and-act-upon-digital-news/