BUSINESS
& POLITICS IN THE WORLD
GLOBAL
OPINION REPORT NO. 602
Week: August
26 – September 01, 2019
Presentation
6th September, 2019
Contents
Inside
Afghanistan: Record Numbers Struggle to Afford Basics
UAE
Parents Have High Concerns over Their Child’s Exposure To Inappropriate Online
Content
Health
Insurance Coverage for Nigerians Still Abysmal; An Urgent Call For New
Strategy.
Labour
Voters More Wary about Politics of Child’s Spouse
Most
Brits Expect Recession, As Consumer Confidence Dips To Six-Year Low
Half
of Leave Voters Doubt Johnson Can Secure New Brexit Deal
Few
Believe the Government's Explanation of Why Parliament Is To Be Suspended
Brits
Oppose Parliament Suspension By 47% to 27%
5
Facts about the Abortion Debate In America
U.S.
Concern about Climate Change Is Rising, But Mainly Among Democrats
Most
Americans Say Science Has Brought Benefits to Society and Expect More to Come
Parents'
Concern about School Safety Remains Elevated
As
Labor Day Turns 125, Union Approval Near 50-Year High
Americans'
Satisfaction with U.S. Education at 15-Year High
Most
Cannabis Consumers Use on a Weekly Basis or More
Ride-Sharing
App Uber Overtakes Taxis as Preferred Private Transport Service
Rising
Numbers of Australians Looking At Electric and Hybrid Vehicles for Their Next
Set of Wheels
Toyota
And Mazda Drivers Most Brand Loyal; Have The Luxury Brands Lost Their Lustre?
Britons
Make Worst Tourists, Say Britons (And Spaniards And Germans)
Brazilians
Least Satisfied in Amazon With Environment
India
Ranks 9th on Happiness among 28 Global Markets: Ipsos Global Happiness Survey
The
Biggest Beauty Influencer Isn’t Who You Think It Is
INTRODUCTORY NOTE
This weekly report consists of twenty two surveys.
The report includes four multi-country studies national surveys from different
states across the globe.
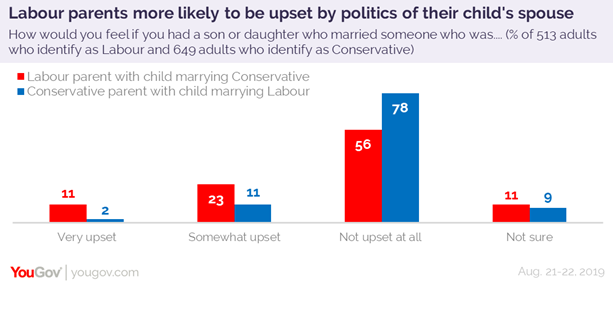
602-43-23/Commentary:
Labour voters more wary about politics of child’s
spouse
A third of Labour
voters say they would be upset if their child married a Conservative – twice as
many as in the reverse situation
Parents only want the best for their children,
especially when it comes to choosing a partner. And it turns out that politics
matters.
New YouGov data
reveals that Labour supporters are more likely to be
upset if their child married into the opposite end of the political spectrum
than their Tory counterparts.
A third (34%) of those who identify themselves
as Labour supporters say they would be upset to some
extent if their child married a Conservative, with a tenth (11%) saying they
would be very upset. Just over half (56%) said they would not be upset at all.

The percentage of Labour
parents who would be upset by a Conservative son or daughter-in-law has risen
six percentage points since January when 28% told YouGov they would be upset in
the same situation.
This compares to 13% of Conservatives who say
they would be upset to some extent if their child tied the knot with a Labour supporter, with 2% of Conservative parents saying
such a marriage would leave them very upset.
There are similar divisions when it comes to
Brexit. Nearly forty percent (39%) of parents who voted Remain in 2016 said
they would be upset to some extent if their child married someone who had opted
to leave the European Union with just under half (47%) saying it wouldn’t upset
them.
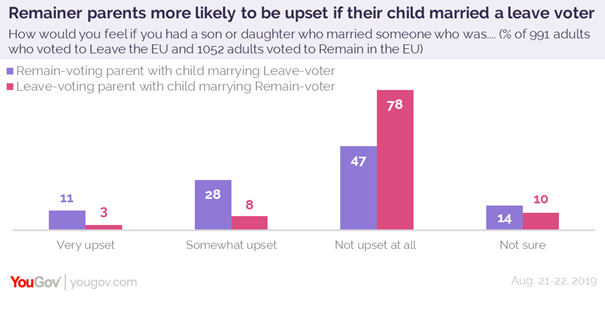 On the flip-side, just over one-in-ten parents
(11%) who backed the Leave campaign said they would be upset if their child
went on to marry a Remainer, with the majority (78%)
saying it wouldn’t upset them.
On the flip-side, just over one-in-ten parents
(11%) who backed the Leave campaign said they would be upset if their child
went on to marry a Remainer, with the majority (78%)
saying it wouldn’t upset them.
(YouGov)
August 27, 2019
602-43-24: Country Profile/ United Kingdom

SUMMARY OF POLLS
ASIA
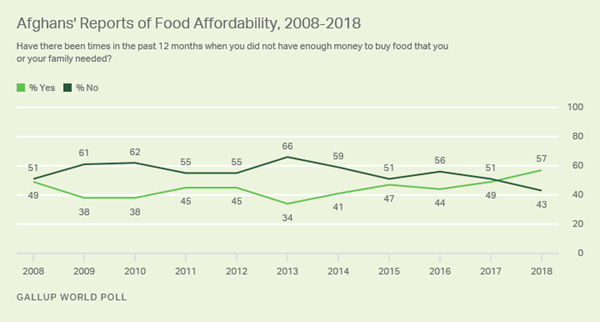
Inside Afghanistan: Record Numbers Struggle to
Afford Basics
Afghans not only are facing challenges in
regard to their safety and security as the country's presidential election
nears, but they also are struggling more than ever to afford the basics such as
food and shelter. Nearly six
in 10 Afghans say they have struggled to afford food at times in the past year.
With nearly two-thirds of the country's provinces suffering from major
droughts, food insecurity has soared. Meanwhile, half of Afghans (50%) say
there have been times in the past year when they have struggled to afford
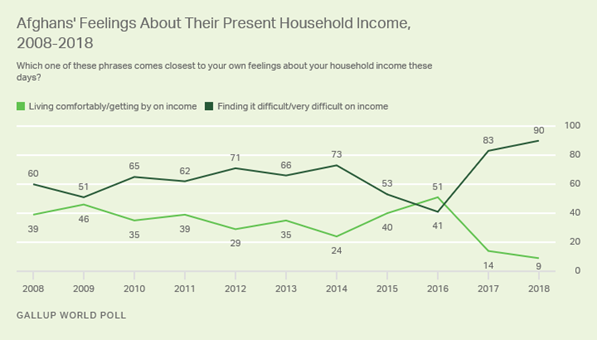
adequate shelter. No Afghans
say they are "living comfortably" and just 9% say they are
"getting by" on their present household income. (Gallup USA)
August
26, 2019
MENA
UAE
parents have high concerns over their child’s exposure to inappropriate online
content
More than three-quarters of parents in the UAE
(78%) are worried about their child’s exposure to inappropriate online content,
new YouGov research reveals. Furthermore, more than nine in ten (92%) agree
with the statement ‘Inappropriate online content can affect a child’s
mental health’. More
than nine in ten UAE parents (93%) said their children use the Internet.
Parents of older children, where the youngest was 10 or older, were much more
likely to say their children use the internet “very often” (79%). Exposure to
inappropriate imagery is the main concern of parents in the UAE in connection
to their child’s digital habits, with 71% stating this as a matter of concern.
This is followed by interaction with strangers (65%), online bullying (62%) and
exposure to dangerous games (61%). (YouGov MENA)
August
29, 2019
AFRICA
Health Insurance Coverage For
Nigerians Still Abysmal; An Urgent Call For New Strategy.
The Nigerian health system has had various
health care reforms aimed at tackling the public health challenges in the
country - the National Health Insurance Scheme (NHIS), the National Immunisation Coverage Scheme (NICS), the Midwives Service
Scheme (MSS) and the Nigerian Pay for Performance scheme. However, as many as 89 percent of the population pay for healthcare
services out-of-pocket. Only 9 percent claim they have some form of
health insurance, of which 71 percent indicated NHIS and 21 percent indicated
Private Health Management Organizations (HMOs) as their provider. Interestingly, a substantial proportion of Nigerians (78 percent)
who were not covered expressed willingness to pay a small amount of money
monthly/yearly to get enrolled for health coverage. (NOI Polls)
August
27, 2019
WEST EUROPE
Labour voters
more wary about politics of child’s spouse
New YouGov data reveals that Labour supporters are more likely to be upset if their
child married into the opposite end of the political spectrum than their Tory
counterparts.
A third (34%) of those who identify themselves
as Labour supporters say they would be upset to some
extent if their child married a Conservative, with a tenth (11%) saying they
would be very upset. Just over half (56%) said they would not be upset at all.
(YouGov)
August
27, 2019
Most
Brits expect recession, as consumer confidence dips to six-year low
The latest analysis from YouGov and the Centre
for Economics and Business Research shows that most Britons expect the country
to be in recession this time next year. Some 56% of respondents believe that
the economy will be in recession and a further 19% think it will be in a
depression. Just 24% of Britons think the economy will be growing, and only a tiny minority of 1% think it will be booming. (YouGov)
August
29, 2019
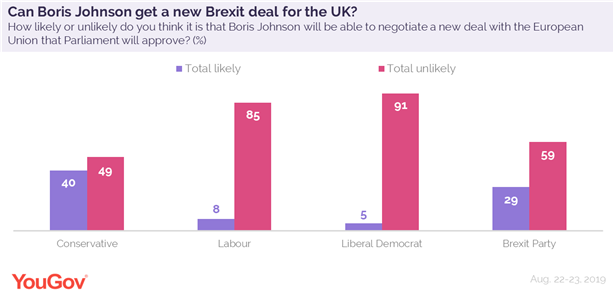
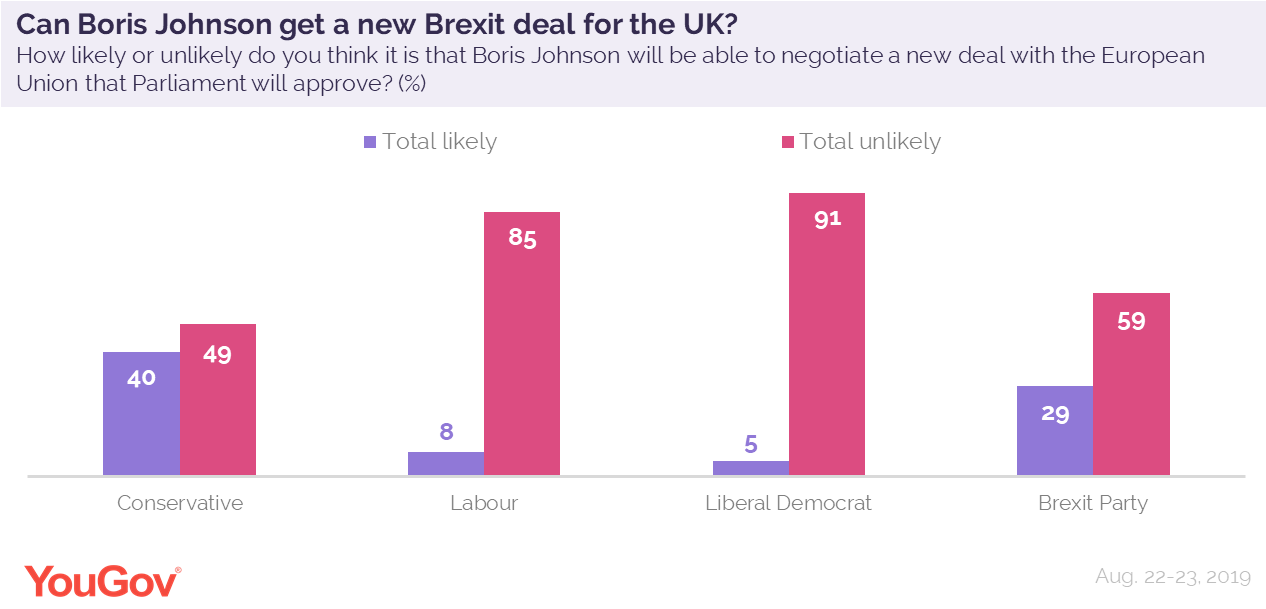
Half of Leave voters doubt Johnson can secure
new Brexit deal
Prime Minister Boris
Johnson has announced he is stepping up efforts to secure a new Brexit deal for
the UK. However, despite his announcement, the majority (67%) of Britons still
doubt that he will be able to net a new deal. In a rare demonstration of unity,
both sides of the Brexit spectrum almost agree, with 55% of Leave voters and
84% of Remain voters thinking a new deal is unlikely to some extent. Half of
Brexit Party supporters think it is at least fairly unlikely that the UK will
be able to get a new deal. (YouGov)
August 30, 2019
Few
believe the Government's explanation of why Parliament is to be suspended
A new Ipsos MORI online poll of adults aged 18-75 across Great
Britain shows that seven in ten (70%) think the main reason the government has
proposed parliament does not sit between 10 September and 14 October is to
limit MPs’ opportunity to stop a “no-deal” Brexit – just 13% say it’s to plan for a Queen’s speech
to deal with issues like the NHS and crime – the reason stated by the
government. When it comes to the move, more believe the government was wrong to
do this (46%) than right (30%) – although a majority of Leave voters (58%)
think the government was right to take this action (20% say it was wrong) while
three quarters (74%) of Remain voters think it was wrong (11% say it was
right). (Ipsos MORI)
30 August 2019
Brits
oppose Parliament suspension by 47% to 27%
The Queen has
approved Boris Johnson’s request to prorogue (effectively suspend) parliament
for a month, but snap YouGov polling reveals that Britons see the move as
unacceptable. Nearly half (47%) of British adults think it’s
unacceptable to suspend Parliament. Just 27% say it is acceptable, and 26% are
unsure. Opinion was split, as ever, between the main political parties. The
majority (68%) of Labour voters say the suspension of
Parliament is unacceptable, while the majority (52%) of Conservative voters who
say the shutdown is acceptable. (YouGov)
August 28, 2019
NORTH
AMERICA
5 facts
about the abortion debate in America
About six-in-ten U.S.
adults (61%) say that abortion should be legal in all or most
cases, compared with 38% who said it should be illegal all or most of the
time. Democrats are much more likely than Republicans and GOP leaners to
support legal abortion in all or most cases (82% vs. 36%). Protestants (77%)
say abortion should be illegal in all or most cases, while an
even larger share of religiously unaffiliated Americans (83%) take the
opposing view. When it comes to the Supreme Court’s 1973 landmark abortion
ruling, seven-in-ten Americans (70%) say Roe v. Wade should not be
completely overturned. In a December 2017 survey, roughly half of Americans
(48%) said having an abortion is morally wrong, while 20% said they think it is
morally acceptable and 31% said it is not a moral issue. About three-quarters
Americans say abortion will either be legal with no restrictions (22%) or legal
with some restrictions (55%). (PEW)
August 30, 2019
U.S.
concern about climate change is rising, but mainly among Democrats
The share of
Americans calling global climate change a major threat to the well-being of the United States has grown
from 40% in 2013 to 57% this year, Pew Research Center surveys have shown. But
the rise in concern has largely come from Democrats. Opinions among Republicans
on this issue remain largely unchanged. Among Democrats and Democratic-leaning
independents overall, 84% say climate change is a major threat to the country’s
well-being as of July 2019, up from 58% in a March 2013 survey. Views among
Republicans and Republican leaners have stayed about
the same (27% in 2019 vs. 22% in 2013). (PEW)
August 28, 2019
Most
Americans say science has brought benefits to society and expect more to come
About seven-in-ten
U.S. adults (73%) say science has had a positive effect on society, just 3% say
it has had a negative effect and 23% say it has yielded an equal mix of positive
and negative effects. When people who said science has had a mostly positive
effect were asked to elaborate on how science has benefited society, 56%
mentioned advancements in medical science – such as “disease eradication,”
“medical devices and new medications” and “cancer research.” (PEW)
August 27, 2019
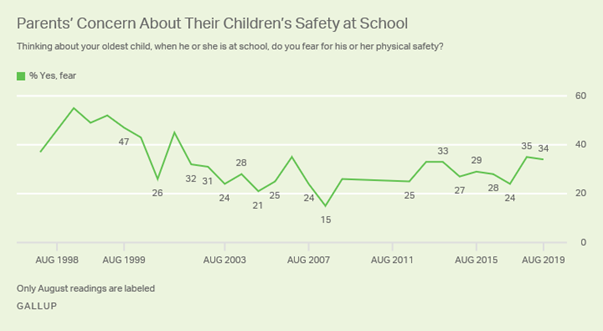
Parents'
Concern About School Safety Remains Elevated
As summer winds down
and children from kindergarten through high school head back to school, 34% of
parents remain fearful for their safety. At the same time, fewer (12%) report
that their school-aged children have expressed concern about feeling unsafe at
school. The current level of parental worry is similar to last August's 35%
reading, which was taken about six months after 17 students and staff members
were killed at Marjory Stoneman Douglas High School
in Parkland, Florida. It is also on par with the 33% of parents who were
concerned about their children's safety at school in August 2013,
roughly eight months after 26 students and staff members were killed at Sandy
Hook Elementary School in Newtown, Connecticut. (Gallup USA)
August 27, 2019
As Labor
Day Turns 125, Union Approval Near 50-Year High
Sixty-four percent of
Americans approve of labor unions, surpassing 60% for the third consecutive
year and up 16 percentage points from its 2009 low point. Union approval
averaged 68% between Gallup's initial measurement in 1936 and 1967, and
consistently exceeded 60% during that time. Since 1967, approval has been 10
points lower on average, and has only occasionally surpassed 60%. The current
64% reading is one of the highest union approval ratings Gallup has recorded
over the past 50 years, topped only in March 1999 (66%), August 1999 (65%) and
August 2003 (65%) surveys. (Gallup USA)
August 28, 2019
Americans'
Satisfaction With U.S. Education at 15-Year High
Gallup's annual
update of how Americans feel about the quality of primary and secondary
education in the U.S. finds the public relatively upbeat this year. For the
first time since 2004, a slim majority of U.S. adults, 51%, are satisfied with
the overall quality of education that students in kindergarten through grade 12
receive. This is up from 43% in 2018 and an average 45% since 2005. Today's increase to 51% is not clear, but it could
reflect Americans' generally positive outlook toward the economy, combined with
a lack of any major newsmaking debates on education.
(Gallup USA)
August 29, 2019
Most
Cannabis Consumers Use on a Weekly Basis or More
Most people who have
used cannabis in the past year do so once a week or more, according to a new Ipsos poll. This poll, among Canadians and Americans in
California, Nevada, Colorado, Oregon, Washington, and Massachusetts aged 21 and
over who report having used cannabis in the past 12 months, also finds that
most users also consumed alcohol during the same period (84%), while far fewer
report tobacco use, about half (52%), and even fewer used non-THC CBD products
(41%). Most people who use marijuana do so at least once a week (61%). Far
fewer consume several times a month (12%), once a month (8%), several times a
year (13%), or once a month or less often (6%). (Ipsos)
28 August 2019
AUSTRALIA
Ride-sharing
app Uber overtakes taxis as preferred private
transport service
Over the past three
years, Uber has experienced a dramatic rise in
popularity. The proportion of Australians (aged 14+) utilising
the service in an average three-month period has increased from 6.6% (1.3
million) of the population, to 22.9% (4.7 million), an increase of 16.3% points
(+ 3.4 million). Although Uber is now the preferred
service, the proportion of Australians using taxis has remained relatively
steady in recent years, dropping only slightly from 24.4% (4.8 million) to 21.8%
(4.5 million). This is the first data to reveal that taxis are no
longer the preferred private transport service of Australians. (Roy Morgan)
August 26 2019
Rising
numbers of Australians looking at Electric and Hybrid vehicles for their next
set of wheels
New data from Roy
Morgan shows that 1,383,000 Australians (aged 14+) are looking to drive a
hybrid vehicle, and 537,000 Australians are intending on driving an electric
vehicle, as their next car – either new or used. Both figures represent an
increase in the intentions of car drivers from a year ago. The number of
Australians looking to drive a hybrid car as their next vehicle increased
341,000 since June 2018. The number of consumers intending to drive an electric
vehicle has increased 125,000 since a year ago. The rise in popularity of
environmentally friendly vehicles has significantly increased the number of
consumers looking to drive hybrid and electric vehicles for their next car.
(Roy Morgan)
August 28 2019
Toyota
and Mazda drivers most brand loyal; Have the luxury
brands lost their lustre?
New data from Roy
Morgan reveals that of Australians (aged 14+) looking to purchase a new car in
the next four years, six-in-ten of current Toyota and Mazda drivers are
intending to purchase the same brand, which are the highest loyalty ratings of
any manufacturer. Toyota and Mazda’s loyalty ratings are followed by Subaru,
Mercedes-Benz, Volkswagen, BMW, Hyundai, Honda, Lexus, Audi, Mitsubishi,
Nissan, Ford and Holden. Eight of the ten non-luxury manufacturers increased
their loyalty rating from three years ago. The largest improvement was by
Mitsubishi, climbing from 28.4% in 2016, to 41.8% this year. (Roy Morgan)
August 26 2019
MULTICOUNTRY
STUDIES
Britons
make worst tourists, say Britons (and Spaniards and
Germans)
An international YouGov study shows Britons are
the most likely among 26 countries to take a negative view of their own
tourists. More than half of us (57%) hold an unfavourable
opinion of British tourists, and just 29% take a positive view. The next
comparable country is Germany where the 43% who think Germans behave badly on
holiday is largely matched by the 40% who think their brethren give their
country a good name. These figures are a far cry from those from the
Philippines, where a whopping 85% hold a favourable
view of Filipinos vacationing abroad and only 11% feel the opposite way.
(YouGov)
August
30, 2019
Brazilians Least Satisfied in Amazon With Environment
Brazilians' satisfaction with efforts to
preserve the environment dropped to a new low of 30% in 2018, long before they
saw massive expanses of the Amazon rainforest consumed by flame and
deforestation this year. This
is also the lowest for any country that is home to the Amazon. Satisfaction
with efforts rises to a majority in only two countries -- Ecuador and Bolivia
-- although satisfaction there has been trending downward in the past several
years. (Gallup USA)
August
30, 2019
India
ranks 9th on Happiness among 28 global markets: Ipsos
Global Happiness Survey
According to a new global survey by Ipsos in India has ranked 9th in the pecking order on
Happiness, among 28 nations polled. Interestingly, markets with the highest
prevalence of happiness are largely the developed nations, known for their
citizen-centricity ; Australia and Canada tied at the top spot (at 86%)
have emerged as the happiest nations of the world, followed by China (83%),
Great Britain (82%), France (80%), US (79%), Saudi Arabia (78%)
and Germany (78%)– these are the eight markets preceding India – and the
survey shows that India is a notch below them (at 77%) Argentina (34%),
Spain (46%) and Russia (47%), emerged at the bottom of the heap, among the 28
markets. (Ipsos)
30
August 2019
The
biggest beauty influencer isn’t who you think it is
Mothers, as well as friends, sisters, and other
family members, wield the most influence on women’s beauty routines, according
to a new Ipsos survey of 19,029 adults from 27
countries. Nearly half of women surveyed said their mother (49%), friends
(48%), and sisters or other family (45%) are somewhat or very influential. This
compares with only one in three who said that magazines and print media, online
videos, and Instagram influenced their routines. In
the U.S., the results were even more pronounced. Women were twice as likely to
say that their mother and friends influence their beauty routine compared to Instagram. (Ipsos)
26
August 2019
ASIA
602-43-01/Poll
Inside Afghanistan: Record Numbers Struggle to
Afford Basics
STORY
HIGHLIGHTS
·
57% of
Afghans report having struggled to afford food in the past year
·
In some
regions, two in three have struggled to afford food
·
90% of
Afghans report that it's difficult to get by on household income
WASHINGTON,
D.C. -- Afghans not only are facing challenges in regard to their safety
and security as the country's presidential election
nears, but they also are struggling more than ever to afford the basics such as
food and shelter.
Gallup
surveys in Afghanistan over the past decade highlight the great need for action
from incoming leadership.
Quick
Summary: Severe drought conditions over the past
several years have set back agriculture in Afghanistan, affecting the country's
economy as well as residents' food security. Afghanistan's GDP is still on the
positive side of the ledger, but much larger growth is needed to help the more
than half of Afghans who are living below the poverty line.
According
to World Bank Afghanistan Country Director Henry Kerali,
"Afghanistan faces challenges of insecurity, election-related political
uncertainty, potential declines in international security support, in addition
to the drought in 2018. Any one of these shocks would normally generate strong
headwinds to growth. Afghanistan has faced all of these concurrently."
Afghans
Struggling to Afford Food Hits New High: While
large swaths of Afghanistan's population have struggled to afford food over the
past decade, the percentage crossed the majority threshold for the first time
in 2018. Nearly six in 10 Afghans say they have struggled to afford food at
times in the past year.
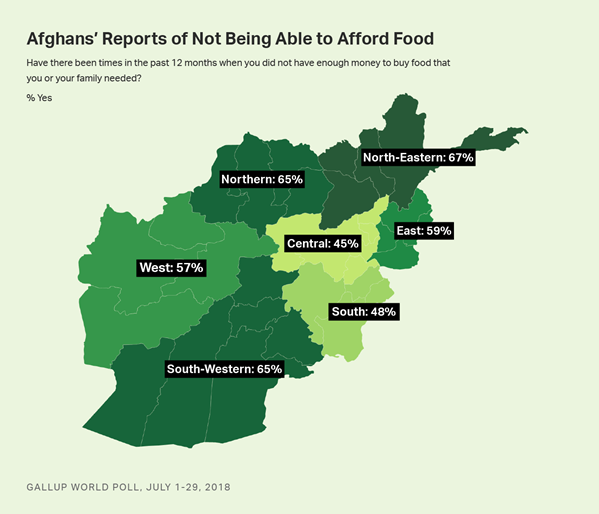
With
nearly two-thirds of the country's provinces suffering from major droughts,
food insecurity has soared. Inability to afford food is particularly acute in
the Northern, North-Eastern and South-Western regions, where about two in three
residents report having had difficulty affording food in the past year. These regions
include the provinces of Balkh, Faryab, Jowzjan, Kunduz, Takhar, Helmand, Uruzgan and Nimroz, which are among the provinces that have been hit
hardest by droughts.
Meanwhile,
half of Afghans (50%) say there have been times in the past year when they have
struggled to afford adequate shelter.
Fewer
Than One in 10 Afghans "Getting by" on Income: No
Afghans say they are "living comfortably" and just 9% say they are
"getting by" on their present household income. The
vast majority of Afghans say they are "finding it difficult" (55%) or
"finding it very difficult" (35%) to get by on their household
income. The combined 90% of Afghans reporting such financial hardship is
the highest on record for Afghanistan -- and was the highest in the world last year.
Implications: If
the scheduled presidential election actually takes place in September, the next
leader of Afghanistan has an uphill battle ahead of him in making the economy
work for the country's residents, who struggle to make ends meet more than any
other population in the world. Though Afghanistan's economy is showing some
growth, much more growth is needed to address the dire straits residents report
being in.
The
incoming president must also take the reins of regional negotiations over water
conflicts with neighboring countries, as the droughts the country has endured
have significantly affected food production and affordability. The big question
that remains is whether the new president will be taken seriously by
neighboring countries and water control stakeholders who have largely left
Afghanistan out of diplomatic talks on the issue.
(Gallup
USA)
August
26, 2019
Source: https://news.gallup.com/poll/265832/inside-afghanistan-record-numbers-struggle-afford-basics.aspx
MENA
602-43-02/Poll
UAE Parents Have High Concerns over Their
Child’s Exposure To Inappropriate Online Content
Although
parents of 10+ year olds have high concerns over their children’s internet
usage, they have less control in place over their online activities
More
than three-quarters of parents in the UAE (78%) are worried about their child’s
exposure to inappropriate online content, new YouGov research reveals.
Furthermore, more than nine in ten (92%) agree with the statement ‘Inappropriate
online content can affect a child’s mental health’.
YouGov’s new
research looks into parents’ concerns over their children’s digital habits and
reveals steps taken by them to monitor their activities. At present, more than
nine in ten UAE parents (93%) said their children use the Internet. Not
surprisingly, parents of older children, where the youngest was 10 or older,
were much more likely to say their children use the internet “very often”
(79%); this compares to only 39% amongst parents with children of 5 or under.
Although consumption is higher among families with children 10+, their parents
are less likely to check their online history very often (30%) as compared to
parents of children 5 and under, of whom half (54%) said they check their
child’s online history very often.
Exposure
to inappropriate imagery is the main concern of parents in the UAE in
connection to their child’s digital habits, with 71% stating this as a matter
of concern. This is followed by interaction with strangers (65%), online
bullying (62%) and exposure to dangerous games (61%). Most of these concerns
are prominent for parents whose children are more than 5 years old, especially
those with children over 10. We see a higher concern with online bullying among
parents whose youngest children are aged between 6 and 10, with seven in ten
(70%) of these parents saying this is concerning to them. On the other hand,
interaction with strangers (75%), illegal downloading (60%) and risk to
reputation on account of content posted by their child (43%) are more worrisome
to parents of older children as compared to their younger counterparts.
In order
to deal with these concerns, parents take certain steps to monitor their
child’s online habits. More than half (53%) restrict their child’s internet
access time and slightly lower than that (47%) try gaining an insight into
their child’s online interests by speaking to them regularly. However, there
are some parents (18%) who do not take any steps in this regard.

YouGov
research shows that even though parents of 10+ year olds have high concerns
over their children’s internet consumption, they seem to have less control in
place over what they are doing online. From the list of options to monitor
children’s internet activities, these parents are less likely than parents of
younger children to take almost all these steps in order to keep a check. This
is especially true for measures such as ‘installing parental control software’
and ‘denying access to personal cell phones’, where the figures are 17% and
20%, respectively. On the contrary, even though internet usage is lowest among
children who are 5 and under, their parents seem to have more control and are
more likely to take actions in order to check their concerns.
(YouGov
MENA)
August
29, 2019
Source: https://mena.yougov.com/en/news/2019/08/29/uae-parents-have-high-concerns-over-their-childs-e/
AFRICA
602-43-03/Poll
Health Insurance Coverage for Nigerians Still
Abysmal; An Urgent Call For New Strategy.
The
Nigerian health system has been evolving over the years through various health
care reforms aimed at tackling the public health challenges in the country. For
instance, the National Health Insurance Scheme (NHIS), the National Immunisation Coverage Scheme (NICS), the Midwives Service
Scheme (MSS) and the Nigerian Pay for Performance scheme are some of the
reforms which should ordinarily address the health care challenges faced in the
country. The NHIS was launched in 2005 however, news
reports and statistics have shown that the scheme only covers less than 10
percent of Nigerians. This implies that most of the vulnerable population are left at the pity of health care services
which in most cases are not affordable.
Given
the above background, NOIPolls presents findings from
its previous poll on health insurance which was conducted in August 2017. The
poll gauged the perception of Nigerians regarding health insurance in the
country. Findings from the poll revealed that as many as 89 percent of the
population pay for healthcare services out-of-pocket. This finding does not in
any way coincide with the main purpose of the National Health Insurance Scheme
(NHIS) which is primarily securing universal health coverage and access to
adequate and affordable healthcare in order to improve the health status of
Nigerians. Further findings from the poll revealed that only 9 percent claimed
they have some form of health insurance, of which 71 percent indicated NHIS and
21 percent indicated Private Health Management Organizations (HMOs) as their
provider. Interestingly, a substantial proportion of
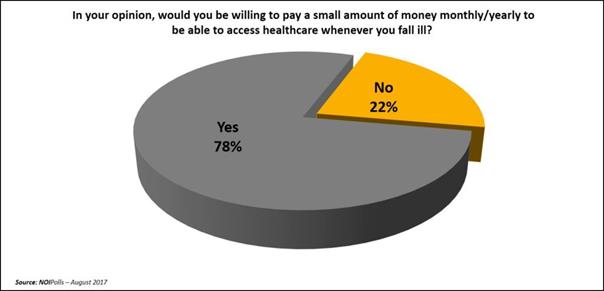
Nigerians (78 percent) who were not covered expressed willingness to pay a
small amount of money monthly/yearly to get enrolled for health coverage.
The
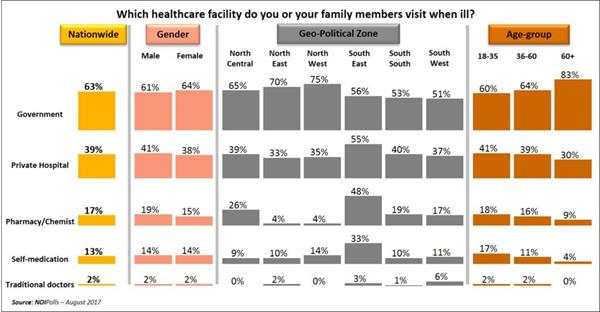
chart below showed that the most utilized healthcare facilities by Nigerians is
government owned hospitals (primary, secondary and tertiary health facilities)
as revealed by majority of Nigerians (63 percent) interviewed. This was
followed by respondents who visit private hospitals (39 percent) and
Pharmacy/Chemist stores (17 percent), and those who self-medicate (13 percent)
amongst others.
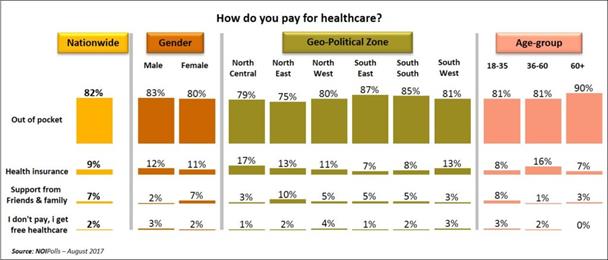
Subsequently,
when asked how they pay for healthcare services, most of the respondents (82
percent) reported that they pay “Out of pocket”, and this cuts across gender,
geo-political zones and age groups. Further analysis indicated that a total of
89 percent actually pays out of pocket, since 7 percent of respondents said
they received support from friends and family, which can also be categorised as out of pocket expenses. This was followed in
a far distance by only 9 percent of the respondents who claimed that they
access health care services using their health insurance scheme. This finding
clearly highlights the low penetration of health insurance among the populace,
which urgently needs to be bridged in order to achieve universal health
coverage.
Subsequently,
poll also ascertained the willingness of Nigerians who pay out of pocket to pay
a small amount of money monthly or yearly (premium) in order to access
healthcare services when they need it, especially in time of emergency. In
response, 78 percent of the respondents expressed their willingness to pay a
small amount to get enrolled into the health insurance scheme. Interestingly,
during the course of the poll, some respondents made on the spot inquiries on
how to enroll on a health insurance scheme. These findings clearly demonstrate
the critical need for sensitization and awareness campaigns to mobilize the
citizenry on the need and benefits of health insurance.
In
conclusion, the National Health Insurance Scheme was set up with the objective
of making health care accessible and affordable to many Nigerians, however, the
poll revealed that 89 percent of Nigerians do not have any form of health
insurance, thus they pay out of pocket to access healthcare services. Of this
proportion, 78 percent expressed their willingness to pay a small amount of
money to enable them access service whenever they fall ill. These findings
clearly highlight the low penetration of health insurance across the country
and calls for intensive sensitization and mass mobilisation
of the populace. Also, there is an urgent need to amend the NHIS Act and enact
laws to make the scheme compulsory for all Nigerians as this would ensure
proper monitoring, efficiency, proper utilization of the health facilities and
ultimately better health care delivery system in the country.
It is
heart-warming to note that at least 10 Nigerian States have signed the health
insurance laws[1] to
help in achieving equitable and sustainable health financing mechanism.
Functional State health insurance schemes will help increase the pool of
individuals with health insurance thereby driving down premiums. Finally, while
it is critical for government to re-evaluate its current budgetary allocation
to the health sector, it is also important for stakeholders to consider more
sustainable ways to finance the sector through health insurance, and to mobilise the public to increase the pool of funds available
for investment into the sector.
(NOI
Polls)
August
27, 2019
WEST EUROPE
602-43-04/Poll
Labour Voters
More Wary about Politics of Child’s Spouse
A third of Labour
voters say they would be upset if their child married a Conservative – twice as
many as in the reverse situation
Parents only want the best for their children,
especially when it comes to choosing a partner. And it turns out that politics
matters.
New YouGov data
reveals that Labour supporters are more likely to be
upset if their child married into the opposite end of the political spectrum
than their Tory counterparts.
A third (34%) of those who identify themselves
as Labour supporters say they would be upset to some
extent if their child married a Conservative, with a tenth (11%) saying they
would be very upset. Just over half (56%) said they would not be upset at all.
The percentage of Labour
parents who would be upset by a Conservative son or daughter-in-law has risen
six percentage points since January when 28% told YouGov they would be upset in
the same situation.
This compares to 13% of Conservatives who say
they would be upset to some extent if their child tied the knot with a Labour supporter, with 2% of Conservative parents saying
such a marriage would leave them very upset.
There are similar divisions when it comes to
Brexit. Nearly forty percent (39%) of parents who voted Remain in 2016 said
they would be upset to some extent if their child married someone who had opted
to leave the European Union with just under half (47%) saying it wouldn’t upset
them.

On the
flip-side, just over one-in-ten parents (11%) who backed the Leave campaign
said they would be upset if their child went on to marry a Remainer,
with the majority (78%) saying it wouldn’t upset them.
(YouGov)
August 27, 2019
602-43-05/Poll
Most
Brits Expect Recession, As Consumer Confidence Dips To Six-Year Low
·
Consumer
confidence hits a low of 104.0 in August, a level not seen since 2013
·
75% of
Britons believe UK will be in recession or depression within a year
·
63%
expect to see unemployment rise over the coming year
The latest analysis from YouGov and the Centre
for Economics and Business Research shows that most Britons expect the country
to be in recession this time next year. Some 56% of respondents believe that
the economy will be in recession and a further 19% think it will be in a
depression.
Just 24% of Britons think the economy will be
growing, and only a tiny minority of 1% think it will
be booming.
The latest data also reveals that consumer
confidence has continued its long-term downward slide by dropping to 104.0.
While any score over 100 means more consumers are confident than unconfident,
the index is still notably below where it was before the UK voted to leave the
European Union in 2016. In fact, you have to trace the history of the YouGov/Cebr tracker back to May
2013 to find lower confidence, when we saw a figure of 102.9.
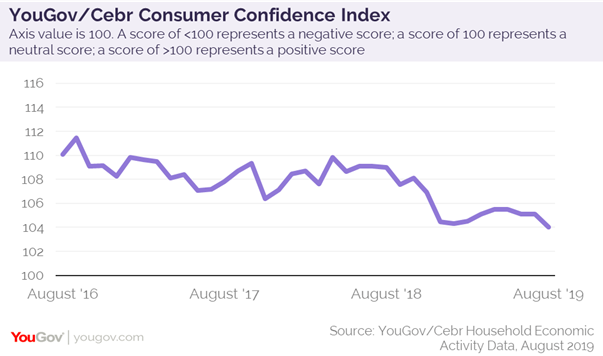
YouGov collects consumer confidence data every
day, conducting over 6,000 interviews a month. Respondents are asked about
household finances, property prices, job security and business activity, both
over the past 30 days and looking ahead to the next 12 months.
While five of the eight metrics which make up
the overall figure rose over the last month, significant drops in three areas
were enough to weigh it down.
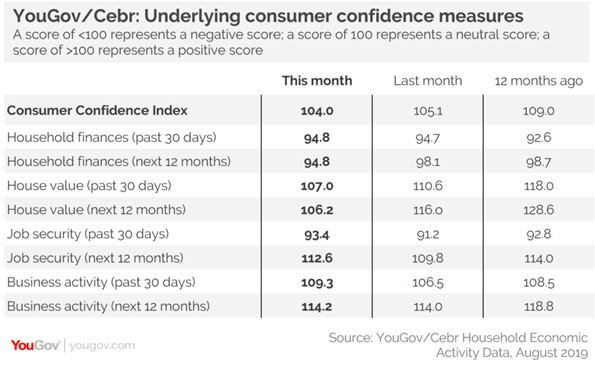
Particularly large falls were seen in house
values. Estimates over the last month slid from 110.6 to 107.0, which is
considerably lower than in August last year when the figure sat at 118.0.
Expectations for the coming year also fell significantly from 116.0 in July to
106.2 in August.
The outlook on household finances over the
coming year also took a large dip, falling from 98.1 to 94.8 - well into
negative territory.
Counter to this, however, job security figures
rose. Britons reported that they felt slightly safer in their job than last
month. Security over the last 30 days rose from 91.2 to 93.4 and the outlook
for the coming year was up from 109.8 to 112.6.
Despite the climbs showing that Britons don’t
expect to lose their own job, our survey also showed that 16% of respondents
believe unemployment will increase "a lot" over the coming year. A
total of 63% expect to see an increase to some extent.
Oliver Rowe, Director of Reputation Research at
YouGov, said:
“Britons have grown progressively more cautious
about the future over the last few years, and we see growing concern about
house prices and the wider economy.”
Nina Skero, Director
at the Centre for Economics and Business Research, said:
“Economic commentators have been warning of a
heightened recession risk, and our latest research shows that their expectations
are matched by those of the general public. These fears have led to a gloomier
housing market outlook, suggesting transaction numbers and prices are about to
come under even greater pressure.”
(YouGov)
August 29, 2019
602-43-06/Poll
Half
of Leave Voters Doubt Johnson Can Secure New Brexit Deal
Leave and Remain voters can agree on one thing
at least – Boris Johnson is unlikely to get a new Brexit deal from the EU
Prime Minister Boris Johnson has announced he
is stepping up efforts to secure a new Brexit deal for the UK. He promised that
the UK’s negotiators will meet with their EU counterparts twice a week in the
lead up to the Brexit deadline at the end of October.
However, despite his announcement, the majority
(67%) of Britons still doubt that he will be able to net a new deal.

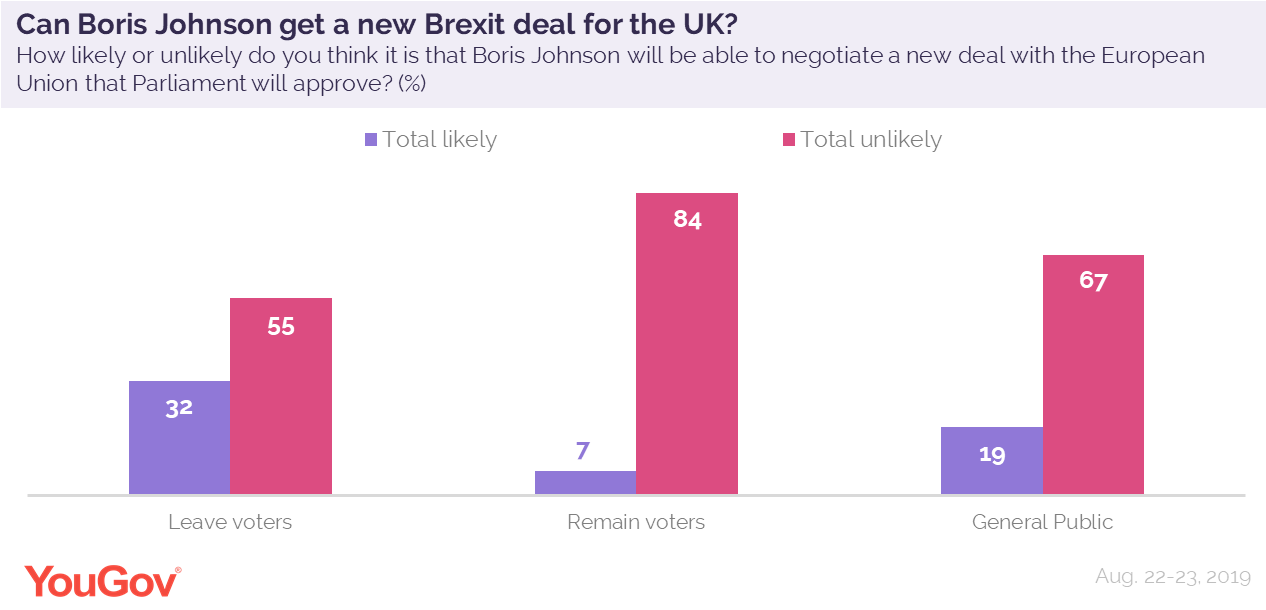
In a rare demonstration of unity, both sides of
the Brexit spectrum almost agree, with 55% of Leave voters and 84% of Remain
voters thinking a new deal is unlikely to some extent. Half of Brexit Party
supporters think it is at least fairly unlikely that the UK will be able to get
a new deal.
Doubt was shared across party lines, with 85%
of Labour supporters having little faith in the Prime
Minister finding enough common ground with the EU to forge a deal, but with
Conservatives divided over their faith in a new deal.
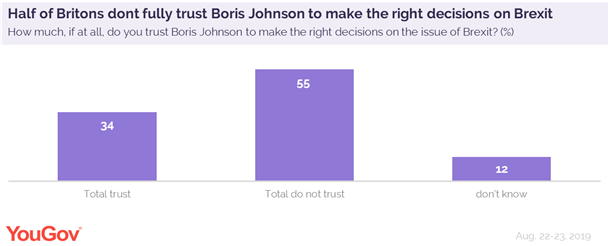
Leave voters do trust Johnson to make the right
choices when it comes to Brexit, however, with 60% trusting the Prime Minister
at least a fair amount. Remain voters do not agree - 64% say they do not trust
the Prime Minister at all to make the right calls.
(YouGov)
August 30, 2019
602-43-07/Poll
Few
Believe the Government's Explanation of Why Parliament Is To Be Suspended
A new Ipsos MORI
online poll of adults aged 18-75 across Great Britain shows that seven in ten
(70%) think the main reason the government has proposed parliament does not sit
between 10 September and 14 October is to limit MPs’ opportunity to stop a
“no-deal” Brexit.
·
Few
believe the Government's explanation of why Parliament is to be suspended
·
More
think suspension of parliament wrong than right
·
More
opposed to No Deal Brexit than in support of it
A new Ipsos MORI
online poll of adults aged 18-75 across Great Britain shows that seven in ten
(70%) think the main reason the government has proposed parliament does not sit
between 10 September and 14 October is to limit MPs’ opportunity to stop a
“no-deal” Brexit – just 13% say it’s to plan for a Queen’s speech to deal with
issues like the NHS and crime – the reason stated by the government. When it
comes to the move, more believe the government was wrong to do this (46%) than
right (30%) – although a majority of Leave voters (58%) think the government
was right to take this action (20% say it was wrong) while three quarters (74%)
of Remain voters think it was wrong (11% say it was right).
Despite this course of action, there is no clear alternative in the public’s
eyes to Boris Johnson when it comes to Brexit. A third (34%) say they’re
satisfied with how the Prime Minister is handling Brexit (49% are dissatisfied)
while 15% say the same for Jeremy Corbyn (70%
dissatisfied) and 19% for Liberal Democrat leader Jo Swinson
(48% are dissatisfied). Boris Johnson however appears to be playing well to
Leave voters – nearly two thirds (63%) are satisfied with how he’s handling
Brexit while 22% are dissatisfied – as well as Conservative voters (67% are
satisfied with him vs. 22% dissatisfied).
When it comes to a no deal Brexit more Britons are opposed to the idea than in
support of it with 46% opposed and 37% in support of it – three quarters (73%)
of Leave voters however say they support no deal while three quarters (76%) of
Remain voters are against it. When it comes to leaving but
only with a deal slightly more are in support of this (37%) than opposed (34%).
Both Leave and Remain voters are spilt when it comes to Britain leaving the EU
but only with a deal 36% of Leave voters support this while 36% oppose it. Four
in ten (41%) Remain voters support leaving but only with a deal while 40%
oppose it.
When it comes to holding a general election immediately more support this (43%)
than oppose (32%) but it’s Remain voters who tend to be more in support of
holding an election (62%) while a majority of Leave voters are opposed to it
(51%). A majority of Conservative voters however are opposed to holding an
election (57%) while Labour voters are much more in
support of it (69%).
Roger Mortimore,
Director of Political Analysis at Ipsos MORI, said:
The majority of the public are unhappy with the
way the Prime Minister is handling the Brexit issue and oppose his decision to
shut down Parliament for a month – but it is playing well with the group that
it is intended to please, Conservatives and Leave voters. What is more, the
other party leaders do not seem to be well enough regarded to unite opponents
of the PM behind them.
(Ipsos MORI)
30 August 2019
602-43-08/Poll
Brits Oppose
Parliament Suspension By 47% to 27%
But Remain and Leave voters butt heads once
again over Boris Johnson’s move
The Queen has approved Boris Johnson’s request
to prorogue (effectively suspend) parliament for a month, but snap YouGov
polling reveals that Britons see the move as unacceptable.
Parliament had already scheduled a period of
suspension between September 12th and October 9th to allow for the various
party conferences, but this will now be extended: Parliament will now not sit
between the middle of September and the middle of October, a total of 23
working days, in the run up to UK’s exit from the European Union on the 31st of
October. This could limit political manoeuvres on the
Remain side designed to stop Boris Johnson’s plans.
YouGov polling
conducted today reveals that nearly half (47%) of British adults think it’s
unacceptable to suspend Parliament. Just 27% say it is acceptable, and 26% are
unsure.
Opinion was split, as ever, between the main
political parties. The majority (68%) of Labour
voters say the suspension of Parliament is unacceptable, while the majority
(52%) of Conservative voters who say the shutdown is acceptable.
The same pattern is shown between the Leave and
Remain camps. Half of Leave (51%) voters support the Government plans to suspend Parliament, whereas 73% of Remain voters say the
move is unacceptable.
(YouGov)
August 28, 2019
NORTH AMERICA
602-43-09/Poll
5
Facts about the Abortion Debate In
America
More than four decades after the U.S. Supreme
Court’s Roe v. Wade decision,
opponents and supporters of abortion rights are still battling over the
issue in court, at the ballot boxand in state legislatures. A recently enacted Alabama law has been
described as the nation’s most restrictive, and several other states also have passed new restrictions on
abortion with an eye toward giving the Supreme Court a chance to overturn its decision in Roe.
As the debate over abortion continues, here are
five key facts about Americans’ views on the topic, based on recent Pew
Research Center polling:
1About six-in-ten U.S. adults (61%) said in
a 2019 survey that abortion should be legal in all or
most cases, compared with 38% who said it should be
illegal all or most of the time. On both sides of the issue, Americans are more
likely than not to leave room for exceptions, with more saying abortion should
be legal or illegal most of the time, rather than always.
Public support for legal abortion remains as high as it has been in two decades of polling, and there is virtually no difference between
the views of men and women.
2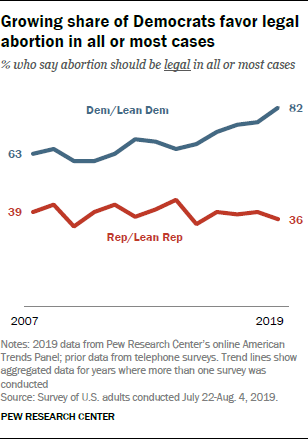
There is a substantial – and growing – partisan divide on abortion, with Democrats and those who lean toward the
Democratic Party much more likely than Republicans and GOP leaners to support
legal abortion in all or most cases (82% vs. 36%). There also are large gaps
based on religious affiliation. For example, three-quarters of white
evangelical Protestants (77%) say abortion should be illegal in all or most
cases, while an even larger share of religiously unaffiliated
Americans (83%) take the opposing view, saying that abortion should be
mostly or entirely legal.
3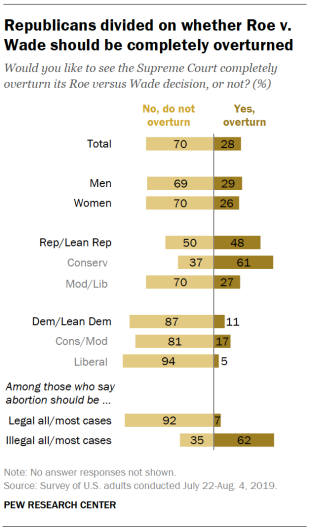
When it comes to the Supreme Court’s 1973
landmark abortion ruling, seven-in-ten Americans (70%) in the 2019 survey said Roe v. Wade should not be
completely overturned. Again,
Democrats are far more likely than Republicans to hold this view; Republicans
are roughly evenly divided, with 50% saying they do not want to see Roe v. Wade
completely overturned and 48% saying they would like the decision tossed out.
Overall, similar majorities of women (70%) and men (69%) do not want Roe v.
Wade overturned.
4In a December 2017 survey, roughly half of
Americans (48%) said having an abortion is morally wrong, while 20% said they think it is morally
acceptable and 31% said it is not a moral issue. These views also differed by
religious affiliation: About three-quarters of evangelical Protestants (77%)
said having an abortion is morally wrong, but just 24% of religiously
unaffiliated people agreed.
5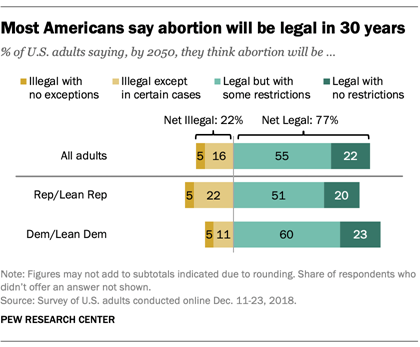
The vast majority of Americans expect abortion
to remain at least mostly legal in the U.S. A survey conducted in December 2018 asked Americans what they think the
status of abortion laws in the country will be in 2050; about three-quarters
said it will either be legal with no restrictions (22%) or legal with some
restrictions (55%). Far fewer said it will be illegal except in certain cases
(16%) or illegal with no exceptions (5%).
(PEW)
August 30, 2019
602-43-10/Poll
U.S. Concern
about Climate Change Is Rising, But Mainly Among Democrats
The share of Americans calling global climate
change a major threat to
the well-being of the United States has grown from 40% in 2013 to 57% this
year, Pew Research Center surveys have shown. But the rise in concern has
largely come from Democrats. Opinions among Republicans on this issue remain
largely unchanged.
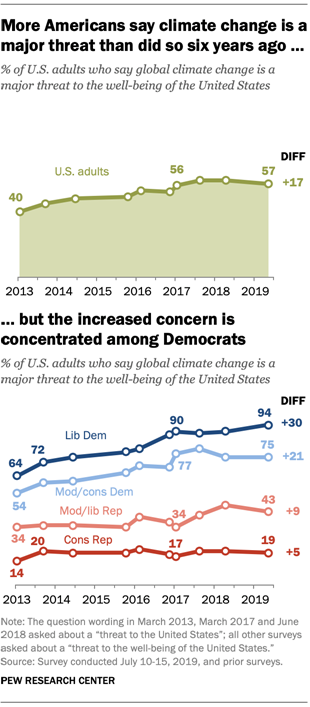
Among Democrats and Democratic-leaning
independents overall, 84% say climate change is a major threat to the country’s
well-being as of July 2019, up from 58% in a March 2013 survey. Views among
Republicans and Republican leaners have stayed about
the same (27% in 2019 vs. 22% in 2013).
Nearly all liberal Democrats (94%, including
independents who lean to the party) consider climate change a major threat to
the nation now, up 30 percentage points from 2013. Three-quarters of
moderate/conservative Democrats say the same, up from 54% in 2013.
By contrast, there has been no significant
change among either moderate or conservative Republicans on this issue. (While
the share of moderate/liberal Republicans who see climate change as a major
threat is up 9 percentage points since 2013, this change is not statistically
significant at the 95% confidence level.)
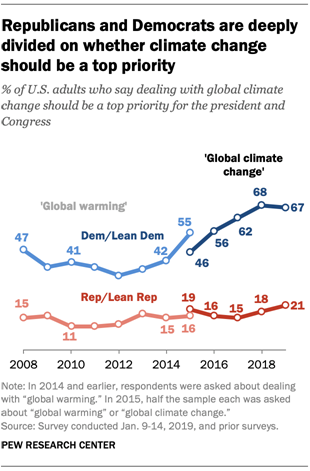
The partisan trend is similar on a related
question. More Americans said in January 2019 that dealing with global climate
change should be a top priority for Congress and the president (44%) than
did so in early 2015 (34%). But the increased interest in prioritizing climate
policy stems from Democrats, not Republicans.
Two-thirds of Democrats (67%), including 83% of
liberal Democrats, said this year that dealing with global climate change
should be a top priority for the president and Congress. This was up from 46%
of Democrats in 2015.
In contrast, about two-in-ten Republicans (21%)
said this year that climate change should be a top priority – a virtually
identical share as in 2015 (19%).
Climate change policy is among the issues taking center stage
for Democrats seeking their party’s nomination. A 2018 survey by
the Center found 82% of registered Democrats said the issue of the environment
would be very important in their vote, up from 69% just two years earlier. The
role of such issues in the general election remains unclear. The same 2018
survey found 38% of registered Republicans saying the environment would be very
important to their vote, roughly the same share as a decade earlier.
(PEW)
August 28, 2019
602-43-11/Poll
Most
Americans Say Science Has Brought Benefits to Society and Expect More to Come
While public trust in scientists and their
work can be mixed, a
strong majority of the American public thinks of science as having a positive
effect on society, and most expect continued benefits to accrue from science in
the years ahead.
About seven-in-ten U.S. adults (73%) say
science has had a positive effect on society, just 3% say it has had a negative
effect and 23% say it has yielded an equal mix of positive and negative
effects, according to a Pew Research Center survey.
White adults are more likely than black and
Hispanic adults to see the effects of science in positive terms. And people who
have higher levels of factual knowledge about science, based on an 11-item index, are especially likely to think science has
had a positive effect overall.
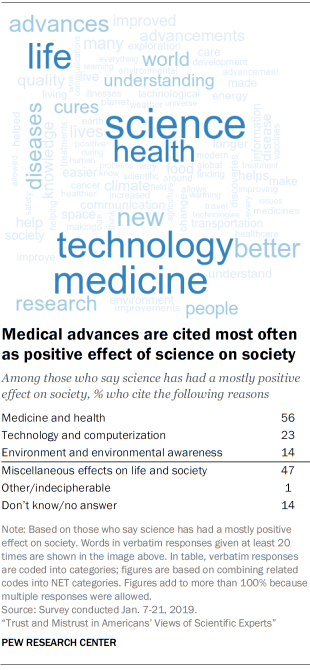
When people who said science has had a mostly
positive effect were asked to elaborate on how science has benefited society,
56% mentioned advancements in medical science – such as “disease eradication,”
“medical devices and new medications” and “cancer research.”
Some mentioned benefits from an aspect of
technology and computerization (23% of those asked), offering general
references to new or helpful technology and changes to communication. One
respondent put it this way: “Science has advanced our communication avenues
which opens the world to all.” Others highlighted benefits for the environment
(14% of those asked), with one respondent saying that science has “kept us
abreast of what to expect from climate change.” Still others (47% of those
asked) cited a miscellany of effects, ranging from improvements in food
production to developing a better understanding of our world.
Those who saw negative or mixed effects of
science on society were also asked their reasons why, and they cited a range of
reasons. About one-in-ten (11%) in this group mentioned concerns about
scientists and scientific theories. One said, “Scientific research has been
contaminated by big business paying to have findings skewed in their favor to
deceive the public.” Another replied, “Conflicting results reported on
breakthroughs, don’t know what is true. What is true today will change over
time.”

As Americans look ahead to the next 20 years, a
large majority of the public (82%) expects scientific developments to make
people’s lives better, while 11% think new developments will make no difference
and 6% expect such developments will make people’s lives worse. Large majorities
of white and Hispanic adults (84% and 83%, respectively) and somewhat fewer
black adults (74%) are optimistic that new scientific developments will improve
lives.
Here, too, medical advances prevail in the
public mind as a likely source for improvements ahead, with six-in-ten U.S.
adults (60%) referencing this topic when asked to think about developments in
science that will make people’s lives better.
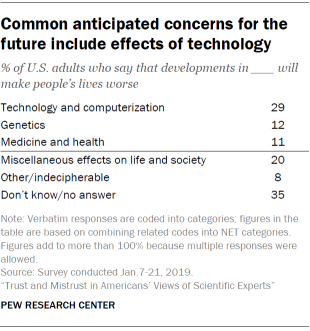
When asked to think about potential downsides
from science for people’s lives coming down the road, the most common concerns
referenced technology and computerization (29% of U.S. adults), such as
automation in the workforce; others cited genetics (12%), including concerns
about cloning and “designer babies,” and developments in medicine (11%).
Note: The quoted responses above are lightly
edited for spelling and punctuation. See topline for full question wording and the Methodology section of the main report for more
information on the index of science knowledge.
(PEW)
August 27, 2019
602-43-12/Poll
Parents'
Concern about School Safety Remains Elevated
STORY HIGHLIGHTS
·
Parental
fear same now as after Newtown and Parkland school shootings
·
12% of
parents say child has expressed worry about safety at school
WASHINGTON, D.C. -- As summer winds down and children
from kindergarten through high school head back to school, 34% of parents
remain fearful for their safety. At the same time, fewer (12%) report that
their school-aged children have expressed concern about feeling unsafe at
school.
The current level of parental worry is similar
to last August's 35% reading, which was taken about six months after 17
students and staff members were killed at Marjory Stoneman
Douglas High School in Parkland, Florida. It is also on par with the 33% of
parents who were concerned about their children's safety at
school in August 2013, roughly eight months after 26 students and
staff members were killed at Sandy Hook Elementary School in Newtown,
Connecticut.
The latest readings are from an Aug. 1-14
Gallup poll, with interviewing spanning two non-school-related mass shootings
in El Paso, Texas, and Dayton, Ohio, which together claimed the lives of 31
people in one weekend. Although Gallup's question about school safety does not
refer specifically to gun violence, parents' fear has spiked in the past after
high-profile mass shootings, indicating they do have these kinds of threats in
mind when answering the question.
The highest level of parental fear, 55%, was
recorded in April 1999, one day after 13 people were killed at Columbine High
School in Littleton, Colorado. By the time parents were sending their children
back to school that year, fear had dipped, but only slightly, to 47%, the highest August figure in Gallup's
trend. By August 2000, it had dropped to 26%.
Parental fear for their children's safety in
school fluctuated over the next two decades but rose in the immediate aftermath
of the school shootings at Santana High School in Santee, California,
in 2001 and at an Amish schoolhouse in Nickel Mines,
Pennsylvania, in 2006. The
lowest August reading is 15% in 2008.
This pattern of heightened levels of concern
after such an event occurs, followed by a gradual decline as it fades from
memory, is common in Gallup trends. Thus, it is not
clear if the stability between the 2018 and 2019 readings reflects sustained
concern from the Parkland shootings or renewed concern from the El Paso and
Dayton shootings.
Children's Fears About
School Safety Return to Lower Levels
While parents' fears about school safety remain
at the same level as last August after the Parkland, Florida, shootings,
children's fears appear to have lessened. One year ago, an August
record-high 20% of parents said their children expressed
concern or worryabout feeling
unsafe at school when they returned for the new school year. Yet now, 12% say
their children have indicated they are concerned about school safety this year.
The current figure is more in line with the historical trend and could be lower
because last year's reading came within six months of the Parkland shootings.
Children may not see as direct a connection to their own safety at school with
the El Paso and Dayton shootings.
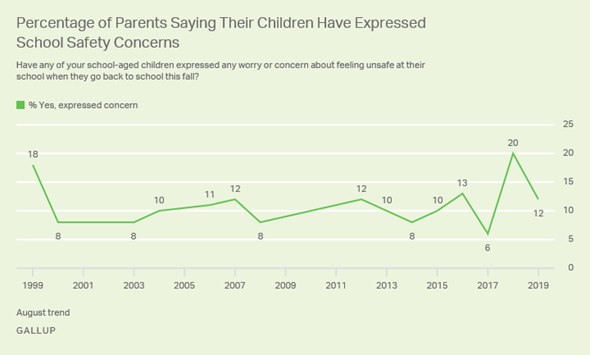
Throughout Gallup's 20-year trend, the
percentage of parents expressing concern about their children's safety has
always exceeded the percentage of parents reporting that their children have
expressed fear. It is unclear if this gap results from parents simply being
more fearful than children, parents being more aware of the risks to children's
safety, or children being reluctant to express their fears to their parents.
Bottom Line
As another school year begins, parents' latest
level of fear about school safety matches last year's heightened level. This
may reflect parents' reaction to the two mass shootings that occurred while the
poll was being fielded; or memories of the 2018 Parkland, Florida, shootings;
or this may be their new normal. Whatever the case, it is among the highest
back-to-school parental school-safety-fear readings Gallup has recorded.
Children's fears, which have consistently been
lower than those of their parents, have fallen back to a low level after
spiking last year. Many parents undoubtedly shield their children from
disturbing news events involving school shootings, which may account for
children's lower levels of fear. Yet, shielding children can go only so far. As
safety drills (such as lockdowns and shelter-in-place) have become commonplace
in U.S. schools today, children are regularly exposed to the possibility of
dangerous situations happening at their schools.
(Gallup USA)
August 27, 2019
602-43-13/Poll
As
Labor Day Turns 125, Union Approval Near 50-Year High
STORY HIGHLIGHTS
·
64% of
Americans approve of labor unions
·
Since
1970, higher only in 1999 (66%) and 2003 (65%)
·
Up 16
points from 2008, with party groups showing similar increases
WASHINGTON, D.C. -- Sixty-four percent of
Americans approve of labor unions, surpassing 60% for the third consecutive
year and up 16 percentage points from its 2009 low point. This comes 125 years
after President Grover Cleveland signed a law establishing the Labor Day
holiday after a period of labor unrest in the U.S.
Union approval averaged 68% between Gallup's
initial measurement in 1936 and 1967, and consistently exceeded 60% during that
time. Since 1967, approval has been 10 points lower on average, and has only
occasionally surpassed 60%. The current 64% reading is one of the highest union
approval ratings Gallup has recorded over the past 50 years, topped only in
March 1999 (66%), August 1999 (65%) and August 2003 (65%) surveys.
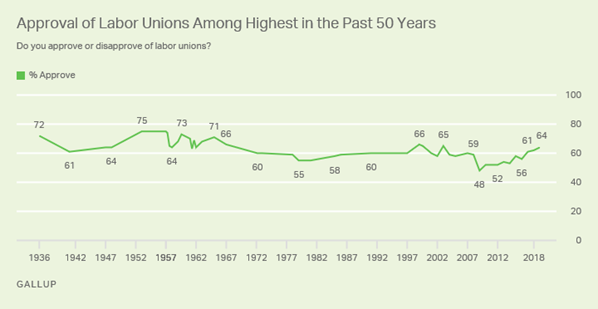
Higher public support for unions in the past
few years likely reflects the relatively good economic conditions in place,
particularly low unemployment. By contrast, the lowest union approval ratings
in Gallup history came from 2009 through 2012, years of high unemployment that
followed the Great Recession. Gallup also observed relatively low union
approval during the poor economic times in the late 1970s and early 1980s.
Democrats, independents and Republicans are all
more likely to view unions positively now than they were at the low point a
decade ago. Notably, since 2009, union approval has increased among each party
group by 16 or 17 points. Democrats (82%) remain far more likely than
Republicans (45%) to approve of unions.
Changes in Labor Union Approval by Party,
2009-2019
|
2009 |
2019 |
Change |
|
|
% |
% |
pct. pts. |
|
|
Democrats |
66 |
82 |
+16 |
|
Independents |
44 |
61 |
+17 |
|
Republicans |
29 |
45 |
+16 |
|
GALLUP |
|||
In addition to partisanship, union affiliation
is a significant driver of union approval. Specifically, 86% of U.S. adults
living in a household with a union member approve of unions, compared with 60%
of those in nonunion households.
According to the 2019 survey, 14% of Americans
reside in a union household, and 10% of working adults are personally members
of labor unions.
(Gallup USA)
August 28, 2019
602-43-14/Poll
Americans'
Satisfaction with U.S. Education at 15-Year High
STORY HIGHLIGHTS
·
51% of
U.S. adults are satisfied with quality of U.S. K-12 education
·
Current
satisfaction is highest since 2004
·
Most
parents remain satisfied with own children's education
WASHINGTON, D.C. -- Gallup's annual update of
how Americans feel about the quality of primary and secondary education in the
U.S. finds the public relatively upbeat this year. For the first time since
2004, a slim majority of U.S. adults, 51%, are satisfied with the overall
quality of education that students in kindergarten through grade 12 receive.
This is up from 43% in 2018 and an average 45% since 2005.
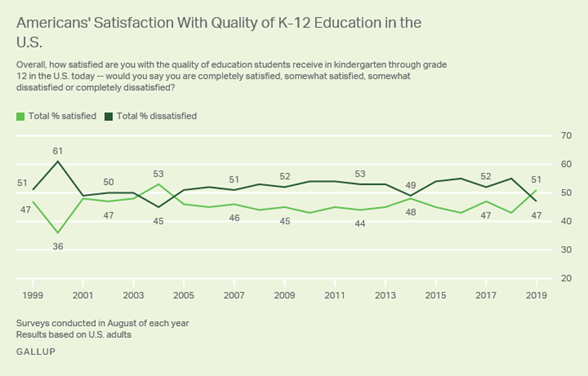
For most of Gallup's trend line on Americans'
views of K-12 education since 1999, satisfaction has ranged between 43% and
48%. One exception was a drop to 36% in 2000, likely reflecting the focus in
that year's presidential campaign on the need for education reform. The other
exception was a spike in satisfaction to 53% in 2004.
The reason for today's increase to 51% is not
clear, but it could reflect Americans' generally positive outlook toward the
economy, combined with a lack of any major newsmaking
debates on education, such as occurred in the past with the federal No Child
Left Behind Act and, more recently, the Common Core
educational standards.
The important qualifier is that, while 51% are
at least somewhat satisfied with U.S. educational quality, only 10% say they
are completely satisfied. At the other end of the spectrum, 32% are somewhat
dissatisfied and 15% are completely dissatisfied.
These results are from Gallup's 2019 edition of
its annual Work and Education poll, conducted Aug. 1-14.
Lower-Income Americans' Views of Education Have
Improved
Comparing Americans' satisfaction with U.S.
education today to the average level of satisfaction over the past two years,
satisfaction is up equally among gender, age and partisan subgroups.
By contrast, satisfaction has increased more
among lower-income Americans -- those in households earning less than $40,000
annually -- than among middle- and upper-income adults. Satisfaction has also
improved among blacks and Hispanics, as well as among parents of children under 18. Yet, there has been no change among whites and
adults without children under 18.
Recent Trend in Satisfaction With
U.S. Education, by Key Subgroups
% Satisfied with
quality of education children in grades K-12 receive
|
2017-2018 |
2019 |
Change |
|
|
% |
% |
pct. pts. |
|
|
U.S. adults |
45 |
51 |
6 |
|
Men |
43 |
50 |
7 |
|
Women |
47 |
52 |
5 |
|
18-34 |
40 |
47 |
7 |
|
35-54 |
47 |
51 |
4 |
|
55+ |
47 |
54 |
7 |
|
Republican |
46 |
51 |
5 |
|
Independent |
42 |
49 |
7 |
|
Democrat |
48 |
51 |
3 |
|
$100,000+ |
42 |
47 |
5 |
|
$40,000-<$100,000 |
44 |
48 |
4 |
|
Less than $40,000 |
48 |
59 |
11 |
|
Non-Hispanic white |
44 |
47 |
3 |
|
Non-Hispanic black |
41 |
53 |
12 |
|
Hispanic |
56 |
66 |
10 |
|
College graduate |
43 |
46 |
3 |
|
Not college graduate |
46 |
53 |
7 |
|
Child under 18 |
45 |
58 |
13 |
|
No child under 18 |
45 |
48 |
3 |
|
2017-2018 data based on combined August Work
and Education polls |
|||
|
GALLUP |
|||
U.S. Education Quality Not a Partisan Issue
Perhaps because education is perceived as more
of a local than a federal issue, Gallup has found only slight partisan
distinctions in Americans' ratings of U.S. education across presidential administrations.
·
Since
2017, under Republican Donald Trump's presidency, there has been virtually no
partisan difference in Americans' satisfaction with U.S. education, similar to
the partisan consistency seen from 2001 to 2008 under Republican President George
W. Bush.
·
A modest
partisan gap emerged during Democrat Barack Obama's presidency, when Democrats
were slightly more likely than Republicans to be satisfied, 50% vs. 41%. But
this was attributable to Republicans' becoming less satisfied. Democrats' satisfaction
has been steady near 50% across presidential administrations.
Satisfaction With
Quality of K-12 Education, by Presidential Administration and Party ID
% Satisfied with
quality of education children in grades K-12 receive
|
2001-08 (G.W. Bush) |
2009-16 (Barack Obama) |
2017-19 (Donald Trump) |
|
|
% |
% |
% |
|
|
Republicans |
50 |
41 |
48 |
|
Independents |
45 |
43 |
45 |
|
Democrats |
47 |
50 |
49 |
|
Data based on combined August Work and
Education polls for each period |
|||
|
GALLUP |
|||
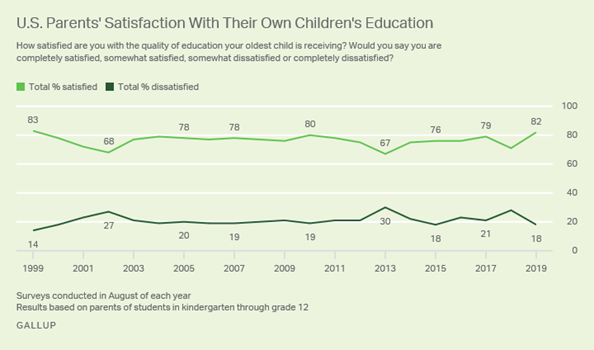
Parental Satisfaction With
Children's Education Remains High
Parents' satisfaction with their own children's
education is typically much higher than public satisfaction with K-12 education
generally. Currently, 82% of parents say they are satisfied with the education
their oldest child is receiving. That includes equal proportions saying they
are completely satisfied (41%) or somewhat satisfied (41%). Eighteen percent
are completely or somewhat dissatisfied.
The latest combined 82% parental satisfaction
reading is higher than the average 76% Gallup has recorded since 1999. However,
today's figure is statistically similar to the level in several individual
years -- most recently 2017, when 79% were satisfied, and the nominal high of
83% in 1999.
Overall parental satisfaction with their
children's education is similar across most demographic subgroups, but
upper-income parents are more satisfied with their child's education than those
earning less than $40,000. The rates are 85% of those earning $100,000 or more
and 81% among those earning between $40,000 and $99,999, versus 73% of those
earning less than $40,000.
Bottom Line
In a year when education reform has not been a
front-page newsmaker, Americans' views of the quality of education in
kindergarten through grade 12 have improved to the highest level Gallup has
seen in 15 years. Lower-income and minority groups are largely responsible for
this improvement. At the same time, parents of school-aged children remain
largely satisfied with their students' education. Still, with less than half
"completely satisfied," there remains much room for improvement.
(Gallup USA)
August 29, 2019
602-43-15/Poll
Most
Cannabis Consumers Use on a Weekly Basis or More
American Consumers Are More Likely to Use
Cannabis Daily than Canadians
Washington, DC, August 28, 2019 — Most people
who have used cannabis in the past year do so once a week or more, according to
a new Ipsos poll. This poll, among Canadians and
Americans in California, Nevada, Colorado, Oregon, Washington, and
Massachusetts aged 21 and over who report having used cannabis in the past 12
months, also finds that most users also consumed alcohol during the same period
(84%), while far fewer report tobacco use, about half (52%), and even fewer
used non-THC CBD products (41%). Most people who use marijuana do so at least
once a week (61%). Far fewer consume several times a month (12%), once a month
(8%), several times a year (13%), or once a month or less often (6%)
·
Americans
are more likely to use cannabis daily than Canadians, 2 out of 5 Americans
report daily use (37%), compared to under a third of Canadians (27%).
The pattern of a high percentage of frequent
users and fewer occasional users is mirrored with non-THC CBD use. Over half of
those who have consumed CBD in the past year do so once a week or more (55%).
Fewer use it more occasionally: 15% say several times a month, 10% say once a
month, 14% say several times a year, and 6% say once a year or less often. CBD
is also more popular among Americans than Canadians. Half of American cannabis
users report CBD use in the past 12 months (48%) compared to 35% of Canadians.
The most preferred form of consuming cannabis
is by smoking (61%), though 1 in 5 indicate edibles
are their preferred method (19%). Less common forms include vaping
(13%), capsules (3%) and tinctures (3%).
·
Americans
are more likely than their northern neighbors to prefer vaping
(16% compared to 11% of Canadians) and edibles (21% compared to 17%).
Most cannabis users consume it to wind down
after a long day (67%), though some also drink alcohol for the same purpose
(38%). Tobacco use is less common among cannabis consumers to relax (17%), as
is CBD (12%).
·
Canadians
are more likely to use alcohol to relax at the end of the day than Americans –
42% of Canadians report drinking alcohol to relax, while only a third of
Americans report the same behavior (33%).
Half of users purchase their cannabis products
at a recreational dispensary (54%), a third buy from friends (32%), and another fifth from a medical dispensary (21%).
Home delivery service is the least popular option (13%).
·
Two
thirds of Americans buy from recreational dispensaries (67%), compared to only
two fifths of Canadians (44%). Canadians are more likely to buy from their
friends (38%) than American (25%).
·
Americans
are more open about their cannabis use with potential partners than Canadians.
Half of Americans are willing to discuss cannabis use after a first date (53%),
while Canadians prefer to wait longer: only 37% would discuss it after a first
date, and 22% wait until after two dates.
Cannabis use is also associated with music for
some people. On average, they report listening to music under the influence of
cannabis 48% of the time. The most popular genres of music to listen to while
using cannabis are classic rock (50%) hip hop or rap (39%), pop music (36%),
alternative rock/indie, and R&B/soul (32% each). Reggae (25%), metal and
hard rock (25%), country (22%) and blues (20%) are also popular. The least
common genres are musical theatre and Broadway (5%) and gospel or religious
music (3%).
In addition to using cannabis while listening
to music at home, about 40% of users say they have used cannabis before
attending a music concert or festival. The most common form of consumption
before attending these events is smoking (66%), though edibles (17%) and vaping (12%) are also popular. Capsules (3%) and tinctures
(2%) are the least popular.
·
Americans’
preferences for cannabis use are more diverse than Canadians. Half of Americans
like to smoke at a concert or music festival (51%), a quarter like to vape (24%), and another 22% use edibles. Almost two thirds
of Canadians smoke at a live music event (64%).
(Ipsos)
28 August 2019
AUSTRALIA
602-43-16/Poll
Ride-Sharing
App Uber
Overtakes Taxis as Preferred Private Transport Service
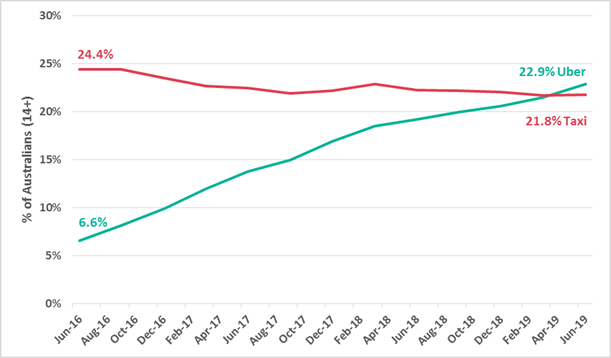
The latest data from Roy Morgan has shown that
a greater proportion of Australians (aged 14+) are now using Uber (22.9%) compared with taxis (21.8%). This is the first
data to reveal that taxis are no longer the preferred private transport service
of Australians.
Over the past three years, Uber
has experienced a dramatic rise in popularity. The proportion of Australians utilising the service in an average three-month period has
increased from 6.6% (1.3 million) of the population, to 22.9% (4.7 million), an
increase of 16.3% points (+ 3.4 million).
Although Uber is now
the preferred service, the proportion of Australians using taxis has remained
relatively steady in recent years, dropping only slightly from 24.4% (4.8
million) to 21.8% (4.5 million).
Percentage of Australians who used each service
in an average three months
Source: Roy Morgan Single Source Australia, July
2015 – June 2019. Rolling 12-month quarterly figures.
Average interviews per year n=14,733. Base: Australians aged
14+
When we look at customers by age group, we see
the rising popularity of Uber being driven by younger
Australians. A total of 42.6% (1 million) of those aged 18-24, and 35.7% (1.3
million) of those aged 25-34, used Uber in an average
three-month period. These two age groups account for 2.3 million out of the 4.7
million Australians who use Uber in an average
three-month period.
However, the usage of Uber
differs markedly across age groups. While younger Australians are Uber’s best customers, Australians aged 65+ had the lowest
proportion (6.6%) of Uber usage among them. Taxi
usage, however, is far more consistent across age groups. Those aged 35-49 had
the highest proportion of taxi usage (25.3%), with 14-17 years old’s recording the lowest (14.8%).
Proportion of Australians (by age) who used
each service in an average three months
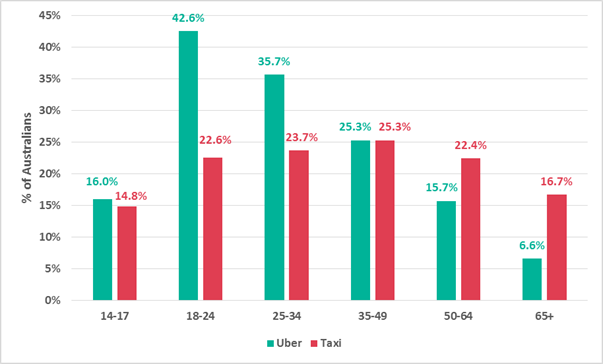
Source: Roy Morgan Single Source Australia, July 2018 –
June 2019, n=14,383. Base: Australians aged 14+
These are the latest findings from the Roy
Morgan Single Source survey derived from in-depth face-to-face interviews with
1,000 Australians each week and over 50,000 each year.
What else do we know about Uber
users?
Uber users
are far more likely than the average Australian to be in Generation Y and
Generation Z, to be in the Young Optimism and Socially Aware Roy Morgan Value Segments, and to be in a
Young Single or Young Couple household life cycle.
When it comes to health and fitness, 82% report
feeling well and in good health, almost half (46%) are concerned about their
sugar intake, and 30% love doing as many sports as possible.
Compared with the average Australian, Uber users are 144% more likely to have recently
snowboarded, 43% more likely to be more interested in their job than their
house, and 35% more likely to have recently been to the cinema.
Michele Levine, CEO of Roy Morgan, says:
“Although it comes as no real surprise, Uber has now officially become the most popular private
transport service among Australians, with a total of 4.7 million Australians utilising the ride-share app in an average three-month
period.
“Young Australians aged between 18-34 years old
are Uber’s largest customer base. As these younger,
more tech-friendly generations take up a greater proportion of the population, Uber is likely to continue to rise in popularity.
“The data shows that while taxi usage has remained
relatively stable over the past few years, it is the 35-64 year age group that
is taxis’ largest consumer base. As this group continues to age, it is likely
we’ll see the number of taxi users continue to fall.
“When we look at Uber
users within specific locations, we see Perth having the highest Uber usage of any capital city, with 32.1% of residents
having recently used one. This is followed by Melbourne (31.8%) and Sydney
(29.1%).”
(Roy Morgan)
August 26 2019
602-43-17/Poll
Rising
Numbers of Australians Looking At Electric and Hybrid Vehicles for Their Next
Set of Wheels
New data from Roy Morgan shows that 1,383,000
Australians (aged 14+) are looking to drive a hybrid vehicle, and 537,000
Australians are intending on driving an electric vehicle, as their next car –
either new or used.
Both figures represent an increase in the
intentions of car drivers from a year ago. The number of Australians looking to
drive a hybrid car as their next vehicle increased 341,000 since June 2018. The
number of consumers intending to drive an electric vehicle has increased
125,000 since a year ago.
The rise in popularity of environmentally
friendly vehicles has significantly increased the number of consumers looking
to drive hybrid and electric vehicles for their next car.
Number of Australians intending to drive hybrid
and electric vehicles for next car
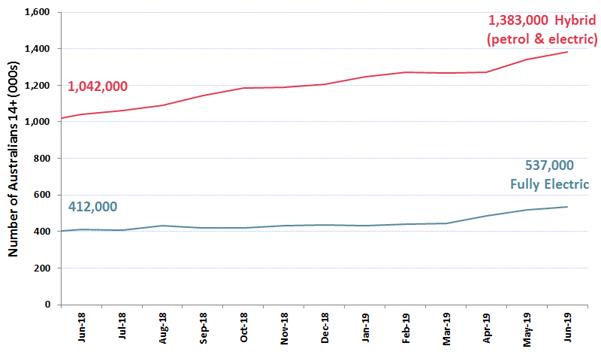 Source: Roy Morgan Single Source Australia, July
2017 – June 2019. Average interviews per year n=50,516. Base: Australians
aged 14+.
Source: Roy Morgan Single Source Australia, July
2017 – June 2019. Average interviews per year n=50,516. Base: Australians
aged 14+.
Used electric vehicles are increasingly favoured over new electric vehicles
When looking specifically at those intending to
purchase an electric vehicle within the next four years, we see 92,000
Australians intending on purchasing a used electric vehicle, up from 53,000 as
of June 2018 (an increase of 39,000).
However, the opposite trend was apparent for
those looking to purchase a new electric vehicle within four years. As of June
2019, a total of 49,000 Australians were looking to buy a new electric vehicle,
compared with 57,000 as of June 2018 (a decrease of 8,000).
This trend for used car purchasing is a really
important step for electric vehicles becoming a mainstream technology. This is
a similar trend to what was observed with new hybrid technology in the early
2000’s and what will drive the volume of electric vehicle sales into the
future.
Number of Australians looking to buy new and
used electric vehicles
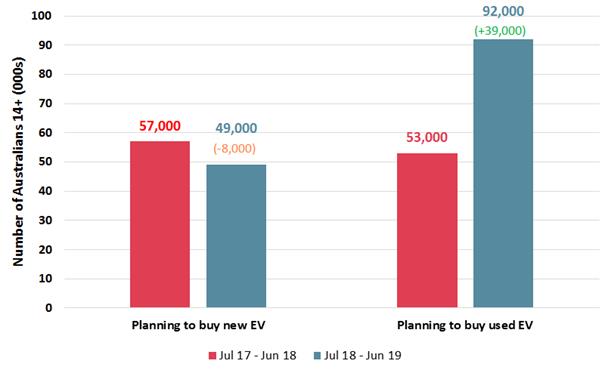
Source: Roy Morgan Single Source Australia, July
2017 – June 2018 n=280, July 2018 – June 2019 n=316. Base: Australians
aged 14+ who want to buy electric vehicle as next car in the next four years.
These are the latest findings from the Roy
Morgan Single Source survey derived from in-depth face-to-face interviews with
1,000 Australians each week and over 50,000 each year.
What are some attitudes held by those looking
to buy electric vehicles?
We know that 98.8% try to recycle everything
they can, 92.7% believe that if we don’t act now we’ll never control our
environmental problems, and 89.9% believe they are environmentalists at heart –
all far higher than average Australians.
They are also far more likely than the average
Australian to go out of their way to learn about new technology, to believe
that a percentage of everyone’s income should go to charities, and believe it’s
the government’s duty to support those who cannot find work.
Michele Levine, CEO of Roy Morgan, says:
“Over the past twelve months, we have seen a
significant increase in the number of Australians looking to drive electric or
hybrid vehicles for their next car. These increasing numbers send a clear signal
to car manufacturers that Australians are interested in greener technologies.
“The strong growth in popularity of electric
and hybrid vehicles suggests that the number of Australians driving these cars
will occupy an increasing proportion of the future car industry.
“When we look at the types of electric vehicles
people are intending to buy, we see used vehicles growing more strongly than
new vehicles, compared with a year ago. This is despite there not yet being a
large second-hand electric vehicle market available.
“This new data derived from in-depth
face-to-face interviews with over 50,000 Australians as part of the Roy Morgan
Single Source survey will no doubt be of interest to electric car
manufacturers, who are receiving a clear message from Australian consumers that
they are looking for more affordable electric vehicle options.”
(Roy Morgan)
August 28 2019
Source: https://www.roymorgan.com/findings/8089-electric-and-hybrid-vehicle-intenders-june-2019-201908280629
602-43-18/Poll
Toyota
And Mazda Drivers Most Brand Loyal; Have The Luxury Brands Lost Their Lustre?
Three years ago loyalty was clearly greatest
among luxury brands like BMW and Mercedes. Today, new data from Roy Morgan
reveals that of Australians (aged 14+) looking to purchase a new car in the
next four years, six-in-ten of current Toyota and Mazda drivers are intending
to purchase the same brand, which are the highest loyalty ratings of any
manufacturer.
Toyota and Mazda’s loyalty ratings are followed
by Subaru, Mercedes-Benz, Volkswagen, BMW, Hyundai, Honda, Lexus, Audi,
Mitsubishi, Nissan, Ford and Holden.
Eight of the ten non-luxury manufacturers
increased their loyalty rating from three years ago. The largest improvement
was by Mitsubishi, climbing from 28.4% in 2016, to 41.8% this year. The sharp
increase has allowed Mitsubishi to climb from fourteenth position overall to
eleventh, in the space of three years.
Unlike non-luxury vehicles, luxury brands have
seen declines in loyalty ratings when compared to three years ago. Because
Mercedes-Benz has managed to limit its decline to only 3%, it has recorded the
highest loyalty rating of the four luxury brands as on June 2019.
These are the latest findings from the Roy
Morgan Single Source survey derived from in-depth face-to-face interviews with
1,000 Australians each week and over 50,000 each year.
Ranking car manufacturers by car owners who
intend on purchasing the same brand as they currently drive
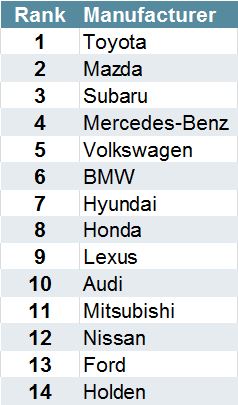
Source: Roy Morgan Single Source Australia, July 2018 –
June 2019 n=4,826. Base: Australians aged 14+ intending on
buying new car in next four years.
What else do we know about people intending on
buying a Toyota or Mazda?
Women (51%) are more likely than men (49%) to
be looking at buying a Mazda, whereas the reverse is true for Toyota, with men
(55%) being more interested than women (45%).
Mazda intenders are 85% more likely than the
average Australian to be placed in the Visible Achievement Roy Morgan Value Segment, whereas Toyota
intenders are 62% more likely to be placed in Real Conservatism.
Only 30% of people intending on purchasing a
Mazda believe the government is doing a good job at running the country,
compared with 40% of those intending on buying a Toyota.
And 82% of likely Mazda buyers are optimistic
about the future, and 59% of likely Toyota buyers watch news on TV to keep them
up-to-date.
Michele Levine, CEO of Roy Morgan, says:
“Brand loyalty in the car industry is an
important indicator for two reasons. First, it provides a signal to
manufacturers about future buying trends. And second, it is perhaps the most
valuable form of feedback that a consumer can give.
“Toyota and Mazda have been near the top of
customer loyalty ratings for a few years now, with both recording impressive
growth over the same period. While this result would be pleasing for both car
manufacturers, they would no doubt be aiming to increase these numbers even
further.
“Luxury car brands appear to be losing loyal
customers. The proportion of current drivers intending on purchasing the same
luxury brand again has decreased over the past few years. Combining this data
with Roy Morgan’s automotive satisfaction ratings would provide a more
wholesome picture of what seems to be happening in the luxury car market.”
(Roy Morgan)
August 26 2019
MULTICOUNTRY STUDIES
602-43-19/Poll
Britons
Make Worst Tourists, Say Britons (And Spaniards And
Germans)
We are the country with the most negative view
of its own tourists
An international YouGov study shows that tales
of British rowdiness overseas are now part of the popular consciousness;
Britons are the most likely among 26 countries to take a negative view of their
own tourists.
More than half of us (57%) hold an unfavourable opinion of British tourists, and just 29% take
a positive view.
We are, in fact, the only country that feels so
much more negatively about our own tourists; the next comparable country is
Germany where the 43% who think Germans behave badly on holiday is largely
matched by the 40% who think their brethren give their country a good name.
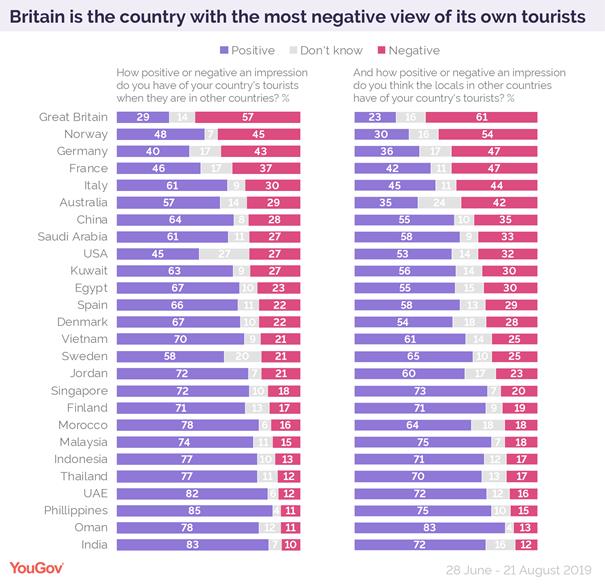
These figures are a far cry from those from the
Philippines, where a whopping 85% hold a favourable
view of Filipinos vacationing abroad and only 11% feel the opposite way.
Unsurprisingly, Britons are also the most
likely to think that the locals in foreign resorts also take a dim view of our
holidaymakers. More than six in ten (61%) think that residents
have a negative opinion of British tourists, and only 23% believe that we are
gladly received by natives.
We are joined in this by the French (54% of
whom think their own nation’s holidaymakers are an irritant to the locals,
compared to 30% who do not), Germans (47% versus 36%) and Norwegians (47%
versus 42%).
Again, at the other end of the table, Filipinos
are the most likely to think their tourists are greeted with a smile (83%).
Britons’ belief that other countries take a dim
view of our tourists is hardly unfounded. Asked to name up to three countries
from which the worst tourists originate, almost half of Spanish people (46%)
named Britain.
We also topped the list in Germany (39%) and
also in our own country (23%). We in Britain are only marginally less
likely to hold a negative view of American tourists (22%).
Also unpopular among Europeans are Russian
tourists, particularly in Denmark, Sweden, Finland and Norway, where they top
the list (at between 24% and 38% in each nation), as well as Germany where 36%
of people named them among the world’s worst tourists. Germans themselves were
also frequently cited by other Europeans (including themselves) as being among
the worst tourists, as were the Chinese.
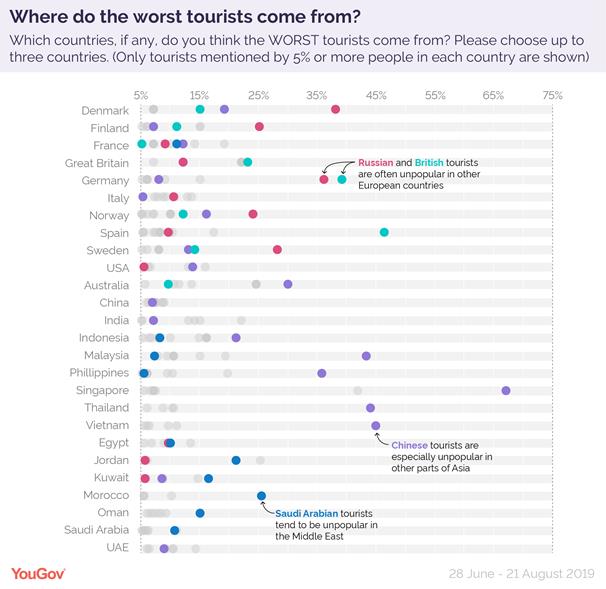
Chinese tourists are even less popular in other
parts of Asia (including China itself), being named as the worst tourists in
Australia, Indonesia, Malaysia, the Philippines, Singapore, Thailand, and
Vietnam. In fact an enormous 67% of Singaporeans included Chinese tourists in
their list of the world’s worst holidaymakers (they are also pretty unimpressed
with Indian tourists, at 42%).
Asked where the best tourists come from, one
nation stands out above all others: Japan. With Japanese football fans having
make headlines around the world during the World Cup by helping to clean the
stadiums after matches, the nation is consistently cited as being home to the
most gladly received tourists the world over.
This is particularly the case in Finland,
France, Germany, Indonesia, Malaysia, the Philippines, Singapore, and Thailand,
all of whom placed Japanese tourists at the very top of their lists.
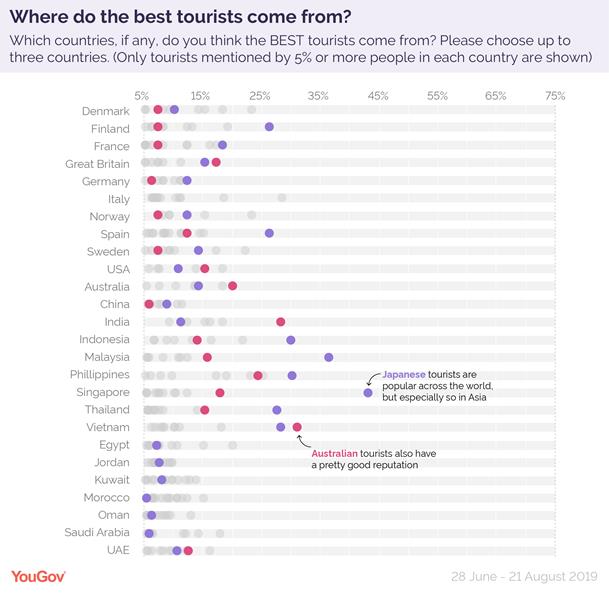
(YouGov)
August 30, 2019
602-43-20/Poll
Brazilians
Least Satisfied in Amazon With
Environment
STORY HIGHLIGHTS
·
30% of
Brazilians are satisfied with efforts to preserve the environment
·
Less
than a majority in most Amazon countries are satisfied with environment
WASHINGTON, D.C. -- Brazilians' satisfaction
with efforts to preserve the environment dropped to a new low of 30% in 2018,
long before they saw massive expanses of the Amazon rainforest consumed by
flame and deforestation this year. But this percentage stands out for another
reason -- it is also the lowest for any country that is home to the Amazon.
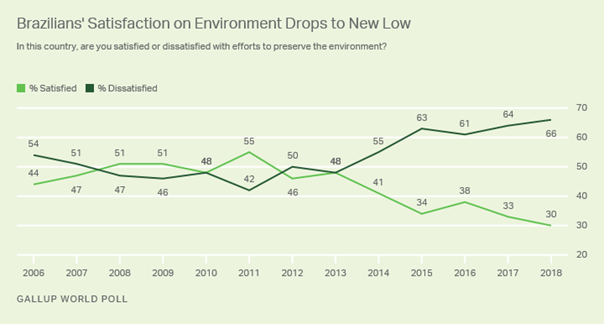
Brazil has historically been a leader in environmental
protection, having been a long-time trailblazer in carbon emission reduction
through the production and use of ethanol and other biofuels. However,
Brazilians' displeasure with efforts to preserve the environment started to
show after 2014, following sharp increases in deforestation rates across the
country after years of decline. The new low in 2018 came on the news that
annual deforestation rates that year were the worst in a decade.
The situation has only become more acute under
Brazilian President Jair Bolsonaro,
who has long supported scaling back rainforest protections. Since the start of
2019, Brazil's National Institute for Space Research (INPE) has reported over
72,843 fires in Brazil, more than half occurring in the Amazon rainforest. This
is the highest number of fires reported since 2010. INPE has also reported an
83% increase in deforestation this year in comparison to 2018.
With international and domestic pressure
mounting on the Brazilian government to act, Bolsonaro
announced the deployment of troops on Monday to quench the blaze in the
rainforest. South American countries will meet next week to discuss a
coordinated response to the fires.
Brazilians' Dissatisfaction Runs Deep
Brazilians' satisfaction with their country's
environmental preservation efforts falls along educational, economic and
political divides. While few Brazilians are satisfied with efforts to preserve
the environment, Brazilians with at least a high school education (23%
satisfied) are significantly less satisfied than those with an elementary
school level of education or less (42% satisfied).
As a note for political watchers, those who
disapprove of Brazil's leadership are nearly three times less likely to be
satisfied with preservation efforts (24% satisfied) than those who approve (64%
satisfied). While environmental issues in the past haven't registered as a top
concern among voters -- which is apparent given Bolsonaro's
election -- other polling in the region suggests that Brazilians ultimately
hold the government responsible for safeguarding the environment.
Brazilians' Satisfaction on Environment Varies
by Education, Politics
In this country, are you satisfied or
dissatisfied with efforts to preserve the environment?
|
Satisfied |
Dissatisfied |
|
|
% |
% |
|
|
Elementary school or less |
42 |
53 |
|
Less than tertiary education |
23 |
74 |
|
Approve of leadership |
64 |
34 |
|
Disapprove of leadership |
24 |
72 |
|
GALLUP WORLD POLL, 2018 |
||
Brazilian Satisfaction the Lowest in the Amazon
Residents in most countries with the Amazon rainforest
within their borders are more dissatisfied than satisfied with efforts to
preserve the environment in their countries. In fact, satisfaction with efforts
rises to a majority in only two countries -- Ecuador and Bolivia -- although
satisfaction there has been trending downward in the past several years.
However, Brazilians stand out as the least satisfied of their regional
neighbors.
Satisfaction With
Efforts to Preserve the Environment Across the Amazon
|
Satisfied |
Dissatisfied |
|
|
% |
% |
|
|
Ecuador |
58 |
38 |
|
Bolivia |
53 |
43 |
|
Peru |
45 |
50 |
|
Colombia |
41 |
55 |
|
Venezuela |
34 |
64 |
|
Brazil |
30 |
66 |
|
GALLUP WORLD POLL, 2018 |
||
The recent fires are not just a problem for
Brazil's Amazon. While the fires in Brazil have garnered more news coverage,
fires are also raging in Bolivia, where more than 1.8 million acres have burned
so far. The INPE estimates that between July and August, there has been a 422%
increase in the number of fires in Bolivia.
Trade Implications
Before the blazes in Brazil made headlines, the
burning issue was a potential trade deal between the EU and the Mercosur bloc countries, which includes Brazil. While the
deal is yet to be ratified by EU member states, the agreement between the two
blocs would secure adherence to the Paris climate accord for nations like
Brazil, whose climate-skeptic leadership has voiced strong opposition to the
accord, citing it to be an economic stranglehold on their nation.
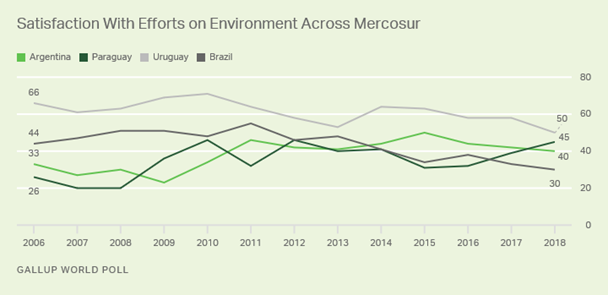
French President Emmanuel Macron's intent to
block the EU-Mercosur deal unless Bolsonaro
shows he is taking environmental preservation more seriously has pitted the two
nations' leaders against each other. Like Brazilians, the majority of residents
in other Mercosur bloc countries --Paraguay, Argentina
and Uruguay -- are dissatisfied with their country's efforts toward
environmental preservation.
Bottom Line
With the world watching how Brazil responds to
the fire in its backyard, it is crucial for Bolsonaro,
and his government, to find a resolution that is in the best interests of
Brazilians and the rainforest they steward.
While the immediate economic growth from
clearing forests for farmland may be an incentive for some, the negative effect
of continued deforestation may be felt through trade sanctions by partner
countries whose leaderships are more focused on environmental protection.
(Gallup USA)
August 30, 2019
602-43-21/Poll
India Ranks
9th on Happiness among 28 Global Markets: Ipsos
Global Happiness Survey
Australia and Canada are tied at the top spot
as happiest nations Living conditions, physical well-being, personal safety and
security, friends, feeling in control of life, emerged as some of the top
determinants of happiness
According to a new global survey by Ipsos in India has ranked 9th in the pecking order on
Happiness, among 28 nations polled.
Interestingly, markets with the highest
prevalence of happiness are largely the developed nations, known for their
citizen-centricity ; Australia and Canada tied at the top spot (at 86%)
have emerged as the happiest nations of the world, followed by China (83%),
Great Britain (82%), France (80%), US (79%), Saudi Arabia (78%)
and Germany (78%)– these are the eight markets preceding India – and the
survey shows that India is a notch below them (at 77%).
So, which were the markets, lowest on the
happiness sweepstakes? Argentina (34%), Spain (46%) and Russia (47%), emerged
at the bottom of the heap, among the 28 markets.
Notably, globally, happiness levels have
receded in 2019, vis-à-vis 2018. For India too, there’s been a 6 per cent drop
(from 83% in 2018 to 77% in 2019).
What makes Indians happy?
Buddha said, ages ago, ‘There is no path to
happiness, happiness is the path.’ Interestingly, the Ipsos
global happiness survey, demystifies the true determinants of happiness.
The factors voted as most important in
triggering happiness were: My living conditions (89%), my health/ physical
well-being (88%), my personal safety and security (88%), my friends (87%),
feeling in control of my life (86%), feeling my life has meaning (86%),
my hobbies/ interests (85%), the well-being of my country (85%), among
others.
“For Indians it boils down to comfortable
living conditions, robust health, good financial conditions, friends and social
circle and to have purpose in life. Hobbies and interests are important too,”
says Parijat Chakraborty,
Country Service Line Leader, Public Affairs and Corporate Reputation, Ipsos India.
The top global list for happiness,
is at slight variance. The top determinants of happiness were: My physical
health/ wellbeing (88%), my living conditions (86%), my hobbies/ interests
(85%), my personal safety/ security (85%), feeling that my life has meaning
(85%), feeling in control of my life (84%), satisfaction with the direction my
life is going in (84%), having more money (84%), having more friends (83%), et
al.
About the Study
These are the findings of a 28-country Ipsos survey conducted via Ipsos’s
Global Advisor online survey platform between May 24th and June 7th, 2019.
(Ipsos)
30 August 2019
602-43-22/Poll
The Biggest
Beauty Influencer Isn’t Who You Think It Is
New global study looks at beauty standards,
ideals, and routines. With all of the attention paid to online beauty
influencers, beauty brands may be missing out on a key target: mothers.
Mothers, as well as friends, sisters, and other
family members, wield the most influence on women’s beauty routines, according
to a new Ipsos survey of 19,029 adults from 27
countries. Nearly half of women surveyed said their mother (49%), friends
(48%), and sisters or other family (45%) are somewhat or very influential. This
compares with only one in three who said that magazines and print media, online
videos, and Instagram influenced their routines. In
the U.S., the results were even more pronounced. Women were twice as likely to
say that their mother and friends influence their beauty routine compared to Instagram.
The survey also asked about beauty ideals and
values. Beautiful people are seen as happy, kind and confident, which
replicates the survey that led to Dove’s revolutionary “Real Beauty” campaign
in 2004.
Ipsos
surveyed more than 19,000 men and women around the world asking them to rate
the importance of 19 characteristics of beauty. As in 2004, intrinsic
characteristics outranked physical characteristics such as appearance of skin,
body weight and shape, facial appearance and sexiness. This question was asked
about both female and male beauty, and the results were largely consistent for
both genders.
But at a time when there are growing calls for
a more inclusive sense of beauty, the study finds that very definite ideals
still exist across nations and cultures. The survey also asked people to
describe a beautiful man and woman in their country based on height, body type,
eye and hair color. A plurality generally said “no
opinion,” but among those who offered an opinion, a remarkably consistent
picture emerged.
Ipsos then
commissioned artists in 12 of those countries to illustrate what a beautiful
man and woman in their country would look like, based on the survey data. The
results were published in Ipsos’ latest award-winning
“What the Future” report, focused on the future of beauty.
The report, including the entire global
dataset, can be viewed at the newly-launched future.ipsos.com
(Ipsos)
26 August 2019