BUSINESS
& POLITICS IN THE WORLD
GLOBAL
OPINION REPORT NO. 657
Week: September 23 – September
29, 2020
Presentation: October 02, 2020
657-43-24/Commentary: Changing Japan? 99.8%
of officials show plan to take paternity leave
Changing
Japan? 99.8% of officials show plan to take paternity leave
As
colleges start back, students need support at this difficult time
Why
is it so hard to eliminate corruption in Lebanon?
Kenyans
experience increased deprivation of basic necessities, Afrobarometer surveys
show
Most
Angolans give the government poor marks on economic management, Afrobarometer
survey shows
Almost
7 In 10 Nigerians Describe The Security Situation In The Country As Bad
83%
of Spaniards are in favor of the legalization of abortion, 5 points less than
in 2014
5
percent of Germans are planning a vacation abroad in the autumn holidays
despite Corona
American
presidential elections: a victory for Joe Biden desired by the French
Only
a quarter of companies have taken action on racial inequality since Black Lives
Matter protests
Majority
support new lockdown measures, but it’s not helping the government
Three
in five Brits have had the same current account for over ten years
Life
Ratings Among Black Americans Erode During Trump Era
Democrats
Regain Favorability Edge Over GOP
Economics
Alone Don't Tell the Full Story of Poverty
61%
of Americans Support Abolishing Electoral College
Hispanic
teens enjoy religious activities with parents, but fewer view religion as ‘very
important’
Gen Z
eligible voters reflect the growing racial and ethnic diversity of U.S.
electorate
54%
of Americans say social media companies shouldn’t allow any political ads
Super
fund satisfaction down in July, as Australians allowed to withdraw a second
tranche of $10,000
The
Arab World’s Digital Divide
INTRODUCTORY NOTE
657-43-24/Commentary: Changing Japan? 99.8% of officials show plan to take paternity leave
Almost all male central government officials with babies born between April and June plan to take paternity leave after managers received an incentive to push the time off on their subordinates.
Of 3,035 officials surveyed, 3,030, or 99.8 percent, plan to temporarily leave work to help raise their newborns, according to the Cabinet Bureau of Personnel Affairs.
The remaining five officials were busy with disaster relief or responding to the COVID-19 pandemic. But they will also be encouraged to take paternity leave later.
In April, the bureau, which oversees the national government employee system, started to include in its evaluations of managers how eagerly they encourage subordinates to take paternity leave.
In fiscal 2018, only 12.4 percent of eligible officials took the time off.
The government has since encouraged its workers to take paternity leave, and its promotional campaign appears to be paying off.
The bureau’s survey results on Aug. 28 showed that the officials plan to take paternity leave for 43 days on average, and 85.2 percent are expected to take “more than one month” off, a goal set by the central government.
“It is very important for male officials to do housework and child-rearing to allow women to participate actively in society,” a bureau official said. “We would like to promote paternity leave so that the new trend will take root among officials.”
The bureau’s survey covered government officials who provide regular services and Defense Ministry officials who provide special services.
Under the new evaluation system, the efforts of senior managers and supervisors to promote paternity leave is reflected in their personnel grades. For example, as a part of their efforts, they are asked to write documents showing the preferred child care leave schedules of their subordinates.
(The Asahi Shimbun)
September 29, 2020
Source: http://www.asahi.com/ajw/articles/13715431
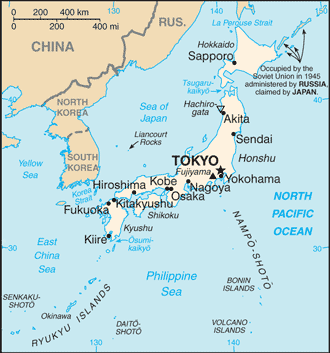
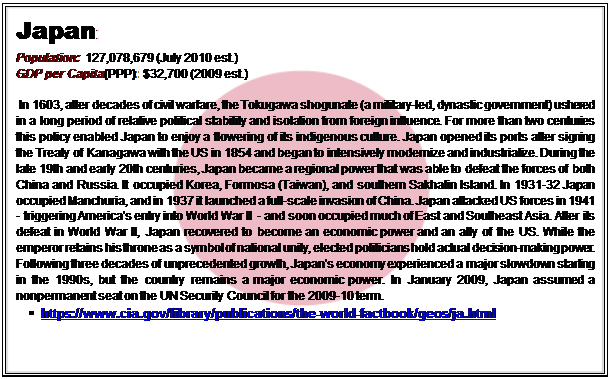
657-43-25/Country Profile:
Japan
SUMMARY
OF POLLS
ASIA
(Japan)
Changing Japan? 99.8% of officials show plan to take paternity leave
Almost all male central government officials with babies born
between April and June plan to take paternity leave after managers received an
incentive to push the time off on their subordinates. Of 3,035 officials
surveyed, 3,030, or 99.8 percent, plan to temporarily leave work to help raise
their newborns, according to the Cabinet Bureau of Personnel Affairs. The
remaining five officials were busy with disaster relief or responding to the
COVID-19 pandemic. But they will also be encouraged to take paternity leave
later. (The Asahi Shimbun)
September 29,
2020
(Japan)
As colleges start back, students need support at this difficult time
Most of the universities and colleges will be combining
face-to-face classes to be taught on campus with remote classes to be given
online. Education ministry figures show one-third of the universities and
colleges will be providing fewer face-to-face classes than their remote
counterparts. One survey has provided worrying results. The survey was conducted
this past summer of about 9,000 students by the National Federation of
University Cooperative Associations. Asked about their physical and mental
conditions, some 4,000 respondents said they seldom feel motivated, with
another 4,000 or so saying they feel stressed. (The Asahi Shimbun)
September 28, 2020
MENA
(Lebanon)
Why is it so hard to eliminate corruption in Lebanon?
Although Lebanon is an upper-middle-income country, the Lebanese
state has been unable to deliver satisfactory levels of social welfare and
public services. Considering
these outcomes, it is unsurprising that data from Arab Barometer show that 91
percent of Lebanese say that corruption in national state agencies and
institutions exists to a large or medium extent. Additionally, a vast majority
in each sect holds this view, demonstrating that this concern is shared across
a major political divide. (Arab
Barometer)
September 24, 2020
AFRICA
(Kenya)
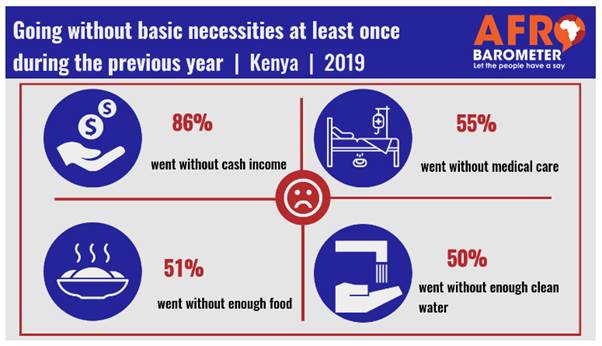
Kenyans experience increased deprivation of basic necessities, Afrobarometer surveys show
More Kenyans are frequently going without basic necessities such as
enough food and clean water, according to Afrobarometer
survey findings. At least half of all Kenyans reported going without enough
food, enough clean water, and needed medical care at least once during the year
preceding the survey. Compared to 2016, the proportion of Kenyans who
experienced frequent shortages of basic necessities, or high levels of “lived
poverty,” increased in 2019, while fewer citizens experienced no such
deprivation. (Afrobarometer)
September 28, 2020
(Angola)
Most Angolans give the government poor marks on
economic management, Afrobarometer survey shows
A large majority of Angolans say the government is doing a poor job
on unemployment, improving living standards of the poor, and other economic
issues, according to the most recent Afrobarometer
survey. More than three-quarters of Angolans give the government bad marks on
maintaining price stability, and almost as many are critical of its overall
economic management. Residents of Luanda and Cabinda are particularly critical
of the government’s economic performance. (Afrobarometer)
September 25, 2020
(Nigeria)
Almost 7 In 10 Nigerians Describe The Security Situation In The Country
As Bad
A new public opinion poll conducted by NOIPolls
has revealed that almost two-thirds (65 percent) of Nigerians nationwide do not
consider the current security situation in the country to be good.
Additionally, analysis of respondents revealed that the South-West region (71
percent) had the highest proportion of Nigerians who do not consider the
security situation in the country unsafe, while the North-East zone (57
percent) had the lowest proportion of Nigerians in this category. (NOI Polls)
September 25, 2020
EUROPE
(Spain)
83% of Spaniards are in favor of the legalization
of abortion, 5 points less than in 2014
Spain is the third European country where support for the legalization
of abortion falls the most, from 88% to 83%. Germany and France lead the
decline in the percentage of the population in favor of the legalization of
abortion in Europe, with 9 and 6 points less respectively. However, Europe is
the world region that most supports the legalization of abortion, with Spain
being the sixth country in the world ranking. Latin America is the region where
less support is shown for legalization, but a change in trend is detected due
to the influence of feminist movements in several countries. (Ipsos)
September 25, 2020
(Ukraine)
Ukrainians' expectations about the influence of countries and
international organizations on world affairs and attitudes towards the United
States
Most residents of Ukrainian cities expect a positive impact of
"Euro-Atlantic" countries and organizations on world affairs in the
next decade, while a small proportion of citizens expect this from Russia and
Iran (24% and 21%). In the new wave of the international study Global Advisor,
conducted by Ipsos in Ukraine and 28 other countries in June-July this year, in
addition to basic economic and socio-political issues, the people’s attitude to
a sample of 16 countries and international organizations was also assessed.
(Ipsos)
September 30, 2020
(Germany)
5 percent of Germans are planning a vacation
abroad in the autumn holidays despite Corona
The autumn holidays will begin in the coming week in Hamburg,
Hesse, Mecklenburg-Western Pomerania and Schleswig-Holstein. But only a
small proportion of Germans have plans to travel: 70 percent of German
respondents say they have no travel plans for the October weeks. 7 percent
say they are changing their plans to travel abroad due to the Corona
crisis. 2 percent say this about their travel plans within Germany. However,
5 percent of the German respondents also state that they definitely want to
start their planned trip abroad, and 9 percent do not want to give up their
plans for a trip within Germany. (YouGov)
September 29, 2020
(France)
American presidential elections: a victory for Joe Biden desired by the
French
The four years in power of Donald Trump have not succeeded in
turning the opinion of the French in his favor: 69% of the population believe
that the current President of the United States was a bad president during his
mandate. For 53% of the French, Donald Trump has badly
defended the interests of his country during his four years in power. An
opinion shared in particular among 18-24 year olds (70%), among students (69%)
and among those who voted for Emmanuel Macron in the first round of the 2017
presidential elections (63%). (YouGov)
September 30, 2020
(UK)
Only a quarter of companies have taken action on
racial inequality since Black Lives Matter protests
This is despite most (86%) business decision-makers saying that
companies have a role to play in tackling racial inequality. The killing of
George Floyd earlier this year in the US sparked a global wave of protests
calling for action against police brutality and discrimination against ethnic
minorities. Companies on both sides of the Atlantic have made public statements
of solidarity with grassroots campaign organisation
Black Lives Matter and have declared their support to fighting racial
inequality. (YouGov)
September 28, 2020
(UK)
Majority support new lockdown measures, but it’s
not helping the government
Throughout the coronavirus crisis we’ve found overwhelming support
every time restrictions have been brought in to stymie the spread of the virus.
This week is no exception, with the majority of the public supporting all six
of the new measures affecting England that were announced this week. Strongest
support comes for the measures that are less restrictive on groups of people
meeting, with 85% supporting the toughened rules around wearing face masks
(85%), the advice to work from home when possible (85%) and pubs operating with
table service only (82%). (YouGov)
September 25, 2020
(UK)
Three in five Brits have had the same current account for over ten
years
Most Brits still stick with their current account for decades - but
one in eight (13%) have switched in the past three years. There is an old adage
that an Englishman is more likely to change his wife than his bank account.
Results from YouGov Profiles reveal that this saying may be based on a
foundation of truth. Despite initiatives like the Current Account Switch
Guarantee and banks offering upfront cash and better interest rates to
switchers, consumers are still reluctant to change their main current account.
(YouGov)
September 27, 2020
NORTH AMERICA
Life Ratings Among Black Americans Erode During
Trump Era
The percentage of Black Americans who
evaluate their lives well enough to be considered "thriving" has
eroded since 2016, dropping to 48.1% in 2020. This is down nearly 10 percentage
points since the recorded high mark of 57.9% in 2010 and is down five points
since 2016. These results are based on new data from the Gallup National Health
and Well-Being Index, which began measurement in 2008. 54.6% of White Americans are classified
as thriving, compared with 52% of Hispanic Americans and 48.1% of Black
Americans. (Gallup USA)
September 24, 2020
Democrats Regain Favorability Edge Over GOP
Americans' opinions of the Republican
Party have soured since January but are similar to what they were a year ago.
Meanwhile, Americans' favorability ratings of the Democratic Party (47%) have
been stable and again surpass those of the GOP (42%). More Americans have a favorable opinion
of the Democratic Party than the Republican Party, a change from January.
During most of the past four years, the Democratic Party has been viewed at
least slightly more positively than the Republican Party. (Gallup USA)
September 24, 2020
Economics Alone Don't Tell the Full Story of
Poverty
Poverty is often measured in economic
terms. In fact, the most popular poverty statistic is based on a financial
calculation. It looks at the number of workers that live on less than $2 per
day. And that figure -- is 8%. Poverty is multidimensional. And the dimension
that receives the least amount of attention is behavioral. This behavioral
dimension goes by a few other names -- such as happiness and subjective
wellbeing. Regardless of what you call it -- the names mean the same thing.
(Gallup USA)
September 24, 2020
61% of Americans Support Abolishing Electoral
College
Heading into the 2020 presidential
election, three in five Americans favor amending the U.S. Constitution to
replace the Electoral College with a popular vote system, marking a
six-percentage point uptick since April 2019. This preference for electing the
president based on who receives the most votes nationwide is driven by 89% of
Democrats and 68% of independents. Far fewer Republicans, 23%, share this view,
as 77% of them support keeping the current system in which the candidate with
the most votes in the Electoral College wins the election. (Gallup USA)
September 24, 2020
Hispanic teens enjoy religious activities with
parents, but fewer view religion as ‘very important’
Hispanics, who make up one of the
nation’s fastest growing racial and ethnic groups and are its youngest, tend to
be more religious than Americans overall on several measures, such as attending
worship services regularly and saying religion is very important in their
lives. However, these differences aren’t as stark among younger Americans:
Hispanic teenagers (ages 13 to 17) look a lot like their peers when it comes to
religion, even though they are more likely than U.S. teens overall to identify
as Catholic and say it’s necessary to believe in God to be moral, according to
a recent Pew Research Center survey. (PEW)
September 22, 2020
Gen Z eligible voters reflect the growing racial
and ethnic diversity of U.S. electorate
As the presidential election fast
approaches and early voting gets underway in some states, interest is building
over the impact Generation Z voters – who will make up one-in-ten eligible
voters this fall – will have on the outcome. Gen Z eligible voters, who range in age
from 18 to 23, are a more racially and ethnically diverse group than older
generations. While a majority (55%) are non-Hispanic White, a notable 22% are
Hispanic, according to a Pew Research Center analysis based on Census Bureau
data. Some 14% of Gen Z eligible voters are Black, 5% are Asian and 5% are some
other race or multiracial. (PEW)
September 23, 2020
54% of Americans say social media companies
shouldn’t allow any political ads
More than half of U.S. adults (54%) say
social media companies should not allow any political advertisements on their
platforms. And a larger share (77%) finds it not very or not at all acceptable
for these companies to use data about their users’ online activities to show
them ads from political campaigns, according to a Pew Research Center survey
conducted Sept. 8-13, 2020. At the same time, 45% say social media
companies should allow at least some political
ads on their platforms, with 26% saying these firms should allow all of these ads and 19% backing the
idea that only some should
be allowed. (PEW)
September 24, 2020
AUSTRALIA
Super fund satisfaction down in July, as
Australians allowed to withdraw a second tranche of $10,000
New data from Roy Morgan’s Superannuation
Satisfaction Report shows an overall super fund satisfaction with financial
performance rating of 61.6% in July. This is down 1.3% points on the previous
month but is virtually unchanged on a year ago with satisfaction of 61.7% in
July 2019.
The ratings for July 2020 cover the first
month in which Australians in financial hardship were able to apply to withdraw
a second tranche of up to $10,000 held in their superannuation accounts.
(Roy Morgan)
September 22, 2020
MULTICOUNTRY STUDIES
World’s most admired 2020
Barack Obama has deposed Bill Gates from
his position as world’s most admired man for the first time since YouGov first
started asking in 2014. Michelle Obama holds on to her position as world’s most
admired woman, having ended Angelina Jolie’s run of dominance last year. Jolie
herself has risen one place since last year to second, with Queen Elizabeth II
also rising one rank to become the world’s third most admired female. Gates has
only slipped one rank, with his fall potentially coming as a result of rumours that he is in some way involved in the spread of
COVID-19. (YouGov)
September 28, 2020
(YouGov)
September 28, 2020
The Arab World’s Digital Divide
The internet has been touted as an engine for equality because of
its potential to expand opportunities across all segments of society,
accelerate upward social mobility, and lend voice and platforms to marginalized
groups. Yet, despite decades of increasing internet penetration, the
proliferation of smartphones, and an expanding internet culture, inequalities
in the Arab World remain pronounced, and by some estimates have grown more
severe. Data from the latest wave of Arab Barometer surveys indicate that rates
of internet usage differ markedly along demographic lines. (Arab Barometer)
September 25, 2020
ASIA
657-43-01/Poll
Changing Japan? 99.8% of officials show plan to take paternity leave
Almost all male central government officials with babies born between April and June plan to take paternity leave after managers received an incentive to push the time off on their subordinates.
Of 3,035 officials surveyed, 3,030, or 99.8 percent, plan to temporarily leave work to help raise their newborns, according to the Cabinet Bureau of Personnel Affairs.
The remaining five officials were busy with disaster relief or responding to the COVID-19 pandemic. But they will also be encouraged to take paternity leave later.
In April, the bureau, which oversees the national government employee system, started to include in its evaluations of managers how eagerly they encourage subordinates to take paternity leave.
In fiscal 2018, only 12.4 percent of eligible officials took the time off.
The government has since encouraged its workers to take paternity leave, and its promotional campaign appears to be paying off.
The bureau’s survey results on Aug. 28 showed that the officials plan to take paternity leave for 43 days on average, and 85.2 percent are expected to take “more than one month” off, a goal set by the central government.
“It is very important for male officials to do housework and child-rearing to allow women to participate actively in society,” a bureau official said. “We would like to promote paternity leave so that the new trend will take root among officials.”
The bureau’s survey covered government officials who provide regular services and Defense Ministry officials who provide special services.
Under the new evaluation system, the efforts of senior managers and supervisors to promote paternity leave is reflected in their personnel grades. For example, as a part of their efforts, they are asked to write documents showing the preferred child care leave schedules of their subordinates.
(The Asahi Shimbun)
September 29, 2020
Source: http://www.asahi.com/ajw/articles/13715431
657-43-02/Poll
As colleges start back, students need support at this difficult time
Practically all of Japan’s universities, junior colleges and technical colleges are expected to resume on-campus classes from this school year’s second term, which typically starts in September or October.
The COVID-19 pandemic has forced the universities and colleges to hold most of their classes online for as long as half a year.
Japan’s school year starts in April and ends in March.
Not that all classes will be operating as usual.
Most of the universities and colleges will be combining face-to-face classes to be taught on campus with remote classes to be given online. Education ministry figures show one-third of the universities and colleges will be providing fewer face-to-face classes than their remote counterparts.
One survey has provided worrying results.
The survey was conducted this past summer of about 9,000 students by the National Federation of University Cooperative Associations. Asked about their physical and mental conditions, some 4,000 respondents said they seldom feel motivated, with another 4,000 or so saying they feel stressed (multiple answers allowed).
Many respondents complained in their free-text answers that they don’t understand why university students alone should be encouraged to stay home when elementary, junior high and senior high school students are attending classes as usual. In addition, they cited the fact that travelers are even enjoying trips under the government’s tourism campaign.
University students tend to engage in a broad range of activities. They also have frequent opportunities to attend gatherings that involve drinking. And they come under heavy fire when they happen to set off a group infection.
University authorities are therefore cautious about normalizing campus life, partly also under pressure from society at large. It is understandable that students have doubts about that trend and stance, feeling discontented.
Students, and particularly those in science and practical training majors, are also unhappy that they are being called on to pay tuition, facilities and equipment fees and other charges just like in other years.
More than a few students are weighing the option of taking a leave from, or quitting, their universities, all the more because they are harder up for money due to fewer opportunities for working part time, sources said.
The government has granted 100,000 yen to 200,000 yen ($947 to $1,894) in relief payments to cash-strapped students. Many universities have also taken steps to address the issue, including by setting up their own relief payment systems and mental health counseling services.
Society, however, has seldom paid enough attention to the tough circumstances surrounding university students, since the coronavirus crisis has been affecting all other walks of life.
Some of the problems could be resolved when face-to-face classes are resumed. Campus life, however, is unlikely to return completely to its previous state any time soon. The state of the economy is not likely to recover immediately, either.
The government should study the reality of students and prepare for problems that have yet to arise in working out necessary assistance measures for them.
It is heartening to learn that some students are setting out on their own to break out of their plight.
Yujiro Tatsuno of Kochi University and his colleagues, for example, worked to set up a project for linking students in need of an income with farmers in need of workers.
The program was initially aimed at proposing jobs with low risk of COVID-19 infection. It turned out, once the project was under way, that students obtained emotional support from interactions with farmers.
Students across Japan, among other things, are also providing online counseling services to their juniors who are new in their universities. Such activities work effectively where counseling services of the universities don’t, because students are emotionally close to each other and find it easier to lay bare their feelings to their fellow students.
Universities and the regional communities that host them should back up attempts to turn the coronavirus crisis into an opportunity for brushing up skills to overcome difficulties.
(The Asahi Shimbun)
September 28, 2020
Source:
http://www.asahi.com/ajw/articles/13767441
MENA
657-43-03/Poll
Why is it so hard to eliminate corruption in Lebanon?
Although Lebanon is an upper-middle-income country, the Lebanese state has been unable to deliver satisfactory levels of social welfare and public services. Electricity provision, for example, is the fourth worst in the world. In the same vein, a report from the World Bank concludes that the country’s water supply services are below the levels expected in a middle-income country. The report traces the poor quality of service delivery to elite capture and endemic corruption, which have negatively affected living conditions and quality of life.
Considering these outcomes, it is unsurprising that data from Arab Barometer show that 91 percent of Lebanese say that corruption in national state agencies and institutions exists to a large or medium extent. Additionally, a vast majority in each sect holds this view, demonstrating that this concern is shared across a major political divide.
There are a number of reasons Lebanon has not witnessed accountable government and low levels of corruption. A full account would go beyond the scope of this blog. However, social scientists have shown that high levels of corruption result from low levels of social trust. As such, what, if anything, can levels of social trust tell us about Lebanon’s current predicament?
What role does social trust play?
Social trust refers to the belief in the honesty, integrity, and reliability of other members of society. Evidence shows that social trust facilitates reliable behavior and cooperation among individuals that do not know each other, helping to promote conditions conducive to economic growth, democratic government, low levels of corruption, and the fair provision of public goods.
However, exhibiting trust makes little sense unless it reflects a general condition of trustworthy behavior in society. In a low-trust society, for example, a person is incentivized to pay a bribe to a government official for fear that not doing so might yield a far worse outcome. Although everyone would be better off if they do not pay a bribe, it is difficult to break the cycle of corruption without higher levels of trust. In other words, society is trapped in a “low-trust equilibrium” in which everyone is worse off, but no one can break out. In comparison, a person in a high-trust society is far less likely to engage in such practices and likely to fear that paying a bribe would lead to worse consequences than adhering to legal regulations.
High levels of social distrust in Lebanese society
Data from Arab Barometer reveal that Lebanon is a low-trust society. About 95 percent say one must be very careful in dealing with people, reflecting a general feeling unanimously shared by all Lebanese. Both the results and the concept of social trust suggest Lebanese society may find itself in such a “collective action problem”.
Social distrust is found not only on the individual level, but also at the group level. Lebanon shows high levels of social distrust among sects, reproduced by the country’s sectarian system.
Consistent to the concept of social trust and the experiences of other societies, members of each sect would be better off if they acted collectively to solve this problem. However, even though data from Arab Barometer suggest that a majority of Lebanese think that the government does not do enough to combat corruption, they can never be sure that others will take advantage of them by not securing state resources to themselves. As is common among any competing groups, expectations are that other sects are poised to take advantage of each other, leading to behavior that reinforces these outcomes.
Social distrust is deeply embedded in Lebanese political culture, lowering the chances for social cohesion and collective action. That might be one reason Lebanon has not seen the formation of a broad reformist coalition group, which pushes forward political reforms in the public sector. Further research is required to analyze the factors determining social trust and corruption in Lebanon. In particular, the effect of Lebanon’s institutional arrangement on levels of social trust and the Lebanese’s ability to act collectively should be on the focus of further inquiry.
(Arab Barometer)
September 24, 2020
Source: https://www.arabbarometer.org/2020/09/why-is-it-so-hard-to-eliminate-corruption-in-lebanon/
AFRICA
657-43-04/Poll
Kenyans experience increased deprivation of basic necessities, Afrobarometer surveys show
More Kenyans are frequently going without basic necessities such as enough food and clean water, according to Afrobarometer survey findings.
At least half of all Kenyans reported going without enough food, enough clean water, and needed medical care at least once during the year preceding the survey. Compared to 2016, the proportion of Kenyans who experienced frequent shortages of basic necessities, or high levels of “lived poverty,” increased in 2019, while fewer citizens experienced no such deprivation.
The survey also found that poorer citizens were less likely than their better-off counterparts to have access to key service infrastructure and to be optimistic about economic conditions improving during the coming year.
(Afrobarometer)
September 28, 2020
657-43-05/Poll
Most Angolans give the government poor marks on economic management, Afrobarometer survey shows
A large majority of Angolans say the government is doing a poor job on unemployment, improving living standards of the poor, and other economic issues, according to the most recent Afrobarometer survey. More than three-quarters of Angolans give the government bad marks on maintaining price stability, and almost as many are critical of its overall economic management. Residents of Luanda and Cabinda are particularly critical of the government’s economic performance. Citizens’ assessments of the government’s economic performance highlight the challenges Angola faces in achieving United Nations Sustainable Development Goals (SDGs) No. 8 (“Decent work and economic growth”) and No. 10 (“Reducing inequalities”).
(Afrobarometer)
September 25, 2020
657-43-06/Poll
Almost 7 In 10 Nigerians Describe The Security Situation In The Country As Bad
A new public opinion poll conducted by NOIPolls has revealed that almost two-thirds (65 percent) of Nigerians nationwide do not consider the current security situation in the country to be good. Additionally, analysis of respondents revealed that the South-West region (71 percent) had the highest proportion of Nigerians who do not consider the security situation in the country unsafe, while the North-East zone (57 percent) had the lowest proportion of Nigerians in this category.
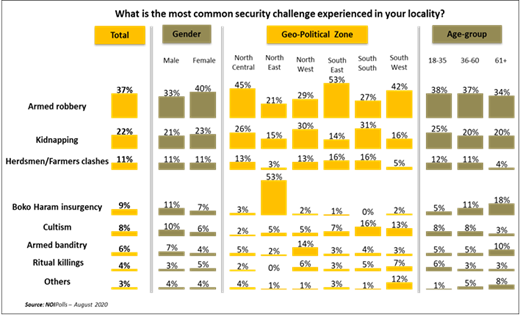
Furthermore, the survey revealed that the top three most common security challenges in localities across Nigeria was found to be: ‘Armed robbery’ (37 percent), ‘kidnapping’ (22 percent) and ‘Herdsmen / Farmers Clashes’. Also, a quick analysis of the prevalence of these top three common security challenges across geo-political zones shows that ‘armed robbery’ was more prevalent in the South-East zone (53 percent), while ‘Kidnapping’ was found to be more prevalent in the South-South zone (31 percent) and ‘Herdsmen/Farmers Clashes’ was more prevalent in the South-East zone (16 percent).
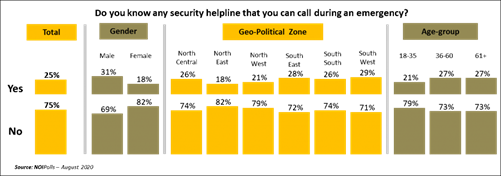
Also, the poll revealed that one-quarter (25 percent) of Nigerians nationwide are aware of a security helpline that they can call during emergencies. Alarmingly, comparing the results to that of a similar poll conducted by NOIPolls in 2018, analysis showed a 5-percentage point dip with respect to the proportion of Nigerians that are aware of security helplines to call during emergencies[1]. The challenge here is that three-quarters (75 percent) of Nigerians do not know or are not aware of security helplines to call during emergencies.
Moreover, the poll revealed that most Nigerians are willing to report security challenges in their localities. However, some Nigerians are not willing to report security challenges in their localities with worrisome reasons that need to be addressed. These reasons include: ‘I don’t want police problem’, ‘I don’t have time’, ‘it is none of my business’, ‘nothing will be done if I report’ and ‘I’m not interested’. Overall, these reasons show lapses like lack of synergy between the police and local host communities, a lack of trust in the ability of the police to curb security challenges, and to some extent lack of understanding regarding collective security responsibility by the governed and government.
Finally, the survey having gauged the perception of citizens on the state of security in the country, awareness of emergency security helplines and the general attitude of citizens with respect to reporting security challenges. Results revealed that a huge percentage of Nigerians do not think that the country is secure, it also reveals a poor attitude towards reporting security challenges. It is therefore pertinent that these challenges addressed expressly. These are the key highlights from the security poll conducted in the week commencing August, 17th 2020.
Survey Background
As the various security agencies continue work tirelessly to secure lives and property, a series of security challenges have continued to bedevil the country. These security challenges are not limited to any particular region but cuts across all regions thereby creating a sense fear across Nigeria due to their unpredictable nature. To put it clearly, there is a significant risk of terrorism, crime, inter-communal clashes, armed attacks and kidnappings in and across states in Nigeria[2].
Survey Findings
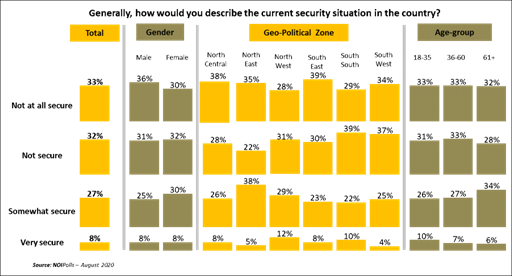
Overall, the survey revealed that only 35 percent (27 percent + 8 percent) of Nigerians nationwide described the security situation in the country as secure. Further analysis of respondents in this category showed that 8 percent described the security situation in the country as ‘very secure’, while 27 percent stated that the security situation is ‘somewhat secure’.
On the contrary, 65 percent (33 percent + 32 percent) of Nigerians nationwide do not think that the current security situation in the country is secure. Nigerians who held this opinion described the current security situation in the country as ‘not at all secure’ and ‘not secure’. Additionally, analysis of respondents who asserted that the security situation in the country is not secure across geo-political zones revealed the South-West region (71 percent) had the highest proportion of Nigerians that hold this believe, while the North-East zone (57 percent) had the lowest proportion of Nigerians in this category. This implies about 6 in 10 Nigerians in each geopolitical zone do not think that the county is secure.
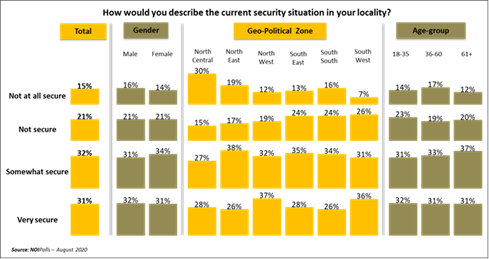
Consequently, the survey sought to determine what respondents think about the security situation in their localities. Hence, the analysis of results revealed that 36 percent of Nigerians nationwide described security situation in their localities as not secure: ‘not at all secure’ (15 percent) and ‘not secure’ (21 percent).
On the contrary, 63 percent of Nigerians nationwide described the security situation in their localities as secure. These categories of Nigerians described security situation in their localities as either ‘somewhat secure’ (32 percent) or ‘very secure’ (31 percent). This implies that slightly more than 6 in 10 Nigerians nationwide consider the security situation in their localities as secure.
Furthermore, the poll sought to determine the most common security challenges across Nigerian localities nationwide, and the analysis of survey results revealed that although there are several security challenges across localities nationwide. The top three most common security challenges in localities across Nigeria was found to be: ‘Armed robbery’ (37 percent), ‘kidnapping’ (22 percent) and ‘Herdsmen / Farmers Clashes.
In addition, the survey gauged the awareness level of Nigerians regarding security helplines to call during emergencies. The analysis of results showed that 25 percent of Nigerians nationwide are aware of a security helpline that they can call during emergencies. This implies that only one-quarter of Nigerians nationwide have or know a security helpline that they can all during an emergency. Comparing this result with that of a similar poll conducted in 2018 by NOIPolls shows a 5-percentage point dip in the percentage of Nigerians that are aware of security helplines to call during emergencies[3]. On the contrary, 75 percent of Nigerians nationwide are not aware of security helplinesto call during emergencies.
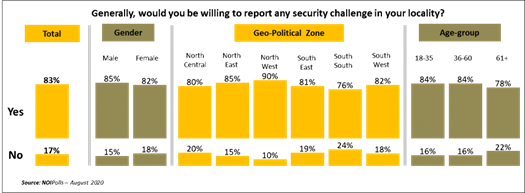
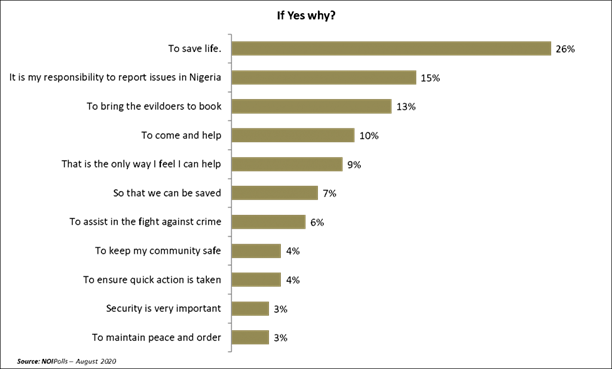
With respect to the willingness of Nigerians to report security challenges in their localities, the analysis of survey results revealed that overall 83 percent of Nigerians are willing to report any security challenges within their locality. This result is encouraging particularly in the endeavor of Community Policing, as it reveals the willingness of the general public to partner with law enforcement agencies to fight crime. If the majority of citizens are willing to report crime in their locality, it implies criminals will not have a safe haven to hide and perpetuate their nefarious activities.
The top three reasons why Nigerians are willing to report any security challenge in their locality were found to be: ‘to save life’ (26 percent), ‘it is their responsibility to report the issue’ (15 percent) and ‘to bring evil doers to book’ (13 percent).
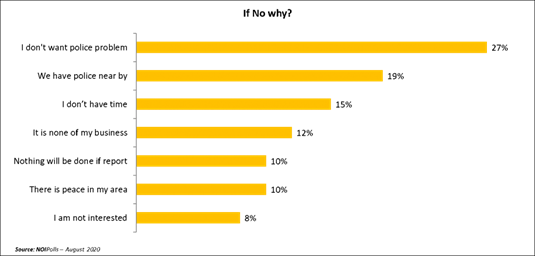
On the contrary, the top three reasons why Nigerians are not willing to report any security challenge in their locality were found to be: ‘I don’t want police problem’ (27 percent), ‘We have police nearby’ (19 percent) and ‘I don’t have time’ (15 percent).
Alarmingly, a quick glance at other reasons why Nigerians are not willing to report security challenges in their localities was quite worrisome as these reasons: ‘I don’t want police problem’, ‘I don’t have time’ , ‘it is none of my business’, ‘nothing will be done if I report’ and ‘I’m not interested’ all seem to depict a lack of synergy between the police and local host communities, a lack of trust in the ability of the police to curb security challenges and to some extent loss of understanding regarding collective security responsibility by the citizenry.
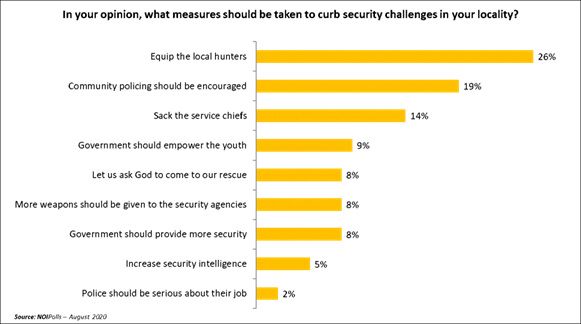
Finally, the survey explored the opinion of Nigerians regarding measures that should be taken to curb security challenges in their localities. Hence, the analysis of survey results revealed that 26 percent of Nigerians want ‘local community hunters to be equipped’, 19 percent of Nigerians stated ‘community policing should be encouraged’ and 14 percent of Nigerians want ‘service chiefs to be sacked’. These were the top measures opined by Nigerians with respect to curbing security challenges.
Conclusion
In conclusion, the poll results revealed that a most Nigerians believe that the country is not secure, and 75 of Nigerians nationwide do not know the security helplines to call during emergencies. Furthermore, attitudes towards reporting security challenges showed a willingness to report crime in their locality, in other words willingness to partner with law enforcement to fight crime. However, a significant proportion are not willing to report crime, and this may reflect a lack of synergy between the police and local host communities, as well as a lack of trust in the ability of law enforcement to curb security challenges. It may also reflect to some extent a loss of understanding regarding the collective security responsibility of the governed and government.
Finally, having brought this to fore, it is imperative that all stakeholders and security actors look into the issues raised by this poll and look for ways to improve the overall security situation in the country by deploying global best practices on the improvement in security.
(NOI Polls)
September 25, 2020
Source: https://noi-polls.com/security-situation-in-nigeria-poll/
EUROPE
657-43-07/Poll
83% of Spaniards are in favor of the legalization of abortion, 5 points less than in 2014
Spain is the third European country where support for the legalization of abortion falls the most, from 88% to 83%. Germany and France lead the decline in the percentage of the population in favor of the legalization of abortion in Europe, with 9 and 6 points less respectively. However, Europe is the world region that most supports the legalization of abortion, with Spain being the sixth country in the world ranking. Latin America is the region where less support is shown for legalization, but a change in trend is detected due to the influence of feminist movements in several countries.
On September 28, the Global Day of Action for access to Legal and Safe Abortion is celebrated, also known as the Day for the Decriminalization and Legalization of Abortion, with which it is intended to make visible the need to legalize abortion and facilitate access to abortion. itself, with the aim of preventing millions of women in the world from continuing to die from having abortions in unsafe conditions. The debate on the legalization of abortion is especially topical in some Latin American countries, and, although in Europe it seems outdated, the discrepancies on the limits of the law periodically jump to the present time.
Ipsos has been conducting a worldwide study since 2014 analyzing the opinions of citizens on the legalization of abortion thanks to which it is possible to know the evolution of support for this law in different countries, highlighting the influence of movements such as the feminist that every year it takes more strength, or the rise of the extreme right in several European countries that have also been able to change part of public opinion.
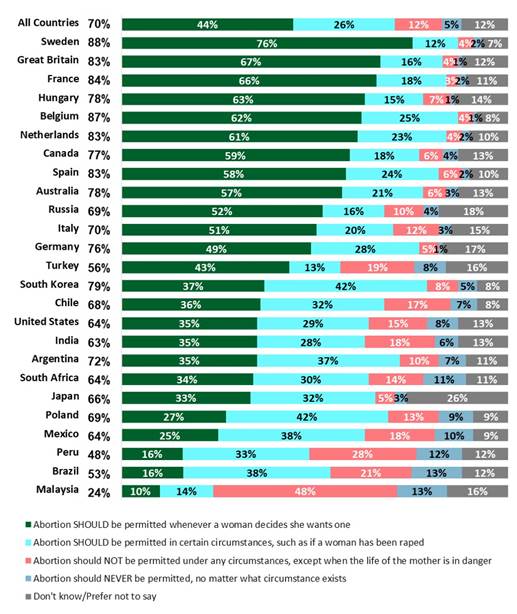
Worldwide, 70% of the population supports the legalization of abortion, 2 points less than in 2014, of which only 4 out of 10 support abortion without assumptions. In Spain currently 83% of the population is in favor of legalization, although 24% supports a law with assumptions. However, despite this vast majority, the percentage of Spaniards who believe that legal abortion has dropped by 5 points since 2014. However, Spain is among the 6 countries worldwide that shows the greatest support for legalizing abortion.
The case of Spain is not particular, but this decline is a trend at the European level, where Germany stands out, going from 85% of the population in favor of legalization in 2014 to 76% in 2020, followed by France, second country where the support of the population decreases the most with 6 points less. The only European country where the percentage of citizens in favor of legal abortion increases is Belgium, which goes from 85% in 2014 to 87% today.
Despite these general declines, Europe continues to be the region where the population shows the most support for legalizing abortion (80%), led by Sweden (88%), Belgium (87%), France (84%) and the United Kingdom , The Netherlands and Spain with 83%
At the global level, Latin America is at the bottom of the world with only 62% in favor, although this figure is expected to rise in the coming years since in countries such as Argentina support has risen 8 points since 2014 (72%) and in Mexico the increase reaches 13 points (64%), reflecting the results of the feminist mobilizations that have emerged in recent years.
World views on abortion
(Ipsos)
September 25, 2020
657-43-08/Poll
Ukrainians' expectations about the influence of countries and international organizations on world affairs and attitudes towards the United States
Most residents of Ukrainian cities expect a positive impact of "Euro-Atlantic" countries and organizations on world affairs in the next decade, while a small proportion of citizens expect this from Russia and Iran (24% and 21%).
In the new wave of the international study Global Advisor, conducted by
Ipsos in Ukraine and 28 other countries in June-July this year, in addition to
basic economic and socio-political issues, the people’s attitude to a sample of
16 countries and international organizations was also assessed. In
particular:
∙ Among the countries: Canada,
Germany, France, China, India, USA, Russia, Israel, Iran, Great Britain, Saudi
Arabia
∙ Among international
organizations: the UN, the European Union, the International Monetary Fund, the
World Bank
We asked respondents how these countries / organizations will affect world
affairs in the next decade - positively or negatively.
Interviewed Ukrainians tend to evaluate European democracies most positively
together with Canada: 82% are confident in the positive influence of Germany,
81% of Canada, 78% of Great Britain, and 76% of France. It is noteworthy that
Iran has the lowest positive expectations on a par with Russia - 21% and 24%,
respectively.
As expected, there are clear differences in this issue depending on the
region of residence: in the West and in the North, in general, the
representatives of the "Euro-Atlantic bloc" of countries and
organizations are treated more positive.
In particular, among the countries there is a significantly more positive
attitude to Canada (87% in the West with 81% in general), the United States
(77% in the West and North vs. 65% in total), the United Kingdom (89% in the
North vs. 78% in total). In the East, significantly fewer people have positive
expectations of Canada (73%), France (70%), and the United States (53%).
Among international organizations, the biggest differences between the regions
can be seen in the attitude towards NATO - it is expected to have a positive
impact on significantly more people in the North, West and Kyiv (77%, 77% and
76% respectively against 68% overall), significantly less in the East and South
(56% and 53%). The IMF is more positive treated in the West (66% vs. 58%) and
least positive in the South (46%).
Among the differences
in socio-demographic groups is the fact that women tend to have more positive
expectations of the IMF than men - 64% vs. 50%. Also, more affluent people
(middle-income and above-average income) respond better to the International
Monetary Fund - 64% vs. 55% among people with below-average incomes.
In the survey, we also asked people to compare the United States with
other countries in a number of statements that concerned the economy, human
rights, institutions, the United States' relations with other countries, and so
on.
First of all, Ukrainians rate the US economy higher than the economies of other
countries - 76% rated the United States "much above average" or
"slightly above average" on this indicator. In general, respondents
rated the United States higher in the context of things that are more about the
United States itself, such as the strength of the economy (76%), respect for
citizens' rights (63%), democratic values (62%), and living standards (62%). ),
attractiveness for investment (62%). They are much less likely to evaluate the
country positively in the international context - the least people agreed that
the United States respects its neighbors and other countries better than other
countries (37%).
It is worth noting
that, in general, the strength of democratic values / institutions and respect
for the rights of citizens / human beings were highly valued by most people on
a par with economic factors such as a strong economy, investment attractiveness
and living standards.
The largest differences in the assessment of the United States among those who
expect a negative impact of the United States on world events, and among those
who believe that this impact will be positive, is observed in the statements
regarding the impact on international socio-economic development (26%). against
77% respectively) and respect for human rights (20% vs. 69% respectively).
As with the overall assessment of the country's role over the next 10 years,
the United States rated more negatively in most statements in eastern Ukraine.
Compared to the entire sample, views differed most on the fact that the United
States contributes to the world economy (47% vs. 58% of the total population)
and international peace and cooperation (32% vs. 42%).
(Ipsos)
September 30, 2020
657-43-09/Poll
5 percent of Germans are planning a vacation abroad in the autumn holidays despite Corona
The autumn holidays are
approaching. Who is planning to drive away and whose plans the corona
pandemic thwarted, answered a current YouGov survey.
The autumn holidays will begin in the coming week in Hamburg, Hesse, Mecklenburg-Western Pomerania and Schleswig-Holstein. But only a small proportion of Germans have plans to travel: 70 percent of German respondents say they have no travel plans for the October weeks. 7 percent say they are changing their plans to travel abroad due to the Corona crisis. 2 percent say this about their travel plans within Germany.
However, 5 percent of the German respondents also state that they definitely want to start their planned trip abroad, and 9 percent do not want to give up their plans for a trip within Germany.
GEN Z IS MOST WILLING TO
TRAVEL DURING THE AUTUMN BREAK
Most frequently, respondents between the ages of 18 and 24 state that they do not want to do without their travel plans during the autumn vacation: 13 percent of Gen Z say that they want to start their vacation trip within Germany despite the pandemic (vs. 8 percent of respondents from 55 years). 10 percent of the Gen Z respondents stated that they still want to start their trip abroad. Respondents aged 55 and over are also the least likely to make this statement (3 percent).
(YouGov)
September 29, 2020
Source: https://yougov.de/news/2020/09/29/5-prozent-der-deutschen-planen-den-herbstferien-tr/
657-43-10/Poll
American presidential elections: a victory for Joe Biden desired by the French
The four years in power of Donald Trump have not succeeded in turning the opinion of the French in his favor: 69% of the population believe that the current President of the United States was a bad president during his mandate.
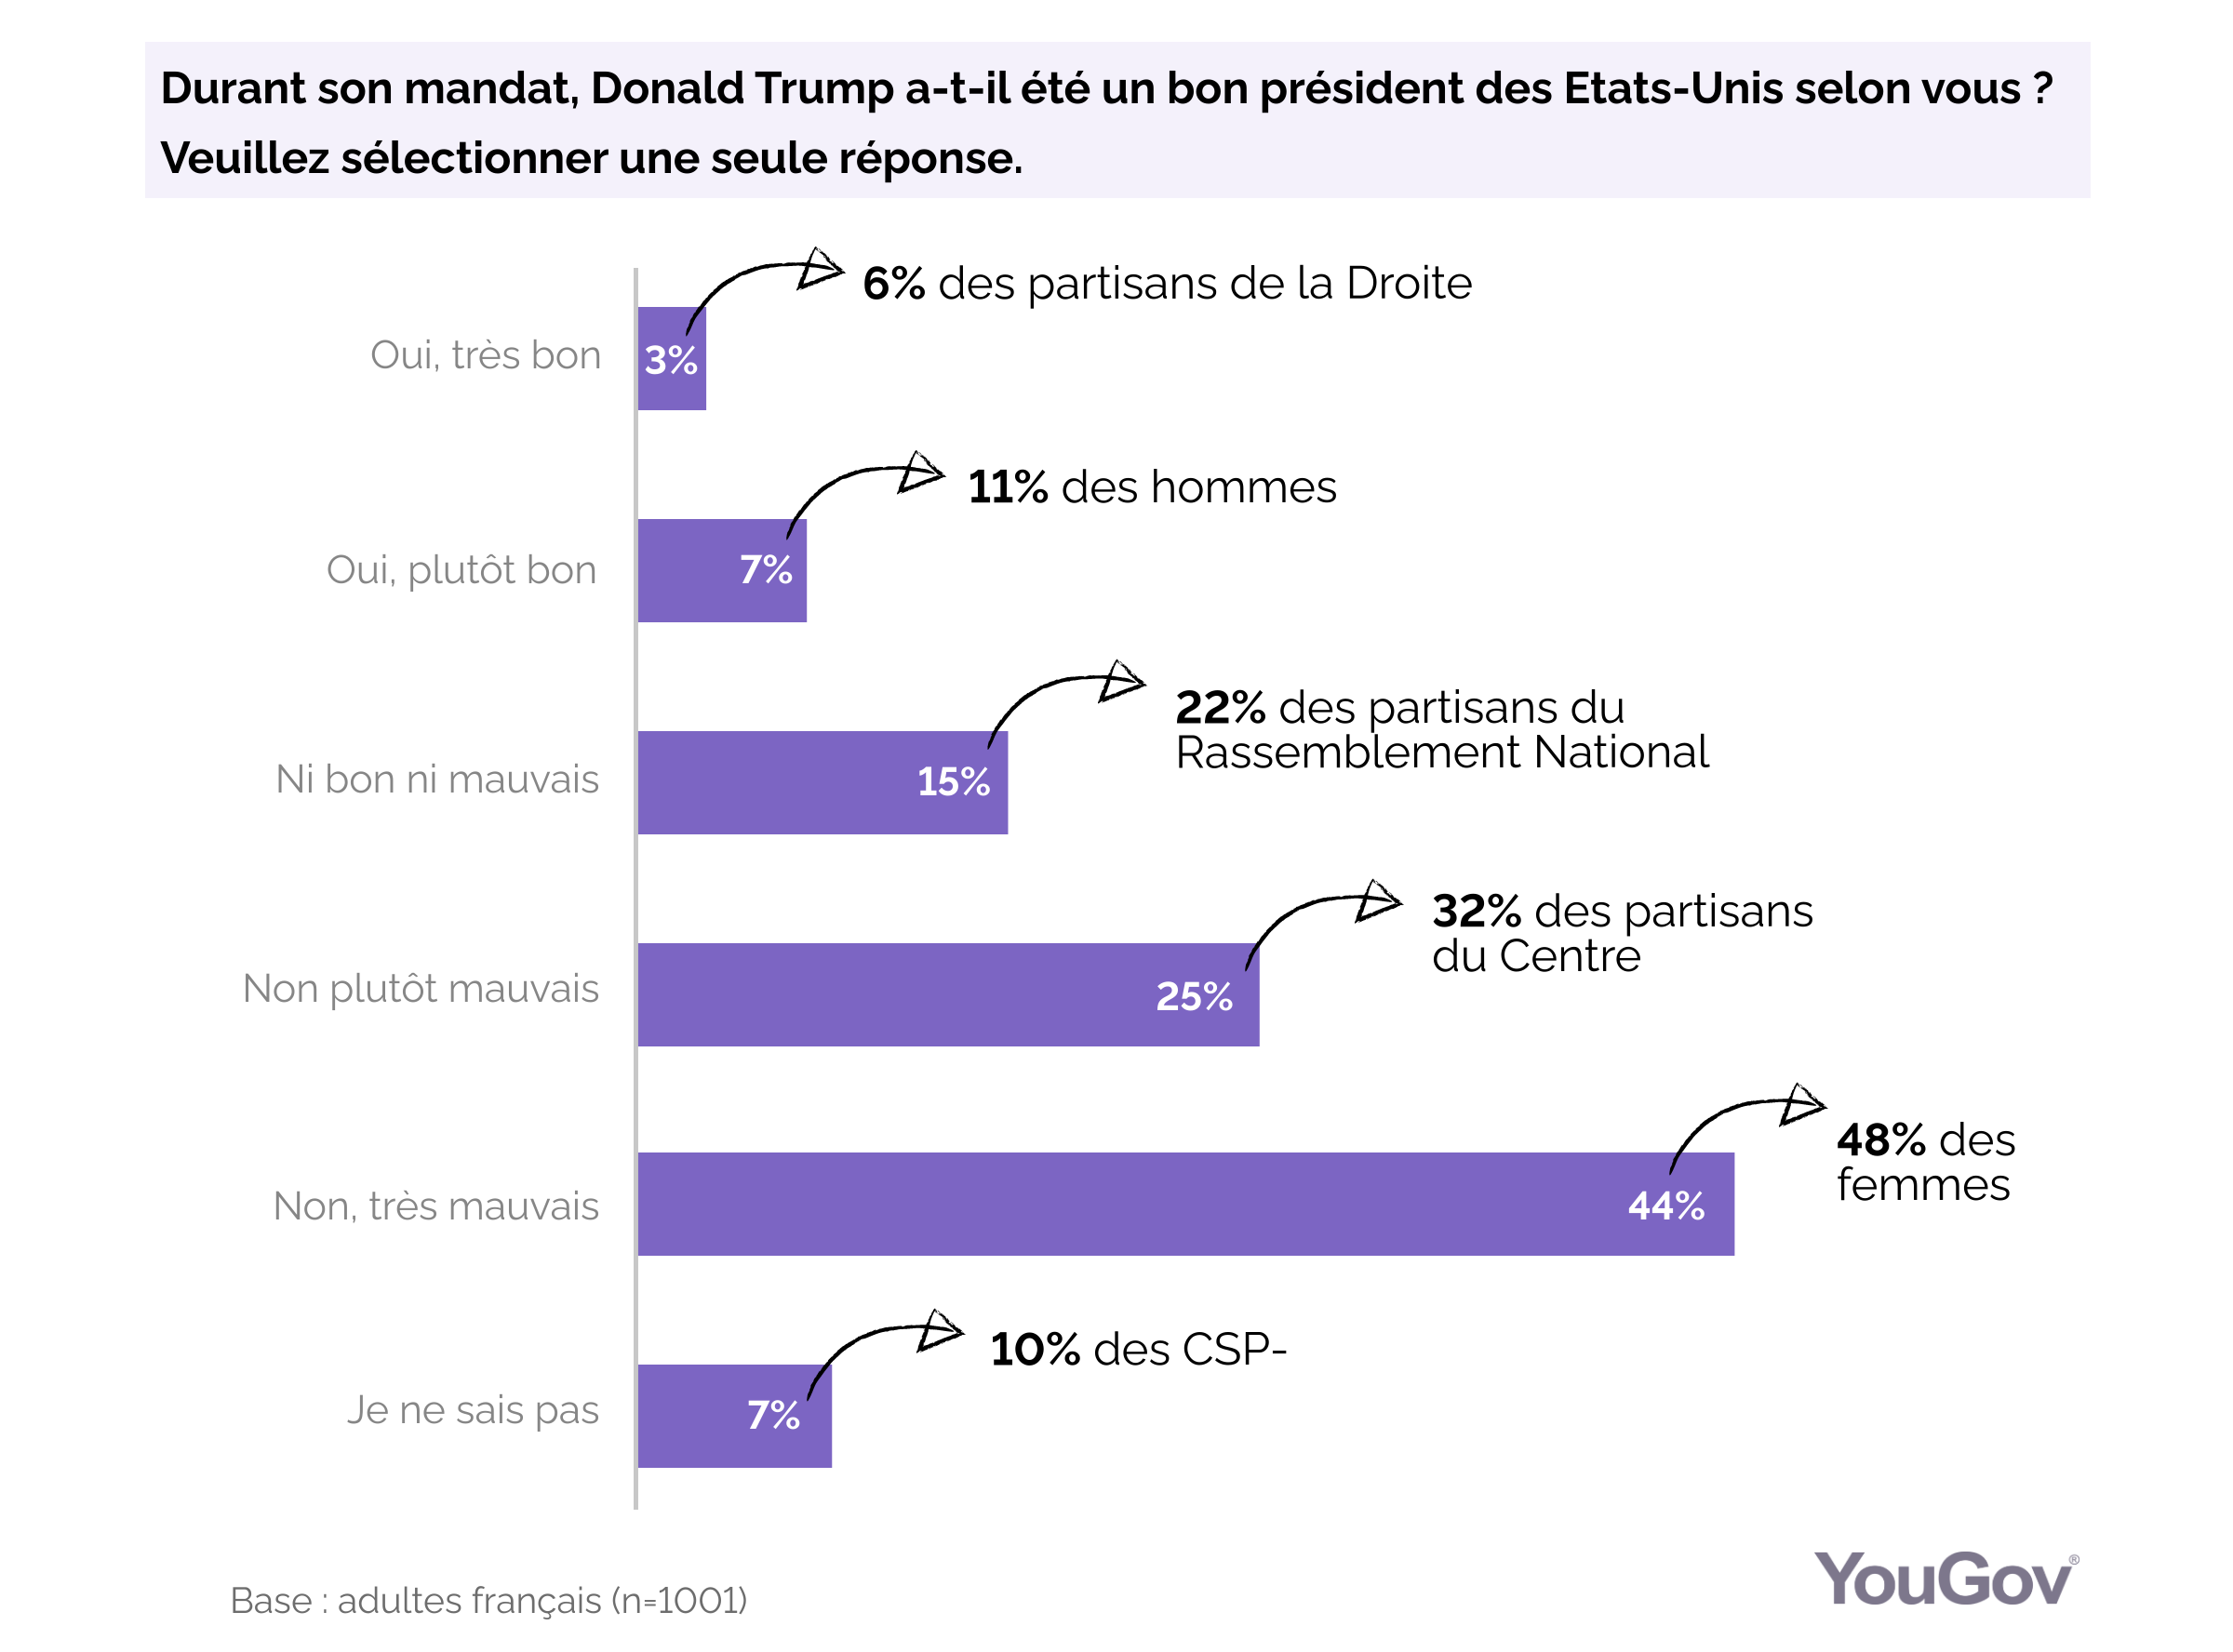
For 53% of the French, Donald Trump has badly defended the interests of his country during his four years in power. An opinion shared in particular among 18-24 year olds (70%), among students (69%) and among those who voted for Emmanuel Macron in the first round of the 2017 presidential elections (63%).
Note: nearly 6 in 10 French people (61%) say they wanted to see Donald Trump dismissed before the end of his mandate.
The French wish a victory for Joe Biden
This year, 4 in 10 French people (42%) say they are following the campaign for the American election: a trend seen on the rise among men (51% vs. 34% of women) and among those aged 55 and over (50% ).

The current American president is not very popular with the French since only 10% of the population claim to see him win the next American presidential elections. In contrast, his opponent Joe Biden announced as the favorite: almost one in two French (52%) was won by Democrat and wants to see it become the 46 th President of the United States. A more assertive choice among CSP + (61%) as well as among those with higher education (60%).
To note :
- 19% of the French do not want to see Donald Trump or Joe Biden win the next election and 19% of the French have no opinion on this subject.
- 33% of French people believe that Joe Biden's victory would turn things around for the better and 23% think his victory would not make a big difference.
Emmanuel Macron was he too accommodating to Donald Trump?
While 22% of French people say that Emmanuel Macron behaved well in the face of the American head of state, a third of the population (34%) find him too accommodating and 14% too confrontational.
(YouGov)
September 30, 2020
Source: https://fr.yougov.com/news/2020/09/30/elections-presidentielles-americaines-joe-biden/
657-43-11/Poll
Only a quarter of companies have taken action on racial inequality since Black Lives Matter protests
This is despite most (86%)
business decision-makers saying that companies have a role to play in tackling
racial inequality
The killing of George Floyd earlier this year in the US sparked a global wave of protests calling for action against police brutality and discrimination against ethnic minorities.
Companies on both sides of the Atlantic have made public statements of solidarity with grassroots campaign organisation Black Lives Matter and have declared their support to fighting racial inequality.
New YouGov research with business decision-makers uncovers that while over eight in ten (83%) would feel comfortable taking on racial discrimination in their workplace, just 26% say their organisation has taken new steps to improve diversity and inclusion as a result of the Black Lives Matter protests.
Likewise, a majority (55%) say that there had been no change on the prioritisation of achieving a good standard of internal diversity and inclusion in the workplace. Fewer than a third (30%) say that this has become more of a priority over the past year.
It may be the case that companies are still prioritising diversity and inclusion but believe that they are already doing an adequate amount in this area. This poll finds that a higher proportion (78%) of decision-makers feel that their organisation is meritocratic (that is to say, people are able to progress on hard work regardless of their background), than think that UK society as a whole is meritocratic (52%).
These beliefs are undermined by data from Business in the Community, whose recent update to their 2014 report Race at the Top found that just 1.5% of managers, directors and senior officials in the UK are black; an increase of just 0.5% over the last six years.
The government-commissioned McGregor-Smith Review in 2017 uncovered that while one in eight of the working age population are from a black, Asian or minority ethnic (BAME) background, just one in ten of the workforce are.
If those from minority ethnic backgrounds are still underrepresented in the workplace, particularly in high level positions, is it true that in general, organisations are truly meritocratic?
Could a belief that their workplace is meritocratic create complacency? YouGov’s poll finds that 85% of decision-makers feel either ‘very’ or ‘somewhat’ informed on the actions that they or their organisation can take to improve diversity, and a majority (53%) say they would not benefit from more guidance in this area.
(YouGov)
September 28, 2020
657-43-12/Poll
Majority support new lockdown measures, but it’s not helping the government
Public
tend to think latest measures will help reduce the spread of the
virus, but feel easing of restrictions in July happened too quickly
Throughout the coronavirus crisis we’ve found overwhelming support every time restrictions have been brought in to stymie the spread of the virus. This week is no exception, with the majority of the public supporting all six of the new measures affecting England that were announced this week.
Strongest support comes for the measures that are less restrictive on groups of people meeting, with 85% supporting the toughened rules around wearing face masks (85%), the advice to work from home when possible (85%) and pubs operating with table service only (82%).
Support for other measures introduced is slightly weaker, though closing pubs at 10pm (69%), reducing capacity at weddings (62%) and limiting indoor sport to six people (61%) are all still backed by a comfortable majority of the British public.
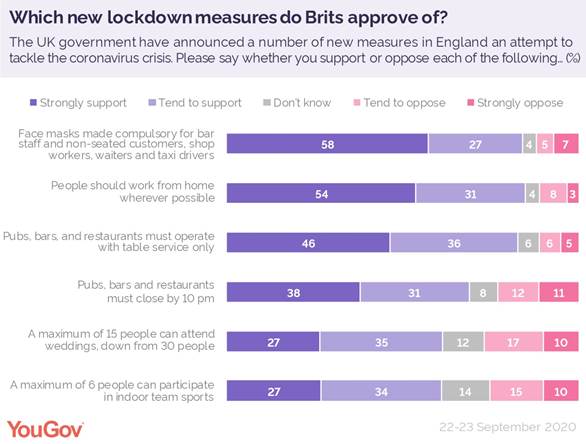
While there is support for the measures across all age groups, younger people are more divided with 35% opposing the decision to shut pubs early, and 31% opposing the new restriction of 15 people at weddings.
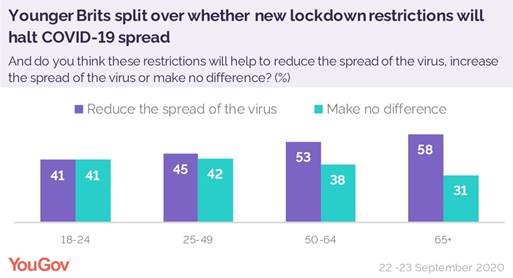
Part of the reason for this age divide may be down to differing views on the effectiveness of these measures. Overall, half of Brits (49%) think they will help to reduce the spread of the virus, while 38% think they will make no difference. However, the under-25s are completely divided with 41% saying they’ll reduce the spread and 41% saying they’ll make no difference. This contrasts with the over-65s who think the measures will make a positive difference by 58% to 31%.
Government approval
continues to fall
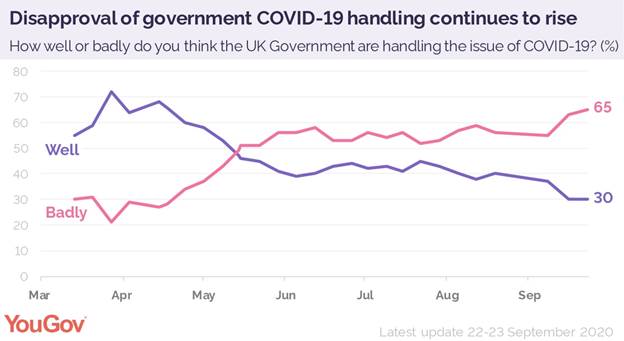
Despite continued support for lockdown measures, the public’s approval of the Government’s handling of the crisis has continued to fall. Just 3 in 10 of the British public think that the UK Government are doing well at tacking the crisis, compared to 65% who say they are doing a bad job. This net score of -35 is their lowest to date, down two compared to last week.
The Prime Minister’s own ratings when it comes to handing the crisis also make for grim reading, with just 32% saying they have confidence in him to make the right decisions compared to62% who say they don’t. Rishi Sunak fares better, with 44% having confidence in the chancellor vs 33% who do not.
The two highest profile civil servants working on the crisis, Chris Whitty (the chief medical officer) and Sir Patrick Vallance (the chief scientific officer) also continue to have the public’s confidence. Whitty is backed by 50% to 22%, while for Vallance it is 36% to 18%.
Why isn’t support for the new lockdown measures translating to a popularity boost for the government?
The high levels of public support the government held back in March and April this year now seem an age away, initially falling in late May around the time of the Dominic Cummings scandal and fell further still over the last few weeks as cases began to rise.
Ever since the initial lockdown it seems the public have been concerned that the government is not acting strongly enough. In late June the public was unsure on whether it was right to loosen the lockdown. Over the course of less than a week opinion flipped from thinking the pace was right by 47% to 37% thinking it was too fast, to 48% too fast and 37% about right.
Fast forward to this week and most people (57%) think that restrictions were indeed loosened too quickly. They likewise tend to believe that the new lockdown measures they welcome nevertheless don’t go far enough (45%, vs 32% who think they are about right).
The public also seem to think the government’s priorities are wrong when it comes to the delicate balancing act of protecting public health and staving off economic collapse. Asked about these conflicting priorities, just 27% think the government is currently getting the balance right. In contrast 38% think they are focussing too much on the economy while 16% think they are focussing too much on healthcare.
The public also strongly believe that the UK has handled the coronavirus outbreak less well than other countries have; indeed a survey conducted in July showed that Britons think the UK is among the top 4 most badly damaged countries.
All of this taken together shows that the damage to the government’s reputation runs deep too deep for one popular announcement to restore. The road to recovery for Boris Johnson is a long one.
(YouGov)
September 25, 2020
657-43-13/Poll
Three in five Brits have had the same current account for over ten years
Most Brits still stick with
their current account for decades - but one in eight (13%) have switched in the
past three years
There is an old adage that an Englishman is more likely to change his wife than his bank account. Results from YouGov Profiles reveal that this saying may be based on a foundation of truth. Despite initiatives like the Current Account Switch Guarantee and banks offering upfront cash and better interest rates to switchers, consumers are still reluctant to change their main current account.
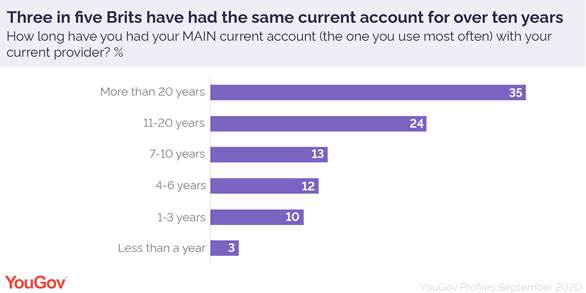
Over a third of Brits have had the same current account for over 20 years (35%), while a quarter (24%) have had it for 11-20 years. Another one in four people (24%) have banked with the same provider for 4-10 years.
Meanwhile, a tenth of consumers changed their account in the last one to three years, while a tiny minority (3%) say they have switched less than a year ago.
Some 13% plan to switch or
open a new account in the next 12 months
While many banks have stopped or dialled back their switchers’ deals during the pandemic, 7% of the public say they’re likely to change their main current account within a year. Another 6% expect to open a new additional account.
But Britain’s Big Four – Barclays, HSBC, NatWest and Lloyds – are all high in consideration with these consumers, while Monzo is the only challenger bank to make the top 15.
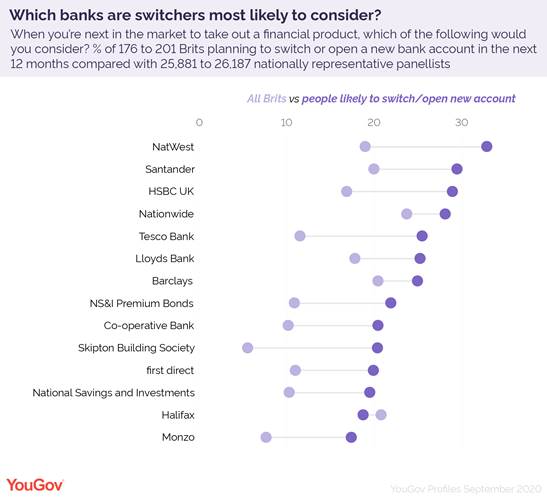
A third of people planning to switch or open a new account (33%) would consider NatWest – the highest of any bank. This compares with a fifth of the general population (19%).
Santander and HSBC, which currently offers switchers £125 to open an account, share second place at 29%.
Nationwide comes third at 28%. Meanwhile, Tesco Bank, which is twice as popular with this segment as the wider public, at 25% vs 12%, is also popular.
Another outlier is Skipton Building Society, which ranks 10th in popularity among people likely to switch or branch out, with a fifth (20%) saying they would consider it. This compares with only 6% of all Brits.
One in six (17%) would consider Monzo. While some way from the top, the challenger bank is much more popular among those considering switching or opening an additional account than with all Brits (8%).
(YouGov)
September 27, 2020
NORTH AMERICA
657-43-14/Poll
Life Ratings Among Black Americans Erode During Trump Era
The percentage of Black Americans who evaluate their lives well enough to be considered "thriving" has eroded since 2016, dropping to 48.1% in 2020. This is down nearly 10 percentage points since the recorded high mark of 57.9% in 2010 and is down five points since 2016. These results are based on new data from the Gallup National Health and Well-Being Index, which began measurement in 2008.
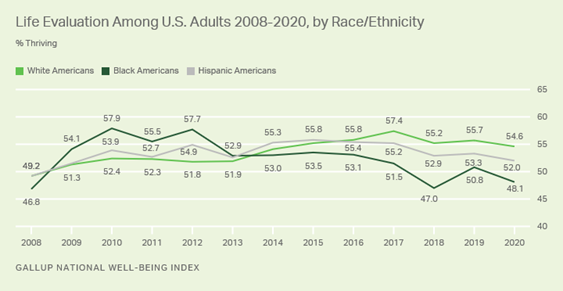
Line graph. The percentages of Americans who are classified as thriving from 2008 through 2020, by race and ethnicity. 54.6% of White Americans are classified as thriving, compared with 52% of Hispanic Americans and 48.1% of Black Americans.
After improving to 57.4% in 2017, the percentage of White adults classified as thriving has since held steady around 55% in the years since, roughly matching levels found in 2015-2016. Hispanic adults, in turn, have slid 3.4 points since 2016 to 52.0%, the lowest thriving level since 2009. Of the three groups, Hispanic Americans have had the most stable thriving percentages since the Well-Being Index measurement began in 2008.
The most recent results measure, captured July 30-Sept. 3, 2020, is based on 2,321 U.S. adults surveyed by mail and web.
Gallup classifies Americans as "thriving," "struggling" or "suffering" according to how they rate their current and future lives on a ladder scale with steps numbered from 0 to 10, based on the Cantril Self-Anchoring Striving Scale. Those who rate their current life a 7 or higher, and their anticipated life in five years an 8 or higher, are classified as thriving.
In 2008, the first full year of the Great Recession, the overall U.S. thriving percentage for the full year was 48.9%, improving to 51.6% in 2009 and 53.2% in 2010. While White and Hispanic adults improved modestly during this two-year period, Black Americans provided the greatest lift to the overall upturn, gaining about 11 percentage points from 46.8% to 57.9%, perhaps in part in response to the historic election of Barack Obama to the presidency. Later, about half of this improvement had eroded during Obama's second term.
Overall Thriving Percentage Holds Steady at Lower Level
Amid a general erosion in life ratings among Black and Hispanic Americans since 2016, the mercurial movement of the thriving percentage in 2020 over the course of the COVID-19 pandemic has now leveled off around 53% since early June, in line with earlier national web polling from the Gallup Panel. This follows a nearly 10-point drop from the spring of 2019 to late April 2020 when the thriving percentage fell to 46.4%, matching its previous lowest level from November 2008.
Testing has shown highly convergent results in the national thriving estimates between the Gallup Panel and the Gallup National Health and Well-Being Index, allowing for comparability.
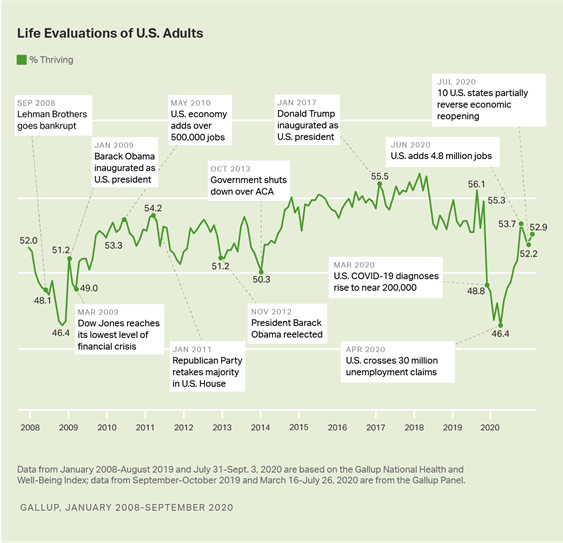
Line graph. The percentages of Americans classified as thriving from 2008 to 2020. Currently, 52.9% of Americans are now classified as thriving.
COVID-Era Spikes in Daily Stress and Worry Continue to Recover
Gallup also tracks whether Americans have experienced specific emotions, including stress and worry in their daily life.
The percentage of people who reported experiencing significant stress and worry the day before showed unprecedented increases in the first half of March, with stress rising 14 percentage points to 60% and worry rising 20 points to 58%. Experiences of these emotions have subsequently leveled off at an elevated level in the months since. The most recent estimates now show significant daily stress still being experienced by 55% of the adult population, about one-third of the way recovered to pre-COVID levels. Daily worry, in turn, is current estimated to be experienced by 47%, recovered about one-half of the way.
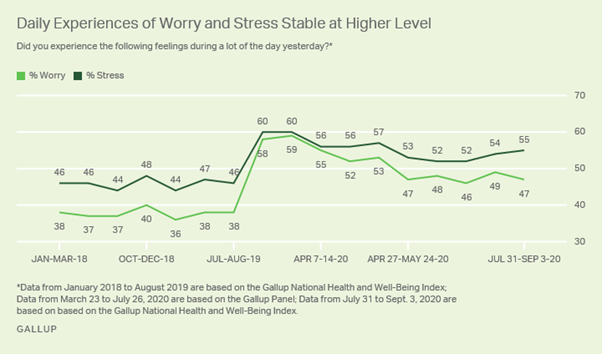
Line graph. The percentages of Americans who experience worry or stress yesterday. 55% of Americans report having experienced stress yesterday, and 47% say they experienced worry.
Implications
The national decline in the Well-Being Index score in 2017 was driven by significant drops among Black and Hispanic Americans. (The Well-Being Index score includes the ladder questions but also many more metrics across five elements of wellbeing.) This drop occurred even as key economic metrics closely related to wellbeing improved during the same period, including unemployment, perceptions of standard of living, confidence in the economy and optimism about spending, and was ultimately characterized by an unprecedented decline in 21 states compared to the year before.
Prior research had shown an additive effect in both race and political identity in how various U.S. subgroups changed the way that they evaluated their lives in the aftermath of regime changes in the presidency. Black Democrats, followed by White Democrats, reported the greatest jump in thriving percentages in the two years following the inauguration of Obama while White Republicans reported a decline during the same period.
In a year that suffered the dual effects of a global pandemic coupled with domestic racial unrest primarily catalyzed by the killing of George Floyd, it is unsurprising that the thriving percentage now is suppressed compared with last year for White, Black and Hispanic adults alike. For Black Americans in particular, however, the decline in general life ratings since 2016 is particularly acute and points to assessments of this group's quality of life that stand apart from the other two groups.
Belief among Black adults, for example, that their children will have as good a chance as White children in the same community to get a good education has reached an all-time low, as has a belief in racial equality in affordable housing. And only 59% of U.S. adults report that the civil rights of Black adults have improved in their lifetime -- down from 87% just seven years earlier -- while 82% of Black Americans now believe that new civil rights laws are needed, up from 53% during the same period of time.
(Gallup USA)
September 24, 2020
Source: https://news.gallup.com/poll/320810/life-ratings-among-black-americans-erode-during-trump-era.aspx
657-43-15/Poll
Democrats Regain Favorability Edge Over GOP
Americans' opinions of the Republican Party have soured since January but are similar to what they were a year ago. Meanwhile, Americans' favorability ratings of the Democratic Party (47%) have been stable and again surpass those of the GOP (42%).
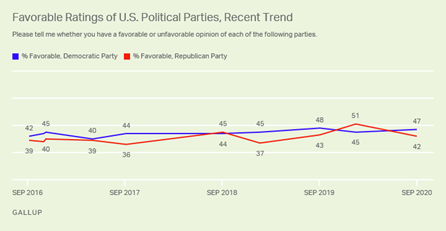
Line graph. More Americans have a favorable opinion of the Democratic Party than the Republican Party, a change from January. During most of the past four years, the Democratic Party has been viewed at least slightly more positively than the Republican Party.
These results are based on Gallup's annual Governance poll. In recent years, Americans have not held either party in high esteem -- the 51% January rating for the Republican Party amid President Donald Trump's impeachment trial was a rare majority-level positive reading for either party.
Before January, Republican favorability had not exceeded 50% in 15 years. The Democratic Party has not had a favorable rating of 50% or above since 2012, immediately after Barack Obama's reelection as president. Before 2005, majority positive readings for one or both parties were the norm.
Four years ago, when Trump and Hillary Clinton were campaigning for president, Americans' views of both parties were slightly less positive than today, with Democrats still holding a slight advantage in favorability, 42% to 39%.
Americans Increasingly See Parties as Too Extreme
In an era of intense partisanship, the public has increasingly come to view both parties as being "too extreme" rather than "generally mainstream." Forty-seven percent now see the Republican Party as too extreme, and 42% say the same about the Democratic Party. Both figures are up about 10 percentage points since Gallup last asked the question in 2004, and even more from 2000, when the question was first asked.
Still, a slim majority of Americans believe the Republican Party is in the mainstream, and a higher 57% say the same of the Democratic Party.
Americans' Perceptions of the Political Parties' Views and Policies
Finally, thinking again about the political parties, overall, would you describe the views and policies of -- [RANDOM ORDER] -- as too extreme, or as generally mainstream?
|
2000 |
2004 |
2020 |
||||||||||||||||||||||||||||||||||||||||||||||||||||||||||||
|
% |
% |
% |
||||||||||||||||||||||||||||||||||||||||||||||||||||||||||||
|
Republican
Party |
||||||||||||||||||||||||||||||||||||||||||||||||||||||||||||||
|
Too extreme |
35 |
37 |
47 |
|||||||||||||||||||||||||||||||||||||||||||||||||||||||||||
|
Generally mainstream |
57 |
59 |
52 |
|||||||||||||||||||||||||||||||||||||||||||||||||||||||||||
|
Democratic
Party |
||||||||||||||||||||||||||||||||||||||||||||||||||||||||||||||
|
Too extreme |
26 |
34 |
42 |
|||||||||||||||||||||||||||||||||||||||||||||||||||||||||||
|
Generally mainstream |
67 |
62 |
57 |
|||||||||||||||||||||||||||||||||||||||||||||||||||||||||||
|
2000 and 2004 results are based on an average of two surveys conducted each year. |
||||||||||||||||||||||||||||||||||||||||||||||||||||||||||||||
|
GALLUP |
||||||||||||||||||||||||||||||||||||||||||||||||||||||||||||||
Democrats and independents show similar increases in the perception that the GOP is too extreme, with a 15-point increase since 2004 among Democrats (from 64% to 79%) and a 12-point increase among independents (from 40% to 52%).
Most of the change in views of the Democratic Party has come among Republicans, with 88% now saying the Democratic Party is too extreme, up from 64% in 2004.
A separate question measuring the perceived extremism of the two major-party presidential nominees finds 40% of Americans saying they are "very concerned" that Donald Trump "may be too closely aligned with people who hold radical political views," while 31% say the same about Joe Biden.
Trump is far more likely to be viewed as aligned with radicals than either Barack Obama (28%) or John McCain (17%) was in 2008, the last time Gallup asked this question.
Republicans Rated No Worse Than Democrats on Prosperity, Security
Although the Democratic Party has a more positive image than the Republican Party, Americans believe the GOP is no worse, if not better, than the Democratic Party for keeping the country safe from external threats (50% versus 46%, respectively) or for keeping the country prosperous (47% versus 48%).
The Republican Party has typically fared better than the Democratic Party on the security issue, but the current four-point GOP advantage is among the smallest Gallup has measured since it first asked the question in 2002. Americans thought the Democratic Party was better on the issue in 2007; the parties were tied in 2012; and the Republican Party had a two-point edge in 2006.
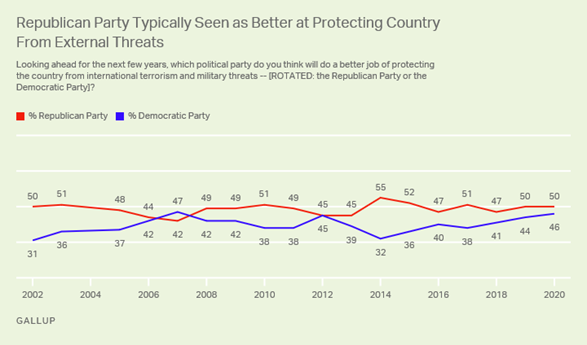
Line graph. Americans, by 50% to 46% in 2020, say the Republican Party will do a better job of protecting the country from international terrorism and military threats. In most years, Republicans have held an advantage on this, with the largest being 55% to 32% in 2014. Democrats had an advantage only in 2007, 47% to 42%.
The Democratic Party trailed the Republican Party for keeping the country prosperous during much of Barack Obama's presidency and early in Donald Trump's presidency, but it led during most of George W. Bush's time in office.

Line graph. Forty-eight percent of Americans believe the Democratic Party and 47% believe the Republican Party will do a better job of keeping the country prosperous. Republicans have led on this measure for most of the past 10 years, while Democrats led the prior six years.
Where Americans clearly give the Democratic Party an edge is in being better able to deal with the problem they think is most important. By 47% to 39%, Americans say the Democratic Party can better handle whatever they personally consider to be the most important problem, particularly if they name the coronavirus pandemic, which ties with "the government" as the most-commonly mentioned issue.
Majority Says Third Party Is Needed
Americans' frustration with the parties is evident in the 57% of Americans saying a third party is needed, while 40% think the two major parties are doing an adequate job of representing the American people.
Americans tended to be more positive about the performance of the parties before 2010 -- with the exception of 2012, after the Democratic convention that year.
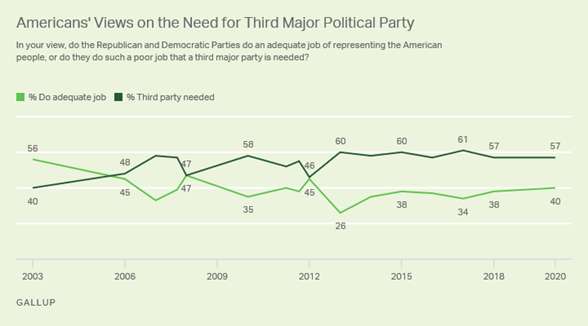
Line graph. Fifty-seven percent of Americans in 2020 say a third major party is needed, while 40% say the two major parties do an adequate job of representing the American people.
As has been the case historically, political independents (72%) are much more likely than Democrats (52%) and Republicans (40%) to say a third party is needed.
Bottom Line
The Democratic Party is heading into the final weeks of the presidential election campaign with a more positive image than the Republican Party, something that was not the case earlier this year during the impeachment hearings. The coronavirus pandemic, or, more specifically, Trump's handling of it, has arguably been a major factor in improving the Democratic Party's positioning this year. At a time when 14% of Americans are satisfied with the way things are going in the country, but the GOP is seen as no worse than the Democratic Party on matters of security and prosperity, a greater focus on those issues may help the GOP improve its long odds of winning the 2020 presidential election.
(Gallup USA)
September 24, 2020
Source: https://news.gallup.com/poll/320804/democrats-regain-favorability-edge-gop.aspx
657-43-16/Poll
Economics Alone Don't Tell the Full Story of Poverty
Poverty is often measured in economic terms. In fact, the most popular poverty statistic is based on a financial calculation. It looks at the number of workers that live on less than $2 per day. And that figure -- is 8%.
But is that how many people in the world are suffering?
Poverty is multidimensional. And the dimension that receives the least amount of attention is behavioral. This behavioral dimension goes by a few other names -- such as happiness and subjective wellbeing. Regardless of what you call it -- the names mean the same thing. Wellbeing is a statistical representation of people reporting how their lives are going.
Gallup measures wellbeing in almost every country, every year. And this research helps answer one of the world's biggest questions -- what percentage of the world's adult population is "suffering"?
In 2007, Gallup found that 9% of people around the world rated their lives so poorly they were considered suffering. Now, it's 17%. A record high in the history of our tracking.
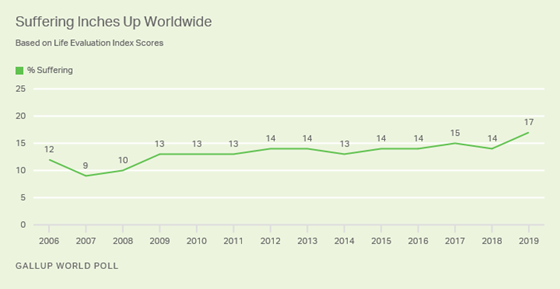
More than one in six people worldwide rated their lives poorly enough to be considered suffering in 2019. This represents a new high for the past decade of Gallup World Poll surveys.
And suffering isn't the only thing that has reached a record high. People are experiencing more anger, more sadness, more worry and more physical pain than at any point in Gallup's history of global tracking.
Much of this suffering stems from people being unable to meet their basic needs. When asked, "Have there been times in the past 12 months when you didn't have enough money to provide adequate shelter or housing for you and your family?" three in 10 people around the world say "yes" (another record high in Gallup's tracking). When asked, "Have there been times in the past 12 months when you didn't have enough money to buy food that you or your family needed?" 35% percent of people worldwide say "yes" (yet another record high).
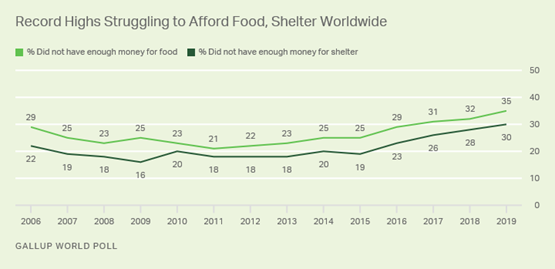
In 2019, the percentage of people worldwide who said they struggled to afford food and shelter rose to a new high. When asked, "Have there been times in the past 12 months when you didn't have enough money to provide adequate shelter or housing for you and your family?" 3 in 10 people said yes. When asked, "Have there been times in the past 12 months when you didn't have enough money to buy food that you or your family needed?" 35% said yes.
But I haven't told you the worst news. The worst news is that all of these record highs recorded by Gallup were collected one year before COVID-19 ravaged our world. That means these figures are only going to get worse.
The United Nations and global governments are making incredible progress in the war against poverty. But to achieve an absolute victory in this war -- world leaders cannot rely solely on economic indicators; they also need to know what people are thinking.
(Gallup USA)
September 24, 2020
Source: https://news.gallup.com/opinion/gallup/320912/economics-alone-don-tell-full-story-poverty.aspx
657-43-17/Poll
61% of Americans Support Abolishing Electoral College
Heading into the 2020 presidential election, three in five Americans favor amending the U.S. Constitution to replace the Electoral College with a popular vote system, marking a six-percentage point uptick since April 2019. This preference for electing the president based on who receives the most votes nationwide is driven by 89% of Democrats and 68% of independents. Far fewer Republicans, 23%, share this view, as 77% of them support keeping the current system in which the candidate with the most votes in the Electoral College wins the election.
Americans Favor Using Popular Vote to Elect President
Thinking for a moment about the way in which the president is elected in this country, which would you prefer -- to amend the Constitution so the candidate who receives the most total votes nationwide wins the election, or to keep the current system, in which the candidate who wins the most votes in the Electoral College wins the election?
|
Amend
the Constitution |
Keep
current system |
|
|
% |
% |
|
|
Total U.S. adults |
61 |
38 |
|
Republicans |
23 |
77 |
|
Independents |
68 |
31 |
|
Democrats |
89 |
10 |
|
GALLUP, AUG. 31-SEP. 13, 2020 |
||
Gallup has periodically measured public attitudes about the process of electing the president using this question since shortly after the 2000 election when George W. Bush won the electoral vote, and Al Gore won the popular vote. The latest findings, from an Aug. 31- Sept. 13 Gallup poll, are similar to readings after the 2000 election and in 2004 and 2011.
Of the seven times this question was asked over the past two decades, support for amending the Constitution to abolish the Electoral College only fell below the majority level once -- in November 2016 after Donald Trump won the electoral vote and Hillary Clinton the popular vote. At that point, 49% of Americans wanted the current system to be replaced, and 47% wanted it to remain in place. By 2019, support for using the national vote totals over the Electoral College had risen to 55%.
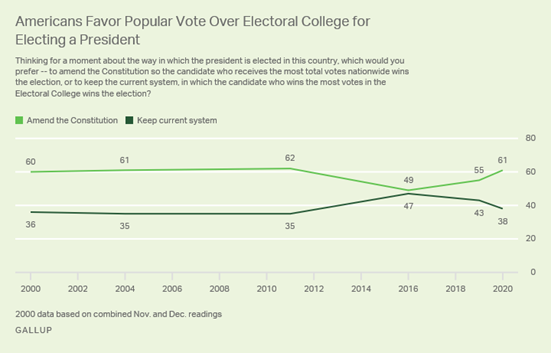
Line graph. Americans' preference for the way to elect a president in the U.S. since 2000. Currently, 61% would prefer to amend the Constitution so the candidate who receives the most total votes nationwide wins, and 38% would prefer to keep the current system.
Between 1967 and 1980, Gallup tracked the public's appetite for changing the electoral system with a similarly worded question and found majorities of 58% to 80% approved of amending the Constitution to "do away with the Electoral College and base the election of a president on the total vote cast throughout the nation."
Democrats and Republicans Consistently Differ on Electoral Preference
Republicans have been consistently less supportive of eliminating the Electoral College throughout the past 20 years compared with Democrats and independents. Yet, the divergence between Republicans and Democrats has been much greater since 2016. After Trump defeated Clinton, Democrats were more than four times as likely as Republicans to favor using the national popular vote to elect U.S. presidents. This was due both to Democrats becoming more supportive and Republicans less supportive of the Electoral College system in the wake of Trump's victory.
While Republicans have become slightly more supportive of this concept since then, Democrats are still far more likely to favor it.
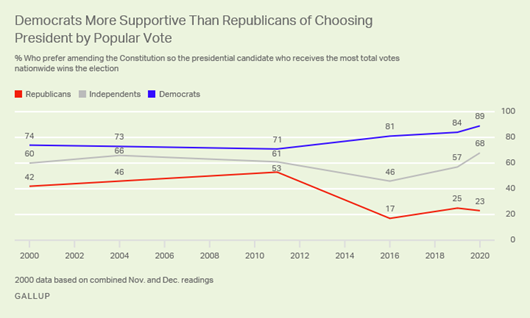
Line graph. Partisans' preferences for the way to elect a president in the U.S. since 2000. Currently, 89% of Democrats, 68% of independents and 23% of Republicans would prefer to amend the Constitution, so the candidate who receives the most total votes nationwide wins. Democrats and independents have consistently been more supportive of abolishing the Electoral College than Republicans.
In contrast, data from the similar question about doing "away with the Electoral College" between 1967 and 1980 found majorities of Republicans, Democrats and independents alike favored the concept.
Bottom Line
Presidential candidates have only won the electoral vote and lost the popular vote four times in U.S. history, and two of these occurrences have been in the last five presidential elections. In both 2000 and 2016, the Republican candidates won the Electoral College while the Democratic candidates won the popular vote. This is likely the main reason behind Democrats' strong support -- and Republicans' strong opposition -- to changing the current system to use the popular vote to elect the U.S. president. That is, Americans' opinions are increasingly driven by what would benefit their party.
Amending the Constitution to abolish the Electoral College system in the U.S. requires support from two-thirds of both houses of Congress and three-quarters of the 50 states. Given the current polarization among partisans on the issue, there is little chance that such an amendment will happen anytime soon. An alternate proposal that would not require a constitutional amendment -- The National Popular Vote Interstate Compact -- is an agreement between states to award all of its electoral votes to the presidential candidate who wins the overall popular vote. It has been adopted by 15 states and the District of Columbia, but it, too, is sharply politicized.
(Gallup USA)
September 24, 2020
Source: https://news.gallup.com/poll/320744/americans-support-abolishing-electoral-college.aspx
657-43-18/Poll
Hispanic teens enjoy religious activities with parents, but fewer view religion as ‘very important’
Hispanics, who make up one of the nation’s fastest growing racial and ethnic groups and are its youngest, tend to be more religious than Americans overall on several measures, such as attending worship services regularly and saying religion is very important in their lives.
However, these differences aren’t as stark among younger Americans: Hispanic teenagers (ages 13 to 17) look a lot like their peers when it comes to religion, even though they are more likely than U.S. teens overall to identify as Catholic and say it’s necessary to believe in God to be moral, according to a recent Pew Research Center survey.
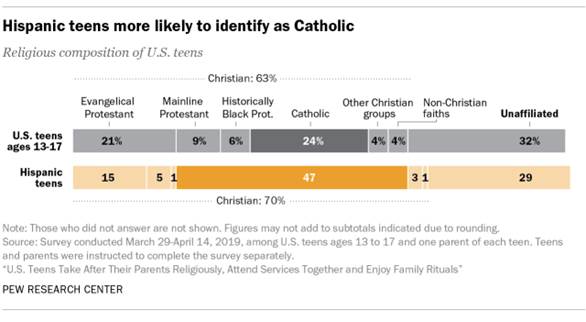
Rates of religious service attendance among Hispanic adolescents are on par with those of other teens. For example, 45% of Hispanic teens say they attend services at least once or twice a month, while 53% say they attend less often. And roughly four-in-ten Hispanic teens (41%) attend services with both parents, while a quarter attend with either just their mother (24%) or father (3%). Among teens overall, those shares are virtually identical.
How
we did this
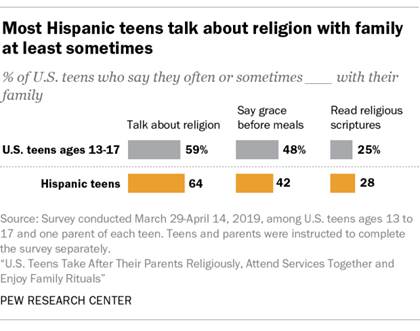
Like teens overall, Hispanic teens also practice religion with their families in other ways: roughly two-thirds (64%) say they talk with their family “often” (21%) or “sometimes” (43%) about religion. And just one-in-ten say they never have these discussions. About four-in-ten report saying grace or a prayer before family meals at least sometimes, and 28% say they read religious scriptures as a family with the same frequency.
Among Hispanic teens who do religious things with their family (as measured by responses to saying grace, reading scripture and a more generic question asking whether there are any other religious activities in which they participate with their families), roughly two-thirds acknowledge that they participate at least partly because their parents want them to. At the same time, eight-in-ten say they get “a lot” (36%) or “some” (45%) enjoyment out of it, similar to the share of U.S. teens overall who say the same.
While Hispanic teens say they engage relatively often in religious practices with their family, they report lower levels of personal religious commitment. About three-in-ten (28%) say that religion is very important in their lives and a similar share (27%) have a daily prayer practice. And though the vast majority believe in God or a universal spirit (89%), fewer hold this belief with absolute certainty (44%). On these questions they look largely like U.S. teens as a whole.
However, Hispanic teens diverge from other U.S. teens when it comes to religious identity.
Hispanic teens in the U.S. are more likely be Catholic than to say they belong to any other religious group. Roughly half are Catholic (47%), while one-in-five identify as Protestants, including those in the evangelical Protestant tradition (15%), mainline Protestant tradition (5%) and the historically Black Protestant tradition (1%). U.S. teens overall are about half as likely as Hispanics to identify as Catholics (24%), and more likely to identify as Protestants (36%).
There is not much of a gap between teens when it comes to not having a religion: Roughly three-in-ten Hispanic (29%) and U.S. teens overall (32%) say they are religiously unaffiliated, that is, atheist, agnostic or “nothing in particular.”
On a question about morality, Hispanic teens hold different opinions from their White, non-Hispanic peers. Hispanic teens are about evenly split on the question of whether it is necessary to believe in God in order to be moral and have good values: 50% say it is not necessary, while 48% say it is. By comparison, 71% of White teens say that a belief in God is unnecessary to be moral and 28% say it is necessary.
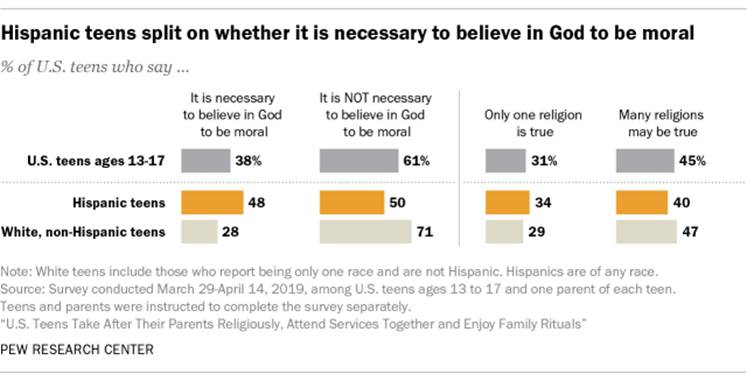
Hispanic teens also are divided on a concept known as religious “exclusivism”: 40% say that many religions may be true, and 34% say one religion is true. Fewer say that there is little (15%) or no (10%) truth in any religion. By comparison, among White teens the balance tilts decidedly toward the idea that many religions may be true (47%), as opposed to the idea that just one religion is true (29%).
The findings about teens’ religious beliefs and practices are based on a Pew Research Center survey conducted March 29 to April 14, 2019, among 1,811 pairs of teenagers and their parents. Hispanics made up roughly 24% of the teens included.
(PEW)
September 22, 2020
657-43-19/Poll
Gen Z eligible voters reflect the growing racial and ethnic diversity of U.S. electorate
As the presidential election fast approaches and early voting gets underway in some states, interest is building over the impact Generation Z voters – who will make up one-in-ten eligible voters this fall – will have on the outcome.
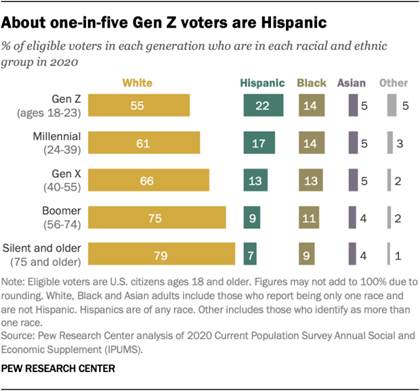
Gen Z eligible voters, who range in age from 18 to 23, are a more racially and ethnically diverse group than older generations. While a majority (55%) are non-Hispanic White, a notable 22% are Hispanic, according to a Pew Research Center analysis based on Census Bureau data. Some 14% of Gen Z eligible voters are Black, 5% are Asian and 5% are some other race or multiracial.
The share of Gen Z voters who are Hispanic is significantly higher than the share among Millennial, Gen X, Baby Boomer or Silent Generation and older voters.
How
we did this
Gen Z voters are less likely than their predecessors to be foreign born: 4% were born outside the U.S., compared with 9% of Millennial voters, 15% of Gen X voters, 12% of Baby Boomer voters and 13% of Silent voters and older. This aligns with previous Center studies, which looked at a broader segment of Gen Z – not just citizens who are voting age – and found that Gen Zers are more likely than Millennials to be the children of immigrants. In 2019, 22% of Gen Zers ages 7 to 22 had at least one immigrant parent, compared with 14% of Millennials when they were a comparable age.
In raw numbers, there are more than 23 million eligible Gen Z voters this year, about 16 million more than could vote in the 2016 election – although the Gen Z voters make up significantly smaller shares of the overall electorate than other generations because many aren’t yet eligible to vote. For context, more than 63 million Millennials are eligible to vote this year.
The impact Gen Zers have on the election will depend in large part on voter turnout. Younger voters traditionally turn out to vote at lower rates than their older counterparts, as turnout tends to increase with age. Three-in-ten Gen Z eligible voters cast ballots in the 2018 midterm election – lower than the share of Millennial eligible voters who turned out (42%) and substantially below the rate for all eligible voters (53%).
(PEW)
September 23, 2020
657-43-20/Poll
54% of Americans say social media companies shouldn’t allow any political ads
More than half of U.S. adults (54%) say social media companies should not allow any political advertisements on their platforms. And a larger share (77%) finds it not very or not at all acceptable for these companies to use data about their users’ online activities to show them ads from political campaigns, according to a Pew Research Center survey conducted Sept. 8-13, 2020.
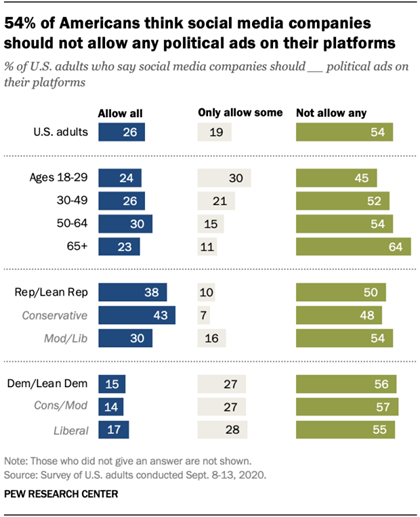
At the same time, 45% say social media companies should allow at least some political ads on their platforms, with 26% saying these firms should allow all of these ads and 19% backing the idea that only some should be allowed. And 22% think it is at least somewhat acceptable for social media companies to use data about their users’ online activities to show them political campaign ads.
The sentiments against political ads extend across most groups, though there are some differences tied to factors like partisanship and age. For instance, just 15% of Democrats and independents who lean toward the Democratic Party say that social media companies should allow all political ads on their platforms, compared with 38% of Republicans and GOP leaners. Some 27% of Democrats say only some political ads should be allowed on these platforms, compared with a much smaller share of Republicans (10%) who say the same. When it comes to not allowing any political ads on these sites at all, 56% of Democrats and half of Republicans express this view.
How
we did this
Within the Democratic cohort, there are no differences in these views by ideology. However, Republicans are slightly more divided along ideological lines. For instance, 43% of conservative Republicans say social media companies should allow all political ads on their platforms, while 30% of moderate to liberal Republicans say the same. Moderate and liberal Republicans are also about twice as likely as conservative Republicans to say these sites should allow only some political ads (16% vs. 7%).
These views also vary somewhat by age. Those ages 65 and older are most likely to favor not allowing political ads on social media. Some 64% of those 65 and older say these sites should not allow any political ads on their platforms, compared with slightly over half of those ages 30 to 64 and 45% of those 18 to 29. By contrast, those in the youngest age group are more likely to favor allowing only some ads on the site, with 30% holding this view, compared with about one-in-five or fewer of those in older age groups.
There are also differences in these views by race and ethnicity and gender. White Americans (56%) are more likely than Black (47%), Hispanic (51%) and Asian Americans (48%) to say these companies should not allow any political ads on their site. However, White Americans (28%) are also more likely than Black (21%), Hispanic (23%) and Asian American adults (19%) to say social media sites should allow all political ads on their sites. Black, Hispanic and Asian Americans are all more likely to favor social media sites allowing only some political ads on their sites when compared with White adults. Women (58%) are also more likely than men (49%) to say these sites should not allow any political ads on their platforms. Conversely, men are more likely than women to favor allowing all political ads on these sites (31% vs. 21%).
These findings reflect an intensifying dynamic in political debate this election cycle. In recent years, social media sites have emerged as news hubs and serve as online public spheres where people encounter and discuss political information. Yet, in the current campaign season, social media companies and political candidates themselves have drawn criticism for publishing and approving ads bearing false information.
Some companies are reacting. In late 2019, Twitter announced it would ban sponsored political content from the site altogether, and more recently others, like Facebook, revealed their plans to ban any new political ads in the week before the contest.
Tactically, many political advertisements on social media rely on microtargeting – a strategy used to reach a specific group of users based on their geographical location or personal interests. Social media companies have taken a range of approaches when it comes to the moderation of ad targeting. For example, Facebook uses a robust classification system to categorize users’ preferences, including political leanings. On the other hand, Google said in 2019 it would restrict how political candidates can microtarget users with ads based on political attributes.
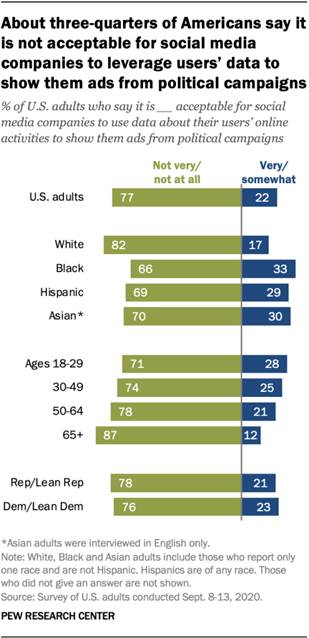
When asked about the acceptability of social media companies using data about their users’ online activities to show them ads from political campaigns, roughly three-quarters of Americans (77%) say this practice is not very or not at all acceptable. Some 53% say this targeting is not acceptable at all. About a fifth (22%) find targeting somewhat or very acceptable, with a small share (4%) saying this is very acceptable.
There are not major differences between partisans on this issue. At the same time, there are differences in these attitudes by race and ethnicity. The vast majority of White adults (82%) find social media companies using data about their users’ online activities to target them with ads from political campaigns to be not very or not at all acceptable, compared with smaller shares – though still majorities – of Black, Hispanic and Asian Americans.
Views of the acceptability of this practice also vary by age. Those 65 and older (87%) are more likely than younger Americans to find this kind of ad targeting not very or not acceptable at all, though seven-in-ten or more of those in younger groups also hold this view.
This public resistance to political ad targeting is not new. These findings line up with a 2018 Center survey that found that roughly six-in-ten U.S. social media users (62%) found it unacceptable for social media sites to use data about them and their online activities to show messages from political campaigns. And the results in the current survey tie to more recent research showing the public is concerned about the interplay of major tech companies and politics. For instance, most Americans think social media sites censor political viewpoints, and few U.S. adults say they are very or somewhat confident in tech companies to prevent misuse of their platforms in the 2020 election.
(PEW)
September 24, 2020
AUSTRALIA
657-43-21/Poll
Super fund satisfaction down in July, as Australians allowed to withdraw a second tranche of $10,000
New data from Roy Morgan’s Superannuation Satisfaction Report shows an overall super fund satisfaction with financial performance rating of 61.6% in July. This is down 1.3% points on the previous month but is virtually unchanged on a year ago with satisfaction of 61.7% in July 2019.
The ratings for July 2020 cover the first month in which Australians in financial hardship were able to apply to withdraw a second tranche of up to $10,000 held in their superannuation accounts.
According to the Australian Prudential Regulation Authority (APRA) the COVID-19 Superannuation Early Release Scheme has now released over $33 billion to over 3.2 million applicants. Since the end of June applicants have been able to apply for a second tranche and over a third, 1.2 million people, have done so.
Industry Funds have been the standout over the last year and were the only sector to increase customer satisfaction, up by 0.2% points to 63%. Satisfaction with Public Sector Funds fell marginally, by 0.4% to 71.4% but still retains the highest rating of any sector.
Customer satisfaction with Retail Funds declined 2.5% points to 54.9% but easily the biggest decline was felt by Self-Managed Funds, down a significant 10.4% points to 67.1%. One year ago people invested in Self-Managed Funds were the most satisfied but now satisfaction with these funds is at its lowest for eight years since September 2012.
The Superannuation Satisfaction Report, with data up to July 2020, shows Unisuper with the highest customer satisfaction rating of the Industry Funds ahead of CARE Super, AustralianSuper, HOSTPLUS, HESTA, Cbus, Sunsuper, First State Super and REST Super.
The highest placed Retail Super Fund is Colonial First State followed by BT, OnePath, MLC and AMP.
The report’s findings are from Roy Morgan Single Source, Australia’s most trusted consumer survey, compiled by in-depth interviews with around 50,000 Australians each year.
Roy Morgan CEO Michele Levine says July 2020 was well into the period of re-opening for most of Australia, although it was also the month Victoria was returned to a Stage 3 lockdown in response to a second wave of COVID-19:
“Australia’s superannuation
funds have had a challenging year with millions of people opting to withdraw up
to $10,000 in funds in response to the COVID-19 pandemic and associated
shutdowns.
“Over 3.2 million
Australians have lodged a withdrawal request since the scheme started in April
withdrawing an average of nearly $7,700. The second withdrawal period began in July
and 1.2 million Australians have already withdrawn additional funds at a higher
average of over $8,400 per withdrawal.
“The volatile share-markets
so far during 2020 as well as the withdrawal of around $33 billion so far have
placed immense pressure on Australia’s superannuation funds but their
performance has held up well.
“Overall satisfaction with
financial performance, amongst Australia’s superannuation funds was at 61.6% in
July 2020, virtually unchanged on a year ago – 61.7% in July 2019. Industry
Funds have even increased their satisfaction – up 0.2% points from a year ago
to 63%.
“Amongst these results there
were several stand outs with BT and Colonial First State two of the Retail
Funds to increase their customer satisfaction from a year ago while the biggest
increases for Industry Funds were for CARE Super, AustralianSuper,
HOSTPLUS, REST Super, Sunsuper
and Unisuper.
“The customer satisfaction
with financial performance ratings of Australia’s super funds are reliant on
the performance of the Australian share-markets which dropped significantly in
March but have since been stable for nearly four months. The ASX 200 Index
bottomed at 4,564 points on 24th of March but by the end of May it had
rebounded by nearly 30% to end the month of May at 5,851 and closed last week
at 5,864 (Sep. 18, 2020).
“The declining number of
cases of COVID-19 in Victoria since peaking in early August is a big positive
for the broader economic picture and suggests Australia can continue on the
road to recovery in the months ahead, as the country emerges from the lockdowns
and border closures that have stifled the economy.”
Satisfaction with financial performance of different type of super funds
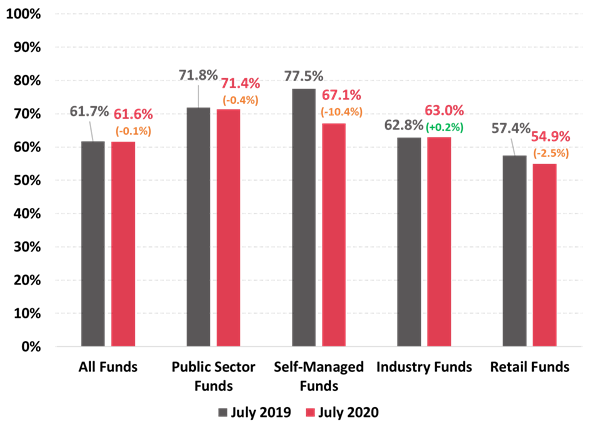
(Roy Morgan)
September 22, 2020
Source: https://www.roymorgan.com/findings/8522-superannuation-satisfaction-july-2020-202009210552
MULTICOUNTRY STUDIES
657-43-22/Poll
World’s most admired 2020
The Obamas are the world’s most admired man and woman
Barack Obama has deposed Bill Gates from his position as world’s most admired man for the first time since YouGov first started asking in 2014.
Michelle Obama holds on to her position as world’s most admired woman, having ended Angelina Jolie’s run of dominance last year. Jolie herself has risen one place since last year to second, with Queen Elizabeth II also rising one rank to become the world’s third most admired female.
Gates has only slipped one rank, with his fall potentially coming as a result of rumours that he is in some way involved in the spread of COVID-19. Chinese president Xi Jinping finds himself in third place once again, having previously held that position from 2015-2017.
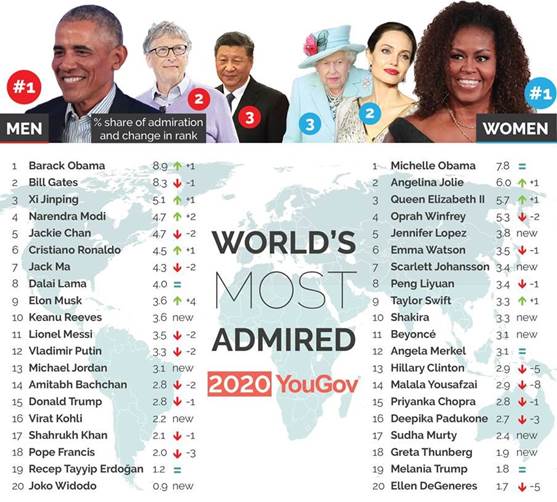
This year’s study is our largest ever with more than 45,000 people in 42 countries and territories being interviewed to compile the list.
Tesla and SpaceX CEO Elon Musk has seen the greatest increase since last time, climbing four places from 13th to ninth. Human rights campaigner Malala Yousafzai has fallen farthest, tumbling eight places from 6th to 14th.
Entertainers dominate the female list, with 12 of the most admired women being actresses, singers or TV presenters (although some, like Emma Watson and Angelina Jolie, are also notable for their humanitarian work). By contrast, the list of most admired men contains more people from political, business and sporting backgrounds.
The results are calculated from the combination of responses to two questions – whether a respondent admires the figure at all and then whether they are the figure the respondent admires the most. Each nation's results in the global compilation are also weighted to represent the country's population size. (Full methodology is available below)
New additions to the top twenties this year include environment campaigner Greta Thunberg, pop stars Jennifer Lopez, Beyoncé and Shakira, actors Keanu Reeves and Scarlett Johansson, sportsmen Michael Jordan and Virat Kohli, Indonesian president Joko Widodo, and Indian charity head Sudha Murty.
Barack Obama is more admired than Donald Trump in every country, except one
Barack Obama’s rise in the rankings is mirrored by Donald Trump’s fall, with the current US president slipping one spot to 15th place globally.
The former president tops the global list in 22 of the 42 countries and territories surveyed, including the USA. Trump performs best in the US (coming 2nd), South Africa (3rd) and Vietnam (3rd), but only ranks ahead of Obama in one country: Russia, where he places 11th to Obama’s 15th.
Who is the GOAT, according to World’s Most Admired?
The results show that football’s greatest rivalry continues to be won by Cristiano Ronaldo, ranked as the world’s 6th most admired man, compared to 11th for competitor Lionel Messi.
Ronaldo ranks higher than Messi in 32 of the 42 countries and territories surveyed, and has led his opponent in the last three global studies.
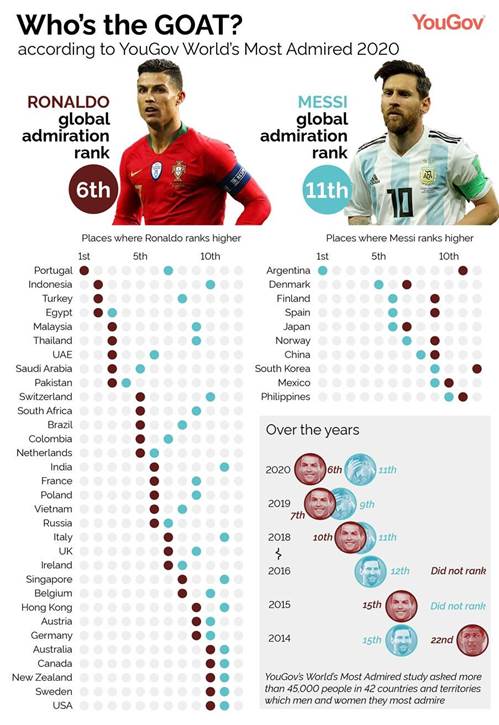
2020 world's most
admired – country breakdown
Numbers show the percentage share of admiration for each person in 42 countries and regions worldwide
|
MEN |
Admiration |
WOMEN |
Admiration |
|||||
|
David Attenborough |
23.13% |
Queen Elizabeth II |
23.29% |
|||||
|
Barack Obama |
15.91% |
Michelle Obama |
10.87% |
|||||
|
Prince William, Duke of Cambridge |
9.52% |
Jacinda Ardern |
8.01% |
|||||
|
Bill Gates |
6.18% |
Catherine, Duchess of Cambridge |
7.33% |
|||||
|
Dalai Lama |
4.92% |
Greta Thunberg |
7.29% |
|||||
|
Boris Johnson |
4.89% |
Malala Yousafzai |
4.89% |
|||||
|
Jeremy Corbyn |
4.60% |
Nicola Sturgeon |
4.49% |
|||||
|
Keanu Reeves |
3.83% |
Angela Merkel |
4.34% |
|||||
|
Nigel Farage |
2.93% |
Emma Watson |
2.61% |
|||||
|
Pope Francis |
2.62% |
Oprah Winfrey |
2.06% |
|||||
|
Elon Musk |
2.19% |
Meghan, Duchess of Sussex |
1.69% |
|||||
|
Cristiano Ronaldo |
1.44% |
Hillary Clinton |
1.65% |
|||||
|
Jackie Chan |
1.44% |
Beyoncé |
1.54% |
|||||
|
Lionel Messi |
1.38% |
Angelina Jolie |
1.38% |
|||||
|
Michael Jordan |
1.28% |
Taylor Swift |
1.37% |
|||||
|
Donald Trump |
1.20% |
Theresa May |
1.30% |
|||||
|
Vladimir Putin |
0.82% |
Scarlett Johansson |
1.16% |
|||||
|
Virat Kohli |
0.29% |
Ellen DeGeneres |
1.08% |
|||||
|
Shahrukh Khan |
0.26% |
Jennifer Lopez |
0.85% |
|||||
|
Jack Ma |
0.17% |
Melania Trump |
0.60% |
|||||
|
Recep Tayyip Erdoğan |
0.12% |
Shakira |
0.55% |
|||||
|
Xi Jinping |
0.09% |
Priyanka Chopra |
0.29% |
|||||
|
Amitabh Bachchan |
0.07% |
Deepika Padukone |
0.09% |
|||||
|
Narendra Modi |
0.05% |
Sudha Murty |
0.09% |
|||||
|
Joko Widodo |
0.01% |
Peng Liyuan |
0.07% |
Methodology
From January to March this year YouGov gathered open-ended nominations from panellists across 42 countries and territories, asking them simply: “Thinking about people alive in the world today, which [man or woman] do you most admire?” These nominations were then used to compile a list of the 20 men and 20 women who received the most nominations and were nominated in at least four countries. An additional 5-10 popular local figures were added to the lists for individual countries.
Because the first wave of fieldwork was carried out before the peak of the coronavirus pandemic, some figures associated with leading national efforts to counter the disease did not make it on to the national admiration lists. This is unlikely to affect the global results, as such figures are generally only well-known in their own country and a candidate needs to be nominated in at least four countries to stand a chance of making the global top twenty (which it is less likely still they would have reached).
In fieldwork conducted from May to September we used these lists to poll each of the 42 areas asking two questions: “who do you truly admire?”, where respondents could make multiple selections, and “who do you MOST admire?”, where they could only pick one. These two numbers were combined into a percentage share of admiration, displayed to the right of each name in the graphic above and table below, which shows the full results for every country including local celebrities and public figures:
By asking respondents two questions, we can understand both the breadth (i.e. global reach) and the intensity of a person's support.
Altogether, we polled in countries that constitute more than seven-tenths of the world's population. However, some parts of the world were better represented than others, so we weighted up the impact certain countries had on the final scores and weighted down others so the global scores more accurately reflect the breakdown of sentiment in the world overall.
All of the surveys were conducted online, and in many of the countries the internet penetration is low to the point where the sample can only be said to be representative to the online population. The countries and territories where this applies are China (including Hong Kong), Egypt, Indonesia, Malaysia, Pakistan, the Philippines, Thailand and Vietnam.
(YouGov)
September 28, 2020
Source: https://mena.yougov.com/en/news/2020/09/28/worlds-most-admired-2020/
657-43-23/Poll
The Arab World’s Digital Divide
The internet has been touted as an engine for equality because of its potential to expand opportunities across all segments of society, accelerate upward social mobility, and lend voice and platforms to marginalized groups. Yet, despite decades of increasing internet penetration, the proliferation of smartphones, and an expanding internet culture, inequalities in the Arab World remain pronounced, and by some estimates have grown more severe. Data from the latest wave of Arab Barometer surveys indicate that rates of internet usage differ markedly along demographic lines. When controlling for potentially confounding variables, disadvantaged segments of society like women, the elderly, the less educated, and lower income individuals are less likely to use the internet than their male, younger, higher educated, and higher income counterparts. These findings from twelve Arab World countries contribute to a body of evidence showing that though the internet has the potential to mitigate some societal ills, disparate rates of internet usage along demographic or socio-economic lines can actually compound inequalities and contribute to a worrisome digital divide.
Overall Rates of Internet Usage
The literature generally defines the digital divide as the gap between segments of society “with regard to both their opportunities to access information and communication technologies [ICTs] and to their use of the Internet”. As society has grown reliant on technology and the internet, those lacking digital literacy and access to ICTs face greater challenges and even outright exclusion integrating into an increasingly digitally-dependent economy and society.
Across the Middle East and North Africa (MENA) the proportion of citizens who are offline varies greatly by country – wherein “offline” here denotes respondents who say they never use the internet and “online” denotes those who use the internet at any frequency, including as little as about once a month.
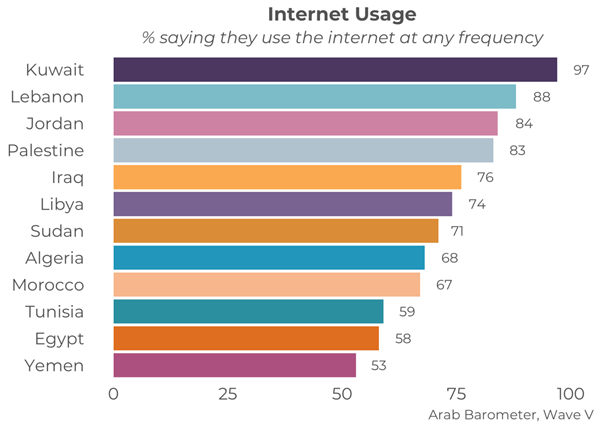
The divide across MENA is not just within countries, but also across countries. In Kuwait, one of the wealthiest countries in the world, only 3 percent say they never use the internet. This is unsurprising given the Arab Gulf has some of the highest rates of internet penetration in the world, exceeding those found in the United States and various Western European countries. Meanwhile, across the Levant the rates of offline citizens are also relatively low. Fewer than two-in-ten citizens in Lebanon (12 percent), Jordan (16 percent), and Palestine (17 percent) say they never use the internet. In contrast, roughly a quarter of respondents in Iraq (24 percent), Libya (26 percent), and Sudan (28 percent) are offline, while over three-in-ten in Morocco (31 percent) and Algeria (32 percent), and over four-in-ten in Tunisia (41 percent) and Egypt (42 percent) say the same. Most notably, in Yemen, one of the poorest countries in the world, the proportion of offline respondents roughly equals the rate of online respondents (47 percent versus 53 percent, respectively).
Beyond wealth, there are a number of other factors that may contribute to the discrepancy in internet usage across MENA. As Yemen enters its fifth year of civil strife, citizens there face internet shortages and connectivity issues due to both deteriorating infrastructure and politically motivated censorship and blockages. By contrast, from 2014 to 2018 Morocco and Tunisia increased their mobile internet penetration rates by 15 percent and 18 percent, respectively. However, beyond such country-level differences, are there individual-level predictors that account for some of the variance seen in citizen’s internet usage across the Arab World?
Predictors of Internet Usage: Age, Gender, Education, and Income
Simple proportions show that across the region several key variables, like age, gender, education, income, and settlement type (urban, rural, or refugee camp), correlate with internet usage. Yet these proportions do not account for interactions across variables: for instance, urbanity is highly correlated with education levels. Fitting a regression model helps address this issue and isolate which variables are in fact most predictive of internet usage by controlling for key covariates simultaneously.
Unsurprisingly, across the countries surveyed, older individuals are less likely to use the internet. For instance, the average, religious 30-year-old Egyptian man with a basic education is 52 percent likely to be an internet user, compared to 32 percent likely if he is 40 years old. Alternatively, this can be viewed as a 58 percent decrease in the odds of being an internet user for a ten-year increase in age, holding all else equal. This trend may stem from greater apprehension among older adults with respect to adopting newer technologies, less confidence in their ability to successfully use these technologies, or that such technologies are often not built with the needs of older users in mind. AB data show that in many countries this digital divide between young adults (18-29) and older individuals (60+) is severe. This generational discrepancy is most extreme among Egyptian young adults, who use the internet at a rate that is 82 percent higher than Egyptians who are 60 or older. In comparison, young adults in Kuwait use the internet at a rate 20 percent higher than older Kuwaitis.
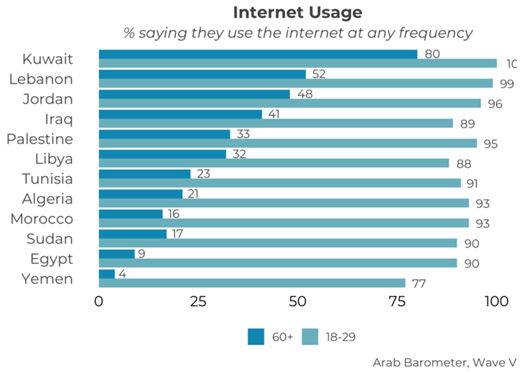
The digital gender divide shows a similar imbalance. When controlling for other variables, we see a 56 percent decrease in the odds of being an internet user for women as opposed to men. Women face immense barriers to full participation in the digital sphere, and these barriers are not dissimilar to those found in other domains. In fact, they are informed by and representative of real-world phenomena. Cultural norms, gender roles, biases, and stereotypes often dissuade and even prevent women from accessing the internet, gaining digital literacy, and participating in the digital economy or society. According to the International Telecommunication Union, when compared to other world regions the gap between men and women with respect to the internet penetration rate is largest across Arab States. Such disparities coupled with the region showing the world’s worst performance in narrowing the gender gap, paint a troubling picture of the present situation.

In addition to age and gender, educational attainment and income also prove to be significant predictors. As educational levels and income decrease, the propensity of an individual to be online decreases as well. Interestingly, though a cursory look at simple proportions shows a correlation between respondents’ settlement type and whether they are internet users, this analysis suggests that such a trend could be due to the effects of confounding variables like education or income.

Solution Challenges
Identifying inequalities in internet access and determining which populations could benefit from targeted interventions are necessary but not sufficient steps toward comprehensive digital inclusion. In addition to obstacles preventing their access and usage of the internet, marginalized groups are often more vulnerable than their counterparts once online. Across the world, older individuals are more likely to fall victim to internet fraud and online financial schemes, women are 27 times more likely than men to face online abuse, and studies have found that those with lower levels of education and income are more likely to believe and share misinformation online. With doctored media, disinformation campaigns, doxing, and sexual harassment permeating our digital spaces, it is clear that media literacy and privacy consciousness are a critical cornerstone of healthy internet usage. As we reckon globally with balancing the internet’s threats and benefits, we must ensure that vulnerable populations have equal opportunity to reap these benefits without bearing the brunt of the internet’s failures and injustices. Only then can we consider our efforts to bridge the digital divide successful.
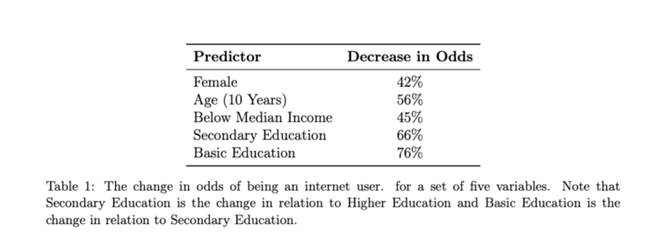
(Arab Barometer)
September 25, 2020
Source: https://www.arabbarometer.org/2020/09/the-mena-digital-divide/