BUSINESS
& POLITICS IN THE WORLD
GLOBAL
OPINION REPORT NO. 671
Week: December 28, 2020 –
January 03, 2021
Presentation: January 08, 2021
Faith
on the Hill: 26% Of American Public But Only One Congressman Claims To
Have ‘No Religion’
Teachers in record numbers take leave for
mental illnesses
AD of the month EGY – Schweppes December 2020
Sociologists
found out who Russians trust during the second wave of the pandemic
Russians
have a sharp increase in spending before the New Year
The Corona era has raised the importance of
parcel machines to their peak
World
survey shows 7 in 10 Irish people likely to get COVID-19 vaccine
Who kept their 2020 New Year’s resolutions? And
how many are making them for 2021?
Few think the EU trade deal is good for
Britain, but most want MPs to accept it
How Britons celebrate Christmas and Easter
Six in ten of the GB adults believe British
businesses behave ethically for the second year running
Despite a chaotic 2020, Britons are feeling
good about 2021
Americans' Average Weight Holds Steady in 2020
Donald Trump, Michelle Obama Most Admired in
2020
Now 77% of Australians would get a vaccine for
COVID-19 – down 10% points since April 2020
U.S. and U.K. are optimistic indicators for
COVID-19 vaccination uptake
Fear and Social Distancing: Global Perceptions
of Risk Vary
INTRODUCTORY NOTE
671-43-19/Commentary:
Faith on the Hill:
26% Of American Public But Only One Congressman Claims To Have ‘No Religion’
 When it comes to religious affiliation, the
117th U.S. Congress looks similar to the previous Congress but quite different
from Americans overall.
When it comes to religious affiliation, the
117th U.S. Congress looks similar to the previous Congress but quite different
from Americans overall.
While about a quarter (26%)
of U.S. adults are religiously unaffiliated – describing themselves as atheist,
agnostic or “nothing in particular” – just one member of the new Congress (Sen.
Kyrsten Sinema, D-Ariz.) identifies as religiously unaffiliated (0.2%).
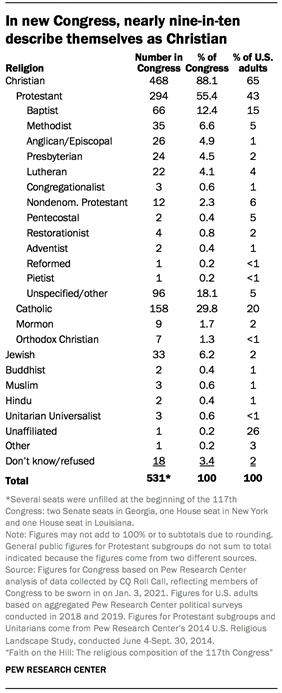
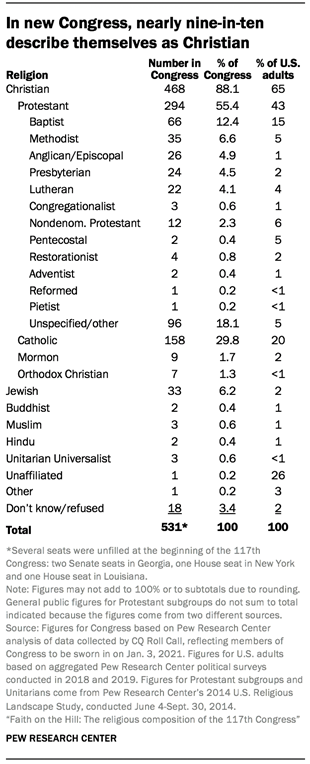
Nearly nine-in-ten members
of Congress identify as Christian (88%), compared with two-thirds of the
general public (65%). Congress is both more heavily Protestant (55% vs. 43%)
and more heavily Catholic (30% vs. 20%) than the U.S. adult population overall.
Members of Congress also are
older, on average, than U.S. adults overall. At the start of the 116th
Congress, the average representative was 57.6 years old, and the average
senator was 62.9 years old.1 Pew Research Center surveys have found
that adults in that age range are more likely to be Christian than the general
public (74% of Americans ages 50 to 64 are Christian, compared with 65% of all
Americans ages 18 and older). Still, Congress is more heavily Christian even
than U.S. adults ages 50 to 64, by a margin of 14 percentage points.2
Over the last several
Congresses, there has been a marked increase in the share of members who
identify themselves simply as Protestants or as Christians without further
specifying a denomination. There are now 96 members of Congress in this
category (18%). In the 111th Congress, the first for which Pew Research
Center analyzed the religious affiliation of members
of Congress, 39 members described themselves this way (7%). Meanwhile, the share of
all U.S. adults in this category has held relatively steady.
Over the same period, the
total number of
Protestants in Congress has remained relatively stable: There were 295
Protestants in the 111th Congress, and there are 294 today. The increase in
Protestants who do not specify a denomination has corresponded with a decrease
in members who do identify
with denominational families, such as Presbyterians, Episcopalians and
Methodists.
Still, members of those
three Protestant subgroups remain overrepresented in Congress compared with
their share in the general public, while some other groups are underrepresented
– including Pentecostals (0.4% of Congress vs. 5% of all U.S. adults),
nondenominational Protestants (2% vs. 6%) and Baptists (12% vs. 15%).3
Jewish members also make up
a larger share of Congress than they do of the general public (6% vs. 2%). The
shares of most other non-Christian groups analyzed in this report (Buddhists,
Muslims, Hindus and Unitarian Universalists) more closely match their
percentages in the general public.
Nearly all non-Christian
members of Congress are Democrats. Just three of the 261 Republicans who were
sworn in on Jan. 3 (1%) do not identify as Christian; two are Jewish, and one
declined to state a religious affiliation.
These are some of the key
findings of an analysis by Pew Research Center of CQ Roll Call data on the
religious affiliations of members of Congress, gathered through questionnaires
and follow-up phone calls to candidates’ and members’ offices.4 The CQ questionnaire asks members what
religious group, if any, they belong to. It does not attempt to measure their
religious beliefs or practices. The Pew Research Center analysis compares the
religious affiliations of members of Congress with the Center’s survey data on
the U.S. public.

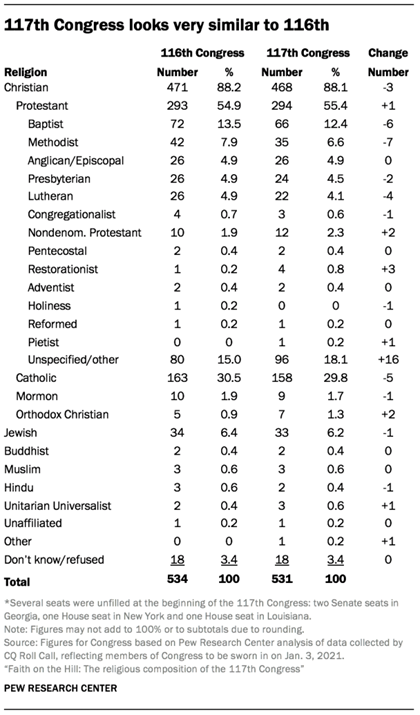
Little change
between 116th and 117th Congresses for most religious groups
 The overall composition of the new Congress is
similar to that of the previous Congress – in part because 464 of the 531
members of the 117th Congress (87%) are returning members.
The overall composition of the new Congress is
similar to that of the previous Congress – in part because 464 of the 531
members of the 117th Congress (87%) are returning members.
Methodists saw the largest
loss – seven seats – followed closely by Baptists (six seats) and Catholics
(five seats). There also are four fewer Lutherans in the 117th Congress than
there were in the 116th. By contrast, Protestants who do not specify a
denomination are up substantially, gaining 16 seats in the 117th Congress after
also gaining 16 seats two years ago, when the 116th took office. Protestants in
the Restorationist family also gained three seats (all members of Congress in
this category identify with the Churches of Christ).5
In total, there currently
are three fewer Christians in the new Congress than there were in the previous
Congress, although this gap is all but certain to narrow once three of the four
open seats are filled. Five of the six candidates in the uncalled or
outstanding races identify as Christians; Jon Ossoff, a Democrat running for
Senate in Georgia, is Jewish.6
When it comes to the 63
members of Congress who are not Christian, a slim majority (33) are Jewish, a
number that has held relatively steady over the past several Congresses.
The next largest non-Christian
group is made up of those who declined to specify a religious affiliation.
There are 18 people in this category in the 117th Congress, the same as in the
116th, which had seen an increase of eight members in this group.
The three Muslim representatives
from the 116th Congress return for the 117th: Reps. André Carson, D-Ind.; Ilhan
Omar, D-Minn.; and Rashida Tlaib, D-Mich. Similarly, both Buddhists from the
previous Congress return: Georgia Democratic Rep. Hank Johnson and Hawaii
Democratic Sen. Mazie K. Hirono.
Unitarian Universalists
gained one seat, as Rep. Deborah K. Ross, D-N.C., joins California Democratic
Reps. Ami Bera and Judy Chu.
There are now two Hindus in
Congress – Rep. Ro Khanna, D-Calif., and Rep. Raja Krishnamoorthi, D-Ill., both
returning members. Former Rep. Tulsi Gabbard, D-Hawaii, who served in the 115th
and 116th Congresses, ran for president in 2020 and withdrew her reelection bid
for her House seat. She is replaced by Kai Kahele, who declined to specify a
religious affiliation.
One member, California
Democratic Rep. Jared Huffman, describes himself as a humanist. He is listed in the “other” category. Fewer
than three-tenths of 1% of U.S. adults specifically call themselves humanists.
Sinema is the only member of
the 117th Congress who identifies as religiously unaffiliated. Both Sinema and
Huffman have said they do not consider themselves atheists.7
Differences by
chamber
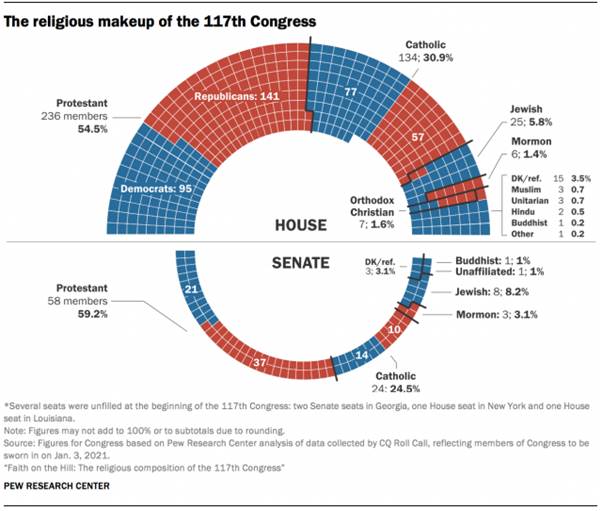
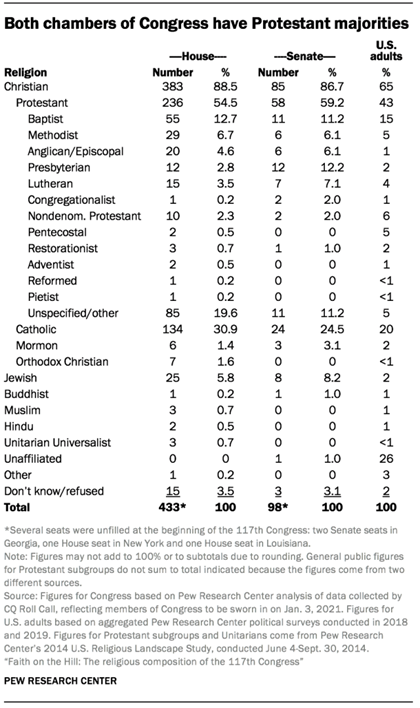 Most members of the House and Senate are
Christians, with the House just slightly more Christian than the Senate (88%
vs. 87%). And both chambers have a Protestant majority – 55% of representatives
are Protestant, as are 59% of senators.
Most members of the House and Senate are
Christians, with the House just slightly more Christian than the Senate (88%
vs. 87%). And both chambers have a Protestant majority – 55% of representatives
are Protestant, as are 59% of senators.
Within Protestantism, the
largest differences are in Presbyterians (3% in the House vs. 12% in the
Senate) and Protestants who do not specify a denomination (20% in the House,
11% in the Senate).
Catholics make up a larger
share in the House (31%) than in the Senate (24%).
The Senate, meanwhile, has a
higher share of Jewish (8% vs. 6%) and Mormon (3% vs. 1%) members than the
House does.
All of the Muslims, Hindus
and Unitarian Universalists in Congress are in the House, while there is one
Buddhist in each chamber.
The sole religiously
unaffiliated member of Congress (Sinema) is in the Senate, and the only member
in the “other” category (Huffman) is in the House.
Differences by
party
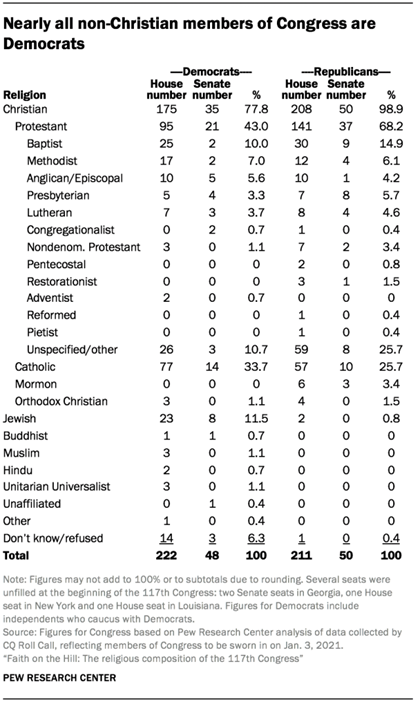 Fully 99% of Republicans in Congress identify
as Christians. There are two Jewish Republicans in the House, Reps. Lee Zeldin
of New York and David Kustoff of Tennessee. New York Rep. Chris Jacobs declined
to specify a religious affiliation. All other Republicans in the 117th Congress
identify as Christian in some way.
Fully 99% of Republicans in Congress identify
as Christians. There are two Jewish Republicans in the House, Reps. Lee Zeldin
of New York and David Kustoff of Tennessee. New York Rep. Chris Jacobs declined
to specify a religious affiliation. All other Republicans in the 117th Congress
identify as Christian in some way.
Most Republican members of
Congress identify as Protestants (68%). The largest Protestant groups are
Baptists (15%), Methodists (6%), Presbyterians (6%), Lutherans (5%) and
Episcopalians (4%). However, 26% of Republicans are Protestants who do not
specify a denomination – up from 20% in the previous Congress. There are 15
Republican freshmen in this category, compared with three Democratic newcomers.
Now that Democratic Sen. Tom
Udall of New Mexico has retired, all nine members of the Church of Jesus Christ
of Latter-day Saints (sometimes called Mormons) in Congress are Republicans.8
Democrats in Congress also
are heavily Christian – much more than U.S. adults overall (78% vs. 65%).9 But the share of Democrats who identify
as Christian is 21 percentage points lower than among Republicans (99%).
Democrats are much less likely than Republicans to identify as Protestant (43%
vs. 68%). Conversely, Catholics make up a higher share among Democrats than
they do among Republicans (34% vs. 26%).
Among Democrats, 11% are
Jewish, and 6% did not specify a religious affiliation. All of the Unitarian
Universalists (3), Muslims (3), Buddhists (2) and Hindus (2) in Congress are
Democrats, as are the single members in the “other” and religiously
unaffiliated categories.
First-time members
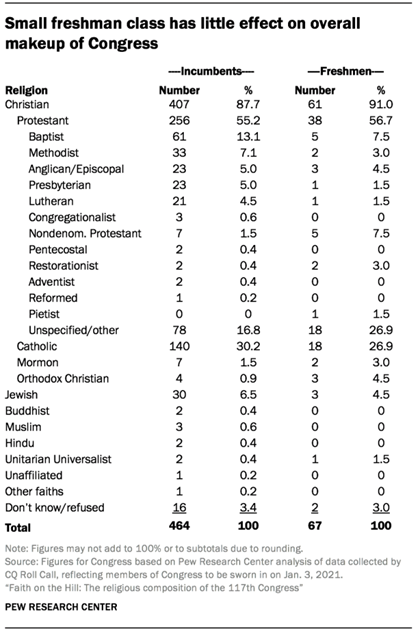 While the small freshman class of the 117th
Congress does little to change the overall makeup of the body, there are some
notable differences in religious affiliation between incumbents and freshmen.
While the small freshman class of the 117th
Congress does little to change the overall makeup of the body, there are some
notable differences in religious affiliation between incumbents and freshmen.
The freshman class is
slightly more Christian
than its incumbent counterpart. Just six of the 67 new members are not
Christian: Three are Jewish, one is a Unitarian Universalist and two declined
to share an affiliation.
The largest difference
between newcomers and incumbents is in the share of Protestants who do not
specify a denomination – 27% of freshmen are in this category, compared with
17% of incumbents. Similarly, those who specifically describe themselves as
nondenominational Protestants make up 2% of incumbents and 7% of freshmen.
Among freshmen, there are
two Restorationists – the same number as there are among incumbents.
Other Protestant subgroups
are smaller among newcomers than they are among incumbents. For example,
freshmen are less likely than incumbents to be Baptists (7% vs. 13%) or Methodists
(3% vs. 7%).
Catholics, who make up 30%
of Congress and 30% of incumbents, make up a smaller share of freshmen (27%).
Orthodox Christians, on the other hand, make up just 1% of incumbents and 4% of
freshmen (three new members).
Looking back
While the U.S.
population continues to become less Christian, Congress has held relatively steady in recent
years and has remained heavily Christian. In the 87th Congress (which began in
1961), the earliest for which aggregated religion data is available, 95% of
members were Christian, which closely matched the roughly 93% of Americans who
identified the same way at the time, according to historical religion data from Gallup.
Since the early ’60s, there
has been a substantial decline in the share of U.S. adults who identify as
Christian, but just a 7-point drop in the share of members of Congress who
identify that way. Today, 88% of Congress is Christian, while 65% of U.S.
adults are Christian, according to Pew Research Center surveys.

(PEW)
January 04, 2021
Source:
https://www.pewforum.org/2021/01/04/faith-on-the-hill-2021/
671-43-20/Country Profile: United
States


SUMMARY
OF POLLS
ASIA
(Japan)
Teachers in record numbers
take leave for mental illnesses
A record number
of public school teachers took leaves of absence for mental illnesses in fiscal
2019 while a near-record number were disciplined for committing obscene acts
against children, an education ministry survey showed. According to the survey
results, released on Dec. 22, 5,478 teachers and staff members at public
elementary, junior high, high and special-needs schools took time off in fiscal
2019 due to mental illnesses, such as depression. In fiscal 2018, 817 teachers
and staff member quit their jobs to deal with their illnesses, also a record
high, the ministry said. (The Asahi Shimbun)
December 23, 2020
MENA
(Egypt)
AD of the month EGY –
Schweppes December 2020
In December, the
brand with the highest uplift in Ad Awareness score across the MENA markets was
Schweppes in Egypt. The back end of November and early December saw Coca Cola
owned brand, Schweppes, launching a campaign featuring Egyptian actor, writer
and film producer Asser Yasin. Followed by Egypt based Tunisian actress Dorra
Zarrouk featuring in video, billboard and social media advertising with the tag
line ‘it’s Schweppes time’. (YouGov)
January 03, 2020
AFRICA
(Nigeria)
End of Year 2020 Poll
Result
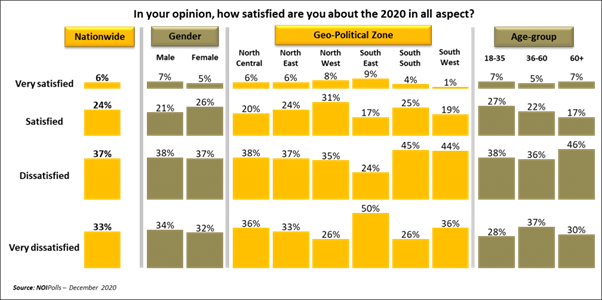
A new public
opinion poll released by NOIPolls has revealed that majority of Nigerians (70
percent) asserted that they are not satisfied with the year 2020 in all
aspects. Analysis by geo-political zone revealed that the South-West zone had
the highest number of Nigerians who made this assertion. According the poll
there are four major areas of shortfalls in the country namely: economic
hardship, Security, unemployment rate and stagnant educational system, which
informed their being dissatisfied with the year 2020. (NOI Poll)
December 27, 2020
EUROPE
(Russia)
Sociologists found out who Russians trust during
the second wave of the pandemic
In the list of public people who inspire
the greatest confidence in Russians, castlings have
occurred since autumn. This is stated in the study "Top-100"
Trust Rating "Romir" (available from
RBC). Sociologists release similar studies every three months. The top
five of the rating included President Vladimir Putin, Defense Minister Sergei
Shoigu (he climbed three points since the fall); the third place, as in the
fall, is taken by the leader of the Liberal Democratic Party Vladimir
Zhirinovsky. (Romir Research)
December 30, 2020
(Russia)
Russians have a sharp increase in spending before
the New Year
On the eve of the New Year, Russians'
spending is traditionally growing. But this year, citizens have started
spending even more than before. From December 21 to December 27, the
average Russian citizen spent 5967 rubles on purchases. This is 914 rubles
more than in the previous week, and 55 more than in the same period last year. This
is evidenced by the data of the "Romir"
holding, which are at the disposal of kp.ru. (Romir
Research)
December 30, 2020
(Finland)
The Corona era has raised
the importance of parcel machines to their peak
The importance of postal services has
grown steadily year by year; now 72% of Finns need postal services in
connection with or in the vicinity of grocery stores, compared to 47% ten years
ago. The importance of the parcel machine has grown the most, and it has
become the most important additional service in connection with a grocery
store. Vending machines are especially important for families under the
age of 45 and families with children. (Taloustutkimus)
December 15, 2020
(Ireland)
World survey shows 7 in 10 Irish people likely to
get COVID-19 vaccine
WIN International, the world’s leading
association in market research and polling, of which RED C Research is the
Irish member, has published the first release from the Annual WIN World Survey
(WWS – 2020) exploring the views and beliefs of 26,757 people from 32 countries
across the globe about the pandemic. The first release analyses views and
opinions related to the vaccine, the way governments handled the health crisis,
the capacity of the national health systems, and the likelihood of travelling in
2021. (Red C)
December 28, 2020
(UK)
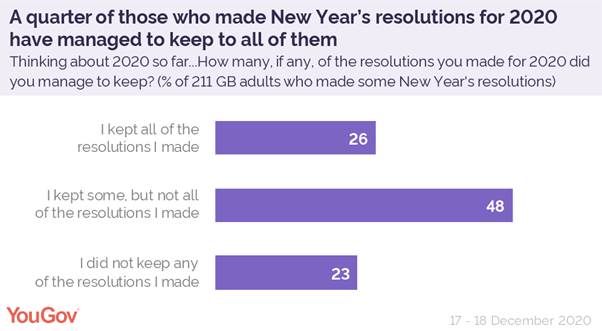
Who kept their 2020 New
Year’s resolutions? And how many are making them for 2021?
Overall, 12% of Britons made New Year’s
resolutions for 2020, although this is fewer than half of the 27% who said they
were planning on doing so when we asked in December 2019. Resolutions proved
most popular among the young; nearly a quarter (24%) of those aged 18-24 made a
resolution compared to just 6% of the 65+ age group. However, with 2020 being
the way it was, how many made good on their promises to themselves? Of those
who made resolutions, only a quarter kept all of them (26%), although half
managed to keep some of them (48%). Around a quarter failed entirely (23%).
(YouGov)
December 30, 2020
(UK)
Few think the EU trade deal is good for Britain, but most want MPs to
accept it
With MPs set to vote
on the EU trade deal this afternoon, a new YouGov survey finds that a majority
of Britons want to see the agreement accepted. By a wide margin of 57% to 9%,
the public want to see the deal passed. Majorities of both Leave voters (69%)
and Remain voters (58%) want to see Parliament pass the deal, as do 78% of
Conservative voters. (YouGov)
December 30, 2020
(UK)
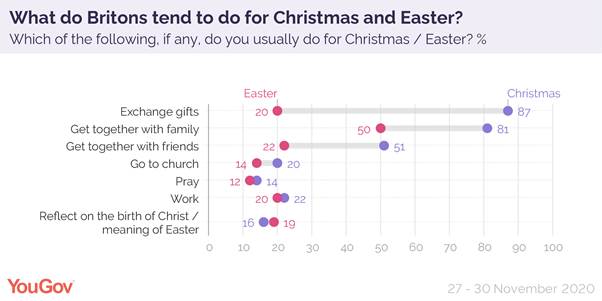
How Britons celebrate Christmas and Easter
Christmas and Easter are both religious
holidays – two of the most important in Christianity – but that is not how
either is celebrated in the public, YouGov research has found. When it comes to
Christmas, six in ten of those who celebrate the holiday (61%) say they
celebrate it as a completely secular event. For three in ten (31%) it’s a
combination of religious and secular. Just 4% of Britons say they celebrate
Christmas purely as a religious event. (YouGov)
December 2, 2020
(UK)
Six in ten of the GB adults believe British businesses behave ethically
for the second year running
An annual Ipsos MORI survey conducted for
the Institute of Business Ethics on the attitudes of the British public to
business ethics has found. Close to six in ten (59%) of the public say that
British business behaves ‘very’ or ‘fairly’ ethically - this is roughly in line
with results in 2018 and 2019 (61% and 57% respectively). A third (33%) of the
public feel the opposite, saying it behaves ‘not very or ‘not at all’
ethically. (Ipsos MORI)
December 30, 2020
(UK)
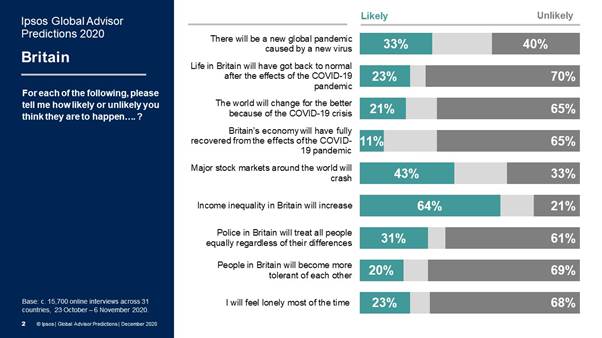
Despite a chaotic 2020,
Britons are feeling good about 2021
Almost three-quarters (73%) of Britons
are optimistic that 2021 will be a better year for them than 2020 according to
the predictions poll from Ipsos Global Advisor. In a new global survey
in 31 countries, a majority of Britons are hopeful for 2021, despite the events
of 2020. Almost three-quarters (73%) are optimistic that 2021 will be a better
year for them than the past 12 months. (Ipsos MORI)
December 28, 2020
NORTH AMERICA
Americans' Average Weight Holds Steady in 2020
Americans' self-described weight remains roughly the same as last
year with 41% saying they are overweight, similar to
the 42% reporting this in 2019. Meanwhile, just over half (now 51%) continue to
say their weight is about right, while a small percentage (6%) report being
underweight. (Gallup USA)
January 04, 2020
Faith on the Hill
When it comes to religious affiliation, the
117th U.S. Congress looks similar to the previous Congress but quite different
from Americans overall. While about a quarter (26%) of U.S. adults are
religiously unaffiliated – describing themselves as atheist, agnostic or
“nothing in particular” – just one member of the new Congress (Sen. Kyrsten
Sinema, D-Ariz.) identifies as religiously unaffiliated (0.2%). (PEW)
January 04, 2021
Donald Trump, Michelle
Obama Most Admired in 2020
Americans are most likely to name President
Donald Trump and Michelle Obama as most admired man and woman in 2020. Trump
tied former President Barack Obama for the honor last year but edged out his
predecessor this year. Trump's first-place finish ends a 12-year run as most
admired man for Obama, tied with Dwight Eisenhower for the most ever.
Meanwhile, Michelle Obama ranks as most admired woman for the third year in a row.
Vice President-elect Kamala Harris is second. (Gallup USA)
December 29, 2020
AUSTRALIA
Now 77% of Australians
would get a vaccine for COVID-19 – down 10% points since April 2020
Of all Australians
three-in-four (77%, down 10% points on April 2020) say they are willing to be
vaccinated for Coronavirus if a new vaccine becomes publicly available, while a
small 12% (up 5%) of Australians are not willing and 11% don’t know, according
to a special Roy Morgan survey of an Australia-wide cross-section of 1,008
Australians aged 18+ conducted in November 2020. (Roy Morgan)
December 22, 2020
MULTICOUNTRY STUDIES
U.S. and U.K. are
optimistic indicators for COVID-19 vaccination uptake
New Ipsos-World Economic Forum survey following the release of a vaccine in the U.S. and U.K finds intentions to get vaccinated up in both countries, but down in several others as many worry about side effects. A new Ipsos survey conducted in partnership with the World Economic Forum after the first COVID-19 vaccinations in the United States and the United Kingdom points to a recent uptick in vaccination intent in both countries. (Ipsos)
December 29, 2020
Fear and Social Distancing: Global Perceptions of
Risk Vary
The COVID-19 pandemic has shown us that the
perception of risk affects public health policy -- and public behavior -- as
much as actual risk. Results from the Lloyd's Register Foundation World
Risk Poll, a global survey conducted before the COVID-19 pandemic, show that
countries racked by greater levels of worry about being harmed in the course of
daily life often went on to adopt stricter COVID-suppression policies and
behaviors. (Gallup USA)
December 28, 2020
ASIA
671-43-01/Poll
Teachers in record numbers take leave for mental illnesses
A record number of public school teachers took leaves of absence for
mental illnesses in fiscal 2019 while a near-record number were disciplined for
committing obscene acts against children, an education ministry survey showed.
According to the survey results, released on Dec. 22, 5,478 teachers and
staff members at public elementary, junior high, high and special-needs schools
took time off in fiscal 2019 due to mental illnesses, such as depression. In
fiscal 2018, 817 teachers and staff member quit their jobs to deal with their
illnesses, also a record high, the ministry said.
The ministry also said disciplinary action was taken against 273 teachers
and staff in fiscal 2019 for sexual harassment or obscene acts, nearing the
record of 282 set in fiscal 2018.
Of the 273, 126 were disciplined for obscene acts on children, and 121 of
them were dismissed from their jobs.
Overall, 153 educators lost their jobs because of their behavior.
Eighty-four of the 273 educators were disciplined for “touching bodies,”
49 “had sexual intercourse” and 33 used cameras for voyeurism or peeped,
according to the survey.
Twenty-four were disciplined for a verbal sexual harassment, followed by
23 for kissing and 19 for sexual harassment through texts and images.
Many of the incidents occurred at hotels or in classrooms and other rooms
on the school campus.
The ministry said the trend is “extremely grave,” and it will consider
implementing measures, such as banning teachers from having private
conversations with students on social media, which have led to some of the
cases.
The survey covered all 47 prefectures as well as 20 government-designated
major cities.
To deal with the mental illness problem, the ministry said it will reform
working practices by thoroughly managing work hours and setting up consulting
service windows.
Educators have shouldered a heavier work burden while dealing with the
novel coronavirus pandemic, the ministry said.
The ministry said it has received reports that many teachers have been
forced to work overtime and must respond to excessive demands from parents.
According to the ministry, the workload has increased for teachers while
the ministry’s curriculum guideline has become more complex.
In addition, teachers of the postwar baby-boom generation have begun
retiring, putting young and middle-aged educators under more pressure.
The number of leaves of absences from public schools in fiscal 2019 was
266 more than in the previous fiscal year, and accounted for 0.59 percent of
the number of teachers on duty, the second highest ratio recorded.
In fiscal 2019, 649 teachers and staff at special-needs schools, or a
record high 0.72 percent of all staff members, took leaves of absence.
The numbers were 2,647 teachers and staff at elementary schools, or 0.64
percent, 1,387, or 0.6 percent, at junior high schools, and 768, or 0.42
percent, at high schools.
By age group, 1,477 educators in their 30s, or 0.76 percent, took leaves
of absence, followed by 1,380, or 0.67 percent, in their 40s, and 1,789, or
0.55 percent, in their 50s.
Okinawa Prefecture had the highest ratio of 1.24 percent, or 190, of
educators taking time off among all prefectures and government-designated major
cities, followed by Kawasaki with 1.05 percent, or 69 educators, Osaka’s 1.02
percent, or 133, and Kobe’s 0.98 percent, or 81.
Tokyo saw 633 educators take leaves of absence, while Yokohama had 161,
both accounting for 0.97 percent.
December 23, 2020
Source:
http://www.asahi.com/ajw/articles/14052961
MENA
671-43-02/Poll
AD of the month EGY – Schweppes December 2020
During December 2020, Schweppes achieved the highest uplift
in Ad Awareness of any brand in Egypt
The back end of November and
early December saw Coca Cola owned brand, Schweppes, launching a campaign
featuring Egyptian actor, writer and film producer Asser Yasin. Followed by
Egypt based Tunisian actress Dorra Zarrouk featuring in video, billboard and
social media advertising with the tag line ‘it’s Schweppes time’.
The adverts feature the stars ignoring all the calamities happening
around them, to sit and enjoy a drink of Schweppes, because ‘it’s Schweppes
time’. In relation to all the current events in the world, the advert has
clearly resonated with the audience.
The percentage of the adult online population in Egypt that said they had
seen a Schweppes advert in the last two weeks, jumped from 25.3% at the
beginning of December to peak at 32.6% - an uplift of +7.3%.
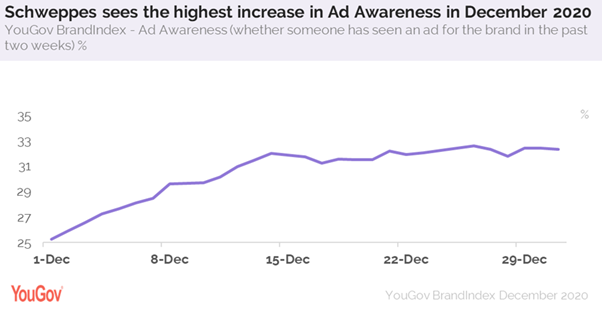
That is on top of the 5% uplift already seen towards the end of November
(from 20.1% to 25.3%).
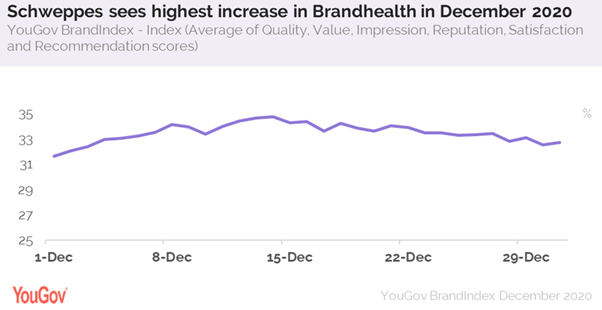
Apart from increasing Ad Awareness, we can see that brand health scores
also improved over this time period from 31.6 to 34.7 at it’s peak
mid-December, and despite tailing off marginally, it remained above 31.6 points
from 1st December to close the month at 32.7.
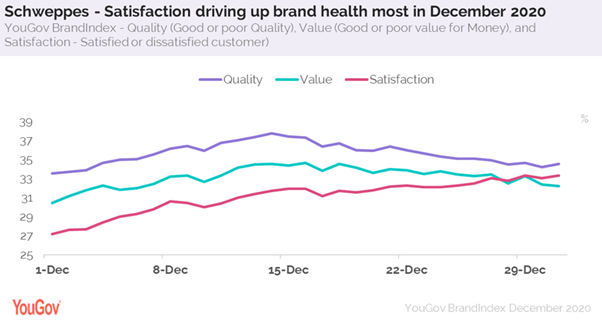
Satisfaction towards the brand is the clear driver for this uplift in
brand health scores and we can see this continued to grow during the month,
whilst other brand health metrics declining can explain the dip in brand health
scores beyond mid-December.
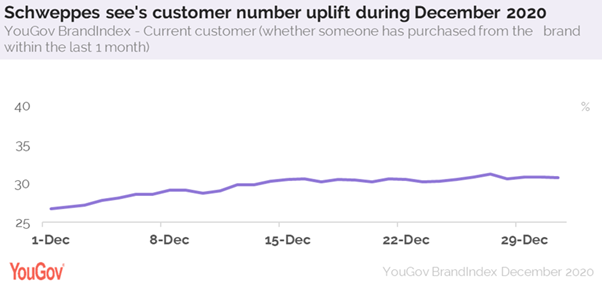
Looking further along the funnel we can see there was also an uplift in
current customers, so this campaign shifted the needle in terms of customer
behaviour as well driving customers to the brand.
What remains to be seen is whether the brand can maintain the momentum,
and retain the higher volume of customers over the longer term. We will
continue to monitor the success in BrandIndex, YouGov’s daily brand perception
tracking study.
January 03, 2020
Source:
https://mena.yougov.com/en/news/2021/01/07/ad-month-egy-schweppes-december-2020/
AFRICA
671-43-03/Poll
End of Year 2020 Poll Result
A new public opinion poll released by NOIPolls has
revealed that majority of Nigerians (70 percent) asserted that they are not
satisfied with the year 2020 in all aspects. Analysis by geo-political zone
revealed that the South-West zone had the highest number of Nigerians who made
this assertion. According the poll there are four major areas of shortfalls in
the country namely: economic hardship, Security, unemployment rate and stagnant
educational system, which informed their being dissatisfied with the year 2020.
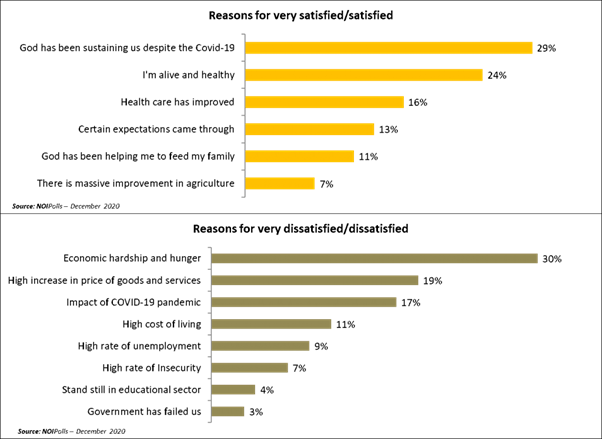
Specifically, poll revealed that 30 percent of
the respondents disclosed that they are dissatisfied mostly because of the
economic hardship and hunger they faced this year. Also, 19 percent mentioned
high increase in prices of goods and services, 17 specified that it was due to
the impact of COVID-19 pandemic while 11 percent attributed their
dissatisfaction to high cost of living in the country. Other reason mentioned
are ‘high rate of unemployment’ (9 percent), ‘high rate of insecurity’ (7
percent), ‘stand still in the educational sector’ (4 percent) and that the
‘government has failed us’ (3 percent).
On the contrary, out of the 30 percent who claimed that they were
satisfied, 29 percent mentioned ‘God’s sustenance despite COVID-19 pandemic’,
24 percent said ‘I am alive and healthy’, 16 percent stated ‘healthcare has
improved’ while 13 percent cited that ‘certain expectation came through this
year’. This implies that despite the negative impacts of COVID-19 in Nigeria
the poll suggests that about a-third (30 percent) of Nigerians nationwide do
have some positive assertions about year 2020 – the most interesting thing from
this category of respondent is their perceived improvement in Nigeria’s sector
health sector and massive development in the agricultural sector.
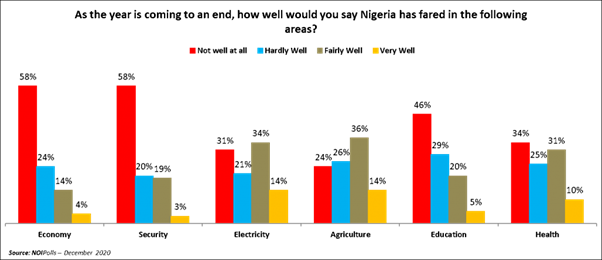
Consequently, the poll assessed the opinion of Nigerians regarding how
well we have fared as nation in certain areas with regards to the year 2020.
Hence, the analysis of results revealed that the Economy, Security and the
Education sectors took the hardest hit as at least 75 percent of Nigerians are
of the opinion that the nation has not fared well in the areas of: Economy,
Security and Education. Specifically, 82 percent of Nigerians stated that the
nation has not fared well in the area of the economy, more so, 78 percent of
Nigerians asserted that the country has not fared well in the area of security
and 75 percent of Nigerians nationwide stated that the country has not fared
well in the area of Education.
Finally, the poll having assessed the perception and the opinions of
Nigerians regarding 2020, Nigerians mentioned four key areas of shortfalls
in the country: economic hardship, Security, unemployment rate and stagnant
educational system, which informed their being dissatisfied with the year 2020.
Concerning areas of focus where the citizenry think that the nations has not
fared well in the 2020, the poll also revealed that the Economy, Security and
Education sectors are the hardest hit or poorly performing sectors with at
least about 75 percent of Nigerians across all regions affirming this.
Therefore, the poll having highlighted these hardest hit sectors, it is
important that government and stakeholders in all three sectors highlighted
herein move quickly to address all the challenges inhibiting the growth of this
three sectors and drive growth in these sectors in the year ahead. These are
the key highlights from the End of Year Poll conducted in the week
commencing December, 14th 2020.
Survey Background
End of the year for a typical Nigerian is a period for different
celebrations, with diverse festivities ranging from parties to carnivals,
social gatherings, family/school reunions, cultural fairs to annual sporting
and art events, etc. To some Nigerians, it is a time to reflect on what they
have achieved thus far and what to expect in the coming year.
However, the year 2020 is particularly a unique year given the impact of
Coronavirus on the livelihoods of the citizenry as a result of measures that
were put in place by government reduce the spread of the virus. Against this
backdrop, NOIPolls conducted a survey to gauge the perceptions and opinions of
Nigerians regarding the year 2020 as a whole.
Survey Findings
Given that 2020 is a unique and eventful year, the first question gauged
the level of satisfaction of the respondents. The poll result revealed that
majority of Nigerians (70 percent) asserted that they are not satisfied with
the year 2020 as a whole. Analysis by geo-political zone revealed that the
South-West zone represented that highest number of Nigerians who made this assertion.
Also, with regards to age-group, analysis showed that the level of
dissatisfaction increases as the age-group increased hence, Nigerians aged 60
and above had more respondents (76 percent) who were dissatisfied in this
category.
On the other hand, 30 percent of the respondents mentioned that they are
satisfied with the year 2020 as a whole and Nigerians living in the North-West
zone had more respondents who stated this.
Subsequently, 70 percent of the respondent who stated that they were dissatisfied
were further probed and analysis showed that there are 4 major categories of
issues, such as economic hardship, Security, unemployment rate and stagnant
educational system, which informed their being dissatisfied with the year 2020.
Specifically, poll revealed that 30 percent of the respondents disclosed that
they are dissatisfied mostly because of the economic hardship and hunger they
faced this year. Also, 19 percent mentioned high increase in prices of goods
and services, 17 specified that it was due to the impact of COVID-19 pandemic
while 11 percent attributed their dissatisfaction to high cost of living in the
country. Other reason mentioned are ‘high rate of unemployment’ (9 percent),
‘high rate of insecurity’ (7 percent), ‘stand still in the educational sector’
(4 percent) and that the ‘government has failed us’ (3 percent).
On the contrary, respondents who mentioned that they are satisfied with
current year stated the top 4 reasons for their satisfaction were: ‘God’s
sustenance despite COVID-19 pandemic’ (29 percent), ‘I’m alive and healthy’ (24
percent), ‘healthcare has improved’ (16 percent) and their ‘certain expectation
came through’ (13 percent). This implies that despite the negative impacts of
COVID-19 in Nigeria the poll suggests that about a-third (30 percent) of
Nigerians nationwide do have some positive assertions about year 2020 – the
most interesting thing from this category of respondent is their perceived
improvement in Nigeria’s sector health sector and massive development in the
agricultural sector. In their opinion the COVID-19 pandemic has forced our
leadership to focus more on the lapses and gaps in the Nigerian health sector
as well as make tremendous effort in the area of agricultural development in
the current year.
Furthermore, the poll assessed the opinion of Nigerians regarding how
well we have fared as nation in certain areas with regards to the year 2020.
Hence, the analysis of results revealed that the Economy, Security and the Education sectors
took the hardest hit as a result of the COVID-19 pandemic; as at least 8 in 10
Nigerians nationwide are of the opinion that the nation has not fared well in
the area of: Economy, Security and Education. Specifically, 82 percent (58
percent + 24 percent) of Nigerians stated that the nation has not fared well in
the area of the economy, more so, 78 percent (58 percent + 20 percent) of
Nigerians asserted that the country has not fared well in the area of security
and 75 percent (46 percent + 29 percent) of Nigerians nationwide stated that
the country has not fared well in the area of Education.
Additionally, 52 percent (31 percent + 21 percent) of Nigerians do not
think that the nation has fared well in the areas of Electricity in the year
2020, furthermore, 50 percent (24 percent + 26 percent) of Nigerians nationwide
stated that the nation has not fared well in the area of Agriculture and 59
percent (34 percent + 25 percent).
Conclusion
In conclusion, the poll has revealed that a larger proportion of
Nigerians (70 percent) are dissatisfied with the year 2020 mainly due to four
key areas of shortfalls in the country namely economic hardship, Security,
unemployment rate and stagnant educational system. Concerning areas of focus
where the citizenry think that the nations has not fared well in the 2020, the
poll also revealed that the Economy, Security and Education sectors are the
hardest hit sectors with at least about 75 percent of Nigerians across all
regions affirming this. Therefore, the poll having highlighted these hardest
hit sectors, it is imperative that government and stakeholders in all three
sectors highlighted here move swiftly to address all the challenges obstructing
the growth of this three sectors and drive growth in these sectors in the year
ahead.
December 27, 2020
Source:
https://noi-polls.com/end-of-year-2020-poll-result/
EUROPE
671-43-04/Poll
Sociologists found out who Russians trust during the second wave of the pandemic
In the list of public people who inspire the greatest confidence in Russians, castlings have occurred since autumn. This is stated in the study "Top-100" Trust Rating "Romir" (available from RBC). Sociologists release similar studies every three months.
The top five of the rating included President Vladimir Putin, Defense Minister Sergei Shoigu (he climbed three points since the fall); the third place, as in the fall, is taken by the leader of the Liberal Democratic Party Vladimir Zhirinovsky. Foreign Minister Sergei Lavrov dropped two points in three months (from second to fourth position). In fifth place is Prime Minister Mikhail Mishustin, followed by TV presenter Andrei Malakhov (both moved up one point in comparison with the autumn rating). They are followed by actor Konstantin Khabensky (+2 points) and TV presenter Ivan Urgant (+3 points). Oppositionist Alexei Navalny (he dropped five points in comparison with the previous rating) and TV presenter Vladimir Solovyov, whose rating remained unchanged, round out the top ten.
Methodology
In total, 2.4 thousand people over 14 years old from cities with a population of 100 thousand people or more participated in the Romir study. Answering the open question "Which of the public figures of Russia do you trust?", They could independently choose up to seven persons. Based on the survey results, a point rating of individuals was compiled. The votes cast for each person were counted taking into account the place of his mention. That is, the one whom the respondent named first received seven points, the second - six, and so on up to seventh place. The survey took place through special software, according to the study.
In the presence of a large number of creative intelligentsia, scientists and regional leaders are practically absent in the rating, said Andrey Milekhin, the head of "Romir", vice-president of Gallup International, commenting on the study. “In general, in the top 100, the situation is returning to the one that developed about a year ago, when bloggers began to crowd out TV hosts,” he said. "The pandemic has thrown this process back, but now we are seeing a return of this trend." The sociologist explains Putin's permanent leadership in the rating by the fact that the president remains the leader of the majority.
(Romir Research)
December 30, 2020
671-43-05/Poll
Russians have a sharp increase in spending before the New Year
On the eve of the New Year, Russians' spending is traditionally growing. But this year, citizens have started spending even more than before. From December 21 to December 27, the average Russian citizen spent 5967 rubles on purchases. This is 914 rubles more than in the previous week, and 55 more than in the same period last year. This is evidenced by the data of the "Romir" holding, which are at the disposal of kp.ru.
The weekly bill (the average cost of one purchase), in turn, increased to 700 rubles.
- The growth of the indices is associated with the pre-holiday period, and the reason for the higher annual growth is that this year Russians travel less and stay at home more. They have freed up some of the funds that were spent on gifts, a festive table and other festive preparations, ”explains the executive director of Romir Inna Karaeva.
Earlier, "Romir" published a study on the increase in free money among Russians. Their volume increased by 4.7% compared to November last year.
(Romir Research)
December 30, 2020
Source: https://romir.ru/press/komsomolskaya-pravda--u-rossiyan-rezko-vyrosli-rashody-pered-novym-godom
671-43-06/Poll
The Corona era has raised
the importance of parcel machines to their peak
According to the Finland Eat survey, more and more Finns consider the
availability of postal services and parcel machines important in connection
with or in the immediate vicinity of the grocery store. This reflects the
strong growth of e-commerce during the Korona era, and the importance of
services will certainly only increase as Christmas approaches.
The importance of postal services has grown steadily
year by year; now 72% of Finns need postal services in connection with or
in the vicinity of grocery stores, compared to 47% ten years ago. The
importance of the parcel machine has grown the most, and it has become the most
important additional service in connection with a grocery store. Vending machines
are especially important for families under the age of 45 and families with
children.
The decrease in the use of cash is clearly reflected in the decline in the
importance of ATMs. However, ATMs are still an important service for 67%
of Finns, especially for those over 54, but also for young people (15–24
years).
63% of Finns want a pharmacy in connection with or in the vicinity of the
grocery store. The importance of this service is emphasized by older age
groups as well as parents of young children. In connection with the
grocery store, it is worth investing in at least postal services, a parcel
machine, an ATM and a pharmacy. Together, these key services reach a wide
audience.
(Taloustutkimus)
December 15, 2020
671-43-07/Poll
World survey shows 7 in 10 Irish people likely to get COVID-19 vaccine
The first release analyses views and opinions related to the vaccine, the
way governments handled the health crisis, the capacity of the national health
systems, and the likelihood of travelling in 2021.
HEADLINES –
IRELAND
Getting the
COVID-19 Vaccine
- The majority (71%) of Irish people say they will get the
COVID-19 vaccine, with nearly 2 in 5 (38%) saying they will definitely get
it. 1 in 10 definitely will not.
- Slightly more men saying they will get it than women
(76% vs 66%).
- People in the vulnerable ‘over-55s’ category (81%) as
well as higher social grades (77%) are most likely to say they will get
the vaccine.
- This places Ireland at the global average, behind the UK
(81%), but ahead of European countries like Germany (65%) and France
(44%).
Rating the Irish
government’s performance during COVID-19
- More than 6 in 10 (63%) Irish people feel that the Irish
government has performed well in handling the crisis. This compares to
only 35% of those surveyed in the UK who believe the British government
has performed well.
- Those in older 55+ age groups (78%) and higher social
grades (70%) have been especially happy with the government’s actions,
while groups disproportionately affected by the crisis (18-34’s and lower
social grades) are more critical of the government.
- Compared to the other 31 countries surveyed, Irish
people are on average happier with the government’s response to the
pandemic, with the same favourability rating as in Germany (61%), where
the government has been internationally praised for their reaction to the
crisis.
Rating the
Health System’s capacity during COVID-19
- Over half of those surveyed have a poor view of the
capacity of the Irish health system, with 1 in 5 rating it ‘very badly’
and 18-34’s being most critical.
- Just under half (46%) rate the capacity of the Irish
health system positively.
- Irish people have been less satisfied with the capacity
of the health service to cope with the crisis than in most other countries
surveyed, including Germany (81%), the United Kingdom (71%), and the
United States (62%).
Travel in
2021
- Although less than 4 in 10 Irish people (38%) say they
are likely to take a foreign holiday in 2021, this is significantly above
the global average (29%) and is also on par with the United Kingdom (37%)
and Germany (39%).
- In terms of business travel, fewer than 1 in 10 Irish
people (7%) anticipate travelling abroad for business during 2021,
compared to an international average of 17%.
HEADLINES –
WORLD
The Vaccine
- Globally, the vast majority of people (71%) say they are
likely to be vaccinated against COVID-19 when a vaccine is available, with
lower education levels and unemployed peoples expressing less interest in
getting vaccinated.
- Among the regions, APAC (80%) is most willing to be
vaccinated, with Vietnam (98%), and China (91%) being the countries that
lead the world ranking. On the other hand, in countries such as Serbia
(62%), Croatia (59%), France (56%) and Lebanon (56%), the vast majority of
the population is still not convinced to get vaccinated.
- Considering that each country has to get a minimum of
65% vaccine take up to achieve herd immunity, there is important work to
be done in terms of information and awareness to convince especially those
people who say that they probably won´t get vaccinated (17%), a percentage
that varies among countries. It is important to consider that 12% don’t want
to receive the vaccine against Covid-19.
Governments and
the Health System
- The APAC region stands out again when it comes to
positively evaluating the way in which the government handled the pandemic
crisis (73%) and the capacity of the health system (79%).
- The countries that best evaluated both institutions are
China and Vietnam with scores that exceeded 90% approval, while Poland
(81%), Spain (72%), Lebanon (72%) and Ecuador (70%) harshly evaluated the
actions of their governments.
- When rating their health system, Poland (87%) and
Ecuador (78%) come up again among the countries who gave a stricter
evaluation, followed by Perú with a rating of 70% (rather badly + very
badly).
Travelling in
2021
- Regarding the possibility of travelling abroad in 2021,
either for holidays or work, 65% and 77% see it as unfeasible
respectively.
- However, there are certain countries with a greater
predisposition to travel: at the top of the list is Nigeria with a score
above 50%. China reports one of the highest level of people willing to
vaccinate and at the same time the lowest level of intention to travel
next year.
December 28, 2020
Source: Post Cornavirus times - RedC Research & Marketing
671-43-08/Poll
Who kept their 2020 New
Year’s resolutions? And how many are making them for 2021?
Upping their
exercise is top among Britons making a resolution for 2021
With the New Year on the horizon, YouGov explores how
Britons got on with their resolutions they made for 2020, and how many plan on
making new ones for the coming year.
Nearly a quarter
of Britons who made a resolution for 2020 failed to keep any of their
promises
Overall, 12% of Britons made
New Year’s resolutions for 2020, although this is fewer than half of the 27% who
said they were planning on doing so when we asked in December 2019.
Resolutions proved most popular among the young; nearly a quarter (24%) of
those aged 18-24 made a resolution compared to just 6% of the 65+ age group.
However, with 2020 being the way it was, how many made good on their
promises to themselves? Of those who made resolutions, only a quarter kept all
of them (26%), although half managed to keep some of them (48%). Around a
quarter failed entirely (23%).
Despite coronavirus, the proportion of
resolution-makers saying they have kept all their resolutions is around the
same as it was in 2019 (25%).
While a similar proportion of men (10%) and women
(15%) made resolutions for the year, men are more likely to claim they achieved
all their aims (36% vs 20%).
Around a fifth
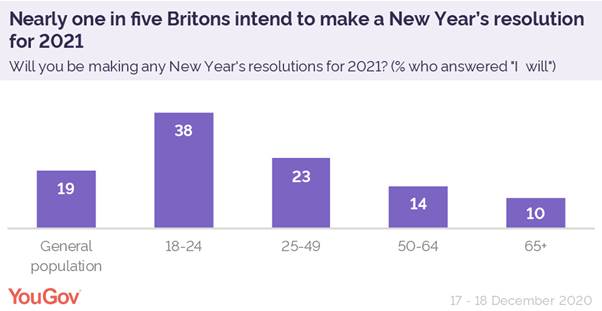
of Britons plan on making New Year’s Resolutions for 2021
Approaching one in five (19%) of Britons say that they
will be making a resolution for 2021, with resolutions again proving most popular
among those aged 18-24, of whom 38% plan on doing so. Of the 65+ age group,
only one in ten (10%) plan on making a resolution.
Women (23%) are more likely than men (15%) to plan on
making resolutions for the New Year. Resolutions are also more popular among
those from an ABC1 background (24%) than those from C2DE backgrounds (13%).
Health dominates
New Year’s resolutions
What resolutions are Britons making? For the second year in a row health dominates the top
three resolutions.
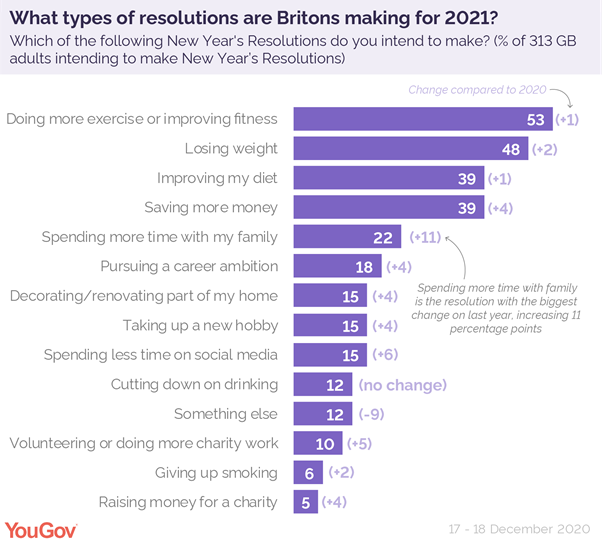
Doing more exercise and improving fitness top the list
of resolutions (53%), with losing weight (48%) the second most popular
resolution, and 39% resolving to improve their diet in 2021. Resolutions around
improving heath are universally more popular with women, with the biggest
difference being changing diet; a resolution for 47% of women making
resolutions compared to 26% of their male counterparts.
The biggest non-health resolution is saving money,
with approaching two in five (39%) resolution-makers aiming to put more money
away this year.
The biggest change year-on-year is with
resolution-makers and their loved ones: 22% of resolutions for 2021 include
spending more time with family members, an increase of eleven percentage points
on 2020. Men are more likely to want to see more of their family than women
(27% v 19%).
In another increase from last year 15% of resolution-makers
aim to spend less time on social media, up six percentage points from last
year.
Some of the resolutions Britons listed in our
‘something else’ category include moving house, passing their driving tests and
“listening to one David Bowie track every day”.
December 30, 2020
671-43-09/Poll
Few think the EU trade deal
is good for Britain, but most want MPs to accept it
Just one in six
think the terms of the agreement represent a good deal
Majorities of both Leave voters (69%) and Remain voters (58%) want to see
Parliament pass the deal, as do 78% of Conservative voters.
Half of Labour voters also want MPs to pass the deal
(48%), four times the number who want them to block it (12%). This will be
welcome news for Keir Starmer, who has come under fire from some within the Labour party for
telling MPs to vote for the deal.
While there is strong support for accepting the deal,
that is not to say that Britons are pleased with the deal. Only 17% say they
think the terms represent a good deal for Britain. Slightly more (21%) think it
represents a bad deal, while another 31% see it as neither good nor bad. A
further one in three (31%) aren’t sure.
Support is lukewarm among Leave voters, with only 27%
saying the deal is a good one, compared to 38% saying it will be neither good
nor bad. Nevertheless, only 10% see it as a bad deal.
By comparison, a YouGov survey in mid-December found that 33% of Leave voters thought
leaving the transition period without a trade deal at all would be good for
Britain, while 32% believed it would make no difference. One in five (20%)
thought it would be bad for the country.
Conservative voters aren’t much more enamoured with
the fruits of Boris Johnson’s labours. One in three (33%) think the deal will
be good for Britain, while another 39% think it will be neither good nor bad.
Just 7% think it will be bad for the country, however.
Labour and Remain voters are much more negative.
Slightly more than a third of each voting group (36-37%) think the deal will be
bad for Britain, with a further 28-29% thinking it will be neither good nor
bad. Only 5% of Labour voters and 9% of Remain voters think the deal will be
good for the UK.
December 30, 2020
671-43-10/Poll
How Britons celebrate
Christmas and Easter
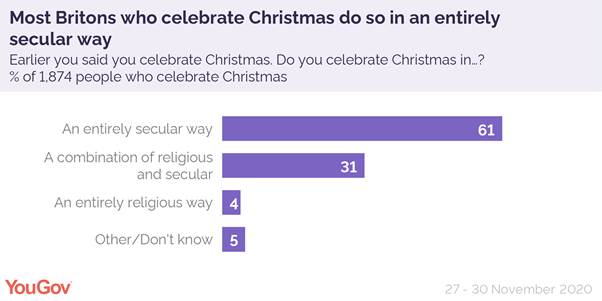
Most Britons
celebrate Christmas and Easter as secular rather than religious events, with
many combining the two aspects
When it comes to Christmas, six in ten of those who celebrate the holiday
(61%) say they celebrate it as a completely secular event. For three in ten
(31%) it’s a combination of religious and secular. Just 4% of Britons say they
celebrate Christmas purely as a religious event.
While going to church used to be commonplace at
Christmas and Easter, few Britons do so now. Only 22% go to church at
Christmas, while 15% do so at Easter (and only 13% do so on both occasions).The
custom of having a decorated tree at a home – which has ancient roots but, in
today’s tradition, dates back to 16th century Germany – is an
unmissable detail, if not the central theme, for almost every Christmas
celebration.
Eight in ten (79%) of Britons say they put up a
Christmas tree at home. This tradition is more popular among women (84%) than
men (78%) and is equally practised across all age groups.
Other Christmas activities Britons partake in include
exchanging gifts (87%), and getting together with family (81%) and friends
(51%). Despite the holiday, a fifth (22%) of Britons say they work during the
Christmas period. One in seven (16%) said they reflect on the birth of Christ,
whilst one in eight (14%) said they pray.
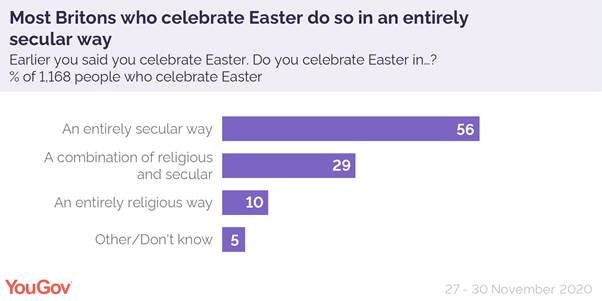
When it comes to the motivations for celebrating
Easter, here too it is primarily secular. The majority of those who observe the
festival (56%) say they do so in an entirely secular way. Only 10% say they do
so in an entirely religious fashion, while 29% combine the two.
Half of Britons (50%) say they get together with
family at Easter, and a fifth (22%) with friends. Far fewer people exchange
gifts at Easter (20%) than at Christmas. Similar numbers, however, say they
reflect on the meaning of Easter (19%), and pray (12%).
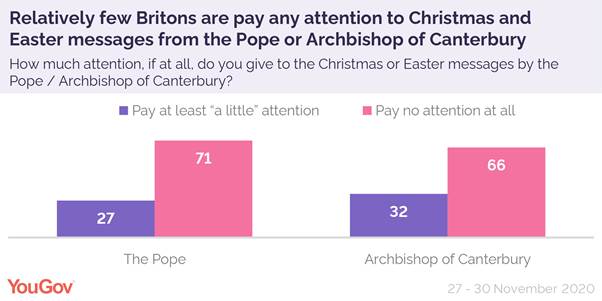
The importance
of Christmas/Easter sermons
The pope’s Christmas and Easter sermons, Urbi et Orbi
– traditionally delivered on Christmas Day/Easter Sunday from the central
balcony of St. Peter’s Basilica in the Vatican – are broadcast to over a
billion people around the world annually. However, in the UK, just a quarter of
Britons (27%) say they pay attention to the Christmas/Easter message by the
Pope, whilst seven in ten (71%) say they pay no attention to this.
Slightly more (32%) pay attention to the
Christmas/Easter message from the Archbishop of Canterbury, but in this case as
well the majority (66%) don’t.
Britons who are 60 and older are more likely to pay
attention to the Christmas/Easter messages from the Pope (36%) or the
Archbishop (46%), but this is still a minority.
December 2, 2020
671-43-11/Poll
Six in ten of the GB adults
believe British businesses behave ethically for the second year running
We have conducted our annual survey for the Institute of Business Ethics on the attitudes of the British public (GB adults 18+) towards business ethics.
An annual Ipsos MORI survey
conducted for the Institute of Business Ethics on
the attitudes of the British public to business ethics has found.
Close to six in ten (59%) of the public say that British business behaves
‘very’ or ‘fairly’ ethically - this is roughly in line with results in 2018 and
2019 (61% and 57% respectively). A third (33%) of the public feel the opposite,
saying it behaves ‘not very or ‘not at all’ ethically.
As in 2019, when asked which issues need to be most
addressed by British businesses, Corporate tax avoidance ranks top, (35%).
Executive pay (21%) has become less of a priority for the public since 2019,
dropping significantly since last year (-8pp). Environmental responsibility
(29%) now takes the second position, continuing its rise as a consumer
priority.
December 30, 2020
671-43-12/Poll
Despite a chaotic 2020,
Britons are feeling good about 2021
In a new global survey in 31 countries, a majority of Britons are hopeful
for 2021, despite the events of 2020. Almost three-quarters (73%) are
optimistic that 2021 will be a better year for them than the past 12 months.
However, many are cautious: less than a quarter (23%)
think it is likely that life will return to normal in the next year; France is
the only country where fewer people expect to see a return to normality.
Indeed, a third of Britons say it is likely that there will be another pandemic
from a new virus.
The starting point is bleak: looking back to 2020,
over 9 in 10 (94%) of Britons say it was a bad year for the country, only those
in Argentina, France and South Africa are more likely to agree (95%). Seven in
ten say 2020 was bad for them and their families, up from 42% who said the same
in 2019.
This new survey finds just 21% of Britons saying it is
likely that the world will change for the better as a result of the pandemic,
with three times as many (65%) saying this is unlikely. Perhaps underpinning
this pessimistic outlook, more than 8 in 10 (83%) in Britain say it is unlikely
the economy will recover from the effects of COVID-19 in the next year, the
highest number among the 31 countries surveyed.
What’s more, over 4 in 10 (43%) expect stock markets
around the world to crash next year. Meanwhile, almost two-thirds (64%) expect
income inequality to rise.
Only 3 in 10 expect police in Britain to treat
everyone equally, regardless of their differences while even fewer expect
people to become more tolerant of one another (20%). Almost a quarter say it is
likely they will feel lonely most of the time (23%).
The biggest threat, as perceived by Britons, is global
warming. Over three-quarters (77%) believe global temperatures will continue to
increase in 2021. Other threats, such as discovery of ghosts, a visit from
aliens and an asteroid hitting the Earth are much less worrying to Brits, only
1 in 10 (9%) think these events are likely.
Other findings
include:
- 58% think the wide distribution of a successful COVID-19
vaccine in Britain is likely
- 6 in 10 (61%) expect to see people wearing face masks in
public places in a year’s time
- Over 4 in 10 (43%) expect the global economy to be
stronger in the coming year
- Nearly 7 in 10 (68%) say it’s likely that they will
spend more money shopping online than in-store next year
- Less than a third (31%) believe women will be paid the
same as men for the same work
- Almost 2 in 5 (38%) think it’s likely they will make a
new friend in their local area next year
- A third (34%) say the number of people living in big
cities is likely to shrink
- While only 14% expect human cloning to be legalised in
some countries next year, 22% think robots will look like, speak like and
think like humans
- A third (32%) say it is likely that one of their online
accounts will be hacked in the year ahead
- Under 1 in 10 (9%) believe humans will become extinct in
the coming year
- Three in 5 (61%) say they will make resolutions for the
year ahead
December 28, 2020
Source: https://www.ipsos.com/ipsos-mori/en-uk/ipsos-mori-britons-predictions-for-2021
NORTH AMERICA
671-43-13/Poll
Americans' Average Weight
Holds Steady in 2020
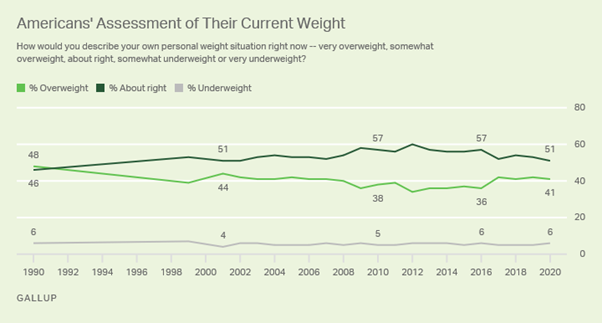
Line graph. Trend since 1990 in Americans' view of
their weight status. The percentage describing themselves as overweight trended
down from 48% in 1990 to 36% in 2016, but has since risen and is 41% in 2020.
The amount that Americans say they weigh also has not
changed, averaging 181 pounds among all U.S. adults. Men report being about 20
pounds heavier than that, averaging 200 pounds, while women say they are about
20 pounds lighter than the overall average, at 162 pounds.
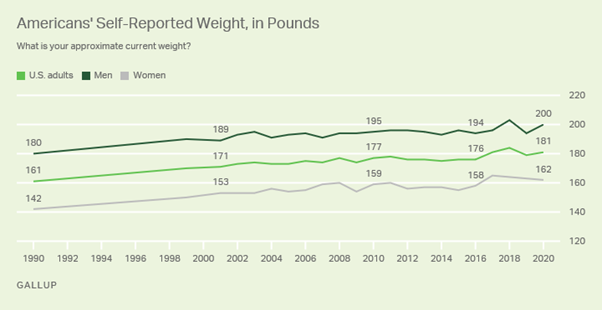
Line graph. Trend since 1990 in Americans'
self-reported weight. This has gradually increased from an average 161 pounds
in 1990 to 181 pounds today. Men and women have shown similar shifts with men's
weight rising from 180 to 200 pounds over this period and women's increasing
from 142 to 162 pounds.
These findings are from Gallup's November Health and
Healthcare poll, conducted this year Nov. 5-19, which has tracked Americans'
self-reports of their current weight and desire to lose weight annually since
2001, with occasional trends dating back to the 1990s or earlier.
Majority Still
Want to Lose Weight
Along with the stability in Americans' average weight,
the percentage who would like to lose weight is unchanged, registering 55% each
of the past two years. Most others (38%) would like to maintain their current
weight, while 7% want to gain weight.
As is typical, women (59%) are slightly more likely
than men (51%) to want to lose weight.
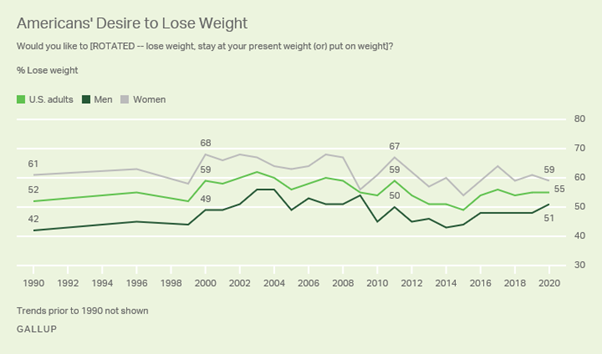
Line graph. Trend since 1990 in Americans'
self-reported desire to lose weight. This has gradually remained the same, with
52% in 1990 and 55% today. Women's desire has remained stable, with 61% of
women wanting to lose weight in 1990 and 59% today; among men, 42% in 1990
wanted to lose weight, while 51% want to lose weight today.
Effort to Lose
Weight Has Waned Among Women
Less than half of those who want to lose weight say
they are seriously trying to do so right now -- with the figure at 23% of all
U.S. adults, including equal percentages of men and women. This compares with
25% of all adults actively trying to lose weight a year ago, and the average
26% seen in the entire past decade, from 2010 to 2019.
Women have become significantly less likely to say
they are working on weight loss in the past year, falling from 29% in 2019 to
23% this year -- their all-time low. The latest decline is also a departure
from the average 30% of women who were trying to lose weight during the 2010s.
Meanwhile, the current 23% of men attempting weight loss has essentially stayed
steady, registering 21% last year and an average 22% in the past decade.
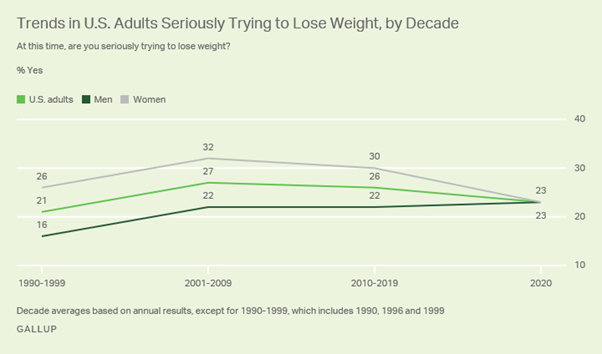
Line graph. Decade averages since 1990 in the
percentage of U.S. adults who say they are seriously trying to lose weight.
This increased from 21% in the 1990s to 27% from 2001-2009. It held at 26% from
2010-2019 but fell to 23% in 2020. The desire to lose weight has held steady
near 22% among since the 2000s while it has decreased among women, falling from
27% to 23%.
Ideal Body
Weight Also Unchanged
At the same time, Americans' concept of their ideal
body weight is unchanged this year, but remains at the higher end of the
historical range following years of gradual increases.
Essentially, as Americans' self-reported weight has
increased over the past two decades, so has their vision of what their perfect
weight should be -- and the 144 pounds that women, on average, identify as
their ideal figure is the highest yet.
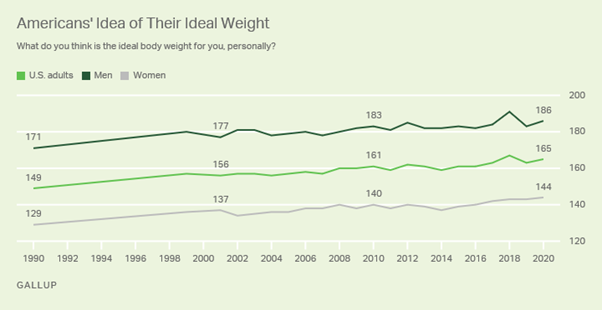
Line graph. Trend since 1990 in Americans view of
their ideal weight in pounds. This has gradually increased from 149 in 1990 to
165 in 2020. Similar increases are seen among men and women, women rising from
129 to 144 pounds and men from 1717 to 186 pounds.
Bottom Line
Despite the risk that various changes in people's
lives and limits on their mobility created by the pandemic would lead to
significant weight gain, this has not occurred according to Americans' own
reports on their weight. But nor have Americans, en masse, used the situation --
including the forced reduction in dining out -- to achieve their weight loss
goals.
The stability in Americans' average weight over the
past year likely reflects a lack of weight change for most people. But that
apparent steadiness may also mask opposing storylines. While some may have
found it easier to diet and exercise during the pandemic, possibly shedding
unwanted pounds, others may have become more sedentary while switching to
remote work or school and struggled to avoid the temptations of overeating at
home, thus gaining weight.
January 04, 2020
Source: https://news.gallup.com/poll/328241/americans-average-weight-holds-steady-2020.aspx
671-43-14/Poll
Faith on the Hill
While about a quarter (26%) of U.S. adults are religiously unaffiliated –
describing themselves as atheist, agnostic or “nothing in particular” – just
one member of the new Congress (Sen. Kyrsten Sinema, D-Ariz.) identifies as
religiously unaffiliated (0.2%).
Nearly nine-in-ten members of Congress identify as
Christian (88%), compared with two-thirds of the general public (65%). Congress
is both more heavily Protestant (55% vs. 43%) and more heavily Catholic (30%
vs. 20%) than the U.S. adult population overall.
Members of Congress also are older, on average, than
U.S. adults overall. At the start of the 116th Congress, the average
representative was 57.6 years old, and the average senator was 62.9 years old.1 Pew Research Center surveys have found that adults in that age
range are more likely to be Christian than the general public (74% of Americans
ages 50 to 64 are Christian, compared with 65% of all Americans ages 18 and
older). Still, Congress is more heavily Christian even than U.S. adults ages 50
to 64, by a margin of 14 percentage points.2
Over the last several Congresses, there has been a
marked increase in the share of members who identify themselves simply as
Protestants or as Christians without further specifying a denomination. There
are now 96 members of Congress in this category (18%). In the 111th Congress,
the first for which Pew Research Center analyzed
the religious affiliation of members of Congress, 39 members described
themselves this way (7%). Meanwhile, the share of all U.S. adults in this
category has held relatively steady.
Over the same period, the total number of Protestants in Congress has
remained relatively stable: There were 295 Protestants in the 111th Congress,
and there are 294 today. The increase in Protestants who do not specify a
denomination has corresponded with a decrease in members who do identify with denominational
families, such as Presbyterians, Episcopalians and Methodists.
Still, members of those three Protestant subgroups
remain overrepresented in Congress compared with their share in the general
public, while some other groups are underrepresented – including Pentecostals
(0.4% of Congress vs. 5% of all U.S. adults), nondenominational Protestants (2%
vs. 6%) and Baptists (12% vs. 15%).3
Jewish members also make up a larger share of Congress
than they do of the general public (6% vs. 2%). The shares of most other
non-Christian groups analyzed in this report (Buddhists, Muslims, Hindus and
Unitarian Universalists) more closely match their percentages in the general
public.
Nearly all non-Christian members of Congress are
Democrats. Just three of the 261 Republicans who were sworn in on Jan. 3 (1%)
do not identify as Christian; two are Jewish, and one declined to state a
religious affiliation.
These are some of the key findings of an analysis by
Pew Research Center of CQ Roll Call data on the religious affiliations of
members of Congress, gathered through questionnaires and follow-up phone calls
to candidates’ and members’ offices.4 The CQ questionnaire asks members what religious group, if any,
they belong to. It does not attempt to measure their religious beliefs or
practices. The Pew Research Center analysis compares the religious affiliations
of members of Congress with the Center’s survey data on the U.S. public.
Little change between 116th and 117th Congresses for most
religious groups
 The overall composition of the new Congress is
similar to that of the previous Congress – in part because 464 of the 531
members of the 117th Congress (87%) are returning members.
The overall composition of the new Congress is
similar to that of the previous Congress – in part because 464 of the 531
members of the 117th Congress (87%) are returning members.
Methodists saw the largest loss – seven seats –
followed closely by Baptists (six seats) and Catholics (five seats). There also
are four fewer Lutherans in the 117th Congress than there were in the 116th. By
contrast, Protestants who do not specify a denomination are up substantially,
gaining 16 seats in the 117th Congress after also gaining 16 seats two years
ago, when the 116th took office. Protestants in the Restorationist family also
gained three seats (all members of Congress in this category identify with the
Churches of Christ).5
In total, there currently are three fewer Christians
in the new Congress than there were in the previous Congress, although this gap
is all but certain to narrow once three of the four open seats are filled. Five
of the six candidates in the uncalled or outstanding races identify as
Christians; Jon Ossoff, a Democrat running for Senate in Georgia, is Jewish.6
When it comes to the 63 members of Congress who are
not Christian, a slim majority (33) are Jewish, a number that has held
relatively steady over the past several Congresses.
The next largest non-Christian group is made up of
those who declined to specify a religious affiliation. There are 18 people in
this category in the 117th Congress, the same as in the 116th, which had seen
an increase of eight members in this group.
The three Muslim representatives from the 116th
Congress return for the 117th: Reps. André Carson, D-Ind.; Ilhan Omar, D-Minn.;
and Rashida Tlaib, D-Mich. Similarly, both Buddhists from the previous Congress
return: Georgia Democratic Rep. Hank Johnson and Hawaii Democratic Sen. Mazie
K. Hirono.
Unitarian Universalists gained one seat, as Rep.
Deborah K. Ross, D-N.C., joins California Democratic Reps. Ami Bera and Judy
Chu.
There are now two Hindus in Congress – Rep. Ro Khanna,
D-Calif., and Rep. Raja Krishnamoorthi, D-Ill., both returning members. Former
Rep. Tulsi Gabbard, D-Hawaii, who served in the 115th and 116th Congresses, ran
for president in 2020 and withdrew her reelection bid for her House seat. She
is replaced by Kai Kahele, who declined to specify a religious affiliation.
One member, California Democratic Rep. Jared
Huffman, describes himself as a humanist. He is listed in the “other” category. Fewer
than three-tenths of 1% of U.S. adults specifically call themselves humanists.
Sinema is the only member of the 117th Congress who
identifies as religiously unaffiliated. Both Sinema and Huffman have said they
do not consider themselves atheists.7
 Most members of the House and Senate are
Christians, with the House just slightly more Christian than the Senate (88%
vs. 87%). And both chambers have a Protestant majority – 55% of representatives
are Protestant, as are 59% of senators.
Most members of the House and Senate are
Christians, with the House just slightly more Christian than the Senate (88%
vs. 87%). And both chambers have a Protestant majority – 55% of representatives
are Protestant, as are 59% of senators.
Within Protestantism, the largest differences are in
Presbyterians (3% in the House vs. 12% in the Senate) and Protestants who do
not specify a denomination (20% in the House, 11% in the Senate).
Catholics make up a larger share in the House (31%)
than in the Senate (24%).
The Senate, meanwhile, has a higher share of Jewish
(8% vs. 6%) and Mormon (3% vs. 1%) members than the House does.
All of the Muslims, Hindus and Unitarian Universalists
in Congress are in the House, while there is one Buddhist in each chamber.
The sole religiously unaffiliated member of Congress
(Sinema) is in the Senate, and the only member in the “other” category
(Huffman) is in the House.
 Fully 99% of Republicans in Congress identify
as Christians. There are two Jewish Republicans in the House, Reps. Lee Zeldin
of New York and David Kustoff of Tennessee. New York Rep. Chris Jacobs declined
to specify a religious affiliation. All other Republicans in the 117th Congress
identify as Christian in some way.
Fully 99% of Republicans in Congress identify
as Christians. There are two Jewish Republicans in the House, Reps. Lee Zeldin
of New York and David Kustoff of Tennessee. New York Rep. Chris Jacobs declined
to specify a religious affiliation. All other Republicans in the 117th Congress
identify as Christian in some way.
Most Republican members of Congress identify as
Protestants (68%). The largest Protestant groups are Baptists (15%), Methodists
(6%), Presbyterians (6%), Lutherans (5%) and Episcopalians (4%). However, 26%
of Republicans are Protestants who do not specify a denomination – up from 20%
in the previous Congress. There are 15 Republican freshmen in this category,
compared with three Democratic newcomers.
Now that Democratic Sen. Tom Udall of New Mexico has
retired, all nine members of the Church of Jesus Christ of Latter-day Saints
(sometimes called Mormons) in Congress are Republicans.8
Democrats in Congress also are heavily Christian –
much more than U.S. adults overall (78% vs. 65%).9 But the share of Democrats who identify as Christian is 21
percentage points lower than among Republicans (99%). Democrats are much less
likely than Republicans to identify as Protestant (43% vs. 68%). Conversely,
Catholics make up a higher share among Democrats than they do among Republicans
(34% vs. 26%).
Among Democrats, 11% are Jewish, and 6% did not
specify a religious affiliation. All of the Unitarian Universalists (3),
Muslims (3), Buddhists (2) and Hindus (2) in Congress are Democrats, as are the
single members in the “other” and religiously unaffiliated categories.
 While the small freshman class of the 117th
Congress does little to change the overall makeup of the body, there are some
notable differences in religious affiliation between incumbents and freshmen.
While the small freshman class of the 117th
Congress does little to change the overall makeup of the body, there are some
notable differences in religious affiliation between incumbents and freshmen.
The freshman class is slightly more Christian than its incumbent
counterpart. Just six of the 67 new members are not Christian: Three are
Jewish, one is a Unitarian Universalist and two declined to share an
affiliation.
The largest difference between newcomers and
incumbents is in the share of Protestants who do not specify a denomination –
27% of freshmen are in this category, compared with 17% of incumbents.
Similarly, those who specifically describe themselves as nondenominational
Protestants make up 2% of incumbents and 7% of freshmen.
Among freshmen, there are two Restorationists –
the same number as there are among incumbents.
Other Protestant subgroups are smaller among newcomers
than they are among incumbents. For example, freshmen are less likely than
incumbents to be Baptists (7% vs. 13%) or Methodists (3% vs. 7%).
Catholics, who make up 30% of Congress and 30% of
incumbents, make up a smaller share of freshmen (27%). Orthodox Christians, on
the other hand, make up just 1% of incumbents and 4% of freshmen (three new
members).
While the U.S. population continues to become less Christian, Congress has held relatively steady in recent
years and has remained heavily Christian. In the 87th Congress (which began in
1961), the earliest for which aggregated religion data is available, 95% of
members were Christian, which closely matched the roughly 93% of Americans who
identified the same way at the time, according to historical religion data from Gallup.
Since the early ’60s, there has been a substantial
decline in the share of U.S. adults who identify as Christian, but just a
7-point drop in the share of members of Congress who identify that way. Today,
88% of Congress is Christian, while 65% of U.S. adults are Christian, according
to Pew Research Center surveys.
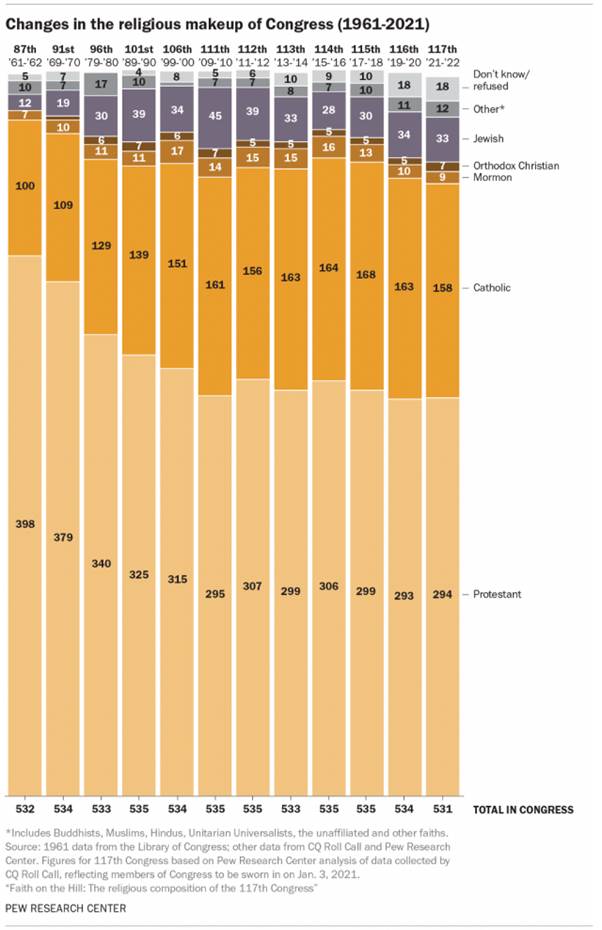
January 04, 2021
Source:
https://www.pewforum.org/2021/01/04/faith-on-the-hill-2021/
671-43-15/Poll
Donald Trump, Michelle Obama
Most Admired in 2020
Americans are most likely to
name President Donald Trump and Michelle Obama as most admired man and woman in
2020. Trump tied
former President Barack Obama for the honor last year but edged out his
predecessor this year. Trump's first-place finish ends a 12-year run as most
admired man for Obama, tied with Dwight Eisenhower for the most ever.
Meanwhile, Michelle Obama ranks as most admired woman for the third year
in a row. Vice President-elect Kamala Harris is second.
Most Admired Man
The incumbent president is usually top of mind when Gallup
asks Americans to name, without prompting, which man living anywhere in the
world they admire most. In the 74 times Gallup has asked the open-ended most
admired man question since 1946, the incumbent president has topped the list 60
times. Harry Truman (1946-1947 and 1950-1952), Lyndon Johnson (1967-1968),
Richard Nixon (1973), Gerald Ford (1974-1975), Jimmy Carter (1980), George W.
Bush (2008) and Trump (2017-2018) are the incumbent presidents who did not
finish first in past years.
When the sitting president is not the top choice, it
is usually because he is unpopular politically. That was the case in 2017 and 2018 when Trump had 36% and 40% approval ratings, respectively, and
finished second to Obama as most admired man.
Even though Trump is similarly unpopular now -- 39% approve of his performance -- his dominant performance among
Republicans, contrasted with Democrats splitting their choices among multiple
public figures, pushes him to the top of the 2020 most admired man list.
- Forty-eight percent of Republicans name Trump this year,
with no other public figure receiving more than 2% of Republicans' votes.
- Obama is the top choice among Democrats, at 32%, but
that is down from 41% last year. President-elect Joe Biden (13%) is also
commonly named by Democrats.
- Additionally, Dr. Anthony Fauci, the nation's top
infectious disease expert, is named by 5% of Democrats but only 1% of
Republicans, further contributing to Democrats' relative dispersion of
choices.
- Independents are evenly split between Trump (11%) and
Obama (11%), with another 3% naming Biden and 2% Fauci.
Overall, 18% of Americans name Trump, 15% name Obama,
6% Biden and 3% Fauci. The remaining top 10 men include Pope Francis,
businessman Elon Musk, Vermont Sen. Bernie Sanders, Microsoft co-founder and
philanthropist Bill Gates, basketball player LeBron James, and the Dalai Lama,
the spiritual leader of Tibetan Buddhists.
Most Admired Man, 2020
What man that you have heard or read about, living
today in any part of the world, do you admire most?
|
% Mentioning |
Number of top 10 finishes |
|
|
Donald Trump |
18 |
10 |
|
Barack Obama |
15 |
15 |
|
Joe Biden |
6 |
2 |
|
Dr. Anthony Fauci |
3 |
1 |
|
Pope Francis |
2 |
8 |
|
Elon Musk |
1 |
4 |
|
Bernie Sanders |
1 |
6 |
|
Bill Gates |
1 |
21 |
|
LeBron James |
1 |
1 |
|
Dalai Lama |
1 |
11 |
|
Combined first and second mentions; rankings based on total number of
responses |
||
|
GALLUP, DEC. 1-17, 2020 |
||
In addition to the public figures named by Americans,
11% name a relative or friend as the man they admire most. Twenty-one percent
did not offer an opinion in response to the open-ended question.
This year marks the 10th time Trump
has finished among the top 10 men, including four times before he entered party
politics -- 1988 through 1990 and 2011. Gates has finished in the top 10 a
total of 21 times, while Obama has now done so 15 times and the Dalai Lama 11
times. Biden has been in the top 10 once before, in 2018, while Fauci and James
are new to the list.
The Rev. Billy Graham, who passed away in 2018, finished
among the top 10 a record 61 times during his life. Former President Jimmy
Carter is the living man with the most top 10 finishes -- 29 -- putting him
behind Graham and Ronald Reagan for third all-time. Carter finishes just
outside the top 10 this year but made the 2019 list.
Most Top 10 Finishes -- Gallup Most Admired Man
|
Number of top 10 finishes |
|
|
Billy Graham |
61 |
|
Ronald Reagan |
31 |
|
Jimmy Carter |
29 |
|
Pope John Paul II |
27 |
|
Bill Clinton |
26 |
|
Bill Gates |
21 |
|
Dwight Eisenhower |
21 |
|
Richard Nixon |
21 |
|
George H.W. Bush |
20 |
|
Harry Truman |
20 |
|
Nelson Mandela |
20 |
|
Ted Kennedy |
18 |
|
Winston Churchill |
17 |
|
George W. Bush |
17 |
|
Colin Powell |
16 |
|
Barack Obama |
15 |
|
Douglas MacArthur |
15 |
|
GALLUP |
|
Pope John Paul II and Gen. Douglas MacArthur
frequently made the top 10. They, along with Henry Kissinger, are the only men
who were not future, current or former presidents to finish first overall in
any year. MacArthur was most admired man in 1946, 1947 and 1951; Kissinger
topped the list from 1973 through 1975, and Pope John Paul II did so in 1980.
Most Admired
Woman
Just as men who were president have dominated the most
admired man list, women who were first lady have commonly been named most
admired woman. Gallup has asked the public to name the woman they admire most
71 times since 1948, with either a current (18) or a former (39) first lady
winning a total of 57 times. That has been the case every year since 1997, with
Hillary Clinton accounting for most of those -- but Michelle Obama (2018
through 2020) and Laura Bush (2001) also finished first during that time span.
This year, 10% of Americans name Obama as most admired
woman, 6% name Harris, and 4% name current first lady Melania Trump. Trump has
been in the top 10 each of the past four years but has never finished first,
joining Bess Truman and Lady Bird Johnson as former or current first ladies not
to have received the distinction.
The remainder of the top 10 most admired women this
year include television personality Oprah Winfrey, German Chancellor Angela
Merkel, Clinton, New York Rep. Alexandria Ocasio-Cortez, Queen Elizabeth II,
Supreme Court Justice Amy Coney Barrett and climate change activist Greta
Thunberg.
Most Admired Woman, 2020
What woman that you have heard or read about, living
today in any part of the world, do you admire most?
|
% Mentioning |
Number of top 10 finishes |
|
|
Michelle Obama |
10 |
13 |
|
Kamala Harris |
6 |
1 |
|
Melania Trump |
4 |
4 |
|
Oprah Winfrey |
3 |
33 |
|
Angela Merkel |
2 |
8 |
|
Hillary Clinton |
2 |
29 |
|
Alexandria Ocasio-Cortez |
2 |
1 |
|
Queen Elizabeth II |
2 |
52 |
|
Amy Coney Barrett |
1 |
1 |
|
Greta Thunberg |
1 |
2 |
|
Combined first and second mentions; rankings based on total number of
responses |
||
|
GALLUP, DEC. 1-17, 2020 |
||
Several other women were named by 1% of Americans,
including singer Dolly Parton, former Secretary of State Condoleezza Rice,
Nobel Peace Prize laureate Malala Yousafzai, former U.N. Ambassador Nikki
Haley, Massachusetts Sen. Elizabeth Warren, New Zealand Prime Minister Jacinda
Ardern, actress Betty White and Michigan Gov. Gretchen Whitmer. These women did
not make the top 10 because they had fewer total mentions than Barrett and
Thunberg.
Sixteen percent of Americans name a relative or friend
as the woman they admire most, and 19% do not have an opinion.
Partisans tend to name public figures aligned with their
own party when answering the most admired woman question. Trump leads among
Republicans at 8%, followed by Barrett (4%) and Haley (4%). Democrats are about
equally likely to name Obama (17%) and Harris (16%), and 5% name Ocasio-Cortez.
Obama leads among independents (11%), with Trump
second at 4%.
Queen Extends
Record of Top 10 Finishes
Queen Elizabeth's top 10 finish this year is her 52nd,
far more than any other woman. Margaret Thatcher is second on the list with 34
top 10 appearances, followed by Winfrey at 33 and Clinton with 29.
Most Top 10 Finishes -- Gallup Most Admired Woman
|
Number of top 10 finishes |
|
|
Queen Elizabeth II |
52 |
|
Margaret Thatcher |
34 |
|
Oprah Winfrey |
33 |
|
Hillary Clinton |
29 |
|
Jacqueline Kennedy Onassis |
28 |
|
Mamie Eisenhower |
21 |
|
Barbara Bush |
20 |
|
Margaret Chase Smith |
20 |
|
Nancy Reagan |
19 |
|
Mother Teresa |
18 |
|
Clare Boothe Luce |
18 |
|
Condoleezza Rice |
17 |
|
Betty Ford |
17 |
|
Madame Chiang Kai-shek |
17 |
|
Helen Keller |
17 |
|
Pat Nixon |
15 |
|
GALLUP |
|
Clinton, Jacqueline Kennedy Onassis, Mamie Eisenhower,
Barbara Bush, Nancy Reagan, Betty Ford and Pat Nixon are the current or former
first ladies who have placed in the top 10 at least 15 times. Obama has
finished among the leaders 13 times to date.
Non-first ladies who have finished first in past years
include Sister Elizabeth Kenny (1951); Ethel Kennedy, the widow of Sen. Robert
Kennedy (1968); former Israeli Prime Minister Golda Meir (1971, 1973-1974);
Mother Teresa (1980, 1986, 1995-1996); and former British Prime Minister
Margaret Thatcher (1982-1984 and 1988-1990).
Bottom Line
Past, present and future White House occupants,
whether presidents or first ladies, have figured prominently when Gallup has
asked Americans to name the man and woman they admire most. As such, Barack
Obama, Donald Trump and Joe Biden are likely to remain strong contenders for
the most admired man title in the coming years. Should Trump continue to
dominate Republicans' consciousnesses -- currently, Republicans rarely name any
other public person than him -- he will have a good chance of winning in future
years, especially if Democrats continue to split their choices between Obama
and Biden. Still, former presidents typically have not been top of mind for
Americans -- only Obama and Eisenhower received 10% or more mentions in any
year after they left office.
Harris' prominent role in the forthcoming Biden
administration should raise her national profile in the coming year, and
possibly position her to overtake Michelle Obama as most admired woman.
December 29, 2020
Source: https://news.gallup.com/poll/328193/donald-trump-michelle-obama-admired-2020.aspx
AUSTRALIA
671-43-16/Poll
Now 77% of Australians would
get a vaccine for COVID-19 – down 10% points since April 2020
Men are more likely
than women to get the COVID-19 vaccine (See Question 5 details below)
Analysis by Gender shows a significantly more men
(83%, down 6%) than women (72%, down 13%) are willing to be vaccinated if a new
Coronavirus vaccine became publicly available.
Analysis by State show those in New South Wales are
most likely (81%) to be vaccinated if one became publicly available, while West
Australians (69%) and Queenslanders (70%) are the least likely. Additionally,
20% of Queenslanders would not be willing to be vaccinated if one became
publicly available much higher percentage than any of the other States: WA
(14%), NSW (11%), VIC (9%) and SA (6%).
If a new Coronavirus
(COVID-19) vaccine became publicly available, I would be willing to be
vaccinated - By States
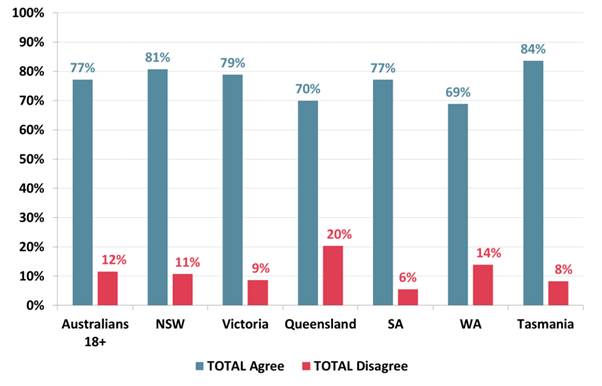
Source: Roy Morgan online survey of Australians
conducted from November 12-17, 2020, n=1,008.
Base: Australians aged 18+.
Australians
accept international travel restrictions to combat the virus (See Question 1
details below)
Large majorities of Australians in all States, both
genders and across all age groups agree travel restrictions between countries
are acceptable in order to fight against the spread of Coronavirus. Agreement
is highest for people aged 50-64 (93%) or 25-34 (93%) and in South Australia
(96%) and New South Wales (93%). In addition, 91% of both men and women agree
that travel restrictions between countries are acceptable.
Do you think
travel restrictions between countries are acceptable in order to fight against
the spread of the Coronavirus? By Age
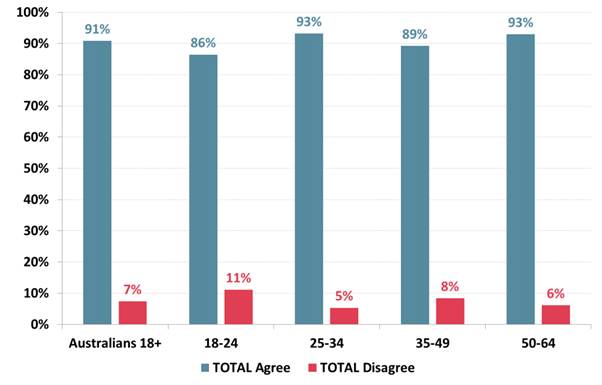
Source: Roy Morgan online survey of Australians
conducted from November 12-17, 2020, n=1,008.
Base: Australians aged 18+.
More Australians
say the Australian Government is handling the Coronavirus crisis well (See
Question 2 details below)
Now 82% of Australians agree (up 17% since April) the
Australian Government is handling the Coronavirus well - 23% (up 2%) strongly agree while a further 59% (up
15%) agree.
An unchanged 75%
of Australians disagree the threat from the virus is exaggerated (See Question
3 details below)
One-in-five Australians agree the threat from
Coronavirus is ‘exaggerated’ with
those living outside capital cities more likely to agree (24%) the threat from
Coronavirus is exaggerated than those from capital cities (19%).
Three quarters
of Australians would sacrifice their ‘human rights’ to help prevent the spread
of the virus – a drop of 5% points from April (See Question 4 details below)
A reduced 75% (down 5% since April) of Australians
agree they are willing to sacrifice some of their ‘human rights’ if it helps
prevent the spread of the Coronavirus compared to 17% (up 3% over the same time
period) disagree.
A decreasing 77% (down 7%) of women agree they would
willingly sacrifice their’ human rights’ if it helps prevent the spread of the
Coronavirus. Of men 73% (down 2%) are willing, 21% not willing and 6% are
undecided.
In
November, before the recent Coronavirus outbreak in Sydney, only 10% of
Australians believed 2021 will be “Worse” while 17% believed it will be “the
same” and a majority of 59% said it will be “Better” while 14% said they
“Didn’t know”.
December 22, 2020
MULTICOUNTRY STUDIES
671-43-17/Poll
U.S. and U.K. are optimistic
indicators for COVID-19 vaccination uptake
New Ipsos-World Economic Forum survey following the release of a vaccine in the U.S. and U.K finds intentions to get vaccinated up in both countries, but down in several others as many worry about side effects.
A new Ipsos survey conducted in partnership with the World Economic Forum after the first COVID-19 vaccinations in
the United States and the United Kingdom points to a recent uptick in
vaccination intent in both countries.
The 15-country survey conducted December 17-20 among
13,500 adults on Ipsos’s Global Advisor online platform finds the highest
levels of vaccination intent in China with 80% agreeing they would get a
vaccine if it were available.
Among the other countries surveyed, intention to get
vaccinated against COVID-19 is:
- Fairly high in Brazil (78%), Mexico (77%), the U.K. (77%),
Australia (75%), South Korea (75%), and Canada (71%);
- Middling in the U.S. (69%); Germany (65%), Italy (62%),
Spain (62%), and Japan (60%); but
- Low in South Africa (53%), Russia (43%), and most of
all, France (40%).
Since October, the percentage of those who strongly or
somewhat agree has increased in the U.S. (+5 points), but it has dropped
markedly in many of the other countries – most of all in South Africa (-15
points), France (-14), Japan (-9), and South Korea (-8).
However, the proportion of those who strongly agree is
up significantly not only in the U.S. (+9 points to 38%), but also in the U.K
(+5 to 46%). It has fallen in several countries, but none shows a drop of more
than seven points.
Reasons for not
taking a vaccine
In every country, between 57% and 80% of those who say
they would not take a COVID-19 vaccine mention being worried about the side
effects.
Doubts about its effectiveness are the second-most
common reason in many countries, cited by as many as 45% in Russia, but only
17% in Japan.
Not being enough at risk from COVID-19 is mentioned by
32% in China and 25% in the U.K., but only by 8% in South Korea.
Opposition to vaccines in general is cited by about
one in four of those who won’t get a COVID-19 vaccine in Russia and South
Africa, but by fewer than 10% in South Korea, Japan, and China.
December 29, 2020
Source:
https://www.ipsos.com/en/global-attitudes-covid-19-vaccine-december-2020
671-43-18/Poll
Fear and Social Distancing:
Global Perceptions of Risk Vary
Results from the Lloyd's Register Foundation World
Risk Poll, a global survey conducted before the COVID-19
pandemic, show that countries racked by greater levels of worry about being
harmed in the course of daily life often went on to adopt stricter
COVID-suppression policies and behaviors. Meanwhile, the countries least worried about (pre-COVID) safety and
health risks have generally taken fewer precautions, despite being among the
most vulnerable to the disease because of high-density cities, thick global
travel networks and large elderly populations.
People living in Sweden, for example, express the
least concern about mundane risks out of 142 countries and areas surveyed. When
it comes to potential harm from food, water, electrical power lines and
appliances, almost no Swedes say they are very worried. Violent crime and
severe weather register significant concern with 10% and 9% of the population,
respectively. By contrast, in Mozambique, 57% of adults say they are very
worried about serious harm from the food they eat and 49% about the water they
drink. Majorities there are very worried about severe weather (60%) and violent
crime (58%), and many worry about serious harm from electrical power lines
(38%) and household appliances (34%).
These gaps in concern are evidently grounded in actual
experiences. According to the World Risk Poll, those worried about serious harm
from a given source are far more likely to report having experienced it or
known someone who has. Official records show early death and severe injury are
much more common in Mozambique and lower-income countries than in Sweden and
higher-income countries, according to data from the World Health Organization.
Experience with risk has shaped the response to
COVID-19. Sweden is well-known for initially declining to issue stay-at-home
orders or close restaurants and other businesses, require masks, or otherwise
issue more than minor restrictions on its population, which has a relatively
older and urbanized population. In mostly rural Mozambique, by contrast, the
average age is 34 (compared with 48 in Sweden) -- but schools and some
workplaces there closed when the pandemic began, and masks are required. The
actual threat has been far greater in Sweden. Mozambique has seen only four
deaths per 1 million people from COVID-19, compared with 626 per million in
Sweden.
The influence of the recent past is apparent in East
Asia. In Taiwan, Hong Kong, Japan and South Korea, mask-wearing became even
more widespread after the 2003 SARS epidemic -- and they enacted other
disease-suppression habits, leaving those countries and areas well-prepared for
the current crisis.
This pattern -- where relatively recent past
experiences related to either safety or trauma guide present behaviors in
addressing the same ostensible situations -- means that high-income countries,
especially the United States and many in Europe, have taken fewer precautions
than many countries in the developing world. Whether countries overreacted or
underreacted will likely be debated for years to come, but it is clear that people
living in different countries perceived the risks from COVID quite differently.
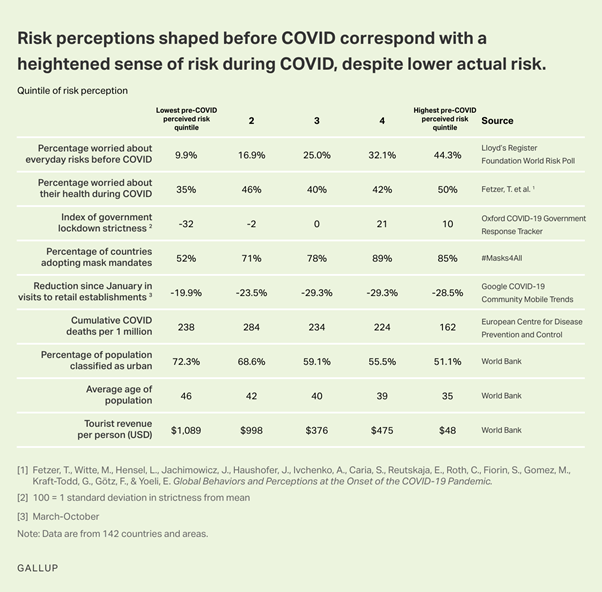
Chart. This chart plots different statistics from a
variety of sources, including the percentage of the population worried about
everyday risks before the COVID-19 pandemic, the average age of the population,
tourist revenue, and countries adopting mask mandates by overall risk
perceptions before the pandemic.
The disconnect between perceived risk and actual risk
is personal. Results from a global survey conducted early in the pandemic by economist Thiemo Fetzer
from the University of Warwick and his collaborators showed that older people
had similar levels of worry about their health as younger people, despite being
at much greater risk of death. People living in countries and regions with
relatively high COVID-19 death rates (the United States and Europe) were also
less worried about their health at the onset of the pandemic than those living
in places with lower death rates, such as Africa and East Asia.
The varying perceptions of risk have motivated varying
actions. Those who say they are worried about their health exhibit much more
cautious behaviors and endorse stricter rules and enforcement of social
distancing, a concept psychologist have deemed "functional fear."
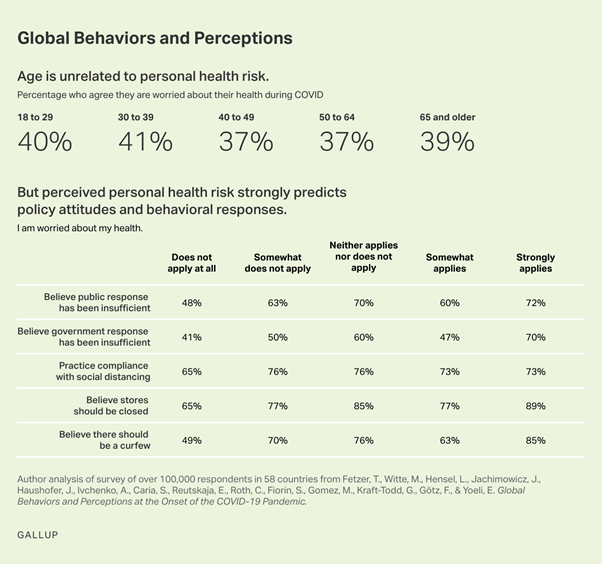
Chart. This chart displays the relationship between
age and people's worry about their health during the COVID-19 pandemic, and the
relationship between people's worry about their health and attitudes and
behaviors in regard to COVID-19 policies.
This connection between fear and policy is playing out
right now in the United States, as Gallup's research with Franklin Templeton has shown. Those
who express greater fear of the virus are far more likely to favor restrictions
on schools and businesses as well as other disease-suppression measures.
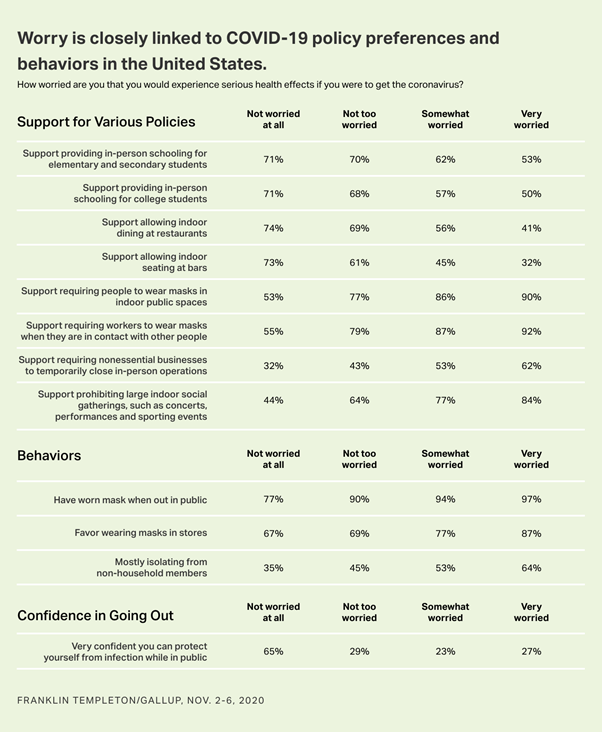
Chart. This chart plots COVID-19 policy preferences,
behaviors during the pandemic, and people's confidence in going out by the
level of worry people have about experiencing serious health effects if they
were to contract the coronavirus.
Moreover, the policy preferences and perceptions of
risk have a partisan edge. Democrats tend to overstate the risks to young
people, and Republicans tend to understate the lethality of the virus more generally.
If President-elect Joe Biden wants more Americans to
take greater precautions until they receive a vaccine, he will need to convince
many who have not been harmed that the risks are nonetheless serious, either to
them or to others. On the other hand, exaggerating the threat from COVID will
make it easier to dismiss. In the United States and a number of other
prosperous nations, logical conclusions from evidence-based research will have
to serve as the impetus for behavioral change, in the absence of a recently
shared collective experience of harm.
December 28, 2020