BUSINESS
& POLITICS IN THE WORLD
GLOBAL
OPINION REPORT NO. 675
Week: January 25 –January 31,
2021
Presentation: February 3, 2021
Remittances: Who sends money overseas?
From
tax exemptions to job creation & agricultural boost, here’s what Indians
expect from Budget2021
FIFA
World Cup tops YouGov Sport’s Global Buzz 2021 Rankings in UAE
Public
support of strict lockdown helps Fianna Fail
Neighborhood
apps: a safe neighborhood or, above all, less privacy?
Car
enthusiasts less likely to be concerned by climate change
Overwhelming
public support for toughening travel restrictions
Remittances:
Who sends money overseas?
Almost
half of Britons want teachers and nursery workers to be vaccinated next
Republicans,
Democrats at odds over social media companies banning Trump
Majority
of Americans continue to favor moving away from Electoral College
In
U.S., Most Say Reducing Cost of Care High Priority for Biden
Americans'
Economic Mood Sinks for Second Straight Month
College
Student Caregivers More Likely to Stop Classes
Covid-19:
76% of Argentines agree with travel restrictions
60%
of the population strongly disagree / disagree with the "Vacation
Permits"
Are
we on the cusp of a mass city to country migration?
Global
study: where do people believe in conspiracy theories?
International
attitudes to following coronavirus rules
INTRODUCTORY NOTE
675-43-22/Commentary:
Remittances: Who sends money overseas?
YouGov data takes a look at
British and American remittance payments
Data from YouGov Profiles reveals that 12% of Britons and Americans send money overseas. But how often do they make these payments – and why do they make them?
Our research shows that a fifth of Britons (20%) and a quarter of Americans (25%) who send remittance payments do so at least once a month – with 21% and 27% respectively sending this money abroad at least once every two to three months. Another fifth of those in Britain (18%) and the US (21%) who transfer money overseas do so once every four to six months, while 12% and 10% respectively do so every seven to 12 months.
How much money are people sending abroad – and why are they sending it?
In terms of quantity, over half (54%) of Brits who send remittance payments send less than £500 whenever they transfer money overseas – with over a quarter (28%) transferring between £100 – £499.99. A further 15% send £500-£999.99, while 18% send £1,000 or more.
It’s a broadly similar picture in the US, where over half (52%) of whose who send these payments send less than $500, and a quarter (26%) send between $100 – $500. Americans, are slightly more likely to send greater amounts of money overseas, with a fifth (20%) sending $1,000 or more and 10% sending over $5,000.
As for why these payments are sent overseas, 43% of both Brits and Americans who send remittances say they are doing so to help their families. This may align with general perceptions of remittance payments, which are commonly associated with migrants in more prosperous countries sending funds back home to help their families and communities in less prosperous countries of origin.
This tendency may be reflected in other answers given – for example, almost a fifth in both the US (18%) and Britain (17%) say they’re sending money overseas to pay for bills. This group skews younger than the general public in both markets: in Britain, two in five (39%) are aged 18-34 next to 28% of the public, while just 14% are over 55. In the US, well over half (56%) are aged 18-34 compared to 32% of the wider public – and a mere 9% are over 55.
There are some key differences between those who send remittance payments in the US and Great Britain: 29% of Americans who transfer funds abroad, for example, are doing so to save money; in Britain, this amounts to just 18% of this group overall. Americans who send remittances are twice as likely to do so in order to pay an overseas credit card (14% vs 7%) or buy an overseas property (15% vs. 7%). International school fees are also a consideration for a minority of this group: 13% of Americans and 8% of Brits say they send money abroad for education.
In terms of preferred payment methods, Paypal is the most commonly used service for both Britons and Americans – though the latter (39%) are far more likely to use it than the former (27%). British consumers who send money overseas are also more likely to use their bank (26%) than Americans (20%), while Americans are more likely to use Western Union (22% vs. 15%). Further down the list, there is evidence that London-based Transferwise enjoys a home advantage among Brits – who are twice as likely (20% vs. 10%) to use it as Americans. The same is true for Dallas-based Moneygram: used by 7% of British and 16% of American consumers who send money abroad.
(YouGov)
January 28, 2021
Source: https://yougov.co.uk/topics/finance/articles-reports/2021/01/28/remittances-who-sends-money-overseas
675-43-23/Country Profile:
United Kingdom

SUMMARY
OF POLLS
ASIA
(India)
From tax exemptions to job creation
& agricultural boost, here’s what Indians expect from Budget2021
Ahead of the upcoming
Union budget, YouGov’s latest survey reveals two in five urban Indians want the
government to focus on job creation as well as agricultural & rural
development (41% each) in the 2021 budget. The economic upheaval caused by the
pandemic has raised people’s expectations from the government, putting a
greater focus on the economy. In comparison to last year’s findings, where
women safety was the top concern of people, jobs and agricultural development
have taken precedence this year. (YouGov)
January 29, 2021
MENA
(UAE)
FIFA World Cup tops YouGov
Sport’s Global Buzz 2021 Rankings in UAE
FIFA World Cup takes
the top spot in YouGov Sport’s Global Buzz 2021 Rankings in the UAE, becoming
the sports property with the most positive Buzz among residents in the country
(32.2). FIFA Club World Cup follows in the second place, with a Buzz score of
27.7. Although the event was postponed to 2021 due to the COVID-19 pandemic, it
managed to create buzz among sports enthusiasts and landed a spot in the
rankings. (YouGov)
January 27, 2021
(Tunisia)
Tunisian youth rank unemployment
and the economy as top problems, disapprove of government’s performance, Afrobarometer study shows
Unemployment and
management of the economy are the two most important problems that young
Tunisians want their government to address, an Afrobarometer
study shows. Although most citizens disapprove of the government’s performance
in handling economic issues, including creating jobs, the youth are more likely
than their elders to rate the government poorly on indicators of economic
performance. (Afrobarometer)
January 28, 2021
AFRICA
(Ethiopia)
Ethiopians embrace freedoms, but
are also willing to trade certain liberties for the sake of public security, Afrobarometer survey finds
A large majority of
Ethiopians say they feel free to express their thoughts, to join political
organizations, and to vote for the candidate of their choice, according to a
recent Afrobarometer survey. But while most citizens
think that people should have the right to associate freely, more than half
would be willing to accept restrictions on certain freedoms in the name of
security. If public safety were under threat, a majority would endorse the
government’s right to impose curfews and roadblocks, to monitor private
communications, and to regulate what is said in places of worship. (Afrobarometer)
January 25, 2021
EUROPE
(Ireland)
Public support of strict lockdown
helps Fianna Fail
As we head into the
second month of lockdown since Christmas, it appears that the strict nature of
the lockdown since the holidays, is actually seen to benefit Fianna Fail – who
voters feel have shown a stricter view on how we approach managing with
COVID-19. There are many who might have expected the government to do poorly in
today’s poll. Given the issues
surrounding school lockdowns, vaccine roll out, and the decision to open up for
a meaningful Christmas, which now appears on the surface to have been a serious
mistake. (Red C
Research)
February 01, 2021
(Netherlands)
Neighborhood apps: a safe
neighborhood or, above all, less privacy?
Neighborhood apps
were originally created to improve contact between neighbors and increase
safety. The aim is also that neighbors can count on each other more and there
is more understanding for each other. But what about in practice? And is it
safe to use the apps? In practice, using neighborhood apps is not just about
making the neighborhood safer. This is partly because the makers of
neighborhood apps have other goals in mind than just creating safety; many app
makers seem to primarily want to earn money from the rollout of a neighborhood
app. In addition, users also ensure that safety in the neighborhood is not
always central when using these apps. (Motivaction)
January 28, 2021
(UK)
Car enthusiasts less likely to be
concerned by climate change
According to YouGov data, it appears that car
enthusiasts are less likely to have positive attitudes towards climate change –
but not much less. Just over half (56%) of Brits interested in cars agree that
climate change is the biggest threat to civilisation
compared to 62% of the general public. Germans appear more environmentally
conscious, but there remains a slight disparity between car enthusiasts and the
public in response to the same question (68% vs 72%). (YouGov)
January 25, 2021
(UK)
Overwhelming public support for
toughening travel restrictions
Ministers are considering
increasing the restrictions on international arrivals again, after the
requirement for travellers to show proof of a negative COVID test came into
force last Monday. New YouGov data shows that nine in ten people (92%) support
the new rules on showing a negative test. Most people (87%) are also in favour of making arrivals quarantine in hotels for 10 days
when they arrive in the UK. (YouGov)
January 25, 2021
(UK)
Remittances: Who sends money
overseas?
Our research shows that a fifth of Britons
(20%) and a quarter of Americans (25%) who send remittance payments do so at
least once a month – with 21% and 27% respectively sending this money abroad at
least once every two to three months. Another fifth of those in Britain (18%)
and the US (21%) who transfer money overseas do so once every four to six
months, while 12% and 10% respectively do so every seven to 12 months. (YouGov)
January 28, 2021
(UK)
Almost half of Britons want
teachers and nursery workers to be vaccinated next
In a new survey by Ipsos MORI, 46% of Britons
believe teachers and nursery workers should be next in line to receive the
COVID-19 vaccine, after currently prioritised groups
including care home workers, frontline health and social care workers, over-70s
and those who are clinically vulnerable. A further 21% see them as their second
priority. Over half of those aged 55-75 want teachers and nursery workers prioritised (54%); however, this falls to only a third
(35%) of 18-34-year olds. (Ipsos MORI)
January 29, 2021
NORTH AMERICA
Republicans, Democrats at odds
over social media companies banning Trump
Several social media companies banned President
Donald Trump from their platforms while he was still in office following
rioting at the U.S. Capitol, citing their belief that his posts violated their
terms of use and that his rhetoric could result in more violence. Americans are
more likely to support rather than oppose this ouster, but views of the bans –
and whether these platforms should remove aggressive content more generally –
are sharply divided along political lines, according to a new Pew Research
Center survey conducted Jan. 19-24, 2021. (PEW)
January 27, 2021
Majority of Americans continue
to favor moving away from Electoral College
Prior to the 2020 election, many observers
noted that – if Donald Trump were to win – his most likely path toward victory
would involve him winning the Electoral College while losing the popular vote
(as was the case in 2016). This did not happen, but the current political
geography of the United States continues to allow for the possibility that the
winner of the popular vote may not be able to secure enough Electoral College
votes to win the office. (PEW)
January 27, 2021
Most U.S. citizens report a
campaign contacted them in 2020, but Latinos and Asians less likely to say so
Most U.S. adults said they were contacted by a
candidate’s campaign or a group supporting a candidate in the month before the
November 2020 presidential election, with majorities saying so across racial
and ethnic, educational, age and partisan groups. But when it came to Latino
and Asian citizens, lower shares of those groups reported a campaign contact
than adult U.S. citizens overall, according to a Pew Research Center survey
conducted in the days after the election. (PEW)
January 29, 2021
In U.S., Most Say Reducing
Cost of Care High Priority for Biden
Seven in ten (70%) U.S. adults say lowering
health insurance premiums should be a high priority for President Joe Biden and
his administration among key healthcare issues, followed closely by lowering
drug costs (66%) and reducing the uninsured rate (63%). These results are based
on a new study conducted by West Health and Gallup. (Gallup USA)
January 28, 2021
Americans' Economic Mood Sinks
for Second Straight Month
Americans' assessments of the U.S. economy
worsened in January after an even larger stumble in December, but following
seven months when economic perceptions had generally shown modest improvements.
The five-point decline in Gallup's Economic Confidence Index to -21 this month
puts the index at a level not seen since June. (Gallup USA)
January 28, 2021
College Student Caregivers
More Likely to Stop Classes
Nearly-one third (30%) of all currently
enrolled college students (including those pursuing a bachelor's degree,
associate degree, certificate, certification or other industry certification)
report that they are parents of minor children or caregivers to adults. This
includes 42% of students pursuing an associate degree program and 21% of those
pursuing a bachelor's degree. (Gallup USA)
January 29, 2021
SOUTH AMERICA
(Argentina)
Covid-19: 76% of Argentines
agree with travel restrictions
A worldwide survey also determined that in the
country 35% consider the threat of the virus as exaggerated. A quarter of the
globe is prone to being vaccinated. 76% of Argentines accept travel
restrictions to prevent the spread of the Covid-19 coronavirus and 35% consider
the threat of the virus "exaggerated", according to data obtained by
a global survey conducted by GIA and VOICES ! from the
country. (Voices)
January 22, 2021
(Chile)
60% of the population strongly
disagree / disagree with the "Vacation Permits"
59.9% of the population strongly disagrees /
disagree with the “Vacation Permits”, which are granted by the government, to
be able to carry out interregional transfers between communes that are, at
least, in Phase 2 of transition. 46.6% of the population has little or no
confidence that the government's Covid-19 Vaccination Plan can be complied
with, which considers vaccinating 15 million people in the first half of 2021.
22.2% have very confident that the plan will be achieved and 31.2% have medium
confidence. (Activa Research)
January 31, 2021
AUSTRALIA
Are we on the cusp of a mass
city to country migration?
Melbourne was set to become Australia’s largest
city by 2026. Since the start of
COVID-19, when a large part of Australia’s workforce was forced to work from
home, there has been much speculation whether this will impact people moving out
of cities. And now it seems the evidence is starting to mount that this is in
fact the case. People are moving out of
Melbourne and Victoria. Survey research
and ABS provisional migration data released in November support this trend.
(Bastion Insights)
January 2021
MULTICOUNTRY STUDIES
Global study: where do people
believe in conspiracy theories?
Research from the 2020 YouGov-Cambridge
Globalism Project reveals just how widespread belief in some common conspiracy
theories is. The survey took place in the summer of 2020 and interviewed more
than 22,000 people in 21 countries. The fallout of the 9/11 attacks survives to the present day.
People continue to ask questions about what really happened that day, spawning
conspiracy theories that the US government was somehow involved in, or knew of,
the attacks before they happened. This conspiracy is most widely believed in
Turkey, where over half of Turkish people (55%) think this conspiracy is
“definitely” or “probably” true. (YouGov)
January 18, 2021
International attitudes to
following coronavirus rules
Now a new international YouGov survey,
conducted in 17 countries and regions, shows that 44% of Britons describe their
approach to coronavirus rules as “I have followed the government rules as and
when the government introduced them, but I have not acted earlier or gone
further than the government says I need to”. Britons are not the most likely to
adopt a bare minimum approach to practicing protective measures, however. That honour goes to Italians, Singaporeans and Danes, at 56% in
each country. (YouGov)
January 28, 2021
ASIA
675-43-01/Poll
From tax exemptions to job creation & agricultural boost, here’s what Indians expect from Budget2021
YouGov’s latest survey explores people’s expectations from the 2021 Union Budget
Ahead of the upcoming Union budget, YouGov’s latest survey reveals two in five urban Indians want the government to focus on job creation as well as agricultural & rural development (41% each) in the 2021 budget.
The economic upheaval caused by the pandemic has raised people’s expectations from the government, putting a greater focus on the economy. In comparison to last year’s findings, where women safety was the top concern of people, jobs and agricultural development have taken precedence this year.
However, women safety remains a concern for many, with 36% saying it should be the prime highlight of the forthcoming budget.
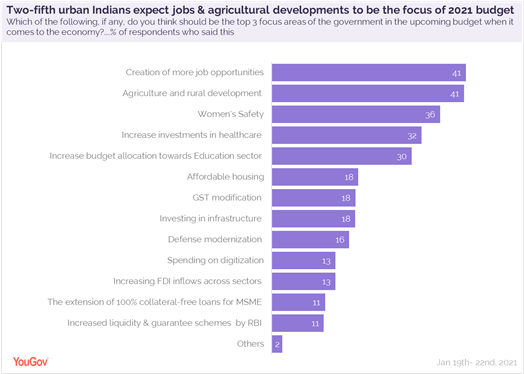
The Coronavirus pandemic has put a strong focus on health, with three in ten (32%) respondents saying the government should emphasize on increasing investment in healthcare this year. Just as many (30%) feel there should be an increase in budgetary allocation towards the education sector.
Among the different generations, surprisingly job creation seems to be more of a priority for Gen X (47%) respondents than millennials (37%) and Gen Z (39%).
Similarly, women are more likely than men to say jobs should be a focus area in the budget this year (44% vs 39%)
When it comes to the individual expectations of the salaried class in India, two-thirds (66%) want the government to raise basic tax exemption limit for an individual to ₹5 lakh from the current limit.
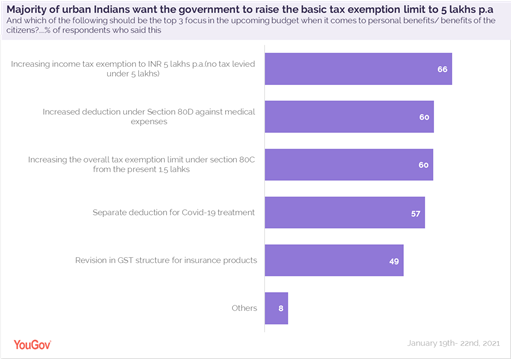
Three in five (60%) expect the finance minister to increase deductions in medical expenses (under 80D), and just as many (60%) desire a rise in the overall tax exemptions limit under section 80C. People from tier I cities of India are most likely to have these expectations as compared to the other residents of India.
A large proportion (57%) feel Covid treatment-related expenses should be considered a separate item under tax deductions, while half (49%) are hoping for a revision in the GST structure for insurance products.
In order to cover the additional expenses incurred due to the pandemic, the government recently proposed adding a coronavirus cess on individual taxpayers. When asked about this, only three in ten (30%) seem to be in favour of this idea. A vast majority are either opposed to this idea (37%) or unsure about it (33%).
The Covid-19 pandemic has made healthcare a priority and placed health and life insurance at the forefront of investments. The data shows two in five (40%) respondents are likely to invest in insurance (health, life, etc.) in 2021. The figure is much higher than last year’s numbers, where only 30% said they would be investing their money in insurance.
Young adults between 30-39 years are most likely to invest in insurance this year as compared to the rest (at 48%).
After insurance, a third (33%) of urban Indians prefer to remain safe and are likely to invest in fixed deposits in 2021. One in three (31%) are likely to invest in Government saving schemes. Those claiming to invest in mutual funds have reduced over the past year, from 37% in 2020 to 28% in 2021.
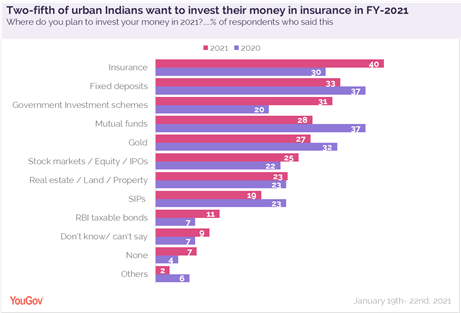
Even though the stock market in India has been on a winning streak, expected to show further improvement, people are still not confident and investment in stocks remains a low priority at 25%. Intend to invest in real estate and SIPs also remain low this year- at 23% and 19%, respectively.
(YouGov)
January 29, 2021
Source:
https://in.yougov.com/en-hi/news/2021/01/29/tax-exemptions-job-creation-agricultural-boost-her/
MENA
675-43-02/Poll
FIFA World Cup tops YouGov Sport’s Global Buzz 2021 Rankings in UAE
FIFA World Cup takes the top spot in YouGov Sport’s Global Buzz 2021 Rankings in the UAE, becoming the sports property with the most positive Buzz among residents in the country (32.2).
FIFA Club World Cup follows in the second place, with a Buzz score of 27.7. Although the event was postponed to 2021 due to the COVID-19 pandemic, it managed to create buzz among sports enthusiasts and landed a spot in the rankings.
YouGov SportsIndex measures the public’s perception of brands on a daily basis across a range of metrics. The rankings are based on the Buzz score from YouGov’s SportsIndex, which measures whether respondents have heard something positive or negative about a brand recently.
The past year has led to monumental disruption within the global sports and events sector. Nevertheless, even during these unprecedented times, the UAE served as an unparalleled sporting destination.
One of the most popular T20 cricket leagues, The Indian Premier League, took place in the UAE last year. The event created a lot of positive buzz among sports-starved residents, making it the third most popular event of 2020.

Two other cricket events- ICC World Twenty20 and the ICC Cricket World Cup also make an appearance in the list, taking the ninth and tenth position (17.4 each), respectively.
The 2020 Formula 1 Championship that ended in Abu Dhabi secured the fourth position in the top ten rankings (21.9).
The past year looked favorable for sports properties related to football. Major football championships like The English Premier League, UEFA Champions League and LA Liga appeared in the top ten list, at fifth (with a score of 21.7), sixth (19.8) and seventh (19.5), respectively.
Dubai’s obsession with health and fitness led the Dubai Marathon to land a place in the top ten rankings- at eighth (18.1).
Domestic ranking

Of those properties which were held in the UAE, it’s the Indian Premier League which comes out on top with a score of 22.0 points. As we mention earlier, the event moved temporarily to the UAE in 2020 to avoid COVID restrictions and it looks like even if the move disappointed many Indians, it created plenty of noise in the UAE.
Dubai-based events then make up the next three highest properties. The Dubai Marathon, Dubai World Cup (equestrianism) and the Dubai Tennis Championships all make a splash with their annual events.
There is little to separate them from the Arabian Gulf League, the UAE’s premier domestic football competition. The League, which along with the Arabian Gulf Cup, represents the highlight of the country’s soccer scene sees off competition from the highly-regarded AFC Champions League.
Talking about the YouGov Sport’s Global Buzz 2021 Rankings, Scott Fritz of YouGov Sports said, “Across the globe, the world of sports had been hit hard by the pandemic, leading to the cancellation or postponement of major sporting events worldwide.
“However, the UAE witnessed a good year in terms of sports with the successful hosting of IPL 2020. Domestic events like the Dubai marathon also kept the buzz alive. However, football dominated the 2021 rankings, with five major tournaments featuring in the top ten list."
“With major global sporting events choosing the UAE as a venue as well as the return of live spectators, this could be a great opportunity for the UAE to reinforce its credentials as a global sports destination.”
About YouGov SportsIndex
SportsIndex is one of YouGov Sport’s signature capabilities. It operates in 33 markets across the world, tracking 200 key domestic and international properties across 30 sports.
In every market, it takes a list of the leading sports properties – a mix of domestic and international events, competitions and leagues – and, from 1.8m surveys annually, it measures the public’s perceptions of them.
Every day, and for every property on our list, we track 16 separate metrics, providing a treasure chest of data for sports marketers and administrators.
SportsIndex gives our clients the capability to do everything from measuring the effect of yesterday’s news headlines to establishing a season-on-season trend stretching back years. And because it operates internationally, users can track and compare properties across the world.
When combined with BrandIndex, which measures perceptions of more than 13,000 brands globally across 38 markets, you have one of the most powerful solutions in the sports world for informing strategy, finding partners and reacting to events.
(YouGov)
January 27, 2021
Source:
https://mena.yougov.com/en/news/2021/01/27/fifa-world-cup-tops-yougov-sports-global-buzz-2021/
675-43-03/Poll
Tunisian youth rank unemployment and the economy as top problems, disapprove of government’s performance, Afrobarometer study shows
Unemployment and management of the economy are the two most important problems that young Tunisians want their government to address, an Afrobarometer study shows.
Although most citizens disapprove of the government’s performance in handling economic issues, including creating jobs, the youth are more likely than their elders to rate the government poorly on indicators of economic performance.
The study also shows that Tunisian adults of all ages cite job creation as the top priority for additional government investment in youth development and that a large majority of citizens believe more attention should be paid to “fresh ideas from young people.”
A decade after the revolution that sparked democratic changes in Tunisia, the youth have hit the streets in a series of protests against poor economic conditions and unemployment, which have been aggravated by the COVID-19 pandemic.
(Afrobarometer)
January 28, 2021
AFRICA
675-43-04/Poll
Ethiopians embrace freedoms, but are also willing to trade certain liberties for the sake of public security, Afrobarometer survey finds
A large majority of Ethiopians say they feel free to express their thoughts, to join political organizations, and to vote for the candidate of their choice, according to a recent Afrobarometer survey. But while most citizens think that people should have the right to associate freely, more than half would be willing to accept restrictions on certain freedoms in the name of security. If public safety were under threat, a majority would endorse the government’s right to impose curfews and roadblocks, to monitor private communications, and to regulate what is said in places of worship.
Key findings
▪ By large majorities, Ethiopians say they feel “somewhat” or “completely” free to say what they think (79%), to join political organizations of their choice (71%), and to choose whom to vote for (76%) (Figure 1).
▪ Two-thirds (66%) of Ethiopians say people should be able to freely join any organization regardless of whether the government approves of it. Only one-third (34%) think the government should be able to ban any organization that goes against its policies (Figure 2).
▪ But a majority of Ethiopians would be willing to give up some of their freedoms in the name of public safety. In particular, if public safety were threatened: o 55% say the government should have the right to impose curfews and set up roadblocks to prevent people from moving around (Figure 3).
▪ 55% would allow the government to monitor private communications, such as mobile-phone conversations, to make sure that people are not plotting violence (Figure 4). The opposing view, that citizens have a right to communicate in private without government monitoring, is somewhat more popular among men and more educated respondents (Figure 5).
▪ 54% would endorse the government’s right to regulate what is said in places of worship (Figure 6).
(Afrobarometer)
January 25, 2021
EUROPE
675-43-05/Poll
Public support of strict lockdown helps Fianna Fail
As we head into the second month of lockdown since Christmas, it appears that the strict nature of the lockdown since the holidays, is actually seen to benefit Fianna Fail – who voters feel have shown a stricter view on how we approach managing with COVID-19.
There are many who might have expected the government to do poorly in today’s poll. Given the issues surrounding school lockdowns, vaccine roll out, and the decision to open up for a meaningful Christmas, which now appears on the surface to have been a serious mistake.
A large proportion of the population are seen to be not happy with how good a job the government is doing at rolling out vaccines as quickly as possible. However, those who are most unhappy with the process, tend to be those that wouldn’t support the government parties anyway, and as such it doesn’t have as much impact on party support as people might expect.
One thing is clear from the results of today’s poll and that is that on the whole the public continues to favor a harder lockdown and stricter rules to bring an end to the rise of COVID-19 cases.
The recent introduction of stricter rules for travel certainly appear to appeal strongly to the public at large, with 86% of those we spoke to supporting the idea that people travelling to Ireland should have quarantine in a hotel at their own expense for 14 days, in order to reduce the risk of Covid 19 transmission.
We also asked if people believed that pubs and restaurants should remain closed, until most people had been vaccinated. Clearly this is a very strict position, but even still 70% of the public actually supports the idea. That is despite the fact that during the time that the poll was in field, it became clear that many may not be vaccinated until late into 2021.
With stricter rules in place, the result is that the government parties hold on to the same level of overall support at 50% of the population. It is just the breakdown of that support which changes, as perhaps the more moderate Fine Gael fall back, and the perceived stricter Fianna Fail make gains.
Those most in favor of the strict measures are Fianna Fail voters. In fact, an astonishing 84% of those who say that they will vote for Fianna Fail at the next election, support the idea that pubs and restaurants remain closed indefinitely.
As a result of this perception of Fianna Fail perhaps being seen as the stricter party, they see support increase by 4% in today’s poll, securing 16% of the first preference vote. This is nowhere near where they have been in the past. However, it is a significant improvement on the 10% and 12% that they have been reaching in recent months.
Elsewhere, the poll sees Fine Gael retain their lead as the largest party in the country. However, this lead and the party’s support in the polls, has been reduced over the Christmas Break. Now 29% of the public suggest that they would give Fine Gael their first preference vote, down 4% on what they secured in November just prior to the Christmas break. This level of support is also a long way down from the heady mid 30 levels that the party achieved at the start of the pandemic, when it was leading the interim government at the time.
Sinn Fein remains the second largest party in Ireland, but with support returning the 27% level they achieved for much of the autumn months. This will be disappointing for the party after they achieved their highest share of the vote in the last poll before Christmas securing 30% at that time.
It is not clear why the party has fallen back again. However, what we do see in the poll results is that Sinn Fein voters are most likely to disagree that the government is doing a good job at rolling out vaccines as quickly as possible. This could suggest its supporters want to see the party do more to force the vaccine rollout more quickly.
Most of the other parties retain support in and around the level seen in November. However, one result is worth mentioning which sees the Social Democrat party secure 5% in today’s poll. This is a continued trend of support which saw the party gain supporters from October at 3% November at 4% and today’s poll of 5%. The party’s strong publicity over recent months, in particular it’s focused support for strict quarantine of those visiting island, appears to have been instrumental in helping drive support.
(Red C Research)
February 01, 2021
Source: https://www.redcresearch.ie/public-support-of-strict-lockdown-helps-fianna-fail/
675-43-06/Poll
Neighborhood apps: a safe neighborhood or, above all, less privacy?
Neighborhood apps were originally created to improve contact between neighbors and increase safety. The aim is also that neighbors can count on each other more and there is more understanding for each other. But what about in practice? And is it safe to use the apps? In practice, using neighborhood apps is not just about making the neighborhood safer. This is partly because the makers of neighborhood apps have other goals in mind than just creating safety; many app makers seem to primarily want to earn money from the rollout of a neighborhood app. In addition, users also ensure that safety in the neighborhood is not always central when using these apps.
Use of neighborhood apps
Neighborhood apps are intended to promote safety in the neighborhood and to facilitate contact between neighbors. There are regularly good initiatives that see the light of day thanks to the neighborhood apps. To get a good idea of the use of neighborhood apps, research agency Motivaction commissioned VPNGids.nl to conduct a survey among 1267 Dutch people. This shows that more than one in three (35.6%) Dutch people currently uses a neighborhood app. Another 10% have used a neighborhood app before, but decided to stop.
Differences between the
Dutch
Analysis of the data shows that more men than women use a neighborhood app today: 39.5% of men use it, compared to 32% of women. In addition, the questionnaire shows that people with a higher income in particular use neighborhood apps. 40.4% of all Dutch people with an above-average income use a neighborhood app, while this is 32.8% among people from lower income groups. The level of education also appears to be strongly related to the differences found in the use of neighborhood apps. 21.9% of all practically educated people use a neighborhood app, while this share is 47.2% among highly educated people. Neighborhood apps are not used equally everywhere in the Netherlands. The share of residents currently using a neighborhood app varies from 45.3% in Overijssel to 20.4% in Zeeland. In Amsterdam,
Safer neighborhood
The vast majority of neighborhood app users are currently part of a neighborhood app for safety in the neighborhood (64.8%). And that is not without reason the main reason: 45.2% of today's users actually feel safer by using the neighborhood app.
But does a neighborhood app also lead to more safety? It seems that way, because 34.2% of people who now use a neighborhood app indicate that a crime has been solved or prevented via the app. This share is lower for people who used a neighborhood app in the past but have now stopped using it (11.8%). The display below refers to people who have used a neighborhood app now or in the past.
Negative experiences with
neighborhood apps
Yet neighborhood apps regularly miss their mark, both current and former users indicate. For example, in 20% of all neighborhood apps there are arguments. South Hollanders in particular seem to have a short fuse in their neighborhood app, because it sometimes happens to 26.6% of the users. In Noord-Holland (25.6%), Drenthe (23.4%) and Zeeland (22.6%), arguments are regularly held in the neighborhood app.
In addition, neighborhood apps are also a source of irritation for a large part of the users. In total, 40.4% is sometimes annoyed by messages in the neighborhood app. Almost half of all highly educated people are irritated by their neighborhood app (49%), while only 36.5% of users of other educational levels are sometimes annoyed.
Users in Overijssel in particular are regularly annoyed (45.8%). Neighborhood app irritations are the least common in Drenthe, at 23.9% of neighborhood app users.
WhatsApp neighborhood
prevention groups in the Netherlands
In the Netherlands there are approximately 9,500 registered WhatsApp neighborhood prevention groups. Especially in Zeeland and Limburg there is a high number of neighborhood prevention groups per 10,000 inhabitants (more than seven per 10,000 inhabitants). Relatively speaking, the province of Groningen has the lowest number of neighborhood prevention groups: 2.8 per 10,000 inhabitants. Relatively speaking, Wijdemeren has the most neighborhood prevention groups. There are 33.3 registered neighborhood prevention groups per 10,000 inhabitants via WhatsApp. Landsmeer (31.4), Boxmeer (29.3) and Gennep (28.6) also have more than 25 neighborhood prevention groups per 10,000 inhabitants.
Burglary figures and the use
of neighborhood apps
To inventory the effectiveness of the use of neighborhood prevention groups, the municipal burglary figures have been compared to the use. In municipalities where many neighborhood prevention groups are used, you would expect a decrease in burglaries in recent years.
This is indeed the case: municipalities with a strong decline in burglaries have more neighborhood prevention groups than municipalities where the decline in burglaries is only limited. In municipalities where at least 30 fewer burglaries per 10,000 inhabitants were committed in 2019 compared to 2015, there are an average of 12.1 neighborhood prevention groups per 10,000 inhabitants; almost twice as much as the average in a municipality. Notable outliers are two municipalities with a sharp increase in the number of burglaries, but where residents often use a neighborhood app. In Wijdemeren and Beemster, the number of burglaries increased the most in the past five years, but there are also an above-average number of neighborhood prevention groups. Residents of these municipalities may try to stop the increasing crime with the help of neighborhood prevention groups.
Stimulation of neighborhood
prevention by municipalities
Many municipalities encourage the use of neighborhood prevention groups and other forms of neighborhood prevention. 252 municipalities report this on their website. 103 municipalities do not do this. In particular, the 311 municipalities with fewer than 14 neighborhood prevention groups per 10,000 inhabitants often have no information about neighborhood prevention on their website (30.1%). This percentage is much lower among the 44 municipalities with more than 14 neighborhood prevention groups per 10,000 inhabitants; only 15.9% of municipal websites lack information about neighborhood prevention.
Privacy with neighborhood
apps
Although neighborhood apps are well-intentioned, there are also consequences for the privacy of users and other neighborhood residents (as witness this tweet ). And that is not only due to the fact that neighbors may label each other as 'suspicious person' and keep an extra close eye on each other. How the neighborhood apps themselves are structured and operate, sometimes leads to privacy risks and fuss. A good example of this is that the makers of the neighborhood app Nextdoor sent letters within residential areas and signed these letters on behalf of existing users of the app from the relevant residential areas. However, these existing users knew nothing about this and therefore had not given permission to contact neighbors on their behalf. Nextdoor's terms and conditions state that users consent to this, but users are often unaware of this. The police are therefore regularly approached about the fact that a letter is being distributed in a neighborhood with the name and street name of a Nextdoor user.
Ads in the apps
Neighborhood apps are also not always good for the privacy of users in other ways. Several free providers of neighborhood apps show advertisements within their app in order to generate income. These advertisements are aimed at specific characteristics of users, such as surfing behavior and personal characteristics. Almost half of all apps surveyed use user data for advertising purposes. For example, Buurkracht, WeAlert and Nextdoor place tracking cookies for targeted advertisements. Address data is also used for the advertisements. For example, an advertiser can target his advertisements to a specific city, neighborhood or district. Veiligebuurt states in the privacy statement that it only shares personal data with partners, such as knowledge institutions, municipalities and insurers.
Tips for using a
neighborhood prevention app
If you want to get started with a neighborhood prevention app, you will find some practical tips below.
- Involve all relevant households in the neighborhood in the neighborhood prevention app as far as possible. The effectiveness of a neighborhood prevention app stands or falls with the active participation of neighbors.
- Ask the local police officer if they want to join the neighborhood prevention app. Via this page of the police you can easily find out which local police officer is working in your area and contact the relevant agent (s) directly via a contact form.
- Make clear agreements about what information is and is not shared in the neighborhood prevention app. Typically only share suspicious activities in the neighborhood prevention app. Consider using a second, separate neighborhood app for less urgent messages, such as power cuts or flooding.
- If you see anything suspicious, use the SAAR method. S = Report what is happening. A = Alert the police by calling 112. A = Appen! Send a message to the rest of the neighborhood via the neighborhood prevention app to notify everyone of the suspicious situation. Also indicate whether 112 has already been called, to prevent the entire neighborhood from calling at the same time. R = Respond to the suspicious situation. Disrupt the suspicious person's activities without putting yourself in danger.
- When you are going to take a look at a report in the neighborhood prevention app by a neighbor, first think about your own safety. Remember that you may come face to face with suspicious and unpredictable people. As a neighborhood, act in a de-escalating way, avoid excessive violence in the event of a civilian arrest and ensure that the police are informed in time.
Research method
To get a picture of how neighborhood apps function, a questionnaire was initially drawn up together with research agency Motivaction and administered to a representative group of Dutch people (N = 1267) to find out how Dutch people use and experience neighborhood apps. In addition, the WhatsApp groups registered on the WhatsApp Neighborhood Prevention website were examined : where are these groups mainly located? Whether municipalities stimulate the use of neighborhood prevention has been investigated with the help of the municipal websites. Does the site provide information about neighborhood prevention, neighborhood apps or WhatsApp groups with neighbors? And do neighborhood apps promote safety in the neighborhood? This has been investigated using the most recent burglary figures.
Finally, it was investigated how neighborhood apps deal with the privacy of users. Based on the general terms and conditions and privacy statements, it has been investigated what exactly users agree to when downloading a neighborhood app. This includes the way in which address data is handled, the possible placing of tracking cookies and the sharing of user data with advertisers and external parties.
(Motivaction)
January 28, 2021
675-43-07/Poll
Car enthusiasts less likely to be concerned by climate change
Is it possible to be a car enthusiast and an environmentalist? Even with the rise of electric and hybrid vehicles, it is sometimes treated as a contradictory proposition.
According to YouGov data, it appears that car enthusiasts are less likely to have positive attitudes towards climate change – but not much less. Just over half (56%) of Brits interested in cars agree that climate change is the biggest threat to civilisation compared to 62% of the general public. Germans appear more environmentally conscious, but there remains a slight disparity between car enthusiasts and the public in response to the same question (68% vs 72%).
In addition, two in five (40%) American motorheads consider themselves environmentalists in contrast to 47% of the population. The same can be said for Great Britain, with car enthusiasts less likely to identify as environmentalists (33% vs 39%).
The relaxed approach of car enthusiasts towards the environment may affect which companies they are likely to buy from. Americans (37%) and Brits (38%) being less likely to consider the environmental or social credentials of a company than the general public (47% and 42% respectively).
These purchasing habits also appear to influence which type of energy is considered. Roughly half of car enthusiasts from Germany (52%), Great Britain (55%) and the US (53%) claim that they don’t care about “green energy” – so long as it is cheap.
What is noticeable when comparing data sets across the three countries is that German car enthusiasts appear more active in their efforts against climate change. Some 45% (compared to 46% of the population) consider themselves environmentalists and a greater proportion (48% vs 47%) try to buy from companies that are socially and environmentally responsible.
(YouGov)
January 25, 2021
675-43-08/Poll
Overwhelming public support for toughening travel restrictions
Britons are very supportive
of measures such as forcing travellers to quarantine in hotels and even banning
international flights completely
Ministers are considering increasing the restrictions on international arrivals again, after the requirement for travellers to show proof of a negative COVID test came into force last Monday. New YouGov data shows that nine in ten people (92%) support the new rules on showing a negative test.
Most people (87%) are also in favour of making arrivals quarantine in hotels for 10 days when they arrive in the UK. Government officials are currently in talks with hotels about the New Zealand-style policy and haven’t ruled out making travellers foot the bill which could be as steep as £1,500 per person.
The current policy of making all arrivals quarantine at an address of their choice for 10 days is slightly less popular but still has very high backing at 79%.
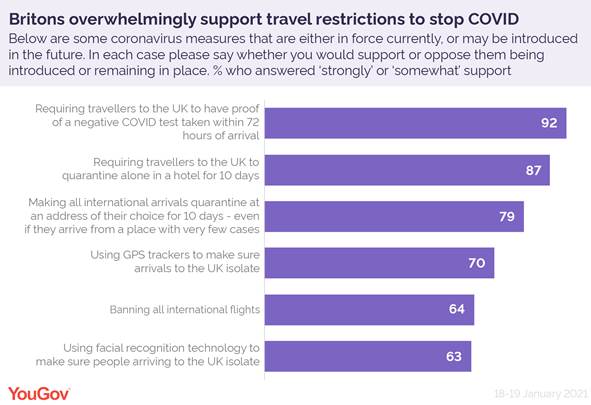
Ministers are also considering other options such as using GPS trackers to make sure people arriving to the UK isolate properly. Seven in ten people (70%) approve of this, while about three in five (63%) support using facial recognition technology for the same purpose, which is another option on the table.
Banning all international flights – a move which is reportedly on the cards – scores lowest among the policies in the survey, but nearly two thirds of Britons (64%) would back it.
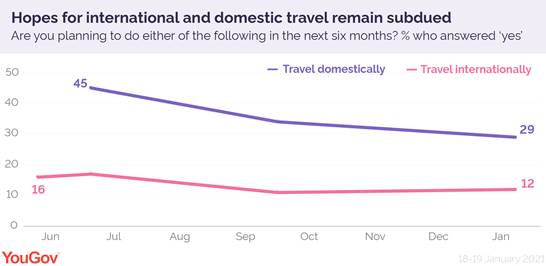
Few people plan to travel in the next six months – including domestically
Most Britons have come to terms with not going abroad in the foreseeable future, with only 12% planning to do so. The figures haven’t moved much from summer and autumn last year. They peaked in July when 17% of people planned to go abroad.
Despite some reports that the vaccine rollout has prompted older Britons to get booking, younger people are still more likely to say they’re going on holiday abroad. One in six 18-24-year-olds (16%) say they have plans to do so, compared with 9% of those aged 65 and older.
While Health Secretary Matt Hancock has encouraged Brits to go on staycations rather than abroad, the number of people hoping to enjoy a domestic trip in the next six months is lower now (29%) compared with in July (45%) and September (34%) last year. However, news from British holiday destinations of record bookings suggests that those who are hopeful are already making their moves.
(YouGov)
January 25, 2021
675-43-09/Poll
Remittances: Who sends money overseas?
YouGov data takes a look at
British and American remittance payments
Data from YouGov Profiles reveals that 12% of Britons and Americans send money overseas. But how often do they make these payments – and why do they make them?
Our research shows that a fifth of Britons (20%) and a quarter of Americans (25%) who send remittance payments do so at least once a month – with 21% and 27% respectively sending this money abroad at least once every two to three months. Another fifth of those in Britain (18%) and the US (21%) who transfer money overseas do so once every four to six months, while 12% and 10% respectively do so every seven to 12 months.
How much money are people sending abroad – and why are they sending it?
In terms of quantity, over half (54%) of Brits who send remittance payments send less than £500 whenever they transfer money overseas – with over a quarter (28%) transferring between £100 – £499.99. A further 15% send £500-£999.99, while 18% send £1,000 or more.
It’s a broadly similar picture in the US, where over half (52%) of whose who send these payments send less than $500, and a quarter (26%) send between $100 – $500. Americans, are slightly more likely to send greater amounts of money overseas, with a fifth (20%) sending $1,000 or more and 10% sending over $5,000.
As for why these payments are sent overseas, 43% of both Brits and Americans who send remittances say they are doing so to help their families. This may align with general perceptions of remittance payments, which are commonly associated with migrants in more prosperous countries sending funds back home to help their families and communities in less prosperous countries of origin.
This tendency may be reflected in other answers given – for example, almost a fifth in both the US (18%) and Britain (17%) say they’re sending money overseas to pay for bills. This group skews younger than the general public in both markets: in Britain, two in five (39%) are aged 18-34 next to 28% of the public, while just 14% are over 55. In the US, well over half (56%) are aged 18-34 compared to 32% of the wider public – and a mere 9% are over 55.
There are some key differences between those who send remittance payments in the US and Great Britain: 29% of Americans who transfer funds abroad, for example, are doing so to save money; in Britain, this amounts to just 18% of this group overall. Americans who send remittances are twice as likely to do so in order to pay an overseas credit card (14% vs 7%) or buy an overseas property (15% vs. 7%). International school fees are also a consideration for a minority of this group: 13% of Americans and 8% of Brits say they send money abroad for education.
In terms of preferred payment methods, Paypal is the most commonly used service for both Britons and Americans – though the latter (39%) are far more likely to use it than the former (27%). British consumers who send money overseas are also more likely to use their bank (26%) than Americans (20%), while Americans are more likely to use Western Union (22% vs. 15%). Further down the list, there is evidence that London-based Transferwise enjoys a home advantage among Brits – who are twice as likely (20% vs. 10%) to use it as Americans. The same is true for Dallas-based Moneygram: used by 7% of British and 16% of American consumers who send money abroad.
(YouGov)
January 28, 2021
Source: https://yougov.co.uk/topics/finance/articles-reports/2021/01/28/remittances-who-sends-money-overseas
675-43-10/Poll
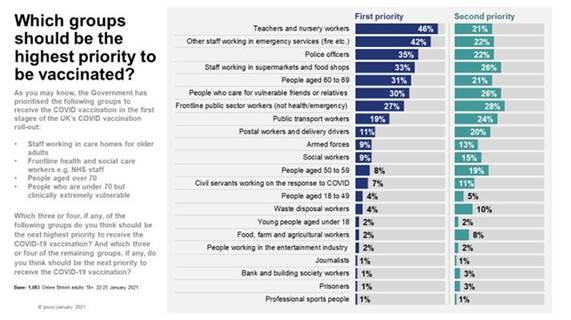
Almost half of Britons want teachers and nursery workers to be vaccinated next
Teachers, police officers and other emergency services are seen as most deserving of the next round of COVID-19 vaccines.
In a new survey by Ipsos MORI, 46% of Britons believe teachers and nursery workers should be next in line to receive the COVID-19 vaccine, after currently prioritised groups including care home workers, frontline health and social care workers, over-70s and those who are clinically vulnerable. A further 21% see them as their second priority. Over half of those aged 55-75 want teachers and nursery workers prioritised (54%); however, this falls to only a third (35%) of 18-34-year olds.
Emergency staff are also a priority for the public; 35% say police officers should be next on the list for the vaccine while 42% say other staff working in emergency services (e.g. fire) should receive it next. Other professions that are seen as a priority include those working in supermarkets and food shops (33%), frontline public-sector workers (not health/ emergency – 27%) and public transport workers (19%).
 Three
in 10 (31%) want to prioritise people aged 60-69 but
there is less concern for lower age groups; only 8% want to prioritise
the 50-59-year olds while 4% want those aged 18-49 to
be the next group to get the COVID-19 vaccine.
Three
in 10 (31%) want to prioritise people aged 60-69 but
there is less concern for lower age groups; only 8% want to prioritise
the 50-59-year olds while 4% want those aged 18-49 to
be the next group to get the COVID-19 vaccine.
However, younger Britons are more likely to prioritise
based on age. Those aged 60-69 should be next to be vaccinated according
to 34% among 18-34-year olds, making them the second highest priority group
according to Gen-Zs and Millennials. Compared to
their elders, those aged 18-34 are also more likely to want to prioritise 50-59-year olds and
18-49-year olds in the vaccination process.
Looking at other professional groups, around one in ten Britons want to see
postal workers and delivery drivers (11%), armed forces (9%) and social workers
(9%) vaccinated next.
There is less concern for those in prison, professional sports people, banks and building society workers and journalists; only 1% say these groups should be next on the list for the vaccine.
Kelly Beaver, Managing Director of Ipsos MORI Public Affairs, said:
The prioritisation
of who gets a vaccine is a tough choice for any Government who have to weigh up a range of issues when it comes to deciding
who gets the vaccine and when. But the British public are clear that after the
currently prioritised groups it’s our teachers and
emergency workers who should be next in line for the COVID-19 vaccine, even
ahead of those aged 60-69.
(Ipsos MORI)
January 29, 2021
NORTH AMERICA
675-43-11/Poll
Republicans, Democrats at odds over social media companies banning Trump
Several social media companies banned President Donald Trump from their platforms while he was still in office following rioting at the U.S. Capitol, citing their belief that his posts violated their terms of use and that his rhetoric could result in more violence. Americans are more likely to support rather than oppose this ouster, but views of the bans – and whether these platforms should remove aggressive content more generally – are sharply divided along political lines, according to a new Pew Research Center survey conducted Jan. 19-24, 2021.
Overall, 58% of U.S. adults say they think social media companies’ decisions to ban Donald Trump’s accounts from their platforms following rioting at the U.S. Capitol on Jan. 6 were the right thing to do, while a smaller share – 41% – say these were the wrong thing to do.
How we did this
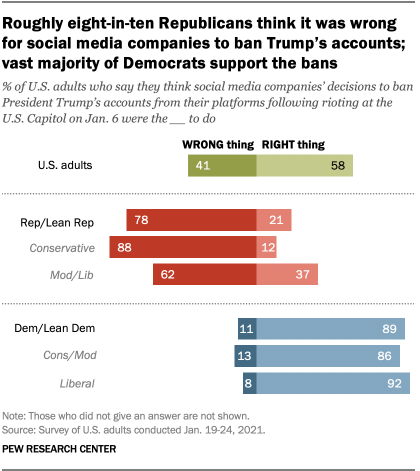
In a period when partisanship has been linked to views about social media bias and censorship, Republicans and Democrats hold sharply contrasting views of these bans. Just 21% of Republicans and Republican-leaning independents say social media companies’ decisions to ban Trump’s accounts were the right thing to do, while 78% say they were wrong. By contrast, the vast majority of Democrats and Democratic leaners (89%) say these bans were the right thing to do. Only 11% of Democrats think it was the wrong decision for social media companies to ban Trump’s accounts.
Opinions on this issue also vary within parties by ideology, but these differences are more pronounced among Republicans than Democrats. While 88% of conservative Republicans believe social media companies’ decisions to ban Trump were the wrong thing to do, that share – though still a majority – drops to 62% among moderate and liberal Republicans. And while only small shares of Democrats across the ideological spectrum say that it was the wrong decision to ban Trump, conservative and moderate Democrats are somewhat more likely than liberal Democrats to think the ban was wrong.
These partisan differences are in line with previous Center surveys that show Republicans are especially likely to disapprove of social media companies labeling posts as misleading or inaccurate, think these platforms have too much political power and influence or believe it’s likely that these sites censor political viewpoints they find objectionable.
Trump’s social media ban is especially striking given how important these platforms – particularly Twitter – have been as a way for him to address his supporters and foes alike. Companies themselves are grappling with the next steps as Facebook and others decide when – and if – Trump should be allowed back on their platforms. Whatever the long-term decisions may be, restrictions on Trump have renewed debates about how much control and responsibility social media companies should have over content that may be deemed to encourage violence.
When asked about this issue more broadly, a majority of Americans are in favor of social media companies taking steps to remove inflammatory content that these firms think could incite violence, the new survey finds. Some 63% of Americans say that social media companies should remove heated or aggressive content posted by elected officials on their platforms if the companies think this content could encourage some people to take violent action. In contrast, 35% say these firms should not remove such content, even if companies think it could encourage violence.
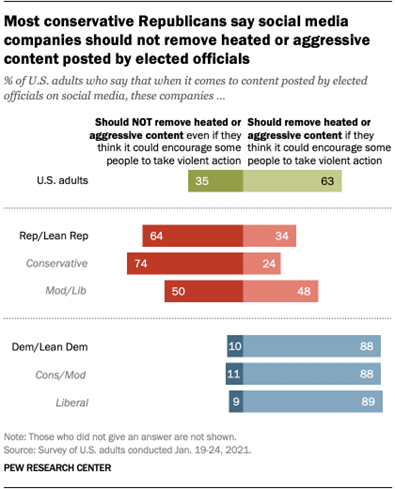
Partisans again express dramatically different views on content removal. Roughly two-thirds of Republicans (64%) say social media companies should not remove heated or aggressive content posted by elected officials, compared with one-in-ten Democrats who say the same. By contrast, Democrats overwhelmingly favor this type of intervention – about nine-in-ten (88%) say the content should be removed.
Conservative Republicans are particularly likely to oppose removal, with 74% saying social media companies should not take this action for content posted by elected officials. The views of moderate or liberal Republicans are more evenly split, with 50% saying such content should not be removed. There are no differences by ideology among Democrats.
Americans hold similar views if asked what these companies should do about heated or aggressive content posted by ordinary users. Some 63% say that social media companies should remove content of this nature posted by ordinary users if they think it could encourage violence, while 35% think these companies should not do so in this context – the same pattern present for content posted by elected officials. (Respondents were randomly assigned questions about whether social media companies should remove content posted by elected officials or ordinary users.)
These findings relate to a previous Center survey exploring the impact of heated or aggressive speech by elected officials in general – not just on social media. In a 2019 survey, about eight-in-ten Americans (78%) said that elected officials using heated or aggressive language to talk about certain people or groups makes violence against those people or groups more likely. Far fewer (21%) said this type of language does not make violence more likely.
Majorities in both parties said they think there is a connection between the language officials use to talk about certain people or groups and the possibility of violence, but this view was more widely held among Democrats (91%) than among Republicans (61%).
(PEW)
January 27, 2021
675-43-12/Poll
Majority of Americans continue to favor moving away from Electoral College
The Electoral College has played an outsize role in several elections in recent memory, and a majority of Americans would welcome a change to the way presidents are elected.
Prior to the 2020 election, many observers noted that – if Donald Trump were to win – his most likely path toward victory would involve him winning the Electoral College while losing the popular vote (as was the case in 2016). This did not happen, but the current political geography of the United States continues to allow for the possibility that the winner of the popular vote may not be able to secure enough Electoral College votes to win the office.
How we did this
A note on question wording
Joe Biden won the popular vote by a margin of about 7 million votes and 4.5 percentage points overall (51.4% of all votes cast across the country were for Biden, 46.9% for Trump). That ultimately translated into an even greater share of the votes in the Electoral College, but – for the second straight election – the outcome in the Electoral College was determined by a relatively small number of voters in a handful of swing states.
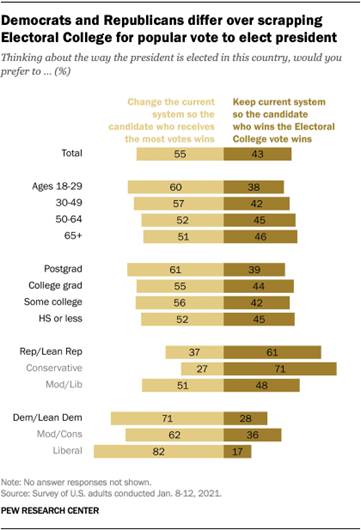
A modest majority of Americans continue to favor changing the way presidents are elected, as they did in a January 2020 survey: 55% in the new poll say the system should be changed so that the winner of the popular vote nationwide wins the presidency, while 43% favor keeping the Electoral College system. The current balance of opinion is little changed over the last few years.
Attitudes about the Electoral College remain deeply divided along partisan lines. Democrats and Democratic-leaning independents – especially liberal Democrats – say they would prefer changing the system to be based on the popular vote (71% of Democrats overall, including 82% of liberal Democrats, say this). Republicans and Republican leaners – especially conservative Republicans – prefer keeping the current system where the winner of the Electoral College takes office (61% of Republicans overall, including 71% of conservative Republicans, say this).
Overall, other demographic divides are relatively modest. Younger adults are somewhat more supportive of changing the system than older adults (60% of those ages 18 to 29 support changing the system, compared with 51% of those 65 or older). A similar divide emerges across levels of formal education. Those with postgraduate degrees are somewhat more supportive of changing the system than those with less formal education.
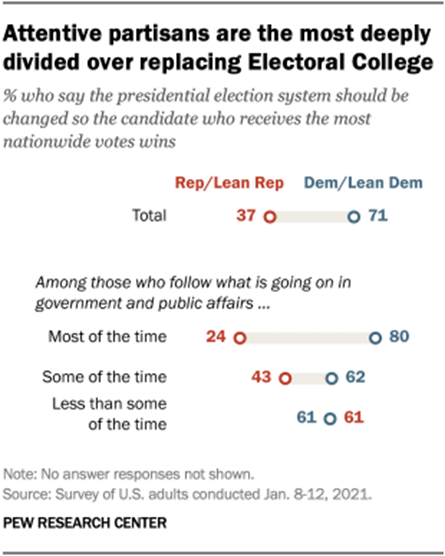
Partisan divides in views of the electoral college are most pronounced among those who pay the most attention to politics. Among partisans who say they follow what is going on in government and public affairs “most of the time,” 80% of Democrats but only 24% of Republicans say they favor changing the system. For those who say they follow politics “only now and then” or “hardly at all,” there is no partisan gap in attitudes.
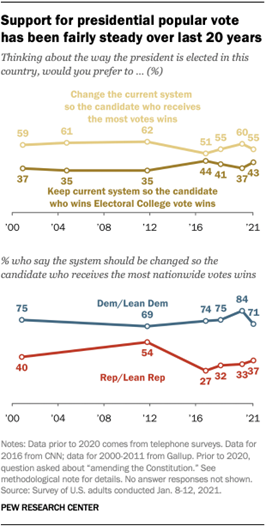
On the whole, attitudes about the Electoral College are little changed over the last several years, and this reflects a largely stable partisan divide with seven-in-ten or more Democrats and about three-in-ten Republicans supporting reform.
After winning both the popular vote and the Electoral College in November’s presidential election, Democrats’ support for reform has slipped somewhat from a high point at the beginning of 2020. Republican support for reform remains low but has increased somewhat since 2016.
(PEW)
January 27, 2021
675-43-13/Poll
Most U.S. citizens report a campaign contacted them in 2020, but Latinos and Asians less likely to say so
Most U.S. adults said they were contacted by a candidate’s campaign or a group supporting a candidate in the month before the November 2020 presidential election, with majorities saying so across racial and ethnic, educational, age and partisan groups. But when it came to Latino and Asian citizens, lower shares of those groups reported a campaign contact than adult U.S. citizens overall, according to a Pew Research Center survey conducted in the days after the election.
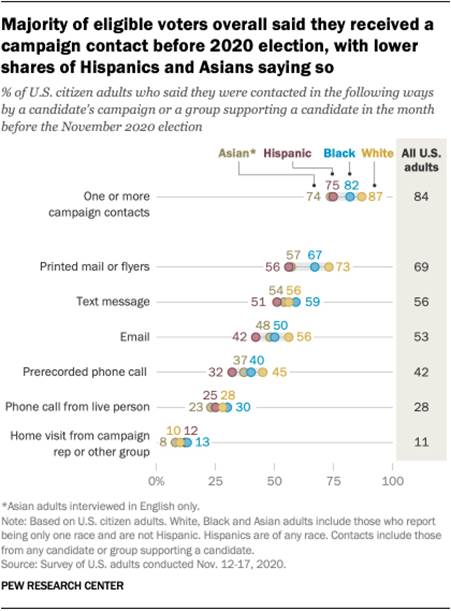
Overall, 84% of U.S. adults who are citizens, and therefore eligible to vote, said they were contacted by a candidate’s campaign or by a group supporting a candidate in at least one of six ways in the month before the November 2020 election. White eligible voters (87%) were somewhat more likely to say they were contacted than Black (82%), Hispanic (75%) or English-speaking Asian (74%) eligible voters, according to the survey. This pattern largely held true even when statistically controlling for other factors such as gender, age, education and party affiliation.
U.S. citizen adults said they were contacted in a variety of ways before the 2020 election, with printed mail the most common type of campaign outreach reported. About three-quarters of White eligible voters (73%) said they were contacted in this way, as did 67% of Black, 57% of English-speaking Asian and 56% of Latino eligible voters.
How we did this
Text messages (56%) and email (53%) were the next most common forms of campaign outreach overall, with a slim majority of U.S. citizen adults saying they received a campaign message by one of these methods. About half or more of U.S. citizens across racial and ethnic groups said they received a campaign contact via text message. Meanwhile, a slightly lower share of Hispanic (42%) and Black (50%) eligible voters reported receiving a campaign email than did White eligible voters (56%). About half of Asian eligible voters (48%) said the same.
Among those who said they voted in the 2020 election, about nine-in-ten adults reported receiving one more campaign contacts, a higher share than among all citizens (83%). This pattern extended across most racial and ethnic groups.
A prior analysis found that the amount of campaign outreach received by those who reported voting is associated with their level of political activism, with those who are more politically active saying they received more types of contacts (though survey respondents may not be aware of all campaign contacts they received).
Hispanics and Asians make up a growing share of the nation’s eligible voters. At the same time, voter turnout among Hispanic and Asian eligible voters typically trails that of White and Black eligible voters. This remained true in 2018 even after a surge in turnout nationwide. Voter turnout in 2020 is scheduled to be published by the U.S. Census Bureau later this year.
A survey fielded just before the election found mixed interest in the presidential campaign among Hispanics, views that came amid concerns the Biden campaign could have done more to engage earlier with potential Hispanic voters. Concerns were also voiced about a lack of outreach to prospective Asian American voters.
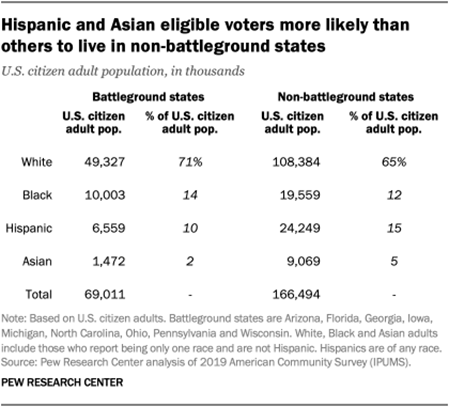
A higher share of U.S. citizen adults living in nine presidential battleground states reported receiving at least one campaign contact than did those living in non-battleground states, 93% vs. 80%.
Latinos and Asian Americans accounted for a lower share of U.S. citizen adults in battleground states (10% and 2%) than non-battleground states (15% and 5%), according to an analysis of Census Bureau data. By contrast, White and Black Americans accounted for a higher share of eligible voters in battleground states (71% and 14%) than non-battleground states (65% and 12%).
It’s also worth noting that among Latino and Asian citizens, a significant share of the population is not proficient in English, according to Census Bureau data. Eight-in-ten Latino eligible voters (80%) say they speak only English or speak English very well, while 71% of Asian eligible voters say the same. By contrast, higher shares of White (99%) and Black (98%) eligible voters say the same.
U.S. eligible voters with a
college degree and those ages 50 and older more likely to report campaign
contact
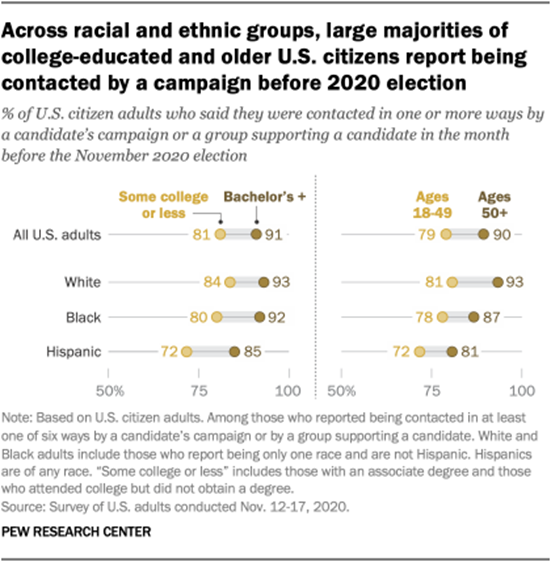
Among U.S. citizen adults, a larger share with a bachelor’s degree or higher reported being contacted in at least one of six ways than did those with some college education or less, 91% vs. 81%. These differences extend to Black (92% vs. 80%), Hispanic (85% vs. 72%) and White (93% vs. 84%) eligible voters.
Adults ages 50 and older are more likely than those 18 to 49 to say they were contacted by a campaign, 90% vs. 79%. Differences by age were also reported among racial and ethnic groups, including among Black (87% vs. 78%) and White (93% vs. 81%) eligible voters. (The sample of Asian eligible voters was too small to analyze by education and age.)
Notably, the share of adults who said they received at least one campaign contact did not differ substantially between Democrats and Democratic-leaning independents (87%) and Republicans and Republican-leaning independents (85%). Men and women, 83% vs. 85%, also had similar shares of contact by a campaign.
Posting online was the most
common preelection political activity among eligible
voters
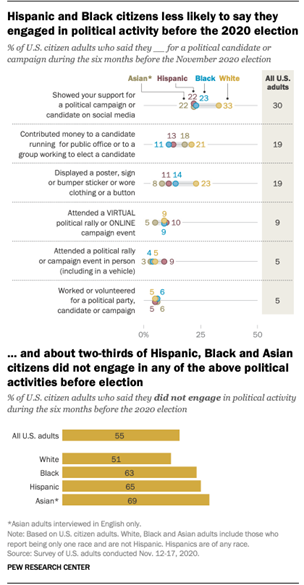
In the six months before the November election, about three-in-ten U.S. citizen adults reported they showed support for a political campaign or candidate on social media – the most common preelection political activity overall. Across racial and ethnic groups, Black (23%), Hispanic (22%) and Asian (22%) eligible voters were less likely than White eligible voters (33%) to say they posted a political message online in the six months before the election.
The next most common preelection activities were making a financial contribution in support of a candidate (19%) and displaying a poster in support of a campaign (19%). Latino (13%) and Black (11%) eligible voters were less likely than White (21%) eligible voters to say they contributed money to a candidate running for public office or to a group working to elect a candidate. Meanwhile, a lower share of Black (14%), Hispanic (11%) and Asian (8%) eligible voters said they displayed a sign when compared with White eligible voters (23%).
About two-thirds of Hispanic, Black and Asian eligible voters said they did not participate in any of the six political activities asked about in the survey during the six months leading up to the election. By contrast, about half of White eligible voters said the same. Overall, a majority of U.S. citizen adults (55%) said they did not participate in a political activity.
(PEW)
January 29, 2021
675-43-14/Poll
In U.S., Most Say Reducing Cost of Care High Priority for Biden
Seven in ten (70%) U.S. adults say lowering health insurance premiums should be a high priority for President Joe Biden and his administration among key healthcare issues, followed closely by lowering drug costs (66%) and reducing the uninsured rate (63%). These results are based on a new study conducted by West Health and Gallup.
Public Prioritization of Key Healthcare Issues, by Political Party
How high of a priority should each of the following be for the U.S. government in the first 100 days of the Biden Administration? Highest, high, medium, low, or lowest priority? (% Highest + High Priority)
|
Total |
Democrat |
Independent |
Republican |
|
|
% |
% |
% |
% |
|
|
Lower health insurance premiums |
70 |
79 |
71 |
61 |
|
Lower drug costs |
66 |
72 |
65 |
62 |
|
Reduce uninsured rate |
63 |
90 |
60 |
30 |
|
Expand care for older adults |
58 |
65 |
56 |
49 |
|
Expand child-care for working parents |
55 |
73 |
53 |
32 |
|
West Health-Gallup Healthcare Survey, Dec. 14, 2020-Jan. 3, 2021; n=3,100 |
||||
|
GALLUP PANEL |
||||
Democrats are more likely than Republicans to prioritize lowering health insurance premiums and the cost of prescription drugs, but majorities of both groups agree these cost reduction goals are high priorities. In contrast, 90% of Democrats (and 60% of independents) but only 30% of Republicans regard reducing the uninsured rate as a high priority. These results come at a time when 26% of adults report there has been at least one time in the prior 12 months that someone in their household did not pursue care due to the cost, matching levels measured in early 2019.
This survey was conducted by web from Dec. 15, 2020-Jan. 3, 2021, with 3,100 adults, ages 18+, living in all 50 U.S. states and the District of Columbia via the Gallup Panel, a scientifically populated, non-opt-in panel of about 110,000 adults nationwide.
Reducing prescription drug prices is a higher priority among older than younger age groups, dropping from 74% among those 65 years or older to 57% among those under the age of 30.
Optimism for New Policies Greatest Among Democrats, Women, Minorities
While the cost of healthcare continues to be of high importance to Americans, 28% are optimistic that the Biden administration and new Congress will be able to enact policies that will successfully reduce costs, while 49% are pessimistic. Similar results are found for policies relating to lowering the costs of prescription drugs, underscoring a public sentiment that is more doubtful than hopeful and the challenges that lie ahead for the Biden administration.
Optimism for Biden and Congress Reducing the Cost of Healthcare, Prescription Drugs
Are you optimistic or pessimistic that the Biden Administration and Congress will be able to enact policies to bring down the cost of healthcare/prescription drugs?
|
Reduce
cost of healthcare |
Reduce
cost of prescription drugs |
|
|
% |
% |
|
|
Optimistic |
28 |
27 |
|
Neutral |
22 |
25 |
|
Pessimistic |
49 |
48 |
|
Net Difference |
-21 |
-21 |
|
West Health-Gallup Healthcare Survey, Dec. 14 2020-Jan. 3, 2021; n=3,100 |
||
|
GALLUP PANEL |
||
These sentiments are not uniform, however. At the time of the survey, conducted immediately prior to Democrats winning both Georgia U.S. Senate runoff elections, about half of Democrats were optimistic about Biden achieving both cost reduction goals, compared with about two in 10 independents and less than 5% of Republicans. These responses may be somewhat different now that the Democrats have retaken the Senate, giving them control -- albeit narrowly -- of both chambers of Congress.
Optimism that the costs of healthcare will be reduced among Black (41%) and Hispanic (38%) respondents outpaces that of White respondents (24%). Also, over one-third (35%) of women are optimistic compared with 21% of men. Optimism is also higher among Americans with more formal education than among those with less.
Optimism for Biden and Congress Reducing the Cost of Healthcare, Prescription Drugs by Poltical Indentity and Key Demographics
Are you optimistic or pessimistic that the Biden Administration and Congress will be able to enact policies to bring down the cost of healthcare/prescription drugs? (% Optimistic)
|
Reduce
Cost of Healthcare |
Reduce
Cost of Prescription Drugs |
||||||||||||||||||||||||||||||||||||||||||||||||||||||||||||
|
% |
% |
||||||||||||||||||||||||||||||||||||||||||||||||||||||||||||
|
U.S. Total |
28 |
27 |
|||||||||||||||||||||||||||||||||||||||||||||||||||||||||||
|
POLITICAL
IDENTITY: |
|||||||||||||||||||||||||||||||||||||||||||||||||||||||||||||
|
Democrat |
52 |
50 |
|||||||||||||||||||||||||||||||||||||||||||||||||||||||||||
|
Independent |
22 |
20 |
|||||||||||||||||||||||||||||||||||||||||||||||||||||||||||
|
Republican |
3 |
4 |
|||||||||||||||||||||||||||||||||||||||||||||||||||||||||||
|
RACE/ETHNICITY: |
|||||||||||||||||||||||||||||||||||||||||||||||||||||||||||||
|
Black adults |
41 |
43 |
|||||||||||||||||||||||||||||||||||||||||||||||||||||||||||
|
Hispanic adults |
38 |
33 |
|||||||||||||||||||||||||||||||||||||||||||||||||||||||||||
|
White adults |
24 |
23 |
|||||||||||||||||||||||||||||||||||||||||||||||||||||||||||
|
GENDER: |
|||||||||||||||||||||||||||||||||||||||||||||||||||||||||||||
|
Female |
35 |
33 |
|||||||||||||||||||||||||||||||||||||||||||||||||||||||||||
|
Male |
21 |
21 |
|||||||||||||||||||||||||||||||||||||||||||||||||||||||||||
|
EDUCATION: |
|||||||||||||||||||||||||||||||||||||||||||||||||||||||||||||
|
Grad School Degree or Education |
36 |
34 |
|||||||||||||||||||||||||||||||||||||||||||||||||||||||||||
|
College Degree |
32 |
27 |
|||||||||||||||||||||||||||||||||||||||||||||||||||||||||||
|
Some College/Technical School |
29 |
28 |
|||||||||||||||||||||||||||||||||||||||||||||||||||||||||||
|
High School Degree or Less |
24 |
23 |
|||||||||||||||||||||||||||||||||||||||||||||||||||||||||||
|
West Health-Gallup Healthcare Survey, Dec. 14, 2020-Jan. 3, 2021; n=3,100 |
|||||||||||||||||||||||||||||||||||||||||||||||||||||||||||||
|
GALLUP PANEL |
|||||||||||||||||||||||||||||||||||||||||||||||||||||||||||||
Most See Country Moving in Wrong Direction on Key Issues
Amid the muted confidence that the Biden administration and Congress will make substantive inroads into the cost of healthcare and prescription drugs, few Americans view the country as moving in the right direction across an array of topical issues.
Leading this list is the cost of healthcare, viewed by 8% of U.S. adults as moving in the "right direction" compared with 70% who believe it is moving in the "wrong direction," including 65% of Republicans and 73% of Democrats.
The cost of prescription drugs, in turn, is viewed similarly unenthusiastically, with 12% reporting that the country is headed in the right direction compared with 68% saying it's going in the wrong direction. A somewhat greater partisan divide is found here, with 22% of Republicans reporting that the country is heading in the right direction compared with 10% of Independents and 8% of Democrats.
The issue with the least negative perception is the management of the COVID-19 pandemic, which -- despite a massive increase nationally in confirmed cases, hospitalizations and deaths since November 1 -- is possibly being bolstered by the release and early-stage administration of vaccines by Pfizer/BioNTech and Moderna. In this case, 27% of U.S. adults feel the country is moving in the right direction. Still, 53% think it is moving in the wrong direction.
Direction Country Is Headed by Key Issues
In general, do you think the country is headed in the right or wrong direction for each of the following: (% Right Direction)
|
U.S.
total |
Democrat |
Independent |
Republican |
|
|
% |
% |
% |
% |
|
|
The cost of healthcare |
8 |
8 |
5 |
12 |
|
The cost of prescription drugs |
12 |
8 |
10 |
22 |
|
Offering high quality K-12 education |
14 |
14 |
11 |
17 |
|
Climate change |
15 |
12 |
12 |
23 |
|
Immigration reform |
18 |
11 |
13 |
32 |
|
The economy |
23 |
15 |
20 |
39 |
|
Managing the COVID-19 pandemic |
27 |
28 |
21 |
34 |
|
West Health-Gallup Healthcare Survey, Dec. 14, 2020-Jan. 3, 2021; n=3,100 |
||||
|
GALLUP PANEL |
||||
Implications
As the Biden administration prioritizes its policy goals for its first 100 days, the importance of the cost of healthcare to Americans remains substantial. Research conducted by West Health and Gallup that preceded the election showed that the cost of care was considered as important as the pandemic itself in how U.S. adults intended to cast their votes, highlighting how this issue has remained critical in the minds of voters. And then-candidate Biden's trust advantage over then-President Donald Trump in managing the healthcare system amid the pandemic likely played a role in his election victory.
With at least two-thirds of respondents currently citing the reduction in health insurance premiums and the reduction of prescription drug costs as having either high or the highest priority for the Biden administration, these issues will continue to play a major role in the minds of voters as the 2022 midterm elections approach. And making real, tangible and noticeable inroads into the cost of care in the U.S. is likely to be a decisive factor in the voting decisions of many Americans.
Against this backdrop, optimism is mixed that the rising costs of healthcare and prescription drugs will be curtailed in the near future, although it is somewhat higher among Democrats (and is potentially higher now since Democrats won control of the Senate in the time since the survey was conducted). And with such a substantial number believing that the country is moving in the wrong direction across the cost of care issues, elected officials throughout the federal government will be challenged to prove them wrong.
(Gallup USA)
January 28, 2021
Source: https://news.gallup.com/poll/328757/say-reducing-cost-care-high-priority-biden.aspx
675-43-15/Poll
Americans' Economic Mood Sinks for Second Straight Month
Americans' assessments of the U.S. economy worsened in January after an even larger stumble in December, but following seven months when economic perceptions had generally shown modest improvements. The five-point decline in Gallup's Economic Confidence Index to -21 this month puts the index at a level not seen since June.
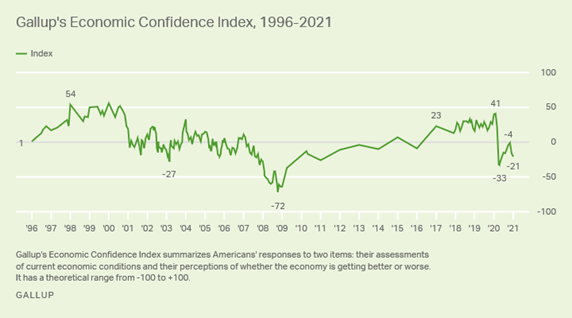
Line graph. Gallup's Economic Confidence Index since 1996. The current -21 reading is down from -16 in December and -1 in November. The latest reading is better than the -33 low from the spring. The lowest point, -72, was during the Great Recession in October 2008.
Gallup regularly tracks Americans' ratings of national economic conditions as excellent, good, only fair or poor and whether the economy is getting better or getting worse. The combined answers are used to create the Gallup Economic Confidence Index, which has a theoretical range of +100 (if all respondents say the economy is excellent or good and that it is getting better) to -100 (if all say it is poor and getting worse).
The latest reading of -21, from a Jan. 4-15 poll conducted just before President Donald Trump left office, marks the second consecutive decline in the index after seven months of steady or slightly improved readings, following the sharp drop at the start of the pandemic. The current confidence rating is 12 points shy of the 2020 low point in April. Still, it is not close to the -72 recorded in October 2008 during the Great Recession.
Decline Driven by Republicans' Worsening Views of Economy
As was the case in December, the decrease in Americans' economic confidence in January was driven by Republicans' increasingly negative views as the Trump campaign's efforts to overturn the election results in key states were rejected by courts, state election officials and state and federal officeholders.
Historically, partisans' assessments of the economy have differed, based on the party of the sitting president. That is, partisans from the same party as the president rate economic conditions more positively than do those from the opposing party. When the president's party changes, so too do partisans' views of a variety of national measures, including the economy. Gallup trends have shown that this change in views may occur as soon as the president is elected, upon inauguration or after some time in office.
Throughout 2020, Republicans' confidence in the economy was in positive territory. While it declined to +5 amid the pandemic, by Election Day, it had rebounded to +56. But after the election, as it became clear that Joe Biden had won, confidence gradually declined -- to +44 in November, +29 in December and -2 now, the first time it has been negative since 2016.
At the same time, Democrats' confidence improved from -52 in October to -42 after the election and has been steady at that level since then. Independents' confidence has been negative since the start of the pandemic and is currently -19.
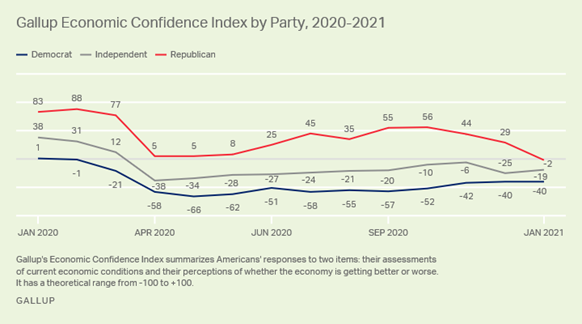
Line graph. Gallup's Economic Confidence Index from January 2020 to January 2021 by party. The latest readings are -2 among Republicans, -19 among independents and -40 among Democrats. Republicans' confidence fell 31 points between December and January.
Partisans' outlook on both dimensions of the index -- the current rating of the economy and whether it is getting better or worse -- follow the same trajectory as the index overall. Republicans increasingly think the economy is fair or poor and that it is getting worse, while Democrats' views have been generally more positive.
Americans Views of the Job Market Worsen Again
In April, the U.S. unemployment rate peaked at a pandemic-fueled 14.8%, and Americans' impressions of whether it was a good time to find a quality job fell 46 points to 22% as millions of workers lost their jobs. By November, the unemployment rate had improved to 6.7%, and 36% of U.S. adults said it was a good time to find a quality job. But in the latest poll, taken as the unemployment rate has plateaued, Americans' optimism about jobs has declined to 27%.
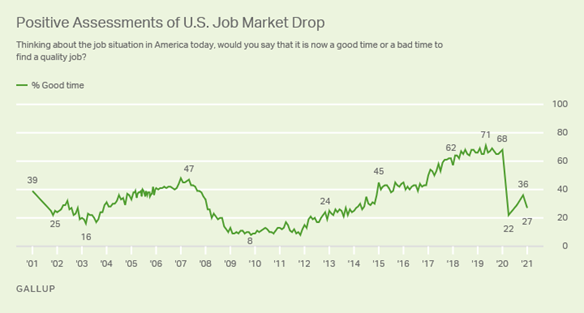
Line graph. Americans' views of whether it is a good time to find a quality job, trend since 2001. The latest percentage who say it is a good time in January 2021, 27%, is down from 36% in November.
Republicans are also the main drivers of this change, as their belief that it is a good time to find a quality job fell 21 points between November and January, versus minimal change among Democrats and independents.
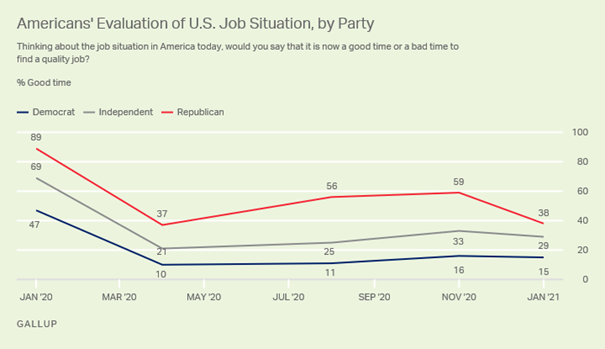
Line graph. Partisans' views of whether it is a good time to find a quality job in the U.S. since January 2020. The latest readings, for January 2021, find 38% of Republicans, 29% of independents and 15% of Democrats saying it is a good time to find a quality job. Republicans have become less likely to say it is a good time, dropping 21 points since November.
As with economic confidence, Americans' assessments of the job market vary in response to changes in key economic indicators, such as the unemployment rate. This is evidenced by the steep drop in April 2020 among all party groups. However, even as these assessments shift, party differences persist, with those who align with the sitting president's party consistently evaluating job conditions more positively than others. Such was the case in 2017, as Democrats' views of economic conditions worsened when Trump became president.
Bottom Line
The coronavirus pandemic and resulting shutdowns plunged the U.S. into an economic crisis in the spring of 2020. While there are some signs of recovery, partisans' views of the economy and jobs appear to be largely affected by politics. Partisans' perceptions of the economy have been shifting since the election, as it became clear that Trump had lost the White House. During this period, Republicans' views of the economy have markedly worsened, while Democrats' confidence in the economy has improved. These shifts are likely to continue in the early part of 2021 as the economy moves further away from one shaped by Trump's economic policies to one shaped by Biden's efforts.
(Gallup USA)
January 28, 2021
Source: https://news.gallup.com/poll/328943/americans-economic-mood-sinks-second-straight-month.aspx
675-43-16/Poll
College Student Caregivers More Likely to Stop Classes
Even before the pandemic, boosting college completion was a major goal for both policymakers and institutions. Familial obligations have long been recognized as potentially coming into conflict with students' focused dedication to coursework and thereby an obstacle to degree completion. Data from the Lumina-Gallup State of the Student Experience survey shed new light on the number of students confronting caregiving responsibilities and the consequences for completion.
Nearly-one third (30%) of all currently enrolled college students (including those pursuing a bachelor's degree, associate degree, certificate, certification or other industry certification) report that they are parents of minor children or caregivers to adults. This includes 42% of students pursuing an associate degree program and 21% of those pursuing a bachelor's degree.
Students Who Are Parents or Caregivers to Adult, by Type of Program
|
All
students |
Pursuing
associate degree |
Pursuing
bachelor's degree |
|
|
% |
% |
% |
|
|
Parent |
21 |
32 |
16 |
|
Caregiver to adult |
16 |
21 |
14 |
|
Parent or caregiver to adult |
30 |
42 |
24 |
|
LUMINA-GALLUP STUDENT STUDY, SEPT. 22-OCT. 5, 2020 |
|||
These results are from the Lumina-Gallup Student Study, conducted Sept. 22-Oct. 5, 2020, with 3,941 students pursuing a bachelor's and 2,064 students pursuing an associate degree and 400 students pursuing a certification, industry certification or a certificate. Surveys were conducted using an opt-in panel, and the sample was weighted to represent the national population of currently enrolled college students.
Caregiving Duties Differ by Employment Obligations, Race
Enrolled students who provide domestic care to children or adults are also much more likely to be employed (either full or part time) than those who do not have those responsibilities. Among caregivers of children or adults, 65% of associate degree-seeking students and 64% of bachelor's degree-seeking students are also working compared with 57% of those without caregiving duties in associate programs and 42% in bachelor's programs.
These differences are only partly due to age, as older students are more likely to have caregiving responsibilities and to be working than younger students, but caretakers of the same age are more likely to be working than non-caretakers.
Employed College Students, by Program Level and Caregiving Responsibility
% Full- or part-time workers
|
Pursuing
associate degree |
Pursuing
bachelor's degree |
|
|
% |
% |
|
|
Parent |
65 |
64 |
|
Not a parent |
58 |
43 |
|
Caregiver to adult |
68 |
68 |
|
Not a caregiver to adult |
59 |
43 |
|
Parent or caregiver to adult |
65 |
64 |
|
Neither parent nor caregiver to adult |
57 |
42 |
|
LUMINA-GALLUP STUDENT STUDY, SEPT. 22-OCT. 5, 2020 |
||
Likewise, Black and Hispanic college students are more likely than White and Asian students to be parents or caregivers to adults.
Caregiving Students, by Race, Ethnicity and Degree Level of Program
% Who are parents or caregivers to adults
|
All
programs |
Pursuing
associate degree |
Pursuing
bachelor's degree |
|
|
% |
% |
% |
|
|
Hispanic students |
39 |
53 |
31 |
|
Black students |
35 |
44 |
28 |
|
White students |
26 |
38 |
21 |
|
Asian students |
20 |
31 |
17 |
|
LUMINA-GALLUP STUDENT STUDY, SEPT. 22-OCT. 5, 2020 |
|||
Caregiving Students More Likely to Consider Pulling Out of Classes
College students who provide care to children or adults are far more likely than those who are not parents or caregivers to say they have considered stopping taking courses in the past six months, 44% to 31%. The significant relationship between caregiving or parental responsibilities and consideration of pulling out of courses persists even after controlling for race, program level, age, gender, marital status, household income, and the amount of money taken out in loans.
Of the two caregiver groups, students who care for an adult are more likely than those with children to say they have considered stopping their classes. Also, associate program students are more likely than those in bachelor's programs to have thought about it.
Caregiving Responsibilities of Students Who Have Considered Stopping Classes
In the past six months, have you considered stopping taking courses? % Yes
|
All
students |
Pursuing
associate degree |
Pursuing
bachelor's degree |
|
|
% |
% |
% |
|
|
Parent |
42 |
46 |
40 |
|
Not parent |
32 |
34 |
32 |
|
Caregiver to adult |
53 |
58 |
49 |
|
Not caregiver to adult |
31 |
32 |
30 |
|
Parent or caregiver to adult |
44 |
46 |
42 |
|
Not parent or caregiver to adult |
31 |
32 |
30 |
|
LUMINA-GALLUP STUDENT STUDY, SEPT. 22-OCT. 5, 2020 |
|||
Caregivers Cite Caregiving Among Top Reasons for Withdrawal
Those college students who have considered stopping classes were asked to indicate which reasons, from a list of 14 possibilities, best explain why they thought of doing so. Caregiving for an adult or a child is one of the key reasons, but others are about equally at play.
Thirty percent of all students who care for an adult cited that care as the reason for their possible withdrawal, 26% attributed it to the cost of schooling and 26% to obtaining a new job.
Parents were more likely to cite childcare -- with 37% citing these responsibilities and another 27% indicating the cost of attendance, 25% the coronavirus, 24% finding a new job, and 20% providing care to an adult.
At the same time, college students who do not have caregiving responsibilities were most likely to say COVID-19 (57%), emotional stress (46%) and the cost of attendance (33%) were the key reasons for considering stopping coursework.
Why Students Have Considered Stopping Courses, by Caregiving Role
Which of the following describes why you considered stopping taking courses? (Select all that apply.)
|
Parent |
Caregiver
to adult |
Not
parent or caregiver to adult |
|
|
% |
% |
% |
|
|
Childcare responsibilities |
37 |
24 |
3 |
|
Cost of attendance |
27 |
26 |
33 |
|
COVID-19/Coronavirus |
25 |
23 |
57 |
|
Got a new job |
24 |
26 |
8 |
|
Care for family member or friend |
20 |
30 |
8 |
|
Health-related reasons |
18 |
19 |
12 |
|
Emotional stress |
17 |
15 |
46 |
|
Lost job |
16 |
18 |
12 |
|
Coursework was too difficult |
13 |
12 |
18 |
|
Did not believe degree/credential would help achieve personal goals |
9 |
14 |
11 |
|
Completing degree/credential taking longer than expected |
8 |
10 |
8 |
|
Did not believe degree/credential would help achieve career goals |
8 |
9 |
7 |
|
Courses not relevant to future career |
7 |
9 |
7 |
|
Education was low quality |
6 |
10 |
15 |
|
LUMINA-GALLUP STUDENT STUDY, SEPT. 22-OCT. 5, 2020 |
|||
Bottom Line
Three in 10 college students are either the parent of a minor child, the caregiver of an adult or both. These students are significantly more likely than those without such responsibilities to say they are considering withdrawing from classes, and they say their caregiving duties are a top reason for it.
Those pursuing associate degrees are particularly likely to say they have caregiving obligations, and they are also more likely to say they are thinking about dropping out. While community colleges and other institutions that offer associate degrees may already be aware of the caregiving demands on a large portion of their students and may offer campus programs that provide such care services to students, these data suggest that more needs to be done to address the needs of these students and retain them.
(Gallup USA)
January 29, 2021
Source: https://news.gallup.com/opinion/gallup/328970/college-student-caregivers-likely-stop-classes.aspx
SOUTH AMERICA
675-43-17/Poll
Covid-19: 76% of Argentines agree with travel restrictions
A worldwide survey also determined that in the country 35% consider the threat of the virus as exaggerated. A quarter of the globe is prone to being vaccinated.
76% of Argentines accept travel restrictions to prevent the spread of the Covid-19 coronavirus and 35% consider the threat of the virus "exaggerated", according to data obtained by a global survey conducted by GIA and VOICES ! from the country.
Of the total acceptance percentage that had the limitations to the transfers in vehicles, 81% are women and 70% men, and when differentiating them according to the educational level it was determined that 85% have a primary level, 74% secondary and 62% higher.
The monitoring was carried out at the end of last year on a basis of 47 countries and about 45,000 adult citizens interviewed about the management of the pandemic in their nations, the possibility of rescinding rights to face the virus and the confidence or not about vaccines .
Argentina demonstrated that 57% are willing to partially renounce their rights to combat the disease, although this number implies a drop since in April it reached 75% of those surveyed.
GIAY VOICES perceives that this decrease "shows the fatigue and weariness that the restrictions and the pandemic crisis have generated in the minds of the population."
In this category worldwide, three out of four people responded that they agreed with sacrificing their rights and a quarter argued otherwise.
The approving group is distributed in India, Australia, Asia, the Middle East, Africa and western countries of the European Union, while the opposite is shown in Russia, Latin America, the eastern European Union and the United States.
"Even so, there is a decreasing trend in the willingness to give up human rights. It seems that people around the world have recovered from the initial shock of the new disease and are now more reluctant to give up some of their rights. of the survey in 2020, the willingness to give up human rights reached 80% worldwide, "the analysis noted.
Asked whether it is an "exaggerated threat", West Asian nations, Africa and European countries that do not make up the European Union dismiss the danger; whereas in Australia, the United States and the European Union (especially the western countries of the EU) they believe that this is not an exaggeration.
In Argentina in April the percentage was 20 and at the end of 2020 it increased to 35%, of which, according to the study, 44% live in the City of Buenos Aires, 31% reside in Greater Buenos Aires and 36 % of the total is indoors.
As for vaccines, "in general they are received with confidence around the world," he details, to the point that 67% in the world "say they would apply a vaccine against COVID-19, if it were available to the public and was considered safe and effective. "
Despite this result, the study warns that a quarter of those surveyed are more likely to decline the opportunity to administer the vaccine and less than 10% remain undecided.
Argentina, at this point, "is above the global average, with 79% of people saying they would receive the vaccine if it were considered safe and effective, with a higher proportion of men (85% vs 73% women) and young people from 18 to 29 (87%) willing to apply it ".
(Voices)
January 22, 2021
675-43-18/Poll
60% of the population strongly disagree / disagree with the "Vacation Permits"
- 59.9% of the population strongly disagrees / disagree with the “Vacation Permits”, which are granted by the government, to be able to carry out interregional transfers between communes that are, at least, in Phase 2 of transition.
- 46.6% of the population has little or no confidence that the government's Covid-19 Vaccination Plan can be complied with, which considers vaccinating 15 million people in the first half of 2021. 22.2% have very confident that the plan will be achieved and 31.2% have medium confidence.
- In presidential preferences, in spontaneous mentions, Pamela Jiles leads the preferences with (11.8%) followed by Daniel Jadue (10.7%), Joaquín Lavín (10.3%), José Antonio Kast (5.3%) , Sebastián Sichel (4.0%), Ximena Rincón (3.0%), Beatriz Sánchez (2.6%), Michelle Bachelet (2.6%), Leonardo Farkas (2.6%), Evelyn Matthei (2 , 2%), Franco Parisi (2.0%), Ignacio Briones (1.5%) and Heraldo Muñoz (1.5%).
- In the likely voting segment, (53.4% of the population) of the future presidential elections November 2021: Daniel Jadue leads the preferences with 17.0% followed by Joaquín Lavín with 11.7% and Pamela Jiles with 10 , 8%.
- President Sebastián Piñera ends January, the second fortnight, with an approval of 12.4%, -1.5 points in relation to the approval of the first fortnight of January (13.9%) and a disapproval of 73.6 %, –0.9 points in relation to the first fortnight of January (74.5%).
(Activa Research)
January 31, 2021
Source: https://www.activasite.com/estudios/pulso-ciudadano-23/
AUSTRALIA
675-43-19/Poll
Are we on the cusp of a mass city to country migration?
Melbourne was set to become Australia’s largest city by 2026. Since the start of COVID-19, when a large part of Australia’s workforce was forced to work from home, there has been much speculation whether this will impact people moving out of cities. And now it seems the evidence is starting to mount that this is in fact the case. People are moving out of Melbourne and Victoria. Survey research and ABS provisional migration data released in November support this trend.
ABS provisional migration data for the June 2020 quarter shows Melbourne had a net loss of 8,000 people from internal migration, the largest quarterly net loss on record[1].
Bastion Insights has been conducting surveys monitoring community sentiment since the beginning of COVID and our research in November showed almost 4 in 10 Victorians (23%) were likely or very likely to move interstate (24%) or to regional Australia (23%) in the next 1-3 years.
For the June quarter 2020, both NSW and Victoria lost population to other states due to migration. This is nothing new for NSW, who has been losing population interstate for a while. But this is a big change for Victoria.
Victoria’s interstate migration has been strongly positive for over 10 years. But in the June 2020 quarter Victoria lost just over 3,000 people interstate in net terms. This is the first quarter of net migration loss Victoria has recorded in over 12 years, and the largest quarterly loss since 1996, so it’s pretty significant. Victoria lost the most population to Queensland.
Comparatively NSW also saw a net loss in population of 4,000 which is the smallest net loss for NSW in 4 years. Most of the loss is to Queensland, a trend we have seen for a while. What was unusual was more people moved from Victoria to NSW (6,900) than from NSW to Victoria (6,100). NSW has not experienced a net gain of people from Victoria in over 23 years.
Melbourne also lead the internal migration from capital cities. The net loss of people through migration from capital cities across Australia in the June 2020 quarter was the largest quarterly net loss (-10,500) since this measurement commenced in 2001, with the bulk of the net loss being from Melbourne (-8,000). This is Melbourne’s largest quarterly net loss on record, and these figures only cover the first lockdown, so we expect migration out of Victoria to be even larger when the ABS release next quarter’s figures.
So, what will Melbourne look like in 2026? What we do know is COVID will have long lasting effects, many of which will only become apparent in the months and years to come.
Net interstate migration[2]
|
Jun-19 net |
Mar-20 net |
Jun-20 net |
|
|
NSW |
-5,369 |
-5,540 |
-3,955 |
|
Vic. |
2,436 |
590 |
-3,042 |
|
Qld |
5,423 |
6,268 |
6,750 |
|
SA |
-912 |
-217 |
104 |
|
WA |
-1,023 |
-224 |
-227 |
|
Tas. |
428 |
298 |
387 |
|
NT |
-950 |
-655 |
-260 |
|
ACT |
-33 |
-520 |
243 |
Net internal migration, greater capital cities
|
Jun-19 net |
Mar-20 net |
Jun-20 net |
|
|
Sydney |
-6,943 |
-8,087 |
-5,964 |
|
Melbourne |
150 |
-2,163 |
-7,957 |
|
Brisbane |
4,370 |
1,874 |
3,210 |
|
Adelaide |
-748 |
-446 |
-178 |
|
Perth |
24 |
-72 |
413 |
|
Hobart |
-203 |
-166 |
-44 |
|
Darwin |
-872 |
-562 |
-207 |
|
Canberra |
-33 |
-520 |
243 |
|
Total
net migration |
-4,255 |
-10,142 |
-10,484 |
(Bastion Insights)
January 2021
Source: https://www.bastioninsights.com/are-we-on-the-cusp-of-a-mass-city-to-country-migration/
MULTICOUNTRY STUDIES
675-43-20/Poll
Global study: where do people believe in conspiracy theories?
Research from the
YouGov-Cambridge Globalism Project shows that Britons are among the least
likely to believe many global conspiracy theories
Research from the 2020 YouGov-Cambridge Globalism Project reveals just how widespread belief in some common conspiracy theories is. The survey took place in the summer of 2020 and interviewed more than 22,000 people in 21 countries.
Where do people believe the
conspiracy theory that the United States government was involved in the 9/11
attacks?
The fallout of the 9/11 attacks survives to the present day. People continue to ask questions about what really happened that day, spawning conspiracy theories that the US government was somehow involved in, or knew of, the attacks before they happened. This conspiracy is most widely believed in Turkey, where over half of Turkish people (55%) think this conspiracy is “definitely” or “probably” true.
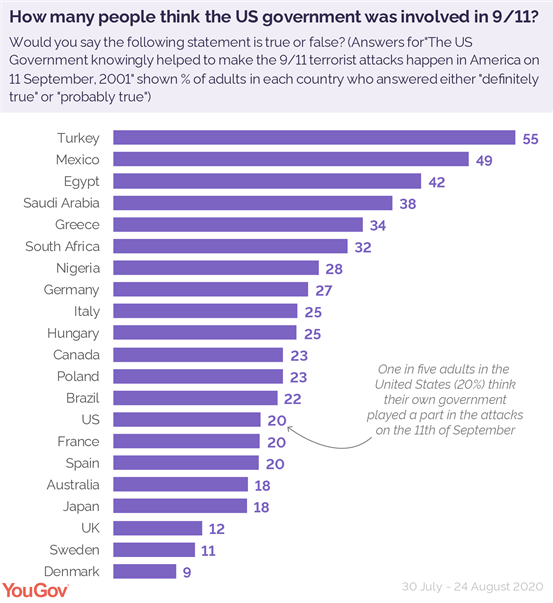
Across the border from the United States in Mexico, nearly half of Mexican adults (49%) think the United States government was involved that day. In Saudi Arabi, where Osama Bin Laden was born, 38% of adults think this conspiracy is true.
In the United States itself one in five Americans (20%) believe their government was involved, as do one in five French and Spanish people (20%). Elsewhere, Britons (12%) are among the least likely to believe the United States government were involved in the attacks.
Where do people believe the
conspiracy theory that Donald Trump’s team worked with the Russian government
during the 2016 presidential election?
Another conspiracy theory embedded in United States politics is that President Trump’s election team knowingly worked with the Russian government during the 2016 presidential election campaign against Hillary Clinton – something held to be “definitely” or “probably” true by 46% of Americans.
America’s neighbours are even more likely to think there was collusion, at 61% in Canada and 58% in Mexico. So too do a majority of people in many western countries, including 57% of Danes, 56% of Spaniards and Germans, and 55% of Britons.
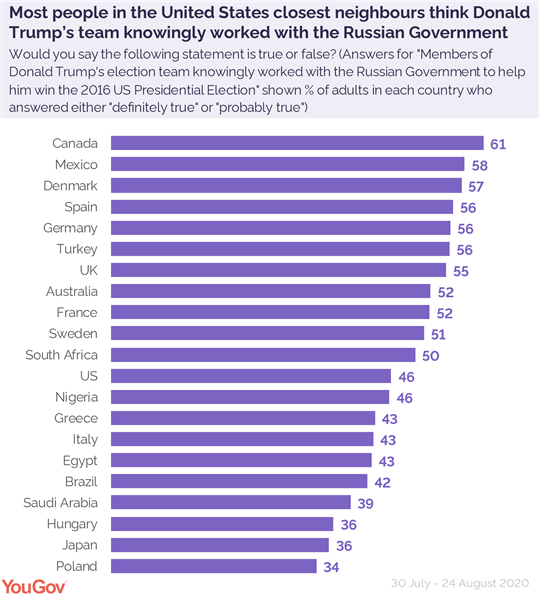
The theory is least popular among the Polish, with only 34% of people in Poland believing Trump colluded with the Russian government.
Where do people believe the
conspiracy theory that pharmaceutical companies are hiding the harmful side
effects of vaccines from the public?
Uptake of the various COVID-19 vaccines will be essential in getting the virus under control, but across the world many people believe potentially harmful side effects of vaccines are kept hidden from the public.
This belief is most likely to be held by people in South Africa, where 57% think rumours that side effects of vaccines being hidden are “definitely” or “probably” true. Similar numbers of people in Nigeria (55%), Turkey (48%), and Egypt (45%) also believe vaccines have hidden side effects.
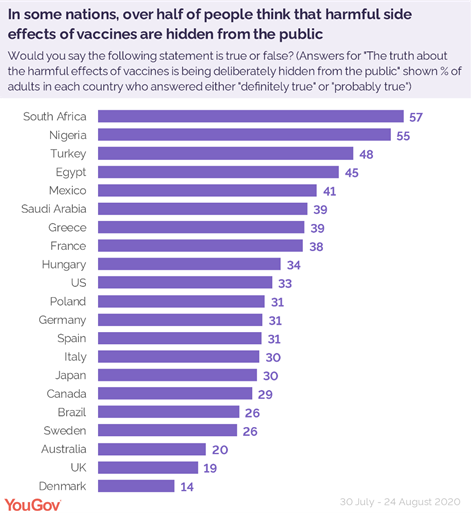
Greece (39%) and France (38%) are the European nations with the highest proportion of people who also believe this particular conspiracy, compared to a third of people in the United States (33%) who share this view. Among Britons, only 19% think that pharmaceutical companies are hiding side effects of vaccines, as do 14% of Danes who are the least likely to believe so.
Where do people believe the
conspiracy theory that the world is run by a single secret group?
The idea that the world is secretly run from the shadows by persons unknown is perhaps the oldest conspiracy theory that the YouGov-Cambridge Globalism Project has asked about, stemming from the late 18th century. The idea is one that has been become engrained in the arts and popular culture, however for many people it’s a very real prospect.
The majority of Nigerians (78%) think that the idea of the word being run behind the scenes is either “definitely” or “probably” true – as do 68% of South Africans. Over half of people in Mexico (59%), Turkey (57%), Greece (56%), Spain (55%), and Egypt (55%) all believe this shadowy cabal to be true.
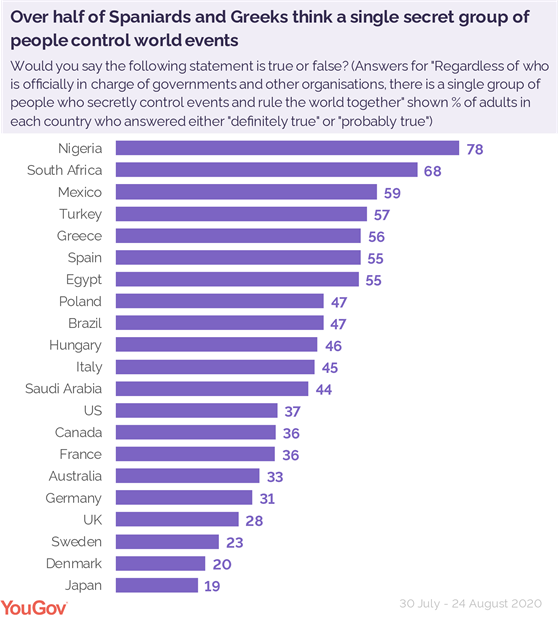
Elsewhere, over a third of people in the United States (37%) and Canadians (36%) believe this to be true. Just over a quarter of Britons (28%) agree, compared to 23% of Swedes and 20% of Danes. The Japanese (19%) are the least likely to believe the world is run from the shadows.
Where do people believe the
conspiracy theory that climate change is a hoax?
Climate change and global warming being a hoax is one of the lesser-believed conspiracy theories with an average of 22% of people across the countries polled believing it to be true. In Nigeria, the most likely nation to think so, only 31% of people believe this to be either “definitely” or “probably” true. In the United States, where climate change is heavily politicised, 27% of people think that it being a hoax made to deceive people is true, the most of any of the western nations surveyed.
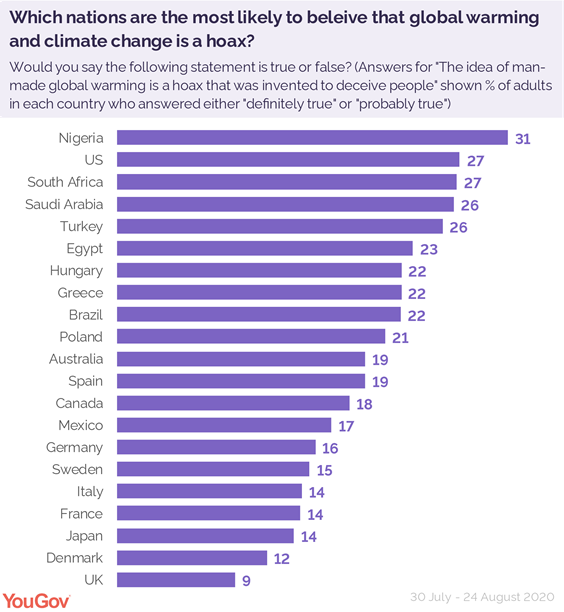
The most likely Europeans to believe this conspiracy theory at the Hungarians and the Greeks, 22% of both believe this to be true. Britons are the least likely to believe in this conspiracy, with only 9% thinking that climate change and global warning are fiction.
Where do people believe the
conspiracy theory that humanity has made secret contact with aliens?
The idea that humanity has made contact with extra-terrestrial visitors hidden from public from view is another idea that has captivated people for years, from Roswell to the X-Files. But how many people actually think it could be true?
More than two in five people in Mexico (44%) think that humanity have secretive contact with aliens is “definitely” or “probably” true, closely followed by 43% of Nigerians.
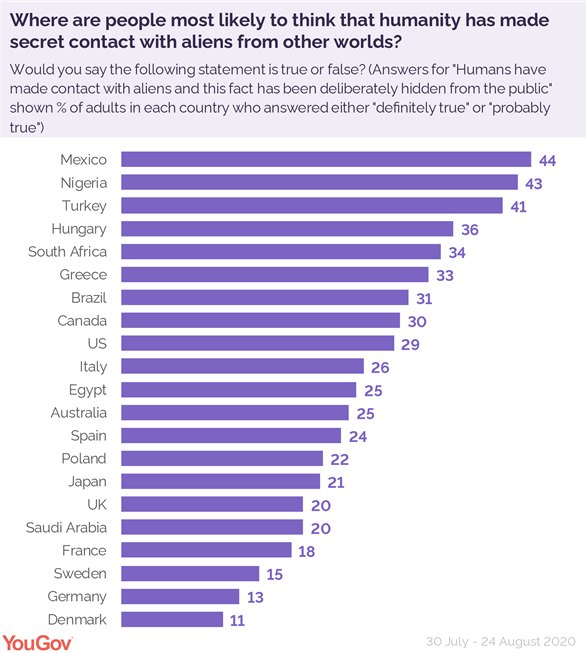
A third of Hungarians (36%) believe this to be true as well, the most likely Europeans to do so, followed by 34% of South Africans. In the United States, 29% of people think humanity has made secret contact with alien visitors, slightly behind 30% of Canadians who think the same. In Briton, one in five (20%) people think this is true.
Elsewhere in Europe, 18% of French people, 13% of Germans, and 11% of Danes all think humans and aliens have established contact.
Where do people believe the
conspiracy theory that AIDS was spread on purpose?
Since its first recorded case in 1981, the Human Immunodeficiency Virus responsible for AIDS has continued to be one of the most prevalent and deadly pandemics, with around 1.7m new cases reported in 2019. However, there are some who believe that the virus was created and spread on purpose.
This conspiracy is believed to be either “definitely” or “probably” true by two in five Nigerans (42%), the most of any nation included in this survey. A similar number of Turks (40%) and South Africans (37%) think the same.
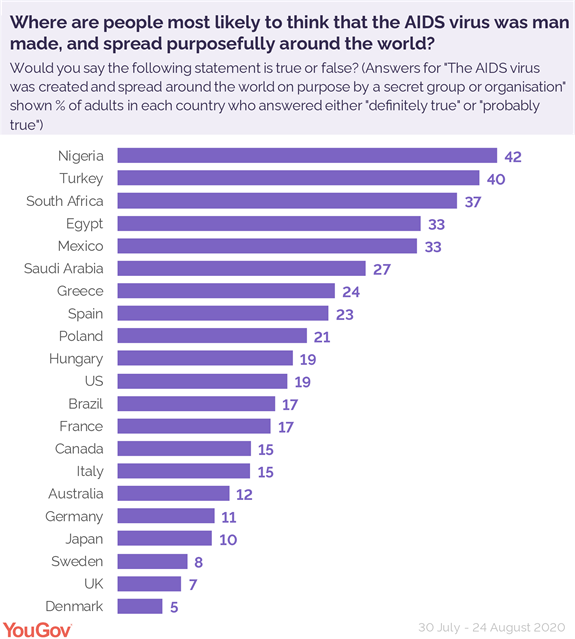
The Greeks (24%) are the most likely Europeans to believe this conspiracy, followed closely by Spaniards (23%) and Poles (21%).
Slightly fewer than one in five Americans (19%) think this is true, while in the UK only 7% believe it, second lowest to the Danes, at 5%.
Where do people believe the
conspiracy theory that the 1969 moon landings were faked?
Landing two men on the surface of the moon and bringing them home safely using less computing power than a smartphone might seem an impossible feat – and many think it was. Three in Ten people in Mexico (31%) say the it is “definitely” or “probably” true that the Americans faked the 1969 moon landings, with a similar number of Turks and Saudi Arabians (28%) also doubting the claims.
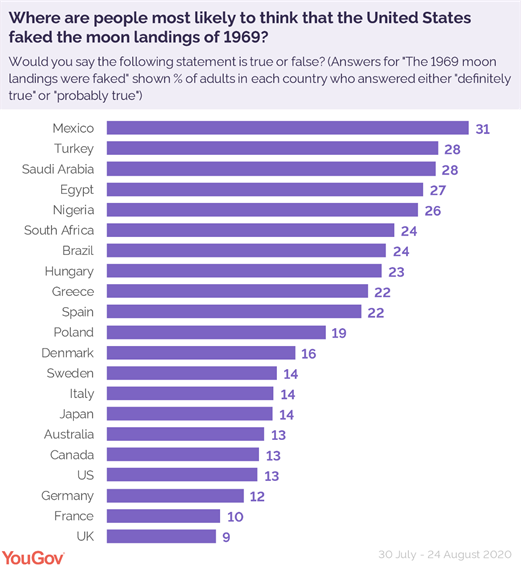
One in eight Americans themselves (13%) think the moon landings were staged, as do an identical proportion of Canadians.
In some European countries around one in five people doubt that Neil Armstrong truly made it to the Moon’s surface, including 23% of Hungarians, 22% of Greeks, 22% of Spaniards and 19% of Poles.
Once again, the Britons are the least likely to doubt the official record: only 9% of people in the UK say they think the United States faked their moon landings in 1969.
(YouGov)
January 18, 2021
675-43-21/Poll
International attitudes to following coronavirus rules
A YouGov survey of almost
19,000 people in 17 countries and regions shows where people have put the most
effort into protecting themselves
Speaking about breaches of coronavirus rules earlier this month, British health secretary Matt Hancock highlighted that COVID rules “are not there as boundaries to be pushed, they are the limit to what people should be doing”.
But YouGov research has consistently shown that many Britons only want to do the bare minimum when it comes to the rules – and our research around the Christmas relaxation of restrictions showed that many would abandon anti-COVID measures the moment they were no longer enforced by rules.
Now a new international YouGov survey, conducted in 17 countries and regions, shows that 44% of Britons describe their approach to coronavirus rules as “I have followed the government rules as and when the government introduced them, but I have not acted earlier or gone further than the government says I need to”.
Britons are not the most likely to adopt a bare minimum approach to practicing protective measures, however. That honour goes to Italians, Singaporeans and Danes, at 56% in each country.
People in Hong Kong are the most likely to have be going above and beyond when it comes to protecting themselves and others from the disease. Six in ten people there (61%) said that “I have been taking protective measures before the government said I had to and/or going further than the government says I need to.”
Mexicans are the second most likely to say that they have gone further than their government says they have to, at 54%. This could be a legacy of the government’s slow response to the outbreak in the early stages, although it could also be an indication of Mexicans overstating their virtue. A recent YouGov study showed that, while 84% of Mexicans say they themselves have been following the rules, only 30% said the same of people in their neighbourhood – by far the largest discrepancy of any country.
About half of Britons (48%) claim to have been doing more than the government requires, as do 43% of Americans.
People in Poland and the US are the most likely to say they have paid no regard to the rules. One in six people in each country (17%) confessed that they “have only followed the government rules I want to or think make sense, but otherwise I have done what I wanted”.
(YouGov)
January 28, 2021