|
BUSINESS & POLITICS IN THE WORLD GLOBAL OPINION REPORT NO. 683 Week:
March 22 –March 28, 2021 Presentation:
April 02, 2021
/Commentary:
About Three-In-Ten 31% U.S. Adults Say They Are ‘Almost Constantly’ Online Not
A Single Prefecture Backs Reuse Of Radioactive Soil Nearly
Half (47%) UAE Residents Feel Safe Against Contracting The Virus Palestinian
Anxieties Over First Elections In Fifteen Years 71
Percent Of The Tunisian Respondents Between 18-36 Are Dissatisfied By The
Education System Only
18% Of Ugandans Think They Can Report Corruption Without Any Fear Two-Thirds
Brits Agree That They Like To Look For Profitable Ways To Invest Money (66%) 6
In 10 Say Brexit Has Made No Difference To Their Daily Life 1
In 5 (19%) Believe Abolishing The Monarchy Would Be Good For The Country’s
Future 30%
Of French People Consume Meat At Least Once A Day 82
Percent Of Germans Are Of The Opinion That The Catholic Church In Germany Has
Lost Credibility The
Growing Diversity Of Black America; 46.8 Million People In U.S. Identify As
Black 40%
Of Democrats Are Paying Attention To News Of The Outbreak, Compared With 23%
Of Republicans About
Three-In-Ten 31% U.S. Adults Say They Are ‘Almost Constantly’ Online Europeans
Now See Astrazeneca Vaccine As Unsafe, Following Blood Clots Scare Global: One
In Three Would Be Uncomfortable Taking Mental Health Medication Income
And Wealth Disparities Perceived As The Most Serious Form Of Inequality INTRODUCTORY NOTE
683-43-24/Commentary:
About
Three-In-Ten 31% U.S. Adults Say They Are ‘Almost Constantly’ Online
As
smartphones and other internet-connected devices have become more widespread,
31% of U.S. adults now report that they go online “almost constantly,” up
from 21% in 2015, according to a new Pew Research Center survey conducted
Jan. 25 to Feb. 8, 2021.
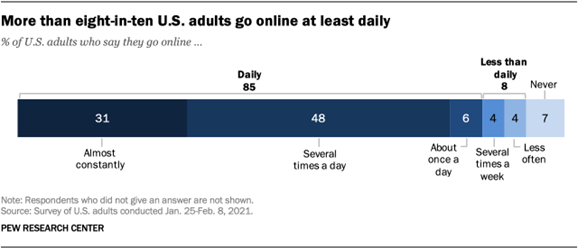
Overall, 85%
of Americans say they go online on a daily basis. That figure includes the
31% who report going online almost constantly, as well as 48% who say they go
online several times a day and 6% who go online about once a day. Some 8% go
online several times a week or less often, while 7% of adults say they do not
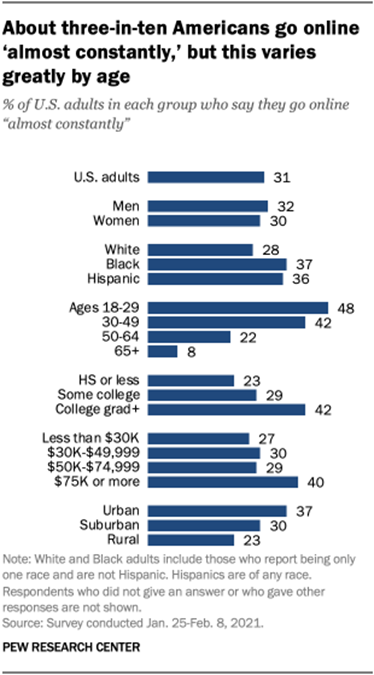
use the internet at all. Adults under
the age of 50 are at the vanguard of the constantly connected: 44% of 18- to
49-year-olds say they go online almost constantly. By comparison, just 22% of
those ages 50 to 64 and even smaller shares of those 65 and older (8%) say
they use the internet at this frequency. While the
share of 18- to 29-year-olds who say they use the internet almost constantly
has risen 9 percentage points since 2018, it remains unchanged since 2019.
Meanwhile, the share of constantly online Americans ages 30 to 49 has risen
14 points since 2015, and the share of 50- to 64-year-olds has risen from 12%
in 2015 to 22% in 2021. The share of Americans ages 65 and older saying this
has not grown since the Center began asking this question in 2015. Other
demographic groups that report almost always going online include
college-educated adults, adults who live in higher-income households and
urban residents.
While 40% of
adults with an annual household income of $75,000 or more say they use the
internet almost constantly, this is true for just 27% of those living in households
earning less than $30,000 a year. Adults who live in urban areas are the most
likely to say they go online almost constantly, compared with suburban
residents and an even smaller share of those who live in rural areas. (PEW) MARCH 26,
2021 683-43-25/Country Profile:
SUMMARY
OF POLLS
ASIA (Japan) Not A Single Prefecture Backs Reuse Of Radioactive Soil The survey of the nation's prefectural
governors, with the exception of Fukushima Prefecture, found zero support for
the reuse of contaminated dirt for farmland development or road construction
projects. Five governors, those in Yamagata, Yamanashi, Nagasaki, Kagoshima
and Okinawa, flatly expressed opposition to any reuse, regardless of projects
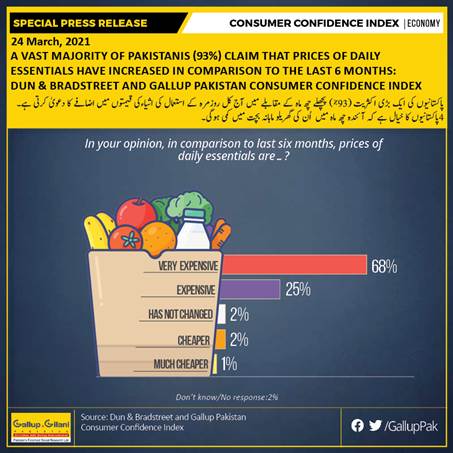
the government has in mind. (Asahi Shimbun) March 28, 2021 (Pakistan) A Vast Majority Of Pakistanis (93%) Claim That Prices Of
Daily Essentials Have Increased In Comparison To The Last 6 Months According to a Dun&Bradsheet and Gallup
Pakistan Consumer Confidence Index survey, 93% Pakistanis claim that prices
of daily essentials have increased compared to the last 6 months. 1% said
‘Much cheaper’, 2% said ‘Cheaper, 2% said ‘Has not changed’, 25% said
‘Expensive’ and 68% said ‘Very expensive.’ 2% did not know/did not
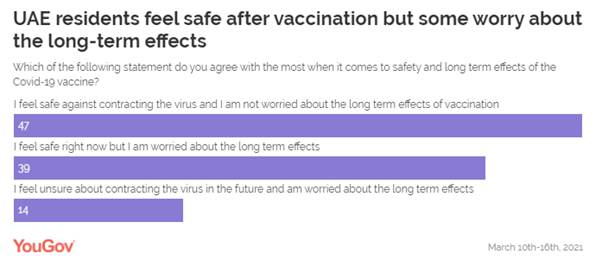
respond. (Gallup Pakistan) March 24, 2021 MENA (UAE) Nearly Half (47%) UAE Residents Feel Safe Against
Contracting The Virus As the UAE expands its vaccination drive to
bring the virus under control, YouGov’s latest survey reveals among those who
are vaccinated, nearly half (47%) feel safe against contracting the virus and
are not worried about the long-term effects of the vaccination. Slightly
lesser (39%) feel safe right now but are worried about the repercussions in
the long run. (YouGov MENA) March 24, 2021 (Palestine) Palestinian Anxieties Over First Elections
In Fifteen Years With rising confidence that parliamentary
elections will indeed take place soon, and given clear anxieties about the
possibility that the siege and blockade over the Gaza Strip could then be
tightened, the split consolidated, and that economic conditions could worsen,
and given concerns about the potential reaction from the international
community and Israel, public attitudes seem to shift a little in favor of
Fatah and away from Hamas. (Arabbarometer) March 24, 2021 (Tunisia) 71 Percent Of The Tunisian Respondents Between 18-36 Are
Dissatisfied By The Education System The data reveal that dissatisfaction with
the educational system within each educational level exceeds the 70 percent
for those having basic education and above. Respondents with MA degrees and
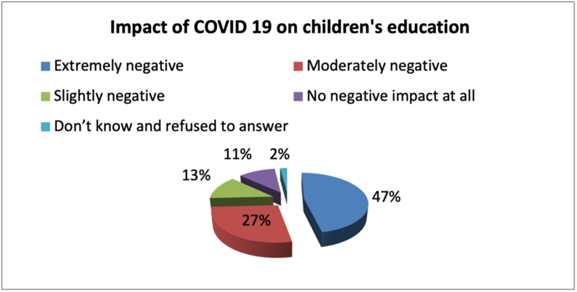
above are the most disappointed. The severe disruption is felt by many
families, as 47 percent of respondents say that the impact of the COVID-19
pandemic on children’s education is extremely negative, while 27 percent
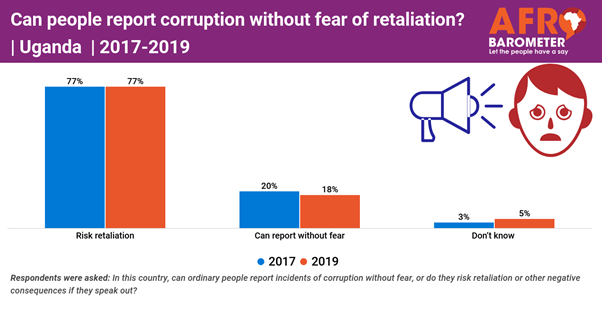
believe it is moderately negative. (Arabbarometer) March 25, 2021 AFRICA (Uganda) Only 18% Of Ugandans Think They Can Report Corruption
Without Any Fear Among key public institutions, the Uganda
police are most widely seen as corrupt, followed by civil servants and tax
officials. Paying bribes is a common part of daily life in Uganda: More than
half of respondents who accessed police services during the previous year say
they had to pay a bribe. Uganda ranks in the worst-performing quarter (142th
out of 180 countries) on Transparency International’s 2020 Corruption
Perceptions Index. (Afrobarometer) 29 Mar 2021 WEST
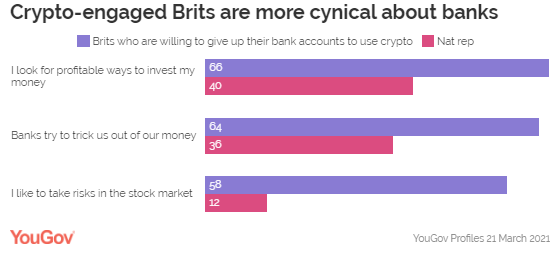
EUROPE (UK) Two-Thirds Brits Agree That They Like To Look For
Profitable Ways To Invest Money (66%) According to data from YouGov Profiles,
just 5% say they’d be prepared to give up their bank accounts and rely
entirely on cryptocurrency. Demographically speaking, this group is
overwhelmingly male: two-thirds are men (66%). They also skew
significantly younger than the general population: more than half are aged
18-34 (52% vs. 28% of the public), with two in five aged 35-54 (40% vs.
34% nat rep) and just 8% aged over 55 (vs. 38% of the public). (YouGov UK) March 25, 2021 6 In 10 Say Brexit Has Made No Difference To Their Daily
Life 6 in 10 (58%) of Britons have seen no
difference to their everyday life as a result of Britain’s exit from the
European Union. However, more have seen a negative impact than a positive
one; 28% say Brexit has made their daily life worse while only 1 in 10 (11%)
say there has been a positive change. The proportion of people who say they
have seen a negative impact on their daily lives rises among certain groups,
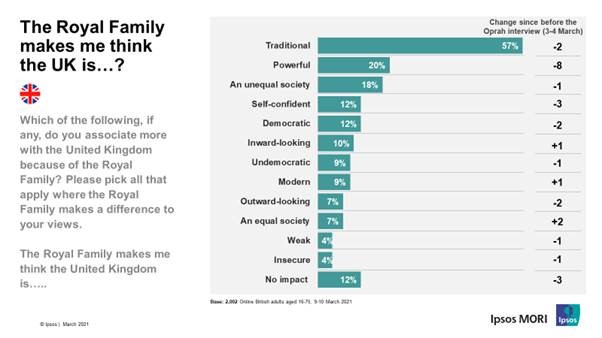
including Graduates (38%), those in Scotland (35%). (Ipsos MORI) 23 March 2021 1 In 5 (19%) Believe Abolishing The Monarchy Would Be Good
For The Country’s Future Before the interview of the Duke and
Duchess of Sussex with Oprah Winfrey was aired in the UK on Monday 8th March,
43% said Britain’s future would be worse should the monarchy be abolished,
and after the interview 41% said the same. Only 1 in 5 (19%) now believe
abolishing the monarchy would be good for the country’s future, a similar
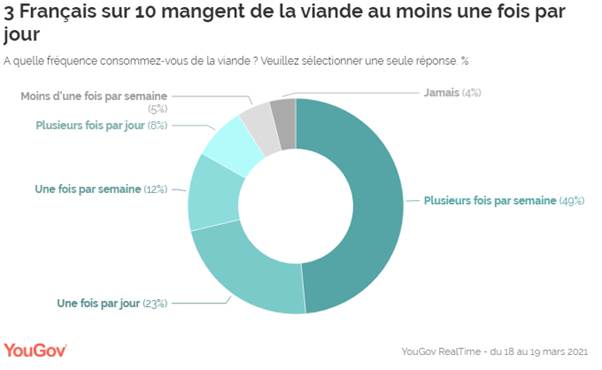
proportion to before the interview (17%). (Ipsos MORI) 24 March 2021 (France) 30% Of French People Consume Meat At Least Once A Day 30% of French people consume meat at least
once a day, a figure that climbs to 43% in the South West vs. 19% in the
Southeast. At the same time, 1 in 2 people say that their meat consumption
has decreased over the past 10 years (50%). Among those 55 and over, it
even reaches 58%. In the collective imagination, meat has a primordial
role. Indeed, 1 in 2 French people (50%) agree with the
following statement: "to be in good health, you must eat
meat". There is a significant difference between men and women with
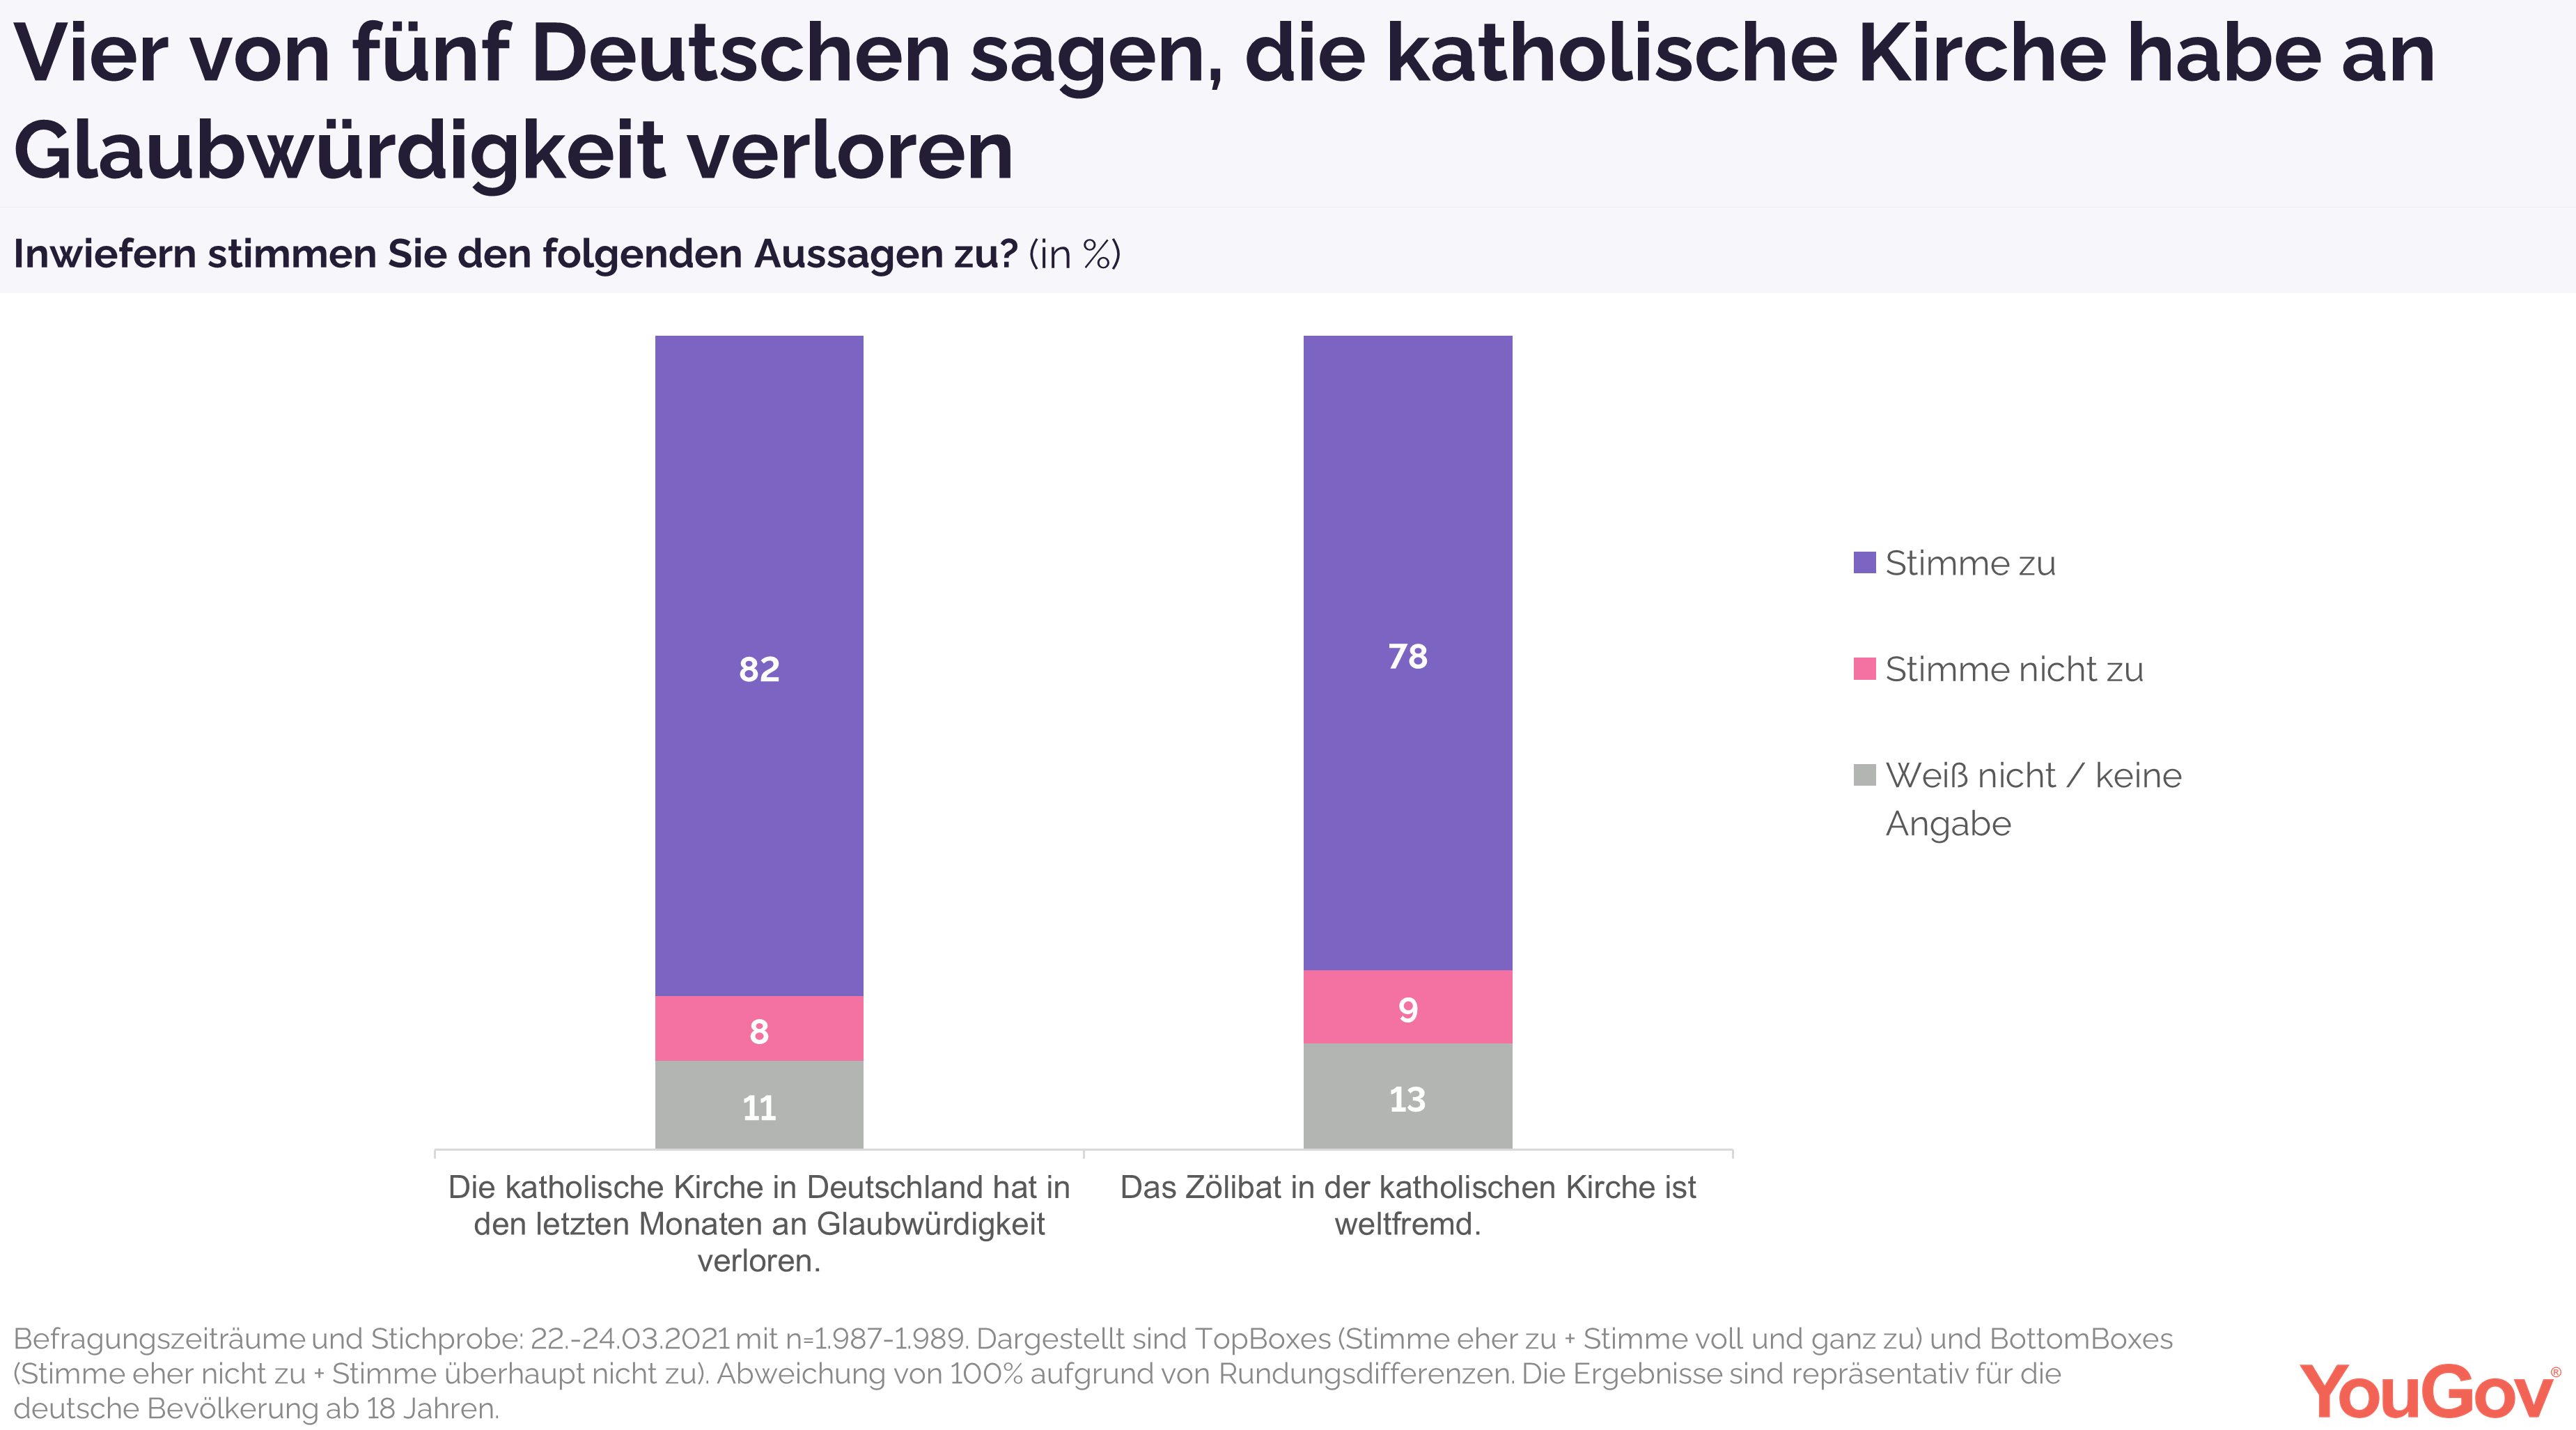
respective scores of 58% and 42%. (YouGov France) March 24, 2021 (Germany) 82 Percent Of Germans Are Of The Opinion That The Catholic
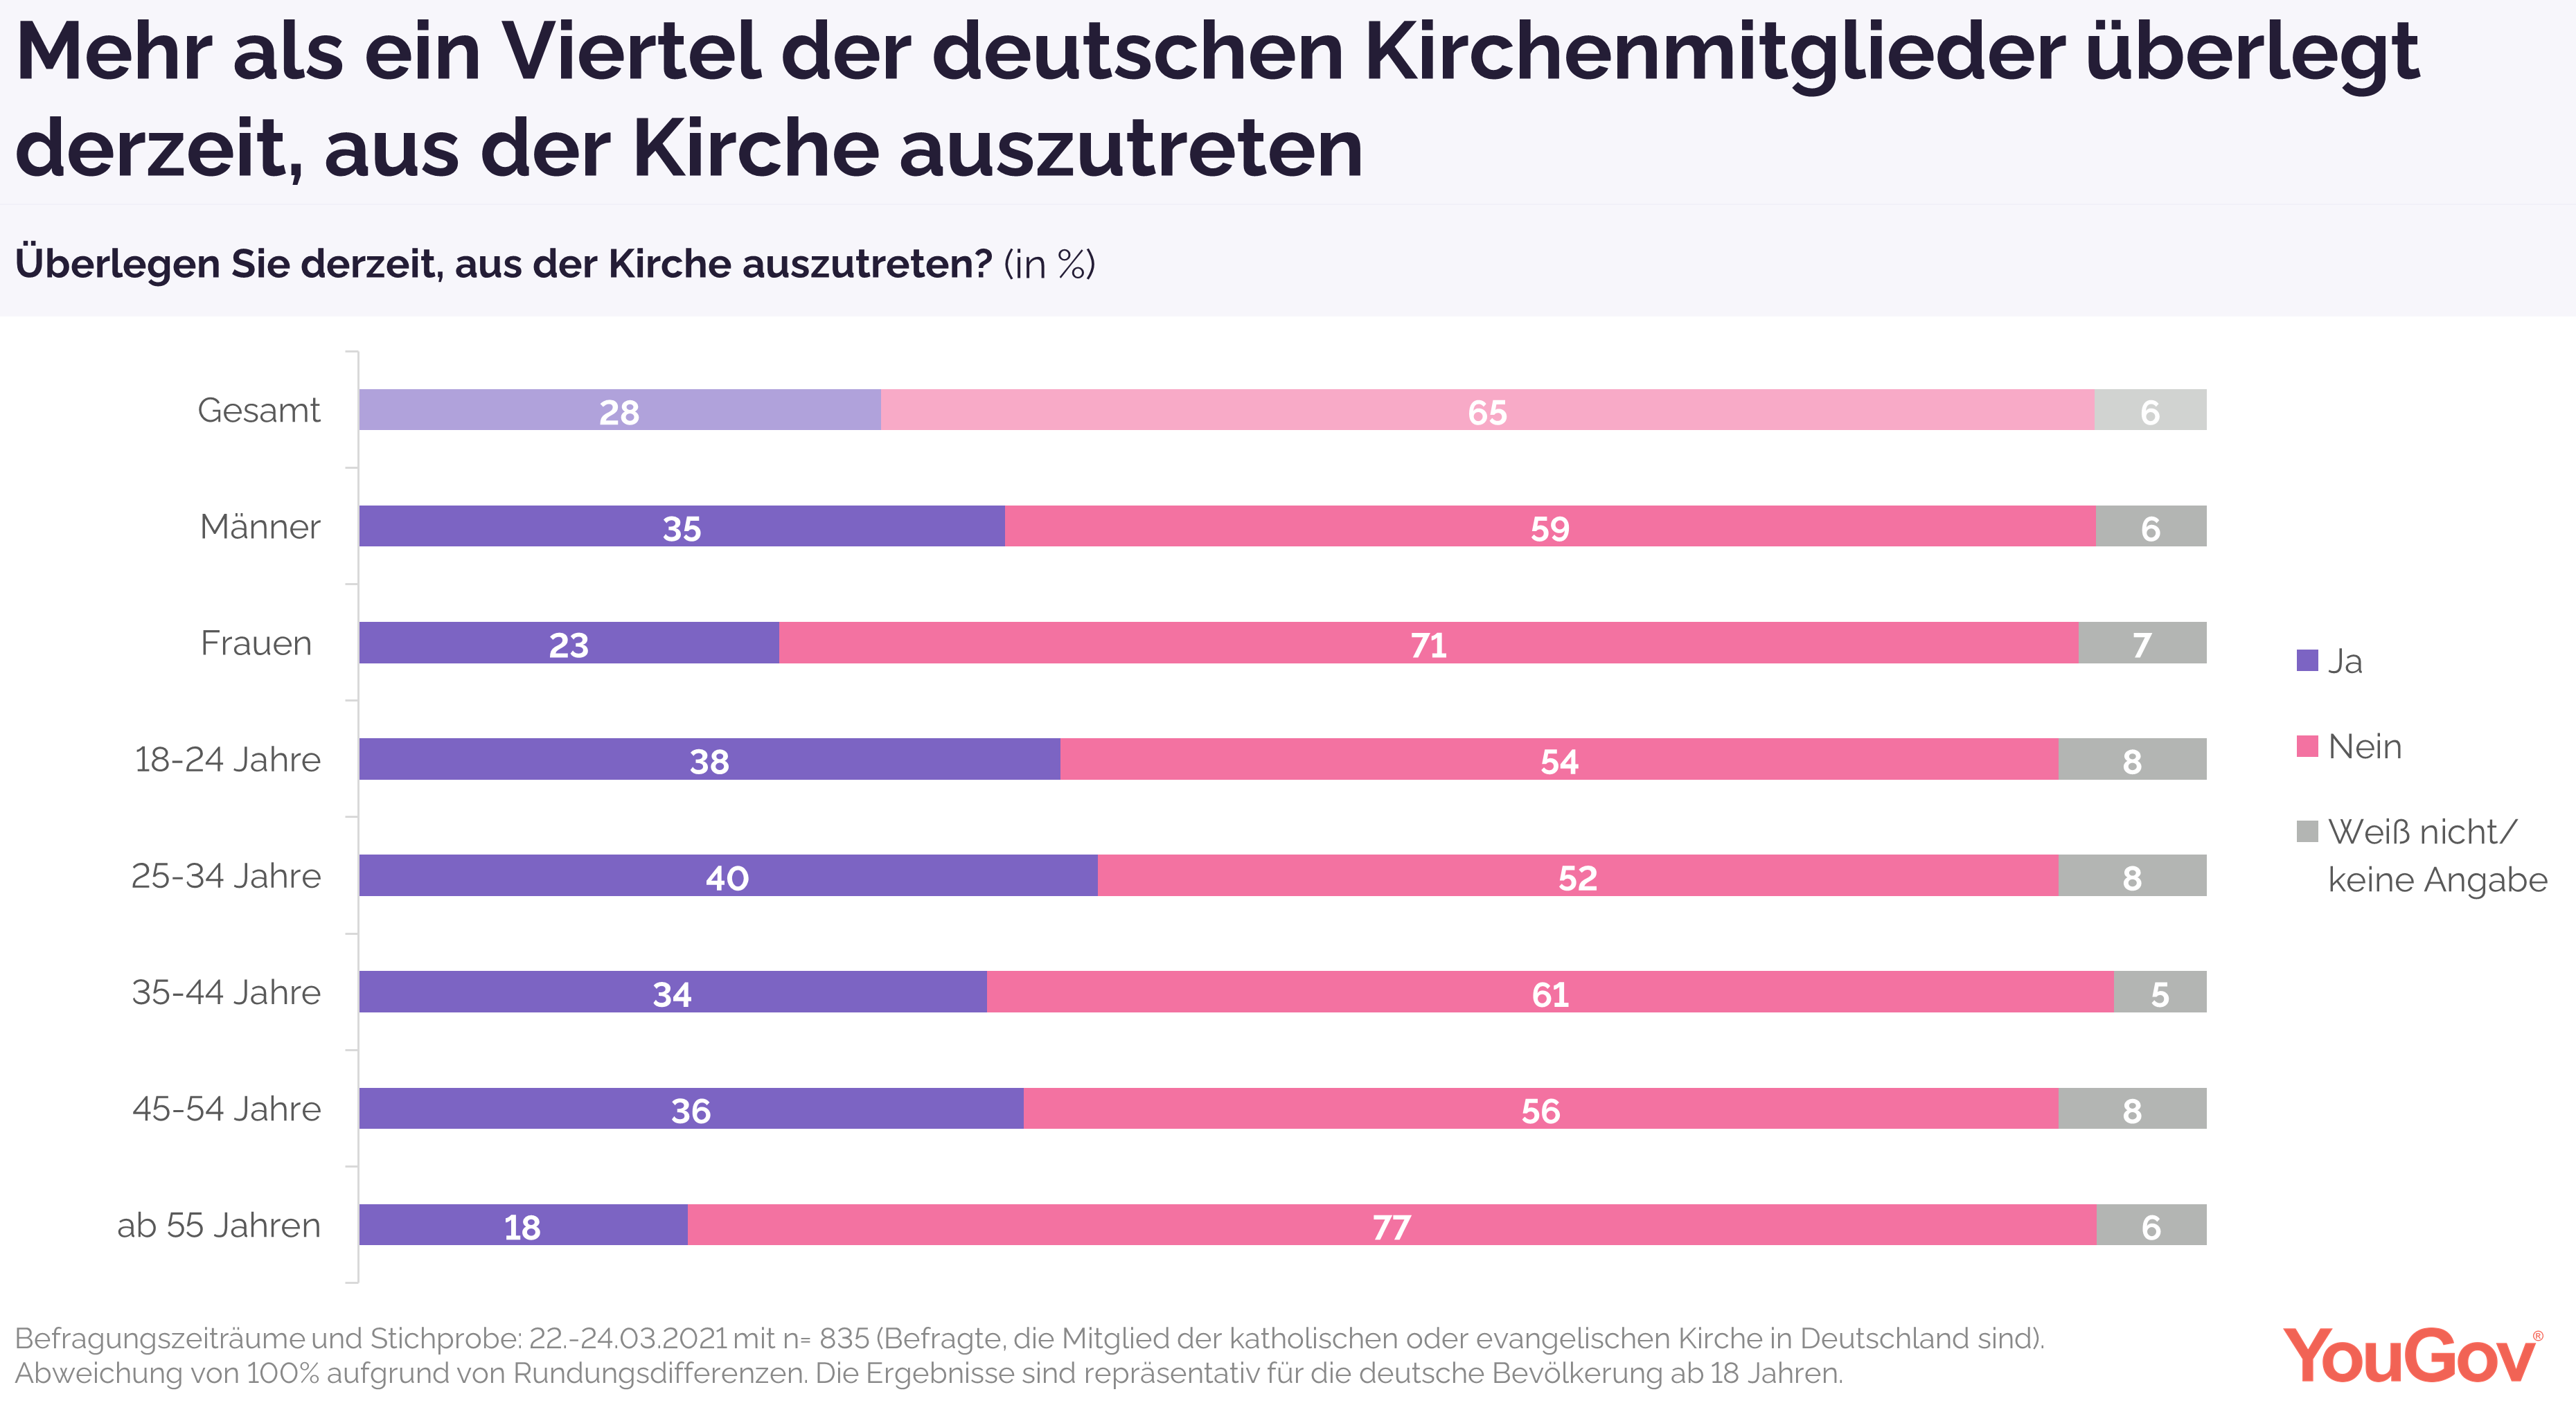
Church In Germany Has Lost Credibility 28 percent of those Germans who are members
of the Catholic or Protestant Church in Germany currently state that they are
considering leaving the church. Men make this statement noticeably more
often than women (35 percent vs. 23 percent of women). 82 percent of Germans
are of the opinion that the Catholic Church in Germany has lost credibility
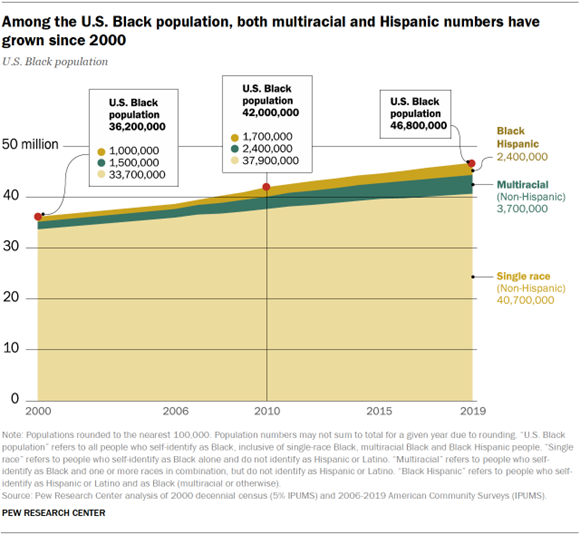
within the last few months. (YouGov Germany) March 26, 2021 NORTH AMERICA (USA) The Growing Diversity Of Black America; 46.8 Million People
In U.S. Identify As Black The U.S. Black population is also growing.
In 2019, 46.8 million people in the U.S. identified their race as Black,
either alone or as part of a multiracial or ethnic background. That is up
from 36.2 million in 2000.1 The Black share of the U.S.
population is higher today than in 2000 as well. About 14% of the national
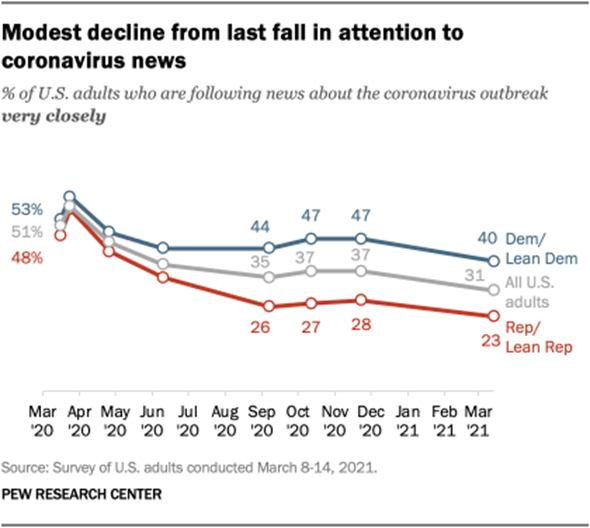
population said they were Black in 2019, up from 13% who did so in 2000. (PEW) MARCH 25, 2021 40% Of Democrats Are Paying Attention To News Of The
Outbreak, Compared With 23% Of Republicans Overall, 31% of adults say they are
following news about the pandemic very closely, according to the survey of
12,045 U.S. adults conducted March 8-14, 2021, on the Center’s American
Trends Panel, the first time this question was asked during Joe Biden’s
presidency. That is down from 37% in a survey
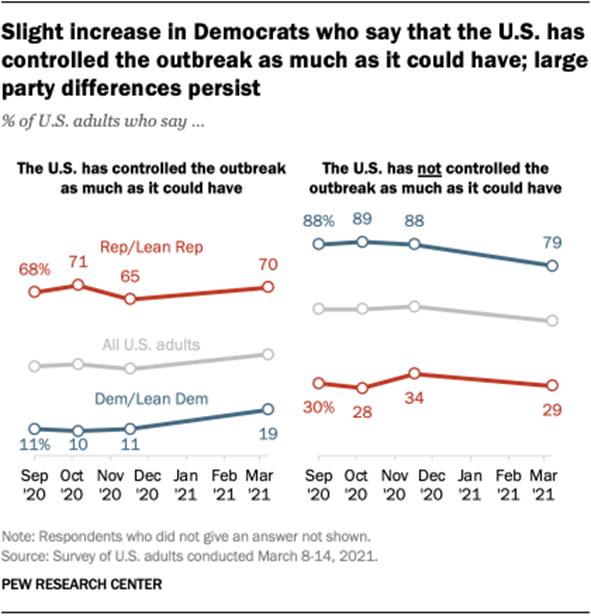
conducted in late November. At the same time,
there has been about a 10 percentage point drop in the portion of Democrats
(79%) who now say the nation did not do as much as it could to control the
outbreak. (PEW) MARCH 26, 2021 Nearly Half (47%) Of U.S. Elementary
Schools Were Open For Full-Time Classroom Learning As Of Last Month Among schools that enroll fourth graders,
47% offered full-time classroom learning in February, while for schools that
teach eighth-graders, the figure was 46%. The results suggested, however,
that at least some students weren’t opting in. In total, about 76% of
elementary and middle schools were open for in-person or hybrid learning,
while 24% offered remote learning only, according to the survey. (AP News) March 25, 2021 About Three-In-Ten 31% U.S. Adults Say They Are ‘Almost
Constantly’ Online Overall, 85% of Americans say they go
online on a daily basis. That figure includes the 31% who report going online
almost constantly, as well as 48% who say they go online several times a day
and 6% who go online about once a day. Some 8% go online several times a week
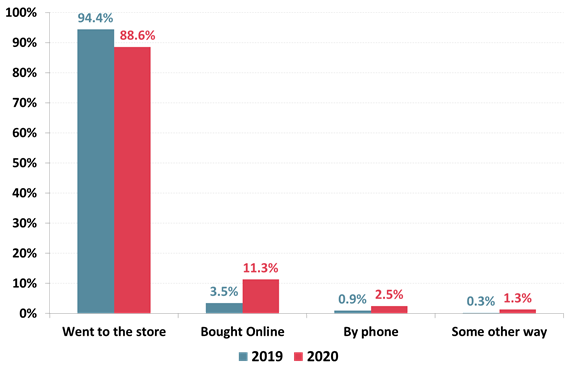
or less often, while 7% of adults say they do not use the internet at all. (PEW) MARCH 26, 2021 AUSTRALIA In 2020 Nearly 6 Million Australians Bought Packaged
Alcohol In An Average Seven Days Whether In Stores Or Online Over one-in-ten of these Australian
packaged alcohol buyers (11.3%) bought alcohol online, more than tripling the
figure of 3.5% for 2019 – an increase of almost 8% points. This represented a
huge increase in the online alcohol market but despite a nation-wide
lockdown, and a four month long second lockdown in Victoria, a vast majority
of 88.6% of Australian packaged alcohol buyers bought alcohol at a store,
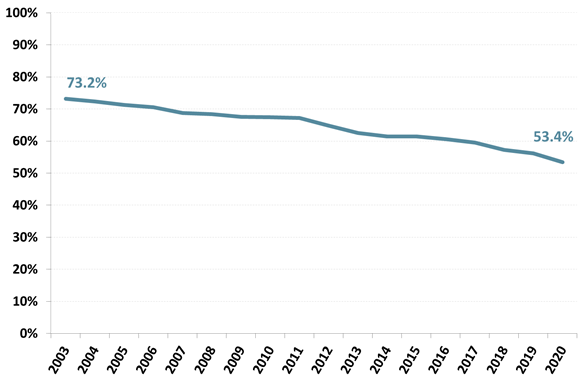
down nearly 6% points from 2019. (Roy Morgan) March 23 2021 (73.2%) Nominated A Religion To Which They Belonged
In 2003 And In 2020, It Had Fallen To Just Over Half (53.4%) Roy Morgan’s Single Source is the nation’s
largest and longest-running survey of Australians, covering values, beliefs,
behaviours, concerns, aspirations and almost every other facet of life. For
close to two decades, this extensive survey has included questions about
religion and in 2003, almost three-quarters of the population (73.2%)
nominated a religion to which they belonged. By the end of 2020, that figure
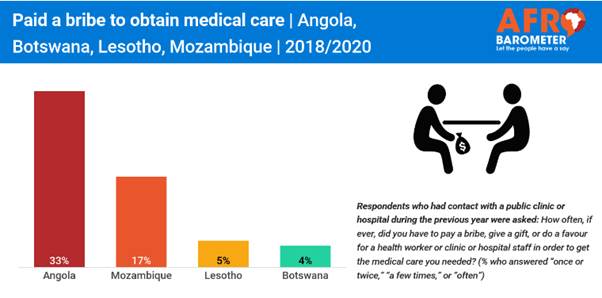
had fallen to just over half (53.4%). (Roy Morgan) March 23 2021 MULTICOUNTRY STUDIES As Covid-19 Vaccines Arrive In Southern African Countries,
Public Health Facilities Confront Challenges Of Mass Campaigns Large majorities of citizens in Angola,
Botswana, Lesotho, and Mozambique rely on public health-care facilities,
according to Afrobarometer data collected between 2018 and 2020, and are
likely to rely on these facilities for access to COVID-19 vaccinations. Among
those who visited public health facilities during the previous year, more
than half of Angolans said they had difficulty obtaining medical care, and
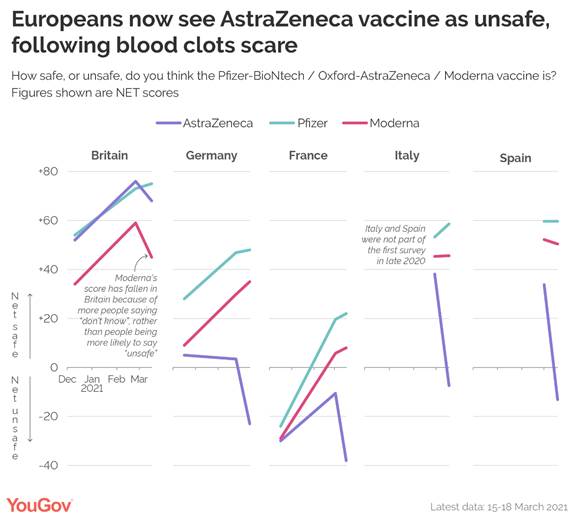
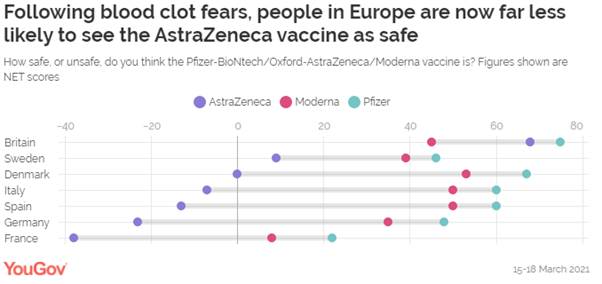
one-third reported having to pay bribes. (Afrobarometer) 22 Mar 2021 Europeans Now See Astrazeneca Vaccine As
Unsafe, Following Blood Clots Scare In our previous survey in Germany, 43% said
they believed the vaccine to be safe, compared to 40% who considered it
unsafe. As of now, a majority of Germans think the vaccine is unsafe
(55%) and just a third think it safe (32%). In France, where people had
already considered the vaccine unsafe (43%) than safe (33%), those figures
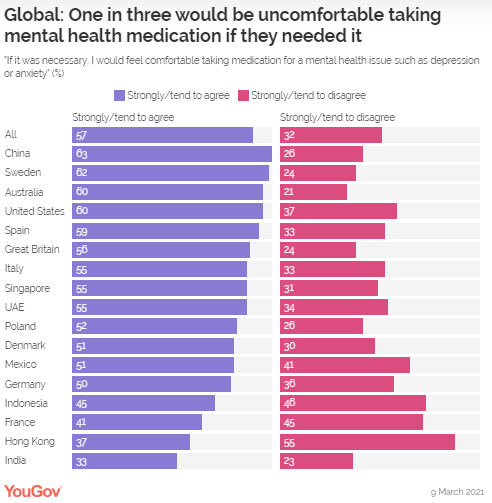
have now worsened to 61% unsafe and 23% safe. (YouGov Denmark) Global: One In Three Would Be
Uncomfortable Taking Mental Health Medication In Sweden (62%) and Spain (59%), for
example, three in five say they’d feel comfortable taking medication for
a mental health issue – with a quarter of Swedes (24%) and a third of
Spaniards (33%) saying the reverse. In Britain, 56% are fine with this kind
of treatment compared to 24% who are not. Mexican people have
higher levels of aversion to mental health medication than the
average (51% comfortable vs. 41% uncomfortable) – and in
the US, 37% are uncomfortable compared to three in five (60%) who are
comfortable. (YouGov UK) March 25, 2021 57% Of Brazilians Believe They Will Take
More Care Of Health And Well-Being When The Pandemic Is Over The figures show that 57% of Brazilians
consider taking actions to improve health and well-being. Despite being
nine percentage points above the global average, which is 48%, Brazil lags
behind Peru (73%), Mexico (69%), South Africa (68%), Malaysia (62%) and India
( 60%). For 19% of Brazilians interviewed, nothing should change in this
regard after the end of the pandemic and 12% think it is unlikely to make any
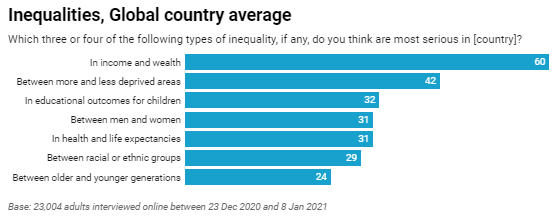
changes that improve health and well-being. March 25, 2021 Income And Wealth Disparities Perceived As
The Most Serious Form Of Inequality Inequality between younger and older
generations is seen as a relatively less serious form of inequality across
the 28 countries polled, with just 24% saying it was one of the most serious
inequalities in their country. There are differences by gender, with 36% of
women across the 28 countries polled believing that gender inequality was one
of the three or four most serious types of inequality in their country,
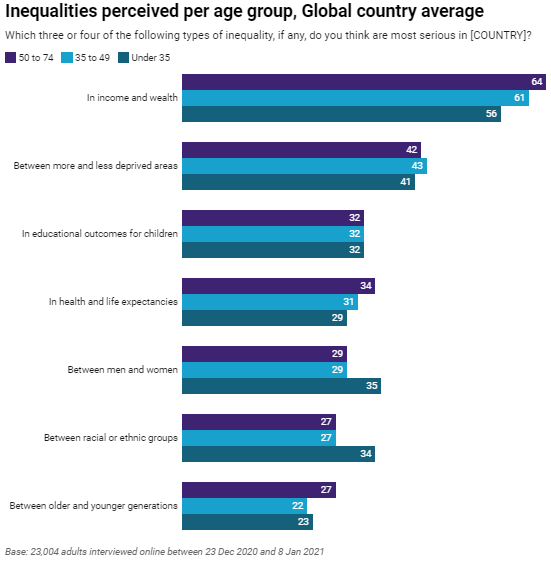
compared to just 26% of men. (Ipsos Egypt) 26 March 2021 Geography And Gender: Britons Stand Out For
Views On Two Types Of Inequality, While Age Divide Splits Opinions On Race The major exception is gender inequality,
which is viewed as a top concern by 33% of Europeans, compared with 23% of
Britons. Britain ranks among the lowest internationally for concern about
gender inequality, alongside countries such as China (24%), Hungary (22%) and
Saudi Arabia (19%), where relatively few people say disparities between men
and women are one of the most serious forms of inequality. Globally, 36% of
women say such inequalities are among the most concerning, compared with 26%
of men. (Ipsos MORI) 26 March 2021 ASIA
683-43-01/Poll Not A Single
Prefecture Backs Reuse Of Radioactive Soil
A central government plan to reuse mountains
of contaminated soil generated from land cleanup operations after the 3/11
Fukushima nuclear disaster got a muted response from other prefectures,
an Asahi Shimbun survey shows. The survey of the nation's prefectural
governors, with the exception of Fukushima Prefecture, found zero support for
the reuse of contaminated dirt for farmland development or road construction
projects. Five governors, those in Yamagata,
Yamanashi, Nagasaki, Kagoshima and Okinawa, flatly expressed opposition to
any reuse, regardless of projects the government has in mind. The governor of Shizuoka opposed the reuse
of radioactive dirt for farmland development while the governor of Shiga
refused to contemplate its use for road construction. All the other governors stood on the
sidelines, citing doubts about the safety of the soil or their
preference not to answer, the survey showed. The topsoil was removed during cleanup
operations in municipalities affected by the triple meltdown at the Fukushima
No. 1 nuclear power plant following the Great East Japan Earthquake and
tsunami in March 2011. The government is required by law to
dispose of the polluted dirt by 2045 once it is removed from Fukushima
Prefecture. Okuma and Futaba, the towns that co-host
the stricken Fukushima No. 1 nuclear power plant, are home to an interim
storage facility for the radioactive soil. Only soil measuring up to 8,000 becquerels
per kilogram will be reused to ensure that annual radiation doses from
exposure are too low to affect human health. The volume of polluted soil to be
gathered at the facility is expected to reach 14 million cubic meters, the
equivalent of 11 Tokyo Dome baseball stadiums, by spring 2022. The central government plans to use 80
percent of the overall soil stored there after concluding it was unrealistic
to expect to dispose of all the dirt. It is promoting the reuse of relatively
low-level radioactive dirt for farmland development or road construction with
the proviso it is covered by regular soil. The central government envisages issuing
guidance by fiscal 2024 on where such soil can be used and how to manage it. But it has made no mention of the process
of selecting candidate sites for final disposal, saying it remains unclear
how much soil will be left for final disposal. When asked in the survey if their
prefecture may become the final disposal site, eight governors rejected the
idea outright. The remaining governors said either they
cannot answer or refused to take a stand, referring to the central
government’s failure to explain the selection process to the public. The survey was conducted between January
and February and involved sending questionnaires to the governors. (Asahi Shimbun) March 28, 2021 Source: http://www.asahi.com/ajw/articles/14311546 683-43-02/Poll A Vast
Majority Of Pakistanis (93%) Claim That Prices Of Daily Essentials Have
Increased In Comparison To The Last 6 Months
A vast majority of Pakistanis (93%) claim
that prices of daily essentials have increased in comparison to the last 6
months: Dun&Bradstreet and Gallup Pakistan Consumer Confidence Index According to a Dun&Bradsheet and Gallup
Pakistan Consumer Confidence Index survey, 93% Pakistanis claim that prices
of daily essentials have increased compared to the last 6 months. This Press
Release is composed of a question that was covered as part of Gallup Pakistan
& D&B Consumer Confidence Index for Q—2020-21. A nationally representative sample of adult
men and women from across the four provinces was asked the following
question, “In your opinion, in comparison
to last six months, prices of daily essentials are…?” In
response to this question, 1% said ‘Much cheaper’, 2% said ‘Cheaper, 2% said
‘Has not changed’, 25% said ‘Expensive’ and 68% said ‘Very expensive.’ 2% did
not know/did not respond. Question:
“In your opinion, in comparison to last six months, prices of daily
essentials are…?” (Gallup Pakistan) March 24, 2021 Source: https://gallup.com.pk/post/31610 MENA
683-43-03/Poll Nearly Half
(47%) UAE Residents Feel Safe Against Contracting The Virus
As the UAE expands its vaccination drive to
bring the virus under control, YouGov’s latest survey reveals among those who
are vaccinated, nearly half (47%) feel safe against contracting the virus and
are not worried about the long-term effects of the vaccination. Slightly
lesser (39%) feel safe right now but are worried about the repercussions in
the long run.
Very few (14%) feel unsure about
contracting the virus and are concerned about the future. Women are much more
likely to be unsure as well as worried about the long term effects as
compared to men (24% vs 10%). Across the UAE, importance of providing the
Covid 19 jab to different groups of people is universal. However, a whopping
majority (90%) believes that getting the shot is the most important for those
who work in the service industry followed by the household staffs, senior
citizens and immediate family (87% each). In comparison to this, personal
vaccination is considered less important (85%). When it comes to information about the
Coronavirus vaccines, seven in ten residents (71%) agree with the statement-
“I am well informed about the various
COVID19 vaccines and their efficiency”. Asian expats were most
likely to agree with the statement- at 80%. When asked about their source of
information, a vast majority of UAE residents (73%) said they turn to
government health sites and reports released by MOHAP to get the most
accurate and reliable data about covid-19 vaccines. One-third (33%) rely on
information shared by individuals who have already taken the vaccine and
almost as many (29%) depend on the news media. A fourth (26%) turn to their
immediate family members or friends for information and very few (14%) trust
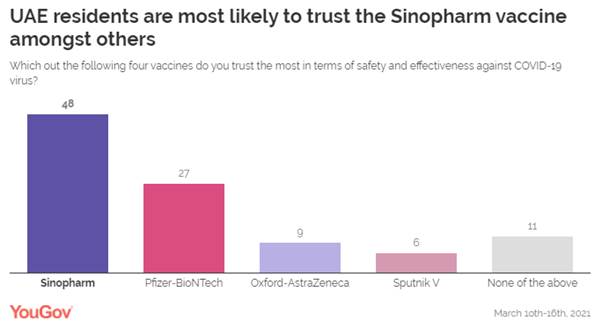
the material circulated on social media. At present, the UAE is offering a choice of
four vaccines for eligible individuals against the COVID-19 infection. When
questioned about the vaccine people trust the most, half of the residents
claimed they trust the Chinese vaccine- Sinopharm. Roughly half of this (27%)
have faith in the Pfizer-BioNTech vaccine.
One in ten residents (11%) are sceptical
and do not trust any vaccine. Comparatively, very few trust
Oxford-AstraZeneca (9%) while Sputnik V (6%) seem to be the least popular
among UAE residents. It is interesting to note that trust among
the youngest adults (18-24 years) for Sputnik is higher than the other age
groups, and for these residents, AZ vaccine ranks lowest on the trust
barometer- at 7%. Similar trends have been noted in European
countries where people have shown a low level of trust in the safety of the
AstraZeneca vaccine. Data from YouGov’s latest international study reveals
that in Germany, the proportion of people who think the AstraZenca vaccine is
unsafe has risen from 30% in December, 2020 to 40% by March, 2021. Similarly,
in France, people are more likely to believe the AstraZeneca vaccine to be
unsafe than safe. Because of such concerns, Europeans are substantially more
likely to refuse taking the AstraZeneca vaccine than the other vaccines. However, in the UK, the AstraZeneca vaccine
is seen as safe, with 81% of Britons saying it is safe, up from 63% from the
previous time we asked the question in December. (YouGov MENA) March 24, 2021 Source: https://mena.yougov.com/en/news/2021/03/24/uae-residents-feel-safe-after-taking-vaccine-some-/ 683-43-04/Poll Palestinian
Anxieties Over First Elections In Fifteen Years
With rising confidence that parliamentary
elections will indeed take place soon, and given clear anxieties about the
possibility that the siege and blockade over the Gaza Strip could then be
tightened, the split consolidated, and that economic conditions could worsen,
and given concerns about the potential reaction from the international
community and Israel, public attitudes seem to shift a little in favor of
Fatah and away from Hamas. These are the results of the latest poll
conducted by the Palestinian Center for Policy and Survey Research (PSR) in
the West Bank and the Gaza Strip between 14-19 March 2021. The period before
the poll was carried out witnessed several developments including the
announcement of a presidential decree to hold parliamentary elections on 22
May and presidential elections on 31 July 2021. It also witnessed a
significant rise in number of coronavirus deaths and infections. The
coronavirus vaccine was not made available in large numbers by the PA
government during the period before the conduct of the poll. A limited
vaccination process did however start using a small quantity that was made
available to the PA. The process however was marred by accusations of
favoritism and lack of transparency. The ICC issued a statement affirming
jurisdiction over the occupied Palestinian territories. Joe Biden assumed his
position as the new US president during this period. Israel announced the
holding of new parliamentary elections to take place on 23 March. This press
release addresses these issues and covers other matters such as the general
conditions in the Palestinian territories, the peace process and the future
possible directions for Palestinians in the absence of a viable peace
process. Total size of the sample is 1200 adults interviewed face to face in
120 randomly selected locations. Margin of error is +/-3%. (Arabbarometer) March 24, 2021 Source: https://www.arabbarometer.org/2021/03/palestinian-anxieties-over-first-elections-in-fifteen-years/ 683-43-05/Poll 71 Percent Of
The Tunisian Respondents Between 18-36 Are Dissatisfied By The Education
System
Since its independence in 1956, Tunisia has
placed a special emphasis on the development of the education sector. Shortly
after independence in 1959, the government implemented an education plan, in
which education was approached as a national investment and key determinant
of the nation’s economic growth. After extensive evaluation of the strengths
and weaknesses of the sector over several years, a National Education Commission
(NEC) was set up in 1967 to provide guidance and recommendations. These
recommendations were approved by the government and incorporated into the
formulation of national development plans. Achieving the different objectives entailed
a well-balanced and integrated development at all levels of education: an
increase in primary and secondary education, and an increased emphasis on
teaching science and mathematics. The Commission was also aware that it was
essential to have qualified teaching staff to pursue these objectives, to be
provided by the university. Thus, post-independence reforms in higher
education concentrated on producing a labor force for the new Tunisian
administration, one that would be able to build a modern economy – consistent
with independence leader Habib Bourguiba’s vision. As a result, public
spending on education expanded to a degree that made Tunisia one of the
biggest education spenders in the Middle East and North Africa (MENA).
Tunisia currently spends more than one-fifth of the state budget, which
corresponds in 2015 to 6.6 percent of its Gross Domestic Product (GDP) on
education. The expansion of education has had
undeniable and enduring positive effects on the economy, on health, on
females’ socioeconomic status and recently on politics, in the peaceful
transition to democracy after the revolution. Activist educated women have
played a vital role in countering religious extremism. Additionally, the
education system has created an educated Tunisian elite that is widely sought-after
in Europe, Canada and Gulf States Today, however, Tunisia is facing a severe
learning crisis among the majority of its students. The rise in the quantity
of graduates was not accompanied by a commensurate improvement in quality.
Given the vast amounts invested, the return on investment (in terms of
student outcomes) has been unsatisfactory, and the standard of education has
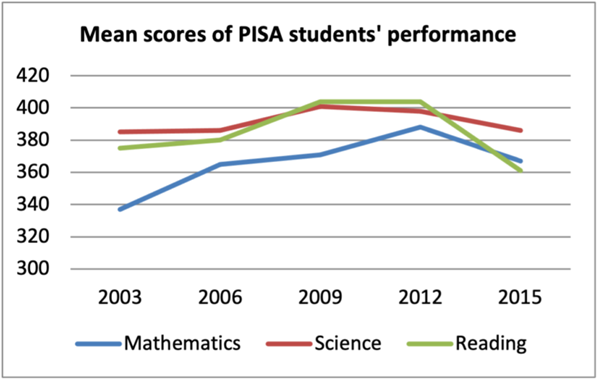
declined drastically according to international metrics such as the Program
for International Student Assessment (PISA) and the Trends in International
Mathematics and Science Study (TIMSS). In the 2015 PISA evaluation, Tunisia
ranked 66th out of 70 participating countries and the
majority of the participating students scored below the proficiency level 1.
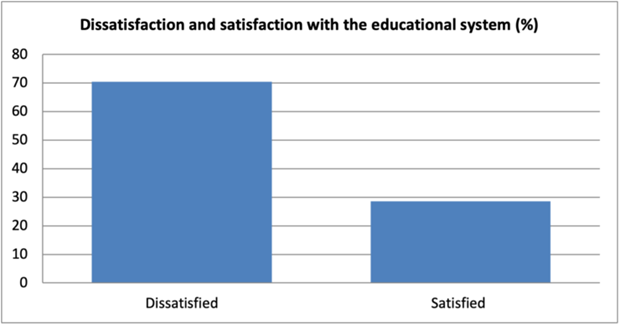
Tunisians have certainly felt the
difficulties in implementing effective education policies and programs, and
have expressed their frustration with the education system. Arab Barometer
Wave 6 data shows Tunisian satisfaction with the education system as follows:
70 percent of Tunisian respondents are dissatisfied whereas only 29 percent
are satisfied.
Historically, the education sector in
Tunisia has witnessed several major reforms. In
1958 the Tunisian Government sought to unify and nationalize the education
system, divided the system into three cycles (primary, secondary and a higher
education), and made education compulsory and free for all children. The
late 1960s witnessed the Arabization of
the primary education curriculum, granting primacy to the Arabic language and
making it the language of all disciplines. French became a second language, a
language of information and communication that gives access to a scientific
and technical culture. Around the same time, the Arabization of technical and
scientific education began and has constituted an important feature of
education policy. Since 1989, further legislative reform of the
education sector was introduced, aiming to enhance the standard of education
and to create the best possible balance between training and employment. The
reform was formalized by Law No 91-65, the purpose of which was to reinforce
the principle of free education at all levels of education and the
implementation of basic education. The latter was divided into two cycles:
the first lasting six years and the second lasting three years. All subjects
related to arts, sciences and technical education were to be taught in Arabic
at all grades of basic education. As for higher education, the LMD
(Licence-Master-Doctorat corresponding to Bachelor-Master-PhD) reform was
introduced in response to the development of the European Higher Education
Area in 1999 under the Bologna Declaration adopted by twenty-nine European
countries. The aim of the reform was to ensure the quality of higher
education, to encourage student and teacher mobility, to facilitate both the
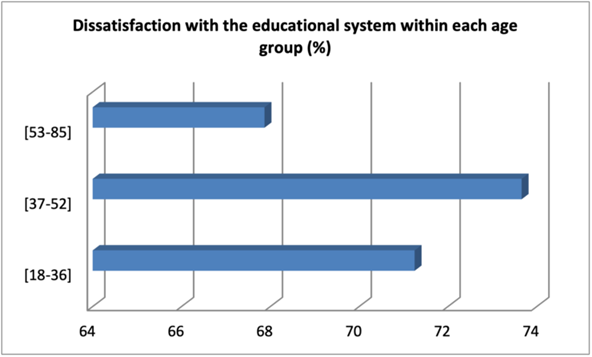
equivalence of diplomas and youth integration into the labor market. With this as a backdrop, segmenting the
dissatisfaction data along different age groups yields the following results:
More than 71 percent of the respondents between 18-36 are dissatisfied by the
education system. These respondents have been the primary targets of two of
the above reforms (basic education and LMD reforms). Additionally, 73 percent
of those aged between 37 and 52 who have been the primary target of
Arabization are dissatisfied with the education system. Their dissatisfaction
reveals that the successive reforms passed in recent years have not had the
desired impact.
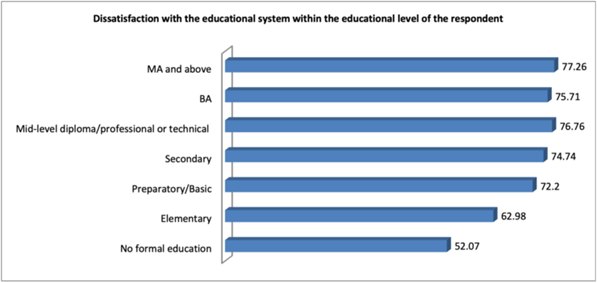
In addition, the data reveal that dissatisfaction
with the educational system within each educational level exceeds the 70
percent for those having basic education and above. Respondents with MA
degrees and above are the most disappointed.
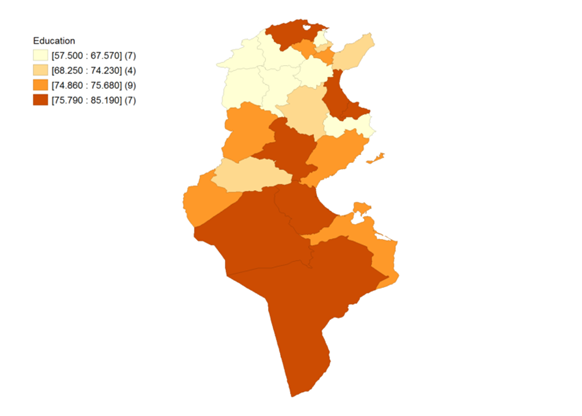
It is not surprising that the highest rates
of discontent are found in the governorates of Gabes, Kebili, Sidi Bouzid and
Tataouine, with more than 80 percent of the respondents dissatisfied with the
education system. This regional frustration can be explained by a variety of
reasons: high school drop-out rates, fewer qualified primary, pre-secondary
and secondary school teachers, low rates of admission to “prestigious“ Tunisian universities
and high unemployment rates.[13]
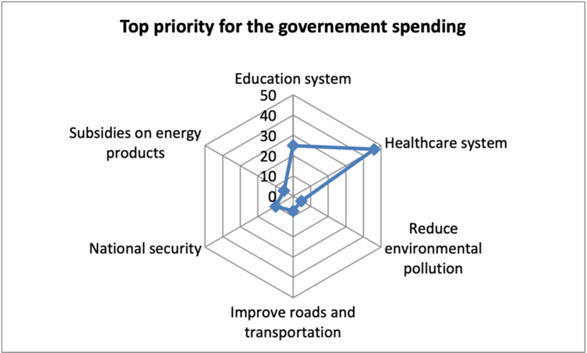
Despite their dissatisfaction with the
education system, Tunisians report that education must remain a top priority
(after health) for government spending.
The COVID-19 pandemic has exacerbated the
crisis in education. In an attempt to curb the spread of the pandemic,
schools were closed for six months (from 12 March to 15 September 2020) with
very limited online instruction and the cancelation of third-term internal
evaluations. Back to school this academic year (2020-2021), primary,
pre-secondary and secondary school pupils attended school on alternate days
to avoid crowded classes. As a result, the curriculum has been lightened, but
without giving up the fundamentals. The severe disruption is felt by many
families, as 47 percent of respondents say that the impact of the COVID-19
pandemic on children’s education is extremely negative, while 27 percent
believe it is moderately negative.
To a large extent, the current
disappointment with the education system is a function of the economy as a
whole, since Tunisia has failed to make tangible economic progress in nearly
a decade. Thus, the education crisis cannot be solely addressed through
reforming the education system. Nevertheless, the education sector faces many
different challenges today. Primary among those is the inability of the
Ministry of Education fulfill the sector’s development needs due to a huge
shortage in capital investment. Moreover, the interruptions attributable to
COVID-19 may not just be a short-term problem but will also have long-term
implications for the affected cohorts and are likely to exacerbate existing
inequalities. Tunisian decision makers should develop a strategy
to address this learning deficit. (Arabbarometer) March 25, 2021 AFRICA
683-43-06/Poll Only 18% Of
Ugandans Think They Can Report Corruption Without Any Fear
A majority of Ugandans think that
corruption is getting worse in their country and that their government is
doing a bad job of fighting it. Most say ordinary people risk retaliation if
they report corruption to the authorities, findings from a recent Afrobarometer
survey show. Among key public institutions, the Uganda
police are most widely seen as corrupt, followed by civil servants and tax
officials. Paying bribes is a common part of daily life in Uganda: More than
half of respondents who accessed police services during the previous year say
they had to pay a bribe. Uganda ranks in the worst-performing
quarter (142th out of 180 countries) on Transparency International’s 2020
Corruption Perceptions Index. (Afrobarometer) 29 Mar 2021 WEST
EUROPE
683-43-07/Poll Two-Thirds Brits Agree That They Like To Look For Profitable Ways To
Invest Money (66%)
The conversation around Bitcoin often revolves around its
valuation – not surprisingly, given that in 2021 it has
already smashed through the $40,000, $50,000, and $60,000 barriers.
But among all the news items about people who’ve forgotten the passwords
to $240m hard
drives, it’s easy to forget that cryptocurrencies are
supposed to be, well, currencies: mediums of exchange, as much as assets
to be speculated on. So how many Brits are willing to use them
accordingly? According to data from YouGov Profiles, just 5% say they’d be
prepared to give up their bank accounts and rely entirely on cryptocurrency.
Demographically speaking, this group is overwhelmingly male: two-thirds are
men (66%). They also skew significantly younger than the general
population: more than half are aged 18-34 (52% vs. 28% of the public), with
two in five aged 35-54 (40% vs. 34% nat rep) and just 8% aged over
55 (vs. 38% of the public). This group are also significantly less likely to
belong to higher income brackets: two in five earn less than 75% of the
national median wage compared to three in ten members of the public (39% vs.
29% of the public). On one hand, this may be encouraging for people who sincerely believe
in the potential of Bitcoin, Ethereum and their counterparts as actual currencies:
certainly, those who are most willing to ditch their retail banks and go
all-in on cryptocurrency are not a moneyed elite. On the other hand, the
attitudes of the 5% may reveal that they too see it as less a form of
exchange than a conventional investment.
Nearly three in five, for example, say they like to take risks on the
stock market (58%) compared to just 12% of the general public.
Two-thirds also agree that they like to look for profitable ways to
invest money (66%) next to just two in five (40%) of Britons overall –
which could indicate that they are less interested in its
applications as a currency than they are in its potential to break through
further valuation barriers. There’s also some evidence to suggest that the 5% who say that
they’re willing to ditch banks and embrace cryptocurrency are motivated more
by discontent towards banks than enthusiasm for blockchain technology.
Two-thirds say banks try to trick people out of money (64%) next to a third
of the public (36%), and just three in ten of this group say they’re either
likely or very likely to buy cryptocurrency in the next 12 months
(30%). So while they may be prepared to swap their bank
accounts for crypto, most don’t plan to any time soon. Elon Musk recently announced that it would be possible to buy Tesla
vehicles with Bitcoin. But all in all, it appears that, right now, even the
Brits who are most enthusiastic about cryptocurrency are not fully banking on
it as a means of exchange just yet. The retail cryptocurrency revolution
may be a way off yet. (YouGov UK) March 25, 2021 683-43-08/Poll 6 In 10 Say Brexit Has Made No Difference To Their Daily Life
A new online survey by Ipsos MORI in partnership with EU|UK Forum shows 6 in 10
(58%) of Britons have seen no difference to their everyday life as a result
of Britain’s exit from the European Union. However, more have seen a negative
impact than a positive one; 28% say Brexit has made their daily life worse while
only 1 in 10 (11%) say there has been a positive change.
Six in ten (59%) say they personally know no one who has been
affected by Brexit. Only 9% say they know someone who has been positively
impacted by Britain’s exit from the EU, 24% know someone who has been
negatively affected. Britons are most likely to believe Britain’s exit from the EU is
working just as expected; 46% say the current situation meets their
expectations. Just over a quarter (27%) say that Brexit is working out worse
than they had expected, increasing to 45% among those who voted to remain in
2016. Sixteen per cent say it is better than they had predicted. Positive outcomes of Brexit Regardless of their vote in the 2016 EU Referendum, 24% believe that
Britain’s gaining of control over its laws and regulations is one of the most
positive outcomes of Brexit. Similarly, 22% believe its ability to respond to
the Covid-19 pandemic better is an upside.
However, 1 in 5 (19%) say that there are no positive outcomes to
Brexit, increasing to 37% of remain voters. Among those who voted to leave in 2016, 39% say that gaining control
of their own laws and regulations was a key positive for Britain. Three in
ten (31%) also say greater control over immigration and borders, the ability
to make independent international trade agreements and make their own
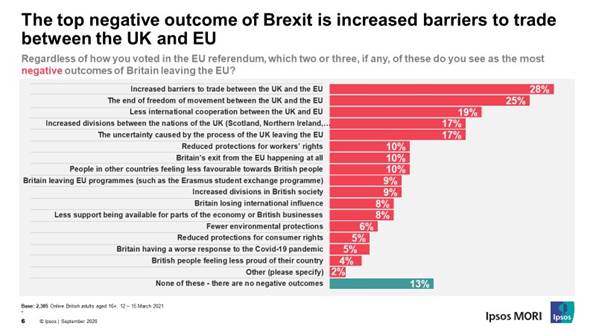
decisions generally are all positive outcomes for the country. Negative outcomes of Brexit Britons are most likely to choose the increased barrier to trade
between the UK and EU as one of the most negative outcomes of Brexit (28%),
similarly, a quarter (25%) say the end of freedom of movement between the UK
and EU is a significant downside. One in five (19%) view the decrease in international cooperation
between the UK and EU as one of the most negative outcomes while 17% say the
same for the increased divisions between the nations of the UK and the
uncertainty caused. Around 1 in 10 (13%) believe there are no negative outcomes to
Brexit, increasing to 28% of those who voted to leave in the 2016
referendum. Among remain voters, the end of freedom of movement between the UK
and EU is seen as the most negative outcome by 40% while 35% view the
increased trade barriers between the country and the international
organisation as a significant downside.
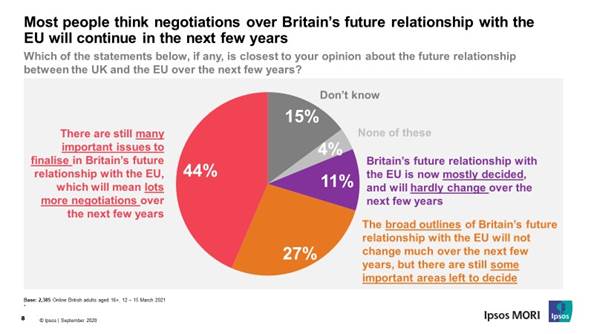
Over the next few years Looking to the near future, most Britons believe there are still many
issues to finalise in Britain’s future relationship with the EU, therefore
there will be lots more negotiations over the next four years (44%).
Only 1 in 10 (11%) say the future of Britain’s relationship with the
EU is now mostly decided and will hardly change over the next few
years. Kelly Beaver, Managing Director of Public Affairs at Ipsos MORI,
said: Brexit hasn’t gone away, and people
recognise that, but many of the personal impacts that people expected to
experience haven’t materialised (as yet). The public see the positive
outcomes from Brexit mostly linked to an increase in control – including on
laws and regulations, but also in relation to the UK’s ability to act
independently around its response to the pandemic. This of course, is traded
off against the negatives which are mostly perceived as an increase in
barriers to trade and mobility. Many of these outcomes are still to be fully
realised – both the positive and the negative – and the public recognise that
there is still a fair amount of negotiation to take place in the years to
come. Paul Adamson, Chairman of Forum Europe and the EU|UK Forum
says: A large majority of respondents - as in the
2019 and 2020 polling - indicate that it it will be important for Britain to
have a close relationship with the EU and a significant proportion recognise
that there are still many important issues to finalise in that relationship.
However, it is now viewed as automatic with respondents evenly divided as to
whether a close relationship is likely or not” (Ipsos MORI) 23 March 2021 Source: https://www.ipsos.com/ipsos-mori/en-uk/6-10-say-brexit-has-made-no-difference-their-daily-life 683-43-09/Poll 1 In 5 (19%) Believe Abolishing The Monarchy Would Be Good For The
Country’s Future
Despite the conversation had by the Duke and Duchess of Sussex with
Oprah Winfrey last week about their time as active Royal members, two surveys
by Ipsos MORI, completed before and after the interview, show it has done
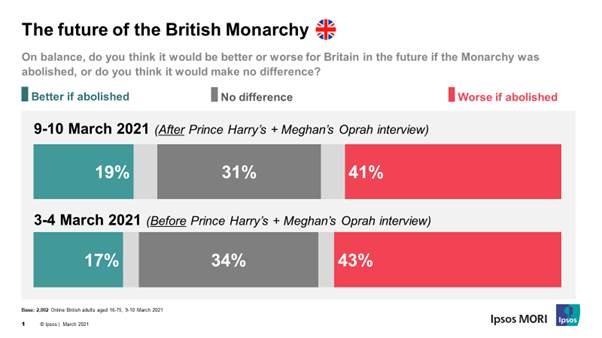
little to alter British opinions towards the monarchy. Before the interview was aired in the UK on Monday 8th March, 43%
said Britain’s future would be worse should the monarchy be abolished, and
after the interview 41% said the same. Only 1 in 5 (19%) now believe
abolishing the monarchy would be good for the country’s future, a similar
proportion to before the interview (17%).
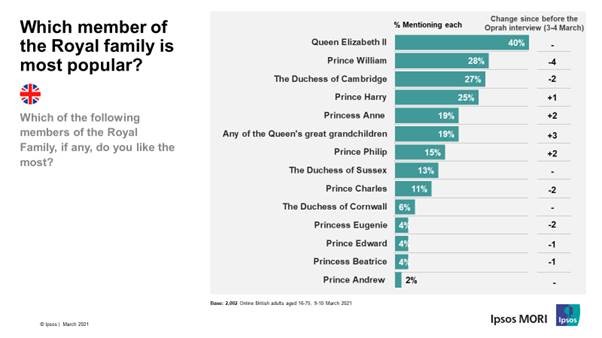
Opinions on individual members of the family also remain stable. Four
in ten (40%) chose the Queen as one of their favourite members of the Royal
Family both before and after the interview. After her, the next three are
also the same; Prince William (32% chose him as one of their favourite
royal family members before his brother’s conversation with Oprah, 28%
selected him as a favourite after), the Duchess of Cambridge (29% before, 27%
after), and Prince Harry’s popularity also remains stable, changing from 24%
to 25% this week. His wife, Meghan, also remains unchanged with 13%
choosing her as one of their favourites.
The Queen’s husband and daughter both see little change in their
popularity, Princess Anne is now a favourite among 19% of Britons, 17% chose
her before the interview, while Prince Philip is now a favourite of 15% of
Britons, 13% chose him the previous week. Prince Charles also sees little
change now a favourite among 11%, 13% had previously named him as their favourite. There is also little change in how people view the UK because of the
Royal Family. Before the interview, Britons were most likely to see the UK as
traditional (59%), now, 57% say the same. The proportion of those who see the
UK as powerful thanks to the monarchy falls by 8 percentage points to
20%.
Other associations see little change, including being an unequal
society (-1), self-confident (-3), democratic (-2) and modern (+1). Direct impact of the interview When asked directly whether the interview had made them more or less
favourable, the British media is one of those most affected. Four in
ten, 42%, said it made them less favourable towards the media while only 6%
said more, giving a net favourability of -38. Almost 4 in 10 (37%) say the
interview has made no difference on their opinion of the British media. The
British monarchy as an institution is seen less favourably as a result of the
interview by 26% of Britons, while 14% view it more positively, giving it a
net favourability rating of -12. Forty-two per cent say it had not changed
the way they view the British monarchy as an institution. When looking at individual members of the family, the Duchess of
Sussex is affected most as a result of the interview with a 41% saying they
see her less favourably while 21% see her more positively and 23% say their
opinion has not changed as a result of the interview. Similarly, for Prince Harry, a quarter (26%) say it has not changed
their opinion, 34% less favourable and 24% more favourable. Opinions in the US also see only a minority saying the interview has
changed their views, although with a different balance of opinion towards
Prince Harry and the Duchess of Sussex, with more saying it has made
them more favourable than less favourable (by 28% to 13% and 26% to 16%
respectively). A quarter of those in the US view the monarchy as an institution less
favourably (26%, 5% more favourably), while 3 in 10 (29%) have a more
negative view of the British media as a result of the interview (4% more
favourably). Again though just over a third (35%) say the interview has made
no difference to their opinion of the monarchy as an institution, 31% say the
same about the British media. Kelly Beaver, MD of Public Affairs at Ipsos
MORI, said: Despite the contents of the interview and
the resulting coverage and analysis in the media, the Duke and Duchess of
Sussex’s interview with Oprah Winfrey appears to have done little to harm
attitudes towards the monarchy here in the UK in the immediate aftermath,
with Britons just as likely to worry about the role of the British media. (Ipsos MORI) 24 March 2021 Source: https://www.ipsos.com/ipsos-mori/en-uk/poll-finds-popularity-monarchy-remains-stable-among-britons 683-43-10/Poll 30% Of French People Consume Meat At Least Once A Day
Evolution of meat consumption in France 30% of French people consume meat at least once a day, a figure that
climbs to 43% in the South West vs. 19% in the Southeast.
At the same time, 1 in 2 people say that their meat consumption has
decreased over the past 10 years (50%). Among those 55 and over, it even
reaches 58%. Could the French draw a line on the meat? In the collective imagination, meat has a primordial
role. Indeed, 1 in 2 French
people (50%) agree with the following statement: "to be
in good health, you must eat meat". There is a significant
difference between men and women with respective scores of 58% and 42%. However, nearly one in four people (23%) say they could eliminate
meat from their diet and become vegetarian. In this regard, differences
are once again observed between men (17%) and women (28%), but also between
generations. Indeed, 18-24 year olds are more likely to consider a
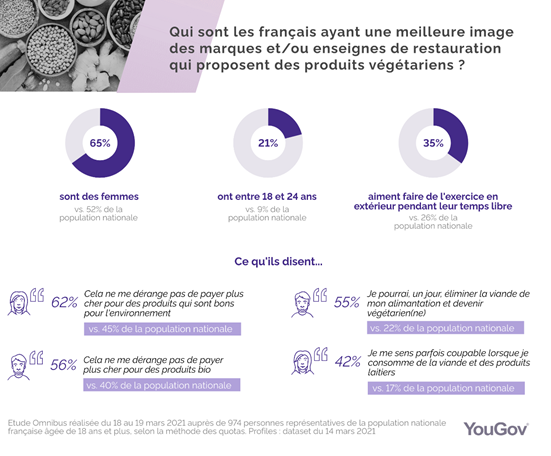
meatless diet than their elders, at 35%. The perception of “veggie” offers According to the results of our survey, 1 in 5 people (20%) have a better image of brands
and / or restaurant chains that offer vegetarian or “veggie” products. If
women are more sensitive than men to this type of offer (25% against 14%), we
nevertheless note that for the majority of French people (59%), this does not
impact the perception of the brand.
Only 1 in 3 French people have already ordered a vegetarian dish in a
restaurant (33%). However, 63% of French people think that restaurant
chains should always offer a vegetarian option (69% of women vs. 56% of men).
19% of French people perceive the “veggie” ranges as being of better
quality. However, a majority find these ranges too expensive (61%), a feeling
shared by 70% of 35-44 year olds. Should food brands offer more vegetarian
products? The French are very divided on the question: 48% answer in the
affirmative, and 40% are against it. In detail, women are mainly for the
development of the offer of vegetarian products (54%) and men are mainly
opposed to it, at 49%. At the same time, we can see the support of the younger generations,
and in particular 18-24 year olds: 67% of them think that brands should offer
more “veggie” products. Some brands selling meat and / or fish (Fleury Michon, Herta, Findus,
etc.) have developed vegetarian ranges. 48% of French people find these initiatives a good thing ,
and 11% a bad thing. It should be noted that a third of French people
(33%) do not have a clear opinion on the issue and therefore remains to be
convinced. Note: 37% of the French population find
that vegetarian alternatives are not highlighted enough on supermarket
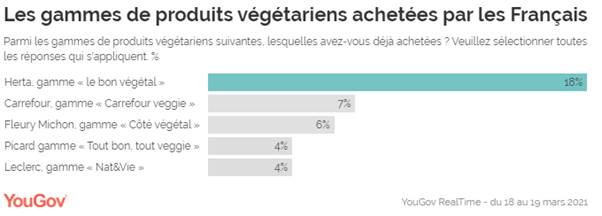
shelves. What ranges of vegetarian products have the
French already bought? At the top of the most purchased ranges, we find "the good vegetable" from Herta (18%) ,
particularly consumed by 35-44 year olds (27%). The “Carrefour veggie” ranges from Carrefour (7%) and “Vegetable
side” from Fleury Michon (6%) complete the top 3.
(YouGov France) March 24, 2021 Source: https://fr.yougov.com/news/2021/03/24/lavenir-de-la-food-est-il-veggie/ 683-43-11/Poll 82 Percent Of Germans Are Of The Opinion That The Catholic Church In
Germany Has Lost Credibility
How do Germans feel about the Catholic
Church at the moment? And would German church members currently consider
leaving the Catholic or Protestant church? The Catholic Church is in the headlines these weeks, among other
things because of the abuse report by the Archdiocese of Cologne or because
of the rejection of the blessings of homosexual couples. 82 percent of
Germans are of the opinion that the Catholic Church in Germany has lost
credibility within the last few months.
28 percent of those Germans who are members of the Catholic or
Protestant Church in Germany currently state that they are considering
leaving the church. Men make this statement noticeably more often than
women (35 percent vs. 23 percent of women).
NON-TRANSPARENT HANDLING OF ALLEGATIONS OF
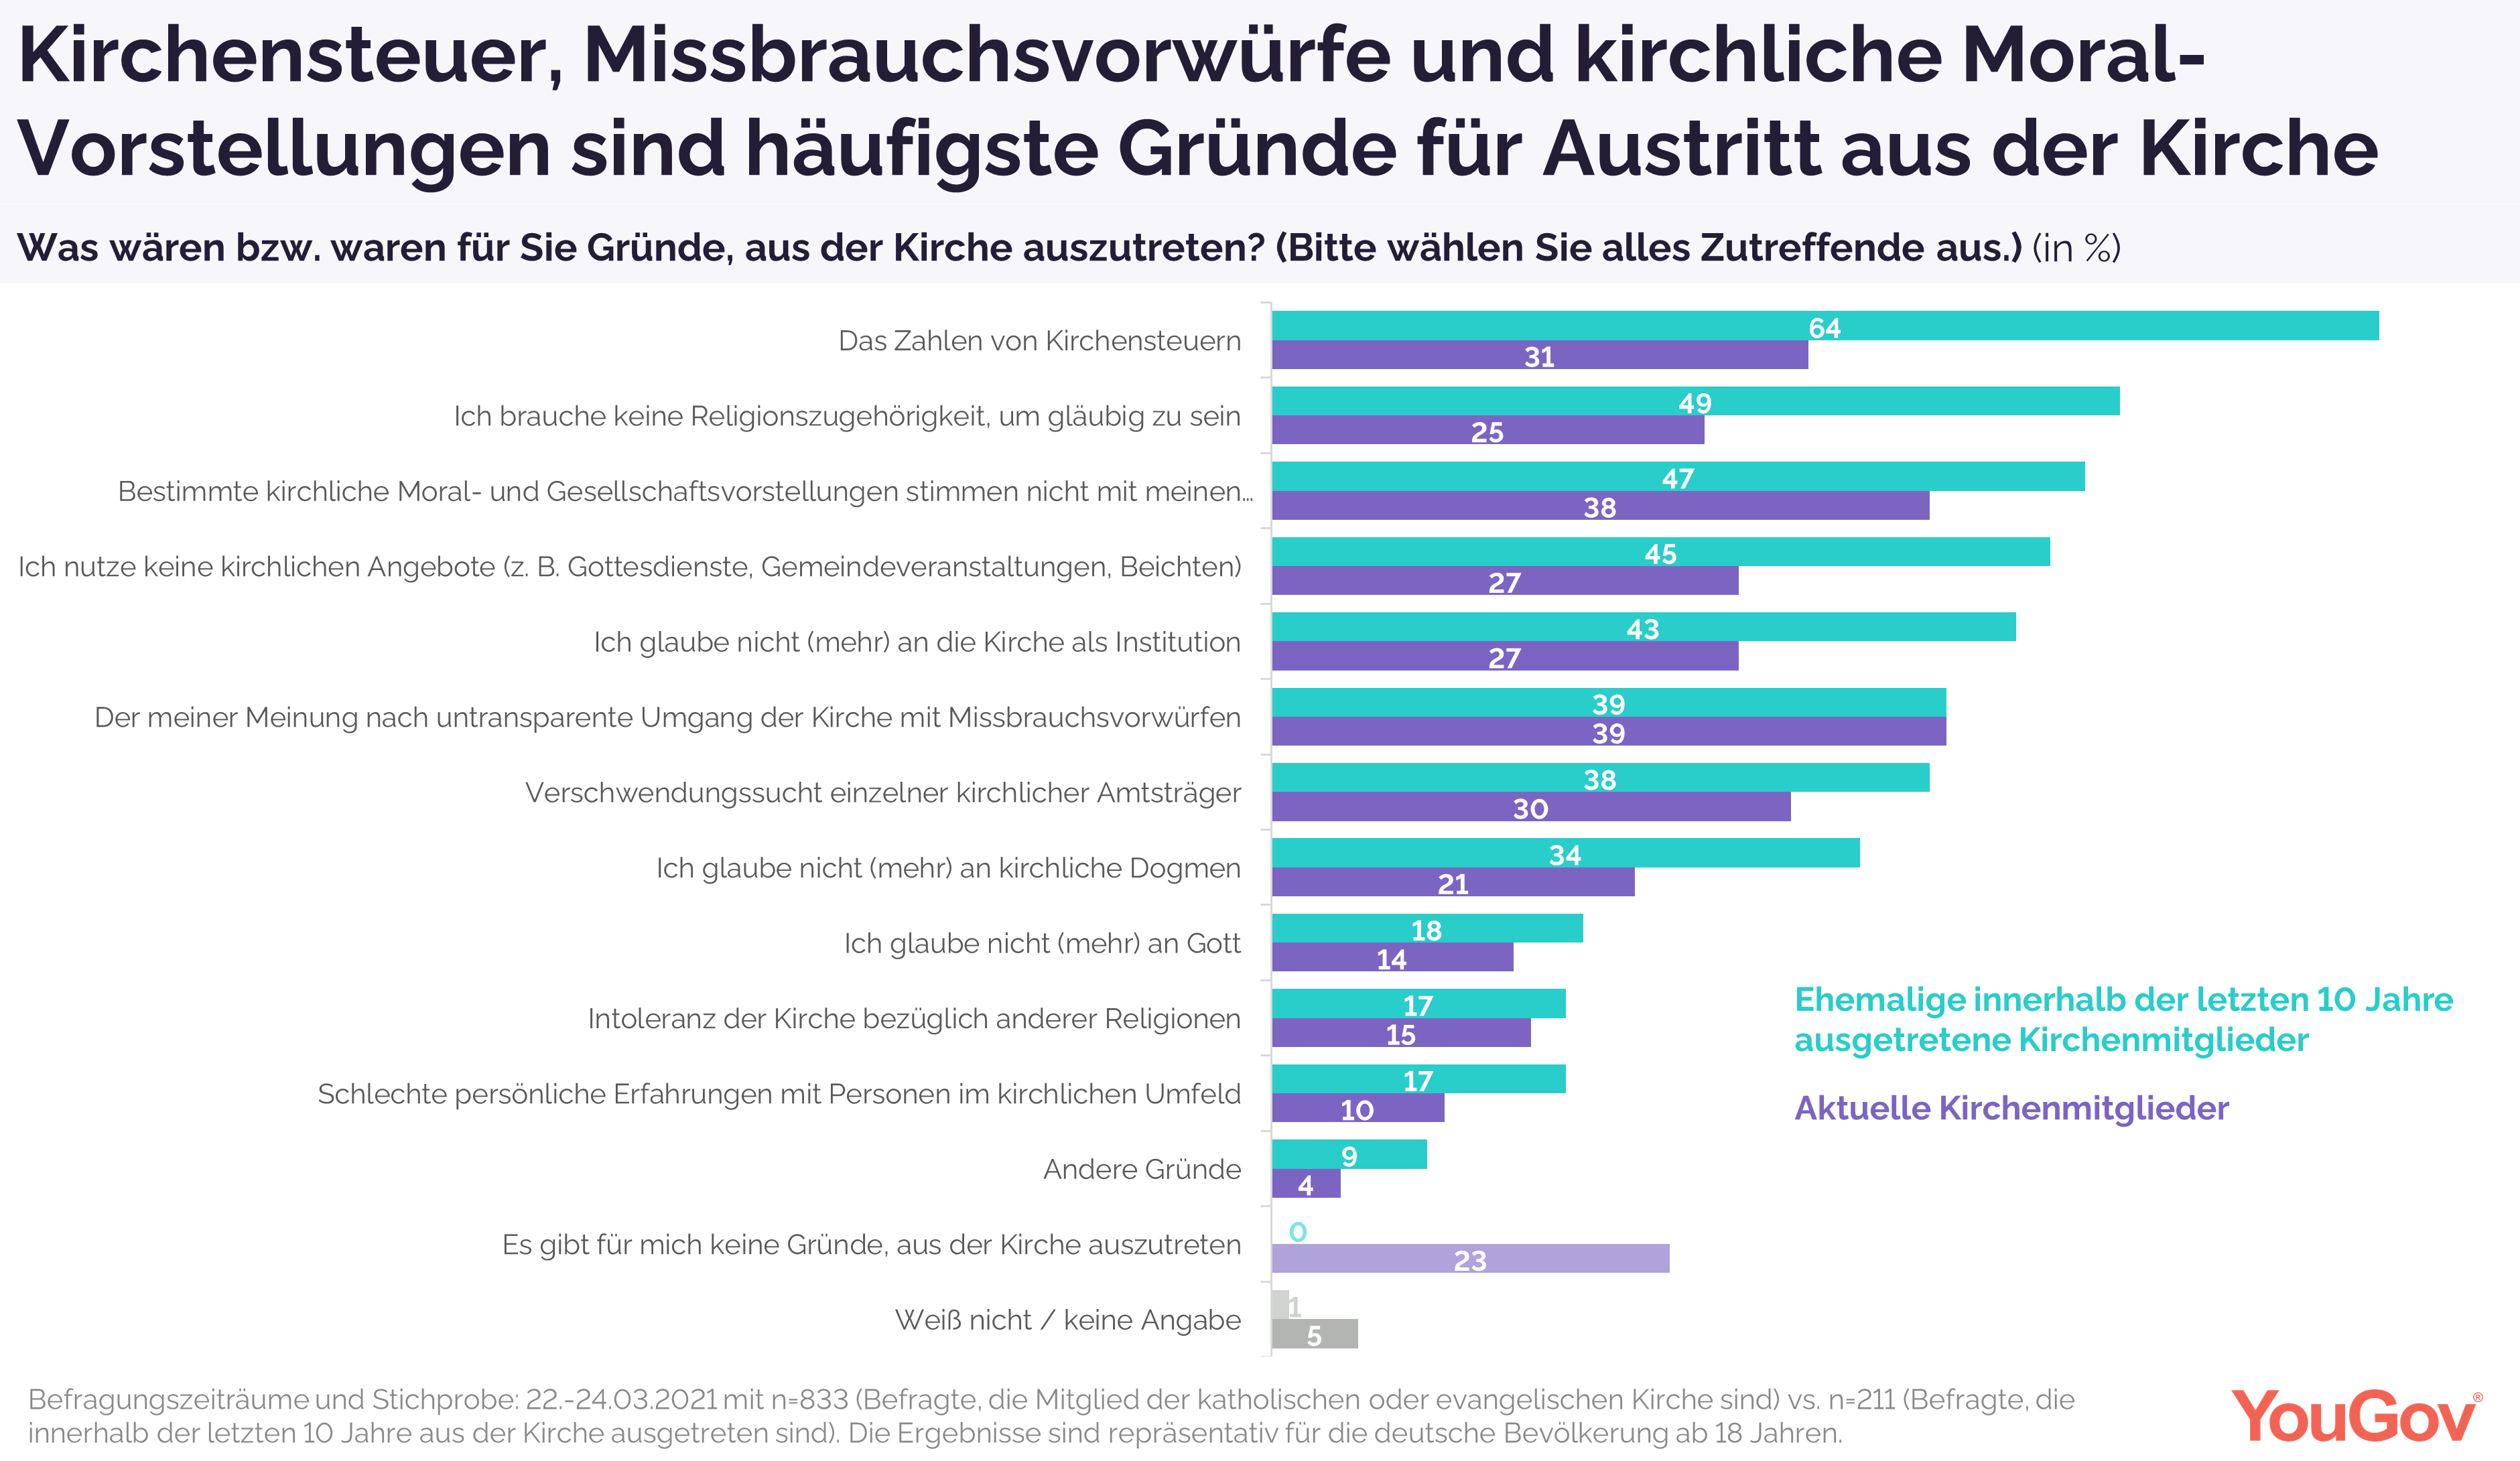
ABUSE IS THE MOST COMMON REASON FOR POSSIBLE EXIT FROM THE CHURCH Almost two out of five of the Catholic and Protestant church members
in Germany (39 percent) state that the church's lack of transparency in
dealing with allegations of abuse would be a possible reason for them to
leave the church. 38 percent named certain church moral and social
concepts that did not match theirs as a possible reason, 31 percent named
paying church taxes. For 30 percent, the extravagance of individual
church officials would be a reason for leaving, and 27 percent say that they
no longer believe in the church as an institution and that they do not use
church services (e.g. church services, community events). Almost a
quarter (23 percent) of German church members, on the other hand, state that
they have no reasons for currently leaving the church. PAYING CHURCH TAXES IS THE MOST COMMON
REASON FOR THOSE WHO HAVE ALREADY LEFT THE CHURCH Almost two thirds (64 percent) of those surveyed who left the church
within the last 10 years state paying church taxes as a reason for
leaving. Half of those (49 percent) say they don't need a religious
affiliation to be a believer. 47 percent name certain church moral and
social concepts that do not match their own as the reason for their past
departure. 45 percent state that they have not used any church offers
(e.g. church services, community events), and 43 percent of those who have
left the church within the last 10 years cite a reason for not believing (any
longer) in the church as an institution .
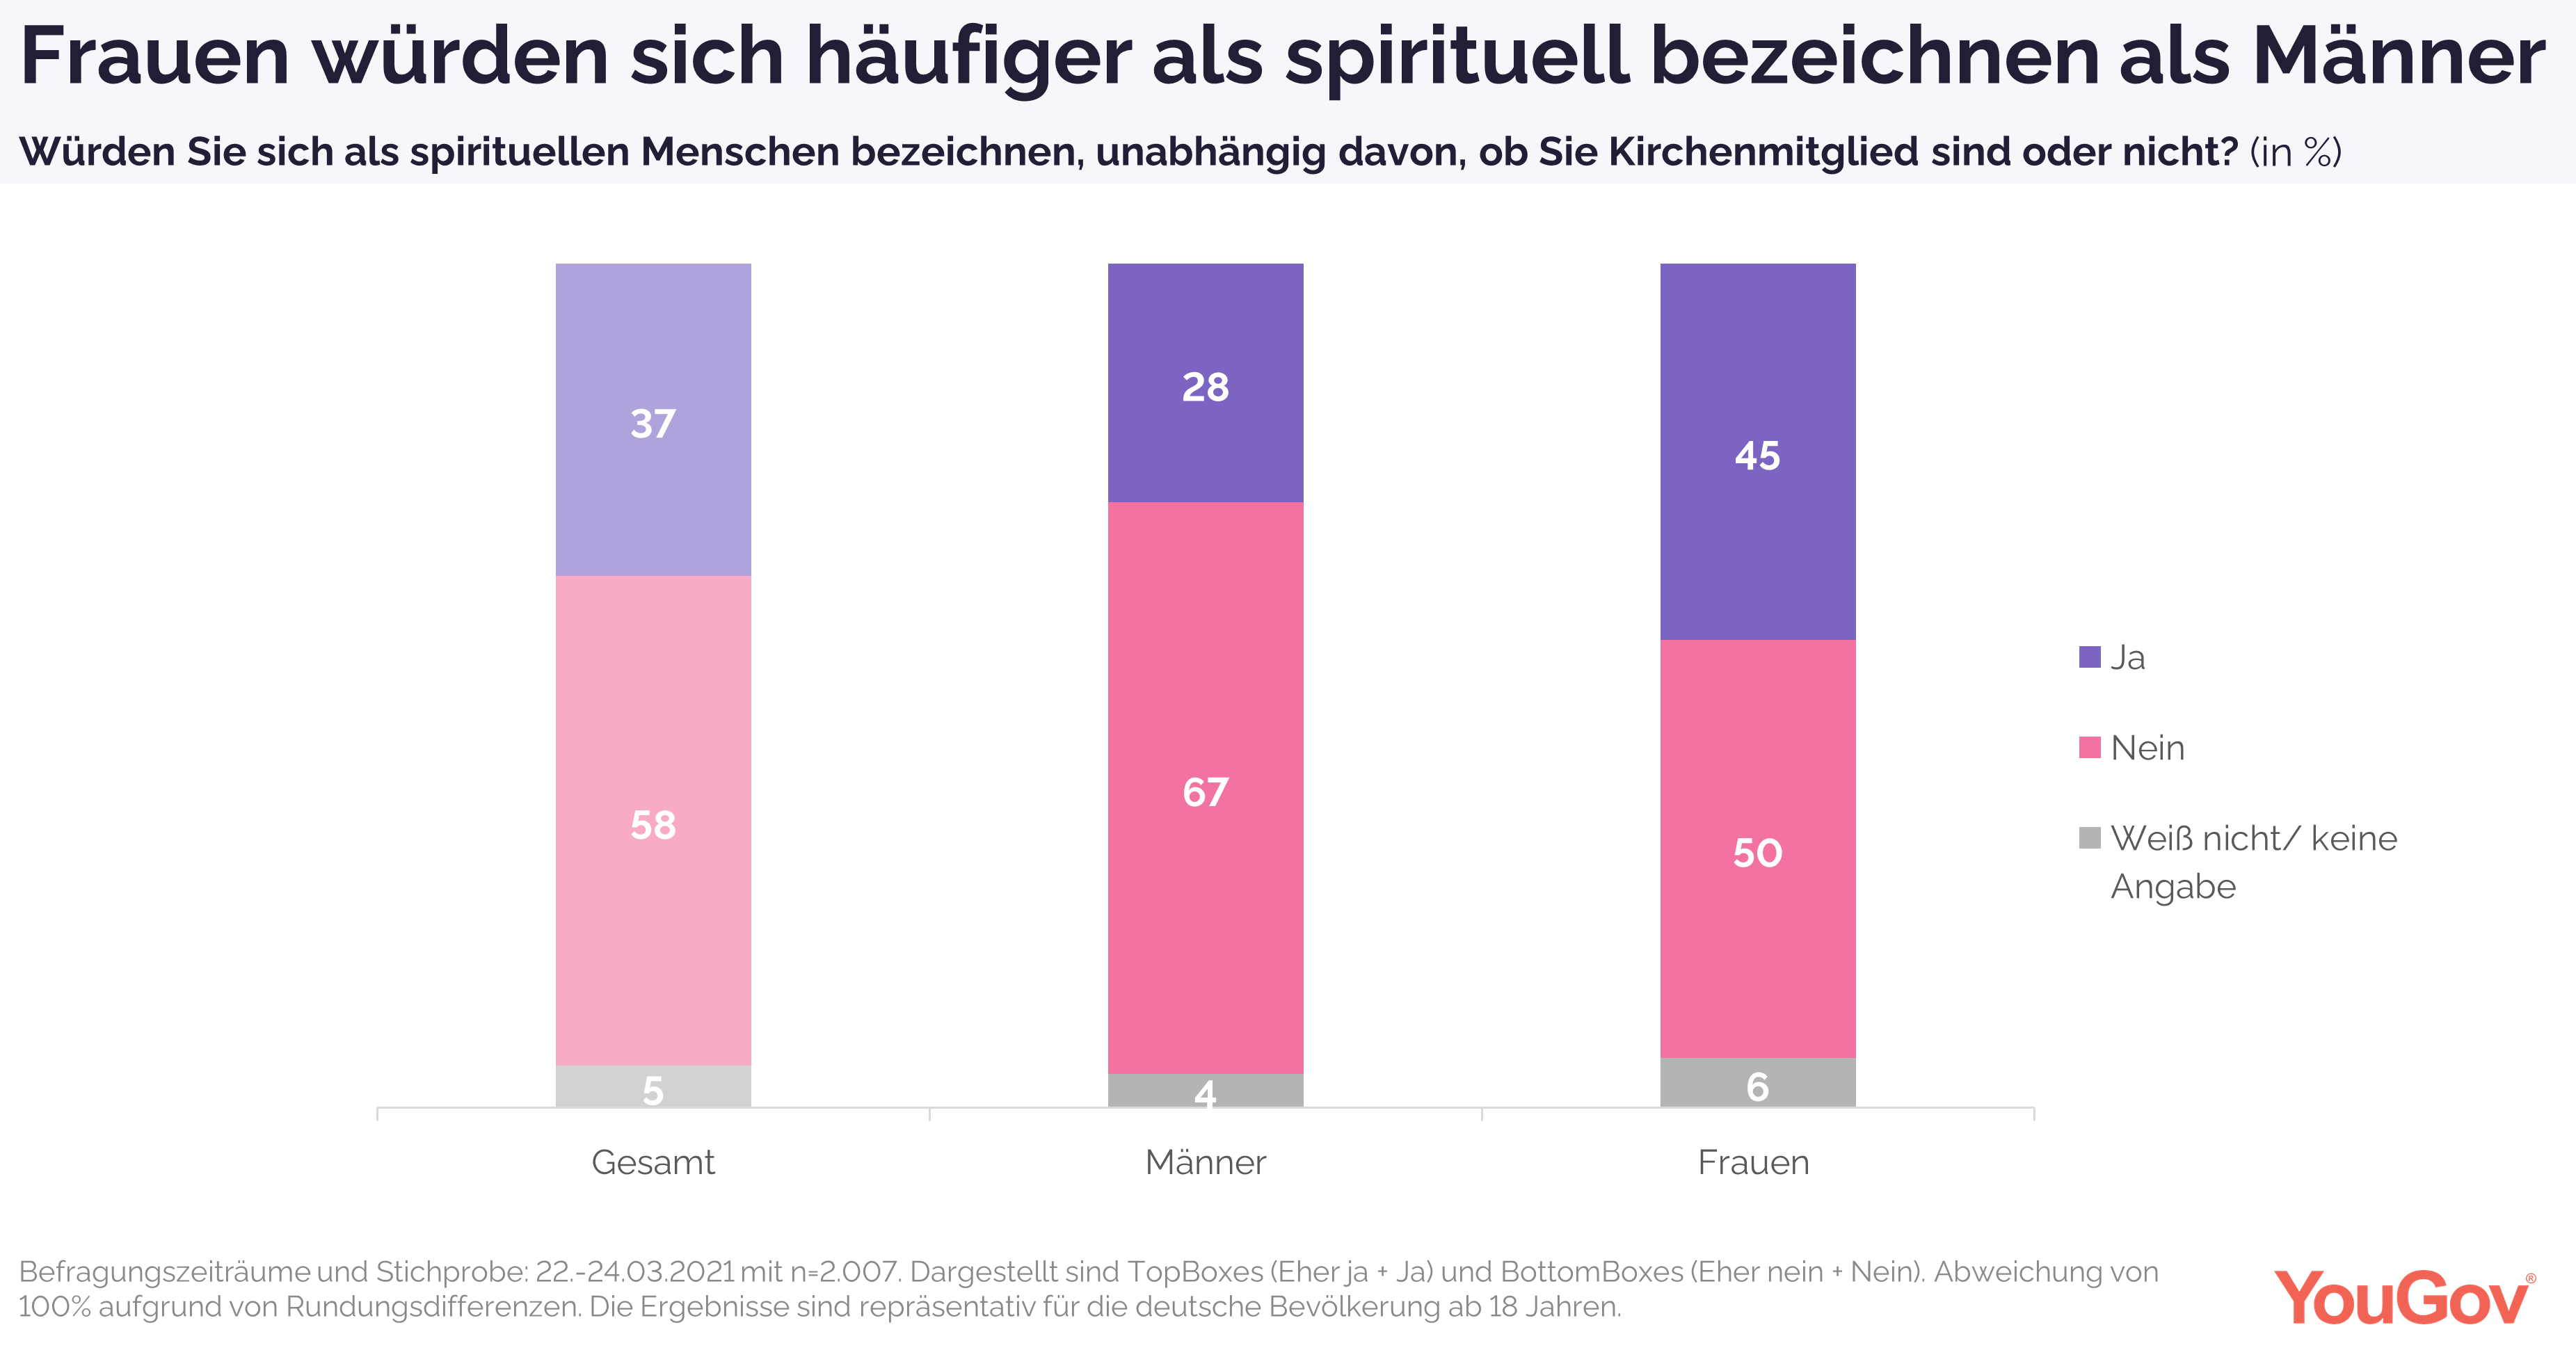
SPIRITUALITY EVEN WITHOUT CHURCH MEMBERSHIP Germans tend not to be a spiritual nation: 37 percent of all German
respondents would describe themselves as spiritual, regardless of whether
they are church members or not. Women say this more often than men (45
percent vs. 28 percent of men). 58 percent of all respondents do not
describe themselves as spiritual.
(YouGov Germany) March 26, 2021 Source: https://yougov.de/news/2021/03/26/grosse-mehrheit-der-deutschen-sieht-glaubwurdigkei/ NORTH
AMERICA
683-43-12/Poll The Growing Diversity Of Black America; 46.8 Million People In U.S.
Identify As Black
The Black population of the United States is diverse. Its members
have varied histories in the nation – many are descendants of enslaved
people, while others are recently arrived immigrants. The Black population
also has nuanced ethnic and racial identities reflecting intermarriage and
international migration. As a result, there are key distinctions in
demographic and economic characteristics between different parts of the
national Black population, highlighting its diverse multitude of backgrounds.
The U.S. Black population is also growing. In 2019, 46.8 million
people in the U.S. identified their race as Black, either alone or as part of
a multiracial or ethnic background. That is up from 36.2 million in 2000.1 The
Black share of the U.S. population is higher today than in 2000 as well.
About 14% of the national population said they were Black in 2019, up from
13% who did so in 2000. At the same time, the Black population’s racial self-identification
is changing. Among those who self-identify as “Black or African American,”
the share who say it is their only racial or ethnic identification has
declined over the past two decades. In 2019, 40.7 million, or 87%, identified
their race as Black alone and their ethnicity as non-Hispanic, while around
3.7 million, or 8%, indicated their race was Black and another race (most
often White) and not Hispanic. Another 2.4 million, or 5%, self-identified as
both Black and Hispanic, or Black Hispanic.2But
these shares have changed since 2000. Then, 93% identified their race and
ethnicity as Black alone. The nation’s Black population is changing in other ways too. A
growing share are foreign born, the population is aging (though some segments
are significantly younger), and a growing share are college graduates. These
trends and more are explored in this report. Accompanying it is a fact sheet showing
the demographic and economic characteristics of the nation’s Black population
in 2019, based on the U.S. Census Bureau’s 2019 American Community Survey.
Findings for all Black people, non-Hispanic single-race Black people,
non-Hispanic multiracial Black people and Black Hispanics are shown
separately. A downloadable spreadsheet of
findings is also available. Measuring racial and ethnic identity Racial identity – as measured by the U.S. decennial census – has
changed over time. The census has drastically changed since its first
administration in 1790. Then, only two racial categories were included: free
(which mostly included White people) and slaves (who were mostly enslaved
Black people). The Census Bureau has modified terms used to refer to people
of non-White racial identities throughout the years, in accordance with the
politics and sensibilities of the times. For example, in the 2020 census, those
who selected “Black or African American” as their race were asked to write
more about their origins, reflecting a more nuanced understanding of Black
racial identity. (For more about how racial and ethnic categories have
changed over time, see “What Census Calls Us.”) Today, decennial census and American Community Survey data is
collected in a different manner than for most of the nation’s history.
Respondents choose their racial response categories themselves. This was not
true for over a century of censuses. Prior to 1960, one’s racial
identification was selected by a census-taker – a Census Bureau employee who
administered the survey on paper and chose a racial category on a person’s
behalf. However, starting that year, some respondents could self-identify, or
chose their own racial category. Self-identification was expanded in
subsequent censuses to include virtually all respondents. Additionally,
starting in 1980, census data included information from the entire population
on Hispanic or Latino ethnic identity in
addition to their racial identification.And the 2000 census marked the first
time respondents were able to include themselves in more than one racial
category; prior to that year, multiracial respondents could select only one
racial category. It’s important to note that racial and ethnic self-identification is
highly personal and can change as one’s relationship with their identity
changes. For example, an analysis of 168 million Americans’ census forms
linked between 2000 and 2010 indicated that 10 million people identified their
racial and/or ethnic background differently between
the two census forms. Multiracial Americans were one of the population groups
that were more likely to change their racial identification between the two
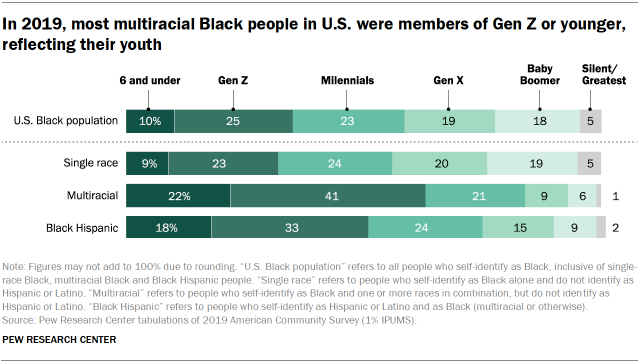
decennial census years. One-in-four Black people are members of Gen
Z The age structure of the Black population has also changed since
2000. As of 2019, the median age of single-race, non-Hispanic Black people is
35, compared with 30 in 2000. This makes the nation’s Black population
younger than the nation’s single-race, non-Hispanic White population (with a
median age of 43) and the single-race, non-Hispanic Asian population (38),
and slightly older than the nation’s Hispanic population (29). The median age for the entire Black population is 32, though it
varies across the differing identities among the Black population. Among
Black Hispanic people, it is 22 years. Meanwhile, multiracial Black people
are the youngest group, with a median age of 16.
A quarter (25%) of those in the U.S. Black population are members of
Generation Z – born between 1997 and 2012 and ages 7 to 22 in 2019. A further
one-in-ten were under the age of 7 that year. Together, 35% of the U.S. Black
population is age 22 or younger. Another 23% are Millennials, meaning that
over half (59%) of the nation’s Black population were Millennials or younger
(under age 38) in 2019. The majority (63%) of multiracial Black people were age 22 or younger
in 2019, reflecting the youth of this demographic subgroup. Roughly half
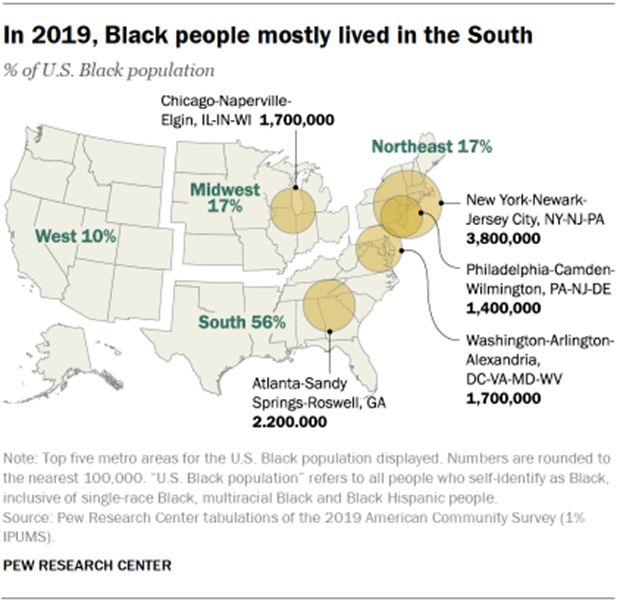
(51%) of Black Hispanics were 22 or younger as well. Over half of the Black population lives in
the South
In 2019, the South was the region with the highest share of the
country’s Black population, with 56% of this population living there. The
Midwest and Northeast each held 17% of this population, while the West was
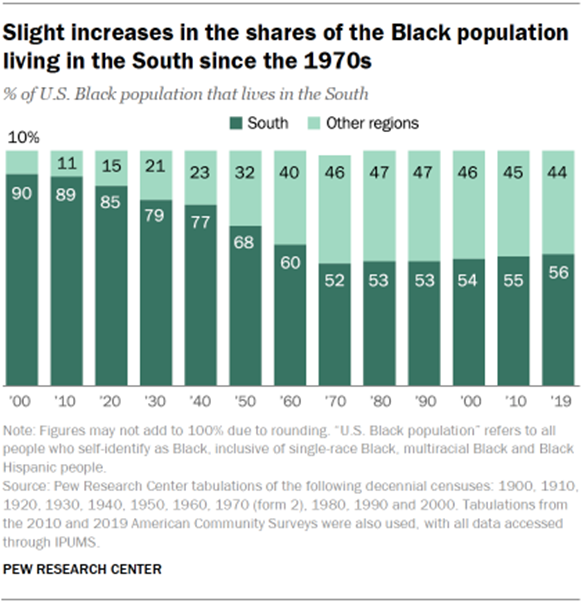
home to one-tenth of the Black population. Regionally, the share of the national Black population living in the
South has grown. In 2000, over half (54%) of Black people in the U.S. lived
in the South, a very similar share to 2019 (56%). Meanwhile, somewhat higher
shares lived the Midwest and Northeast in 2000 than in 2019. Back then, 19% of
the national Black population lived in the Midwest and 18% in the Northeast.
Over the past two decades, the share of Black people living in Western states
was unchanged, at 10%.
The growth of the Black population in the South suggests a departure
from previous Black migration patterns. The first half of the 20th century
featured increasing shares of the population residing in regions of the U.S.
outside of the South, primarily after the start of the Great
Migration in the late 1910s. Consequently, each decade featured
decreasing shares of the Black population living in the South. Starting in 1970, shares of the Black population who live in the
South have grown. There has been a 4 percentage point increase in the shares
of the Black population who live in the South between 1970 (52%) and 2019
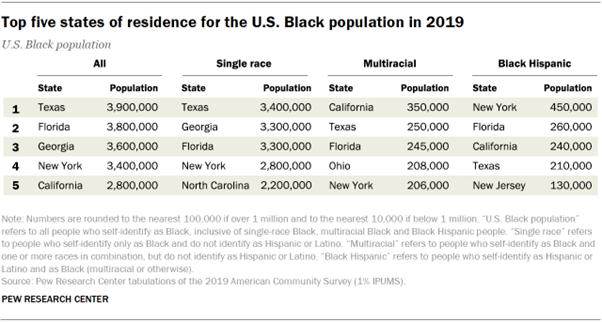
(56%). Texas has the largest Black state
population With more than 3.9 million Black people in 2019, Texas is home to the
largest Black population in the U.S. Florida has the second largest
population at 3.8 million, and Georgia is home to 3.6 million Black people.
Other top states of residence include New York (3.4 million) and California
(2.8 million). Together, these five states hold 37% of the national Black
population. Although the top five states of residence have remained the same for
Black people as in 2000, the order shifted substantially, with New York and
California dropping from the two largest to fourth and fifth in 2019. In
2000, New York (3.2 million), California, Texas, Florida (each 2.5 million)
and Georgia (2.4 million) rounded out the top five, together holding 36% of
the total Black population. Top states of residence differ by racial subgroup. Among non-Hispanic
single-race Black people, Texas has the largest population, followed by
Georgia, Florida, New York and North Carolina. But among non-Hispanic
multiracial Black people, the state with the largest population is
California, followed by Texas, Florida, Ohio and New York. Among Black
Hispanics, meanwhile, New York has the largest population, followed by
Florida, California, Texas and New Jersey. Notably, Texas, New York and
Florida make the top five for all subgroups.
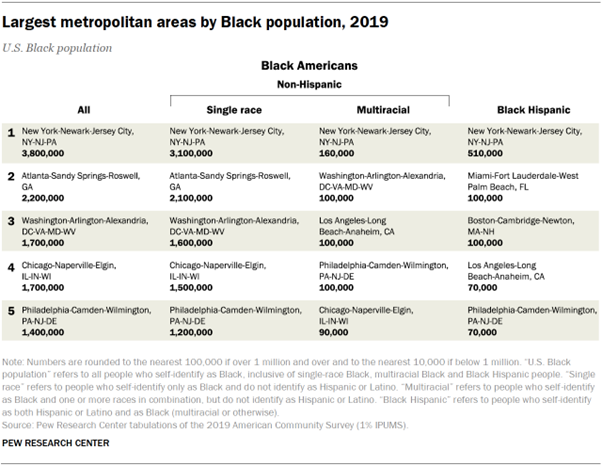
The New York metropolitan area has the
largest Black metropolitan population The metropolitan area with greatest number of Black people is the New
York metropolitan area, with roughly 3.8 million in 2019. The New York City
area has been the top urban center since at least 2000 for Black people,
though other metro areas are on the rise. In 2019, the Atlanta metropolitan
area came in a distant second, with 2.2 million Black people, and the
Washington, D.C., area was next, with 1.7 million. By comparison, in 2000,
the Chicago The New York City metropolitan area has the largest Black population
across the three Black racial and ethnic subgroups, but the other top large
metropolitan areas differ across categories. The list of top five
metropolitan areas for those who say their racial identity is only Black is
the same as it is for the Black population overall, reflecting their majority
(87%) share of the population. However, the top metropolitan areas for
multiracial Black people and Black Hispanics differ. Besides New York City, the top urban centers for those identifying as
multiracial Black are the Washington, D.C., Los Angeles, Philadelphia and
Chicago metropolitan areas. By contrast, for Black Hispanics, Miami is
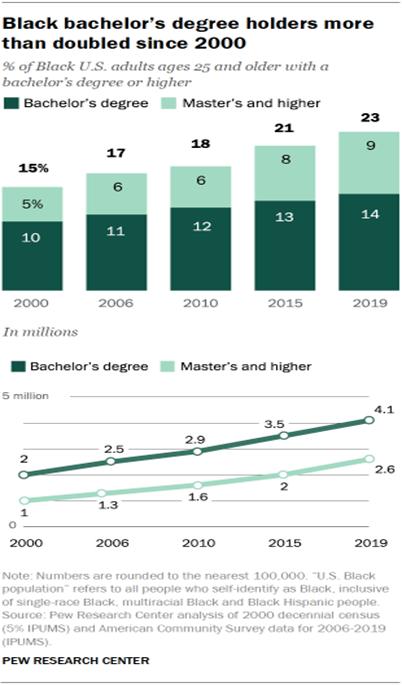
second, followed by the Boston, Los Angeles and Philadelphia metro areas. A growing share of Black adults have a
college degree The number of Black adults with a college degree or more education
has more than doubled since 2000. That year, roughly 3 million Notably, the share of the Black population with at least a college
degree has risen at a similar rate to that of the general population. In
2000, roughly a quarter (24%) of the entire U.S. population ages 25 and older
had a bachelor’s degree or higher. In 2019, that share rose to 33%, an
increase of 9 percentage points. The share of Black adults who earned a
bachelor’s degree or higher also grew nearly 9 points over the same time
period, from 15% to 23%. There has been a similar upward trend specifically among Black adults
with a master’s degree or higher. While roughly 1 million Black adults in
2000 (5% of the population over 25) had an advanced degree, that number rose
to almost 2.6 million, or 9% in 2019. There were differences in educational attainment in 2019 among
different subgroups of the Black population. Among these groups, the
multiracial Black population has the highest shares of adults 25 and older
with a bachelor’s degree (20%) and advanced degree (12%). Single-race Black
adults and Black Hispanics 25 and older have similar, but lower, shares with
a bachelor’s degree (14% and 15%, respectively) as well as an advanced degree
(9% and 8%). The share of Black adults 25 and older without a high school diploma
(or its equivalent, such as a GED certificate) has dropped substantially – by
more than half – since 2000. Then, roughly three-in-ten adults in that age
range (28%) had not earned a high school diploma. In 2019, that share had
dropped to 13%, signifying a 15 percentage point drop over almost two
decades. The Black immigrant population has grown in
number and share Immigrants are a part of the nation’s Black population that has grown
over time. The foreign-born Black population has nearly doubled since 2000,
rising from 7% then to 10% in 2019. In numbers, 2.4 million Black people were
born in another country in 2000, and by 2019, that had risen to 4.6 million. Black immigrants are mostly from just two regions of the world.
Almost nine-in-ten (88%) were born in African or Caribbean countries. Of that
group, a little less than half (46%) were born in Caribbean nations, while a
slightly lower share (42%) are from African countries. The remaining 12% of
Black immigrants are from other parts of the world, with Guyana, Mexico and
Honduras as the top three countries of origin. The majority of Black immigrants identify as single-race Black (87%)
and non-Hispanic, while 10% identify as Black and Hispanic and 3% say their
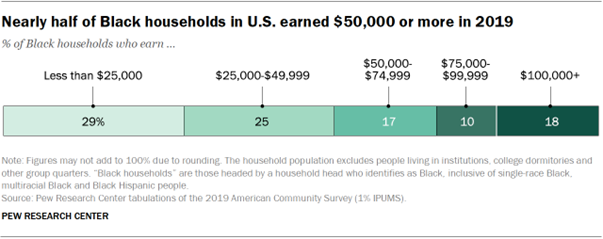
racial background is multiracial. Black household incomes since 2000 Since 2000, the U.S. Black population has seen not seen significant
increases in median household income. The median income for households headed
by a Black person was $44,000 in 2019 (before the COVID-19 pandemic-induced
recession). But household income of Black households varies. Roughly
three-in-ten Black households (29%) made less than $25,000 in 2019, while a
quarter earned between $25,000 and $49,999 – which means that more than half
(54%) of Black households made less than $50,000 in 2019. About one-in-six
Black households (17%) made $50,000 but below $75,000, 10% earned at least
$75,000 but less than $100,000, and 18% earned $100,000 or more in 2019.
The 2019 shares represent an improvement over the distribution of
Black household income in 2000. That year, roughly six-in-ten (61%)
Black-headed households made $25,000 or less (in 2019 U.S. dollar adjusted
value), and more than a quarter (27%) made between $25,000 and $49,999,
meaning that 88% of Black households earned less than $50,000 in 2000. In
that same year, roughly one-in-ten Black households (11%) made at least
$50,000 but less than $100,000, and 2% made $100,000 or more. The median income among Black households in 2019 was roughly $44,000,
representing a slight inflation-adjusted increase over the median household
income for Black people in 2000 ($43,581). Income inequality within the Black population remains one of the widest within
a major racial or ethnic group. In 2019, Black-headed households with income
in the 90th percentile among the population of Black households earned 14
times that of Black households with income in the 10th percentile. The 90th
percentile of households in the overall 2019
population, by contrast, earned 12 times that of households with incomes in
the 10th percentile. (PEW) MARCH 25, 2021 Source: https://www.pewresearch.org/social-trends/2021/03/25/the-growing-diversity-of-black-america/ 683-43-13/Poll 40% Of Democrats Are Paying Attention To News Of The Outbreak,
Compared With 23% Of Republicans
The percentage of Americans following news of the coronavirus outbreak very
closely has slipped to its lowest level since the beginning of the pandemic,
but the large partisan gap in attention to that news remains, a new Pew
Research Center survey has found. Overall, 31% of adults say they are following news about the pandemic
very closely, according to the survey of 12,045 U.S. adults conducted March
8-14, 2021, on the Center’s American Trends Panel, the first time this question
was asked during Joe Biden’s presidency. That is down from 37% in a survey conducted in
late November.
In late March 2020, during the early stages of the outbreak, over
half of all Americans (57%) were following news about the coronavirus very
closely – a percentage that marked the high point in public attention. One finding consistent with late 2020 surveys is that Democrats and
those who lean to the Democratic Party are much more likely to follow news of
the outbreak very closely than Republicans and Republican leaners. In the new
survey, 40% of Democrats are paying that much attention to news of the
outbreak, compared with 23% of Republicans. That party divide did not exist early in the pandemic but emerged in
the summer and held throughout the fall and winter of 2020. In November 2020,
for example, 47% of Democrats were paying very close attention, compared with
28% of Republicans. In March 2020, about half of each party (53% of Democrats
and 48% of Republicans) were following pandemic news very closely. Some shift in Democrats’ views of how the
virus has been treated and handled
When asked if the coronavirus outbreak has been made into a bigger
deal or smaller deal than it really is, or has been approached about right, a
plurality of all adults (43%) now say it has been handled about right. About
a third (34%) say it has been made into a bigger deal, and about a quarter
(23%) say it has been made into a smaller deal. The large partisan differences on this issue that were seen
throughout the past year are also evident in the March 2021 survey. Five
times as many Republicans and GOP leaners (60%) as Democrats and leaners
(12%) say the pandemic has been exaggerated. At the same time, Democrats are
about four times as likely as Republicans (34% vs. 9%) to say it has been
downplayed. Those Republican numbers have stayed stable over months, but there is
some movement among Democrats in the new survey. Since the November 2020
survey, the portion of Democrats who now say the outbreak has been downplayed
has dropped from 45% to 34%. Meanwhile, the percentage of Democrats saying it
has been approached about right has risen from 42% to 53%. As noted in other Pew Research Center findings,
Democrats have been more likely than Republicans to see the virus as a public
health threat. Another key COVID-19 issue that has produced a strong partisan divide
is whether the U.S. has or has not controlled the coronavirus pandemic as
much as it could have. Overall, in the new survey, 42% of all Americans say the U.S. has
done as much as it could, while 56% say it has not. Among Republicans,
seven-in-ten say the nation has done as much as it could (70%), while 29% say
the U.S. has fallen short. Those numbers are reversed for Democrats, with 19%
saying the U.S. controlled the outbreak as much as it could and 79% saying it
has not.
Republicans’ response is consistent with their views in surveys last fall. But
again, there is a detectable shift among Democrats in the new survey. The 19%
who now say the U.S. has done as much as it could to control COVID-19 – while
still a small number – is higher than the 11% who said that last November. At
the same time, there has been about a 10 percentage point drop in the portion
of Democrats (79%) who now say the nation did not do as much as it could to
control the outbreak. (PEW) MARCH 26, 2021 683-43-14/Poll Nearly Half (47%) Of U.S. Elementary Schools Were Open For Full-Time
Classroom Learning As Of Last Month
Nearly half of U.S. elementary schools were open for full-time
classroom learning as of last month, but the share of students with in-person
instruction has varied greatly by region and by race, with most nonwhite
students taught entirely online, according to a Biden administration survey. For the White House, the results of the national survey released
Wednesday mark the starting line for President Joe Biden’s pledge to
have most K-8 schools open full time in his first 100 days in office. But
they also show that he never had far to go to meet that goal. Among schools that enroll fourth graders, 47% offered full-time
classroom learning in February, while for schools that teach eighth-graders,
the figure was 46%. The results suggested, however, that at least some
students weren’t opting in. In total, about 76% of elementary and middle schools were open for
in-person or hybrid learning, while 24% offered remote learning only,
according to the survey. The percentage of students spending at least some
time in the classroom has probably increased since February, when coronavirus
rates were just coming down from a national surge. Education Secretary Miguel Cardona said the findings, while
encouraging, also showed “critical gaps” for in-person learning, especially
for students of color. The Education Department released the survey data the same day it
announced it was distributing $81 billion in school assistance from the $1.9
trillion virus relief bill. In an interview, Cardona said the money will
allow schools to start hiring additional social workers and counselors and
ensure ventilation systems are safe. “It gives districts the ability to start planning long term,” Cardona
said. “This is not about turning the lights on only — it’s about ensuring
that you can create systems that are ready to meet the needs of students,
socially and emotionally.” Still, Cardona cautioned that the return to normalcy will take time.
He said schools must practice social distancing and take other measures to
prevent the virus from spreading. He offered no timeline for a full reopening
of high schools, saying he is “fully focused” on students in pre-K-8. The department’s survey results establish a baseline data set that
the administration plans to update each month to show how many U.S. schools
are teaching in-person, online or through a combination. The government did
not previously collect such information. The findings are based on a survey of 3,500 public schools whose
student bodies include fourth graders, along with 3,500 schools that serve
eighth graders. The survey collected data on schools’ teaching methods as of
February, along with a range of other questions about teaching in January. The survey casts new light on a period of bitter debate in the school
reopening process. In January, officials in California, Chicago and other
places were in stalemates with teachers over reopening plans. Vaccinations
were often a sticking point. Since January, the push to reopen has gained steam in many areas. The
Centers for Disease Control and Prevention issued a road map to reopening in
February. This month, the CDC relaxed guidelines around social distancing in
schools. Under pressure from Biden, dozens of states are now focusing on
giving COVID-19 vaccines to teachers and other school staff. As more schools invite students back to the classroom, many parents
are conflicted, according to a poll from
The University of Chicago Harris School of Public Policy and The Associated
Press-NORC Center for Public Affairs Research. It found
that a majority of parents are at least somewhat concerned that in-person
instruction will lead to more people being infected, but a slightly larger
share is at least somewhat concerned that students will face setbacks in
school because of the coronavirus pandemic. In addition to tracking what types of teaching schools were offering,
the federal survey also tracks how many students enrolled in each mode. In January, 38% of fourth graders were learning full-time in-person,
compared with 28% of eighth graders, the survey found. Larger shares of
students were entirely remote, with 43% of fourth graders and 48% of eighth
graders learning away from school. It was not clear what share was learning
online by choice and how many students were in schools without in-person
options. There were stark differences based on where students live, reflecting
the regional battles that have played out as cities debate how to reopen
schools. In the South and Midwest, where schools were the quickest to reopen,
just under 40% of eighth grade students were enrolled full time in classroom
instruction in January. In the West and Northeast, the figure was about 10%. Across all regions, students in rural areas and towns were far more
likely to be back in the classroom full time compared with students in cities
and suburbs. In a further illustration of the pandemic’s uneven impact, the survey
found striking differences based on students’ race. Among fourth graders,
almost half of white students were learning fully in-person, with just over
one-quarter learning online. Among Black and Hispanic students, nearly 60%
were learning entirely remotely. The difference was even wider among students of Asian descent, with
68% remote and just 15% attending fully in-person. Similar disparities have been uncovered in many cities, raising
alarms among education advocates who fear the pandemic is worsening racial
inequities in education. The administration has pledged to confront racial
gaps in education and is urging schools to prioritize the issue as they spend
the billions in recently approved relief aid. As of January, the survey also found that students with disabilities
and those who are learning English were not being brought back to the
classroom at significantly higher rates than other students. Just 42% of
those with disabilities and 34% learning English were enrolled in full-time
classroom learning, compared with 38% of all students. Among students learning online, the survey found, the amount of time
spent with a live teacher also varied greatly. Roughly one-third of schools
offered more than five hours a day of live instruction, but another third
offered two hours or less. Among schools serving eighth graders, 10% were
offering no live instruction at all. Biden on Wednesday called on schools to create quality summer
learning programs for all students. He said it an “essential” need for
students of color, English language learners, students with disabilities and
others disproportionately affected by the pandemic. The relief bill included $1.2 billion for summer learning programs,
and the Education Department on Wednesday announced a collaboration among
states to help develop effective learning options this summer. The agency’s survey was created in response to an executive order
from Biden. The department said it will issue updated data each month through
July. The information is published on the agency’s website. (AP News) March 25, 2021 Source: https://apnews.com/article/school-survey-gaps-in-person-learning-72aa9af9ca082769e4fb2e8ae478c3d3 683-43-15/Poll About Three-In-Ten 31% U.S. Adults Say They Are ‘Almost Constantly’
Online
As smartphones and other internet-connected devices have become more
widespread, 31% of U.S. adults now report that they go online “almost
constantly,” up from 21% in 2015, according to a new Pew Research Center
survey conducted Jan. 25 to Feb. 8, 2021.
Overall, 85% of Americans say they go online on a daily basis. That
figure includes the 31% who report going online almost constantly, as well as
48% who say they go online several times a day and 6% who go online about
once a day. Some 8% go online several times a week or less often, while 7% of
adults say they do not use the internet at all. Adults under the age of 50 are at the vanguard of the constantly
connected: 44% of 18- to 49-year-olds say they go online almost constantly.
By comparison, just 22% of those ages 50 to 64 and even smaller shares of
those 65 and older (8%) say they use the internet at this frequency. While the share of 18- to 29-year-olds who say they use the internet
almost constantly has risen 9 percentage points since 2018, it remains
unchanged since 2019. Meanwhile, the share of constantly online Americans
ages 30 to 49 has risen 14 points since 2015, and the share of 50- to
64-year-olds has risen from 12% in 2015 to 22% in 2021. The share of
Americans ages 65 and older saying this has not grown since the Center began
asking this question in 2015. Other demographic groups that report almost always going online
include college-educated adults, adults who live in higher-income households
and urban residents.
While 40% of adults with an annual household income of $75,000 or
more say they use the internet almost constantly, this is true for just 27%
of those living in households earning less than $30,000 a year. Adults who
live in urban areas are the most likely to say they go online almost
constantly, compared with suburban residents and an even smaller share of
those who live in rural areas. (PEW) MARCH 26, 2021 AUSTRALIA
683-43-16/Poll In 2020 Nearly 6 Million Australians Bought Packaged Alcohol In An
Average Seven Days Whether In Stores Or Online
New data from Roy Morgan shows online purchases of packaged alcohol
rose quickly during the early and middle parts of 2020 before declining
gently into year-end. Over the full year of 2020 nearly 6 million Australians bought
packaged alcohol in an average seven days whether in store, online, over the
phone or some other way. Over one-in-ten of these Australian packaged alcohol buyers (11.3%)
bought alcohol online, more than tripling the figure of 3.5% for 2019 – an
increase of almost 8% points. This represented a huge increase in the online alcohol market but
despite a nation-wide lockdown, and a four month long second lockdown in
Victoria, a vast majority of 88.6% of Australian packaged alcohol buyers
bought alcohol at a store, down nearly 6% points from 2019. In addition, in 2020 a further 2.5% (up 1.6% points) of Australian
packaged alcohol buyers bought alcohol by phone and 1.3% (up 1% point) bought
alcohol some other way. Analysing the results on a quarterly level shows online buying of
packaged alcohol peaked at 15.4% of packaged alcohol buyers in the September
quarter 2020 before gently declining to 12.0% in the December quarter 2020. Alcohol sales by channel: Visiting a store vs. buying online: 2019
vs. 2020
“The last year has seen unprecedented
changes to the way Australians interact and go about their daily life forced
by strict lockdowns enforced nation-wide during March – May 2020 and on
several other occasions since then to deal with localised outbreaks of the
virus. “The retail industry has been one of the
hardest hit with a huge drop in retail sales in April 2020 (down 17.7%
month-on-month)
during the nation-wide lockdown but then a huge rebound in the months that
followed as the Government pumped hundreds of billions of dollars into
Australians’ pockets over the last year. The most prominent stimulus was the
JobKeeper wage subsidy which is due to end in the next fortnight at the end
of the month. “Hospitality businesses were hardest hit
with the forced closure of restaurants, cafes, bars and hotels during the
lockdown and restrictions on dining during other periods. The closure of
these businesses for extended periods forced Australians to purchase these
goods from supermarkets and other food and liquor outlets. “Although liquor stores were able to stay
open throughout the lockdowns there was a definite impact on how Australians
bought their packaged alcohol in 2020 compared to 2019. To be sure, most
Australians who bought packaged alcohol in 2020 (88.6%) bought alcohol from a
store, but this was down almost 6% points from 2019. “Taking up the slack was the
fast-increasing proportion of Australian packaged alcohol buyers going online
for their liquor purchases, up nearly 8% points to 11.3% for the year. It’s
true the proportion buying online peaked at 15.4% in the September quarter
2020, but even during the relatively restriction-free December quarter 2020 a
sizeable 12.0% were still buying online – up nearly 10% points on 2019. “Perhaps surprisingly those packaged
alcohol buyers aged 35-49 (13.2%) are the most likely to have bought alcohol
online during 2020, just ahead of their younger peers aged 25-34 (12.8%) and
18-24 (12.5%). People in Capital Cities (12.8%) were more likely than those
in Country Areas (8.3%) to buy packaged alcohol online but there was
negligible difference between men (11.8%) and women (10.5%). “The last few weeks have seen the rollout
of COVID-19 vaccines in Australia commence with the Federal Government aiming
to vaccinate all Australians who want the treatment by October 2021. The
question surrounding the liquor market in particular will be whether the
online sales of liquor hold up at or near the levels of late 2020 or decline
further over the course of this year back towards their pre-COVID-19 level of
only 3.5% of packaged alcohol buyers. “Liquor outlets that have successfully sold
their products via online channels over the past year will be hoping Aussie
packaged alcohol buyers keep up with their online purchases as the average spent
buying liquor online in a week is $124 compared to only $71 when buying in
store – a difference of over $50.” (Roy Morgan) March 23 2021 Source: https://www.roymorgan.com/findings/8661-online-alcohol-shopping-2019-march-2021-202103150525 683-43-17/Poll (73.2%) Nominated A Religion To Which They Belonged In
2003 And In 2020, It Had Fallen To Just Over Half (53.4%)
Newly released Roy Morgan data shows a significant drop in the number
of Australians who say they hold religious beliefs. However, the percentage
who report regularly attending a place of worship has remained remarkably
steady. Roy Morgan’s Single Source is the nation’s largest and
longest-running survey of Australians, covering values, beliefs, behaviours,
concerns, aspirations and almost every other facet of life. For close to two
decades, this extensive survey has included questions about religion and in
2003, almost three-quarters of the population (73.2%) nominated a religion to
which they belonged. By the end of 2020, that figure had fallen to just over
half (53.4%). Respondents are free to nominate any religion. In 2003, 68.1% of the
population described themselves as Christian. As of 2020, that was down to
44.0%. Meanwhile the proportion of Australians who describe themselves as
having no religion has risen from 26.0% in 2003 to 45.5% in 2020. Yet despite these significant changes, the percentage of Australians
who say they regularly attend a church or other place of worship has changed
very little, from 18.8% in 2003 to 17.4% in 2020. The information is drawn from large-scale surveys, with a yearly
average of more than 17,000 respondents over the 18-year period covered by
this data. Roy Morgan CEO Michele Levine says: “Australia and Australians have changed in
many different ways over the past two decades or so, and changes in the part
religion plays in people’s lives is a prime example. “In 2003 a large majority of the population
(73.2%) said they belonged to a religion. Now, that has fallen to 53.4%.
That’s a decrease of almost 20% of people. There has been a drop of over 24%
in those who describe themselves as Christian, from a majority of 68.1% to a
minority of 44.0% over that period. “However, while the percentage of the
population who hold religious beliefs has dropped markedly, the percentage
who say they regularly attend a church or other place of worship has remained
remarkably consistent: 18.3% in 2003, compared to 17.4% in 2020. The key word
here being “regularly” — we’re coming up to Easter which, along with
Christmas, sees the regulars numbers boosted by others making annual or
biannual ‘special celebration’ visits to church.” % of Australians who hold religious
beliefs: 2003 – 2020
(Roy Morgan) March 23 2021 Source: https://www.roymorgan.com/findings/8664-religion-in-australia-march-2020-202103220545 MULTICOUNTRY
STUDIES
683-43-18/Poll As Covid-19 Vaccines Arrive In Southern African Countries, Public
Health Facilities Confront Challenges Of Mass Campaigns
As Southern African countries receive their first shipments of
COVID-19 vaccines, their public health systems will be called upon to
confront challenges that have limited services in the past. Large majorities of citizens in Angola, Botswana, Lesotho, and
Mozambique rely on public health-care facilities, according to Afrobarometer
data collected between 2018 and 2020, and are likely to rely on these
facilities for access to COVID-19 vaccinations. Among those who visited public health facilities during the previous
year, more than half of Angolans said they had difficulty obtaining medical
care, and one-third reported having to pay bribes. Smaller proportions of
citizens in the other three countries reported difficult access and
bribe-paying. Even though majorities accessed public health facilities, many
reported going without needed medicines or medical treatment. And while a
majority of Batswana and Mozambicans said their governments were doing at
least “fairly well” on improving basic health services, approval ratings have
generally declined over the past decade. All four countries started receiving COVID-19 vaccines at the
beginning of March 2021 through the COVAX initiative, a program backed by the
World Health Organization (WHO) and the Global Alliance for Vaccines and
Immunization (GAVI) that aims to secure 2 billion doses for low- and
middle-income countries by the end of 2021. (Afrobarometer) 22 Mar 2021 683-43-19/Poll Europeans Now See Astrazeneca Vaccine As Unsafe, Following Blood
Clots Scare
The decision by many countries, including many EU nations, suspending
use of the AstraZeneca vaccine following concerns that it could cause blood
clots, has hugely damaged public perceptions of the vaccine's safety in
Europe. A YouGov study in late February showed that Europeans were already more wary
of the AstraZeneca vaccine , which had not seen nearly
the same level of growth in confidence that the Pfizer and Modern
alternatives had in the preceding months. Nevertheless, in all countries
studied except for France, more people considered the AZ vaccine to be safe
than unsafe. That is no longer the case. In the four continental European
countries studied in both the February and March surveys - France, Germany,
Spain and Italy - people are more likely to see the vaccine as unsafe than safe. In each case this represents a substantial decline in perceived
safety. In our previous survey in Germany, 43% said they believed the
vaccine to be safe, compared to 40% who considered it unsafe. As of now,
a majority of Germans think the vaccine is unsafe (55%) and just a third
think it safe (32%).
In France, where people had already considered the vaccine unsafe
(43%) than safe (33%), those figures have now worsened to 61% unsafe and 23%
safe. In Italy and Spain, most people had previously felt that the
AstraZeneca vaccine was safe (54% and 59% respectively). Since then
those numbers have fallen to 36% and 38% - in both cases lower than the
proportion who feel the vaccine is unsafe. Only in Britain can the blood clots story be considered to have little
to no impact, with the vast majority still considering the vaccine safe, at
77% (down 4pts from February, and still on a par with Pfizer's 79% safe
rating). New entrants to the survey this month are Sweden and Denmark. In
Sweden the AstraZeneca vaccine is still seen as safe by more people than not
(43% vs 34%), while Danes are tied 42% -42%. In both cases, however, the
drug is seen as safe by far fewer people than the Pfizer and Moderna
alternatives.
It is also worth noting that there has not been any spillover concern
over the AstraZeneca vaccine to the Pfizer and Moderna offerings, both of
which are seen as exactly as safe as they were 3 weeks ago. (YouGov Denmark) Source: https://yougov.dk/news/2021/03/22/europeans-now-see-astrazeneca-vaccine-unsafe-follo/ 683-43-20/Poll Global: One In Three Would Be Uncomfortable Taking Mental Health
Medication
International YouGov data shows that a third
(32%) of people across 17 international markets say they would
feel uncomfortable taking medicine for a mental health issue such as
depression or anxiety if they needed to do so. While the global public
are more likely to be happy taking these medicines than not, the proportion
varies heavily from country to country. France, for example, is the only European nation in our
poll where people are more likely to say they’re uncomfortable taking mental
health medication than comfortable. Overall, 45% would not be happy to take
medicine for an issue such as depression or anxiety, while two in five (41%)
would. Recent headlines have suggested that there is some
social stigma around mental health issues within France, and that
mental health services have been underfunded. Germany
also has higher proportions of people who would feel uncomfortable taking
mental health medications (36%) and lower proportions of people who would
feel comfortable (50%).
The picture across the rest of Europe is more accepting of
medication. In Sweden (62%) and Spain (59%), for example, three in
five say they’d feel comfortable taking medication for a mental health
issue – with a quarter of Swedes (24%) and a third of Spaniards (33%)
saying the reverse. In Britain, 56% are fine with this kind of treatment
compared to 24% who are not. The picture is similarly scattershot in other markets. In North
America, for example, Mexican people have higher levels of
aversion to mental health medication than the
average (51% comfortable vs. 41% uncomfortable) – and in
the US, 37% are uncomfortable compared to three in five (60%) who are
comfortable. In the States, both of
these attitudes may be partially explained with data
from YouGov Profiles. Some 45%, for example, say that stigmas around mental
illnesses are declining – but 36% say they are not. One in nine members of
the US public (11%) go as far as to say that mental illnesses are not real
illnesses. But reluctance to take medication – in all markets –
may also simply suggest a preference for other types of treatment, such
as talking therapy, over medicines. (YouGov UK) March 25, 2021 683-43-21/Poll 57% Of Brazilians Believe They Will Take More Care Of Health And
Well-Being When The Pandemic Is Over
One year after the start of the pandemic, we started to have
vaccination campaigns in several countries and people started to project what
life will be like in post-COVID-19. Research conducted by Ipsos, in
partnership with the Global Institute
for Women´s Leadership , points out trends of what should
happen in Brazil and in the world in different aspects of society, such as
health, family, employment and solidarity. (Ipsos Brazil) March 25, 2021 683-43-22/Poll Income And Wealth Disparities Perceived As The Most Serious Form Of
Inequality
Highlighting that views around inequality are still rooted in wealth
and income. Inequalities between more and less deprived areas come second,
with 42% saying that geographical inequality is one of the most serious forms
of inequality in their country. Three in ten think that gender and
racial/ethnic inequalities are among the most serious, although cultural
movements highlighting issues in both areas have achieved global prominence
in recent years. Inequality between younger and older generations is seen as a
relatively less serious form of inequality across the 28 countries polled,
with just 24% saying it was one of the most serious inequalities in their
country. Across the 28
countries, six in ten on average say inequalities in income and wealth are
seen as the most serious. Area based inequalities between more and less
deprived areas seen as the second most serious.
There are differences by gender, with 36% of women across the 28 countries
polled believing that gender inequality was one of the three or four most
serious types of inequality in their country, compared to just 26% of men. Younger people aged under 35 are more likely to highlight
inequalities between racial or ethnic groups and inequalities between men and
women as a concern compared to those aged 35-49 and 50-74. Concerns about
income and wealth inequalities are higher among older people than those aged
under 35. Younger people are much more likely to be concerned about racial
and ethnic inequalities and gender inequality than older people.
Income and wealth inequality
Geographical inequality
Gender inequality
Inequality in educational outcomes for
children and inequality in health and life expectancies
Inequalities between racial or ethnic
groups
Intergenerational inequality
(Ipsos Egypt) 26 March 2021 Source: https://www.ipsos.com/en-eg/income-and-wealth-disparities-perceived-most-serious-form-inequality 683-43-23/Poll Geography And Gender: Britons Stand Out For Views On Two Types Of
Inequality, While Age Divide Splits Opinions On Race
The research, by the Policy Institute at King’s College London and
Ipsos MORI, found 51% of Britons say inequalities between more and less
deprived areas are one of the most serious types of inequality in the country
– much higher than the European average of 39%, and above any other western
European nation. Among this group of countries, Italy has the next-highest
level of concern about this issue, on 42%, while only 22% in Germany think
this is a serious form of inequality. Aside from disparities in income and wealth (56%), other forms of
inequality are seen as relatively less serious, with British opinion in line
with that across Europe. The major exception is gender inequality, which is viewed as a top
concern by 33% of Europeans, compared with 23% of Britons. According to the World Economic Forum’s Global Gender Gap Index, in
2020 Britain was ranked highly, as the 21st most gender-equal country for its
actual levels of equality between men and women. It may therefore seem right for Britons to be less focused on gender
inequality as a serious issue – but interestingly, other nations that do
better according to this objective measure in fact have greater levels of
concern about inequalities between men and women than those seen in Britain. For example, 42% of people in Spain say it is one of the most serious
forms of inequality in their country, despite the country ranking eighth in
the world for gender equality. And 37% of Swedes say the same – even though
their nation comes higher still, ranking fourth globally. Overall, concern about gender inequality appears to be unrelated to a
nation’s actual performance on this issue. For example, only 19% of people in
Saudi Arabia see this as a particularly serious concern there, despite the
country doing very poorly according to objective measures, ranked 146th
globally for equality between men and women. Inequalities between ethnic groups
But there are big differences in views by age: 47% of under-35s say
ethnic inequalities are among the most serious in Britain, compared with 34%
of 35-49-year-olds and 29% of 50-74-year-olds. This age divide in views among the British public is much larger than
the global country average, with 34% of under-35s around the world citing ethnic
disparities as a serious concern and 27% of both older age groups saying the
same. Looking beyond Britain, 55% of Americans consider ethnic inequalities
to be among the most serious forms of inequality in the US – the highest of
any developed country surveyed and lower only than South Africa, on 65%. Income inequality
But concern in Britain is in line with the European average (57%),
and is similar to other western countries, such as Spain (56%), the US (57%)
and Germany (59%). Even though it is considered the worst country for income equality by
the World Bank, which ranks it at 165th globally, 62% of people in South
Africa are particularly concerned about disparities in incomes there, which
barely exceeds the global average of 60%. By contrast, Belgium does much better according to objective
measures, coming 10th for income equality globally, yet concern is relatively
high there, with 69% seeing it as a serious issue – significantly higher than
the European average. Professor Bobby Duffy, director of the Policy Institute at King’s
College London, said: The level of concern about inequalities
between areas in Britain is unusually high – other European countries are
much less likely to be concerned. It seems then that the government’s focus
on the ‘levelling up’ agenda has struck a chord with the British public. But
people are likely to have a variety of things in mind when they pick this out
as a concern – from the north-south divide, to very local ‘left behind’
communities – and we need to reflect this in the policy response.“In
contrast, we’re much less likely to pick out inequality between men and women
as a serious problem compared with other countries. This may seem justified,
as Britain does fairly well on international indices of actual gender
inequality. But it also seems likely that this may be complacency, as other
countries that rank even higher objective measures of gender equality are
still more concerned than Britain. Kully Kaur-Ballagan, Research Director at Ipsos MORI, said: Spontaneous concern about inequality has
been gradually increasing over the last decade in Ipsos MORI’s Issues Index
and these concerns are highlighted here. Britons are much more concerned
about inequality between racial and ethnic groups than the average across the
28 countries and more so than many of their European neighbours. Britons are
also among the most concerned about inequalities between people living in
more and less deprived areas. The Covid-19 crisis has further revealed - and
exacerbated a range of inequalities. The recovery from the pandemic must
address these issues front and centre, given levels of concern about the here
in the UK. (Ipsos MORI) 26 March 2021 |