|
BUSINESS & POLITICS IN THE WORLD GLOBAL OPINION REPORT NO. 685 Week:
April 05 –April 11, 2021 Presentation:
April 19, 2021 YouGov
Dining & QSR Rankings 2021 Singapore Nearly
Half (46%) Of UAE Residents Plan To Engage In Charity During Ramadan This
Year More
Than 6 in 10 Nigerians Still Have Challenge In Access Water 3%
Of Voters Plan To Vote For The Alba Party On The Regional List At The
Holyrood Elections Three
Quarters Of English People Support Government’s Rapid Covid-19 Testing Plan Danes
Are Particularly Worried About The Consequences Of The Lockdown On The State
Of The Economy More
Than 56% Of French People Still Plan To Go On Vacation In The Country, And
31% Abroad 29
Percent Of Germans Heard The Radio Plays "Drei " In Their Childhood Confronting
2016 And 2020 Polling Limitations The
Asian Population In The US Grew 81% Between 2000 And 2019 Eight-In-Ten
(81%) Agree That ‘Natural Resource Development Is Good For Canada 42%
Of Brazilians Believe That The Country's Interests Must Come Before Politics 83%
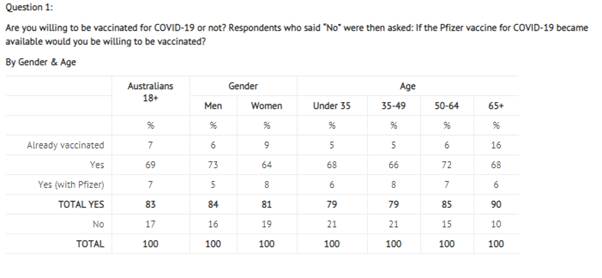
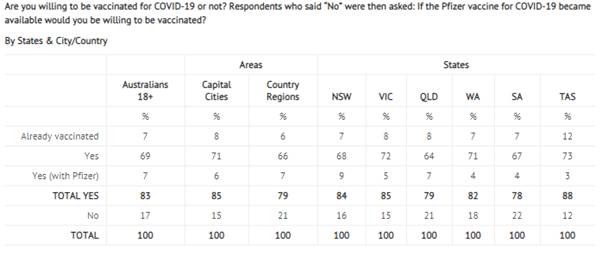
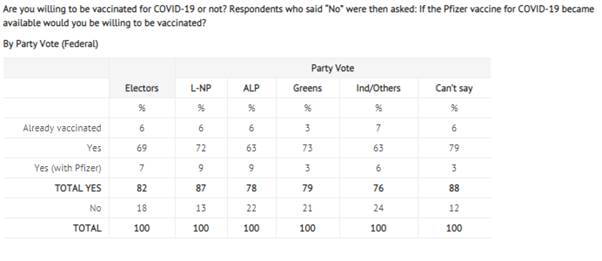
Of Australians Have Either Already Been Vaccinated (7%), Say They Are Willing
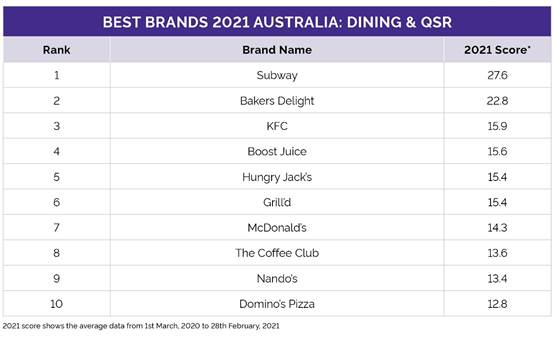
To Be Vaccinated Subway
Tops Yougov Australia’s Dining & Qsr Rankings 2021 Citizens
Weigh In On The Health Of Their Healthcare Systems In Mena INTRODUCTORY NOTE
685-43-23/Commentary:
Nearly
Half (46%) Of UAE Residents Plan To Engage In Charity During Ramadan This
Year
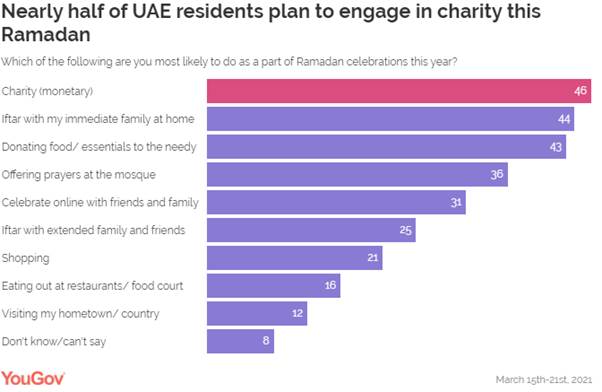
Nearly half
of UAE residents who look forward to Ramadan this year (46%) intend to
celebrate the festival by giving to charity. Among all the respondents, Arab
expats and married respondents with children were most likely to choose this
as their preferred way of celebrating the festival amidst the pandemic (at
56% and 53%, respectively). Almost as
many as those who intend to make monetary contributions plan to donate food/
essentials to the needy (43%), although the government has now urged the
public to pay zakat and/or any donations digitally. The survey
was conducted before the guidelines came into force but it is worth bearing
in mind what people would have liked to do during Ramadan in the absence of
restrictions. As per the
new guidelines around Ramadan, home visits and family gatherings are banned
in the UAE, with families encouraged to gather online instead. Keeping in
mind the current situation, almost a third (31%) intend to celebrate the festival
online with their loved ones.
Although
many residents look forward to celebrating Iftar at home with their immediate
family (44%), a quarter said they were planning to celebrate Iftars with
extended family (25%), a plan that may have to wait for Ramadan 2022 given
current restrictions. Slightly
over a third (36%) would like to offer prayers at the mosque, which is
currently allowed with some restraints. Females as
compared to their male counterparts were more keen to gather for Iftar (51%
vs 41%). Men on the other hand were more likely to offer prayers at the
mosque (40% vs 27%). Even though
there are fewer restrictions on shops and restaurants staying open, few plan
to go shopping or eat at food courts or restaurants during Ramadan (21% and
16% respectively). Travelling to one’s hometown (12%) is not commonly
considered by UAE residents this year. In 2020, as
Ramadan coincided with the spread of the pandemic, people stayed inside and
spent a lot of time online. Fortunately, this year the market has opened up,
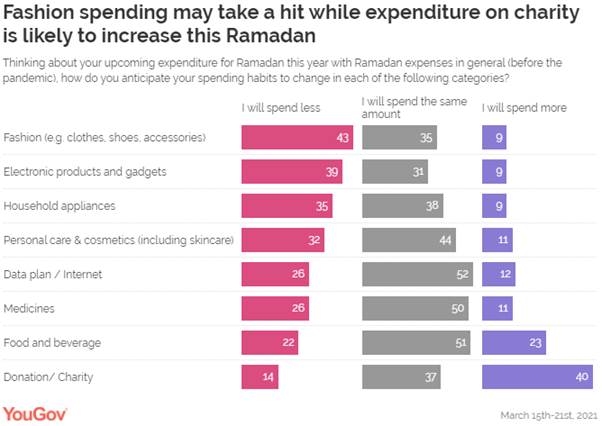
giving an opportunity to business owners to revive sales. When asked
how their spending pattern is likely to change this Ramadan compared to the
pre-pandemic years, UAE residents claimed it is unlikely to change across
most of the listed categories. This is especially true for spending on data
plan/ internet, where 52% of the respondents said they will spend the same
amount of money as they were before the pandemic hit the country.
Similarly,
residents’ spending on food & beverage (51%) and medicines (50%) is also
likely to remain the same as before. Household appliances is a category where
consumers are evenly split, with 38% saying they will spend the same amount
of money on these products but 35% intend to spend less on this category this
year. Purchase of
fashion and electronic products/ gadgets is likely to take a hit- with 43%
and 39% respondents saying they are likely to spend less on these categories
this Ramadan. The only
area that is likely to see an uptick in spending is charity as two in five
UAE residents (40%) plan to spend more than usual on donations this year. (YouGov
MENA) April 6,
2021 Source: https://mena.yougov.com/en/news/2021/04/06/nearly-half-uae-residents-plan-engage-charity-duri/ 685-43-24/Country Profile:
SUMMARY
OF POLLS
ASIA
685-43-01/Poll Six Out Of
Ten (57%) Indians Said They Are Now Ready To Take The Shot Compared To A
Third (33%) Who Said This In January
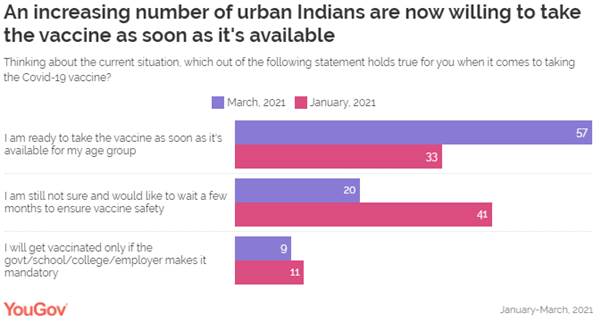
As India expands its vaccination drive to
ensure more people are inoculated, YouGov’s latest research reveals that
intent to take the Covid-19 vaccination has improved since January when we
first questioned respondents about this. Six out of ten (57%) respondents
said they are now ready to take the shot compared to a third (33%) who said
this in January.
Hesitancy around taking a shot also seems
to be on the decline- as now only 20% say they will wait for a few months
before taking a jab as compared to 41% who said this earlier. The willingness to take the jab could be
because of the public’s confidence in the government’s handling of the
vaccine rollouts up until now. More than eight in ten (83%) respondents think
favourably about the way the government has been carrying out the vaccination
drive so far. Only 13% felt it has been tackled badly. At present, only one in sixteen urban
Indians (6%) said they do not want to be vaccinated at all, with adults
between 18-29 years being most likely to say this as compared to the rest. Some recent media reports have labelled
young adults as super spreaders, highlighting how many more of them are
contracting the virus in the second phase of the pandemic. Despite the
growing cases among this cohort, reluctance to take the jab is most common
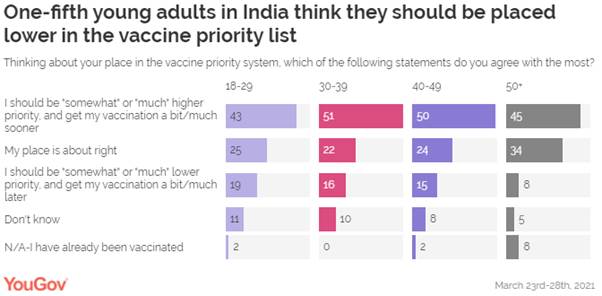
within this age group as compared to the rest. YouGov’s data indicates when it comes to
their place in the vaccine priority system, one in five (19%) young adults
between 18-29 years agree they should be placed lower on the priority list
and must get their shot later than others.
Although 43% of them believe they should be
higher up in the priority list, it is still lower than the proportion of
respondents belonging to age groups 30-39 years and 40-49 years who hold the
same view about their current place in the vaccine priority system (51% and
50% respectively). The government’s recent decision to expand
the eligibility criteria to include everyone above the age of 45 brings good
news for these respondents who are now placed higher up on the priority list. Out of the ones who feel content with their
place in the system, a higher proportion belongs to older people aged 50 and
above. Looking at the employment status,
respondents with part-time (58%) or full-time jobs (51%) are more likely to
believe they should be higher on the priority list than the ones who are not
employed (42%). Although India is yet to allow people under
the age of 45 to get vaccinated, some health experts and state governments
suggested vaccinating younger people between 18-45 years who are more
vulnerable to infections due to travel for work or leisure. When asked about
this proposition, more than three-fourth (77%) of urban Indians agreed to the
idea of inoculating young people. However, agreement was lower among
18-29-year-olds (at 71%) as compared to their older counterparts:
30-39-year-olds (79%) and 40-49 years (81%). (YouGov India) April 6, 2021 Source: https://in.yougov.com/en-hi/news/2021/04/06/increasing-number-urban-indians-are-ready-take-cov/ 685-43-02/Poll YouGov
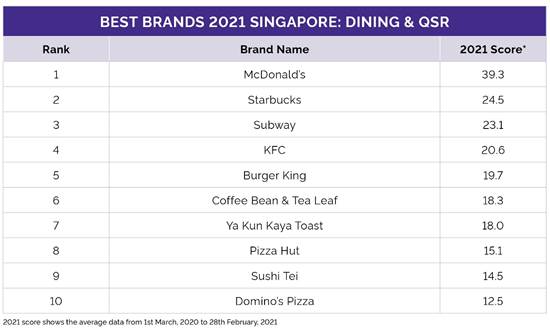
Dining & QSR Rankings 2021 Singapore
COVID has made 2020 one of the most
challenging period for restaurants. Due to various dining restrictions and
safety concern, consumers tend to eat out less frequently. To maintain
businesses, many restaurants have taken measures like shifting their business
to home delivery, or offering discounts for take-away customers. In view of this, YouGov has examined the
public perception of restaurants’ performance in the past 12 months and
ranked the best-performing dining and quick-service restaurant (QSR) brands
with the launch of YouGov APAC Dining
& QSR Rankings 2021! The rankings data is drawn from our daily
brand tracking tool BrandIndex, which measures the public’s perception of
thousands of brands every day across 40 sectors. Check out the below rankings to see which
dining and QSR brands have made the top 10 and top 10 improvers list in
Singapore! Best Brands 2021 Singapore: Dining &
QSR
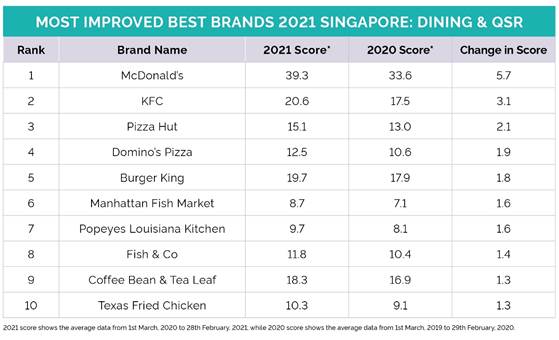
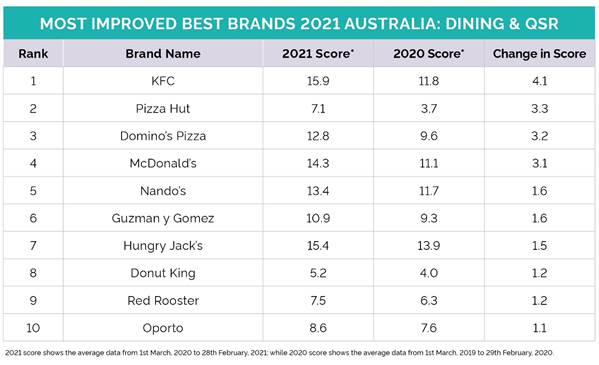
Most Improved Best Brands 2021 Singapore:
Dining & QSR
(YouGov Singapore) April 7, 2021 Source: https://sg.yougov.com/en-sg/news/2021/04/07/yougov-dining-qsr-rankings-2021-singapore/ MENA
685-43-03/Poll Nearly Half (46%)
Of UAE Residents Plan To Engage In Charity During Ramadan This Year
Nearly half of UAE residents who look
forward to Ramadan this year (46%) intend to celebrate the festival by giving
to charity. Among all the respondents, Arab expats and married respondents
with children were most likely to choose this as their preferred way of
celebrating the festival amidst the pandemic (at 56% and 53%, respectively). Almost as many as those who intend to make
monetary contributions plan to donate food/ essentials to the needy (43%),
although the government has now urged the public to pay zakat and/or any
donations digitally. The survey was conducted before the
guidelines came into force but it is worth bearing in mind what people would
have liked to do during Ramadan in the absence of restrictions. As per the new guidelines around Ramadan,
home visits and family gatherings are banned in the UAE, with families
encouraged to gather online instead. Keeping in mind the current situation,
almost a third (31%) intend to celebrate the festival online with their loved
ones.
Although many residents look forward to
celebrating Iftar at home with their immediate family (44%), a quarter said
they were planning to celebrate Iftars with extended family (25%), a plan
that may have to wait for Ramadan 2022 given current restrictions. Slightly over a third (36%) would like to
offer prayers at the mosque, which is currently allowed with some restraints. Females as compared to their male
counterparts were more keen to gather for Iftar (51% vs 41%). Men on the
other hand were more likely to offer prayers at the mosque (40% vs 27%). Even though there are fewer restrictions on
shops and restaurants staying open, few plan to go shopping or eat at food
courts or restaurants during Ramadan (21% and 16% respectively). Travelling
to one’s hometown (12%) is not commonly considered by UAE residents this
year. In 2020, as Ramadan coincided with the
spread of the pandemic, people stayed inside and spent a lot of time online.
Fortunately, this year the market has opened up, giving an opportunity to
business owners to revive sales. When asked how their spending pattern is
likely to change this Ramadan compared to the pre-pandemic years, UAE
residents claimed it is unlikely to change across most of the listed
categories. This is especially true for spending on data plan/ internet,
where 52% of the respondents said they will spend the same amount of money as
they were before the pandemic hit the country.
Similarly, residents’ spending on food
& beverage (51%) and medicines (50%) is also likely to remain the same as
before. Household appliances is a category where consumers are evenly split,
with 38% saying they will spend the same amount of money on these products
but 35% intend to spend less on this category this year. Purchase of fashion and electronic
products/ gadgets is likely to take a hit- with 43% and 39% respondents saying
they are likely to spend less on these categories this Ramadan. The only area that is likely to see an
uptick in spending is charity as two in five UAE residents (40%) plan to
spend more than usual on donations this year. (YouGov MENA) April 6, 2021 Source: https://mena.yougov.com/en/news/2021/04/06/nearly-half-uae-residents-plan-engage-charity-duri/ AFRICA
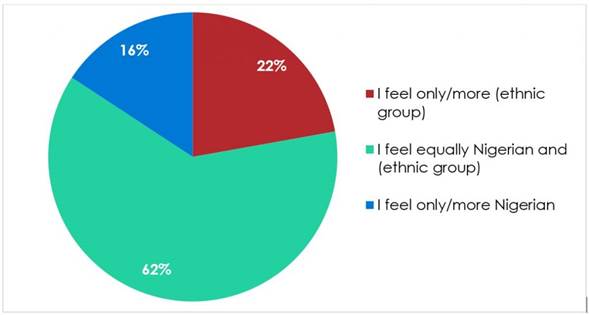
685-43-04/Poll Two-Thirds
(62%) Of Citizens Say They Feel Equally Attached To Their Nigerian Identity
And Their Ethnic Identity
A majority of Nigerians value diverse
communities, identify equally with their ethnicity and nationality, and
believe there is more that unites Nigerians as one people than divides them,
new Afrobarometer findings show. Over the years, Nigeria has witnessed
repeated ethnic and religious clashes. But the survey shows that nine in 10
citizens are tolerant of people from different religions, ethnic groups,
nationalities, and political parties. However, general trust in fellow citizens
is very low; most Nigerians say one “must be very careful” in dealing with
others. Key findings
Afrobarometer surveys Afrobarometer is a pan-African, nonpartisan
survey research network that provides reliable data on African experiences
and evaluations of democracy, governance, and quality of life. Seven rounds
of surveys were completed in up to 38 countries between 1999 and 2018. Round
8 surveys in 2019/2021 are planned in at least 35 countries. Afrobarometer
conducts face-to-face interviews in the language of the respondent’s choice
with nationally representative samples. The Afrobarometer team in Nigeria, led by
NOIPolls, interviewed 1,599 adult citizens of Nigeria in January-February
2020. A sample of this size yields country-level results with a margin of
error of +/-2.5 percentage points at a 95% confidence level. Previous surveys
were conducted in Nigeria in 1999, 2002, 2005, 2007, 2008, 2012, 2014, and
2017. Charts Figure 1: National vs. ethnic identity |
Nigeria | 2020
Respondents were asked: Let us suppose
that you had to choose between being a Nigerian and being a [member of
respondent’s ethnic group]. Which of the following statements best expresses
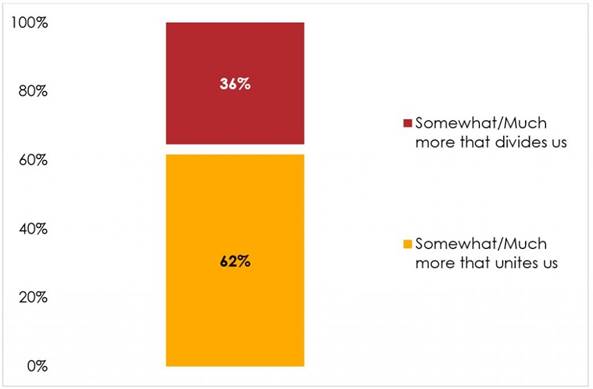
your feelings? Figure 2: More that unites or more that
divides? | Nigeria | 2020
Respondents were
asked: Nigerians
are very diverse. They come from different religions, ethnic groups,
political parties, and economic and social backgrounds. Overall, would you
say that there is more that unites all Nigerians as one people, or more that
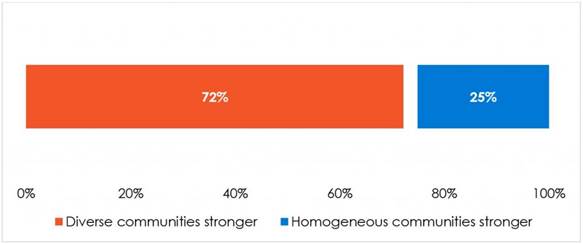
divides them? Figure 3: Does diversity make communities
stronger? | Nigeria | 2020
Respondents were asked: Which of the
following statements is closest to your view? Statement 1: Communities are stronger when
they are made up of people from different ethnic groups, races, or religions. Statement 2: Communities are stronger when
they are made up of people who are similar to each other, that is, people
from the same ethnic group, race, or religion. (% who “agree” or “agree very strongly”
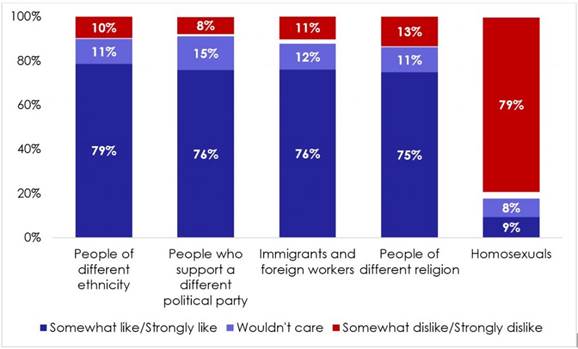
with each statement) Figure 4: Tolerance for others | Nigeria |
2020
Respondents were
asked: For
each of the following types of people, please tell me whether you would like
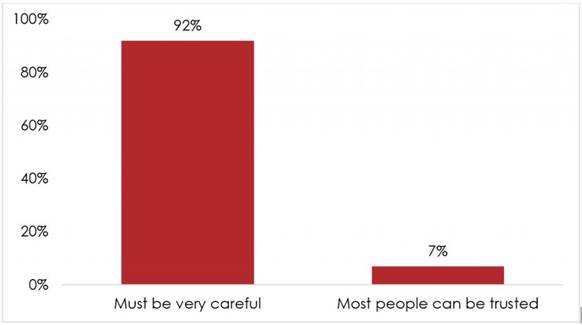
having people from this group as neighbours, dislike it, or not care. Figure 5: Can most people be trusted? |
Nigeria | 2020
Respondents were
asked: Generally
speaking, would you say that most people can be trusted or that you must be
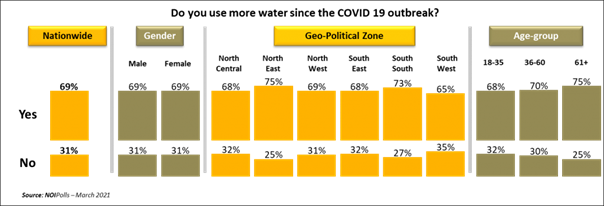
very careful in dealing with people? (NOI Polls) April 8, 2021 685-43-05/Poll More Than 6
in 10 Nigerians Still Have Challenge In Access Water
In commemoration of World Water Day, which
holds on the 22nd of March annually, NOIPolls conducted a new
public opinion poll on access to water. The poll explored the accessibility
of water to Nigerians, the treatment of drinking water and challenges faced
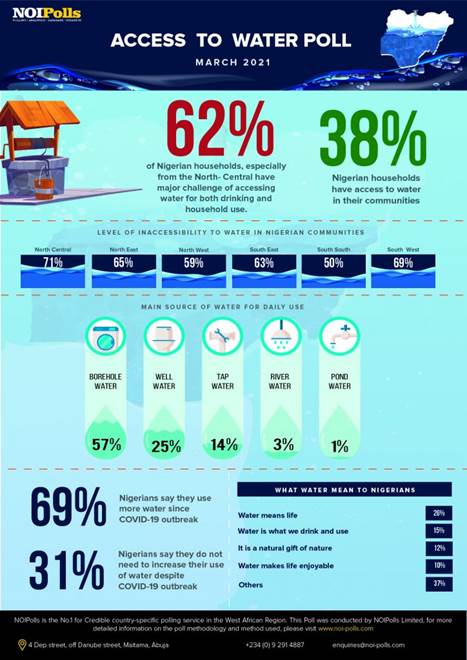
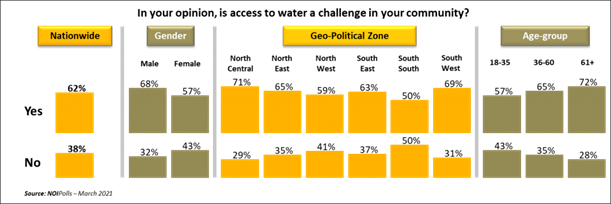
in accessing water. The poll revealed that 62 percent of
Nigerian households especially Nigerians from the North-Central zone reported
that access to water (both for drinking and household use) is still a major
challenge to them. It is important to state that it is the responsibility of
the Federal, State and Local Government to supply water to Nigerians. For
instance, the Local Government is responsible for rural water supply, the
State Government is responsibly for urban water supply while the Federal
Government is in charge of water resource management. More finding from the poll revealed that
borehole (57 percent) and well water (25 percent) are the primary sources of
water for Nigerians for domestic use. According to the WHO/UNICEF Joint
Monitoring Programme (JMP), this source of water supply is mainly classified
as an improved source of water supply.[1] Also, a significant proportion of
Nigerians (56 percent) identified sachet water, popularly known as ‘Pure
water’ as the major source of drinking water in their homes. While this
source of drinking water might be affordable and easily accessible to
Nigerians, its hygiene and quality has been questioned by the National Agency
for Food and Drug Administration and Control (NAFDAC) especially due to the
process of packaging. This has led to the closure of several sachet water
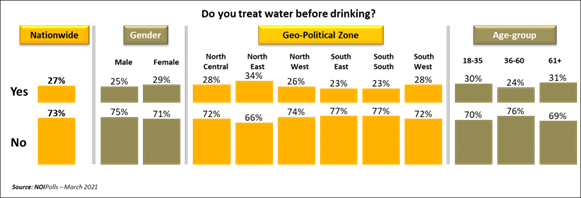
factories by NAFDAC in the past.[2] Subsequently, the poll further revealed
that 73 percent of Nigerians do not treat their water in any form before
drinking regardless of the source. However, 27 percent who treat their water
before drinking it mostly adopt boiling (54 percent) the water as a method of
purification. According to the World Bank, accessing clean water is a major
factor in reducing child mortality. In Nigeria, about 60, 000 children under
the age of five die each year from diseases caused by poor levels of access
to water, sanitation and hygiene. It is interesting to note that 69 percent
of Nigerians reported that they use more water since the outbreak of COVID-19
in Nigeria. While 15 percent stated that they use more water because more
household member stay at home at the same time, 6 percent mentioned that they
use more water specifically to wash their hands in line with COVID-19
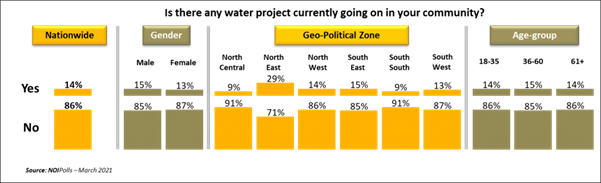
preventive guidelines. With regards to ongoing water projects, a
larger proportion of Nigerians (86 percent) disclosed that there are no water
projects currently being implemented in their various communities. Therefore,
in order to meet the 6th Goal of the Sustainable Development
Goals (SDG), which is to ensure access to water and sanitation for all,
government at all levels needs to urgently work towards the provision of
improved quality of water and water sources to the citizenry. For instance,
the three tiers of government, stakeholders and international support
agencies should synergize their plans and strategies to ensure that all
Nigerians have access to clean potable water in their homes by reviving all
water boards across all states in the country and resuscitating dormant water
plants. These are the key highlights from the Access To Water Poll conducted
in the week commencing March, 15th 2021. Survey Background The World Water Day is a day set aside by
the United Nations to commemorate the importance of freshwater to inhabitants
of the world and to also identify challenges experienced by people around the
world regarding access to water. The Day is held on 22nd March
every year since 1993 when it was first observed. One of the importance of
the world water day is to raise awareness of the 2.2 billion people all
around the world living without water with the view of finding viable ways of
providing water to these inhabitants of the world. Additionally, the core
focus of the World Water Day is to focus on to the support of the achievement
of sustainable development Goal 6: “Water and sanitation for all by 2030”. It
is worthy of note also to state that 1 in 3 people in the world live without
drinking water and by 2050, it is estimated by the UN that 5.7 billion people
could be living in areas where water is scarce for at least one month a year[3]. The theme for this year 2021 is “valuing water” in which the global
body seek to underscore the value of water to everyone. It can be boldly
stated that the value of water is about much more than its price-water has
enormous and complex value for our households, food, culture, health,
education, economics and the integrity of our natural environment. We can
further add that if we risk this value of water, we risk mismanaging this
finite, irreplaceable resource giving for our general and ultimate use. To
make the Day memorable, people and organizations mark World Water Day every
year by taking action to tackle the water crisis affecting people in various
ways than one. The celebration aims to create awareness of water and its
resources which are crucial for the survival of living beings on earth and
without which life on Earth becomes difficult and thereby making the Earth
Inhabitable[4]. There are various classes if water in the
world which is defined mostly by its usage and importance to people around
the world. The list is inexhaustible and as it keeps growing depending on the
newly discovered usage water can be put in to and the mode of discovery of
the type of water. They include and not limited to: tap water which is piped
water, mineral water gotten from mineral spring and full of minerals like
sulfur, magnesium and calcium. Sparkling water sometimes referred to as
carbonated or soda water, Distilled water which is gotten from boiled water
and the steam is collected and condensed into a liquid, purified water which
is usually tap or underground water which has been treated to remove harmful
substances like bacteria, fungi and parasites. Others include: flavored or
infused water, alkaline water, well water etc.[5]. Against this backdrop, NOIPolls conducted
a survey to gauge the pulse of Nigerians regarding access to water and the
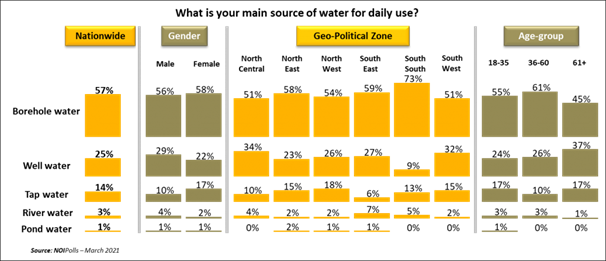
various challenges people are facing regarding water. Survey findings When asked of the main source of water for
household use, 57 percent of Nigerians disclosed that their primary source of
water for household use is borehole. The South-East zone had more respondents
who reported that their main source of water for household use is borehole.
While 25 percent of the respondents mentioned well water especially those
residing in the North-Central zone (34 percent), 14 percent said that they
use tap water for household use and this is common with Nigerians residing in
the North-West (18 percent).
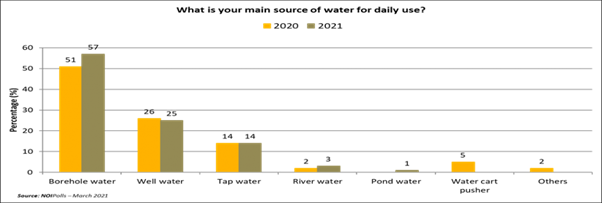
Trend analysis revealed an 6 percent
increase in the proportion of Nigerians who rely on borehole as their main
source of water for household use when current finding is compared to result
obtained in 2020.
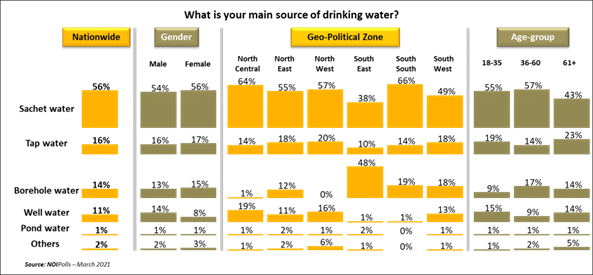
Subsequently, according to a report from
United Nations (UN) Water Global Analysis, an estimated 100 million Nigerians
still lack basic sanitation facilities and 63 million do not have access to
improved source of drinking water.[6] In line with the above report, this
poll result revealed that a major proportion of Nigerians (56 percent) rely
on Sachet water popularly known as pure water as the primary source of
drinking water. The South-West zone (68 percent) represented the larger
proportion of Nigerians who asserted to this.
It is interesting to note that 73 of the
respondents do not treat their water before drinking (except for those whose
only source of drinking water is sachet water). However, 27 percent of
respondents stated that they treat their water before drinking.
While water has an enormous and complex
value for our households, culture, health, education, economics and integrity
of our natural environment, more than two billion people live in countries
experiencing high water stress and Nigeria accounts for one of such countries
despite being blessed with surplus water resources.[7] Given the above, 62 percent of Nigerian
households reported that they have challenge in access water both for
drinking and household use and the North-Central zone (71 percent)
had more respondents who mentioned this. On the contrary, 38 percent of the
respondent indicated that they do not have challenge in accessing water.
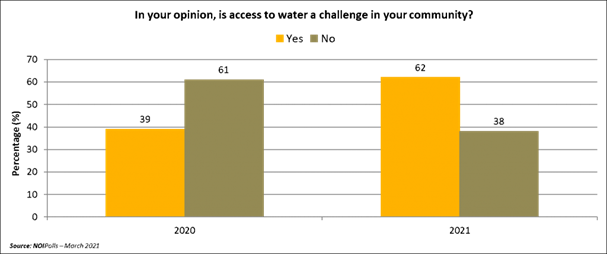
Trend analysis reveals a significant 23
percent increase in the proportion of Nigerians who affirmed having chanlenge
in accessing water in their community when current finding is compared the
result obtained in 2020.
With the rising pollution of water
resources and demand for water due to increasing population, it is imperative
that water is proved to every community is Nigeria. In line with this, is
unpleasant to note that only 14 percent of Nigerians disclosed that they are
ongoing water projects in their various communities while the vast majority
(86 percent) stated otherwise.
The devastating effects of the COVID-19
pandemic reminds every one of the importance of having access to water,
sanitation and hygiene facilities yet many people are without them.[8] In line with this, majority of
Nigerians (69 percent) indicated that they use more water since the outbreak
of COVID-19. This assertion cut across gender, geographical locations and
age-groups. However, 31 percent of respondents stated that they did not use
more water since the outbreak. Nigerians who admitted that they used more
water since the outbreak of COVID-19 in the country were further probed and
the top three reason cited are health conditions (31 percent), increased
washing (19 percent) and frequent showers/bath (17 percent). Other reasons
include increased usage because more people stay at home (17 percent) and constant
washing of hands (6 percent) amongst other reasons highlighted.
Nigerians who admitted that they used more
water since the outbreak of COVID-19 in the country were further probed and
the top three reason cited are health conditions (31 percent), increased
washing (19 percent) and frequent showers/bath (17 percent). Other reasons
include increased usage because more people stay at home (17 percent) and
constant washing of hands (6 percent) amongst other reasons highlighted. Conclusion In conclusion, the poll results have
clearly revealed that a larger proportion of Nigerians rely on sachet water
(56 percent) popularly known as pure water as their primary source of
drinking water and borehole water (57 percent) as their main source of water
for household use. This implies that access to water is still a challenge to
most Nigerians. Therefore, the right of every Nigerian to have sufficient
access to water for personal, domestic use and maintaining public health
cannot be overemphasized. The inability to access clean water leads to water
related disease such as typhoid, cholera etc. which in turn has a negative
impact on the society at large. Finally, it is great important that three
tiers government and other stakeholders ensure that water is made available
to Nigerians as 62 percent reported that access to water (both for drinking
and household use) is a challenge to their communities. (NOI Polls) April 08, 2021 WEST
EUROPE
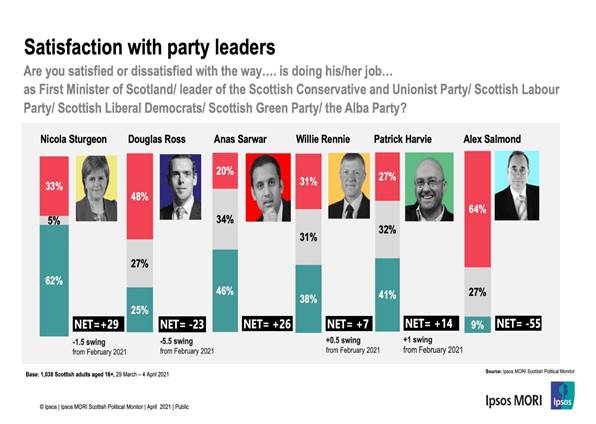
685-43-06/Poll 3% Of Voters Plan To Vote For The Alba Party On The Regional List At
The Holyrood Elections
Ipsos MORI’s Scottish Political Monitor, run in partnership with STV
News, finds support for the SNP on the constituency vote remains at very high
levels ahead of the May 2021 Scottish Parliament elections. However, the
party’s support on the regional list vote has fallen by nine percentage
points since mid-February. In contrast, support for the Scottish Green Party
on the list vote has increased since mid-February, by four percentage points.
Just three per cent of voters said they would cast their list vote for Alex
Salmond’s Alba Party. Scottish Parliament voting intention The SNP retains a strong lead in voting intention for both
constituency and list votes in next May’s Scottish Parliament elections. The
Scottish Conservatives remain in second place on both votes, with Scottish
Labour behind them in third. Support for the Scottish Green Party on the list
vote is up by four percentage points to 12%. Headline Scottish Parliament voting
intention figures for the constituency vote are:
Headline Scottish Parliament voting
intention figures for the regional vote are:
Seven in ten (72%) of SNP constituency voters say they will vote
‘both votes SNP’ by casting their regional list vote for the party as
well. The remaining 28% are most likely to say they will cast their list vote
for the Scottish Green Party (18% of SNP constituency voters say this), with a
small minority saying they will vote for Scottish Labour (4%) or the Alba
Party (4%) on the regional list. Around a third (32%) say they might change
their mind about which party they’ll cast their
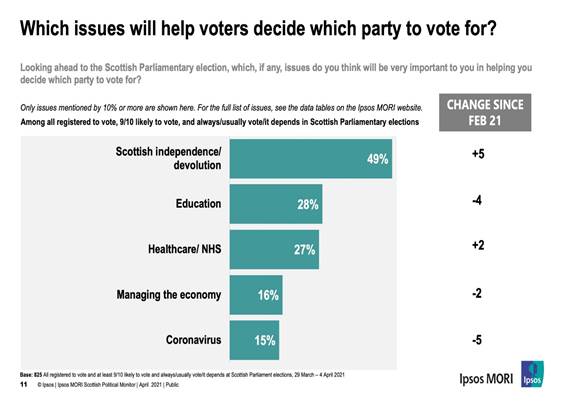
list vote for. Top issues for voters
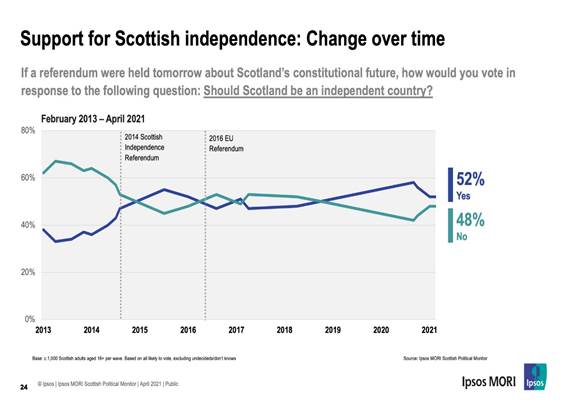
Scottish independence
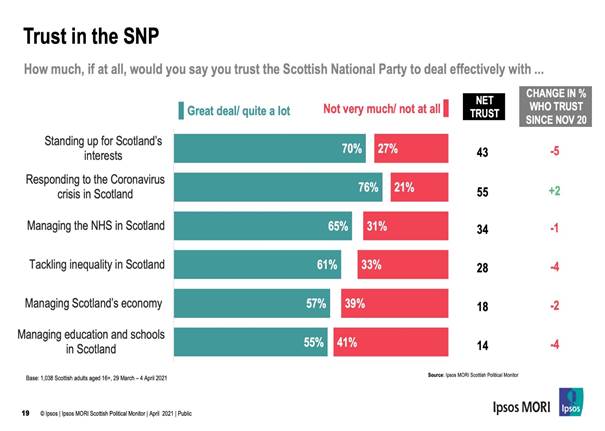
Trust in the parties
Party leaders
Emily Gray, Managing Director of Ipsos MORI
Scotland, commented: Our latest poll results suggest the SNP are
on course to win a majority of seats at Holyrood in May. Independence remains
the top issue for Scotland’s voters and an independence ‘supermajority’ at
Holyrood looks within the realms of possibility. However, our poll indicates that
this may come from an uplift in support for the Scottish Greens on the
regional vote rather than for the Alba Party. The Alba Party’s main impact to
date may have been to remind pro-independence voters of how to use their
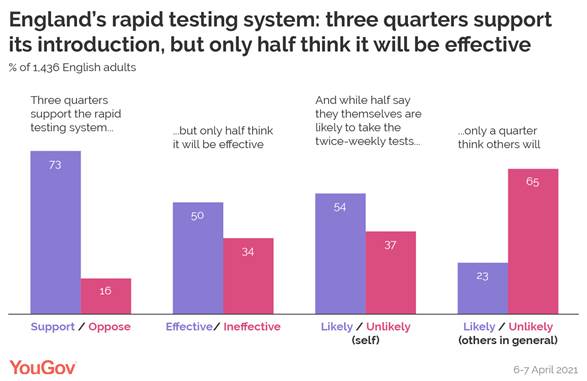
regional vote tactically. (Ipsos MORI) 7 April 2021 685-43-07/Poll Three Quarters Of English People Support Government’s Rapid Covid-19
Testing Plan
As the country starts opening back up after lockdown, the British
government will now offer two at-home rapid coronavirus tests to every adult
in England from today, with the aim to help stop the spread of coronavirus in
its tracks. New YouGov polling reveals that the policy is widely supported in
England, with just under three quarters of the English public (73%) in
favour. Labour voters are particularly likely to support the policy, at 81%,
although so too do 73% of Conservative voters. However, far fewer believe that providing access to two rapid
coronavirus tests a week will actually be effective in suppressing the spread
of COVID-19 in England, with just 10% thinking it will be very effective and
40% thinking it will be fairly effective.
A majority of adults in England say they’ll
be likely to take two rapid tests a week Just over half (54%) of adults in England say that they’d be likely
to take two rapid coronavirus tests a week, with 37% saying they’d be
unlikely to do so. Results suggested similar levels of uptake across the age
categories, and showed that women are slightly more likely to take the tests
than men (58% to 50%). Despite a majority of the English public saying they’d be likely to
take two rapid tests a week, just 23% think that English adults in general
will be likely to take two tests a week. With almost two thirds of the public
(65%) believing that English adults will be unlikely to take two rapid
coronavirus tests a week, it’s perhaps unsurprising that many are sceptical
that the policy will have much of an impact on preventing the spread of
coronavirus in England. The gap between public levels of support and how effective people
think these tests will be can at least in part be explained by the public’s
pessimistic outlook on whether other people will be likely to take the test.
Alternatively, it could be that people are overstating the likelihood that
they themselves will end up taking the tests – a
previous YouGov study showed that while Britons near-universally
claimed to be following COVID rules, the numbers didn’t square up with
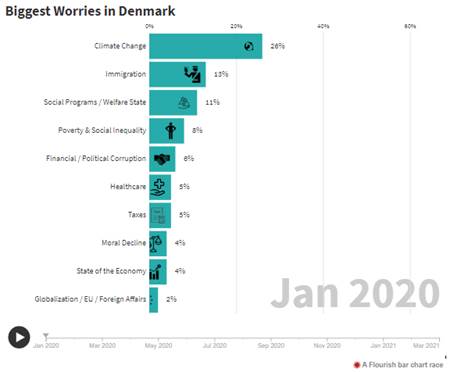
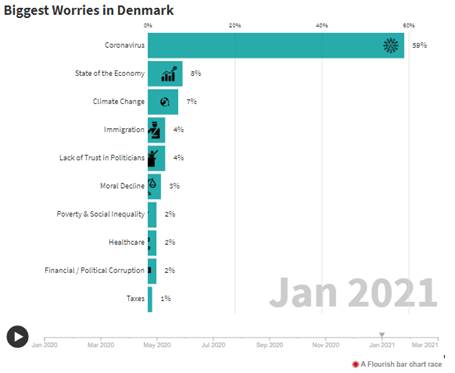
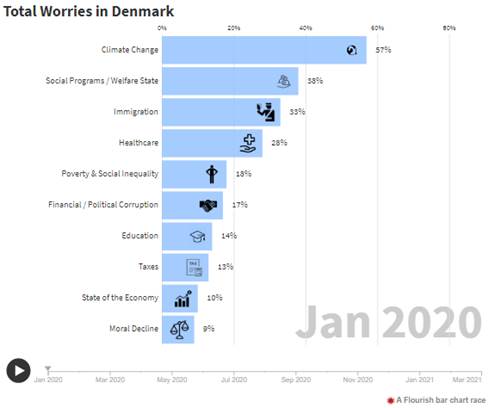
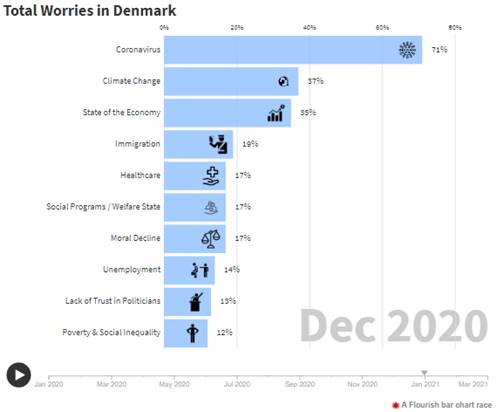
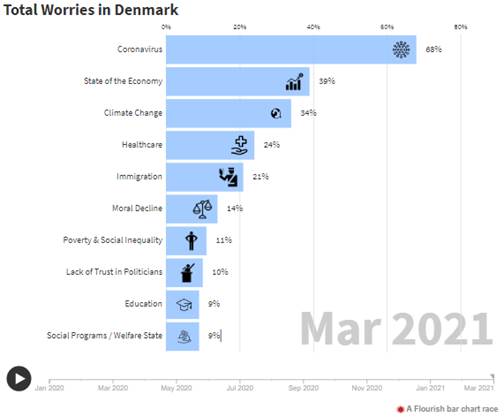
reported compliance among those in their local area. (YouGov UK) April 08, 2021 685-43-08/Poll Danes Are Particularly Worried About The Consequences Of The Lockdown
On The State Of The Economy
By initiating a Danish tracking study from February 2020, we can now
see what keeps Danes up at night and how this change over the months and
years. As another month went by, the Danes’ worries in March are very
similar to the worries in February. The COVID-19 related worries are still
high, but the worries are approximately the same in March as in February
(+0.2%). However, there is a small increase in worries related to healthcare
(+0.9%), which amongst other things are related to mental issues as well as
general health. As the country has been in a lockdown for several months now,
and only starting to open a little in March, there is a small increase in worries
related to the state of the economy (+0.8%). The Danes are particularly
worried about the consequences of the lockdown on the state of the economy.
The Biggest Worries chart refers to an
individual’s perception on the largest/most top-of-mind challenge Denmark is
dealing with today.
The Total Worries chart encompasses the
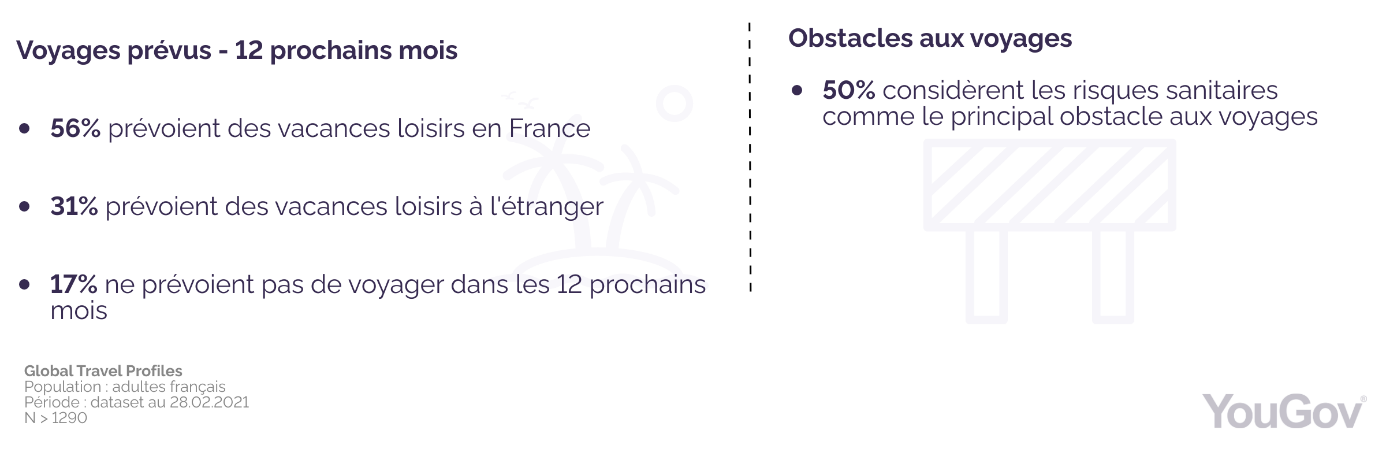
biggest worries and the respondents’ other worries combined. (Ipsos Denmark) 6 April 2021 Source: https://www.ipsos.com/en-dk/what-worries-denmark-march-2021 685-43-09/Poll More Than 56% Of French People Still Plan To Go On Vacation In The
Country, And 31% Abroad
The health situation is having an impact on French travel intentions:
at the start of 2021, nearly 2 in 10
French people plan not to travel this year. More than 56% of
French people still plan to go on vacation in the country, and 31% abroad. Note, 1 in 2 French people consider
health risks as the main obstacle to travel. Among people who intend to travel by road, air, rail or sea
transport, CSP + are over-represented. There are also more inhabitants
of large cities, and in particular those in the Paris region.
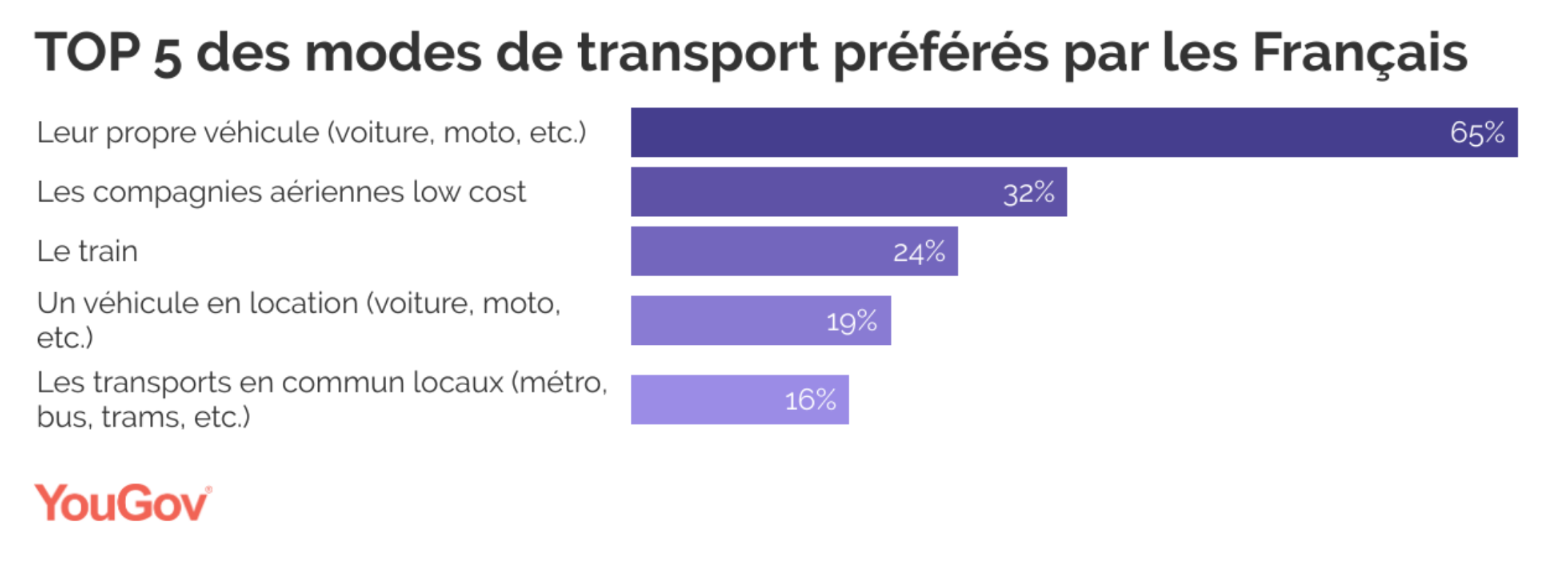
Regarding modes of transport, the
personal vehicle is by far the preferred mode of transport of the French - more than 6 in 10 French people (65%) prefer this
mode of transport. In second place are low cost airlines
(32%), followed by train (24%), rental vehicles (19%) and local public
transport (16%).
(YouGov France) April 9, 2021 Source: https://fr.yougov.com/news/2021/04/09/les-francais-et-le-voyage-quels-sont-leurs-intenti/ 685-43-10/Poll 29 Percent Of Germans Heard The Radio Plays "Drei " In
Their Childhood
Podcasts are currently attracting great interest, and not just since
the beginning of the corona pandemic. But what about radio plays, in which
stories are told with distributed speaking roles, noises and
music? After all, two out of five Germans (39 percent) listen to radio
plays in their free time, 6 percent of them often. The 25 to 44 year
olds in particular listen to radio plays (48-49 percent).
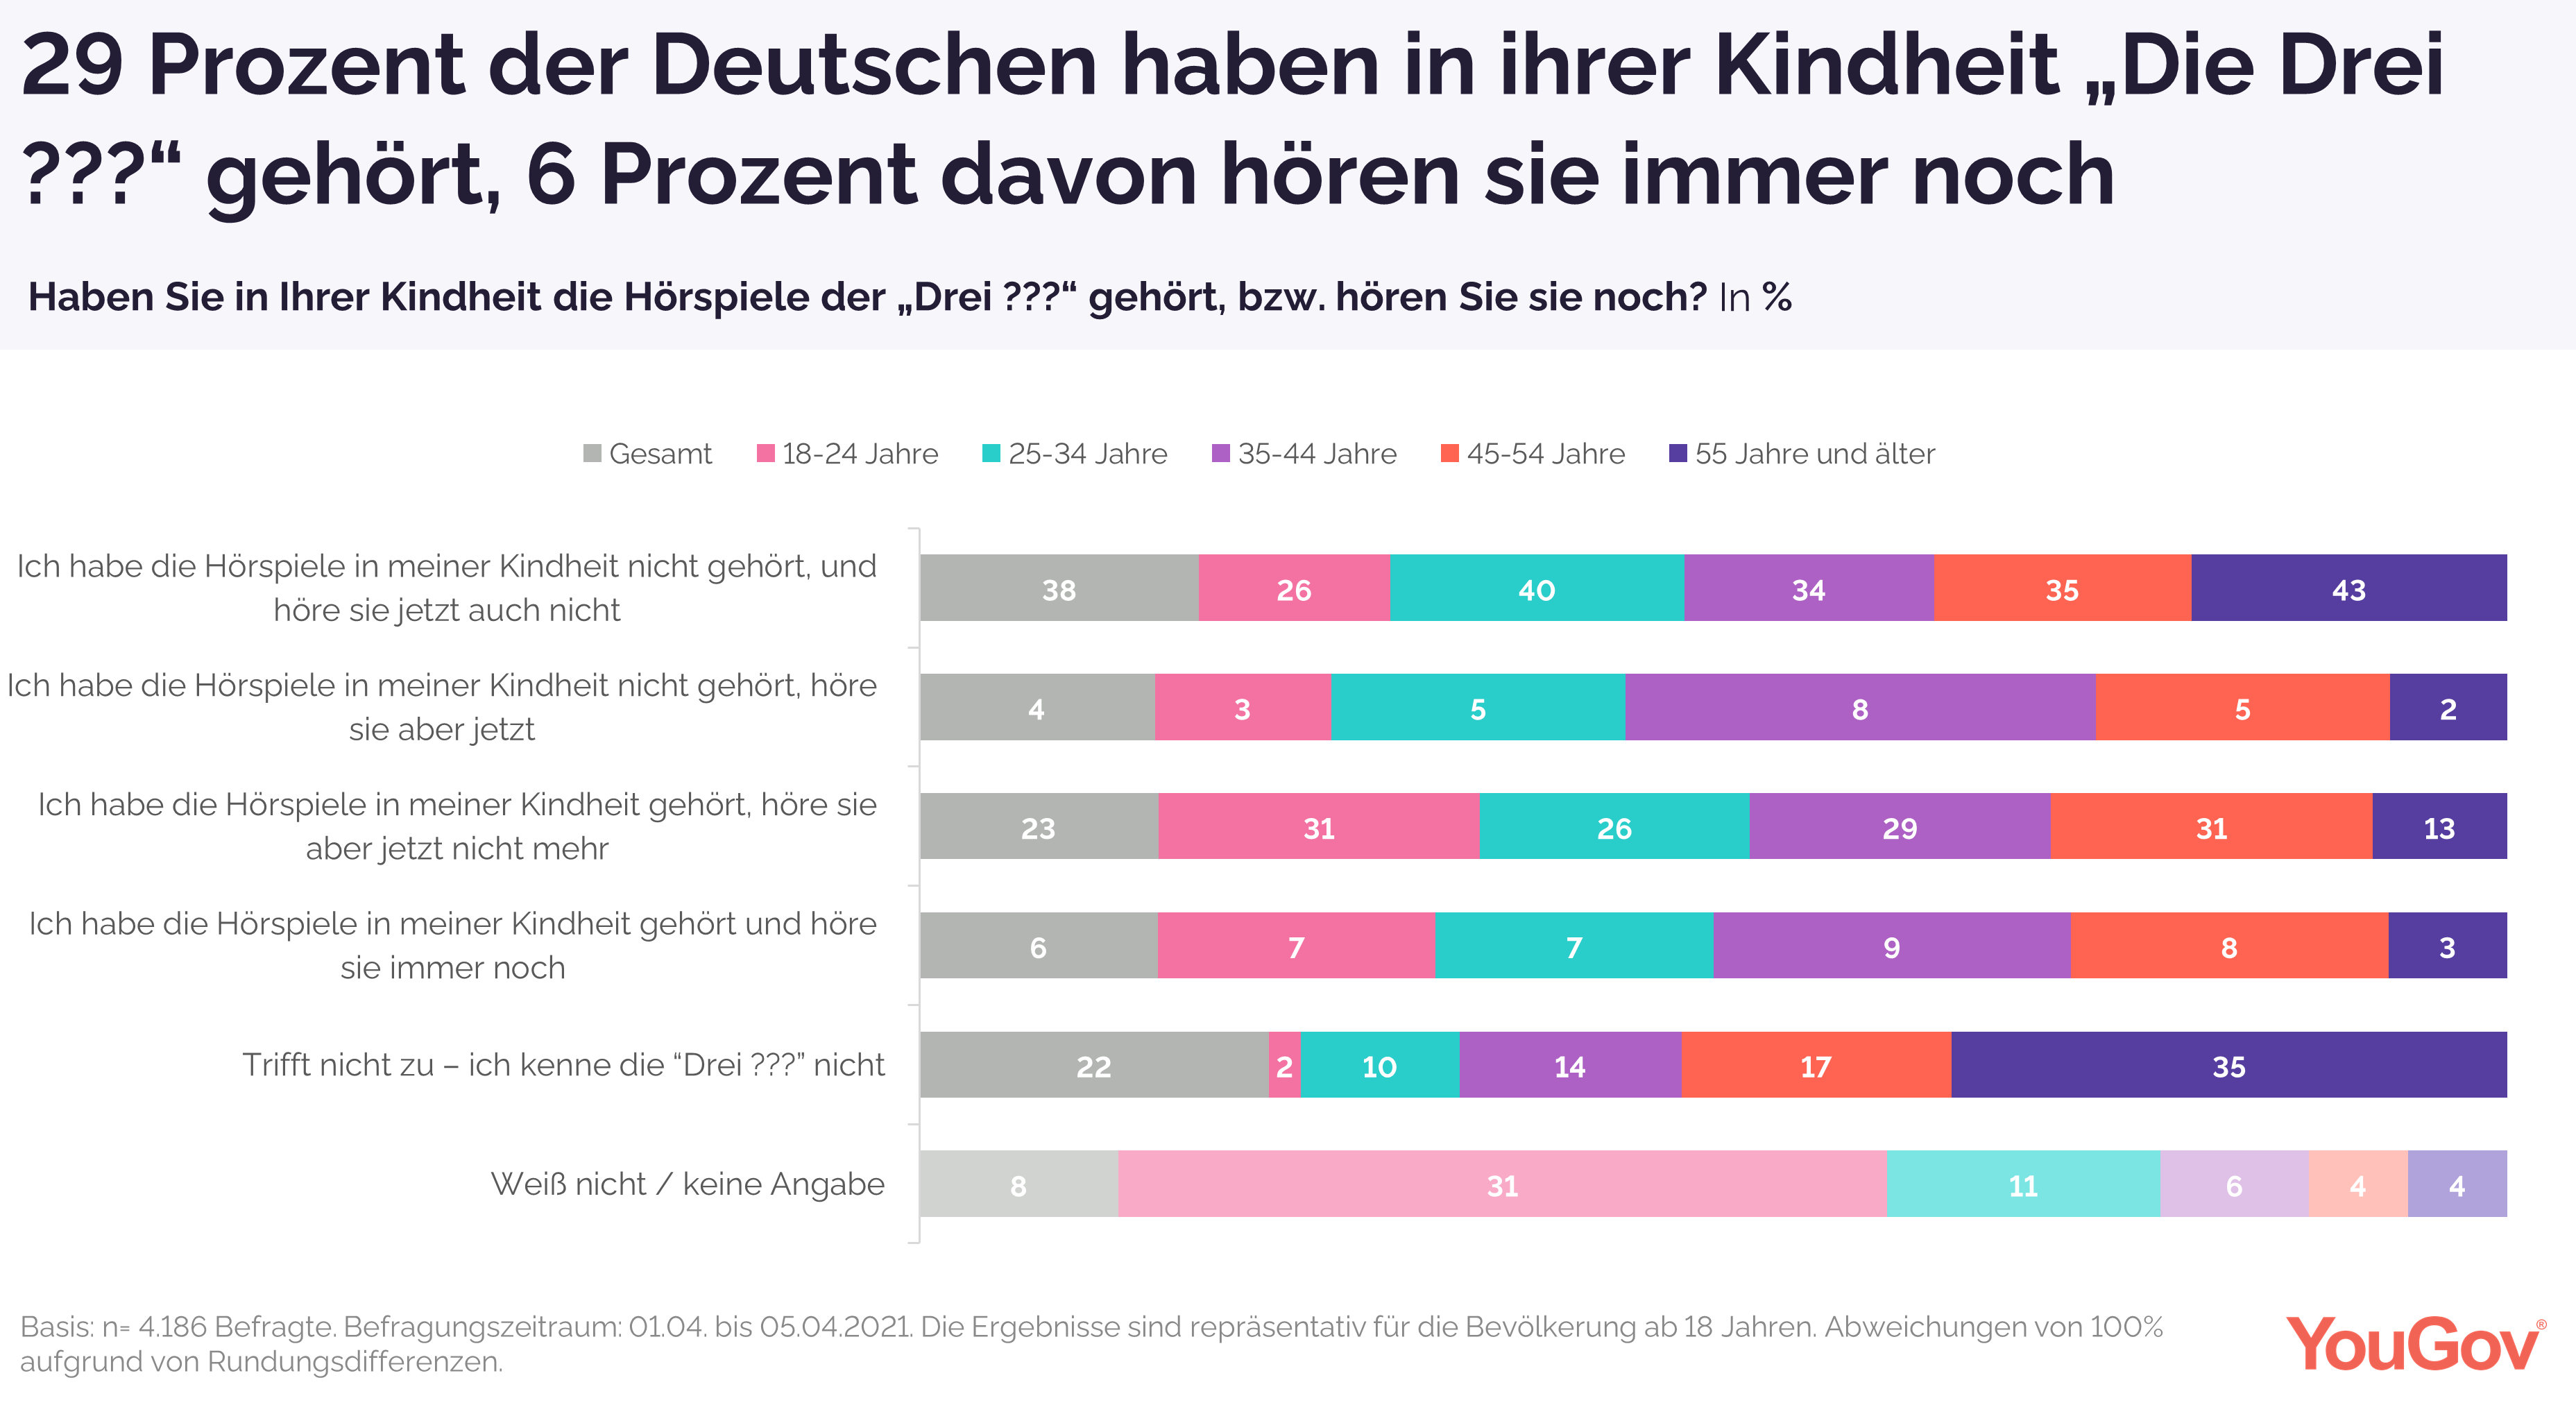
THREE OUT OF TEN HEARD “DIE DREI ???” IN
THEIR CHILDHOOD One of the most popular radio plays are "Die Drei ???", in
which three young detectives solve criminal cases. 29 percent of Germans
state that they heard this in their childhood, 6 percent of them still hear
them today. 10 percent of 18- to 24-year-olds currently hear
the stories about Justus Jonas, Peter
Shaw and Bob Andrews . The age comparison also shows
that 35 to 44-year-olds currently hear the radio play most often (17
percent), regardless of whether they did so in their childhood. 22 percent of all German respondents do not know "Die Drei
???". This is what respondents aged 55 and over say this most often
(35 percent).
(YouGov Germany) April 9, 2021 Source: https://yougov.de/news/2021/04/09/29-prozent-der-deutschen-haben-ihrer-kindheit-die-/ NORTH AMERICA
685-43-11/Poll Democrats Are More Likely Than Republicans To Say They Use Social
Media Overall (77% And 68%, Respectively)
Democrats are more likely than Republicans to say they use social
media overall (77% and 68%, respectively), according to a new Pew Research
Center survey of U.S. adults conducted Jan. 25-Feb. 8, 2021. There are also
notable differences in the shares of Democrats and Republicans who use
particular platforms.
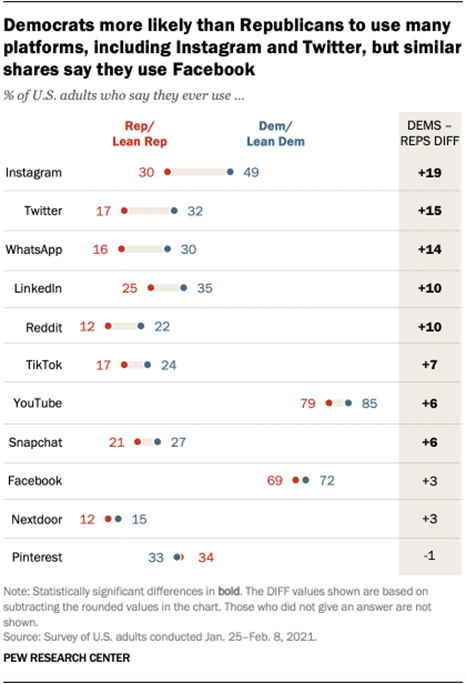
A majority of Americans on both sides of the political aisle say they
use Facebook and YouTube. Roughly seven-in-ten Democrats (72%) and
Republicans (69%) – including independents who lean toward each party – say
they ever use Facebook. And 85% of Democrats report using YouTube, compared
with a slightly smaller share of Republicans (79%). Still, for several other sites and apps measured in this survey,
there are large gaps in use by political party. For example, about half of
Democrats (49%) report using Instagram, 19 percentage points more than the
share of Republicans who say the same (30%). Democrats are
also about 10 points or more likely than Republicans to
say they ever use Twitter, WhatsApp, LinkedIn or Reddit. How we did this These patterns have mostly been consistent across recent surveys. For
example, use of Instagram, Twitter, WhatsApp, LinkedIn and Reddit was more
common among Democrats than Republicans in surveys conducted by the Center in
2019 and 2018. However, while similar shares of Democrats and Republicans now
report using Facebook, that wasn’t the case in 2018, when Democrats were more
likely to do so (74% vs. 63%). While overall social
media use is fairly widespread in the U.S. today, Americans in both
political parties have negative views about social media companies’ power, influence and policies,
previous Center surveys have shown. Social media sites have also become a
hotbed for contentious debates and harassment. Nevertheless, other Center surveys show that these sites hold appeal
for some Americans as a way to get
political news and show
their support for causes. And some social media users have changed
their views about political or social issues because of something they
saw on social media in the past year. Also, majorities in both parties say
that social media is at least somewhat effective as a way to influence
policy decisions or get elected officials to pay attention to an
issue.
As has been the case across prior
Center research on this topic, age is highly correlated with social
media use: American adults under 50 are more likely than their older
counterparts to say they use these sites overall. At the same time, younger
generations tend to be
more Democratic compared with older ones. But age differences in
social media use and party affiliation do not fully explain why Democrats are
more likely than Republicans to use some platforms. In fact, even among
younger Americans, Democrats are more likely than their Republican
counterparts to say they use seven of the 11 sites asked about in the new
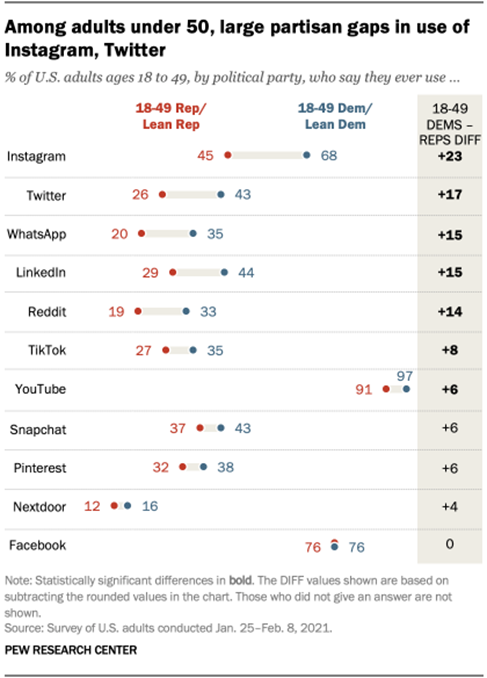
survey. This is particularly true for Instagram: About two-thirds of 18- to
49-year-old Democrats (68%) say they use the platform, compared with 45% of
Republicans in the same age group, a 23 percentage point gap. Among adults
under 50, Democrats are 17 points more likely than Republicans to report
using Twitter (43% vs. 26%). Democrats ages 18 to 49 are again more likely than Republicans in the
same age group to report using WhatsApp, LinkedIn or Reddit. They are also
more likely than their GOP counterparts to say they use TikTok or YouTube,
though by smaller margins. Among adults 50 and older, Democrats are more likely than Republicans
to use Instagram (28% vs. 15%), WhatsApp (23% vs. 11%), Twitter (18% vs. 9%)
or Snapchat (10% vs. 5%). But there are no partisan differences in older
adults’ use of other platforms, including LinkedIn, Reddit, TikTok,
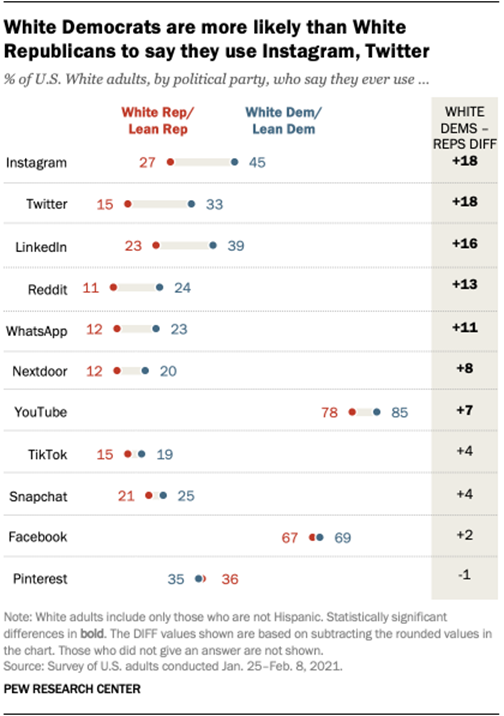
Pinterest, YouTube, Facebook and Nextdoor. Among White adults, social media use also
differs by party Apart from partisan differences in social media use within different
age groups, there are also noteworthy partisan differences among White
adults. (There were not enough Black, Hispanic or Asian respondents in the
sample to analyze findings for each group by party.)
White Democrats are 18 percentage points more likely than White
Republicans to say they ever use Instagram or Twitter. They are also about 10
points or more likely to say they ever use LinkedIn, Reddit or WhatsApp.
While the differences are not as large, White Democrats are more likely than
White Republicans to say they use Nextdoor and YouTube, too. While there are partisan differences overall and within each age
group for Snapchat use, this gap does not appear when looking at White
Republicans and Democrats. In addition, similar shares of both White
Democrats and Republicans use TikTok, Facebook and Pinterest. (PEW) APRIL 7, 2021 685-43-12/Poll Confronting 2016 And 2020 Polling Limitations
The 2016 and 2020 elections raised questions about the state of
public opinion polling. Some of the criticism was premature or overheated,
considering that polling ultimately got key contours of the 2020 election
correct (e.g., the Electoral College and national popular vote winner;
Democrats taking control of the Senate). But the consistency with which most
poll results differed from those election outcomes is undeniable. Looking at
final estimates of the outcome of the 2020 U.S. presidential race, 93% of
national polls overstated the Democratic candidate’s support among voters, while
nearly as many (88%) did so in 2016.1
A forthcoming report from the American Association for Public Opinion
Research (AAPOR) will offer a comprehensive, industry-wide look at the
performance of preelection polls in 2020. But individual polling
organizations are also working to understand why polls have underestimated
GOP support and what adjustments may be in order. Pew Research Center is among the organizations examining its survey
processes. The Center does
not predict election results, nor does it apply the likely voter modeling
needed to facilitate such predictions. Instead our focus is public opinion
broadly defined, among nonvoters and voters alike and mostly on topics other
than elections. Even so, presidential elections and how polls fare in
covering them can be informative. As an analysis discussed,
if recent election polling problems stem from flawed likely voter models,
then non-election polls may be fine. If, however, the problem is fewer
Republicans (or certain
types of Republicans) participating in surveys, that could have
implications for the field more broadly. This report summarizes new research into the data quality of Pew
Research Center’s U.S. polling. It builds on prior studies that
have benchmarked the
Center’s data against authoritative estimates for nonelectoral topics like
smoking rates, employment rates or health care coverage. As context, the
Center conducts surveys using its online panel, the American
Trends Panel (ATP). The ATP is recruited offline via random national
sampling of residential addresses. Each survey is statistically adjusted to
match national estimates for political party identification and registered
voter status in addition to demographics and other benchmarks.2 The
analysis in this report probes whether the ATP is in any way
underrepresenting Republicans, either by recruiting too few into the panel or
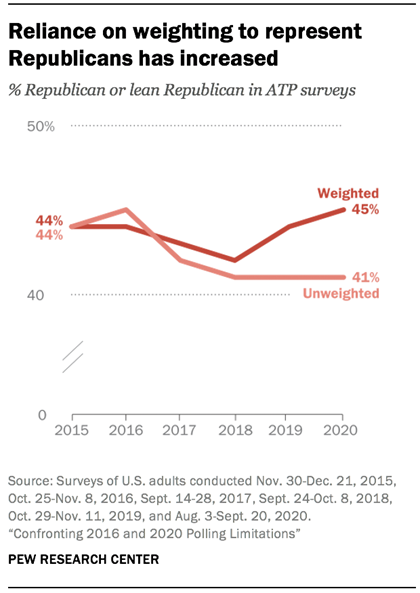
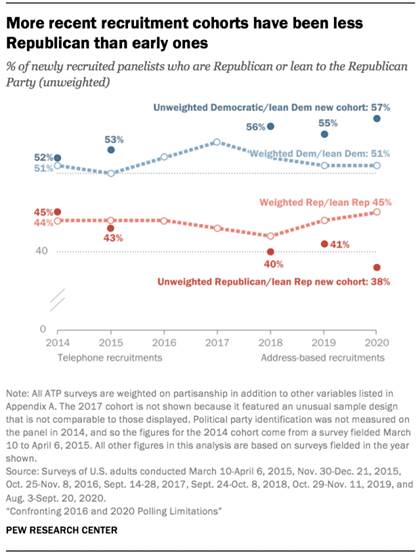
by losing Republicans at a higher rate. Among the key findings: Adults joining the ATP in recent years are
less Republican than those joining in earlier years. The
raw, unweighted share of new ATP recruits identifying as Republican or
leaning Republican was 45% in 2015, 40% in the 2018 and 38% in the 2020. This
trend could reflect real-world change in participation (i.e., Republicans are
increasingly resistant to polling) or real-world change in party affiliation
(i.e., that there is a decline in the share of the public identifying as
Republican), but it might also reflect methodological changes over time in
how the ATP is recruited. Switching from
telephone-based recruitment to address-based recruitment in 2018 may have
been a factor. Regardless of the cause(s), more weighting correction was
needed in 2020 than 2014 (when the panel was created) to make sure that
Republicans and Democrats were represented proportional to their estimated
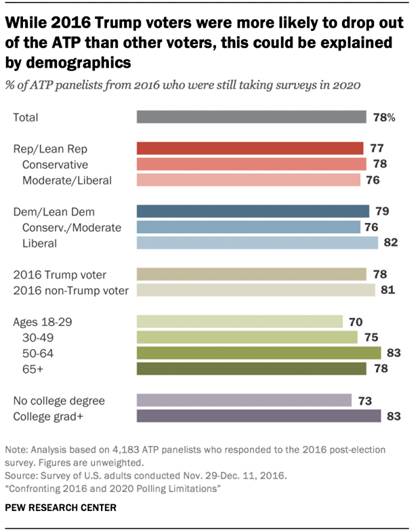
share of the population.3 Donald Trump voters were somewhat more
likely than others to leave the panel (stop taking surveys) since 2016,
though this is explained by their demographics. The
overall retention rate of panelists on the ATP is quite high, as 78% of
respondents in 2016 were still taking surveys in 2020. But a higher share of
2016 Trump voters (22%) than Hillary Clinton or third-party voters (19%)
stopped participating in the ATP during the subsequent four years. The
demographic make-up of 2016 Trump voters basically explains this difference.
In analysis controlling for voters’ age, race and education level,
presidential vote preference does not help predict whether later they decided
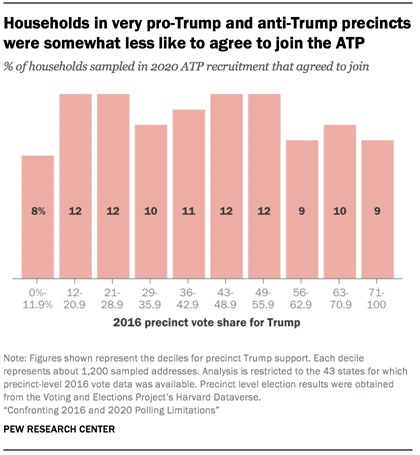
to leave the panel. People living in the country’s most and
least pro-Trump areas were somewhat less likely than others to join the panel
in 2020. Researchers cannot know for sure
whether someone is a Republican or Democrat based simply on their address,
but election results in their voting precinct provide some insight. Analysis
of addresses sampled for panel recruitment in 2020 found that households in
the country’s most pro- and most
anti-Trump areas were somewhat less likely to join the ATP than households in
more politically balanced areas. The share of sampled households joining the
ATP was 9% in the country’s most pro-Trump precincts, 8% in the country’s
most anti-Trump precincts, and 11% in the remainder of the country. While these
differences are not large, they are statistically significant. Taken together, these findings suggest that achieving proper
representation of Republicans is more difficult than it used to be. Survey
participation has long been linked to individuals’ levels of education and
social trust. Now that the GOP is doing better attracting voters with lower
levels of education and, according to some analysts,
doing better than in the past attracting low trust adults, Republican
participation in surveys is waning, increasing reliance on weighting as a
corrective. One silver lining is that these effects do not appear to be
particularly large, at least at present on the ATP. The differences between
Republicans’ and Democrats’ rates of ATP participation tend to be a
percentage point or two, only marginally significant in statistical testing.
It seems possible for pollsters to close the gap – to increase Republicans’
participation to be more on par with Democrats – by modifying the way surveys
are conducted. Based on this research, Pew Research Center is implementing a
number of new strategies to improve the representation of its survey
panel.
One question raised by this multifaceted strategy is whether it might
overcorrect for the initial challenge and result in an overrepresentation of
Republicans. While that is a possibility, we feel that the risks from too
little action are greater. The Center’s analysis pointed to two issues:
partisan differences in willingness to join the ATP and in likelihood of
dropping out of the panel. In turn, the panel weighting was needing to do an
inordinate amount of work to compensate for differences between the panel and
the U.S. adult population. The action plan described above speaks to both
issues, but only with an eye toward truing things up, not blindly going
beyond. Several of the steps are exploratory, determining if and how a design
change might improve the panel. Depending on the testing results, such steps
(e.g., offering inbound IVR as a supplemental mode) may or may not ultimately
be implemented on the ATP. Moreover, steps such as exploring an offline
response mode or modifying recruitment materials are expected to improve
representation among several harder to reach segments of society, not simply
supporters of one candidate. A final question is whether such actions are necessary. Indeed, a
recent Center analysis found
that errors in election estimates of the magnitude seen in the 2020 election
have very minor consequences for attitudinal, mass opinion estimates (e.g.,
views on a government guarantee of health care or perceptions of the impact
of immigrants on the country). That simulation-based analysis, while helpful
for scoping the scale of the issue, does not speak to the erosion of trust in
polling and certainly doesn’t negate pollsters’ obligation to make their
surveys as accurate as possible. Even if the steps outlined above yield
relatively small effects, we expect that they will improve the data quality
in Center surveys. Testing for partisan differences in survey
panel recruitment The first step in selecting adults for Center surveys is drawing a
random, national sample of residential addresses. We mail these addresses and
ask a randomly selected adult to join our survey panel. One way that a
partisan imbalance could emerge is if Republicans are less likely than
Democrats to agree to join, or vice versa. Determining whether this is
happening is difficult because the ideal data do not exist. Our surveys
sample from all U.S. adults, and there is no database to tell us whether the
adults we asked to join favor one party or another.
We can, however, answer this question for the people we asked to join
who are registered to vote and live
a state that records party registration. Researchers took the 16,001
addresses sampled in 2020 for recruitment and matched them to a national
registered voter file. This matching yielded 23,503 registered voter records.
Some 42% of those voter records were registered with a political party. This
analysis finds no clear indication that people’s likelihood of joining the
panel is related to partisanship. The share of registered Republicans at
addresses we sampled who agreed to join the ATP (12%) was not statistically
different from the share of registered Democrats who agreed to join
(13%). A different approach yielded a more discernable pattern. The
alternate approach involved looking at the community in which people live –
specifically whether it is a pro-Trump area or not – to make inferences about
the people asked to join the panel. Researchers did this by looking at
precinct-level voting data. At the time of this analysis, only data from the
2016 election was available. Researchers analyzed what share of the
precinct’s voters backed Donald Trump in 2016 and looked to see if there was
a relationship with willingness to join the ATP. Overall, the relationship is fairly noisy. Willingness to join the
ATP does not consistently increase or decrease as precincts get progressively
more supportive of Trump. That said, there is some indication that
willingness to join the panel is slightly lower at both extremes. In the most
pro-Trump areas – precincts across the U.S. with the highest Trump vote share
– 9% of sampled households agreed to join the panel. In the most anti-Trump
areas – precincts with the lowest Trump vote share – 8% of sampled households
agreed to join the panel. In the rest of the country 11% of sampled
households agreed to join the panel.5 In analysis controlling for local levels of wealth, education, and
racial composition, the electoral support for Trump remains a negative predictor
(albeit a modest one) of a household’s likelihood of joining the ATP.6 On
balance, these analyses suggest that Trump supporters may be slightly less
likely than others to join the ATP. Testing for partisan differences in
dropping out of the panel
Another way that a partisan imbalance could emerge is if Republicans
are more likely to drop out of the panel than Democrats, or vice versa. There
are several reasons why people drop out of survey panels, including becoming
too busy or disinterested, changing contact information and losing touch,
incapacitation, death, or removal by panel management. On the ATP most
dropout is from panelist inactivity (i.e., not responding to several
consecutive surveys) eventually leading to their removal. As a starting point, researchers examined panelists who completed the
2016 post-election survey,
which attempted to interview the entire panel. Researchers determined which
of these panelists from 2016 were still taking surveys fours year later in
2020. The majority of the 2016 panelists (78%) remained active in 2020, while
22% had dropped out. Panelists who said they voted for Trump in 2016 were
somewhat more likely to drop out of the panel than those who voted for
another candidate (22% versus 19%, respectively). This result, while based on
just one panel, lends some support to the notion that Trump supporters have
become slightly less willing to participate in surveys in recent years. Dropout rates varied across other dimensions as well. For example,
panelists who in 2016 were younger and had lower levels of formal education
were more likely to drop out of the panel than others. In fact, when
controlling for a panelist’s age and education level, Trump voters were not
significantly more likely to leave the panel than other voters. In other
words, the higher dropout rate among Trump supporters is likely explained by
their demographic characteristics. Evaluating the composition of the panel Another way researchers evaluated the ATP was to look at the overall
shares of Republicans and Democrats and determine if those shares were
correct. This simple question is extremely difficult to answer, for several
reasons:
Keeping these limitations in mind, researchers analyzed the partisan
composition of the ATP over time, by recruitment cohort. Since the ATP was
created in 2014, the Center has usually, though not always, fielded an annual
recruitment to add new panelists. The size and design of the recruitment has
changed over time. Notably, starting in 2018, the recruitment switched to
address-based sampling (ABS) instead telephone random digit dial (RDD). The analysis found that the recruitment cohorts generally have been
getting less Republican over time. The raw, unweighted share of new ATP
recruits identifying as Republican or leaning Republican was 45% in 2015, 40%
in 2018 and 38% in 2020. The forces behind that trend are not
entirely clear, as there are at least three potential explanations. The methodological change in 2018 from using RDD to ABS to recruit
panelists may have played a role. The RDD-recruited cohorts both had
proportionally more Republicans than the ABS-recruited cohorts. Another
possible explanation for the trend is that the GOP has been losing adherents
gradually over time. In other words, the unweighted ATP recruitments may
reflect a real decline in the share of adults identifying as Republican nationally.
While national demographic changes suggest that is plausible, this idea is
not supported by the Center’s or
other survey organizations’ research. For example, Pew Research Center, the
General Social Survey and Gallup all
show the share of U.S. adults identifying as Republican or leaning Republican
being generally stable since 2016. Since there is no compelling evidence that
there was a significant decline in Republican affiliation from 2014 to
2020, this explanation seems unlikely.
Another explanation could be that Republicans are increasingly
unwilling to participate in surveys. This idea would suggest that the
unweighted ATP recruitments reflect a real decline in the share of
Republicans responding to surveys or joining survey panels. This idea is not
supported by GSS or Gallup poll trends. However, it is consistent with one
prominent interpretation of polling errors in the 2016 and 2020 elections:
that they stem from certain types of Republicans not participating in polls. Whatever the cause, the newer cohorts are less Republican. This trend
has not, however, had much effect on ATP survey estimates. This is because
every ATP survey features a weighting adjustment for political affiliation.
This means that the surveys are weighted to align with the share of U.S.
adults who identify as a Democrat or Republican, based on an external source.7 The
weighted partisan balance on the ATP has been rather stable. The weighted
share of adults in ATP surveys who are Republican or lean to the Republican
Party has stayed in the 42% to 45% range for six years. While weighting helps to make ATP estimates nationally
representative, the trend in the unweighted data is a concern. The recent
increases in the size of the weighting correction on partisanship suggests
that the panel would benefit from shoring up participation among harder to
reach groups. If that is successful, then reliance on weighting will
lessen. As mentioned earlier, Pew Research Center is pursuing several
measures. The first step is adjusting the composition of the existing panel.
Researchers identified panelists belonging to overrepresented groups (e.g.,
panelists who get weighted down rather than up). A subset of this group of
panelists, which skews highly educated and collectively leans Democratic, is
being retired from the panel, meaning they will no longer be surveyed.
Details of the retirement plan are in Appendix B. Researchers are also
exploring new and potentially more effective ways to recruit adults who have
historically been difficult to empanel (which includes lower socioeconomic
status adults of all races and political views). This includes recruitment of
adults who are resistant to taking surveys online, developing new ATP
recruitment materials, and exploring an offline response mode. The impact from these modifications on ATP estimates will generally
be subtle because panel surveys have long been weighting on key dimensions
like partisanship, education, and civic and political engagement. But even
small improvements in accuracy are worth pursuing and relying less on
weighting as a corrective will make estimates more precise. (PEW) APRIL
8, 2021 Source: https://www.pewresearch.org/methods/2021/04/08/confronting-2016-and-2020-polling-limitations/ 685-43-13/Poll The Asian Population In The US Grew 81% Between 2000 And 2019
Asian
Americans recorded the fastest population growth rate among all racial and
ethnic groups in the United States between 2000 and 2019. The Asian
population in the U.S. grew 81% during that span, from roughly 10.5 million
to a record 18.9 million, according to a Pew Research Center analysis
of U.S. Census Bureau
population estimates, the
last before 2020 census figures are released. Furthermore, by 2060, the
number of U.S. Asians is projected to rise to 35.8 million, more than triple
their 2000 population. Hispanics
saw the second-fastest population growth between 2000 and 2019, followed by
Native Hawaiians and Pacific Islanders (NHPI) at 70% and 61%, respectively.
The nation’s Black population also grew during this period, albeit at a
slower rate of 20%. There was virtually no change in the White population. The
growth of the Asian American population in the U.S. comes amid reports
of discrimination and violence against
this group since the start of the coronavirus outbreak. In a Pew Research Center survey conducted
in early March 2021 – before the fatal shooting of six Asian women and two other
people in the Atlanta area on March 16 – 87% of Asian Americans said
there is a lot of or some discrimination against them in society. In a June 2020 survey, 31% of Asians reported they had been the
subject of slurs or jokes since the COVID-19 outbreak began, and 26% said
they had feared someone might threaten or physically attack them because of
their race or ethnicity. (Asian adults in both surveys were interviewed in
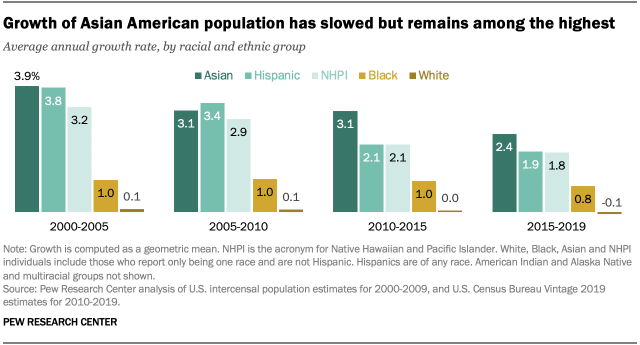
English only.) Average population growth of Asian Americans has slowed
over the past two decades The
average annual growth rate of the Asian American population in the U.S. has
slowed since 2000. From 2000 to 2005, it grew by an average of 3.9% per year.
It dropped to 3.1% per year between 2005 and 2010, remained at that level
between 2010 and 2015, and then fell to 2.4% per year between 2015 and 2019.
Despite
the slowdown, the U.S. Asian population has still had one of the
highest growth rates of any major racial and
ethnic group in most years since 2000. The exception was between
2005 and 2010, when the growth rate among Hispanic Americans slightly
outpaced than of Asian Americans (3.4% vs 3.1% per year). Asian American population grew in all states and D.C.
between 2000 and 2019 Detailed table: U.S. Asian populations in 50 states and
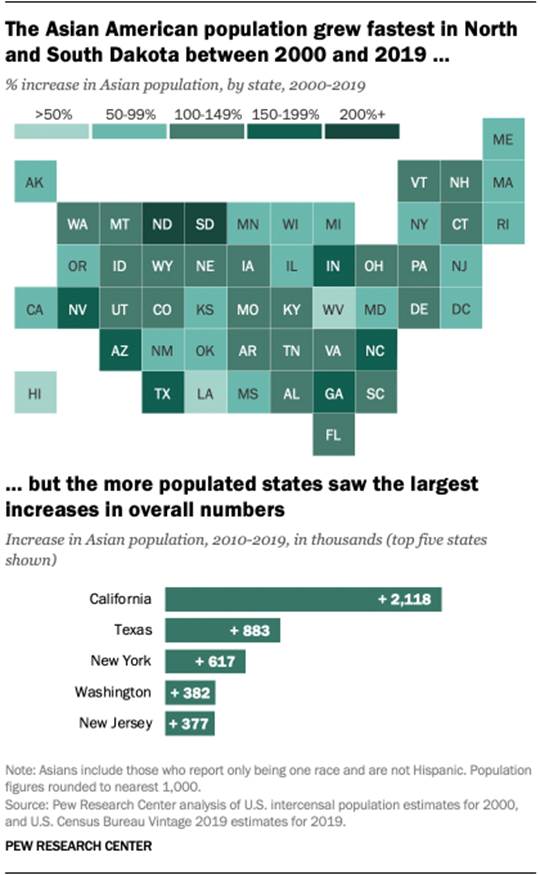
D.C., 2000 and 2019 The
Asian American population has increased in every state and the District of
Columbia over the past two decades. California had an Asian population of
roughly 5.9 million in 2019, by far the nation’s largest. It was followed by
New York (1.7 million), Texas (1.5 million), New Jersey (870,000) and
Illinois (732,000). A majority of U.S. Asians (56%) live in these five
states.
In
terms of growth rates,
North Dakota and South Dakota saw the fastest increases in their Asian
American populations between 2000 and 2019. The Asian populations in both
states more than tripled during that time. Indiana, Nevada and North Carolina
also saw significant growth as their Asian populations increased by 183%,
176% and 175%, respectively. California,
Texas and New York saw the most robust numerical growth
in their Asian American populations between 2000 and 2019. Together, these
three states accounted for 43% of overall Asian population growth in the U.S.
during that period. The number of Asian Americans grew by over 2 million in
California, by 883,000 in Texas and by 617,000 in New York. Notably, the
Asian population grew more in Texas than in New York during this span, even
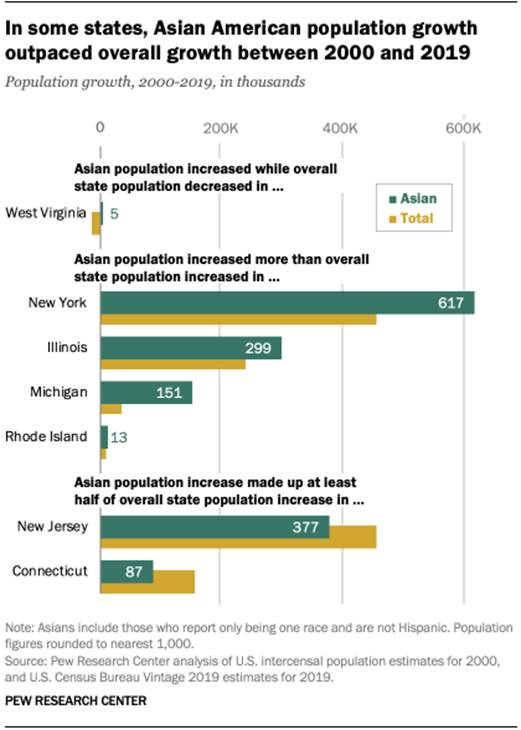
though more Asians still reside in New York. Asian American population growth in some states surpassed
the state’s overall population growth In
West Virginia, the Asian population increased between 2000 and 2019 even
though the state’s overall population declined. The decrease in West
Virginia’s overall population can be largely attributed to a decline in the
state’s White population, which makes up a majority of the state’s populace.
In
four other states, increases in the number of Asian Americans between 2000
and 2019 exceeded the state’s overall population growth. That was especially
apparent in Michigan, where the Asian population grew by more than four times
as much as the state’s overall population (151,000 vs. 34,000). New York,
Illinois and Rhode Island had similar patterns, though to a lesser degree.
In two
other states, Asian Americans accounted for more than half of statewide
population growth from 2000 to 2019. Asians accounted for 83% of total
population growth in New Jersey and 57% in Connecticut during this span. (PEW) APRIL
9, 2021 685-43-14/Poll Eight-In-Ten (81%) Agree That ‘Natural Resource Development Is Good
For Canada
Vancouver BC, April 8, 2021 — A new online poll conducted on behalf
of Resource Works Resource Works and the Task Force for Real Jobs, Real
Recovery[1] shows
strong support for natural resource development. Canadians see the sector as
important to the economy and as an opportunity to help Canada’s post COVID-19
economic recovery. Support for Natural Resource Sector Canadians
support the natural resource sector. Eight-in-ten (81%) agree that ‘natural
resource development is good for Canada’ (only 13% disagree) and more than
eight-in-ten (83%) agree that ‘Canada's natural resource sector is an
important contributor to the Canadian economy today’ (only 10% disagree). Canadians
also view the sector as being important to restarting the Canadian economy.
Roughly three-quarters (73%) of Canadians agree that ‘investment in Canada's
natural resource sector will help Canada's post COVID-19 economic recovery’
(only 15% disagree). As
shown in the table below, agreement with all three of these statements is
well above majority levels in every region of the country and among all age
groups. Continued Importance of Natural Resource Sector Canadians
do not accept the idea that the natural resource sector is becoming less
important to the national economy. Only about one-third (32%) of Canadians
agree that ‘Canada's natural resource sector is less important to the economy
than it has been in the past’ (56% disagree). And a similar one-third agree
that ‘Canada's natural resource sector will become less important to the
economy over the next 10 to 20 years’ (51% disagree). Continued Importance of Natural Resource Sector Currently,
about 19% of Canada's energy comes from renewable sources[2].
Canadians do not think an energy transition away from fossil-based energy
(e.g. oil and natural gas) to a majority (50%+) renewable energy sources
(e.g. wind, hydro, solar and geothermal) is something that will happen in the
next few years. Very
few Canadians (12%) think that renewables can provide a majority of Canada’s
energy in the next 10 years. The largest proportion of Canadians think the
transition will take either 20 years (28%) or 30 years (22%). Another
two-in-ten (19%) think the transition will take 40 years or more, while 18%
are undecided. Collectively,
41% of Canadians think the transition to a majority of renewable energy
sources will take 20 years or less. An equal proportion (41%) thinks the
transition will take 30 years or more. This means the median projection is a
25-year transition. (Ipsos
Canada) 8
April 2021 Source: https://www.ipsos.com/en-ca/canadians-support-natural-resource-development 685-43-15/Poll Over Half (53%) Of Canadian Households $200 Or Less Away From
Insolvency, Yet Still Optimistic About Financial Future
Toronto, ON, April 8, 2021 — After
several months of going through a second wave of the COVID-19 pandemic, there
are signs that Canadians are starting to feel more positive towards their
personal finances. Now in its sixteenth wave, the MNP Consumer Debt Index,
conducted quarterly by Ipsos, tracks Canadians’ attitudes about their debt
situation and their ability to meet their monthly payment obligations. The
Index currently stands at 96 points, up seven points over December 2020,
offering a sign that things could be looking up for Canadians as the country
cautiously re-opens. Pinched Financially, but Still Optimistic While things may seem on the up-and-up, the Index has also found that
households are reporting having less money left over at the end of the month
($625 on average, -$108 from December). This decline could be the result of
generous government aid programs and debt holidays given by lenders simply
having run their course. Canadian households may be discovering that their
bills are becoming due, even if many may not be back to full-time employment. Potential Debt Trap as Low-Interest
Spending Continues With interest rates having remained low in 2020, some Canadians have
seen opportunities to take advantage of favourable rates to make purchases
not normally within their budget. Six in ten (59%) believe that now is a good
time to buy things that they otherwise might not be able to afford (-2 from
December). In addition, nearly half (49%) say they’re more relaxed about
carrying debt than they usually are (+2), rising to more than half (53%) of
those aged 18-34 and 60% among those living in Quebec. Despite the uncertainty brought by the pandemic, bad financial habits
are still in evidence. With interest rates potentially set to increase in
2021, over four in ten (44%) are afraid that they will be in financial
trouble if rates go up much more, and four in ten (40%) are already beginning
to feel the effects of interest rates increasing. Furthermore, over half
(51%) are concerned about their ability to repay their debts if interest rates
rise. Those aged 18-34 (59%) and 35-54 (59%) are more likely to be concerned
about their ability to repay their debts if interest rates rise, compared to
those aged 55+ (40%). About four in ten (35%) are concerned that rising interest rates
could move them towards bankruptcy, rising to over half (52%) among those
aged 18-34 and those living in Atlantic Canada. This concern is also
prominent among those who have a household income under $40,000 (42%). Changing Habits as Pandemic Adds to Debt
Load The survey finds that as many over half (55%) of Canadians say they
have had to change their financial habits in some way as a result of the
pandemic, and over two in ten (25%) have taken on more debt since March of
last year. This includes using their savings to pay for bills (20%), using
credit cards (14%), using line of credit (7%), taking out a bank loan (3%),
or deferring mortgage payments (3%). Given the difficulties over the past year, some Canadians are
considering changing their financial habits over the next year, with nearly
half (45%) say they are going to change in some way. Over two in ten (22%)
say they are considering reducing their consumer spending or expenses, rising
to nearly three in ten (29%) among those who live in Alberta. Some Canadians are
considering paying their bills in the next year by using their savings (12%),
credit cards (8%), taking out a bank loan (5%), or using a line of credit
(5%). However, very few Canadians are planning to get professional help (4%)
or contact a licensed insolvency true to discuss debt relief options (2%) in
the next year. (Ipsos Canada) 8 April 2021 685-43-16/Poll 42% Of Brazilians Believe That The Country's Interests Must Come
Before Politics
Political interests should not be put ahead of the country's
interests by political leaders. This is what 42% of Brazilians said in a
survey conducted by Ipsos in partnership with The Global Institute for
Women´s Leadership on the behavior of government officials in the
post-pandemic. (Ipsos Brazil) 9 April 2021 AUSTRALIA
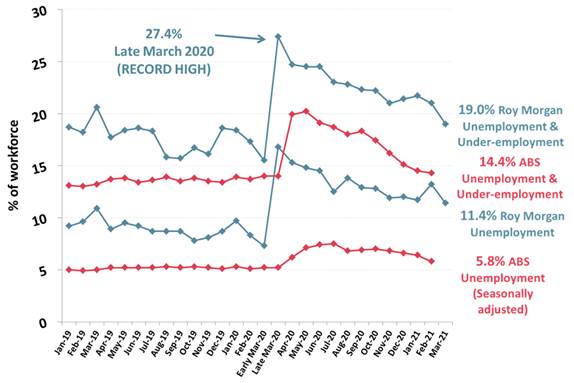
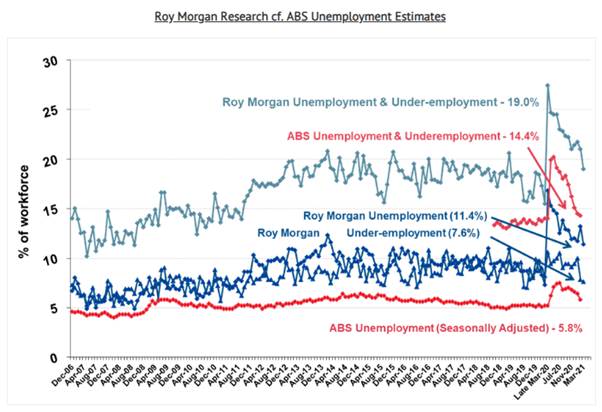
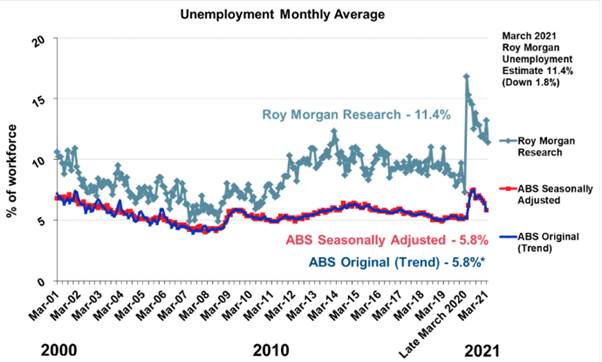
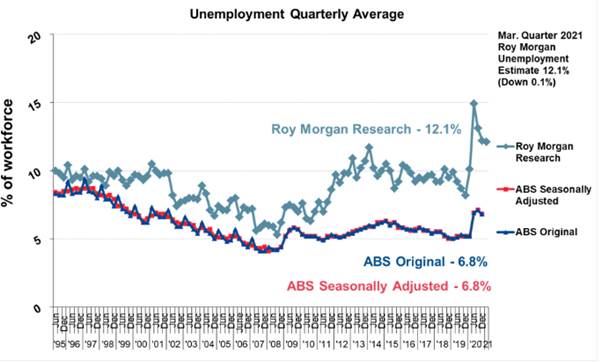
685-43-17/Poll 1.64 Million Australians Unemployed In March (Down 291,000 On
February) For An Unemployment Rate Of 11.4% - The Lowest For A Year
Latest Roy Morgan employment series data shows 1.64 million
Australians unemployed in March (down 291,000 on February) for an
unemployment rate of 11.4% - the lowest for a year.
Roy Morgan’s unemployment figure of 11.4% for March is over 5% points
higher than the current ABS estimate for February
2021 of 5.8%. However, the ABS figure for February
counts as employed an additional 127,000 Australians who were working zero
hours for ‘economic reasons’. If these non-workers are added back the ABS unemployment
estimate for February increases to 932,000 (6.7%). The ABS also claims there
are 1.18 million Australians (8.5%) under-employed for a total of 2.11
million unemployed or under-employed (15.2% of the workforce).
Compared to early March 2020, before the nation-wide lockdown was
implemented, in March 2021 there were over 550,000 more Australians either
unemployed or under-employed (+3.4% points).
Unemployment dropped in all five mainland States in March as we
approached the end of the JobKeeper wage subsidy. A look at the trends on a
State-based level shows unemployment was lowest in the two largest States of
NSW at 10.2% (down 1.3% points from February) and Victoria at 9.8% (down 2.9%
points). Next best was South Australia on 11.0% (down 1.4% points).
Unemployment remains highest in Queensland at 14.7%, although this was down
1.2% points and Western Australia at 14.0% (down 0.5% points). The biggest driver of the declines in unemployment was people leaving
the workforce and no longer looking for work but there was also jobs growth
in NSW and in particular Victoria as the State re-opened fully in March
following a short State-wide lockdown in mid-February. There were an extra
229,000 people employed in Victoria in March compared to February and
employment growth of 3,000 in NSW. The JobKeeper wage subsidy program has now finished and this is expected
to lead to significant job losses over the next few months. There were over
1.5 million Australians receiving the wage subsidy at the end of 2020 and
an estimated 1.1 million were on the
program during the March quarter 2021. According
to Dr. Steven Kennedy, Secretary to the Australian Treasury,
as many as 150,000 Australians may lose their jobs at the conclusion of the
JobKeeper wage subsidy program.
Source: Roy Morgan Single Source January 2019 – March
2021. Average monthly interviews 5,000.
“Roy Morgan’s results for March 2021 show
jobs growth continuing for the sixth straight month since Victoria’s long
second lockdown ended in October 2020, up 46,000 to 12.75 million in March.
This is marginally below the employment levels of a year ago in early March
2020 (12.87 million) with 8.41 million now employed full-time and 4.34
million employed part-time. “The difference to a year ago is an extra
550,000 Australians either unemployed or under-employed. In March 2021 there
were 2.73 million Australians (19% of the workforce) either unemployed or
under-employed compared to 2.16 million (15.6%) in early March 2020. “The ending of the JobKeeper wage subsidy
at the end of March adds an extra ‘wrinkle’ to assessing the jobs market as
an estimated 1.1 million Australians were receiving the subsidy during the
March quarter 2021 and up to 150,000 may lose
their jobs in the coming weeks and months according to Dr. Steven Kennedy of
the Australian Treasury. “The good news for those looking for work
is that Australian businesses are more confident than they’ve been for more
than seven years since early 2014. The latest Roy Morgan
Business Confidence for March is at 124.0 – and a clear majority of 59.4% of businesses
say the next 12 months is a good time to invest in growing the business. “In addition retail sales continue to be
strong with the latest ABS Retail Sales
figures for February 2021 showing annual growth of 9.1% from a year ago. Over the last
nine months since June 2020 Retail Sales have averaged annual growth of 9.2%
on a year ago – an unprecedented boom for larger retailers as Australians
have been prevented from spending on travel and holidays due to frequent
domestic border closures and a closed international border. “These are positive indicators for those
that may lose their jobs in the next few weeks or months due to the end of
the JobKeeper wage subsidy that they should be able to find new employment
even if it may be in a different industry to their existing employment. “The rollout of the COVID-19 vaccines in
Australia has been criticised for lagging other countries, however now that
domestic production of the vaccine is ramping up this should lead to greater
distribution of vaccines over the next few months and increase confidence
that there will be no more domestic border closures or lockdowns during the second
half of the year.” This Roy Morgan survey on Australia’s unemployment and ‘under-employed’*
is based on weekly face-to-face interviews of 745,847 Australians aged 14 and
over between January 2007 and March 2021 and includes 5,959 telephone and
online interviews in March 2021. *The ‘under-employed’ are those people
who are in part-time work or freelancers who are looking for more work. Contact Roy Morgan to learn more about Australia’s unemployed and under-employed;
who and where they are, and the challenges they face as they search for
employment opportunities. Visit the Roy Morgan Online Store to purchase employment profiles,
including for Australians who are employed, unemployed, under-employed, employed part-time, employed full-time, retired, studying and
many more.
(Roy Morgan) April 07 2021 685-43-18/Poll 83% Of Australians Have Either Already Been Vaccinated (7%), Say They
Are Willing To Be Vaccinated
Now 83% of Australians have either already
been vaccinated (7%), say they are willing to be vaccinated (69%) or would be
willing to be vaccinated once the Pfizer vaccine becomes available (7%) – a
total of 83% and an increase of 3% points since February, according to a
special Roy Morgan Snap SMS survey conducted on Friday April 9 and Saturday
April 10, 2021. Although the vast majority of Australians – across all ages, genders,
States and political party allegiances- are willing to take the vaccine or
have already done so, there is a strong political divide. Only 13% of L-NP
voters say they will not be vaccinated, while more than 1-in-5 Labor and
Green voters and those who vote for Independents and other parties express
unwillingness to be vaccinated. The nation is evenly split on Prime
Minister Scott Morrison’s handling of all COVID-19 related issues with 51%
disapproving of Morrison’s handling of the pandemic and 49% approving. Clear majority support for Prime Minister Scott Morrison’s handling
of all COVID-19 related issues is recorded among Australians aged 65+, people
in country areas, NSW, Queensland, Western Australia and Tasmania, as well as
L-NP supporters. In contrast a majority of younger Australians, women, people in
capital cities and Victoria as well as supporters of the ALP and the Greens
disapprove of Morrison’s handling of the pandemic. Australians surveyed were each asked the following questions:
This special Roy Morgan Snap SMS survey was conducted with an
Australia-wide cross-section of 1,423 Australians aged 18+ on Friday April 9
– Saturday April 10, 2021.
In mid-April, 16% of Australians aged 65+ have already been
vaccinated – three times the rate of any other age group – a further
68% of this age group say they are willing to
be vaccinated for COVID-19 and another 6% would be willing to be vaccinated
with the Pfizer vaccine - a total of 90% of the age group most at risk
from a potential COVID-19 infection. Next most likely are Australians aged 50-64 of whom 6% have already
been vaccinated, 72% say they are willing to be vaccinated and 8% say they
would be willing to be vaccinated with the Pfizer vaccine – a total of 85% of
this age group. People aged 50-64 have
had the biggest positive increase in those expressing a willingness to be
vaccinated – up 5% points
since mid-February. In contrast, younger Australians aged under 50 are less likely than
either of the older age groups to express a willingness to be vaccinated, 79%
of people aged under 50 express a willingness for being vaccinated (5%
already vaccinated, 67% willing to be vaccinated and 7% willing to be
vaccinated with the Pfizer vaccine). 21% of people under 50 are unwilling to
be vaccinated – a potential problem.
Men are again more likely than women to express a willingness to be
vaccinated with 84% either already vaccinated (6%), willing to be vaccinated
(73%) or willing to be vaccinated with the Pfizer vaccine (5%) – a total of
84% up only 1% point since mid-February. Women are ‘catching up’ to men over their willingness to be
vaccinated compared to mid-February with 81% either already vaccinated (9%),
willing to be vaccinated (64%) or willing to be vaccinated with the Pfizer
vaccine (8%) – a total of 81% up 4% points since mid-February.
L-NP supporters are more likely to express a willingness to be
vaccinated than two months ago with 87% now saying they are willing to be
vaccinated including 6% who are already vaccinated, 72% who say they are
willing to be vaccinated and a further 9% who are willing to be vaccinated
with the Pfizer vaccine – a total of 87% and up 5% points since mid-February. In contrast the willingness of ALP supporters to be vaccinated is
unchanged from mid-February at 78% including 6% who are already vaccinated,
63% who are willing to be vaccinated and a further 9% who are willing to be
vaccinated with the Pfizer vaccine. The interesting result is for Greens supporters, 79% of whom are now
willing to be vaccinated, down 5% points since mid-February. Only 3% of
Greens supporters have already been vaccinated while a further 73% say they
are willing to be vaccinated with an additional 3% willing to be vaccinated
with the Pfizer vaccine.
A large majority of 85% of Australians in Capital Cities say they are
willing to be vaccinated (8% already vaccinated, 71% willing to be vaccinated
and 6% willing to be vaccinated with the Pfizer vaccine) compared to 79% of
people in Country Areas (6% already vaccinated, 66% willing to be vaccinated
and 7% willing to be vaccinated with the Pfizer vaccine). These totals
represent small increases of 2% points for people in Capital Cities and 4%
for people in Country Areas willing to be vaccinated since mid-February. At a State level people in Tasmania are most willing to be vaccinated
(88%, up 13% points since mid-February)– and have also increased the most in
their willingness to be vaccinated since mid-February. Next most willing to be vaccinated are people in Victoria (85%, up 3%
points since mid-February), New South Wales (84%, down 2% points) and Western
Australia (82%, up 6% points). Least willing to be vaccinated – although still a clear majority –
are people in South Australia (78%, up 2% points since mid-February) and
Queensland (79%, up 8% points).
Older Australians are easily the most likely to approve of Prime
Minister Scott Morrison’s handling of all COVID-19 related issues with 62%
approving compared to only 38% disapproving. Their views are almost directly reversed by younger Australians aged
under 35 of whom 61% disapprove of Morrison’s handling of all COVID-19
related issues compared to only 39% that approve. People aged both 35-49 (49% approve cf. 51% disapprove) and 50-64
(50% approve cf. 50% disapprove) are almost equally split on the question. There is little difference by gender with 50% of men approving and
50% disapproving of Morrison’s handling of all COVID-19 related issues while
a small majority of 52% of women disapprove compared to 48% who approve.
The results at a State level reveal where the lack of support lies
for Morrison with 62% of Victorians disapproving of his handling of all
COVID-19 related issues compared to only 38% who approve. Interestingly small majorities of people in four States including NSW
(54%), Queensland (55%), WA (51%) and Tasmania (52%) approve of the way
Morrison has handled all COVID-19 related issues. South Australians are evenly split with 50% approving and 50%
disapproving. On a regional level Morrison enjoys the approval of a slim majority
of 51% of people in Country Areas compared to 49% that disapprove while this
result is reversed for those in Capital Cities with 52% disapproving of his
handling of all COVID-19 related issues and 48% approving.
Unsurprisingly a clear majority of 60% of L-NP supporters approve of
Prime Minister Scott Morrison’s handling of all COVID-19 related issues
compared to 40% that disapprove. In contrast nearly two-thirds of ALP supporters (64%) and Greens
supporters (65%) disapprove of Morrison’s handling of all COVID-19 related
issues compared to only 36% of ALP supporters and 35% of Greens supporters
that approve.
“Despite substantial controversy over the
COVID-19 vaccines in mid-April a majority of 83% of Australians are willing
to be vaccinated against COVID-19, up 3% from 80% in mid-February. This
includes 7% of Australians who are already vaccinated, a further 69% who say
they are willing to get vaccinated and an additional 7% who are willing to
get vaccinated if they can take the Pfizer vaccine. Only one-in-six
Australians (17%) say they are not willing to be vaccinated. “Despite the slower than expected rollout
of COVID-19 vaccines the increasing support for being vaccinated is a
positive sign that vaccine coverage will reach a large majority of the
population when the vaccine rollout is completed – which may not be until early
2022 and current rates. “Those keenest to receive a vaccine a are
those most at risk from serious health complications from the virus with 90%
of people aged 65+ willing to be vaccinated including 16% who have already
been vaccinated and a further 74% willing to be vaccinated. Willingness to be
vaccinated is also very high for those aged 50-64 while just under 80% of
people aged under 50 say the same. “The country is divided on Prime Minister
Scott Morrison’s handling of all COVID-19 related issues with 51%
disapproving and 49% approving. There is little difference between the two
genders though there is a clear age-related difference with over three-fifths
of people aged 65+ (62%) approving of Morrison’s handling of COVID-19 while
only 39% of people aged under 35 approve. “There is also a clear weakness for
Morrison in Victoria – only 38% of Victorians approve of Morrison’s handling
of COVID-19 while the Prime Minister enjoys a majority of approval in New
South Wales (54%), Queensland (55%), Western Australia (51%) and
election-bound Tasmania (52%). “These results show that although
Australia’s handling of COVID-19 in comparison to other countries overseas
has been well recognized as one of the best, the slow rollout of the COVID-19
vaccines threatens to undermine this story. “If other similar countries overseas return
to a ‘post-COVID-normal’ with the return of international travel well before
Australia does, the Government’s adept handling of the initial stages of the
pandemic may be forgotten in the run-up to the next Federal Election expected
early in 2022.”
(Roy Morgan) April 11 2021 685-43-19/Poll Subway Tops Yougov Australia’s Dining & Qsr Rankings 2021
Subway tops YouGov’s 2021 Dining & QSR Rankings
for Australia with an Index score of +27.6, making it the restaurant
brand with the best overall brand health according to Australians. The rankings are compiled using YouGov BrandIndex Index
score, a measure of overall brand health calculated by taking the average of
Impression, Quality, Value, Satisfaction, Recommend and Reputation scores.
The rankings are measured from 1 March 2020 to 28 February
2021.
Subway comes up on top in five of the six metrics that make up its
Index score – particularly for Value (measuring which brand consumers see to
be most value-for-money). It holds a Value score of +29.3, making it 7.7
points ahead of Hungry Jack’s (+21.6) who comes in second in this metric. The
one metric where it falls behind is on Reputation (measuring which brand
consumers would be proudest to work for). Baker’s Delight tops for Reputation
(+18.2), followed by The Coffee Club (+13.8) and Boost Juice (+12.7) – with
Subway taking fourth in this metric (+12.2). Local favourite Bakers Delight comes in second overall (+22.8), with
a healthy score to marking their 40th anniversary last
year. Other Aussie brands also fare well, with Boost Juice in fourth (+15.6),
Hungry Jack’s and Grill’d in joint fifth (+15.4) and The Coffee Club in
eighth (+13.6). Healthy burger chain Grill’d does particularly well when it
comes to their Recommend metric (measuring which brand consumers are most
likely to recommend), coming in as the third (+18.2) most recommended brand
on the list. American fast-food chains also fare well in the top ten. KFC is in
third (+15.9), McDonald’s in seventh (+14.3). McDonald’s scores particularly
well in the Satisfaction metric, coming in third (+23.4), behind Subway
(+30.4) and KFC (+25.1). Domino’s Pizza is in tenth (+12.8) and South African
chain Nando’s is in ninth (+13.4).
(YouGov Australia) April 8, 2021 Source: https://au.yougov.com/news/2021/04/08/subway-tops-yougov-australias-dining-qsr-rankings-/ MULTICOUNTRY
STUDIES
685-43-20/Poll Almost One In Two People Worldwide (45%) Say That Covid-19 Is One Of
The Main Problems Facing Their Country In March 2021
Almost one in two people worldwide (45%) say that Covid-19 is one of
the main problems facing their country in March 2021, a year after the global
pandemic was declared. Although this figure is 5 points lower than last
month and the lowest level registered since October 2020. When asked if things in their country are going in the right
direction or going the wrong way, more than six in 10 (62%) citizens of the
27 countries chose to say that they were "the wrong way", while 38%
say it is "in the right direction".
Malays are still the most concerned about Covid-19, but the current
61% is significantly lower than last month's 77%. Right behind, with
60%, is Great Britain, again in second place, followed by Japan and the
Netherlands (both with 58%). Unemployment (37%) Unemployment is currently the second biggest concern worldwide, a
position it has held throughout the Covid-19 pandemic. On average, 37%
select it as one of the most important problems facing their country today. Poverty and social inequality Three out of ten (31%) on average in all countries say that poverty
and social inequality is one of the most worrying problems in their country
today. This has been the third main topic of our survey in the last 12
months. Financial / political corruption Financial / political corruption is the fourth worldwide
concern. Our study shows that almost three out of ten (29%) consider it
on average one of the major problems facing their country
today. Replacing Russia, South Africa tops the table; an increase
of 8 points means that almost two-thirds (64%) say that corruption is a major
concern. Peru and Russia follow, both with 50% of citizens concerned
about this issue. Crime and violence Crime and violence was the fifth most worrying issue in March, with
an average of 24% in all countries that selected it as one of the most
important problems facing their country. In the case of Spain, Health is the fifth
greatest concern for 28% of Spaniards, which represents a drop of 5 points
compared to February . In the different
months we have seen how concern about health went hand in hand with the level
of concern about Covid, when it increases the other also does so, and vice
versa. Economic approach In the 27 countries, two-thirds (67%) consider the economic situation
of their country to be "bad", while a third say it is
"good", according to our world average of countries. However,
there has been an increase of 3 points in which they rate their economy
positively compared to last month. Our monitoring of economic expectations in 27 countries reveals a
slight increase in optimism about the future of the local economy since last
month. On average, a third (32%) say they will be stronger six months
from now (+4 points), while a quarter (24%) think they will be weaker. (Ipsos Spain) April 6, 2021 Source: https://www.ipsos.com/es-es/what-worries-world-marzo-2021 685-43-21/Poll Despite All Consequences Caused By The Pandemic During 2020, 79% Of
The Global Population Perceived Themselves As Healthy
Health Perception The year 2020 was full of unexpected changes, marked mainly by the
COVID-19 pandemic. Global economic and health crises, alongside the
adjustment of people to new lifestyles, were central last year.
Sleep Well Sleeping well is necessary for the good maintenance of both the body
and cognitive functioning, as well as emotional regulation. During 2020, 64%³
of the global population admits to sleeping well, and even better rate
compared to last year´s (+3). APAC and Europe are the regions with the better sleep quality among
their citizens (69%³ and 64%³, respectively), while the opposite occurs in
MENA region (54%). Palestinian Territories (51%), Mexico (49%) and Chile
(48%) are at the bottom of the ranking. Exercise According to the results, 39%³ of people worldwide exercised
regularly during 2020, +2% than the two previous years. Nonetheless, there is
still a high rate of people doing little or no exercises at all (31%).
Despite the safety measures put in place, which prevented people from going
to the gym or to field courts, people who already exercised before adapted to
the new conditions and kept doing exercises. Probably, many others,
considering the difficulties of walking and moving around, started exercising
at home precisely due to the safety measures adopted. Suffer from stress Suffer from stress is the first bad and non-action-based habit
considered. During 2020, 31% of population suffered from stress regularly,
while only 35% didn´t. Once again, despite the difficult context experienced,
the variation between the results from 2020 and previous years is minimum. Younger females (from 18 to 24), people with low incomes, students,
unemployed, housewives, and part-time workers are among the individuals who
tend to suffer from stress the most. Unsurprisingly, these individuals also
represent the most vulnerable population around the globe, a result that
emphasizes the relationship between social vulnerability and stress. Smoking and Drinking Nowadays, both smoking and drinking are uncommon habits, which were
classified in the study as bad, action-based behaviors. Overall, 17%³ of the
global population smokes regularly, while 15% drinks alcohol regularly. Even
if last year´s rates didn´t change considerably in comparison with previous
years, it is highly relevant at this moment to reduce the consumption of
cigarettes and alcohol. (WIN) Source: https://winmr.com/health-perception-and-lifestyle-in-global-pandemic-times/ 685-43-22/Poll Citizens Weigh In On The Health Of Their Healthcare Systems In Mena
Of all the crises that have plagued countries in the Middle East and
North Africa (MENA) in the past decade, the COVID-19 pandemic stands out in
at least one regard: the government in each country was not its primary
cause. Yet managing the pandemic was the government’s primary responsibility,
and citizens in several MENA countries have mixed appraisals of how their
governments have fared. Where citizens in Algeria, Jordan, and Morocco are
relatively satisfied with the governments’ response to healthcare side of the
crisis, citizens in Lebanon, Libya, and Tunisia have been left wanting. The pandemic may yet be an opportunity for the region’s governments
to press the reset button on state-society relations, and it is perhaps too
soon to tell whether or not governments have managed to do so. But
ironically, and regardless of their intentions, governments’ abilities to
govern were stilted by their past transgressions: the pandemic further
exacerbated preexisting problems often engendered in the first place by
governments’ negligence at best and corruption at worst. The healthcare
sector is no exception.
(Arabbarometer) April
7, 2021 |