|
BUSINESS & POLITICS IN THE WORLD GLOBAL OPINION REPORT NO. 693 Week:
May 31 –June 06, 2021 Presentation:
June 11, 2021 Only
A Few (22%) Indians Are Likely To Dine Out Once Restaurants Re-Open Or The
Lockdown Is Lifted In
2020 80% Of Liberians Think That Country Is Going In Wrong Direction Ugandans
(50%) approved of COVID-19 lockdown despite difficulty complying 65%
Ugandans Are Of The View That COVID-19 Resources Are Lost Due To Corruption Environmental
Protection Is A Matter Close To The Heart For Seven Out Of Ten Germans 60%
Of U.S. Adults Favor The Death Penalty For People Convicted Of Murder Australian
Unemployment Increases To 10.3% In May – A Month After The End Of Jobkeeper Most
Of The Total Adult Population In The US (59%) And In The UK (72%) Are
Meat-Eaters Are
Consumers Moving Back To Offline Shopping? INTRODUCTORY NOTE
693-43-22/Commentary:
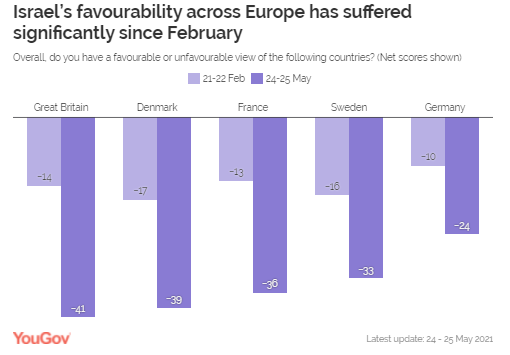
Israel
Is Least Favorable Amongst Britons, With Favorability Falling From -14 In
February To -41 In May Following Gaza Strikes
The ongoing
conflict between Israel and Palestine has recently flared
up again, with Israel executing air strikes on the
Gaza Strip, in response to rocket attacks by Hamas. With an estimated 243
lives lost – almost all civilian – both Hamas and Israel have now agreed to a ceasefire. Now new
YouGov Eurotrack data shows that Israel’s favourability across Europe has
suffered significantly since we last tested it in February, with net
favourability for the nation falling by at least 14 points in all countries
surveyed.
Of all the
countries surveyed, Israel is least favourable amongst Britons, with
favourability falling from -14 in February to -41 in May, its lowest rating
in Britain since we started asking this question in 2016. Israel’s
favourability is lowest amongst Labour voters, of whom only 13% view Israel
favourably, with 68% viewing the country unfavourably (a net score of -55).
Conservative voters view Israel more favourably, although perceptions are
still largely negative: 29% have a favourable impression of Israel while 53%
have an unfavourable impression (net -24). The next
highest fall in Israel’s favourability is seen in France, decreasing 23
points from -13 to -36, the country’s lowest favourability rating amongst the
French since May 2019. A similar fall can be seen in Denmark, experiencing a
22 point drop from -17 to -39. Sweden and Germany see the smallest falls in
favourability, at 17 and 14 points respectively. Germany stands out from the
rest of the countries surveyed with the highest net favourability rating for
Israel at-24, nine points higher than the next highest country (Sweden) at
-33. (YouGov UK) June 04,
2021 SUMMARY
OF POLLS
ASIA (India) Only A Few (22%) Indians Are Likely To Dine Out Once
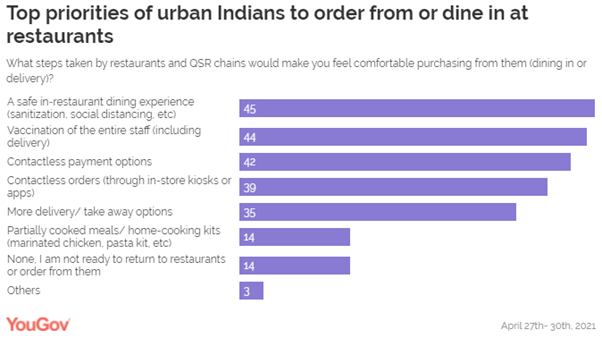
Restaurants Re-Open Or The Lockdown Is Lifted Amid the fresh Covid19 outbreak, YouGov’s latest
survey reveals urban Indians prioritize vaccination of staff as much as a safe
dining experience when it comes to their comfort of buying food from a
restaurant or a QSR chain- either through delivery or dining-in. Many respondents said contactless
payment options and provisions for contactless orders (42% and 39%,
respectively) would make them feel relaxed buying from a restaurant in the
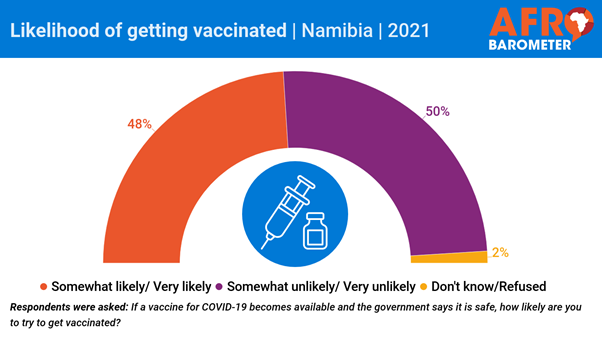
current scenario. (YouGov India) June 1, 2021 AFRICA (Namibia) 48 % Of Namibians Are Likely To Get Vaccinated If It Is
Available And Government Says Its Safe, 50% Are Unlikely Nearly all adult Namibians are worried
about the effects of the COVID-19 pandemic on their households, the country,
and the future of their children, according to a telephone survey by
Afrobarometer. But a majority of citizens have concerns about the safety of COVID-19
vaccines and believe that prayer is more effective than vaccines in
preventing COVID-19 infection. Only about half say they are likely to try to
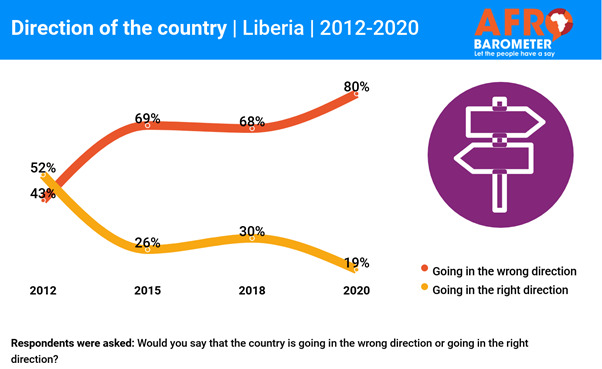
get vaccinated. (Afrobarometer) 2 Jun 2021 (Liberia) In
2020 80% Of Liberians Think That Country Is Going In Wrong Direction Liberians
generally hold gloomy views of the direction of the country, the country’s
economic condition, and their personal living conditions, the latest
Afrobarometer survey shows. An overwhelming majority – almost twice as many
as in 2012 – say the country is going in “the wrong direction,” and only
one-fourth of citizens assess the country’s economic condition as “fairly” or
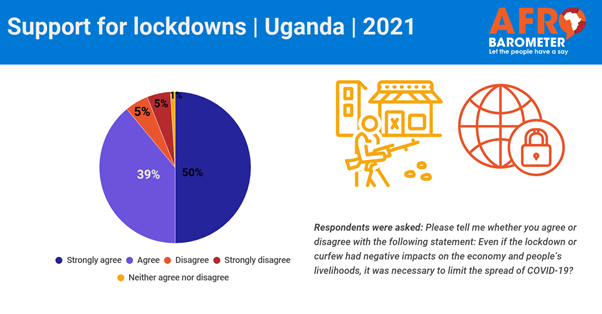
“very” good. (Afrobarometer) 3 Jun 2021 (Uganda) Ugandans (50%) approved of COVID-19 lockdown despite
difficulty complying Almost nine in 10 Ugandans say that last
year’s lockdown was necessary to limit the spread of COVID-19, in spite of
the toll it took on the economy and people’s livelihoods, the latest
Afrobarometer survey shows. Two-thirds say they found it difficult to comply
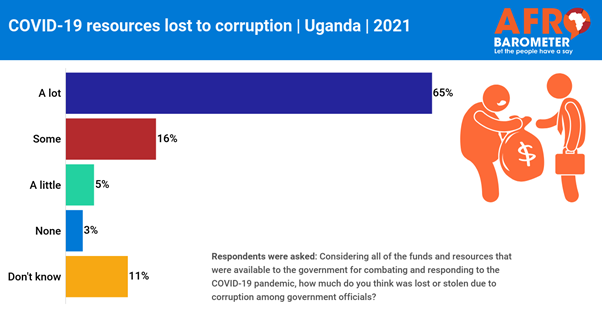
with lockdown restrictions or curfews imposed by the government. (Afrobarometer) 4 Jun 2021 65% Ugandans Are Of The View That COVID-19 Resources Are
Lost Due To Corruption A new Afrobarometer survey in Uganda shows
that a majority of citizens approve of the government’s management of the
response to COVID-19, although many raise concerns about corruption. More
than three-quarters of Ugandans believe that at least some of the resources
available for responding to the pandemic were lost due to corruption among
government officials. Only about half of citizens say they trust government
statistics on COVID-19 cases and deaths. (Afrobarometer) 4 Jun 2021 WEST
EUROPE (UK) Six In Ten Britons Still Expect Measures To Be Lifted On
21st June, But Optimism That Lockdown Will Be Lifted Has Fallen Over The
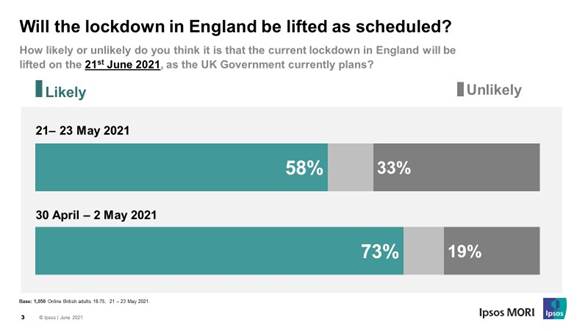
Month New polling by Ipsos MORI shows most people
are still hopeful for the lifting of current lockdown restrictions on 21st
June. Almost 6 in 10 (58%) believe it is likely that this will go ahead as
currently planned by the Government, while a third (33%) say it is unlikely,
in research carried out between 21-23 May. But while a majority remain
hopeful, there has been a significant drop over the month. When the same
question was asked at the beginning of May, almost three-quarters (73%) said
the lifting of restrictions on 21st June was likely, 15ppt more than those
who feel the same way now, while the proportion who think it is unlikely has
risen 14ppt. (Ipsos MORI) 1 June 2021 Two In Five Brits (42%) Say That Local Police Are Effective
At Providing Advice And Guidance To The Public A NEW Ipsos MORI survey shows that two in
five Brits (42%) say that local police are effective at providing advice and
guidance to the public and a similar proportion say they are effective at
responding when a member of the public calls (39%). But only around a quarter
(23%) say they are effective at protecting those online. On most measures of
effectiveness, there has been little change since 2017. (Ipsos MORI) 2 June 2021 53% Of People Think Changes To The National Curriculum
Should Be A Part Of A Hypothetical Overhaul Of The Schooling System The Education Recovery Commissioner Sir
Kevan Collins has resigned after his plans for education reform
to help students catch up following the pandemic were rejected by the government. Some
53% of people think changes to the national curriculum should be a part of a
hypothetical overhaul of the schooling system – including some 61% of parents
with children under 5. (More precise questions on how the curriculum is
handled and could be changed are covered in the next section). (YouGov UK) June 03, 2021 (Germany) Environmental Protection Is A Matter Close To The Heart For
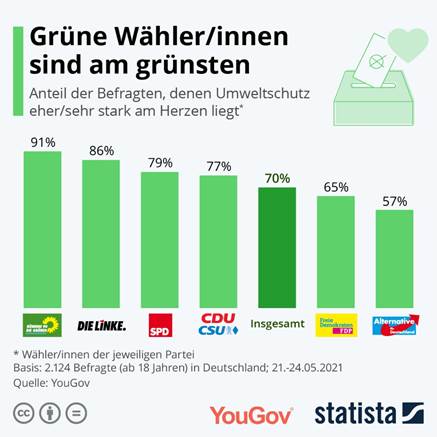
Seven Out Of Ten Germans World Environment Day is celebrated on
Saturday, June 5th. For the majority of Germans, environmental
protection is important: 70 percent say that it is important to
them. Not surprisingly, this is what voters from the Greens are most
likely to say (91 percent). Also voters of the party "Die
Linke" (86 percent), the SPD (79 percent) and the Union (77 percent) are
more important than the general population. This was the result of a
current YouGov survey in cooperation with Statista. (YouGov Germany) June 2, 2021 (Spain) 52% Of The Spaniards Have Not Yet Planned Their Vacations
Since They Prefer To Wait To See How The Pandemic Evolves With the arrival of the month of June, many
are those who can no longer think of anything other than the summer holidays.
While last summer 24% of respondents decided not to go on vacation, this
year 100% of those interviewed affirm that they will. Despite this,
2 out of 3 admit that they have not yet booked their vacations, stating 52%
of them that they prefer to wait to see how the pandemic evolves to make sure
that everything is more controlled and calm. Added to this are the
undecided who still do not have a clear destination (16%) or those who are
waiting to be vaccinated (12%). (Ipsos France) June 3, 2021 NORTH AMERICA (USA) 51% Republicans Say United States Should Follow Its Own
National Interests Even When Allies Strongly Disagree Republicans who turn only to Fox News or
talk radio are less likely than other Republicans to say many of the problems
facing the country can be solved by working with other countries (20% vs.
36%). Democrats, however, are about equally likely to say this regardless of
their media diet: Overall, 71% of Democrats hold this view. (PEW) JUNE 2, 2021 Smartphone Ownership (85%) And Home Broadband Subscriptions (77%) Have Increased Among American
Adults Since 2019 Smartphone ownership (85%) and home broadband subscriptions (77%) have increased
among American adults since 2019 – from 81% and 73% respectively. Though
modest, both increases are statistically significant and come at a time when
a majority of Americans say the internet has been important to them personally. And 91% of adults
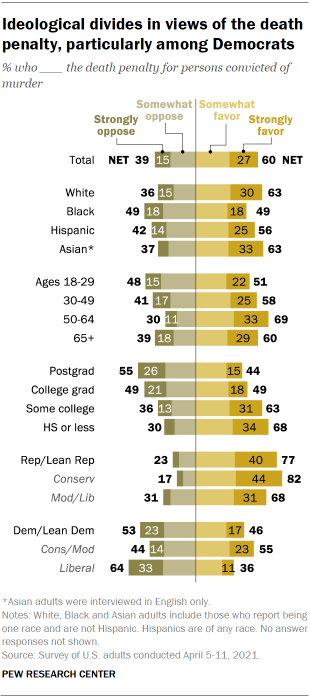
report having at least one of these technologies. (PEW) JUNE 3, 2021 60% Of U.S. Adults Favor The Death Penalty For People
Convicted Of Murder More Americans favor than oppose the death
penalty: 60% of U.S. adults favor the death penalty for people convicted of
murder, including 27% who strongly favor it. About four-in-ten (39%) oppose
the death penalty, with 15% strongly opposed, according to a new Pew Research
Center survey. The survey, conducted April 5-11 among 5,109 U.S. adults on
the Center’s American Trends Panel, finds that support for the death penalty
is 5 percentage points lower than it was in August 2020, when 65% said they
favored the death penalty for people convicted of murder. (PEW) JUNE 2, 2021 (Canada) Four In Ten (40%) Working Canadians Say They’ve Experienced
A Decline In Their Physical Health Throughout The Pandemic As vaccination rates have ramped up across
the country, and businesses are starting to prepare for a post-pandemic
future, working Canadians continue to face a number of health-related
challenges. Four in ten (40%) working Canadians say they’ve experienced a
decline in their physical health throughout the pandemic, according to a
recent Ipsos poll conducted on behalf of RBC Insurance. The inability to
socialize with family, friends or co-workers (72%) and work-related stress
(58%) were also cited as factors impacting overall health. (Ipsos Canada) 1 June 2021 AUSTRALIA Australian Formula 1 Grand Prix In Doubt For 2021 But It’s
The Ongoing V8 Supercars Series That Provides Value For Sponsors Nearly 4.6 million Australians watched
motorsports including Formula 1, V8 Supercars, the Bathurst 1000, Drag racing
and Rally car racing on TV in 2020. The leading motor sports events watched
by Australians on TV are the Bathurst 1000 watched by over 3.1 million, the
V8 Supercars watched by 2.6 million and the Formula 1 watched by nearly 2.3
million. In contrast, only around a quarter of all Australians, 28%, can name
a brand associated with V8 Supercars and just over a fifth, 22%, can name a
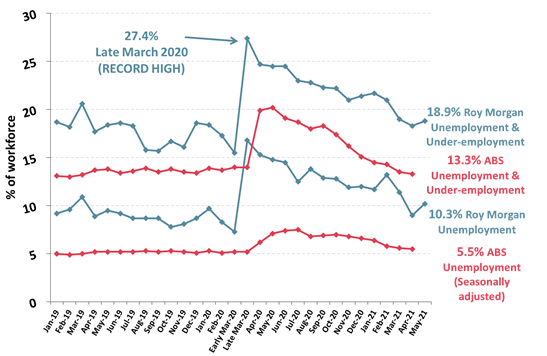
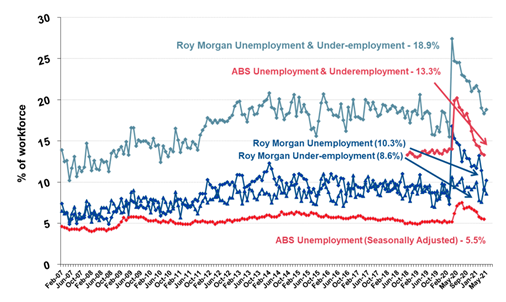
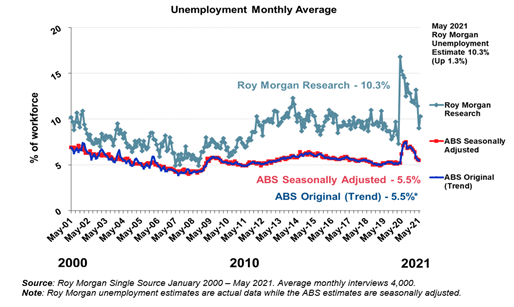
brand associated with the Australian Formula 1 Grand Prix. (Roy Morgan) June 01 2021 Australian Unemployment Increases To 10.3% In May – A Month
After The End Of Jobkeeper Latest Roy Morgan employment series data
shows 1.49 million Australians unemployed in May – up 186,000 on April for an
unemployment rate of 10.3% with the increase somewhat offset by a fall in
under-employment which dropped 101,000 in May to 1,256,000 (8.6%).1,493,000
Australians were unemployed (10.3% of the
workforce), up 186,000 from April. There were far more people
looking for part-time work (up 221,000 to 935,000) but fewer people looking
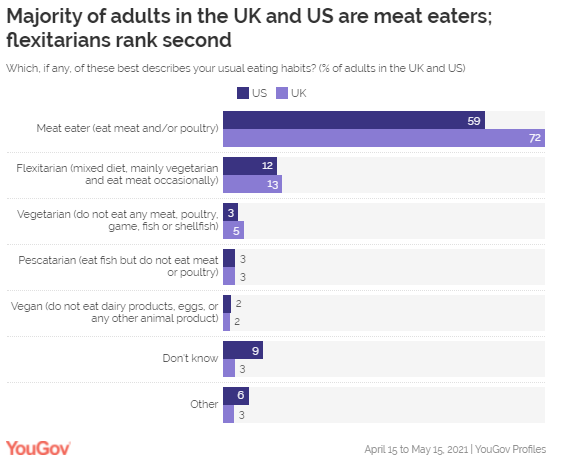
for full-time work (down 35,000 to 558,000). (Roy Morgan) June 04 2021 MULTICOUNTRY STUDIES Most Of The Total Adult Population In The US
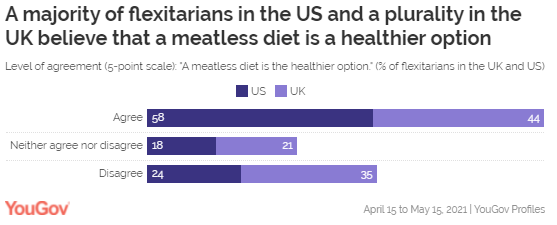
(59%) And In The UK (72%) Are Meat-Eaters More than half (58%) of the American adults
who identify themselves as flexitarians believe that a meatless diet is
a healthier option, albeit that a quarter (25%) of them
disagree. Compared to the general population, half of Americans
(50%) agree that going meat-free is better for
you, while 32% disagree. Flexitarians, who follow
vegetarianism with the occasional inclusion of meat, form 13% of the UK’s
population and 12% in the US. (YouGov UK) May 31, 2021 Are Consumers Moving Back To Offline Shopping? The Covid effect is unmistakable: In
countries with stricter restrictions, the gap between online and offline
buyers is greater. It is one of the greatest divergences in Germany: 46
percent of those surveyed bought non-essentials in stores, 74 percent
online. In Australia, on the other hand, the number of offline shoppers
was higher than that of online shoppers. Only 29 percent of those surveyed
name social distancing as a reason to shop online. On the other hand, 47
percent say it is easier to shop online and 57 percent cite home delivery as
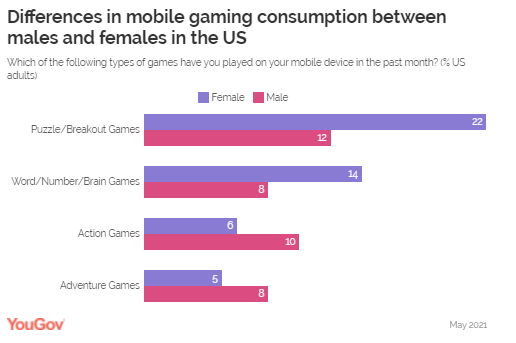
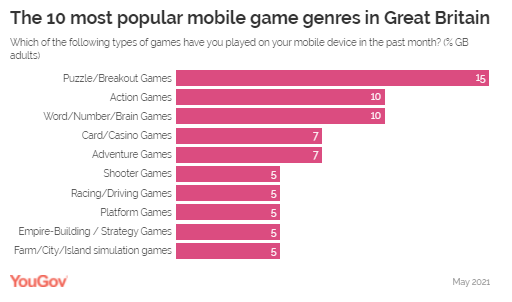
an important benefit. (YouGov Germany) Source: https://yougov.de/news/2021/05/31/schwenken-verbraucher-zuruck-zum-offline-einkauf/ One In Six Consumers In The US (17%) And One In Seven In
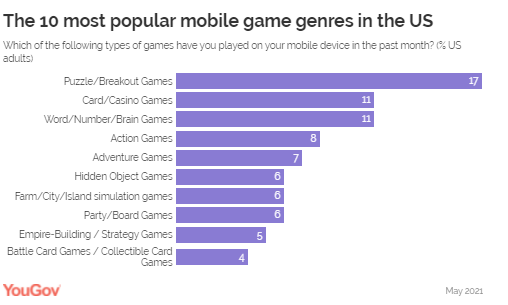
Great Britain (15%) Said They Play Games Such As Candy Crush Saga And
Bejeweled Blitz Let's explore the types of mobile games
that consumers are most drawn to in two key markets: the US and Great
Britain. Data from YouGov Profiles reveals that Puzzle and Breakout games
constitute the most popular category in both markets. About one in six consumers
in the US (17%) and one in seven in Great Britain (15%) said they play games
such as Candy Crush Saga and Bejeweled Blitz. In the US, Card/Casino and
Word/Number/Brain games were tied at the second spot with one in nine
Americans (11%) saying they played games from those genres on their cell
phones over the past month. Action games (8%) and Adventure games (7%)
featured in the top five as well. (YouGov UK) June 01, 2021 Israel Is Least Favourable Amongst Britons,
With Favourability Falling From -14 In February To -41 In May Following Gaza
Strikes Of all the countries surveyed, Israel is
least favourable amongst Britons, with favourability falling from -14 in
February to -41 in May, its lowest rating in Britain since we started asking
this question in 2016. The next highest fall in Israel’s favourability is
seen in France, decreasing 23 points from -13 to -36, the country’s lowest
favourability rating amongst the French since May 2019. A similar fall can be
seen in Denmark, experiencing a 22 point drop from -17 to -39. Sweden and
Germany see the smallest falls in favourability, at 17 and 14 points
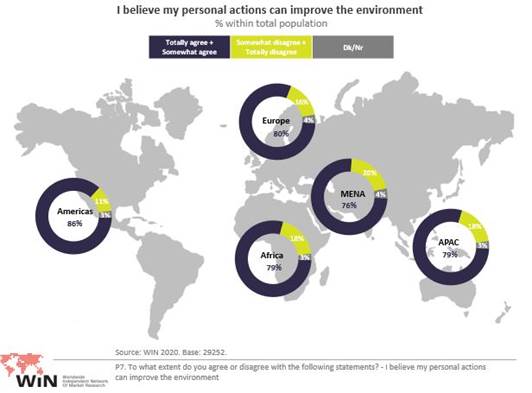
respectively. (YouGov UK) June 04, 2021 Protect The Environment And Fight Climate
Change: Individuals’ Responsibility And The Role Of Companies And Governments Climate change has already been a reality
for several years, and one of its main consequences is global warming, which
is perceived as a threat to humanity
by 85% of the global population surveyed (in APAC and
Americas the share is even higher, with 87% of the population believing
global warming is a threat). Vietnam (97%), South Korea (94%), Chile (93%),
Indonesia (92%), India, Ecuador, and China (91%) are at the top of the world
ranking when it comes to the perceived threat of global warming. (WIN) 4 Jun 2021 ASIA
693-43-01/Poll Only A Few
(22%) Indians Are Likely To Dine Out Once Restaurants Re-Open Or The Lockdown
Is Lifted
Amid the fresh Covid19 outbreak, YouGov’s
latest survey reveals urban Indians prioritize vaccination of staff as much
as a safe dining experience when it comes to their comfort of buying food
from a restaurant or a QSR chain- either through delivery or dining-in. Interestingly, these two factors are a
higher priority in tier-1 cities of India, some of which are worst affected
by the current wave of Covid19. Many respondents said contactless payment
options and provisions for contactless orders (42% and 39%, respectively)
would make them feel relaxed buying from a restaurant in the current scenario. Slightly over a third feel more delivery or
take away options would encourage them to buy (35%), and for few partially
cooked or semi-cooked meal kits would do the needful (14%). Only one in seven (14%) are currently not
willing to either order or dine out at a restaurant no matter what steps they
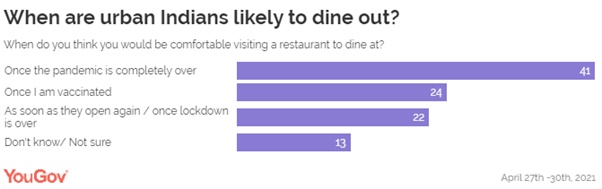
take. On being asked about their likeliness to
visit a restaurant, it seems urban Indians are in no hurry and most of them
would be comfortable going to a restaurant once the pandemic is over or once
they are vaccinated. The rising fear levels around contracting the virus
could perhaps be the reason for not wanting to step out soon. In comparison to this, only a few (22%) are
likely to dine out once restaurants re-open or the lockdown is lifted. Few
others (13%) are unsure of their decision yet. Among the different age groups, 40+ adults
were most likely to say they will dine out once the pandemic is over, but
adults between 18-39 years were more likely than them to visit a restaurant
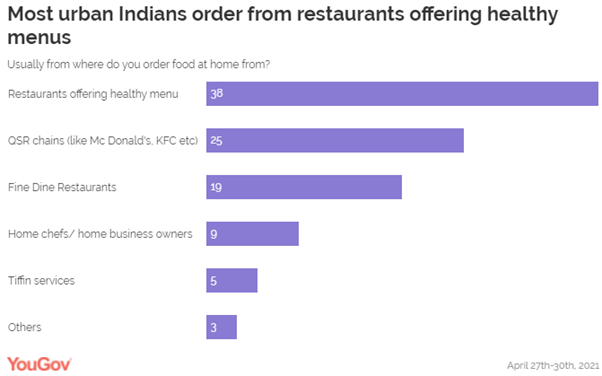
upon vaccination. It seems home-delivery of food has assumed
importance during the current phase of lockdown and most urban Indian
respondents (58%) are ordering in food at home at least once a week. When asked about the places they usually
order from, two in five people (38%) said they order from restaurants
offering healthy menus. A quarter (25%), however, order from QSR
chains such as McDonald’s, KFC, etc). Slightly fewer (19%) order in from
fine-dine restaurants. Comparatively, very few prefer to order from home
chefs or tiffin services. When it comes to reasons for ordering in,
unsurprisingly boredom of eating home-cooked food is the biggest motivation
to order in (62%), followed by the inability to dine out during the pandemic
(53%). Some people order to celebrate special
occasions (45%), others order when they don’t have the time to cook (38%) or
when domestic help is not available (36%). Some others call for food for its
variety (31%), or to avail offers or deals available on ordering (23%). This
indicates people are ordering in to seek the taste or experience of
restaurant dining more than out of convenience. Restaurants and delivery chains may want to
consider these insights in order to provide a safe dining experience to their
customers whilst emphasizing on the safety and wellbeing of their staff and
delivery agents. (YouGov India) June 1, 2021 Source: https://in.yougov.com/en-hi/news/2021/06/01/staff-vaccination-safe-dining-experience-are-top-p/ AFRICA
693-43-02/Poll 48 % Of
Namibians Are Likely To Get Vaccinated If It Is Available And Government Says
Its Safe, 50% Are Unlikely
Nearly all adult Namibians are worried
about the effects of the COVID-19 pandemic on their households, the country,
and the future of their children, according to a telephone survey by
Afrobarometer. But a majority of citizens have concerns
about the safety of COVID-19 vaccines and believe that prayer is more
effective than vaccines in preventing COVID-19 infection. Only about half say they are
likely to try to get vaccinated. The survey, conducted last
December-February, is Afrobarometer’s first under its “AB Calling” telephone
survey label. With 54,659 COVID-19 cases and 817 deaths
as of 1 June 2021 reported by the Namibia Statistics Agency, the country is
facing its biggest health crisis since the start of the pandemic. About
76,500 vaccine doses have been administered, according to the World Health Organisation.
Slow vaccine uptake is of great concern with a third wave of infections
looming large during this winter period. (Afrobarometer) 2 Jun 2021 693-43-03/Poll In 2020 80%
Of Liberians Think That Country Is Going In Wrong Direction
Liberians
generally hold gloomy views of the direction of the country, the country’s
economic condition, and their personal living conditions, the latest
Afrobarometer survey shows. An
overwhelming majority – almost twice as many as in 2012 – say the country is
going in “the wrong direction,” and only one-fourth of citizens assess the
country’s economic condition as “fairly” or “very” good. Fewer than
half describe their personal living conditions as at least “fairly good.” The study
shows that negative assessments of the country’s overall direction and
economic condition increased with individuals’ experience of poverty. (Afrobarometer) 3 Jun 2021 693-43-04/Poll Ugandans
(50%) approved of COVID-19 lockdown despite difficulty complying
Almost nine in 10 Ugandans say that last
year’s lockdown was necessary to limit the spread of COVID-19, in spite of
the toll it took on the economy and people’s livelihoods, the latest
Afrobarometer survey shows. Two-thirds say they found it difficult to
comply with lockdown restrictions or curfews imposed by the government. Only about two in 10 citizens say their
households received special government assistance during the pandemic, and
most Ugandans believe that government assistance was not distributed fairly. Whereas the lockdown was nationwide, relief
aid was distributed only in Kampala and Wakiso, and the first phase targeted
only 1 million urban poor. These survey findings suggest a need for
transparent criteria for targeting of beneficiaries so as to ensure equitable
benefits of the program intervention. (Afrobarometer) 4 Jun 2021 693-43-05/Poll 65% Ugandans
Are Of The View That COVID-19 Resources Are Lost Due To Corruption
A new Afrobarometer survey in Uganda shows
that a majority of citizens approve of the government’s management of the
response to COVID-19, although many raise concerns about corruption. More than three-quarters of Ugandans
believe that at least some of the resources available for responding to the
pandemic were lost due to corruption among government officials. Only about half of citizens say they trust
government statistics on COVID-19 cases and deaths. A report by the Auditor General in March
revealed significant mismanagement of COVID-19 funds. As of 3rd June 2021,
Uganda has so far tested 1,125,306 samples for COVID-19, with 49,759
confirmed cases, 47,760 recoveries and 365 deaths. (Afrobarometer) 4 Jun 2021 WEST EUROPE
693-43-06/Poll Six In Ten Britons Still Expect Measures To Be Lifted On 21st June,
But Optimism That Lockdown Will Be Lifted Has Fallen Over The Month
New polling by Ipsos MORI shows most people are still hopeful for the
lifting of current lockdown restrictions on 21st June. Almost 6 in 10 (58%)
believe it is likely that this will go ahead as currently planned by the
Government, while a third (33%) say it is unlikely, in research carried out
between 21-23 May. But while a majority remain hopeful, there has been a
significant drop over the month. When the same question was asked at the
beginning of May, almost three-quarters (73%) said the lifting of
restrictions on 21st June was likely, 15ppt more than those who feel the same
way now, while the proportion who think it is unlikely has risen 14ppt.
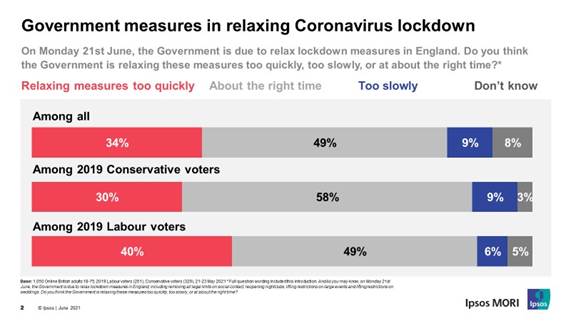
Overall, a third of Britons (34%) believe the Government is lifting
lockdown restrictions too quickly while half say the easing of rules is
coming at the right time, and only 1 in 10 (9%) believe it is happening too
slowly.
Gideon Skinner, Head of Political Research
at Ipsos MORI, said: Even before the reports this weekend, this
latest polling showed that while most Britons were still hopeful that
lockdown would end on the 21st June, they were not as optimistic as they had
been at the beginning of the month – perhaps partly in response to growing
awareness of the potential impact of the new variant. As we have seen
throughout the pandemic the public themselves remain fairly cautious and
there is little sign of much appetite to speed up the relaxation of measures
– instead, around half are broadly supportive of the government’s approach to
easing restrictions, and even a third worry it might be happening too
quickly. (Ipsos MORI) 1 June 2021 693-43-07/Poll Two In Five Brits (42%) Say That Local Police Are Effective At
Providing Advice And Guidance To The Public
A NEW Ipsos MORI survey shows that two in five Brits (42%) say that
local police are effective at providing advice and guidance to the public and
a similar proportion say they are effective at responding when a member of
the public calls (39%). But only around a quarter (23%) say they are
effective at protecting those online. On most measures of effectiveness,
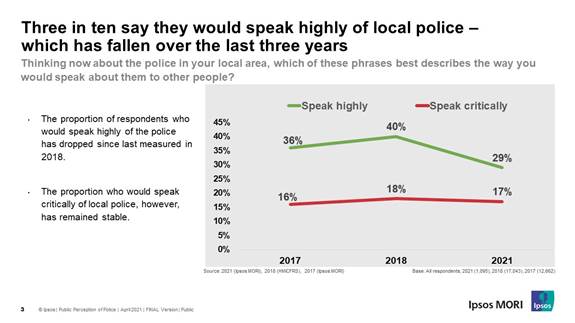
there has been little change since 2017. However, people are now significantly less likely to say they would
speak highly of the police in their local area compared with three years ago.
In 2018, four in ten 10 (40%) Britons said they would speak highly of their
local law enforcement, now only 29% feel the same way. Although, there has
been no change in the proportion of people who would be critical of local
police; 17% now compared with 18% in 2018.
On some aspects of local policing, ethnic minorities are more
positive than White people; around half of ethnic minorities (53%) say that
police in their local area are effective at providing advice to the public
and responding when a member of the public calls (49%), compared with 40% and
37% of White people respectively. Ethnic minorities are also more likely than
White people to see local police as being effective at preventing and
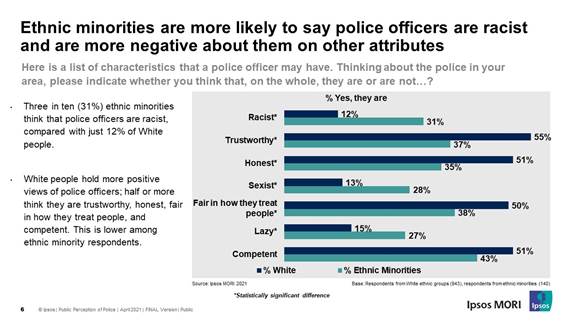
investigating offending, as well as protecting those who are online. Overall, the public is fairly positive about the characteristics of
local police – around half say they are trustworthy (52%), competent (50%),
fair in how they treat people (49%) and honest (49%). Around one in six think
they are lazy (16%), sexist (15%) or racist (14%). However, ethnic minorities are significantly more likely to view
police officers in their area as being racist than White people; three in ten
(31%) ethnic minority people say that the police in their area are, on the
whole, racist, compared to only one in 10 (12%) White people.
Kully Kaur-Ballagan, Research Director at
Ipsos MORI said On the whole people are positive about the
police and how effective they are at policing although there is clearly less
confidence in their ability to protect people online. (Ipsos MORI) 2 June 2021 693-43-08/Poll 53% Of People Think Changes To The National Curriculum Should Be A
Part Of A Hypothetical Overhaul Of The Schooling System
The Education Recovery Commissioner Sir Kevan Collins has resigned after
his plans for education reform to help students catch up following the
pandemic were rejected by the government. In our last
article on the English school system, YouGov looked at what parents
thought of the current schooling system, how it handled the pandemic, and
whether it prepared their children well for adult life. Now, further YouGov
polling for The
Times reveals how parents think the schooling system should change,
from the focus of curriculums and key subjects, to the nature of private schools
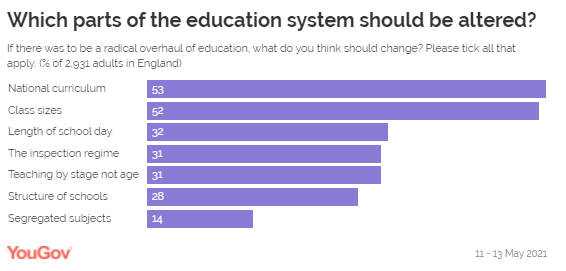
and whether homework is really needed for younger learners. How should schools be reformed? Some 53% of people think changes to the national curriculum should be
a part of a hypothetical overhaul of the schooling system – including some
61% of parents with children under 5. (More precise questions on how the
curriculum is handled and could be changed are covered in the next section). Elsewhere, however, another 52% of the public think that changes need
to be made to class sizes. Parents who have children at secondary age are
more likely to back changes to class sizes (56%) versus just under half of
those with children under 5 (46%) – possibly unsurprising given secondary
classes at their largest size in nearly
twenty years,
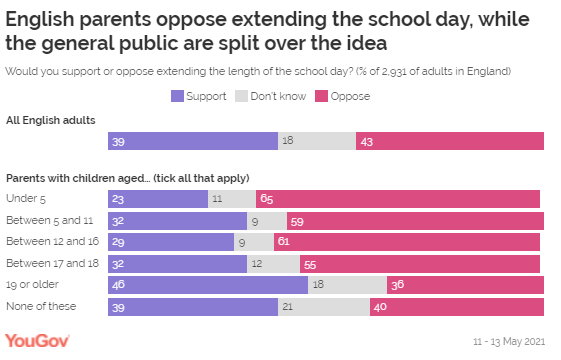
Further to this, Sir Kevan Collins had highlighted increasing
the length of the school
day as a solution to help students catch up on teaching after COVID.
YouGov’s Teacher Track survey previously showed
that the overwhelming majority of teaching staff (91%) across Great Britain
were opposed to such measures. Now this survey finds a similar opinion with
parents, who are also opposed to an extension of the school day, although not
quite as strongly. Opposition is highest among parents of children under 5
(65%) and lower among parents of children aged 17 to 18 (55%). The general public, however, are split over the idea of an extended
school day, with 39% in favour and 43% opposed. Of other potential changes to the system, three in ten people (31%)
would change the current inspection regime, and the same proportion of people
would back teaching by stage, rather than age of child, and 28% think school
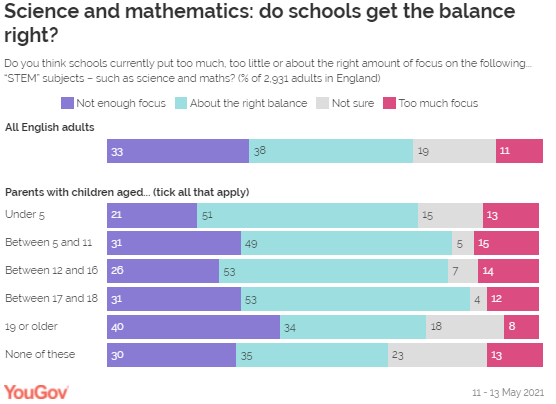
structures need to change. Curriculum: do schools focus too much on
certain subjects like science or art? As we saw above, 53% of the general public would back changes to the
curriculum if there was an overhaul of the education system – so how they do
think schools are currently balancing their topics?
The general public is split on whether arts and STEM (science,
technology, engineering and maths) get either too little or about the right amount
of focus, and among those with children there is disagreement between parents
of the youngest and oldest. Parents with children older than 19 tend to think that the STEM
subjects are not focused on enough in schools (40%), compared to only 21% of
those with the youngest children (under 5) who think the same. This group of
parents is instead most likely to think STEM subjects already get about the
right amount of focus in class time (51%).
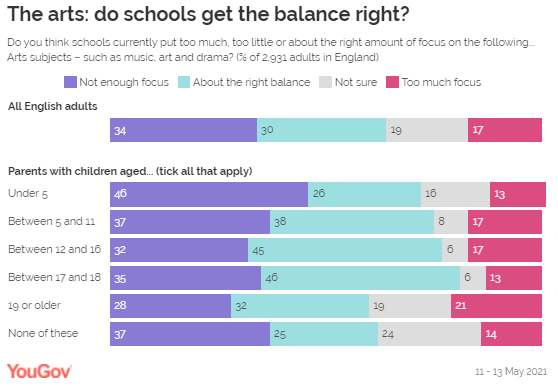
This feeling is reversed when asking about arts subjects. Those with
children under the age of 5 are more likely to think that the arts do not get
enough focus in schools (46%) compared to parents of children aged 19 or
older (28%).
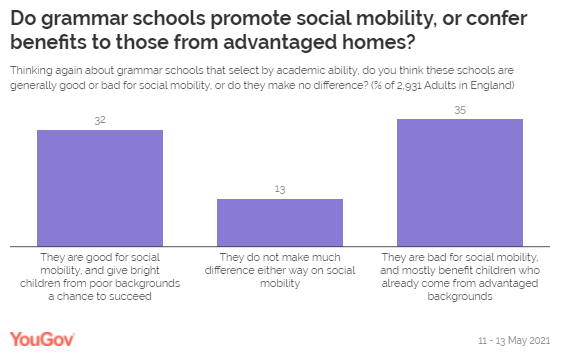
Are grammar schools good for social
mobility, and should private schools be banned? One topic that is always at the forefront of discussion around the
education system is that of private and grammar schools. What do parents and
adults make of elite education: does it benefit all or just a privileged few? The public is split on how grammar schools effect social mobility.
Some 32% of people think they give poor children a chance to succeed and are
good for social mobility, while 35% say they are bad, and limit advantages to
a select few. Another 13% think they make little difference either way.
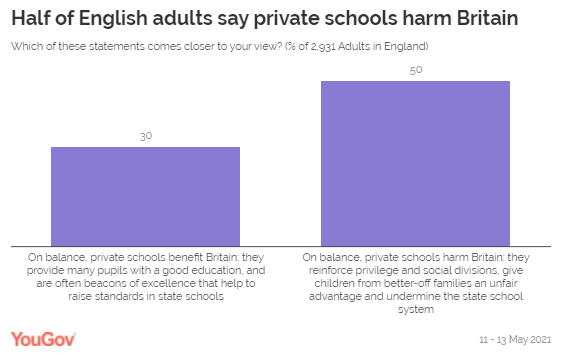
Moving on to private schools, half of people think they harm Britain
and that on balance they “reinforce privilege and social divisions” (50%) –
an opinion consistent among the parental groups. Three in ten people (30%) take the opposing view, instead feeling
more that private schools are “beacons of excellence that help to raise
standards in state schools”.
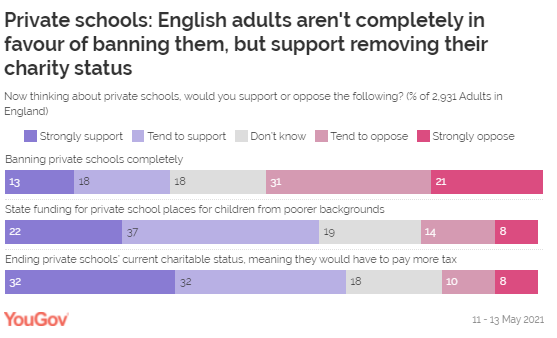
While people are opposed to banning private schools, they do support
ending their charitable status so they would have to pay more tax (64%), with
only 18% opposed to doing so. Most (59%) would also support state funding for
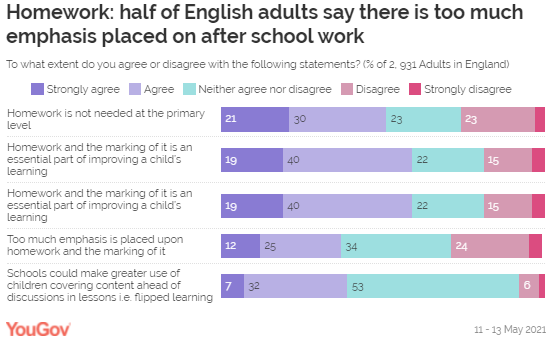
poorer children to attend private institutions. Is homework a good tool for learning, or is
there too much emphasis on it? Homework is another contentious subject, with some arguing it has a “limited
purpose” in teaching - but what do parents think? Among the public, some 59% agree that homework is an “essential part
of improving a child’s learning”. This opinion is most strongly held by those
with older children, including 65% of those with children over the age of 19,
and less reflected in those with children under 5 (47%). Another 51% of the public think that homework is not needed for
students at primary level – a sentiment shared by half of parents with
children at this stage of their education (50%), but is higher among those
with children under 5 (64%).
These parents of the youngest children are also the most likely to
think that too much emphasis is placed on the marking of homework (55%),
compared to three in ten of those with children aged over 19 (30%). (YouGov UK) June 03, 2021 693-43-09/Poll Environmental Protection Is A Matter Close To The Heart For Seven Out
Of Ten Germans
World Environment Day is celebrated on Saturday, June 5th. For
the majority of Germans, environmental protection is important: 70 percent
say that it is important to them. Not surprisingly, this is what voters
from the Greens are most likely to say (91 percent). Also voters of the
party "Die Linke" (86 percent), the SPD (79 percent) and the Union
(77 percent) are more important than the general population. This was
the result of a current YouGov survey in cooperation with Statista.
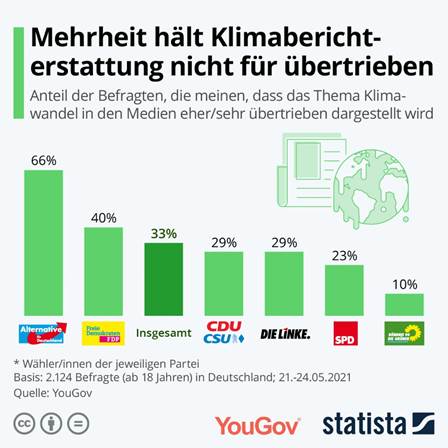
A THIRD OF GERMANS FIND CLIMATE CHANGE TO
BE EXAGGERATED IN THE MEDIA With their fight for environmental and climate protection, Greta
Thunberg and Fridays for Future have attracted a lot of media attention since
2018. Every third respondent in Germany (33 percent) thinks the media
coverage of climate change is excessive. More men (38 percent) say that
than women (28 percent). Differences are also apparent when looking at the voters of the
various parties. AfD voters in particular think that the topic of
climate change is being exaggerated in the media (66 percent). This is
what 40 percent of the voters of the FDP say. Green voters are the least
likely to give this figure (10 percent).
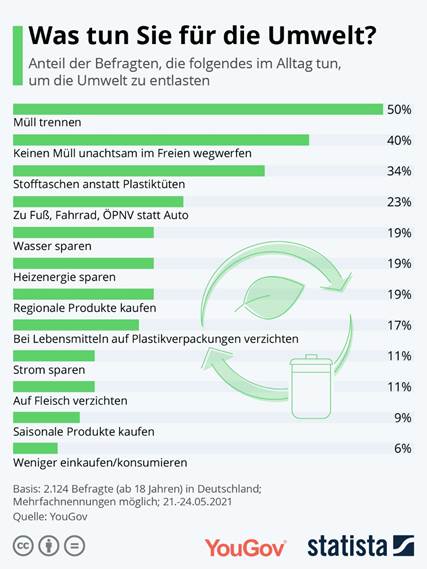
WASTE SEPARATION, CLOTH BAGS AND NO PLASTIC
PACKAGING - THAT IS WHAT GERMANS DO TO PROTECT THE ENVIRONMENT In order to consciously relieve the environment in everyday life,
every second German separates their garbage (50 percent). 40 percent say
they don't carelessly throw away rubbish outdoors or in nature, and 34
percent use cloth bags instead of plastic bags. Almost a quarter (23
percent) walk, ride a bike or use public transport instead of
driving. Every fifth person (19 percent) saves water and heating energy
or buys regional products. Only 11 percent of the Germans surveyed say they save electricity,
also when it comes to video streaming and video games, and 18-24 year-olds
least of all (4 percent).
Based on the YouGov
Omnibus , 2,124 people were surveyed from May 21 to 24, 2021 using
standardized online interviews. The results are weighted and
representative for the German population aged 18 and over. (YouGov Germany) June 2, 2021 Source: https://yougov.de/news/2021/06/02/umweltschutz-fur-sieben-von-zehn-deutschen-ein-her/ 693-43-10/Poll 52% Of The Spaniards Have Not Yet Planned Their Vacations Since They
Prefer To Wait To See How The Pandemic Evolves
With the arrival of the month of June, many are those who can no
longer think of anything other than the summer holidays. In addition,
this year the desire is greater than ever since with the increasingly high
vaccination rate, the coming months draw a much more hopeful horizon and
without so many restrictions that allow us to enjoy a summer more similar to
what we knew before. Faced with this scenario, Ipsos
wanted to know how the members of its What & Why Community approach their summer vacations , and thus be able to shed light
on the forecasts that the tourism sector can make regarding this campaign. While last summer 24% of respondents decided not to go on vacation,
this year 100% of those interviewed
affirm that they will. Despite this, 2 out of 3 admit that they have not
yet booked their vacations, stating 52% of them that they prefer to wait to
see how the pandemic evolves to make sure that everything is more controlled
and calm. Added to this are the undecided who still do not
have a clear destination (16%) or those who are waiting to be vaccinated
(12%). Where and how will the holidays be this
year? This year the summer holidays will be enjoyed within the national
territory, 81% of those interviewed
affirm that they will only travel within Spain . 18%
will combine the national with a trip abroad, and 2% who will spend their
vacations exclusively abroad. Within these destinations, as is customary at this time of
year, the majority (73%) will opt for
beach tourism seeking rest and disconnection from everyday life (57% ). On
the other hand, 33% will opt for city tourism, since there are also those
whose main motivation is to know new places (29%). Regarding where to stay, a change is observed compared to 2020,
since the percentage of those who will
choose to stay in a hotel or tourist complex increases by 10 points (38%
in 2020 compared to 48% in 2021); an option that is gaining followers
this summer compared to second homes,
which drops by 7 points compared to 2020, and homes of family
or friends that goes from 22% to 18%. In addition, since it is mostly a national tourism, almost the total
of those surveyed (86%) will choose the car as a means of transport to get to
their holiday destination, while 21% will use the plane and 8% the train. The Covid-19 will also be present on the
holidays Although this summer arises with important differences from the past,
Covid-19 continues to be a key factor when planning summer vacations and that
makes them different for 56% of those surveyed, and of these, 54% state that they will spend more time outdoors,
followed by 51% who will avoid crowded destinations or 44% who will travel to
nearby places. In addition, among those who have the option of telecommuting, almost
half of those surveyed, one in three (34%) affirm that they will extend their
stay at their holiday destination thanks to this job possibility. (Ipsos France) June 3, 2021 Source: https://www.ipsos.com/es-es/vacaciones-de-verano-si-pero-condicionadas-por-la-pandemia NORTH
AMERICA
693-43-11/Poll 51% Republicans Say United States Should Follow Its Own National
Interests Even When Allies Strongly Disagree
Americans’ views about key
international priorities – and China
specifically – differ widely by party, as recent Pew Research Center
surveys have found. But further differences emerge within party based on where people
turn for political news. Republicans and Republican-leaning independents who say their major
sources of political news are only sources
with right-leaning audiences (Fox News or talk radio) tend to be less open to
international cooperation and to have different foreign policy priorities
than other Republicans. Similarly, Democrats and Democratic-leaning
independents who only rely
on sources with left-leaning audiences (CNN, MSNBC, NPR, The New York Times
and/or The Washington Post) for political news stand apart from other
Democrats in some areas, including by placing a higher priority on
multilateralism and addressing global climate change. And when it comes to
China, partisans in these so-called “news bubbles” on both sides of the aisle
tend to hold more negative views than others in their respective parties. Below is a closer look at these dynamics. All findings are based on
an analysis of what outlets U.S. adults said they used as major sources for
political and election news in a September
2020 survey. The survey asked about eight different sources of news;
outlets are grouped according to the self-reported ideological leaning of
their audiences. You can read
more about the methodology here. Views of international cooperation Public attitudes about the importance of international cooperation
vary widely within party based on Americans’ news diets.
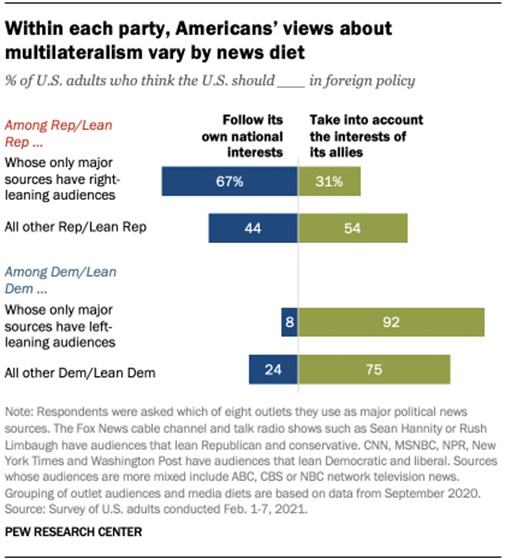
Overall, Republicans
are split over whether the United States should follow its own
national interests even when allies strongly disagree (51%) or whether the
U.S. should take into account the interests of its allies even if it means
making compromises with them (47%). But Republicans who only consume sources
with right-leaning audiences are much more likely than other Republicans to
say the U.S. should follow its own interests (67% vs. 44%). Democrats, for their part, are largely united in the view that the
U.S. should take into account the interests of its allies even if it means
making compromises with them (80% say this). But Democrats who only rely on
outlets with left-leaning audiences are somewhat more likely than other
Democrats to say the interests of allies should be taken into account (92%
vs. 75%). On a related question, Republicans who turn only to Fox News or talk
radio are less likely than other Republicans to say many of the problems
facing the country can be solved by working with other countries (20% vs.
36%). Democrats, however, are about equally likely to say this regardless of
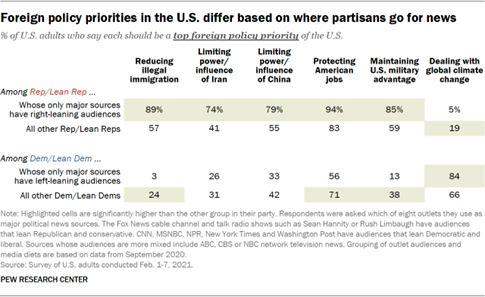
their media diet: Overall, 71% of Democrats hold this view. Foreign policy priorities When asked about foreign policy priorities, Republicans overall
prioritize traditional security goals and limiting immigration, while
Democrats are focused more on reducing the spread of infectious disease and
global climate change. Still, within each party, there are sharp divides in
some foreign policy priorities that relate to people’s media diets. Republicans who only use outlets with right-leaning audiences stand
out from other Republicans for the priority they place on protecting the jobs
of American workers, maintaining the U.S. military advantage over all other
countries, reducing illegal immigration into the U.S., limiting the power and
influence of Iran, and limiting the power and influence of China. This group,
for example, is 32 percentage points more likely than other Republicans to
say reducing illegal immigration into the U.S. should be a top foreign policy
priority. They are also much less likely
than other Republicans to prioritize dealing with global climate change (5%
vs. 19%).
Democrats who turn only to major news sources with left-leaning
audiences are much more likely than other Democrats to say dealing with
global climate change should be a top priority (84% vs. 66%). They are also
significantly less likely
than other Democrats to say reducing illegal immigration into the U.S. should
be a top foreign policy priority (3% vs. 24%). Views of China When asked about a series of foreign countries and organizations –
including Germany, the European Union, NATO and the UN – Republicans whose major
news sources are only Fox News or talk radio tend to be about as negative, or
more so, than other Republicans. Democrats who use only outlets with
left-leaning audiences, in turn, are about as positive, or more so, than
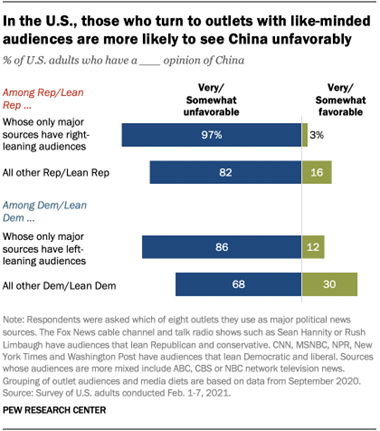
other Democrats. The pattern differs when it comes to China, however. In both partisan
coalitions, those who turn only to news outlets with audiences on the
ideological right or left are more likely than others in their party to have
an unfavorable opinion of China.
Republicans who only turn to Fox News or talk radio have an almost
universally unfavorable view of China (97%), while this is less the case for
other Republicans (82%). Similarly, Democrats who only turn to CNN, MSNBC,
NPR, The New York Times and/or The Washington Post are more likely than other
Democrats to have an unfavorable view of China (86% vs. 68%). It’s important
to note that while more conservative Americans – especially conservative
Republicans – tend to have more negative views of China, these media-related
patterns persist even after accounting for political ideology. The same pattern appears again when looking at views of Chinese
President Xi Jinping. Republicans who turn only to Fox News or talk radio are
more likely than other Republicans to say they have no confidence at all in
Xi (70% vs. 53%). On the Democratic side, those who turn only to outlets with
left-leaning audiences are slightly more likely than other Democrats to say
they have no confidence at all in Xi (37% vs. 32%). Republicans who turn only to news outlets with right-leaning
audiences and Democrats who turn only to outlets with left-leaning audiences
are also more likely than others in their respective parties to say the U.S.
should try to promote human rights in China, even if it harms economic
relations, and that China is doing a very bad job dealing with climate
change.
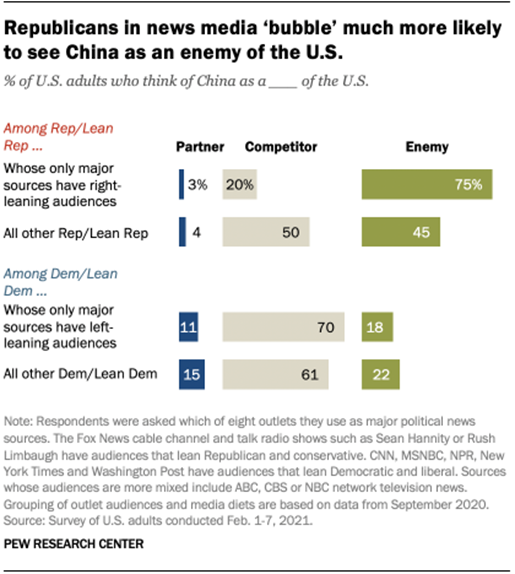
One area where Republicans who turn only to Fox News and talk radio
stand out strongly from other groups in both parties is on the question of
whether China is a partner, competitor or enemy of the U.S. Three-quarters of
these Republicans think of China as an enemy of the U.S., as opposed to a
competitor or partner. That compares with only 45% of Republicans with other
media diets and only about one-in-five Democrats, regardless of media diet. (PEW) JUNE 2, 2021 693-43-12/Poll Smartphone
Ownership (85%) And Home Broadband Subscriptions
(77%) Have Increased Among American Adults Since 2019
Smartphone ownership (85%) and home broadband subscriptions
(77%) have increased among American adults since 2019 – from 81% and 73%
respectively. Though modest, both increases are statistically significant and
come at a time when a majority of Americans say the internet
has been important to them personally. And 91% of adults report
having at least one of these technologies. A Pew Research Center survey of U.S. adults conducted from Jan. 25 to
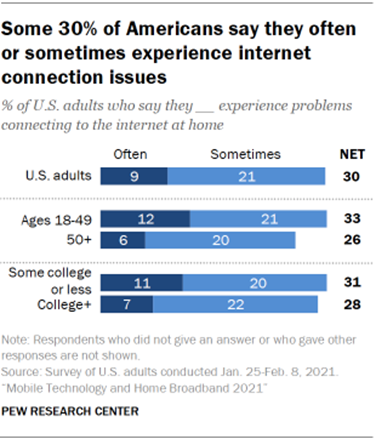
Feb. 8, 2021, also finds that some Americans have difficulties when trying to
go online. Some 30% of adults say they often or sometimes experience problems
connecting to the internet at home, including 9% who say such problems happen
often. Still, a majority of Americans say these connection troubles occur
rarely (41%) or never (21%). While there has been slight growth in the share who say they
subscribe to high-speed internet, about a quarter of the population still
does not have a broadband internet connection at home. And broadband
non-adopters continue to cite financial constraints as one of the most
important reasons why they forgo these services. Among non-broadband users,
45% say a reason why they do not have broadband at home is that the monthly
cost of a home broadband subscription is too expensive, while about
four-in-ten (37%) say the same about the cost of a computer. Beyond cost
barriers, a little fewer than half of non-users cite having other options for
internet access or the fact that their smartphone does everything online they
need as a reason why they do not have a high-speed internet connection at
home. Other major findings in this new survey:
These findings come from a nationally representative survey of 1,502
U.S. adults conducted via telephone Jan. 25-Feb. 8, 2021. The following
sections elaborate on those findings. Adults 65 and older are less likely to own
a smartphone; Americans with lower incomes or with less formal education are
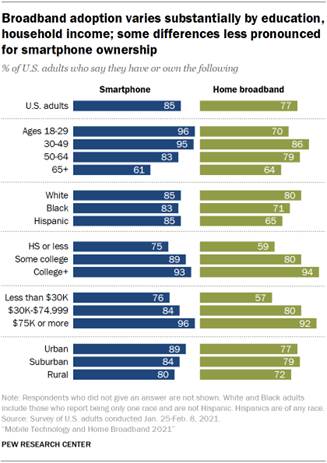
less likely to own a smartphone or have home broadband Fully 85% of adults now say they own a smartphone, up from 81% in
2019, when Pew Research Center last measured smartphone ownership. Some
long-running patterns in Center technology adoption studies are evident in
the new survey. Smartphone ownership is relatively common across major
demographic groups, but some substantial gaps in adoption remain, including
by age. While the share of adults ages 65 and older who have a smartphone has
increased from 53% to 61% in the past two years, this age cohort remains far
less likely than younger groups to report having this type of mobile device. As was the case in 2019, ownership rates also vary among the oldest
adults: 71% of adults ages 65 to 74 say they are smartphone owners, but that
share falls to 43% among those 75 and older. Additionally, those living in households earning less than $30,000
and those with a high school diploma or less are less likely than those in
higher-income households and those with higher levels of education to say
they have this type of device.
The share of Americans with home broadband subscriptions has similarly
grown since 2019 – from 73% of adults saying they have one in the previous
survey to 77% today. There are more pronounced variations across some
demographic groups, particularly in differences by annual household income
and educational attainment. For example, 92% of adults in households earning
$75,000 or more per year say they have broadband internet at home. But that
share falls to 57% among those whose annual household income is below
$30,000. The 35 percentage point gap between these two income groups is
nearly twice as large as the comparable gap for smartphone ownership – there
is a 20-point gap between those in households earning less than $30,000 per
year and those in households earning $75,000 or more who say they own a
smartphone. Educational differences follow a similar pattern. There remains a statistically significant gap between rural residents
who have home broadband and suburban residents, but while the gap was 16
percentage points in 2019, it is 7 points today. As has been true in other
Center surveys, there are still significant gaps in home broadband
adoption by race and ethnicity. White adults (80%) are more likely than Black
(71%) and Hispanic adults (65%) to have home broadband.1 Roughly one-in-ten Americans say they often
have problems connecting to the internet at home
While a majority of Americans say they rarely or never have issues
getting online at home, 30% say they experience such problems at least
sometimes, including 9% of adults who say this happens often. Relatively few Americans across major demographic groups report they
often have problems, but some groups are slightly more likely than others to
have that level of trouble connecting to the internet. For example, adults ages 18 to 49 are more likely than those 50 and
older to say they often experience problems connecting to the internet at
home (12% vs. 6%). And adults who have some college education or less formal
education are slightly more likely than college graduates to say they often
have these troubles (11% vs. 7%). There are no statistical differences among
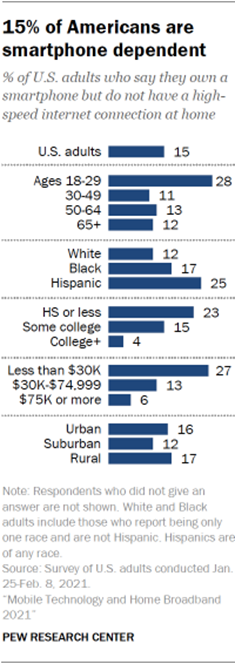
other major demographic groups. About three-in-ten adults under 30 are
smartphone dependent
Some 15% of Americans say they have a smartphone, but not a home
broadband connection. Pew Research Center has been studying these
“smartphone-only” internet users since 2013.
Smartphone dependence is more common among younger rather than older adults:
28% of adults ages 18 to 29 are in this “smartphone-only” category, compared
with 12% of those 30 and older. Some 27% of adults who live in a household earning less than $30,000
annually are smartphone-only. By comparison, 13% of those with household
incomes of $30,000 to $74,999 and 6% of those in households earning $75,000
or more fall into this category. A similar pattern is evident when it comes
to education: Those with a high school diploma or less are much more likely
to be smartphone dependent than those who have a bachelor’s or advanced
degree. There is also a gap between Hispanic and White adults: A quarter of
Hispanic adults are smartphone-only internet users, compared with about
one-in-ten White adults. And 17% of Black adults are smartphone dependent –
but this share is not statistically different from their White or Hispanic
counterparts. Similar shares of non-broadband users cite
their smartphones, cost and alternate internet access options as reasons for
not having broadband
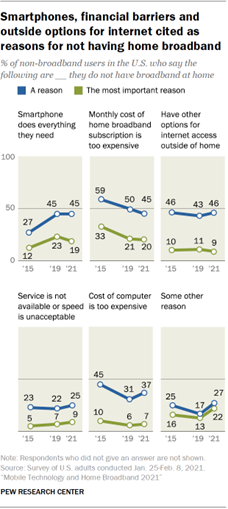
While a growing share of Americans say they have a high-speed
internet subscription at home, 23% do not. Financial barriers are among the more common reasons why Americans do
not subscribe to high-speed internet at home: 45% of non-broadband users say
a reason is that the monthly cost of a subscription is too expensive, while
about four-in-ten cite the cost of a computer as too expensive. Similar shares of non-broadband users say a reason is they have other
options for internet access outside of home (46%) or their smartphone lets them
do everything online that they need to do (45%). A smaller share of Americans
(25%) say they do not have a home subscription because broadband service is
not available where they live or not available at an acceptable speed. Some 27% of adults – up from 17% in 2019 – say they do not have
broadband at home for some other reason, including 11% who say it is because
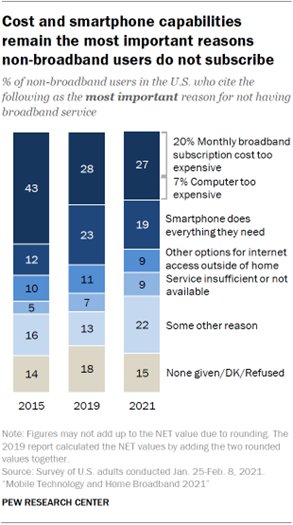
they are not interested, do not care for it or do not need it. Broadband non-adopters were asked which, among the reasons they
mentioned, was the most important
reason they did not have a broadband subscription at home.2 Some
27% of non-broadband users say the most important reason for not having
broadband at home is cost – including 20% who say a monthly broadband
subscription is too expensive and 7% who say a computer is too expensive.
About one-in-five adults (19%) say their most important reason for
not having broadband at home is that their smartphone does everything they
need to do online. Looking specifically at smartphone-dependent Americans,
three-in-ten say their smartphone doing everything they need to do online is
their most important reason for not having broadband at home. That share did
not meaningfully change from 2019. Smaller shares (9% each) say their most important reason for not
having high-speed internet at home is that they have other options for
internet access outside of home or that broadband service is not available,
or not available at an acceptable speed, where they live. Some 22% of non-broadband users cite some other reason as most
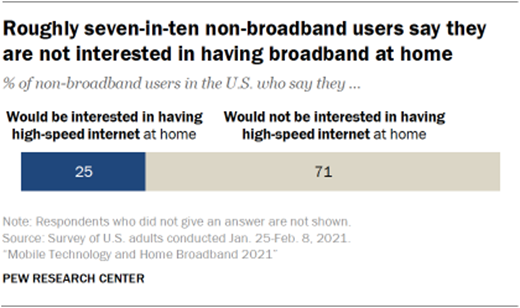
important for not having broadband at home, up from 13% in 2019. A majority of those without home broadband
are not interested in having it in the future
Roughly seven-in-ten non-broadband users (71%) say they would not be interested in having
broadband at home, while 25% think a home broadband subscription is something
that interests them. This is not a statistically significant increase from
the 2019 survey, when 18% said they would be interested in having broadband
at home. In previous Center surveys, Americans have indicated they think that
not having broadband could be tied to a number
of disadvantages – including difficulties finding job opportunities
or being disadvantaged in getting access to government services. (PEW) JUNE 3, 2021 Source: https://www.pewresearch.org/internet/2021/06/03/mobile-technology-and-home-broadband-2021/ 693-43-13/Poll 60% Of U.S. Adults Favor The Death Penalty For People Convicted Of
Murder
The use of the death penalty is gradually disappearing in the United
States. Last year, in part because of the coronavirus outbreak, fewer people
were executed than in any year in more than three decades.
Chart shows majority of Americans favor death penalty, but nearly
eight-in-ten see ‘some risk’ of executing the innocent Yet the death penalty for people convicted of murder continues to
draw support from a majority of Americans despite widespread doubts about its
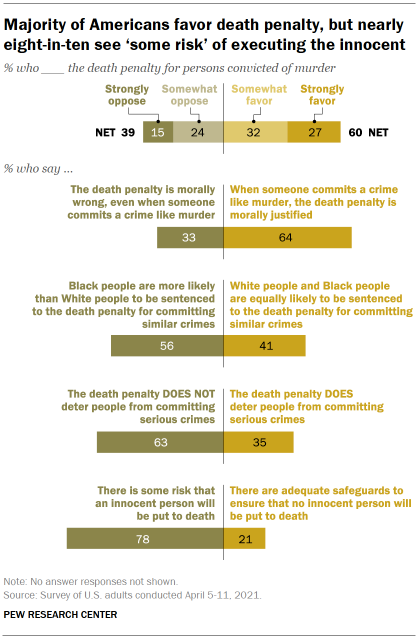
administration, fairness and whether it deters serious crimes. More Americans favor than oppose the death penalty: 60% of U.S.
adults favor the death penalty for people convicted of murder, including 27%
who strongly favor it. About four-in-ten (39%) oppose the death penalty, with
15% strongly opposed, according to a new Pew Research Center survey. The survey, conducted April 5-11 among 5,109 U.S. adults on the
Center’s American Trends Panel, finds that support for the death penalty is 5
percentage points lower than it was in August 2020, when 65% said they
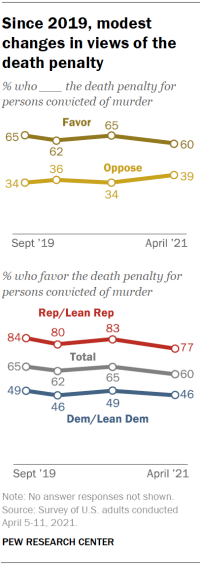
favored the death penalty for people convicted of murder. Chart shows since 2019, modest changes in views of the death penalty While public support for the death penalty has changed only modestly
in recent years, support for the death penalty declined substantially between
the late 1990s and the 2010s. (See “Death penalty draws more Americans’
support online than in telephone surveys” for more on long-term measures and
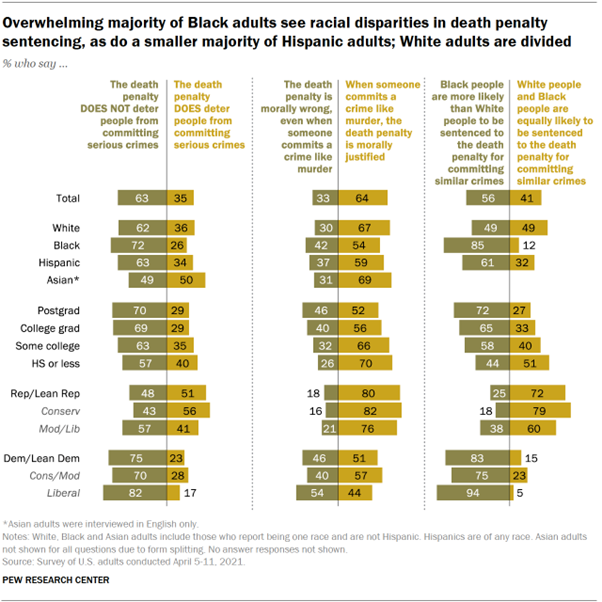
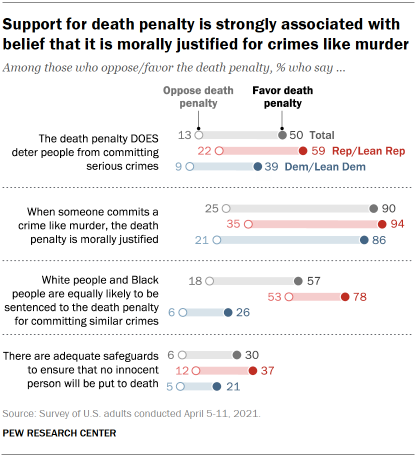
the challenge of comparing views across different survey modes.) Large shares of Americans express concerns over how the death penalty
is administered and are skeptical about whether it deters people from
committing serious crimes.
Nearly eight-in-ten (78%) say there is some risk that an innocent
person will be put to death, while only 21% think there are adequate
safeguards in place to prevent that from happening. Only 30% of death penalty
supporters – and just 6% of opponents – say adequate safeguards exist to
prevent innocent people from being executed. A majority of Americans (56%) say Black people are more likely than
White people to be sentenced to the death penalty for being convicted of
serious crimes. This view is particularly widespread among Black adults: 85%
of Black adults say Black people are more likely than Whites to receive the
death penalty for being convicted of similar crimes (61% of Hispanic adults
and 49% of White adults say this). Moreover, more than six-in-ten Americans (63%), including about half
of death penalty supporters (48%), say the death penalty does not deter
people from committing serious crimes. Yet support for the death penalty is strongly associated with a
belief that when someone commits murder, the death penalty is morally justified.
Among the public overall, 64% say the death penalty is morally justified in
cases of murder, while 33% say it is not justified. An overwhelming share of
death penalty supporters (90%) say it is morally justified under such
circumstances, compared with 25% of death penalty opponents. Chart shows greater support for death penalty in online panel surveys
than telephone surveys The data in the most recent survey, collected from Pew Research
Center’s online American Trends Panel (ATP), finds that 60% of Americans
favor the death penalty for persons convicted of murder. Over four ATP
surveys conducted since September 2019, there have been relatively modest
shifts in these views – from a low of 60% seen in the most recent survey to a
high of 65% seen in September 2019 and August 2020. In Pew Research Center phone surveys conducted between September 2019
and August 2020 (with field periods nearly identical to the online surveys),
support for the death penalty was significantly lower: 55% favored the death
penalty in September 2019, 53% in January 2020 and 52% in August 2020. The
consistency of this difference points to substantial mode effects on this
question. As a result, survey results from recent online surveys are not
directly comparable with past years’ telephone survey trends. A post
accompanying this report provides further detail and analysis of the mode
differences seen on this question. And for more on mode effects and the
transition from telephone surveys to online panel surveys, see “What our
transition to online polling means for decades of phone survey trends” and
“Trends are a cornerstone of public opinion research. How do we continue to
track changes in public opinion when there’s a shift in survey mode?” Partisanship continues to be a major factor in support for the death
penalty and opinions about its administration. Just over three-quarters of
Republicans and independents who lean toward the Republican Party (77%) say
they favor the death penalty for persons convicted of murder, including 40%
who strongly favor it. Democrats and Democratic leaners are more divided on this issue: 46%
favor the death penalty, while 53% are opposed. About a quarter of Democrats
(23%) strongly oppose the death penalty, compared with 17% who strongly favor
it. Over the past two years, the share of Republicans who say they favor
the death penalty for persons convicted of murder has decreased slightly – by
7 percentage points – while the share of Democrats who say this is
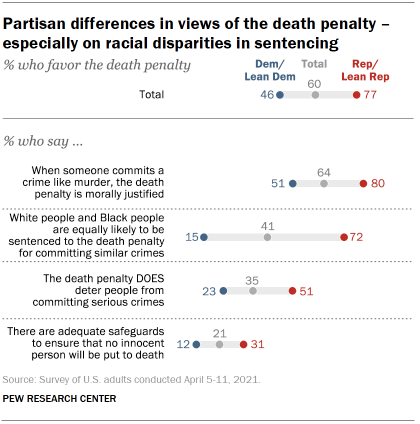
essentially unchanged (46% today vs. 49% in 2019). Chart shows partisan differences in views of the death penalty –
especially on racial disparities in sentencing
Republicans and Democrats also differ over whether the death penalty
is morally justified, whether it acts as a deterrent to serious crime and
whether adequate safeguards exist to ensure that no innocent person is put to
death. Republicans are 29 percentage points more likely than Democrats to say
the death penalty is morally justified, 28 points more likely to say it
deters serious crimes, and 19 points more likely to say that adequate
safeguards exist. But the widest partisan divide – wider than differences in opinions
about the death penalty itself – is over whether White people and Black
people are equally likely to be sentenced to the death penalty for committing
similar crimes. About seven-in-ten Republicans (72%) say that White people and Black
people are equally likely to be sentenced to death for the same types of
crimes. Only 15% of Democrats say this. More than eight-in-ten Democrats
(83%) instead say that Black people are more likely than White people to be
sentenced to the death penalty for committing similar crimes. Differing views of death penalty by race and ethnicity, education,
ideology There are wide ideological differences within both parties on this
issue. Among Democrats, a 55% majority of conservatives and moderates favor
the death penalty, a position held by just 36% of liberal Democrats (64% of
liberal Democrats oppose the death penalty). A third of liberal Democrats
strongly oppose the death penalty, compared with just 14% of conservatives
and moderates. Chart shows ideological divides in views of the death penalty,
particularly among Democrats
While conservative Republicans are more likely to express support for
the death penalty than moderate and liberal Republicans, clear majorities of
both groups favor the death penalty (82% of conservative Republicans and 68%
of moderate and liberal Republicans). As in the past, support for the death penalty differs across racial
and ethnic groups. Majorities of White (63%), Asian (63%) and Hispanic adults
(56%) favor the death penalty for persons convicted of murder. Black adults
are evenly divided: 49% favor the death penalty, while an identical share
oppose it. Support for the death penalty also varies across age groups. About
half of those ages 18 to 29 (51%) favor the death penalty, compared with
about six-in-ten adults ages 30 to 49 (58%) and those 65 and older (60%).
Adults ages 50 to 64 are most supportive of the death penalty, with 69% in
favor. There are differences in attitudes by education, as well. Nearly
seven-in-ten adults (68%) who have not attended college favor the death
penalty, as do 63% of those who have some college experience but no degree. Chart shows non-college White, Black and Hispanic adults more
supportive of death penalty About half of those with four-year undergraduate degrees but no
postgraduate experience (49%) support the death penalty. Among those with
postgraduate degrees, a larger share say they oppose (55%) than favor (44%)
the death penalty.
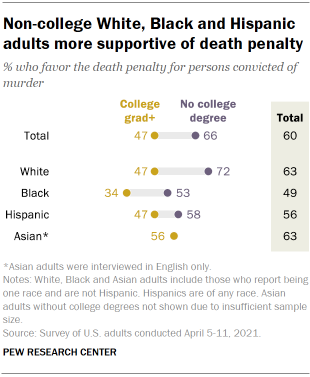
The divide in support for the death penalty between those with and
without college degrees is seen across racial and ethnic groups, though the
size of this gap varies. A large majority of White adults without college
degrees (72%) favor the death penalty, compared with about half (47%) of
White adults who have degrees. Among Black adults, 53% of those without
college degrees favor the death penalty, compared with 34% of those with
college degrees. And while a majority of Hispanic adults without college
degrees (58%) say they favor the death penalty, a smaller share (47%) of
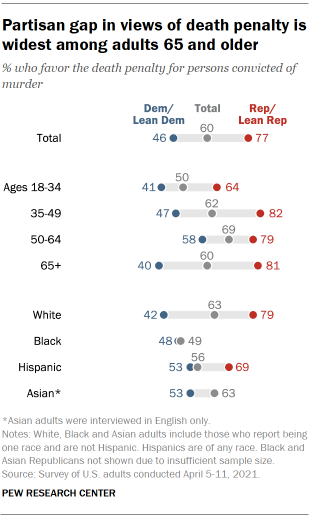
those with college degrees say this. Intraparty differences in support for the death penalty Republicans are consistently more likely than Democrats to favor the
death penalty, though there are divisions within each party by age as well as
by race and ethnicity. Republicans ages 18 to 34 are less likely than other Republicans to
say they favor the death penalty. Just over six-in-ten Republicans in this
age group (64%) say this, compared with about eight-in-ten Republicans ages
35 and older. Chart shows partisan gap in views of death penalty is widest among
adults 65 and older
Among Democrats, adults ages 50 to 64 are much more likely than
adults in other age groups to favor the death penalty. A 58% majority of 50-
to 64-year-old Democrats favor the death penalty, compared with 47% of those
ages 35 to 49 and about four-in-ten Democrats who are 18 to 34 or 65 and
older. Overall, White adults are more likely to favor the death penalty than
Black or Hispanic adults, while White and Asian American adults are equally
likely to favor the death penalty. However, White Democrats are less likely
to favor the death penalty than Black, Hispanic or Asian Democrats. About
half of Hispanic (53%), Asian (53%) and Black (48%) Democrats favor the death
penalty, compared with 42% of White Democrats.
About eight-in-ten White Republicans favor the death penalty, as do
about seven-in-ten Hispanic Republicans (69%). Differences by race and ethnicity, education over whether there are
racial disparities in death penalty sentencing There are substantial demographic differences in views of whether
death sentencing is applied fairly across racial groups. While 85% of Black
adults say Black people are more likely than White people to be sentenced to
death for committing similar crimes, a narrower majority of Hispanic adults
(61%) and about half of White adults (49%) say the same. People with
four-year college degrees (68%) also are more likely than those who have not
completed college (50%) to say that Black people and White people are treated
differently when it comes to the death penalty. Chart shows overwhelming majority of Black adults see racial
disparities in death penalty sentencing, as do a smaller majority of Hispanic
adults; White adults are divided About eight-in-ten Democrats (83%), including fully 94% of liberal
Democrats and three-quarters of conservative and moderate Democrats, say
Black people are more likely than White people to be sentenced to death for
committing the same type of crime – a view shared by just 25% of Republicans
(18% of conservative Republicans and 38% of moderate and liberal
Republicans). Across educational and racial or ethnic groups, majorities say that
the death penalty does not deter serious crimes, although there are
differences in how widely this view is held. About seven-in-ten (69%) of
those with college degrees say this, as do about six-in-ten (59%) of those
without college degrees. About seven-in-ten Black adults (72%) and narrower
majorities of White (62%) and Hispanic (63%) adults say the same. Asian
American adults are more divided, with half saying the death penalty deters
serious crimes and a similar share (49%) saying it does not. Among Republicans, a narrow majority of conservative Republicans
(56%) say the death penalty does deter serious crimes, while a similar share
of moderate and liberal Republicans (57%) say it does not. A large majority of liberal Democrats (82%) and a smaller, though
still substantial, majority of conservative and moderate Democrats (70%) say
the death penalty does not deter serious crimes. But Democrats are divided
over whether the death penalty is morally justified. A majority of
conservative and moderate Democrats (57%) say that a death sentence is
morally justified when someone commits a crime like murder, compared with
fewer than half of liberal Democrats (44%). There is widespread agreement on one topic related to the death
penalty: Nearly eight-in-ten (78%) say that there is some risk an innocent
person will be put to death, including large majorities among various racial
or ethnic, educational, and even ideological groups. For example, about two-thirds
of conservative Republicans (65%) say this – compared with 34% who say there
are adequate safeguards to ensure that no innocent person will be executed –
despite conservative Republicans expressing quite favorable attitudes toward
the death penalty on other questions. Overwhelming share of death penalty supporters say it is morally
justified Those who favor the death penalty consistently express more favorable
attitudes regarding specific aspects of the death penalty than those who
oppose it. Chart shows support for death penalty is strongly associated with
belief that it is morally justified for crimes like murder
For instance, nine-in-ten of those who favor the death penalty also
say that the death penalty is morally justified when someone commits a crime
like murder. Just 25% of those who oppose the death penalty say it is morally
justified. This relationship holds among members of each party. Among
Republicans and Republican leaners who favor the death penalty, 94% say it is
morally justified; 86% of Democrats and Democratic leaners who favor the
death penalty also say this. By comparison, just 35% of Republicans and 21% of Democrats who
oppose the death penalty say it is morally justified. Similarly, those who favor the death penalty are more likely to say
it deters people from committing serious crimes. Half of those who favor the
death penalty say this, compared with 13% of those who oppose it. And even
though large majorities of both groups say there is some risk an innocent
person will be put to death, members of the public who favor the death
penalty are 24 percentage points more likely to say that there are adequate
safeguards to prevent this than Americans who oppose the death penalty. On the question of whether Black people and White people are equally
likely to be sentenced to death for committing similar crimes, partisanship
is more strongly associated with these views than one’s overall support for
the death penalty: Republicans who oppose the death penalty are more likely
than Democrats who favor it to say White people and Black people are equally
likely to be sentenced to death. Among Republicans who favor the death penalty, 78% say that Black and
White people are equally likely to receive this sentence. Among Republicans
who oppose the death penalty, about half (53%) say this. However, just 26% of
Democrats who favor the death penalty say that Black and White people are
equally likely to receive this sentence, and only 6% of Democrats who oppose
the death penalty say this. (PEW) JUNE 2, 2021 693-43-14/Poll Four In Ten (40%) Working Canadians Say They’ve Experienced A Decline
In Their Physical Health Throughout The Pandemic
Toronto, ON, June 1, 2021 — As
vaccination rates have ramped up across the country, and businesses are
starting to prepare for a post-pandemic future, working Canadians continue to
face a number of health-related challenges. Four in ten (40%) working
Canadians say they’ve experienced a decline in their physical health
throughout the pandemic, according to a recent Ipsos poll conducted on behalf
of RBC Insurance. The inability to socialize with family, friends or
co-workers (72%) and work-related stress (58%) were also cited as factors
impacting overall health. Barriers Remain for Some Workers Throughout the pandemic, working Canadians with chronic health issues
have faced increased barriers receiving the care they need, with over six in
ten (63%) noting the inability to visit a doctor or healthcare clinic has
negatively impacted their health. Those with a chronic health issue are more
likely to cite this compared to those without a chronic health issue (47%). Although a majority (58%) of working Canadians with a chronic health
issue or disability say their condition would deteriorate further without
their workplace benefits plan, four in ten (40%) say they have also
experienced challenges accessing their employees benefits due to their unique
needs. Virtual Care Solutions Useful for Employees
with Disabilities or Health Issues Among those who have group benefits or private coverage, Canadian
employees with a disability or a chronic heath issue are more likely to have
access to virtual care tools (48% and 51% respectively) compared to those who
do not. As well, those with a chronic health issue are more likely to agree
that using virtual tools to connect with mental health support has been
useful (64% vs 50% with no chronic health issue). (Ipsos Canada) 1 June 2021 AUSTRALIA
693-43-15/Poll Australian Formula 1 Grand Prix In Doubt For 2021 But It’s The
Ongoing V8 Supercars Series That Provides Value For Sponsors
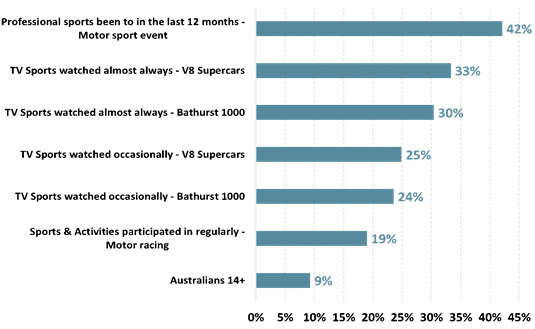
Nearly 4.6 million Australians watched motorsports including Formula
1, V8 Supercars, the Bathurst 1000, Drag racing and Rally car racing on TV in
2020. The leading motor sports events watched by Australians on TV are the
Bathurst 1000 watched by over 3.1 million, the V8 Supercars watched by 2.6
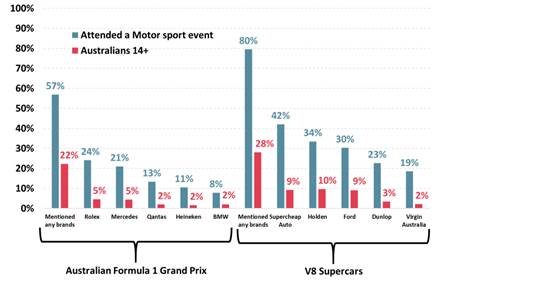
million and the Formula 1 watched by nearly 2.3 million. Of the 362,000 who attended a motorsports event last year a large
majority of 80% can name at least one brand they associate with V8 Supercars
compared to a smaller majority of 57% who can name a brand associated with
the Australian Formula 1 Grand Prix. In contrast, only around a quarter of all Australians, 28%, can name
a brand associated with V8 Supercars and just over a fifth, 22%, can name a
brand associated with the Australian Formula 1 Grand Prix. For those attending motor sport events the top brand associated with
V8 Supercars is former Bathurst 1000 naming rights sponsor Supercheap Auto
mentioned by 42% of attendees ahead of well-known Australian car brands
Holden (34%) and Ford (30%). Former V8 Supercars series naming rights sponsor
Virgin Australia is mentioned by 19% of motor sport attendees and is the
fifth most recognised sponsor of V8 Supercars. Clearly the top two sponsors associated with the Australian Grand
Prix are current naming rights sponsor Rolex mentioned by 24% of motor sport
attendees and leading car manufacturer Mercedes mentioned by 21%. In a sign of how enduring sports sponsorship associations are it is
former naming rights sponsor Qantas in third that is mentioned by 13% of
motor sport attendees as being associated with the Grand Prix. Qantas was the
naming rights sponsor for the Australian Formula 1 Grand Prix from 2010-2012
– nearly a decade ago. Top 5 Brands associated with Formula 1
& V8 Supercars by Australians and motor sport attendees
Supercheap Auto recall is highest for motor
sport attendees ahead of TV viewers Analysing brand association for last year’s Bathurst 1000 naming
rights sponsor Supercheap Auto shows that Australians who have attended a
motor sports event are the most likely to recall the brand when considering
brands and companies associated with V8 Supercars – although TV viewers of V8
Supercars and the Bathurst 1000 aren’t far behind. Over two-in-five motor sports attendees, or 42%, associate Supercheap
Auto with the V8 Supercars. The automotive parts retailer had been the naming
rights sponsor of Australia’s leading V8 Supercars race the Bathurst 1000 for
16 years from 2005-20. For Australian motor sports fans who regularly watch motor sport on
TV sponsor recall is also very high - with 33% of those who almost always
watch V8 Supercars associating Supercheap Auto with V8 Supercars and 30% of
those who almost always watch the Bathurst 1000 making the association. For occasional TV watchers sponsor recall reduces to around a quarter
for Supercheap Auto for both V8 Supercars viewers (25%) and Bathurst 1000
viewers (24%). Sponsor recall is slightly lower again for those Australians who
themselves participate in motor racing with just under a fifth, 19%,
associating Supercheap Auto with V8 Supercars and drops to under one-in-ten
of all Australians (9%). Supercheap Auto sponsor association to V8
Supercars for motorsport attendees, players & viewers
Michele Levine, CEO of Roy Morgan, says the
uncertain status of this year’s Australian Formula 1 Grand Prix is
highlighting the value provided by sponsoring the 12-race V8 Supercars series
held entirely at tracks around Australia and New Zealand: “The rescheduled Australian Formula 1 Grand
Prix was moved until mid-November 2021 from its usual March timeslot to avoid
the Australian border closure which began a year ago in March 2020. “However, this month’s Federal Budget has
put the status of the annual race in doubt with borders not expected to open
until mid-2022 meaning it will be all but impossible for the race to go ahead
if competitors are forced into mandatory two-week quarantine. The latest
outbreak and lockdown in Victoria also adds further doubt to the chances the
Formula 1 Grand Prix will go ahead. “This likelihood means naming rights
sponsor Rolex and leading manufacturer Mercedes are likely to miss out on the
publicity boost that the Grand Prix brings for a second straight year but for
motorsports fans there is the alternative provided by the Australian-based V8
Supercars series. “The V8 Supercars series provides a great platform
for sponsors looking to reach Australia’s 4.6 million motor sports fans and
the sponsorship associations with the V8 Supercars is stronger than that seen
with the Formula 1 Grand Prix. A large majority of 80% of Australians who
attended a motorsports event last year can name a brand associated with V8
Supercars compared to 57% for the Australian Formula 1 Grand Prix. “The long-running sponsor of the Bathurst
1000 Supercheap Auto is the leading brand mentioned by 42% of motorsport
attendees ahead of manufacturers Holden (34%) and Ford (30%). V8 Supercars
series naming rights sponsor from 2016-2020 Virgin Australia was mentioned by
19% of attendees. “The value attained by the V8 Supercars
sponsors has been noticed by rival companies. Automotive parts retailer Repco
signed a deal in September 2020 to sponsor the V8 Supercars, as well as the
iconic Bathurst 1000 race, from 2021-25 replacing both previous naming rights
sponsors Supercheap Auto and Virgin Australia. “The exit of Holden from the Australian car
market at the end of 2020 also signals further change ahead for the sport
with Holden parent company General Motors set to join the V8 Supercars series
in 2022 as ‘General Motors Specialty Vehicles’ (GMSV) using a Chevrolet
Corvette. “The departure of two of the most widely
recognised sponsors of V8 Supercars (Holden and Virgin Australia), and the
ending of the long-running Supercheap Auto sponsorship of the Bathurst 1000,
gives businesses looking to build their profile the opportunity to connect
quickly with the millions of Australians who watch and enjoy V8 Supercars.” (Roy Morgan) June 01 2021 693-43-16/Poll Australian Unemployment Increases To 10.3% In May – A Month After The
End Of Jobkeeper
Latest Roy Morgan employment series data shows 1.49 million
Australians unemployed in May – up 186,000 on April for an unemployment rate
of 10.3% with the increase somewhat offset by a fall in under-employment
which dropped 101,000 in May to 1,256,000 (8.6%).
Roy Morgan’s unemployment figure of 10.3%
for May is over 4% points higher than the current ABS estimate for April 2021 of 5.5%.
However, the ABS figure for April counts as employed an additional 59,000
Australians who were working zero hours for ‘economic reasons’. If these
non-workers are added back the ABS unemployment estimate for March increases
to 815,000 (5.9%). The ABS also claims there are nearly 1.1 million
Australians (7.8%) under-employed for a total of 1.9 million unemployed or
under-employed (13.8% of the workforce).
Compared to early March 2020, before the
nation-wide lockdown was implemented, in May 2021 there were nearly 600,000
more Australians either unemployed or under-employed (+3.3% points) even
though overall employment (13,069,000) is now higher than it was pre-COVID-19
(12,913,000). Unemployment now lowest in NSW – but
increases in all other States in May Unemployment is now lowest in NSW and was down 1.9% points to 7.9% -
the only State to see a fall in the measure in May. In all other States
unemployment increased in line with the national result.
Roy Morgan Unemployment &
Under-employment (2019-2021)
Michele Levine, CEO Roy Morgan, says
although the end of JobKeeper did not immediately presage a rise in
unemployment the latest estimates for May show unemployment rising back above
10% and a new (and extended) lockdown in Melbourne raising further concerns: “The latest Roy Morgan employment estimates
for May show unemployment rising 1.3% points to 10.3% a month after the end
of the $89 billion JobKeeper wage subsidy program. The fall in
under-employment, down 0.7% points to 8.6%, meant overall labour
under-utilisation was up 0.6% to 18.9% with 2.75 million Australians now
unemployed or under-employed – almost 600,000 more than pre-COVID-19. “Although the end of JobKeeper did not lead
to an immediate rise in unemployment in April the withdrawal of the
fortnightly payments to businesses puts the economy in a more vulnerable
position to deal with any new outbreaks and associated lockdowns – as we are
now seeing in Melbourne. “There is some good news in the latest
employment estimates with full-time jobs increasing for a seventh straight
month for the first time ever (November 2020 – May 2021) to a record high of
8,679,000. The jobs growth over the last seven months has come as the economy
recovered from Victoria’s long second wave of COVID-19 from June – October
2020. “However, the latest outbreak and lockdown
in Melbourne shows the recovery remains on a fragile footing until a sizeable
majority of Australians, estimated at around 80% of the population, are
vaccinated against COVID-19. Unfortunately, this is unlikely to happen for at
least another six months. “On a State-by-State basis NSW now has the
lowest unemployment at 7.9% with Victoria the second lowest at 8.5% -
although this was before the latest lockdown which is sure to put pressure on
jobs that are no longer being supported by the JobKeeper wage subsidy. “The lower unemployment in both NSW and
Victoria is perhaps unsurprising when one considers that nearly two-thirds of
the $89 billion JobKeeper wage subsidy payments went to either NSW ($30
billion) or Victoria ($28.1 billion) although these two States comprise only
around 55% of the national economy. “These figures are reflected in the Federal
Government’s COVID-19 funding per capita which shows Victoria ($6,760) and NSW
($6,409) receiving the highest funding. This funding distribution makes sense
as these two States, and particularly Victoria, have been hardest hit by the
pandemic with over 85% of Australia’s 30,000 COVID-19 infections in either
Victoria (20,600) or NSW (5,600). “Although Treasurer Josh Frydenberg was
rightly proud of the latest ABS Australian GDP estimates for the March quarter
2021 which showed the
economy grew 1.8% in the first three months of this year and 1.1% over the 12
months to March 2021 there is still a long way to go before the Australian
economy returns to a sustainable post-pandemic ‘normality’.” This Roy Morgan survey on Australia’s unemployment and ‘under-employed’* is based on weekly
interviews of 758,633 Australians aged 14 and over between January 2007 and
May 2021 and includes 7,028 telephone and online interviews in May
2021. *The ‘under-employed’ are those
people who are in part-time work or freelancers who are looking for more
work. Roy Morgan Unemployed and ‘Under-employed’*
Estimates
*Workforce
includes those employed and those looking for work – the unemployed.
Source: Roy Morgan Single Source October 2006 – May 2021.
Average monthly interviews 4,000. Note: Roy
Morgan unemployment estimates are actual data while the ABS estimates are
seasonally adjusted. Roy Morgan Research cf. ABS Unemployment
Estimates
Source: Roy Morgan Single Source January 2000 – May
2021. Average monthly interviews 4,000. Note: Roy Morgan unemployment estimates are actual data
while the ABS estimates are seasonally adjusted.
(Roy Morgan) June 04 2021 Source: https://www.roymorgan.com/findings/8722-australian-unemployment-estimates-may-2021-202106040743 MULTICOUNTRY
STUDIES
693-43-17/Poll Most Of The Total Adult Population In The US (59%)
And In The UK (72%) Are Meat-Eaters
According to the Food and Agricultural
Organisation of the United Nations, the world’s total meat production in
2020 was more or less the same as it was the previous year. The
same report also says that the annual average indices of all meat
products that constitute the index fell in 2020. So, with
consumption of meat remaining static (or even shrinking) globally –
and confounding many expectations - we thought we’d look
into eating habits in the UK and the US. According to data collected by YouGov Profiles,
which studies consumer behaviour, opinions and habits across 17
markets, most of the total adult population in the US (59%) and in
the UK (72%) are meat-eaters. Vegetarianism is practised by only 3% of
adults in the US and 5% in Great Britain.
More than half (58%) of the American adults who identify themselves
as flexitarians believe that a meatless diet is a healthier option,
albeit that a quarter (25%) of them disagree. Compared to the
general population, half of Americans (50%) agree that going meat-free
is better for you, while 32% disagree. Flexitarians in Great Britain are less likely to agree
to the same statement (44%) while 35% disagree with it
altogether.
Yet when asked if being a vegan is more ethical, flexitarians in
Britain were on the fence - 40% agreed while 38%
disagreed. In the US, there is more of a difference
- 42% of flexitarians agreed with the notion, compared
to 37% who disagreed but it’s still much less than the
proportion of the same group who tell us that they are trying to eat less
meat.
(YouGov UK) May 31, 2021 693-43-18/Poll Are Consumers Moving Back To Offline Shopping?
We probably all wish for normality, but even if it is gradually
returning in many areas of life, the pandemic has changed many things
forever. A new normal is emerging, and one industry where it is still
very open what this normal will look like is retail. Closed stores and
distance bids have led to an online shopping boom. A YouGov study
provides answers to whether consumers have got used to a new way of shopping
and what they miss about shopping in stores. In January and February 2021, we surveyed consumers in 17 markets
about their shopping habits in the previous three months. The extensive
results are now available in the form of the YouGov International Retail Report . On
average, 81 percent of those surveyed stated that they had shopped
online. Non-essential goods such as clothing, books and electronics were
more often bought online than in physical stores. The Covid effect is
unmistakable: In countries with stricter restrictions, the gap between online
and offline buyers is greater. It is one of the greatest divergences in
Germany: 46 percent of those surveyed bought non-essentials in stores, 74
percent online. In Australia, on the other hand, the number of offline
shoppers was higher than that of online shoppers. Will online business benefit from this in the long term? Or will
the new customers acquired during the lockdown all go back to the shops in
their area? Only 29 percent of those surveyed name social distancing as
a reason to shop online. On the other hand, 47 percent say it is easier
to shop online and 57 percent cite home delivery as an important
benefit. Delivery costs are most frequently cited as disadvantageous,
and longer delivery times also discourage customers from shopping
online. A serious disadvantage is that the products cannot be touched or
tried on, coupled with inadequate exchange options. The Germans deviate from these global averages in some interesting
respects. Much more often than others - including their European
neighbors - German consumers see it as an advantage that products can be
compared with one another more easily online. It is the second most
frequently mentioned online advantage in this country. Much less than
others, Germans see the advantage of being able to save money online with
special offers as an advantage. Germans also have data protection
concerns far less often than consumers in France, Poland and especially
Spain, where twice as many people as we are concerned about the security of
their data when shopping online. These concerns are even greater in
emerging markets. Again, Germans see it a little differently. For them, speed is
not a reason to buy in the store. Instead, they more often cite the
advantage of being able to go shopping with other people offline. The
most common obstacle is a lack of shops nearby. Whether people prefer to shop online or offline depends on a few
other factors, including the product category. Details can be found in
the free study here . (YouGov Germany) Source: https://yougov.de/news/2021/05/31/schwenken-verbraucher-zuruck-zum-offline-einkauf/ 693-43-19/Poll One In Six Consumers In The US (17%) And One In Seven In Great
Britain (15%) Said They Play Games Such As Candy Crush Saga And Bejeweled
Blitz
The mobile gaming industry is as strong as it has ever been. The
pandemic-enforced curbs on several other forms of entertainment resulted in
increased consumer interest in mobile gaming. A YouGov study in April
revealed that the surge in mobile gaming is likely to continue even after
the pandemic
has been overcome. Let's explore the types of mobile games that consumers are most drawn
to in two key markets: the US and Great Britain. Data from YouGov
Profiles reveals that Puzzle and Breakout games constitute the most popular
category in both markets. About one in six consumers in the US (17%) and one
in seven in Great Britain (15%) said they play games such as Candy Crush Saga
and Bejeweled Blitz.
In the US, Card/Casino and Word/Number/Brain games were tied at the
second spot with one in nine Americans (11%) saying they played games from
those genres on their cell phones over the past month. Action games (8%) and
Adventure games (7%) featured in the top five as well. There were significant differences in mobile gaming genres consumed
across various generations. In the US, Action games enjoyed disproportionate
popularity among members of Gen Z (2000 and later). One in five (21%) of them
said they played Action games like Subway Surfers or Cut the Rope over the
past month. For comparison, only one in fourteen Gen X (1965-1981)
members said they played games from that genre. The Puzzle/Breakout genre enjoyed the most popularity among
Gen X, with one in five (22%) consumers saying they play these
types of games. Members of Gen X were more than twice as likely to have
played Card/Casino games than their Gen Z counterparts. One-seventh of them
(15%) picked that genre compared to one in seventeen (6%) of Gen Z consumers.
Stark consumption differences were observed by as well. Women
were far likelier than men to have played games from the Puzzle/Breakout and
Word/Number/Brain categories, while men were likelier to have opted for games
from the Action and Adventure genres. The most popular types of mobile games in
Great Britain Interestingly, the five most popular mobile game genres in the UK
mirror those seen in the US, albeit in a different order. Action and Brain
categories jointly claimed the second spot with one in ten (10%) consumers
saying they played those types of games in the past month.
The Card/Casino and Adventure genres closed out the top five with one
in fourteen (7%) Brits saying they played games from those categories. Like in the US, Puzzle/Breakout games won the popularity contest
among Gen X, with one in five (19%) people from that generation indicating
they played that genre of games. One in six British
Millennials (1982-1999) were drawn to action games, making it the second
most popular genre in that generation, after Puzzle games. Action games won
out in Gen Z, receiving votes from one in eight (13%) of them. Even gender-based preferences ran parallel to those seen in the US
market. British women tended towards Puzzle/Breakout games (18%) and
Word/Number/Games (12%) in greater shares than their male counterparts (13%
and 9%, respectively). Meanwhile, one in eight (13%) men chose action games,
making them twice as likely as women to do so (6%). A similar affinity was
seen with Adventure games, with one in eleven (9%) men playing games from
that genre compared to only one in twenty-five (4%) women. (YouGov UK) June 01, 2021 693-43-20/Poll Israel Is Least Favorable Amongst Britons, With Favorability Falling
From -14 In February To -41 In May Following Gaza Strikes
The ongoing conflict between Israel and Palestine has recently flared up again,
with Israel executing air strikes on the Gaza Strip, in response to rocket attacks
by Hamas. With an estimated 243 lives lost – almost all civilian – both Hamas
and Israel have now agreed
to a ceasefire. Now new YouGov Eurotrack data shows that Israel’s favourability
across Europe has suffered significantly since we last tested it in February,
with net favourability for the nation falling by at least 14 points in all
countries surveyed.
Of all the countries surveyed, Israel is least favourable amongst
Britons, with favourability falling from -14 in February to -41 in May, its
lowest rating in Britain since we started asking this question in 2016.
Israel’s favourability is lowest amongst Labour voters, of whom only 13% view
Israel favourably, with 68% viewing the country unfavourably (a net score of
-55). Conservative voters view Israel more favourably, although perceptions
are still largely negative: 29% have a favourable impression of Israel while
53% have an unfavourable impression (net -24). The next highest fall in Israel’s favourability is seen in France,
decreasing 23 points from -13 to -36, the country’s lowest favourability
rating amongst the French since May 2019. A similar fall can be seen in
Denmark, experiencing a 22 point drop from -17 to -39. Sweden and Germany see
the smallest falls in favourability, at 17 and 14 points respectively.
Germany stands out from the rest of the countries surveyed with the highest
net favourability rating for Israel at-24, nine points higher than the next
highest country (Sweden) at -33. (YouGov UK) June 04, 2021 693-43-21/Poll Protect The Environment And Fight Climate Change: Individuals’
Responsibility And The Role Of Companies And Governments
Climate change has already been a reality for several years, and one
of its main consequences is global warming, which is perceived as a threat to humanity by 85% of the
global population surveyed (in APAC and Americas the share is
even higher, with 87% of the population believing global warming is a
threat).
In line with the belief that personal actions can have an impact and
that it is not too late to stop climate change, 66% of the global population affirms that they would like to live more
sustainably, even if they find that often they don’t make the necessary
changes in their own behaviors: people who are keener in admitting
that are mostly in the APAC region and America, indeed Paraguay (90%), South
Korea (81%), the Philippines (77%), India (77%) and Chile (76%) are at the
top of the ranking. Vilma Scarpino, President of WIN
International Association, said “The WIN Worldwide Survey still shows that the majority of the world
population considers climate change as a serious threat to humankind, and 54%
think that is not too late to curtail climate change. Citizens around the
world are aware of their responsibility when it comes to applying sustainable
behaviors in their everyday life but, at the same time, they expect
businesses and governments to also do their part. Considering that many want
to live more sustainably, governments and companies’ efforts towards
sustainability could also be a driver to individuals’ behavioral change.” (WIN) 4 Jun 2021 |
|||||||||||||||||||||||||||||||||||||||||||||||||||||||||||||||||||||||||||||||||||||||||||||||||||||||||||||||||||||||||||||||||||||||||||||||||||||||||||||||||||||||||||||||||||||||||||||||||||||||||||||||||||||||||||||||||||||||||||||||||||||