|
BUSINESS & POLITICS IN THE WORLD
GLOBAL OPINION REPORT NO. 694 Week: June 07 –June 13, 2021 Presentation: June 17, 2021 CONTENTS 694-43-21/Commentary: 77% Canadians Agree
There Should Be a National Day of Remembrance for Victims of Residential
Schools, but Split on Removing Statues (52%)…….2 SUMMARY OF POLLS………………………………………………………………..........................................8 ASIA More Than a Third (35%) of Urban Indian
Would Self-medicate If They Showed Covid
Symptoms…………………………………………………………………………………………………….16 74% of Singaporeans Think
Government was Handling the Coronavirus Situation Well Whereas 23% Think They
Were Handling It Badly………………………………………………………………………………………20 Iranian
Elections Show Lowest Turnout Ever--With Only 25% of Respondents Saying They
Would Vote……………………………………………………………………………………………………………23 MENA: Only
Half of UAE Residents are Aware of the New Measures Around Live Entertainment
in Dubai………………………………………………………………………………………………………………..29 EUROPE Majority (58%) of Brits
Expect House Prices to Increase In the Year
Ahead…………………………………………………………………………………………………………………32 One in Four Britons Receive Scam Calls,
Texts and Emails Daily…………………………………………………..36 17% Britons Have Temporarily Cut off
Contact With Their Siblings……………………………………………….38 NORTH AMERICA 41% Of U.S. Believe Geoengineering Would
Help Reduce Effects of Climate Change Whereas 53% Say it Would Not Make a
Difference………………………………………………………………………………………………..40 Americans Have Less Confidence In Key World
Leaders – Including Biden – Than Other Global Publics
do……………………………………………………………………………………………………………………...46 Slow Growth In U.S. Electric Vehicle
Market: Only 7% of Adults Have an Electric or Hybrid
Vehicle………………………………………………………………………………………………………………..50 NATO In a Favorable Light By People In
Member States: 61% Americans’ Opinion in
Favor………………………………………………………………………………………………………………….57 During The Pandemic, Teen Summer Employment
Hit Its Lowest Point (30.8%) Since the Great
Recession……………………………………………………………………………………………………………..64 46%
of Americans Believe Changing One's Gender is Morally Acceptable Whereas 51%
Believe It is Morally Wrong………………………………………………………………………………………………………………...76 Only 20% Of Americans
Believe COVID-19 To Be The Main Problem…………………………………………….84 SOUTH AMERICA: 93% of Brazilians Want to Get
Vaccinated…………………………………………………………………………..90 EUROPE: A Quarter Of Germans Own Smart Household
Appliances, 10 percent of them Own a Smart Washing
Machine……………………………………………………………………………………………………………….91 Two Out Of Five Germans Use Mobile Apps For
Voice Calls- Less Than The Global Average……………………………………………………………………………………………………………….95 60% of Italians Think That The Absence of Fans In Stadiums Will Make The
Tournament Less Interesting……………………………………………………………………………………………………………98 51% of Spanish Population Takes
into Account the Existence of Natural Products In its Cosmetics When Purchasing
Them………………………………………………………………………………………………………………102 Most Popular Holiday Types in The
Nordics……………………………………………………………………….105
INTRODUCTORY NOTE This weekly report consists of twenty-one surveys. The report
includes five multi-country studies from different states across the globe. 694-43-21/Commentary: 77% Canadians Agree
There Should Be a National Day of Remembrance for Victims of Residential
Schools, but Split on Removing Statues (52%) Six in Ten (62%) Say
They Know More about Residential Schools Now than Before the Discovery of the
Unmarked Burial Site Toronto, ON, June 9th, 2021 – The discovery of 215 unmarked graves at a former
residential school in Kamloops, British Columbia, has shone a spotlight on
the legacy of residential schools and has thrust conversations about
reconciliation to the forefront. A new Ipsos poll conducted for Global News
has found that most (77%) Canadians believe there should be a national day of
remembrance for the victims. The legacy of
residential schools and the path of truth and reconciliation in Canada has
been a subject of political discourse for many years, but recent events have
caused nearly two thirds (62%) of Canadians to agree that they know more now
about the residential school system than they did before the discovery of the
unmarked burial site. However, whether awareness will translate into action
remains to be seen. One potential action that some have been advocating for
is removing statues of architects of the residential school system, but
Canadians are split on the idea with half (52%) in favour, and half (48%)
against. Kamloops Discovery a Shock for 80%
of Canadians
The discovery of 215
bodies in unmarked graves in Kamloops has been a revelation for many
Canadians. Nearly all (89%) say they have seen, read, or heard anything (43%
a lot, 34% something, 12% not too much) about the Kamloops finding, and 80%
agree that they were shocked by the uncovering of the burial sites at the
former residential school. Quebecers are more likely than any other region to
say they were shocked by the Kamloops discovery (92% vs. 80% ATL, 79% ON, 74%
SK/MB, 70% BC, 70% AB). Despite conversations
about Truth and Reconciliation swirling in the political realm for years, it
seems this discovery might have made the legacy of Indian residential schools
feel more tangible for many: six in ten (63%) agree that the Kamloops
discovery changed their view of Indian Residential Schools. Not only do
Canadians indicate that they know more, but there appears to be more
political will- 77% agree there should be a national day of remembrance for
residential school victims, including missing indigenous children.
Canadians Agree Government and
Church Have Responsibilities in Reconciliation
Beyond the tragic nature
of finding 215 deceased children, much discussion has surrounded how to move
forward, who should bear responsibility for searching for more unmarked
burial sites, and how to atone for the legacy of residential schools. A
majority of respondents feel that both government and religion play a part in this: 87% of
Canadians agree that the Federal government should assist in searching the
grounds of other former residential schools to determine whether there are
more unmarked burial sites. The exact same proportion (87%) agree the
Catholic Church and religious organizations that ran residential schools need
to play a bigger role in reconciliation. Furthermore, eight in ten (81%)
agree that the Federal government must act now to help raise the quality of
life of Canada’s aboriginal people, a 6-point increase from 2020, and up 18
points from 2013. The role of the private
sector might also be a factor in reconciliation as 65% agree Canadian
businesses need to play a bigger role in reconciliation. Notably, indigenous
respondents indicate that the private sector has a part to play: 54% of
indigenous respondents say that they ‘strongly agree’ that businesses need to
play a bigger role in reconciliation (vs. 20% non-indigenous). Additionally,
Quebecers (81% vs. 64% ATL, 64% BC, 59% ON, 57% AB, 57% SK/MB) and Gen Z (78%
vs. 71% Millennial, 63% Gen X, 58% Boomer) are more likely to agree that the
private sector has a role to play in reconciliation. Whether a role in
reconciliation lay with businesses, government, or the church, Canadians
appear pessimistic that progress will be made quickly: 68% agree that real
reconciliation with indigenous peoples will not be achieved in their lifetime. Canadians Divided on Whether
Indigenous Peoples Are Treated Well by Canadian Government
Despite the strong
agreement that the federal government should be involved moving forward,
Canadians are divided on whether the treatment of indigenous peoples until
now has been adequate and whether the Prime Minister has kept his promises. While half of
respondents (54%) agree that Prime Minister Justin Trudeau has kept his
promise to build better relationships with Canada's indigenous peoples, there
is even less consensus on whether indigenous peoples are treated well by the
Canadian government. When asked in 2013
during the Idle No More movement which saw Attawapiskat Chief Theresa Spence
on hunger strike, 62% of Canadians agreed that indigenous Canadians were
treated well. This metric has only declined since. When asked in February
2020 during the rail blockades in support of the Wet'suwet'en Nation’s
opposition to the Coastal GasLink pipeline, 55% agreed that indigenous
peoples are treated well by the government. Presently, less than half (46%)
of Canadians agree that Canada's indigenous peoples are treated well by the
Canadian government, marking a 16-point decline in 8 years. Importantly,
indigenous respondents are significantly more likely to strongly disagree that indigenous peoples are treated well by the Canadian
government: (34% indigenous vs. 17% non-indigenous). Many Never Learned About Residential
Schools in Their Education
But how much of this
sentiment is driven by what is learned about the Indian residential school
system in Canadians’ education? Two thirds of respondents (68%) say they
never learned about residential schools between kindergarten and the end of
secondary school, significantly higher among boomers (85% vs. 73% Gen X, 54%
Millennial, 34% Gen Z). However, indigenous respondents are significantly
more likely to say they learned a lot about
residential schools in their K-12 education (23% vs. 9% non-indigenous). Whether Canada’s youth
will be more educated on the subject of the Indian residential school system
remains unclear for many. Only 34% of Canadians believe children today are
taught a lot or a little about residential schools in their primary/secondary
education (kindergarten through to the end of secondary school). A quarter
believe that residential schools are not part of the current curriculum
(23%), while four in ten (43%) aren’t sure what is taught in today’s schools. Canadians Divided on How to Handle
Legacy of Founders Who Created Residential School System
Despite nearly unanimous
shock and sadness being evoked in the aftermath of the Kamloops finding, when
it comes to the legacy of Canada’s founding fathers- many of whom were
architects of the residential school system- Canadians show less uniformity
in their opinions. Taking a broad lens: 54%
of Canadians agree that we should remove all statues of historical figures
who are deemed to have perpetuated racism, a 15-point increase from September
2020 when the same question was asked in the wake of the Black Lives Matter
movement. Considering the legacy
of historic leaders who were architects of the residential school system,
Canadians are divided on how to handle statues of these persons, or buildings
named for them: 52% agree that statues of leaders who planned the residential
school system should be removed, while 56% agree buildings for these persons
should be renamed. However, that leaves nearly half of Canadians who disagree with each statement, suggesting that while Canadians
agree that an unmarked burial site of children is a tragedy, reckoning with
the legacy of our leaders who contributed to residential schools may be a
more complex discussion. A prime example of this
conflict arises in the case of Sir John A Macdonald, Canada’s first prime
minster and a key architect in the creation of the residential school system.
Six in ten (59%) agree that Macdonald’s legacy as Canada’s founding PM
outweighs his role in the creation of residential schools. However, nearly
half (46%) agree that statues and buildings bearing Sir John’s likeness or
name should be removed, due to his involvement in residential schools. While Canadians appear
unsure how to handle the legacy of our founding fathers, more consensus
arises when considering protestors who are defacing statues. Only a third
(33%) support protestors who are removing or defacing statues of historical
figured who they deem to have perpetuated racism. However, the data show
support for protestors is strengthening over time as this metric has
increased 7 points since being asked in September 2020 pertaining to the
Black Lives Matter movement. It is important to note
that indigenous Canadians show less ambivalence on this subject- respondents
who self identify as indigenous are significantly more likely to strongly agree with removing statues and supporting protestors:
About the Study
These are some of the
findings of an Ipsos poll conducted between June 4-6, 2021, on behalf of
Global News. For this survey, a sample of 1,001 Canadians aged 18+ was
interviewed online. The sample comprised of n=47 respondents who identify as
Indigenous Canadians. Quotas and weighting were employed to ensure that the
sample’s composition reflects that of the Canadian population according to
census parameters. The precision of Ipsos online polls is measured using a
credibility interval. In this case, the poll is accurate to within ± 3.5
percentage points, 19 times out of 20, had all Canadians aged 18+ been
polled. The credibility interval will be wider among subsets of the
population. All sample surveys and polls may be subject to other sources of
error, including, but not limited to coverage error, and measurement error. 9th
June 2021 (Ipsos,
Canada) SUMMARY OF POLLS ASIA: (India) More Than a Third (35%) of Urban
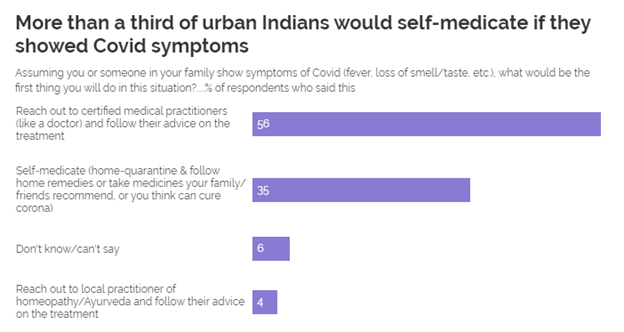
Indian Would Self-medicate If They Showed Covid Symptoms According to YouGov’s latest study
more than one-third (35%) of urban Indians are likely to self-medicate if
they or someone in their family showed Covid symptoms. Although a majority
(56%) said they would reach out to a certified medical practitioner, a large
proportion rely on self-medication. Younger
adults (18-39 years) are more likely to self-medicate themselves upon
developing symptoms whereas older adults (40+) would turn to doctors for
help. On being asked about the treatment people are most likely to take
for Covid-19, allopathy emerged as the top choice of nearly half of the
respondents (47%). Some would opt for ayurvedic medicines (18%) or home
remedies (13%) for treatment, while others would rely on homeopathy or
naturopathy for cure. 11th June 2021 YouGov India (Singapore) 74% of Singaporeans Think
Government was Handling the Coronavirus Situation Well Whereas 23% Think They
Were Handling It Badly. Three quarters (74%) of
Singaporeans felt that the government was handling the situation well and the
remaining three quarters (23%) felt they were handling it badly. During this
period, the majority of cases were made up of foreign workers living in dormitories, which sparked criticism on the living conditions of foreign
workers. However, inspite reassurance from the government that
most migrant workers were expected to be cleared of coronavirus by end-July,
on 16 July 2020 YouGov data showed the number of Singaporeans who felt the
government was handling the virus well fell to 70%. 7th June 2021 YouGov Singapore (Iran) Iranian Elections
Show Lowest Turnout Ever--With Only 25% of Respondents Saying They Would
Vote. The Group for Analyzing and Measuring
Attitudes in Iran (GAMAAN), conducted an online survey between May 27 and
June 3 on the upcoming vote. The results show that
the Islamic Republic is facing its lowest turnout ever, with only 25% of
respondents saying they would vote. The vast majority of our respondents,
71%, said the main reason they were abstaining was because of “the unfree and
ineffective nature of elections in the Islamic Republic.” Only 7% reported
the Guardian Council’s recent “disqualification of my preferred candidate” as
their reason. Only 8% explicitly supported the Islamic Republic by
identifying as Reformist, and only 13% saw themselves as Principlists, who
support the Islamic Revolution and the supreme leader. 10th
June 2021 (Gamaan) MENA: (UAE) Only Half of UAE Residents are Aware of the New Measures Around Live
Entertainment in Dubai Recently, Dubai eased restrictions on
live entertainment and social activities with the condition that spectators
and participants of such events be vaccinated for Covid-19 and observe the
required precautionary measures. YouGov’s latest survey reveals when asked
about this new rule only half of UAE residents (49%) claimed they had heard
about it and were aware of all the rules. Some had heard about it but not
completely aware of the rules (28%), while others were totally unaware (17%)
or unsure about it (6%). Among the surveyed respondents, three in five claim
to have taken all injections required to be fully vaccinated against
Covid-19. One in seven (14%) have started the process but need another shot
while one in five (19%) intend to take the shots soon. The rest are either
unwilling or unsure about getting vaccinated (7%). 10th June
2021 (YouGov MENA) EUROPE (UK) Majority (58%) of Brits Expect
House Prices to Increase In the Year Ahead Most
recent figures show that the housing market is growing at its fastest rate in seven years – a jump of 9.5% in the year to May. Experts suggest that ‘market
activity continues to be boosted by the government’s stamp duty holiday’ and
that this boom period may continue as the ‘unexpected savers’ of the pandemic
look to invest their extra money. Now, new YouGov tracking data shows that
58% of Brits expect prices of homes to go up in the year ahead while 21%
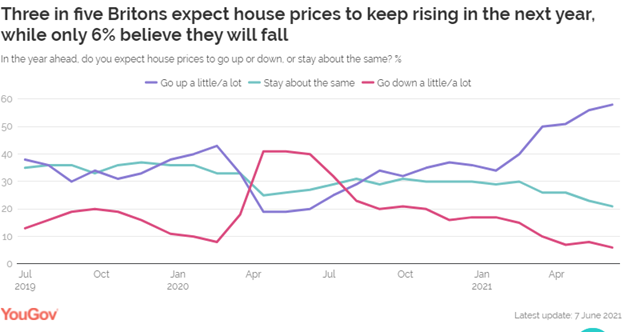
expect them to stay about the same, and only 6% anticipate a dip. Three in five Britons expect house prices to keep
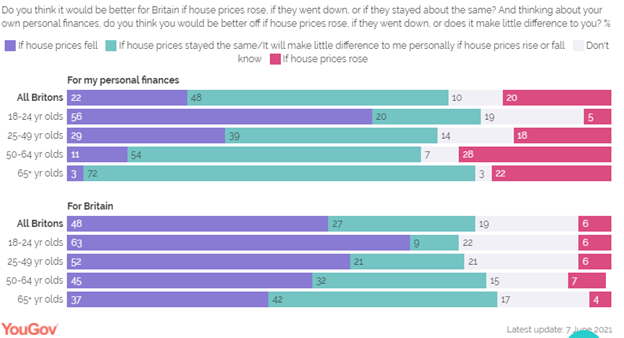
rising in the next year, while only 6% believe they will fall. And half of Brits think it would be better for the country if house prices
dropped. (Majority of Brits expect house prices to increase in the year ahead | YouGov) 14Th June 2021 (YouGov UK) (UK) One in Four Britons Receive Scam Calls, Texts and Emails
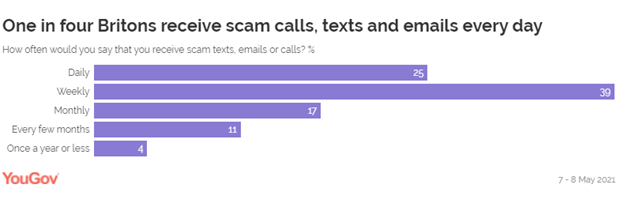
Daily YouGov data shows that calls, texts and emails from
scammers are a daily nuisance for one in four people (25%), while another two
in five (39%) say it occurs weekly. Some 17% of Britons receive scam messages
and calls monthly, while only one in seven say it happens every few months
(11%) or once a year or less (4%). Older Britons are the most likely to say
they receive daily scam correspondence, with 31% of those aged 65+ attesting
to this. This compares with 22% of 25–49-year-olds. 11th June 2021 (YouGov, UK) One in four Britons receive scam calls, texts and emails daily | YouGov (UK) 17%
Britons Have Temporarily Cut off Contact With Their Siblings Among all types of family relations, siblings are the
most likely to stop speaking to each other. One in six Britons (17%) say they
have cut off contact with their brother or sister temporarily, while 7% have
done so permanently. Such fallouts seem to happen later in life for many
people: only 9% of 18–24-year-olds say they have temporarily stopped speaking
to their sibling, compared with a fifth (19%) of those aged 25-64.
Cutting contact with a sibling is as common as pausing as a close friendship.
10th June 2021 (YouGov, UK) It’s not just Harry and William: 17% of Britons have stopped
speaking to their sibling | YouGov NORTH
AMERICA (Canada) 77% Canadians Agree
There Should Be a National Day of Remembrance for Victims of Residential
Schools, but Split on Removing Statues (52%) The discovery of 215 unmarked graves
at a former residential school in Kamloops, British Columbia, has shone a
spotlight on the legacy of residential schools and has thrust conversations
about reconciliation to the forefront. A new Ipsos poll conducted for Global
News has found that most (77%) Canadians believe there should be a national
day of remembrance for the victims. 62% of Canadians to agree that they know
more now about the residential school system than they did before the
discovery of the unmarked burial site. One potential action that some have
been advocating for is removing statues of architects of the residential
school system, but Canadians are split on the idea with half (52%) in favor,
and half (48%) against. 9th
June 2021 (Ipsos,
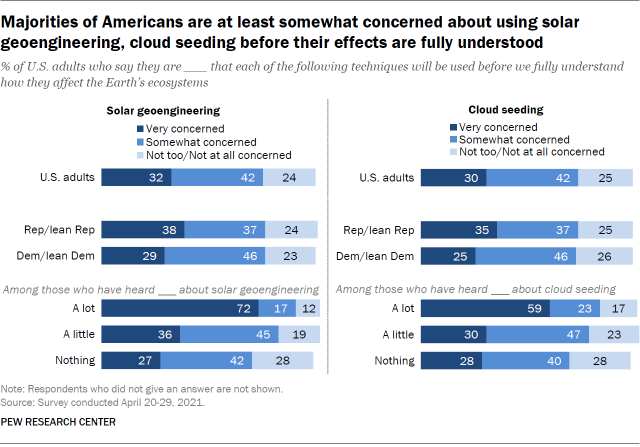
Canada) (USA) 41% Of U.S. Believe Geoengineering Would Help
Reduce Effects of Climate Change Whereas 53% Say it Would Not Make a
Difference About four-in-ten Americans (41%) say
they think solar geoengineering technology would make a difference in
reducing the effects of global climate change, while 53% say it would not
make a difference. Opinion about the effectiveness of solar geoengineering is
roughly the same as when the question was last asked in 2018, when 45% of
adults said it would make a difference and 53% said it would not. Americans
are also divided over whether cloud seeding would help in reducing the
effects of climate change-related drought. Half of adults say it would make a
difference, while 45% say it would not. 11th
June 2021 (Pew,
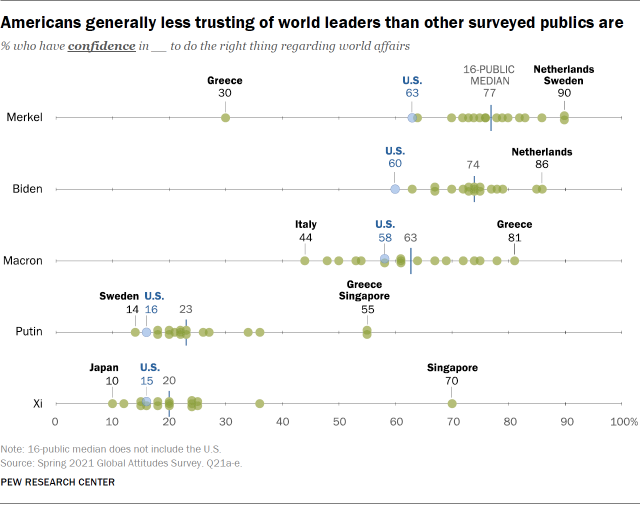
USA) (USA) Americans Have Less Confidence In Key World
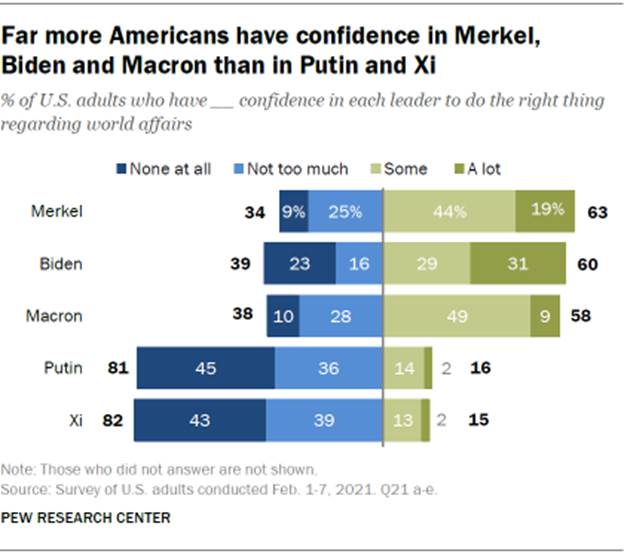
Leaders – Including Biden – Than Other Global Publics do Overall, six-in-ten U.S. adults say
they have confidence in Biden to do the right thing regarding world affairs.
That’s similar to the share of Americans who express confidence in German
Chancellor Angela Merkel (63%) and French President Emmanuel Macron (58%) and
far higher than the share who have confidence in Russian President Vladimir
Putin (16%) and Chinese President Xi Jinping (15%). More than four-in-ten
U.S. adults say they have no confidence at all in the Russian and Chinese
presidents. By comparison, people surveyed in other parts of the world are
generally more likely than Americans to express confidence in each of these
world leaders. Across all 16 surveyed publics, excluding the U.S., a median
of around three-quarters of adults have confidence in Merkel (77%) and Biden
(74%), while a median of 63% have confidence in Macron. Far fewer have
confidence in Putin and Xi (medians of 23% and 20%, respectively). 11th June 2021 (PEW, USA) (USA) Slow Growth In U.S. Electric Vehicle Market:
Only 7% of Adults Have an Electric or Hybrid Vehicle 7TH
June 2021 (Pew Research
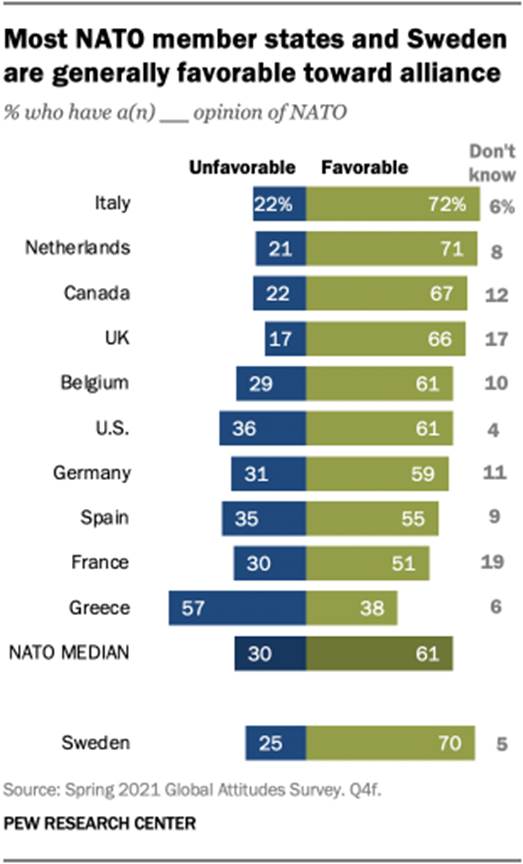
Center) (USA) NATO In a Favorable Light By People In Member
States: 61% Americans’ Opinion in Favor. Positive views of NATO are
at or near all-time highs across several member states. Opinions among
Americans, who contribute the most to NATO’s
annual budget, are at 61% favorable, the same as the overall median across
the NATO states surveyed. In nine of the nations surveyed in 2021, about half
or more hold a favorable opinion of the alliance. Two-thirds or more of
adults in Italy, the Netherlands and Canada have a positive opinion of NATO,
along with about six-in-ten or more in the United Kingdom, the United States,
NATO’s home base of Belgium, and Germany. But in Greece, only 38% see NATO
favorably. Except in Greece, in no country surveyed do more than about a
third have a negative view of NATO, although in many countries around
one-in-ten hold no opinion of the multilateral organization. 10th
June 2021 (Pew
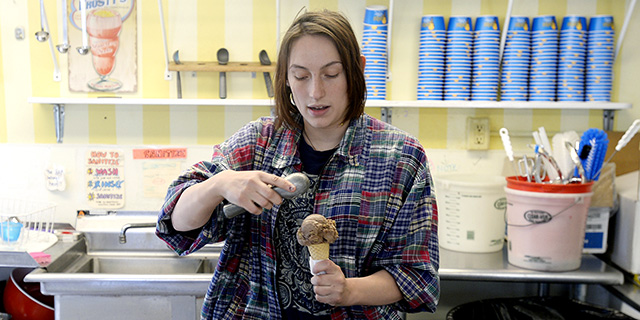
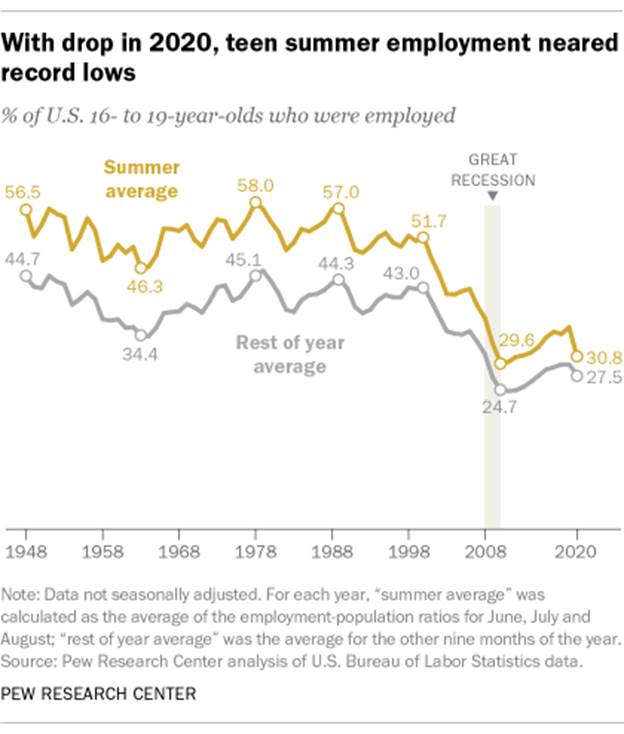
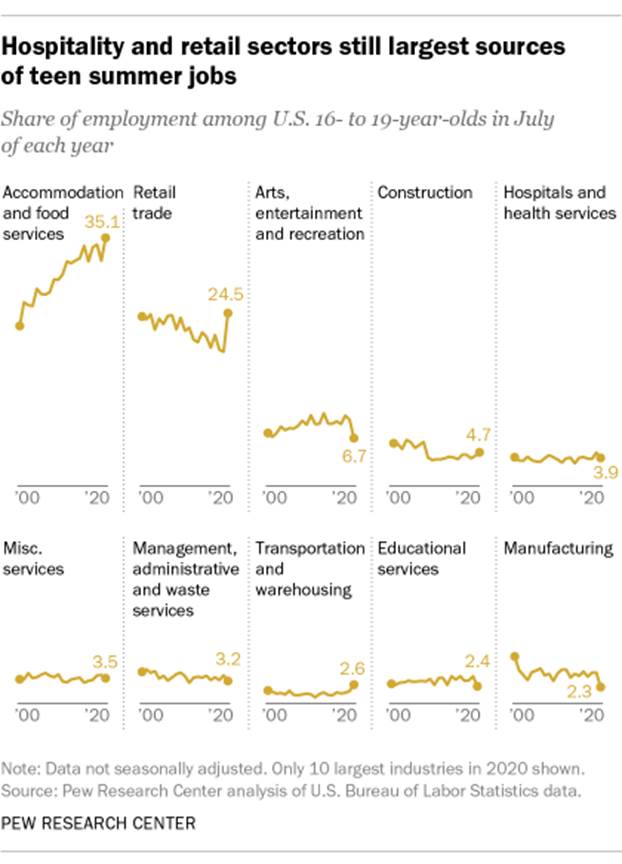
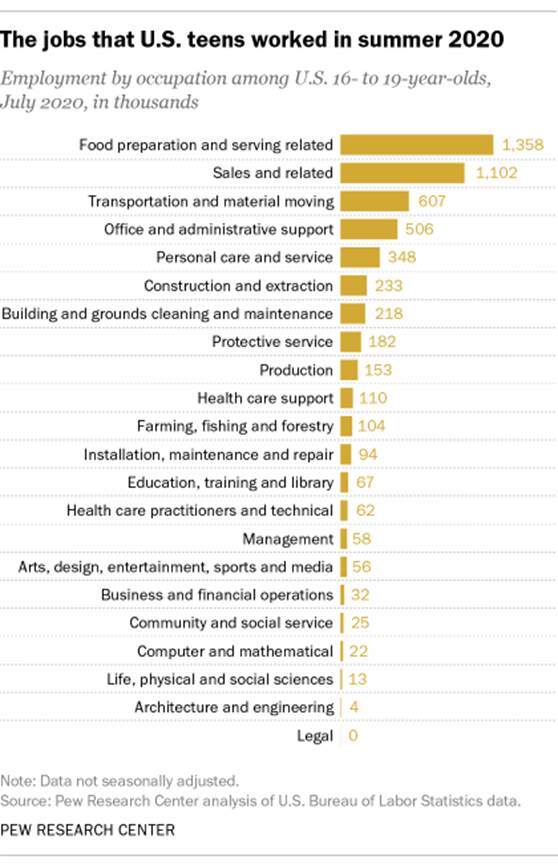
Research Center) (USA) During The Pandemic, Teen Summer Employment Hit
Its Lowest Point (30.8%) Since the Great Recession Fewer than a third (30.8%) of U.S.
teens had a paying job last summer, as many of the places most likely to
employ them – restaurants, shops, recreation centers, tourist attractions –
were either shuttered entirely or had their operations severely curtailed
because of the COVID-19 pandemic. In 2019, 35.8%
of teens worked over the summer. About 1.9 million 16- to 19-year-olds lost
their jobs between February and April 2020. While there was some recovery in
the ensuing months, the number of teens employed in July 2020 – what would
normally be the peak month for summer jobs – fell by more than a million from
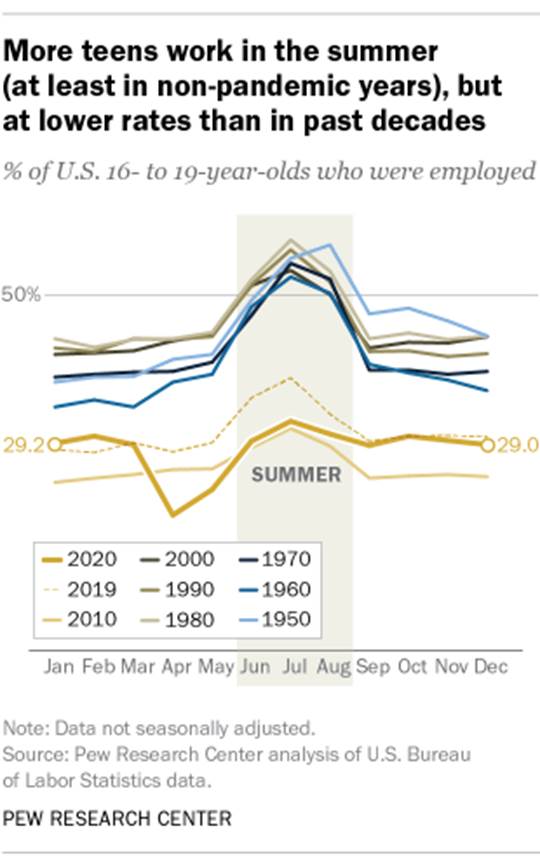
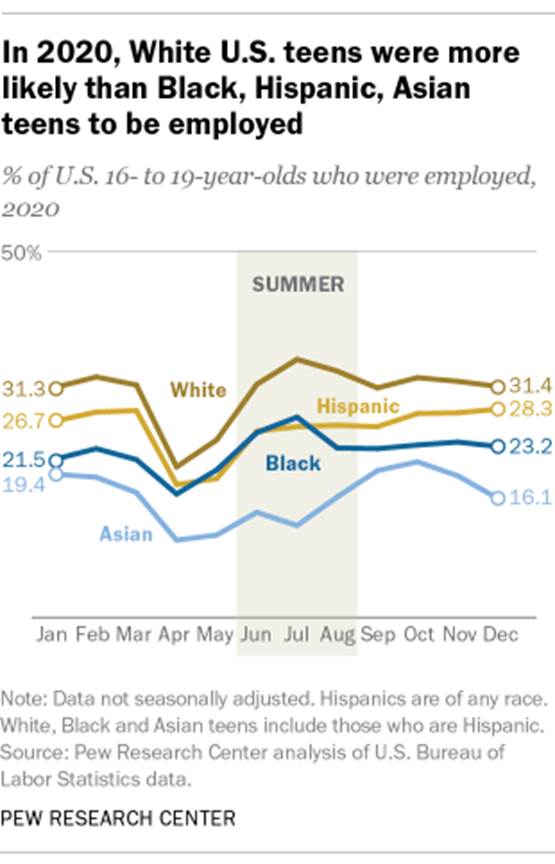
July 2019. On average last summer, about a third (33.4%) of 16- to 19-year-old
White teens were employed, compared with 25.8% of Hispanic teens, 25.1% of
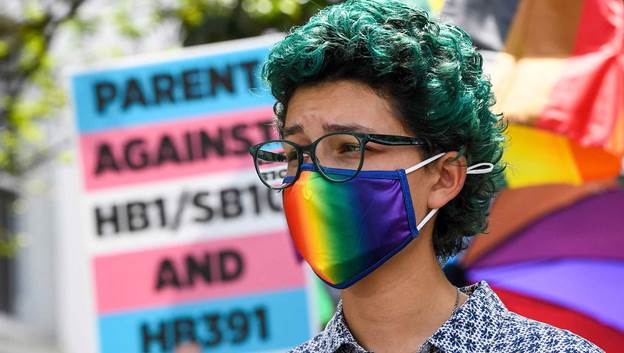
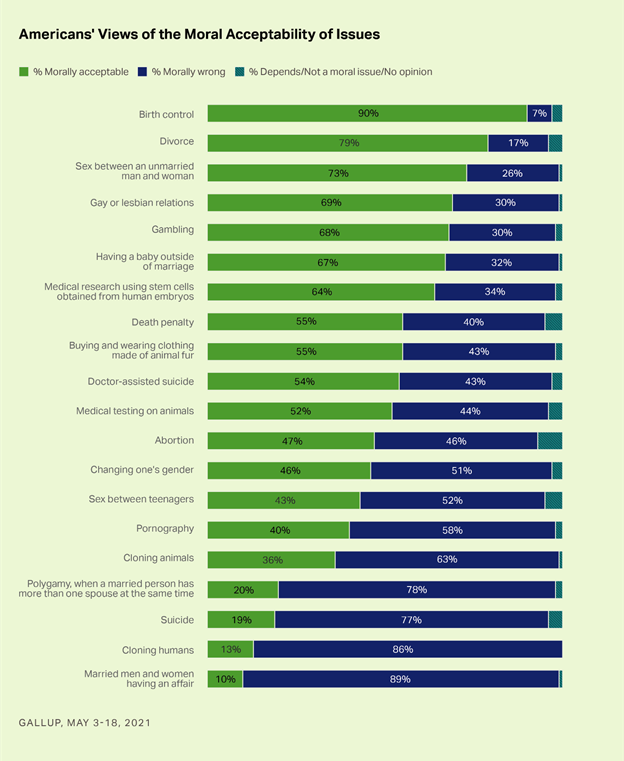
Black teens and 14.3% of Asian teens. 7TH June 2021 (Pew USA) (USA) 46%
of Americans Believe Changing One's Gender is Morally Acceptable Whereas 51%
Believe It is Morally Wrong Changing one's gender identity is sharply
contentious among Americans, who are slightly more likely to say it is
morally wrong (51%) than morally acceptable (46%). Women are more likely than
men to view switching genders as morally acceptable, as are younger adults
more likely than older adults. The large majority of those who identify as
politically liberal (78%) think being transgender is acceptable from a moral
standpoint, and they are more than three times as likely as political
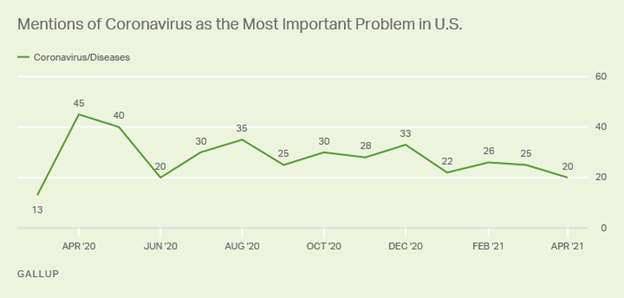
conservatives (23%) to say as much. 11th June 2021 (Gallup, USA) (USA) Only 20% Of Americans Believe
COVID-19 To Be The Main Problem With millions of Americans being vaccinated
against COVID-19 every day and states increasingly loosening restrictions,
the public is now less likely to say the coronavirus is the most important
problem facing the nation than at any point since March 2020. Although
fewer U.S. adults cite COVID-19 than have done so for more than a year, it is
still the top problem, and immigration (14%), the government (14%) and race
relations (12%) are named as the next most pressing issues. In addition to
the five-percentage-point decline in mentions of COVID-19, the government (-6
points) and the economy (-4 points) fell since last month. At the same time,
the percentages naming immigration (+6 points) and race relations (+4 points)
as the nation's top problem ticked up. 28th
April 2021 (Gallup
USA) SOUTH
AMERICA: (Brazil) 93% of Brazilians Want to Get Vaccinated The Global Views on a Covid-19
Vaccine monitor conducted for the
World Economic Forum in 15 countries shows willingness of people to
vaccinate. In Brazil, the intention remains very high as 93% of people say
they will take the vaccine as soon as available to them. This by far remains
the highest rate among all countries surveyed. 9TH
June 2021 (Ipsos, Brazil) (Germany) A
Quarter Of Germans Own Smart Household Appliances, 10 percent of them Own a Smart
Washing Machine Switching on the coffee machine or programming the tumble dryer on the go
– smart "Internet of Things" (IoT) devices are already used by a
quarter of Germans: 25 percent of all respondents state that they already own
a smart household appliance. Among them, 10 percent each own a smart
washing machine or a smart vacuum cleaner. 8 percent of owners of smart
household appliances state that they own a stove or oven, and another 8
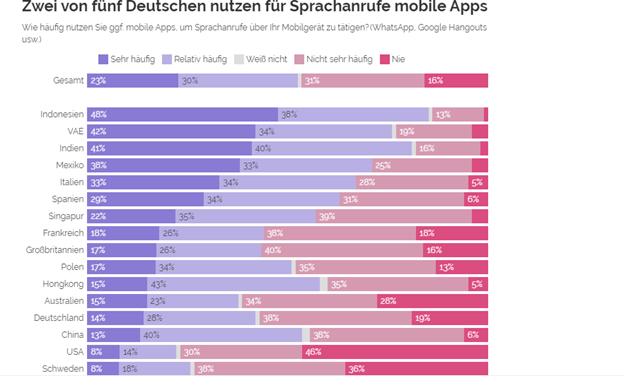
percent own a refrigerator, freezer or a refrigerated-frozen combination. 11th June 2021 (YouGov, Germany) (Germany) Two Out
Of Five Germans Use Mobile Apps For Voice Calls- Less Than The Global Average
Among Germans, 42 percent say that they make voice calls via mobile apps
very or relatively frequently. These are rather few in an international
comparison. The data show that consumers in certain emerging markets do
this most often: Indonesians lead on this question with 86 percent, followed
by Indians (81 percent), respondents in the United Arab Emirates (76 percent)
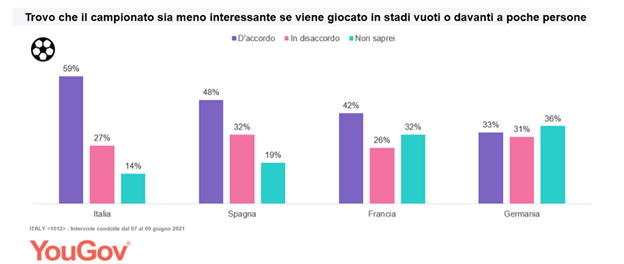
and Mexicans (71 percent). 9th June 2021 (YouGov, Germany) (Italy) 60% of Italians Think That
The Absence of Fans In Stadiums Will Make The Tournament Less Interesting 60% of Italians think that the absence of fans in
stadiums will make the tournament less interesting: a percentage higher than
that of any other European country. If the Spaniards are not too far
away (48%), French and Germans attach much less importance to the presence of
spectators in the stands: 42% of cousins from Oltralpe and only a third of
Germans find that the tournament will be less attractive due to the lack of
fans. Italians between the ages of 34
and 44 and people over 55 (64% for both age groups) consider a competition
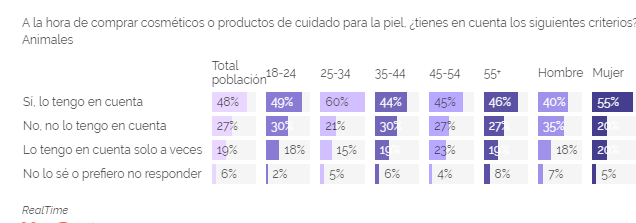
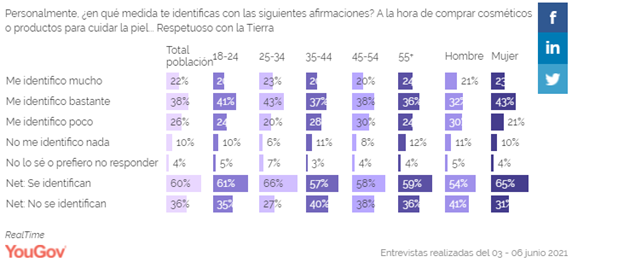
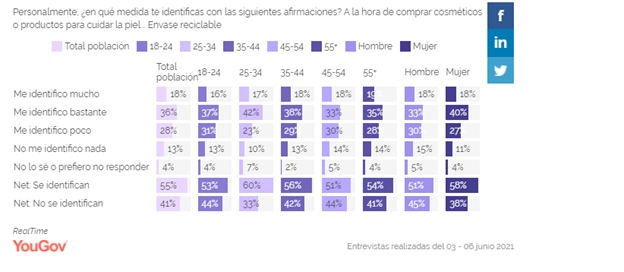
without fans less interesting. 11th June 2021 YouGov Italy (Spain) 51% of Spanish
Population Takes into Account the Existence of Natural Products In its Cosmetics
When Purchasing Them Environmental issues have also reached the cosmetics and skincare
products sector; more and more the effects of any industry on the
environment begin to influence the purchasing criteria. More than half of the
Spanish population (51%) it takes into account the existence of natural
products in its cosmetics when purchasing them. This percentage varies
between men and women, since 56% of women in Spain retain this criterion as
important, compared to 47% of men.The population that most takes into account
the natural origin of cosmetic products when buying them is the one over 55
years old (56). 60% of the population responds that, when buying cosmetics or
skin care products, they take into account that they are respectful of the
planet. This percentage is higher among young people between 25 and 34 years of
age (67%) and women (65%). 9th June 2021 YouGov, Spain MULTI
COUNTRY: Most
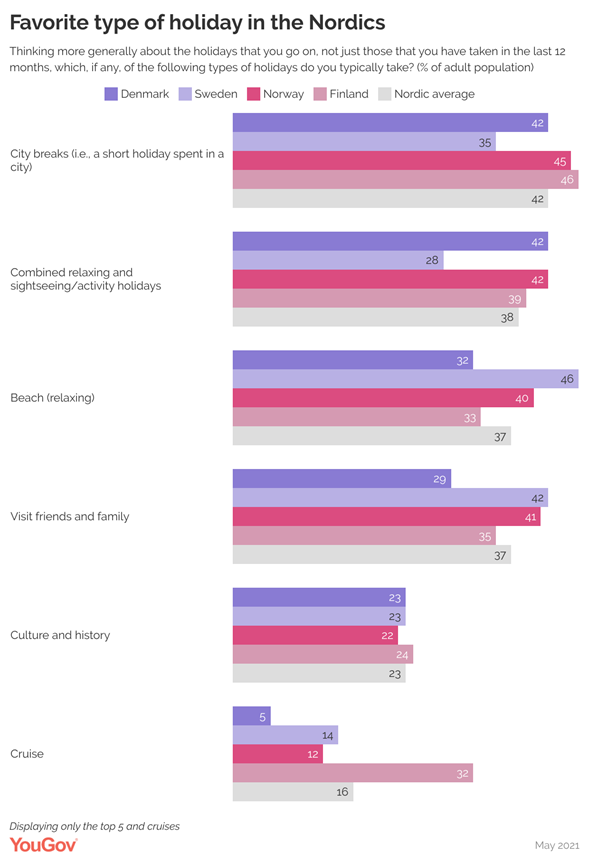
Popular Holiday Types in The Nordics Overall,
people in the Nordics are mostly into city breaks i.e. short holidays spent
in a city, with an average of 42 % people choosing this type of holiday
(ranging from 35 % of Swedes to 46 % of Finns). Next up are holidays that
combine relaxing and sightseeing/activity, with an average of 38 % – however,
this applies to only 28 % of the Swedish population. People in the Nordics
generally like to visit friends and family in the holidays (37 %). Especially
Swedes (42 %) and Norwegians (41 %) practice this kind of vacation activity,
while it is slightly less popular in Denmark (29 %). Holidays that involve
culture and history are furthermore popular across the Nordic countries (23
%). (15th June 2021) (YouGov, Denmark) YouGov | What are the most popular holiday types in the Nordics? ASIA: 694-43-01/Poll More Than a Third (35%) of Urban Indian Would Self-medicate
If They Showed Covid Symptoms
More than half take homemade immunity
boosters or follow home remedies as preventive measures against the virus According to YouGov’s latest study more than one-third (35%)
of urban Indians are likely to self-medicate if they or someone in their
family showed Covid symptoms. Although a majority (56%) said they would
reach out to a certified medical practitioner, a large proportion rely on
self-medication. More than a third of urban Indians would self-medicate if they showed
Covid symptoms
The rampant self-medication at home without any expert
supervision has become a concern and many health experts are talking about
the dangers of indulging in such treatments. Interestingly, younger adults (18-39 years) are more likely to
self-medicate themselves upon developing symptoms whereas older adults (40+)
would turn to doctors for help. On being asked about the treatment people are most likely to
take for Covid-19, allopathy emerged as the top choice of nearly half of the
respondents (47%). Some would opt for ayurvedic medicines (18%) or home
remedies (13%) for treatment, while others would rely on homeopathy or
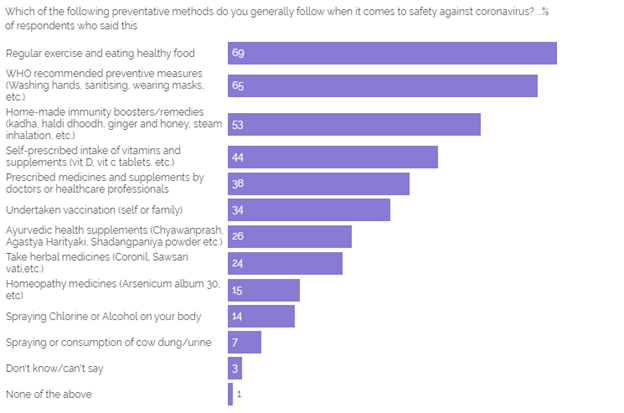
naturopathy for cure. In order to protect themselves from the virus, people are
following various safety measures. Most people said they regularly exercise
& eat healthy (69%) or follow WHO recommended guidelines (65%) as precautionary
measures against Covid-19. Some take medicines or supplements prescribed by a
healthcare practitioner while others have taken a vaccine to safeguard
themselves (38% and 34% respectively). Preventive measures taken by urban Indians to safegaurd themselves from
Covid-19
Even though urban Indians are following guidelines given by
the government and health experts, a considerable proportion are indulging in
self-medication or following unscientific remedies as preventive measures
against the virus. More than half (53%) claimed they take homemade immunity
boosters like kadha, ginger, honey, etc. to prevent the infection, with women
relying more on these remedies as compared to men (59% vs 48%). Many consume ayurvedic health supplements or herbal medicines
like Coronil (50%) or turn to self-prescribed vitamins and supplements
(44%). Despite warnings by doctors against unscientific practices, a
fifth (21%) have adopted the method of spraying alcohol, chlorine or cow’s
urine to ward off the virus. It is interesting to note, adults between the
age of 30-39 years are most likely to adopt these methods as compared to the
rest. There are some differences amongst regions when it comes to
popular preventive measures. Respondents from North India are more likely
than residents from other regions to claim they take homemade immunity
boosters or spray alcohol or urine on their body as a precaution against
Covid. On the other hand, residents of South India are more likely than the
rest to resort to vaccination in order to safeguard themselves against the
virus. Data collected online
by YouGov Omnibus among 1016 respondents in the country in June 2021
using YouGov’s panel of over 11 million people worldwide. Data is
representative of the adult online population in the country. 11th June 2021 YouGov India Source: YouGov
| More than a third of urban Indians would self-medicate if they showed Covid
symptoms 694-43-02/Poll (Singapore) 74% of Singaporeans Think
Government was Handling the Coronavirus Situation Well Whereas 23% Think They
Were Handling It Badly.
With the nation moving back to Phase 2 restrictions following
the recent rise of community cases, YouGov’s COVID-19 tracker looks at how Singaporeans
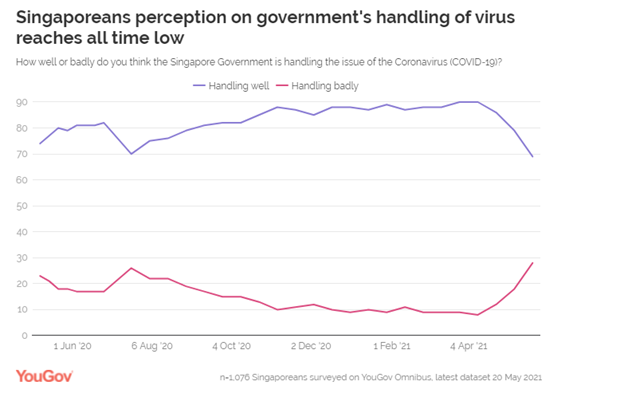
perceptions have changed since the start of the pandemic. YouGov
began tracking Singaporeans perception on the government’s handling of the
COVID-19 virus since 5 May 2020. On this date, three quarters (74%) of
Singaporeans felt the government was handling the situation well and the
remaining three quarters (23%) felt they were handling it badly. During this
period, the majority of cases were made up of foreign workers living in dormitories, which sparked criticism on the living
conditions of foreign workers. The government was quick to respond,
by rolling out mass
testing for foreign workers living in dormitories and by early
June announced they would build
new dormitories with improved living standards. However, in-spite reassurance from the government that most migrant
workers were expected to be cleared of coronavirus by end-July, on 16 July
2020 YouGov data showed the number of Singaporeans who felt the government
was handling the virus well fell to 70%.
Following
mid-July however, there was a steady increase of people saying the government
was handling the situation well, and by 17 December 2020 – a few days after
the Prime Minister’s announcement that the nation would be moving to
Phase 3 re-opening, a whopping 88% of Singaporeans felt that the government
was handling the pandemic well. This trend continued throughout the first
quarter of the year and peaked at 90% on 8 April 2021. Singapore
enjoyed a few months of zero community cases, lauded by global press as “the best place to
live during COVID”. However, but by late April, there were a rise of cases and
reports of a possible cluster at Tan Tock Seng Hospital. On 6 May
2021, the number of Singaporeans who felt the government were handling the
pandemic well had fallen to eight in ten (79%). Around this time, media
reports emerged of Tan Tock Seng staff testing
positive for the India variant of the virus, and the
government re-introduced
tighter measures to stop the spread. However, by 20 May 2021, the number
of Singaporeans who felt the government were handling the situation well had
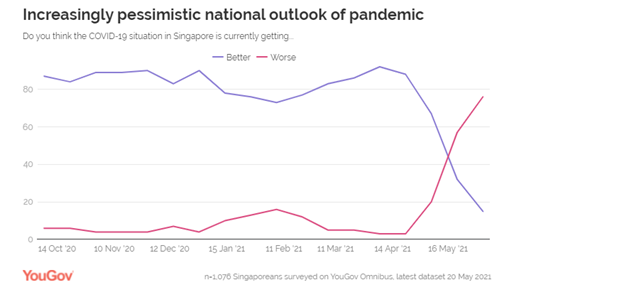
fallen to an all-time low – coming at 69%. YouGov
also tracked the national outlook of the COVID-19 situation since October
2020. Since tracking national outlook, the number of Singaporeans who felt
the situation was getting better hovered above 80%, dropping to the lowest of
73% on 28 January 2021. However, by 22 April 2021, this had fallen to only two-thirds
(67%) of Singaporeans finding that the situation was improving. At the same
time, the number of Singaporeans who felt the situation was getting worse had
risen to 20%. By 6 May 2021, the number of Singaporeans who found that the
situation was getting worse (57%) outweighed the number who had a positive
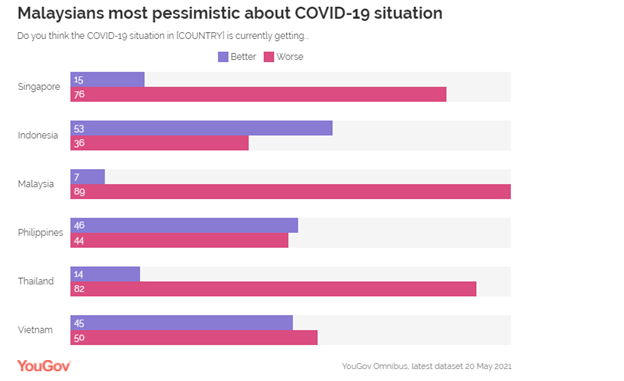
outlook (32%). The most recent data shows an increasingly pessimistic
national outlook, with a record three quarter (76%) thinking the COVID-19
situation in Singapore is getting worse.
Across
six other ASEAN nations however, it is Malaysians that are feeling the most
negatively about the pandemic. A whopping nine in ten (89%) feel the
situation is getting worse, followed by Thais (82%) and Singaporeans (76%).
Conversely, Indonesians are the most optimistic with over half (53%) saying
the situation nationally is improving, followed by Filipinos (46%).
YouGov Singapore Source: YouGov | Singaporeans increasingly pessimistic following Phase 2 restrictions 694-43-03/Poll (Iran) Iranian
Elections Show Lowest Turnout Ever--With Only 25% of Respondents Saying They
Would Vote
A poster of Ebrahim Raisi, the conservative head of the
judiciary, who is frontrunner to be Iran’s next president. Abedin
Taherkenareh/EPA The Islamic Republic of Iran has never organised
free and fair elections since its establishment in 1979. By definition, the
combination of modern totalitarianism and Iran’s Islamic theocracy, with a
supreme leader, cannot allow for more than a voting spectacle, rather than
elections in the normal sense of the word. Yet, a majority of Iranians
have used the platform of an election to make their presence felt. They did this in 1997 with the rise of the so-called
Reformists, in the disputed 2009 elections that were followed by mass
protests, and in 2017 when the current president, Hassan Rouhani, was re-elected with a turnout of more than 70%. However, the
population’s mode of expression has now shifted. Many Iranians say they will
refuse to participate in the upcoming elections, hacking at the regime’s sole
remaining pillar of legitimacy. Listen to the authors discuss their research on The Conversation
Weekly podcast. Find out how to subscribe here. Rouhani is standing down after
serving two terms and presidential elections are taking place on June 18. The
frontrunner is Ebrahim Raisi, an ultra-conservative and head of the judiciary
who is responsible for ordering the execution of several thousands of political
prisoners in 1988. Iran’s Guardian Council, a body of 12 members appointed by
the supreme leader, Ali Khamenei, and the head of the judiciary, Raisi
himself, must approve the candidates. Among those rejected were former president, Mahmoud Ahmadinejad. Our research institute, the
Group for Analyzing and Measuring Attitudes in Iran (GAMAAN), conducted an
online survey between May 27 and June 3 on the upcoming vote. The results show that the Islamic Republic is facing its lowest
turnout ever, with only 25% of respondents saying they would vote.
Nearly three quarters of Iranians surveyed said they would not vote. GAMAAN, Author provided Polling in authoritarian countries
Our estimated turnout is lower
than the official numbers published by the state-run Iranian Students Polling
Agency (ISPA), which predicts a turnout lower than 40%. The discrepancies are likely to be caused by the differences
between traditional telephone and on-site sampling on the one hand, and the
less charted territories of online sampling, on the other. From research in other
authoritarian countries such as Russia and China, we know that respondents are much less willing to answer
truthfully when they are reached using conventional, offline, survey methods.
Inflated polling numbers can then be used to validate potentially fraudulent
results to give autocrats an air of respectability. That’s why GAMAAN conducts
surveys using an anonymous digital platform, which makes people feel safe
enough to share their true opinions about politically sensitive matters. Iran’s internet penetration
rate is comparable with Germany. According to the most recent statistics, there are 77 million mobile internet subscribers and roughly 74% of Iranians over 18 use at least one social media platform. So it’s
possible to reach a substantial percentage of Iranians online and ask about
their views. We have conducted several such
surveys on religion, capital punishment, and media popularity, gaining insights into Iranian internet users’ behaviour that
help target an appropriate range of digital channels spread across the
country. After cleaning the data for our
most recent survey, we were left with a sample of 68,000 Iranians living in
Iran. The sample was weighted and balanced to the target population of
literate Iranians aged above 19, using five demographic variables, voting
behaviour in the 2017 presidential elections, and new survey data on
political preferences. Crucial for the weighting is
the participation of pro-regime respondents, whose absence would skew the
results. In this survey, we attracted 9,000 respondents who voted for the
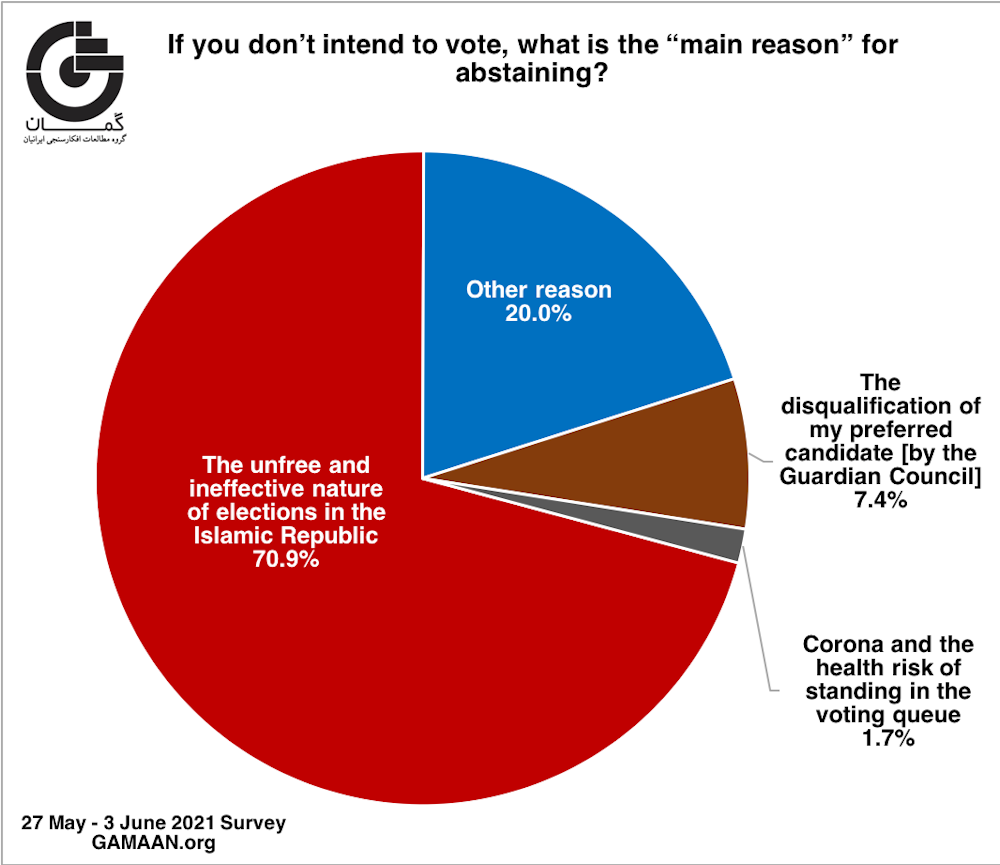
conservative candidate, Raisi, in the 2017 elections. The meaning of not voting
What can explain the turnout
drop, from over 70% in 2017 to an expectation of less than 30% today? The
vast majority of our respondents, 71%, said the main reason they were abstaining
was because of “the unfree and ineffective nature of elections in the Islamic
Republic.” Only 7% reported the Guardian Council’s recent “disqualification
of my preferred candidate” as their reason.
A lack of free and fair elections is keeping voters away from the polls. GAMAAN, Author provided In another survey we conducted in April 2019, 79% of respondents said they would vote no to the Islamic
Republic in a free referendum. This was before the bloody crackdowns in
November that year which led to the death of an estimated 1,500 people, and before the Islamic Revolutionary Guard Corps
admitted shooting down a Ukrainian passenger airline in 2020. Our latest results show that
the majority’s desire to get rid of the theocratic system hasn’t changed.
Around half of the population supports regime change as a precondition for
meaningful change, and a quarter supports a softer transition away from the
current system. Only 8% explicitly supported the Islamic Republic by
identifying as Reformist, and only 13% saw themselves as Principlists, who
support the Islamic Revolution and the supreme leader.
A majority of Iranians think change can only come with regime change. GAMAAN, Author provided We are not the only group with
such findings. A recent state-run survey revealed that Reformists and Principlists together have
about 20% of supporters. The respectable World Values Survey conducted an on-site survey in Iran in the summer of
2020 and found that the Principlists’ base was no larger than 16%. Worried about the expected low
turnout, the supreme leader hurried to describe the act of voting as a religious duty. But if Iranians’
political disenchantment has turned into religious disappointment, with millions abandoning or changing their faith, the leader
has turned the elections into a test of the nation’s religiosity. It is this
entanglement of religion and politics that is at the heart of Iranians’
discontent, and which the regime’s mismanagement and corruption and the economic sanctions have only exacerbated. Like other authoritarian
regimes, the Islamic Republic needs a high enough turnout so that its foreign
minister can sell an image of a legitimate government abroad. By boycotting what
are nothing but staged elections, ordinary Iranians are refusing to
participate in this political theatre. It’s time the international community
recognised their will to effect a real change in Iran. 10th
June 2021 (Gamaan) MENA: 694-43-04/Poll (UAE) Only Half of UAE Residents are Aware of the New Measures Around Live
Entertainment in Dubai
Once vaccinated, residents are most comfortable
visiting outdoor public places but less relaxed about attending concerts and
wedding events Recently,
Dubai eased restrictions on live entertainment and social activities with the
condition that spectators and participants of such events be vaccinated for
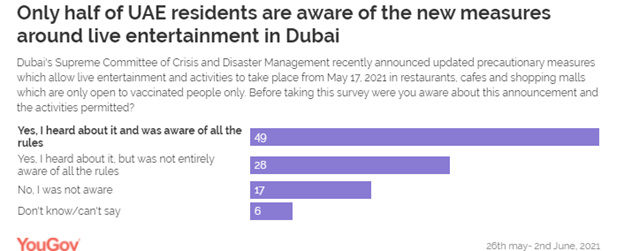
Covid-19 and observe the required precautionary measures. Now
YouGov’s latest survey reveals when asked about this new rule only half of
UAE residents (49%) claimed they had heard about it and were aware of all the
rules. Some had heard about it but not completely aware of the rules (28%),
while others were totally unaware (17%) or unsure about it (6%).
Among
the surveyed respondents, three in five claim to have taken all injections
required to be fully vaccinated against Covid-19. One in seven (14%) have
started the process but need another shot while one in five (19%) intend to
take the shots soon. The rest are either unwilling or unsure about getting
vaccinated (7%). It
seems the new mandate is likely to encourage people to get vaccinated, as 65%
of residents out of those who have not taken a single injection (those who
plan to, do not intend to or are unsure) said they are likely to take the
covid vaccination following the new mandate. Furthermore,
seven out of ten respondents view this move favorably and feel the new rule
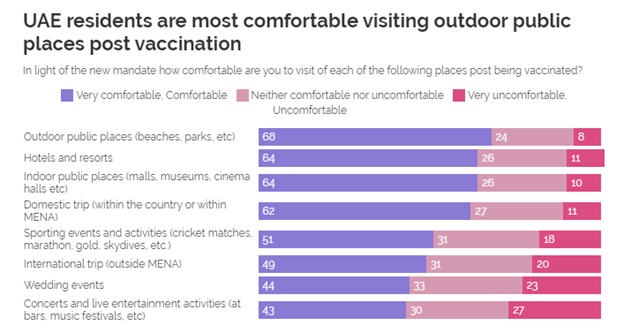
will curb Covid cases not just in Dubai (71%) but the entire UAE (72%). When
asked about the different places they will be comfortable visiting
post-vaccination, UAE residents showed the greatest comfort in visiting
outdoor public places such as beaches, parks, etc. (68%), followed by indoor
public places (museums, malls, etc), and hotels and resorts (64% each).
A
large proportion is relaxed about taking domestic trips (62%) or attending
sporting events (51%). In comparison to this, people are less comfortable
with international travel (49%), wedding events (44%), or live concerts
(43%). Men
are notably more comfortable than women in visiting all the above-mentioned
places post-vaccination. Data collected online among 1006 respondents
in the UAE by YouGov’s Omnibus between May 26th and June 2nd 2021 using YouGov’s
panel of over 11 million people worldwide 10th June
2021 (YouGov MENA) EUROPE 694-43-05/Poll (UK) Majority (58%) of Brits Expect House Prices to Increase In the Year Ahead
Only 6%
of Brits think increasing house prices would be beneficial for the country,
but one-fifth (20%) say it would be advantageous for their personal
finances
Most recent figures show that the housing market is growing at its fastest rate in seven years – a jump of 9.5% in the year to May. Experts suggest that ‘market activity continues to be boosted by the government’s stamp duty holiday’ and that this boom period may continue as the ‘unexpected savers’ of the pandemic look to invest their extra money. Now, new YouGov tracking data shows that 58% of Brits expect prices of homes to go up in the year ahead while 21% expect them to stay about the same, and only 6% anticipate a dip.
When asked in February last year, prior to the beginning of the pandemic, 43% expected house prices to go up, compared to only 8% who thought they would drop. Fast-forward to April 2020 - just after the UK entered its first lockdown – and the number of those that thought house prices would increase tumbled to just 19%, while those who anticipated a fall, increased to 41%. Opinion remained static for a couple of months, before beginning to rise from June to August, at which point it levelled off once again at around 35%. The success of the vaccination programme caused confidence to rebound, with the number expecting house prices to go up shooting up from 35% in mid-January 2021 to 50% in mid-March. Expectations that house prices will rise have grown further since that point, reaching 58% in early June. Half of Brits think it would be better for
the country if house prices dropped
In general, 48% of the public say it would be better for Britain if house prices went down, while a much smaller proportion (6%) think it would be better if prices increased. Around a quarter (27%) believe it would be best if it remained at the current level. When asked the same question, but this time thinking about personal finances, One-fifth of Brits (20%) say they would be better off if prices rose. A similar proportion (22%) say it would be beneficial if prices fell. A majority of young Britons say they would benefit from falling house
prices, while those aged 50 and older tend to say any change in house prices
wouldn't affect them
Half (48%) of Brits say it will make little difference to them personally if house prices rise or fall. This is most apparent among those aged 65+ (72%) compared to only 20% of those aged 18 to 24. 14Th June 2021 (YouGov UK) Source: Majority of Brits expect house prices to increase in the year ahead | YouGov) 694-43-06/Poll (UK) One in Four Britons Receive Scam Calls, Texts and Emails Daily
About
half of the public say banks should reimburse scam victims, although support
is also high for the Home Office’s proposal to use frozen criminal accounts
The UK’s cybersecurity agency has removed more scams in the last year than in the three previous years combined, and ministers have warned of a massive sudden spike in scam calls and texts. YouGov data shows that calls, texts and emails from scammers are a daily nuisance for one in four people (25%), while another two in five (39%) say it occurs weekly. Some 17% of Britons receive scam messages and calls monthly, while only one in seven say it happens every few months (11%) or once a year or less (4%). Older Britons are the most likely to say they receive daily scam correspondence, with 31% of those aged 65+ attesting to this. This compares with 22% of 25-49 year olds.
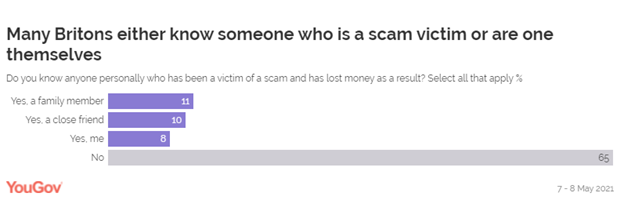
While the number of people falling prey for fraudulent messages and calls is lower, many people know someone affected or have been a victim themselves. Some 11% say this has happened to family member, while one in ten (10%) know a close friend who has been tricked, and 8% say they themselves have been scammed.
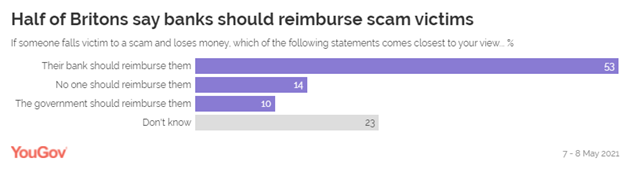
Who should reimburse scam victims?
While many banks are signed up to a voluntary scheme to reimburse customers who get scammed to transfer money to a fraudster, research shows they refuse to compensate most on the basis that the victim is to blame for the losses. Around half of Britons (53%) say banks should reimburse people who lose money to a scam, while only 14% say no one should compensate them, and one in ten (10%) believe it should fall on the government. This is similar to previous YouGov research from 2018, which showed that 49% of the public said that banks should reimburse victims even if they’ve been careless.
Home secretary Priti Patel has also suggested that scam victims could be reimbursed using suspected criminal funds from frozen bank accounts. The trade association UK Finance called on the government to allow this in 2017. The proposal is popular with Britons. Three quarters of people (76%) support it, including 37% who are strongly in favour. Only 11% are against it. But despite the popularity, the money is unlikely to come close to cover the amount lost to scammers. Last year this figure came to £1.26 billion, while an estimate from 2017 suggested £130 million was held in frozen bank accounts. 11th June 2021 (YouGov, UK) Source: One in four Britons receive scam calls, texts and emails daily | YouGov 694-43-07/Poll (UK) 17% Britons Have Temporarily Cut off Contact With Their Siblings
Cutting
contact with a sibling is as common as pausing a close friendship
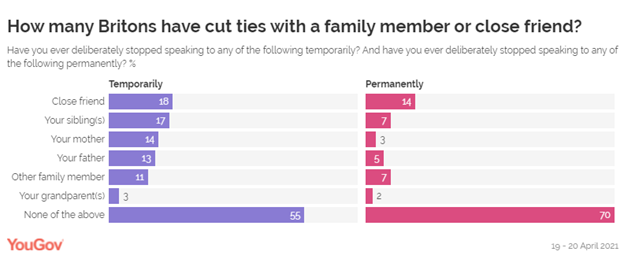
Much of the coverage of Prince Philip’s funeral was focused on his feuding grandsons, Prince Harry and Prince William, who rather than walking side by side were separated by their cousin, Peter Phillips. New YouGov data shows that Harry and William are not alone in their familial spat. In fact, among all types of family relations, siblings are the most likely to stop speaking to each other. One in six Britons (17%) say they have cut off contact with their brother or sister temporarily, while 7% have done so permanently. Such fallouts seem to happen later in life for many people: only 9% of 18-24 year olds say they’ve temporarily stopped speaking to their sibling, compared with a fifth (19%) of those aged 25-64.
Equally common as falling out with a family member is stopping contact with a close friend. About a fifth of Britons (18%) have done so for some time, while one in seven (14%) say they’re permanently not speaking to a formerly close mate. The figures are highest among young people, with three in ten 18- 24 year olds (29%) having stopped talking to a friend momentarily, while a fifth (20%) have done so for good. Many Britons have also cut contact with one of their parents. This includes one in seven (14%) who stopped talking to their mother for some time and 3% permanently. The figures for Britons not talking to their fathers are similar, with 13% pausing the relationship temporarily, while one in twenty (5%) say it’s final. Just over half of the public (55%) have never paused contact with a close friend or family member temporarily, including 59% of men and 51% of women. Seven in ten (70%) have never done so permanently. 10th June 2021 (YouGov, UK) Source: It’s not just Harry and William: 17% of Britons have stopped
speaking to their sibling | YouGov NORTH
AMERICA 694-43-08/Poll 41% Of U.S. Believe Geoengineering Would Help
Reduce Effects of Climate Change Whereas 53% Say it Would Not Make a
Difference U.S. adults have mixed views on whether
geoengineering would help reduce effects of climate change
No more than half of U.S. adults say they think two
geoengineering techniques – solar geoengineering and cloud seeding – would make
a difference in reducing the effects of climate change, and most are worried
about unintended consequences from these approaches, according to a
recent Pew Research Center survey.
Scientists and policymakers are exploring the use of several
geoengineering techniques to alter the environment in ways that could reduce
the effects of climate change. Solar geoengineering is a proposed technique
that aims to temporarily lower Earth’s temperature by spreading particles in
the atmosphere to reflect sunlight back into space. A recent report from the National Academies of Sciences,
Engineering and Medicine recommended that the U.S. federal government invest
up to $200 million in researching the effects and feasibility of solar
geoengineering. How we did this Cloud seeding, another form of geoengineering, involves
dispersing particles in the atmosphere to encourage rain and snowfall. At
least eight Western states have recently used this technique in an effort to increase precipitation
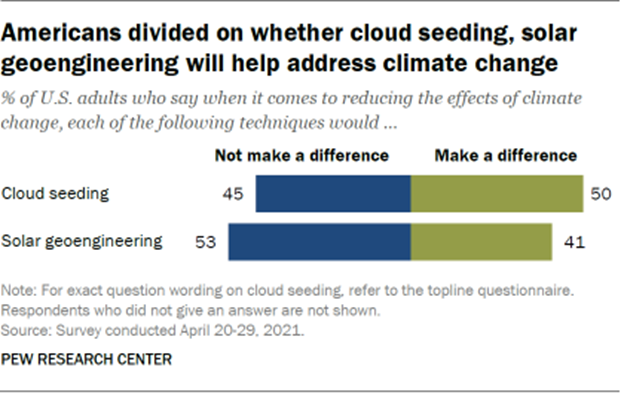
and the water supply for rivers and lakes. About four-in-ten Americans (41%) say they think solar
geoengineering technology would make a difference in reducing the effects of
global climate change, while 53% say it would not make a difference. Opinion
about the effectiveness of solar geoengineering is roughly the same as when
the question was last asked in 2018, when 45% of adults said it would make a
difference and 53% said it would not. The idea of solar geoengineering is familiar to only a small
share of the public: Just 4% say they have heard or read a lot about this,
another 38% say they have heard a little and a majority (57%) have heard
nothing at all. Americans are also divided over whether cloud seeding would
help in reducing the effects of climate change-related drought. Half of
adults say it would make a difference, while 45% say it would not.
Again, the public is largely unaware of this technique: 53% of
Americans say they’ve heard nothing about cloud seeding, another 42% say
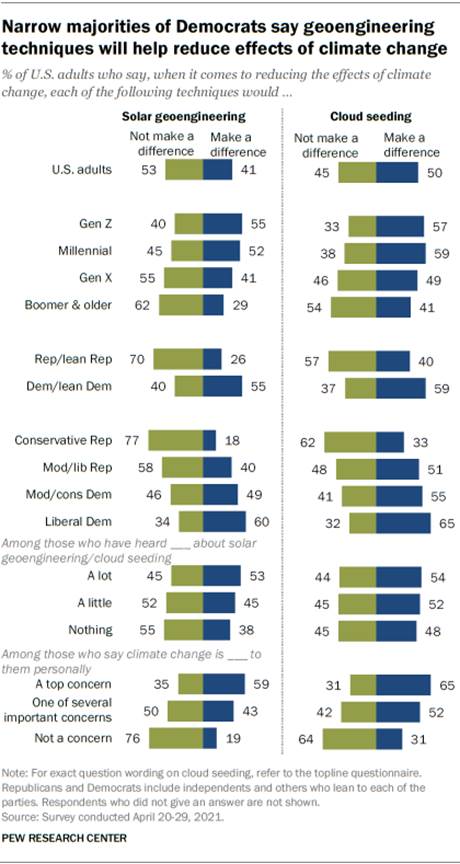
they’ve heard a little about it and just 4% have heard a lot. Democrats and Democratic-leaning independents, especially
those who self-identify as liberal, are more optimistic than Republicans and
GOP leaners about geoengineering’s potential impact. For instance, a majority
of liberal Democrats (60%) say they think solar geoengineering would make a
difference in reducing the impact of climate change, compared with just 18%
of conservative Republicans. People who say addressing climate change is a top concern to
them personally are also more optimistic about the potential impact of these
technologies: Majorities of these adults say solar geoengineering (59%) and
cloud seeding (65%) would make a difference in reducing the effects of
climate change. Younger adults – who are more likely to identify as Democrats and as ideologically liberal, and to say
addressing climate change is a top personal concern – are more positive about
geoengineering. For example, more than half of Gen Z or Millennial adults
(55% and 52%, respectively) say they think solar geoengineering techniques
would make a difference in reducing climate change’s effects, compared with
29% of Baby Boomer and older adults.
Some researchers have expressed concern about geoengineering and argued that the
technology could have unforeseen negative impacts on the Earth’s climate.
Earlier this year, climate researchers halted a test of solar geoengineering
technology in Sweden after environmental conservationists and
indigenous groups objected. Large majorities of Americans worry that both technologies
will be deployed before scientists fully understand the environmental
consequences of using them. More than seven-in-ten U.S. adults say they are
very or somewhat concerned that solar geoengineering (74%) or cloud seeding
(72%) will be used before we fully understand how they affect the Earth’s
ecosystems. That includes about a third who say they are very concerned
about this (32% and 30%, respectively). People who have heard a lot about these technologies are
especially likely to express concern. For example, 72% of adults who have
heard a lot about solar geoengineering say they are very concerned it will be
used before we understand how it impacts Earth’s ecosystems, compared with
36% of those who have heard only a little about it and 27% who have heard
nothing. A similar pattern occurs with views about cloud seeding: A majority
of those who have heard a lot about it (59%) say they are very worried about
using such techniques before we understand their effects, compared with about
three-in-ten of those who have heard a little or nothing about it. 11th
June 2021 (Pew, USA) Source: Mixed
views in U.S. on using geoengineering to address climate change | Pew
Research Center 694-43-9/Poll (USA) Americans Have Less Confidence In Key World
Leaders – Including Biden – Than Other Global Publics do Americans have less confidence in key world
leaders – including Biden – than other global publics do
Americans generally exhibit less confidence in a variety of
world leaders – including U.S. President Joe Biden – than people in Canada,
Europe and the Asia-Pacific region do, according to a Pew Research Center
survey of 17 global publics conducted earlier this year. Overall, six-in-ten U.S. adults say they have confidence in
Biden to do the right thing regarding world affairs. That’s similar to the
share of Americans who express confidence in German Chancellor Angela Merkel
(63%) and French President Emmanuel Macron (58%) and far higher than the
share who have confidence in Russian President Vladimir Putin (16%) and
Chinese President Xi Jinping (15%). More than four-in-ten U.S. adults say
they have no confidence at all in the Russian and Chinese presidents. How we did this By comparison, people surveyed in other parts of the world are generally more likely than Americans
to express confidence in each of these world leaders. Across all 16 surveyed
publics, excluding the U.S., a median of around three-quarters of adults have
confidence in Merkel (77%) and Biden (74%), while a median of 63% have
confidence in Macron. Far fewer have confidence in Putin and Xi (medians of
23% and 20%, respectively).
Notably, Americans are the least confident
in Biden out of all publics surveyed. This is the inverse of the pattern seen
under Donald Trump, when Americans exhibited significantly more confidence in the U.S. president compared with
others surveyed around the globe. Americans are also among the least confident in Merkel. Only Greeks
exhibit less trust in the German chancellor, who draws confidence from 90% in
some European countries. Views of Macron, Xi and especially Putin are also
relatively negative in the U.S. compared with in Europe and the Asia-Pacific.
Americans tend to have more extreme opinions of Biden than of
his European counterparts. Around one-third of U.S. adults (31%) say they
trust Biden a lot, while only 19% say the same for Merkel and 9% for Macron.
On the opposite end of the spectrum, Americans are twice as likely to say
they do not have any confidence in Biden (23%) as
to say the same about the German and French leaders (9% and 10%,
respectively). This is in large part due to the wide partisan divisions in
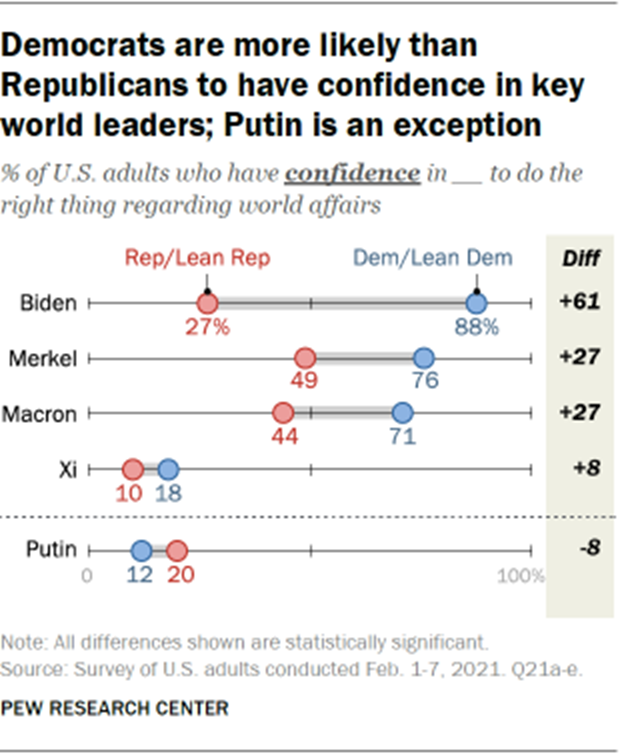
Americans’ views of the U.S. president. Across all five leaders, Democrats and Republicans are most
divided over their own head of state. Democrats and Democratic-leaning
independents are 61 percentage points more likely than Republicans and
Republican-leaning independents (88% vs. 27%) to express confidence in Biden
to do the right thing regarding world affairs. (For more on the partisan
divide over Biden’s approach to foreign policy, see Pew Research
Center’s February report.)
Democrats are also 27 points more likely than Republicans to
have confidence in Merkel and Macron and 8 points more likely to have
confidence in Xi (18% vs. 10%). As for Putin, the partisan divide is turned
on its head. Republicans are 8 points more likely than Democrats to have
confidence in the Russian leader to do the right thing regarding world
affairs, though only 20% of Republicans and 12% of Democrats hold this view. 11th June 2021 (PEW, USA) Sources: Americans
less confident in key world leaders than other global publics | Pew Research
Center 694-43-10/Poll (USA) Slow Growth In U.S. Electric
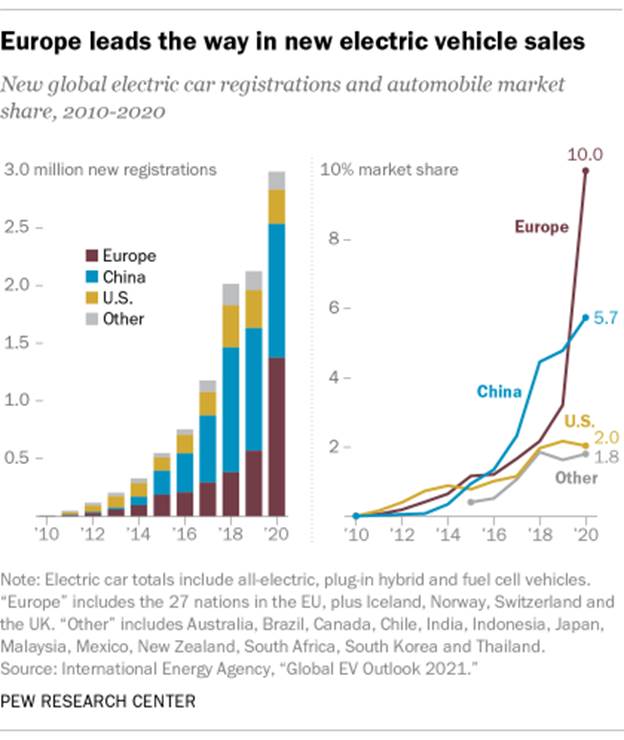
Vehicle Market: Only 7% of Adults Have an Electric or Hybrid Vehicle Today’s
electric vehicle market: Slow growth in U.S., faster in China, Europe A small but significant share of car owners in the United
States have traded filling up for plugging in, and many more are thinking of
joining them. In a recent Pew Research Center survey, 7% of U.S. adults said they currently have
an electric or hybrid vehicle, and 39% said they were very or somewhat likely
to seriously consider buying an electric vehicle the next time they’re in the
market for new wheels. Outside of a few major metropolitan areas, electric vehicles
(EVs) aren’t all that common in the U.S. While their numbers have
grown rapidly in absolute terms in recent years, that’s from a relatively
small base.
As of 2020, nearly 1.8 million EVs were registered in the
U.S., more than three times as many as in 2016, according to the International Energy Agency (IEA). They come in three broad categories.
All-electric vehicles (also called battery-electric vehicles) have been the
fastest-growing category: The total number of such vehicles registered in the
U.S. has soared from fewer than 300,000 in 2016 to more than 1.1 million last
year. Consumers have purchased the other two types of EVs, plug-in hybrid
vehicles and fuel cell vehicles, at lower rates. How we did this Terminology But the U.S. represents only about 17% of the world’s total
stock of 10.2 million EVs, according to IEA data. China has 44% of all the
EVs in the world (more than 4.5 million), and the nearly 3.2 million in
Europe account for about 31%.
The fastest growth in EV sales has been in Europe: a compound
annual growth rate of 60% from 2016 to 2020, compared with increases of 36%
in China and 17% in the U.S.
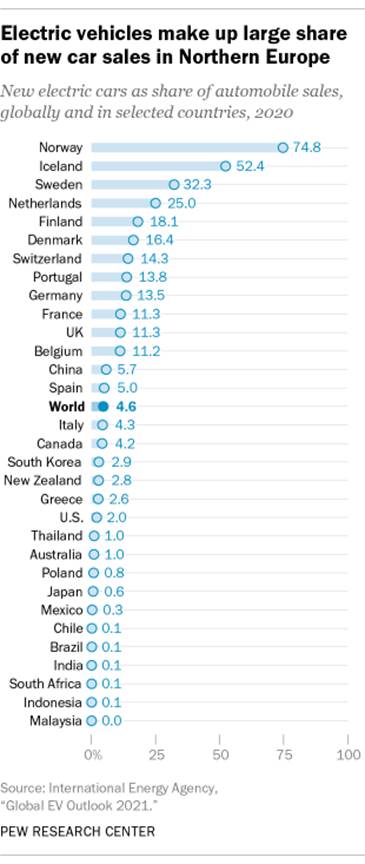
Last year, nearly three-quarters of all cars sold in Norway and
more than half of those sold in Iceland were electric – by far the highest
market shares for EVs in any of the 31 countries for which IEA has collected
data. In 10 other European countries, between a tenth and a third of all
new-car sales last year were electric. By contrast, sales have slowed in the U.S. in the past few
years, largely due to the declining popularity of plug-in hybrids and the
phaseout of federal tax credits on some of the most popular models. Last
year, about 64,300 plug-in hybrids were sold, about half as many as in 2018,
according to the IEA. Meanwhile, about 231,000 all-electric vehicles were
sold in 2020, down 3.2% from 2018. In each of the past three years, EVs
accounted for about 2% of the U.S. new-car market. The COVID-19 pandemic may have affected vehicle sales of all
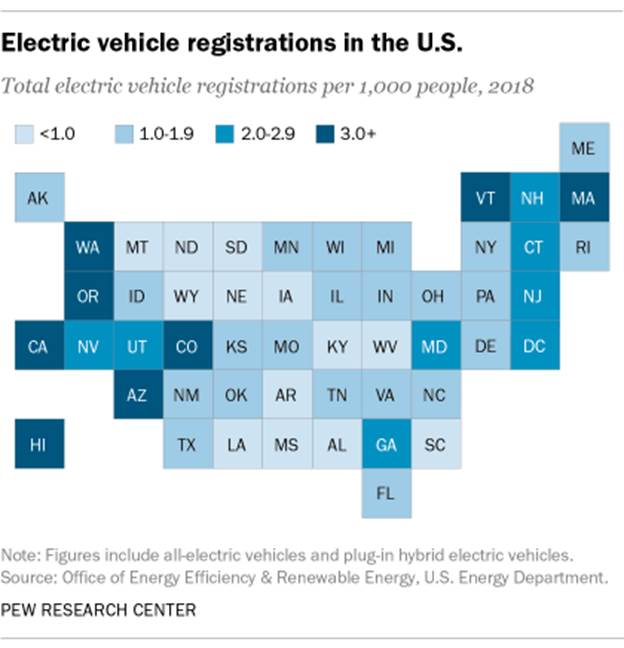
types in 2020, making comparisons difficult. California has by far the highest share of EVs of any U.S.
state – which is to be expected, given that for decades the state has
required carmakers to build EVs and has used an array of rebates and other incentives to encourage Californians to buy them.
As of 2018, the most recent year for which federal data is available,
California had about 12 EV registrations per 1,000 people; the next-highest state, Hawaii, had roughly
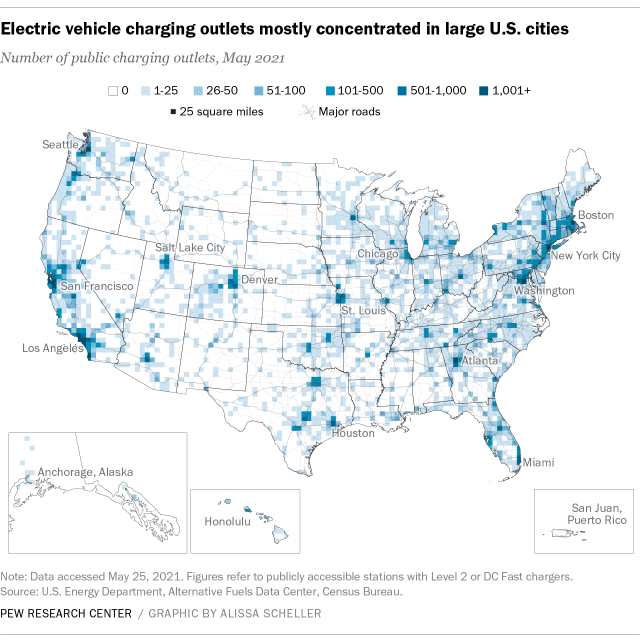
six registrations per 1,000 people. To support all those EVs, California also has led in building
out networks of charging stations. Of the more than 42,000 publicly
accessible charging stations in the U.S. as of May 25, 2021 (containing more
than 102,000 individual outlets) across the U.S., nearly a third (30.8%) are
in California, according to Pew Research Center’s analysis of Energy Department data. For comparison, there are an estimated 145,000 to 150,000 gasoline retailers in the U.S. Relative to the size of its vehicle fleet, though, Washington,
D.C., may be the most convenient place in the U.S. to drive an EV. The 237
charging stations in the federal district have a total of 630 outlets, or one
for every 487 privately owned cars and trucks on D.C. roads. (Vermont and,
yes, California place second and third; the national average is one outlet
for every 2,570 private and commercially owned cars and trucks.)
Nationwide, the number of publicly available charging stations
has more than tripled since 2015, when there were fewer than 32,000
throughout the country, according to IEA data. The agency projects that
number to grow dramatically by the end of the decade, to between 800,000 and 1.7
million, depending on which public policies are adopted. (President Joe
Biden’s infrastructure proposal includes a national network of 500,000 charging stations; in the Pew
Research Center poll, 62% of Americans said they favored such a plan.) Electric cars weren’t always such a small percentage of the
U.S. market. Over a century ago, while the auto business was still in the
learner’s-permit stage, electricity competed fiercely with steam and gasoline
to be the new industry’s dominant power source. In 1900, in fact, more than a
third of all cars built in the U.S. were electric, according to a Census Bureau report from that time. (True, that was 1,575
cars out of a total of 4,192, but still.) Within a couple of decades, however, several developments
would lead to the dominance of the gas-powered internal-combustion engine.
Among them were public desire for longer-range vehicles; electric starters
replacing cumbersome and hazardous hand-cranks; lower gasoline prices; and
assembly line mass production. By 1935, electric vehicles had all but disappeared. 7TH
June 2021 (Pew Research
Center) Sources: Electric
vehicle market growing more slowly in U.S. than China, Europe | Pew Research
Center 694-43-11/Poll (USA) NATO In a Favorable Light By People In Member
States: 61% Americans’ Opinion in Favor. NATO continues to be seen in a favorable
light by people in member states
As leaders across Europe and North America gather next week
for the 2021 NATO summit, most across the 10 member states included in a new Pew
Research Center survey see the political and military alliance in a positive
light. Moreover, positive views of NATO are at or near all-time highs across
several member states. Opinions among Americans, who contribute the most to NATO’s annual budget, are at 61%
favorable, the same as the overall median across the NATO states surveyed.
In nine of the nations surveyed in 2021, about half or more
hold a favorable opinion of the alliance. Two-thirds or more of adults in
Italy, the Netherlands and Canada have a positive opinion of NATO, along with
about six-in-ten or more in the United Kingdom, the United States, NATO’s
home base of Belgium, and Germany. But in Greece, only 38% see NATO favorably. In nonmember Sweden, 70% have a positive opinion of the more
than 70-year-old alliance. Except in Greece, in no country surveyed do more
than about a third have a negative view of NATO, although in many countries
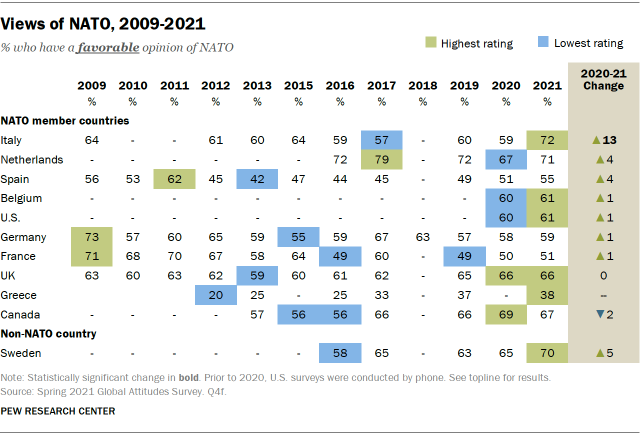
around one-in-ten hold no opinion of the multilateral organization. Favorable opinions of NATO have generally held steady across
most countries surveyed over the past year. And in many countries, positive
attitudes toward NATO are at or near all-time highs since this question was
first asked in 2009, including in Italy and the UK. Italy is the only NATO
country surveyed in which positive views of the organization have increased
significantly since the summer of 2020 (up 13 percentage points). How we did this While opinion of NATO in the U.S. is mostly unchanged over the
past year, views before that had fluctuated from 49% favorable in 2013 to as
high as 64% in 2018. However, these figures were from prior to 2020, when the surveys were done by phone and the
Center had not yet switched to its online American Trends Panel, and are not directly comparable.
In every country surveyed, those with a favorable view of the U.S. are more likely than those with an
unfavorable view of the U.S. to see NATO in a positive light. In Spain, for
example, 68% of those with a favorable view of the U.S. also have a favorable
view of NATO, compared with just 35% of those with an unfavorable view of
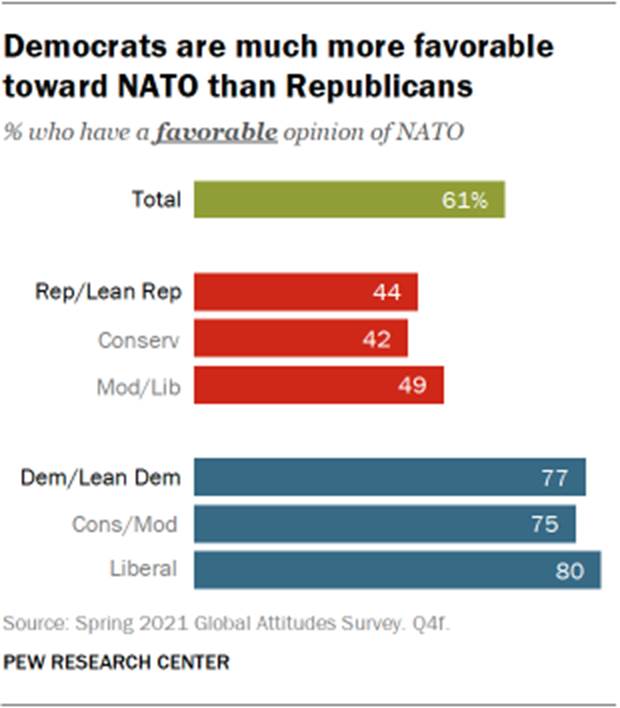
America. While Americans are more favorable toward NATO than not,
partisans hold very different views of the alliance. Democrats and
Democratic-leaning independents are much more likely than their Republican
counterparts to have a positive assessment of NATO (77% vs. 44%,
respectively). But within each partisan coalition
in the U.S., there are few differences by ideology. Conservative Republicans
are about as likely as moderate or liberal Republicans to have a favorable
view of the organization. The same holds true for Democrats: Liberals are no
more likely than conservative or moderates to have a positive view of NATO.
Generally, Democrats have been more keen on the military
alliance than Republicans in phone surveys conducted since 2009. In addition, 71% of Americans say the
U.S. benefits by being a member of NATO, including 55% of Republicans and 85% of
Democrats. Outside of the U.S., political attitudes are linked to views
of the alliance, but in the opposite direction. In several European
countries, those who place themselves on the ideological right are more
favorable toward NATO than those on the ideological left. In Greece, for
example, 48% of those on the right have a favorable view of the organization,
compared with 23% of those on the left. This pattern also holds in non-NATO
country Sweden, where those on the right are 31 percentage points more likely
than those on the left to have a positive view of the alliance. U.S. President Joe Biden will be attending the summit as part of his first overseas
trip as president. Biden’s public statements reaffirming U.S. commitment to the organization stand in stark
contrast with his predecessor’s more unfavorable views of NATO. Biden will also be meeting with
the leaders of France and Germany on his trip, and new data shows that all
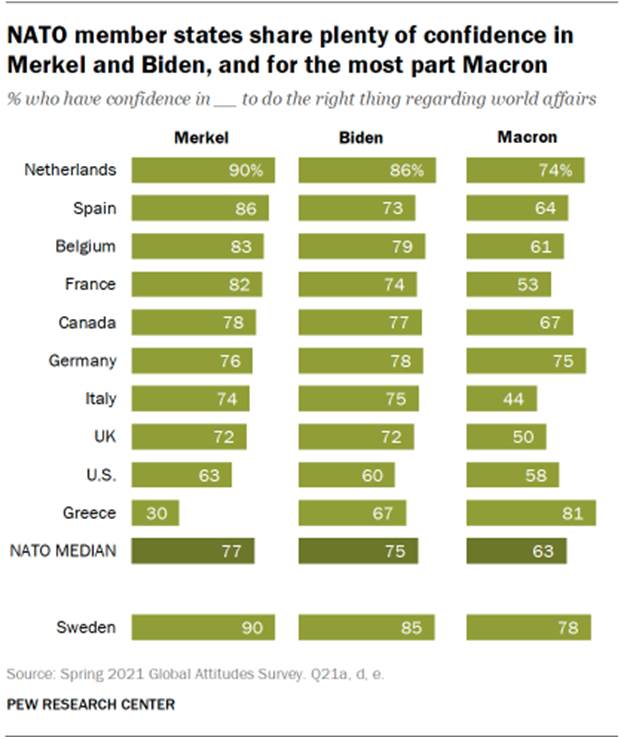
three leaders are generally popular with the NATO publics surveyed.
Among NATO member countries, a median of 75% have confidence
in Biden to do the right thing regarding world affairs. This compares with
77% who have confidence in German Chancellor Angela Merkel and 63% who have
confidence in French President Emmanuel Macron. In most NATO countries
included in the survey, along with Sweden, publics have roughly similar
levels of confidence in Merkel and Biden, although Macron garners less in
Italy. Greeks are enthusiastic toward the U.S. and French leaders: 67% say
they have confidence in Biden and 81% have confidence in Macron. However,
only 30% in Greece have confidence in Merkel. Confidence in these three leaders’ ability to handle world affairs is also
linked to views of NATO: Across most countries included, those who have
confidence in Biden, Merkel and Macron are more likely than those who do not
to hold a favorable opinion of NATO. In Canada, for example, those with
confidence in Biden are 31 percentage points more likely than those with no
confidence to have a positive view of NATO. And Canadians who have confidence
in Merkel and Macron are 34 and 21 points more likely, respectively, to have
a favorable view of NATO than those who do not have confidence in the German
and French leaders. Copyright 2021 Pew Research Cen 10th
June 2021 (Pew
Research Center) Source: People
in NATO member states have favorable views of alliance in 2021 | Pew Research
Center 694-43-12/Poll (USA) During The Pandemic, Teen Summer Employment Hit
Its Lowest Point (30.8%) Since the Great Recession During the pandemic, teen summer employment
hit its lowest point since the Great Recession
During the pandemic summer of 2020, teen summer employment in
the United States plunged to its lowest level since the Great Recession,
erasing a decade’s worth of slow gains, according to Pew Research Center’s
latest analysis of federal employment data.
Fewer than a third (30.8%) of U.S. teens had a paying job last
summer, as many of the places most likely to employ them – restaurants,
shops, recreation centers, tourist attractions – were either shuttered
entirely or had their operations severely curtailed because of the COVID-19 pandemic. In 2019, 35.8% of teens worked over the
summer. As recently as 2000, more than half (51.7%) of U.S. teens
could expect to spend at least part of their summer vacation lifeguarding,
selling T-shirts, dishing up soft-serve ice cream or otherwise working for
pay. But the share of teens working during the summer tumbled soon after, to
29.6% in 2010 and 2011. When teens do get summer jobs these days, they’re
more likely to be busing tables or tending a grill than staffing a mall
boutique or souvenir stand (despite an uptick in teen retail employment in
2020). How we did this
From the late 1940s, which is as far back as the data goes,
through the 1980s, teen summer employment followed a fairly regular pattern:
rising during economic good times and falling during and after recessions. The teen summer employment rate fluctuated
in a relatively narrow band: 46.3% (the low, in 1963) to 58% (the peak, in
1978). That pattern began to change in the 1990s, when the teen
summer employment rate didn’t experience its typical bounce-back after the
1990-91 recession. Teen summer employment fell sharply starting during the
2001 recession and dropped even more sharply during and after the 2007-09
Great Recession. The teen summer employment rate edged higher throughout the
2010s but never quite returned to pre-recession levels. The COVID-19 pandemic, and the economic restrictions imposed
to combat its spread, upended the teen job market just as it did the broader
job market. About 1.9 million 16- to 19-year-olds lost their jobs between
February and April 2020. While there was some recovery in the ensuing months,
the number of teens employed in July 2020 – what would normally be the peak
month for summer jobs – fell by more than a million from July 2019. While younger teens – 16- and 17-year-olds – are still less
likely to work in the summer than their older peers, they lost jobs at a
slower pace last year than did older teens (ages 18 to 19). Last summer’s
average employment rate for 16- and 17-year-olds was 22.3%, down 2 percentage
points from 2019. But for 18- and 19-year-olds, summer employment last year
averaged 40.5%, compared with 47.8% in 2019.
White teens are more likely to work in the summer, as well as
during the rest of the year, than teens of other racial and ethnic
backgrounds – a trend the pandemic did nothing to change. On average last
summer, about a third (33.4%) of 16- to 19-year-old White teens were
employed, compared with 25.8% of Hispanic teens, 25.1% of Black teens and
14.3% of Asian teens. The decline in teen summer jobs is a specific instance of a
broader long-term decline in overall youth employment, a trend that’s also been observed in other advanced economies. Besides the pandemic-specific reasons why teens might not have
worked last summer, researchers have suggested multiple reasons why fewer
young people are working in other summers: fewer low-skill, entry-level jobs,
such as sales clerks or office assistants, than in decades past; more schools
ending later in June and/or restarting before Labor Day; more students
enrolled in high school or college over the summer; more teens doing
volunteer community service as part of their graduation requirements or to
burnish their college applications; and more students taking unpaid
internships, which the Bureau of Labor Statistics doesn’t count as being employed. The types of summer jobs that
teenagers are holding have changed over time, too – though last year’s
pandemic-related shifts obscure some of the long-term trends.
More than a third (35.1%) of the estimated 5.4 million teens
who were employed last July worked in the accommodation and food services
industry – restaurants, hotels and the like – compared with 31.9% in July
2019 and 22.6% in July 2000, according to BLS data. Retail, after years of
decline as a summertime source of teen jobs, rebounded last summer,
accounting for about a quarter (24.5%) of employed teens. The retail share
had fallen from 24% in 2000 to 19% in 2019. The construction and manufacturing sectors, which together
employed about 12.6% of teens in July 2000, accounted for just 7% this past
July. And arts, entertainment and recreation, which had grown steadily as a
summertime employer of teens since 2000 (think of all those fairs, carnivals
and community pools), slumped to 6.7% of total teen summer employment in
2020, compared with 9.3% in 2019.
Occupational (not industry) data shows that many summer job
categories continue to differ markedly by sex. Last July, for example, 27.6%
of working female teens had sales jobs, compared with 12.8% of male teens.
Female teens were three times as likely as males to have personal care and
service jobs (9.7% vs. 3.2%) and more likely to have office and
administrative support jobs (11.2% of female teens vs. 7.7% of male teens).
On the other hand, male teens were far likelier than female teens to have
transportation and material moving jobs (17.9% vs. 5%); construction and
extraction jobs (8.8% vs. 0.1%); and installation, maintenance and repair
jobs (3.4% vs. 0.1%). As the country continues to emerge from pandemic-related
shutdowns and restrictions, how do things look for teen summer employment
this year? As overall job trends indicate a strengthening economy, 32.4%
of 16- to 19-year-olds, or 5.3 million teens, were employed in May 2021 (not adjusting for seasonal variations). By both
measures, those are the highest May employment figures for teens since 2008.
An estimated 562,000 teens were unemployed, meaning they were available and
actively searching for work but hadn’t yet found any – a much stronger number
than a year ago, when about 1.7 million teens were unemployed. The
unemployment rate among those ages 16 to 19 was 9.5%, a vast improvement over
the 30.7% rate recorded in May 2020. That improvement, combined with reports of worker shortages as
the country reopens, could portend a far better summer for teen jobs than last year. Over the long term, though, the trend of fewer teens working
over the summer seems likely to continue. Even though there were more
working-age teens in May 2021 than in May 2000 (16.4 million vs. 15.9
million), far fewer of them were in the labor force: 5.9 million as of May,
down from 8.1 million in 2000. And about 10.6 million teens, or nearly
two-thirds of the total civilian non-institutional population ages 16 to 19,
were outside the labor force entirely, compared with 7.8 million (49.1%) in
May 2000. Note: This is an update of a post originally published July 2,
2018. 7TH June 2021 (Pew USA) Source: During
COVID-19, teen summer jobs were at lowest since Great Recession | Pew
Research Center 694-43-13/Poll (USA) 46%
of Americans Believe Changing One's Gender is Morally Acceptable Whereas 51%
Believe It is Morally Wrong Changing One's Gender Is Sharply Contentious Moral Issue
BY MEGAN BRENAN
STORY HIGHLIGHTS
WASHINGTON,
D.C. -- Gallup's most recent gender
identity data find 0.6% of U.S. adults identify as transgender; that is,
the gender with which they identify is different from the one they were
assigned at birth. Changing one's gender identity is sharply contentious
among Americans, who are slightly more likely to say it is morally wrong
(51%) than morally acceptable (46%). There are
significant demographic disparities in Americans' views, including by gender,
age and political ideology. Women are more likely than men to view switching
genders as morally acceptable, as are younger adults more likely than older
adults. The large majority of those who identify as politically liberal (78%)
think being transgender is acceptable from a moral standpoint, and they are
more than three times as likely as political conservatives (23%) to say as
much. Americans'
Views of the Moral Acceptability of Changing One's Gender Regardless
of whether or not you think it should be legal, for each one, please tell me
whether you personally believe that in general it is morally acceptable or
morally wrong. -- Changing one's gender
Gallup
has tracked Americans' views of the morality of a range of social issues
since 2001. The latest update, conducted May 3-18, includes 20 issues, 16 of
which have been tracked since the early 2000s. The gender question was asked
for the first time this year. Americans View 11
of 20 Issues as Morally Acceptable
A majority
of Americans consider 11 of the 20 issues morally acceptable. The use of
birth control ranks at the top of the list, with 90% of U.S. adults saying it
is acceptable. Broad
majorities also view divorce (79%) and sex between an unmarried man and woman
(73%) as acceptable moral behaviors. Likewise, roughly two-thirds of
Americans see gay or lesbian relations, gambling, having a baby outside of
marriage, and medical research using human embryonic stem cells as morally
acceptable. Fewer,
though still more than half of U.S. adults, think the death penalty, buying
and wearing clothing made of animal fur, doctor-assisted suicide and medical
testing on animals are morally acceptable. Abortion,
which has long been a wedge issue, is the only one of the 20 with an equal
split between those who believe it is morally acceptable (47%) and those who
say it is morally wrong (46%). In the past, more Americans typically
considered abortion morally wrong than morally acceptable. As is the
case with views of changing one's gender, a slim majority think sex between
teenagers is morally wrong, while the remaining six issues are viewed as
morally wrong by larger majorities of Americans. Nearly nine in 10 U.S.
adults believe extramarital affairs and cloning humans are morally wrong, and
just over three-quarters view polygamy and suicide the same way. Roughly six
in 10 think cloning animals and pornography are wrong from a moral
perspective.
Stacked
bar chart. Of 20 issues measured, 11 are considered morally acceptable by
majorities of Americans -- birth control, getting a divorce, sex between an
unmarried man and woman, gambling, smoking marijuana, gay or lesbian
relations, having a baby outside of marriage and medical research using human
embryonic stem cells, the death penalty, medical testing on animals, buying
and wearing clothing made of animal fur and doctor-assisted suicide. Views on
abortion are split nearly evenly and the remaining seven issues are viewed by
majorities of Americans as morally wrong: extramarital affairs, cloning
humans, suicide, polygamy, cloning animals, pornography and teenage sex. Current
perceptions about the morality of the issues tested are similar to readings
in recent years. However, the latest data includes several notable findings
from a historic perspective: ·
The percentages who say three of the issues -- abortion, divorce
and gay or lesbian relations -- are morally acceptable are the highest
recorded by Gallup, all by two percentage points. ·
Likewise, the moral acceptability of two issues are the highest
on record by one point -- sex between an unmarried man and woman and having a
baby outside of marriage. Generally
speaking, Americans' attitudes have
become more morally permissive on most of these issues over the past two decades. Political Ideology
Divides Views of Morality of Nearly All Issues
Americans'
perspectives on morality are strongly related to (and perhaps influenced by)
their own political ideology. The most polarizing issues are changing one's
gender and abortion with 55- and 54- point gaps, respectively, in liberals'
and conservatives' views of them as morally acceptable. There are
significant ideological differences on all issues but medical testing on
animals. Even so, majorities of liberals and conservatives are on the same
side of the issue in 10 of 20 cases. On almost all of the rest, liberals find
the practice morally acceptable, while Republicans disagree. ·
Agreement on moral acceptability: The issues with majority-level agreement on moral
acceptability among liberals and conservatives are: birth control, divorce,
gambling, sex between an unmarried man and woman, and medical testing on
animals. Majorities of liberals and conservatives also agree that several
behaviors are morally wrong -- extramarital affairs, cloning animals or
humans, suicide, polygamy and pornography. ·
Liberal majorities: Majorities of liberals but less than half of conservatives
view some issues as morally acceptable -- changing one's gender, abortion,
gay or lesbian relations, medical research using human embryonic stem cells,
doctor-assisted suicide, sex between teenagers, pornography and cloning
animals. ·
Conservative majorities: Majorities of conservatives but less than half of liberals
believe two issues are morally acceptable -- the death penalty and buying or
wearing clothing made of animal fur. Moral
Acceptability of Issues, by Ideology %
Saying it is morally acceptable
Bottom Line
Americans'
views of the morality of 20 issues are little changed since last year, though
from a longer-term perspective, Americans' views have shifted significantly
toward more permissive attitudes. Birth control and divorce continue to be
the most morally acceptable to society and extramarital affairs, and cloning
humans the most morally wrong. The new addition to the list, changing one's
gender, is nearly as divisive as abortion, which has typically been the most
contentious issue. And the ideological divide on these two issues is the
greatest seen in the poll. Transgender issues only recently emerged as a
prominent topic in society, and it remains to be seen whether the public's
views about changing one's gender will evolve in the way that their opinions
of gays and lesbians did, or if they stay as polarized as abortion. 11th June 2021 (Gallup, USA) Source: Changing
One's Gender Is Sharply Contentious Moral Issue (gallup.com) 694-43-14/Poll (USA) Only 20% Of Americans Believe
COVID-19 To Be The Main Problem Fewer in U.S. Cite Coronavirus as Most Important Problem
BY MEGAN BRENAN
STORY HIGHLIGHTS
WASHINGTON,
D.C. -- With millions of Americans being vaccinated against COVID-19 every
day and states increasingly loosening restrictions, the public is now less
likely to say the coronavirus is the most important problem facing the nation
than at any point since March 2020. Twenty percent currently name the
coronavirus, down from 25% last month, but considerably lower than the April
2020 high point of 45% when residents in many states were living under
stay-at-home orders.
Line
graph. Percentage of Americans mentioning the coronavirus as the most
important problem facing the U.S. since March 2020. Currently, 20% mention
it, the lowest since 13% in March 2020. Although
fewer U.S. adults cite COVID-19 than have done so for more than a year, it is
still the top problem, and immigration (14%), the government (14%) and race
relations (12%) are named as the next most pressing issues. In
addition to the five-percentage-point decline in mentions of COVID-19, the
government (-6 points) and the economy (-4 points) fell since last month. At
the same time, the percentages naming immigration (+6 points) and race
relations (+4 points) as the nation's top problem ticked up. Most
Important Problem in U.S., March-April 2021 What do
you think is the most important problem facing this country today?
[OPEN-ENDED]
These
changes, from the latest Gallup poll conducted April 1-21, are largely
reflective of recent public opinion on these issues. Specifically, Americans
are largely satisfied
with the vaccine rollout and are less
worried about contracting COVID-19 than they have been since the beginning of the pandemic.
Likewise, approval
of President Joe Biden remains relatively high and economic
confidence is better than it has been in over a year. The decreases in mentions
of COVID-19, the government and economic concerns as the greatest U.S.
problem are likely owed, at least in part, to these attitudes. Meanwhile,
the increase in mentions of immigration comes as the Biden administration
continues to struggle with record numbers of migrants arriving at the
southern U.S. border. The
latest poll's field period also coincided with most of the trial of Derek
Chauvin, the police officer who was ultimately found guilty of manslaughter
and second-degree murder and third-degree murder of George Floyd. This, along
with a recent spate of news around several deaths of Black people caused by
police, has likely contributed to the increase in citations of race relations
as the nation's most important problem. Still, mentions of race relations
are not
as high as they were last year in the aftermath of Floyd's death and nationwide calls for
racial justice. Partisans' Starkly
Different Views of Nation's Most Important Problem
As with
most things in the U.S. today, there is little common ground between
partisans when it comes to their assessments of the top problem in the
nation. Republicans and Republican-leaning independents cite immigration
(25%) and the government (20%) as the top problems, and 13% name COVID-19. In
contrast, COVID-19 is the top overall problem among Democrats and
Democratic-leaning independents at 27%, followed by race relations at 19%.
All other problems register in the single digits among Democrats. While race
relations is one of Democrats' chief concerns, just 4% of Republicans mention
the issue. Most
Important Problem in the U.S. What do
you think is the most important problem facing this country today?
[OPEN-ENDED]
Satisfaction With Direction of Country Remains Elevated
Americans'
satisfaction with the direction of the country is now at 34%, little changed
from last month's 32%, but is the highest since March 2020 when 42% were
satisfied. Satisfaction has tripled since January when it hit its lowest point in a decade; still, roughly
two-thirds of Americans, 65%, remain dissatisfied.
Line
graph. Satisfaction with the direction of the U.S. among Americans since
April 2019. The latest 34% satisfaction rating on the metric is up 23
percentage points since January. The
recent rise in satisfaction is owed
almost entirely to Democrats and independents. While 51% of Democrats and
Democratic-leaning independents are satisfied, 16% of Republicans and
Republican-leaning independents are. Approval of
Congress Down Slightly, but Still High on Relative Basis
Americans'
33% job approval rating of Congress is down slightly from last
month's 36%, which was a 12-year high.
Line
graph. Americans' approval of the way Congress is handling its job since
January 2008. Currently, 33% of U.S. adults approve, which marks a
three-percentage point decline from last month. The
increase in congressional approval reflects Democrats'
greater positivity toward the institution since the party took control of the
presidency and both houses of Congress. Approval of the legislative branch
remains highly polarized in the current survey, with Democrats and Democratic
leaners (52%) four times more likely than Republicans and Republican leaners
(13%) to approve. Bottom Line
Biden is
marking his first 100 days in office with an address before both houses of
Congress. The general mood among Americans is better than it has been for
much of the previous year. Biden's job approval rating is a solid 57%, the
public is feeling more positive about the fight against COVID-19, and
assessments of the economy are at their highest point in over a year. Yet, he
is facing some tough issues in addition to the pandemic and the economy. The
crisis at the U.S.-Mexico border has resulted in an uptick in concern about
immigration (mainly among Republicans), and mentions of race relations as the
nation's greatest problem have increased (mostly among Democrats). 28th
April 2021 (Gallup
USA) Sources:
Fewer
in U.S. Cite Coronavirus as Most Important Problem (gallup.com) SOUTH AMERICA: 694-43-15/Poll (Brazil) 93% of Brazilians Want to Get Vaccinated Global Views on a Covid-19 Vaccine: 93% of Brazilians want to
get vaccinated
Brazilians
want to get vaccinated against Covid-19. This is what our Global Views on a Covid-19
Vaccine monitor shows,conducted for the World
Economic Forum in 15 countries. In Brazil, the intention remains very high:
93% of people say they will take the vaccine as soon as available to them, by
far the highest rate among all countries surveyed. 9TH
June 2021 (Ipsos, Brazil) Sources: Présentation
PowerPoint (ipsos.com) EUROPE 694-43-16/Poll (Germany) A
Quarter Of Germans Own Smart Household Appliances, 10 percent of them Own a Smart
Washing Machine A quarter of Germans own smart household appliances, 10 percent of them a
smart washing machine
On TheJune 11, 2021, 9:27 a.m. A YouGov
analysis of smart home appliances, consumer attitudes to purchase and use
Switching on the coffee machine or programming the
tumble dryer on the go – smart "Internet of Things" (IoT) devices
are already used by a quarter of Germans: 25 percent of all respondents state
that they already own a smart household appliance. Among them, 10
percent each own a smart washing machine or a smart vacuum cleaner. 8
percent of owners of smart household appliances state that they own a stove
or oven, and another 8 percent own a refrigerator, freezer or a refrigerated-frozen
combination.
CONTROL VIA APP MAIN SMART FUNCTION
Control via app on the smartphone or tablet is the most
important smart function for those respondents who say they pay attention to
smart functions when buying household appliances (23 percent of all respondents)
(56 percent). 41 percent pay attention to smart assistance functions,
for example that a stove recognizes the pot sizes, a washing machine the
filling quantity or a refrigerator individual products stored in it. 28
percent, on the other hand, pay attention to the control via voice commands
without an app.
COMFORT AND RELIEF IN EVERYDAY LIFE WITH SMART
HOUSEHOLD APPLIANCES MOST IMPORTANT
Three out of five Germans (59 percent) say that smart
household appliances are comfortable, 51 percent are of the opinion that they
relieve everyday life. 44 percent think they make sense. The
respondents are least likely (31 percent) to rate these devices as
environmentally friendly.
DEEP DIVE – INTERESTED PARTIES FOR SMART HOUSEHOLD
APPLIANCES
The target group of people who say they pay attention
to smart features when buying household appliances are more likely to be male
(58 percent vs. 47 percent of those who don't pay attention to them), less
likely to be single (23 percent vs. 31 percent of those who don't pay attention
to them), and less likely to be older than 55 years old (27 percent vs. 48
percent of those who don't pay attention to them). 43 percent of the
target group plan to buy a new household appliance in the next 12 months (vs.
30 percent of those who do not pay attention to it).
11th June 2021 (YouGov, Germany) 694-43-17/Poll (Germany) Two Out
Of Five Germans Use Mobile Apps For Voice Calls- Less Than The Global Average
Two out of five Germans use mobile apps for voice calls, less than the
global average
A recent
survey conducted in 17 markets worldwide provides information on which
consumers use third-party apps for voice calls.
The fact that nowadays you can no longer only make
voice calls via the telephone or mobile network, but also fall back on social
networks such as WhatsApp, Signal or Telegram, is not new. But how
widespread is making calls via these third-party app providers in an
international comparison? Among Germans, 42 percent say that they make voice
calls via mobile apps very or relatively frequently. These are rather
few in an international comparison. The data show that consumers in
certain emerging markets do this most often: Indonesians lead on this
question with 86 percent, followed by Indians (81 percent), respondents in
the United Arab Emirates (76 percent) and Mexicans (71 percent). AMONG EUROPEANS, ITALIANS ARE LEADERS IN MAKING CALLS
THROUGH THIRD-PARTY APPS
Two-thirds of Italians (67 percent) state that they
make voice calls via mobile apps very or relatively frequently. This
puts Italy in 1st place in Europe on this issue, followed by the Spaniards
with 63 percent. In France, 44 percent make this figure, in great
Britain 43 percent.
In some cases, there is a correlation of our data to
the prices of mobile Internet data: In India, Indonesia and Italy, the use of
such apps is particularly high, but the prices for mobile data are
low. However, the same cannot be said for the United Arab Emirates and
Mexico, where people often use third-party apps for calls even though data
prices are high. SWEDES AND DANES USE THIRD-PARTY APPS FOR MAKING CALLS
THE LEAST
Although Germany ranks in the bottom half worldwide
when it comes to voice telephony with third-party apps, the Scandinavian
countries surveyed and consumers in the USA use apps for voice calls even
less frequently or least frequently in an international comparison: among Sweden
it is 26 percent, among Americans 22 percent and among Danes even only 20
percent who make this statement. In the US, for example, consumers enjoy
unlimited calls with their mobile tariffs, which undoubtedly contributes to
the low use of apps. As the availability of mobile Internet, including via
5G technology, will increase in emerging markets, the need to make
traditional phone calls is undoubtedly decreasing
there. Enterprise-based communication services, such as Microsoft Teams,
Slack, and Zoom, also provide cost-effective ways to make voice calls while
offering a number of other useful features. Since the beginning of the
corona pandemic, companies and their employees have had the opportunity to
familiarize themselves with these services as well. 9th June 2021 (YouGov, Germany) 694-43-18/Poll (Italy) 60% of Italians Think That
The Absence of Fans In Stadiums Will Make The Tournament Less Interesting The results of the research 60% of Italians think that the absence of fans in stadiums will make the
tournament less interesting
A few hours before the kick-off of the first UEFA EURO
2021 match from YouGov Italy we present the opinions of Italians, Germans,
French and Spaniards with respect to this tournament. How restrictions affect interest in the tournament According to anti-Covid regulations, the capacity of
each stadium will determine the volume of spectators who can sit in the
stands to watch the matches. Some stadiums such as Amsterdam, Bucharest,
Copenhagen, Glasgow, Rome and Seville will be able to exploit between 25% and
33% of their capacity. How has this affected interest in EURO 2020? 60% of Italians think that the absence of fans in
stadiums will make the tournament less interesting: a percentage higher than
that of any other European country. If the Spaniards are not too far
away (48%), French and Germans attach much less importance to the presence of
spectators in the stands: 42% of cousins from Oltralpe and only a third of
Germans find that the tournament will be less attractive due to the lack of
fans. Italians between the ages of 34 and 44 and people over
55 (64% for both age groups) consider a competition without fans less
interesting.
Where and how Europeans will follow UEFA EURO 2021 27% of Italians say they will only watch matches of the
national team or their favorite teams, while only 7% say they will follow all
matches. With the pandemic not yet behind, more than three quarters of
Italian respondents (77%) will watch games at home or with family, while
31% will do it at friends' homes. 7% will watch matches in a bar, and
the same percentage will do so in a public place suitable, possibly, to
celebrate the competition.
Are the Italians ready for the tournament? 49% of the Italian population loves The European and
can't wait for the games to start to enjoy this competition. The
percentage is more so among men, rising to 56 % among those between 35 and 44
years of age. Consistently, this age group is also the one most likely
to buy the kit of the national team or other participating teams: 27% of the
35-44 intend to do so, compared to 22% of 18-34 years old and 16% of the
national average.
Who are the Italians passionate about EURO 2020? There are over 16 million Italians passionate about
major sporting events that will follow the European Championship, equally
distributed along the Peninsula, mainly Men (69%) and 30% over the age
of 55. By crossing respondent data with the YouGov Profiles
database, we have identified some consumption habits that characterize fans
at EURO 2020: they are more likely to consume drinks, both soft (above
average consumption frequency) and alcoholic (17% have consumed alcohol
watching sporting events in the last 4 weeks, twice the national
average). This target was in fact more receptive to identifying some main sponsors of
EURO 2020: 47% noticed the presence of Coca-Cola (compared to 35% of
non-enthusiasts), 43% Heineken (against 27% of the benchmark).
11th June 2021 YouGov Italy 694-43-19/Poll (Spain) 51% of Spanish Population
Takes into Account the Existence of Natural Products In its Cosmetics When
Purchasing Them Cosmetics and skin care: purchase decision according to the environmental
impacts of the sector
Environmental issues have also reached the cosmetics
and skincare products sector. More and more the effects of any industry
on the environment begin to influence the purchasing criteria, therefore,
from YouGov we have analyzed the impact of environmental issues on the
shopping cart of the Spanish population. When purchasing a product its natural origin and the
care of animals are two of the most important criteria in the choice of
purchase More than half of the Spanish population (51%) it
takes into account the existence of natural products in its cosmetics when
purchasing them. This percentage varies between men and women, since 56%
of women in Spain retain this criterion as important, compared to 47% of men. The population that most takes into account the natural
origin of cosmetic products when buying them is the one over 55 years old
(56%). Another of the most decisive criteria when making the
purchase is the care that the elaboration of the product has with the
animals, when testing or developing them. This criterion is taken into account
by 48 per cent of the population. Most people who take this criterion into account are
between the ages of 25 and 34 (60%) and are women (55%).
On the other hand, 60% of the population responds that,
when buying cosmetics or skin care products, they take into account that they
are respectful of the planet. This percentage is higher among young
people between 25 and 34 years of age (67%) and women (65%).
Finally, recyclable packaging is also a purchasing
criterion when buying cosmetics or skincare products for 55% of the
population. Especially for the population between 25 and 34 years old
(60%) and women (54%).
9th June 2021 YouGov, Spain MULTI
COUNTRY: 694-43-20/Poll Most
Popular Holiday Types in The Nordics What are the most popular
holiday types in the Nordics?
Summer is fast approaching, and the Nordic
population is longing for a holiday. While some people dream about relaxing
time at the beach, others are more into active holidays or sightseeing in the
city. YouGov has felt the pulse of the favorite holiday types in the Nordics.
The global
pandemic heavily influenced last summer’s holiday season in the Nordics, but
as vaccinations are rolling and restrictions are gradually easing, more and
more start planning and dare to book a holiday abroad. Which holiday types do the people in the
Nordics generally prefer?
In May, we
measured the holiday types people in Sweden, Denmark, Norway and Finland
typically take.
Overall,
people in the Nordics are mostly into city breaks i.e. short holidays spent
in a city, with an average of 42 % people choosing this type of holiday
(ranging from 35 % of Swedes to 46 % of Finns). Next up are holidays that
combine relaxing and sightseeing/activity, with an average of 38 % – however,
this applies to only 28 % of the Swedish population. People in
the Nordics generally like to visit friends and family in the holidays (37
%). Especially Swedes (42 %) and Norwegians (41 %) practice this kind of
vacation activity, while it is slightly less popular in Denmark (29 %). Holidays
that involve culture and history are furthermore popular across the Nordic
countries (23 %). Swedes prefer beach holidays, while many Finns
choose a cruise
Looking at
the countries separately, there are several national differences. Focusing
on Sweden, the most popular holiday activity is simply relaxing at the beach.
Almost half of the Swedes (46 %) choose this type of holiday, while only a
third of Finns (33 %) and Danes (32 %) state the same. The Finns
have another favorite in their top 5. A third of the population (32 %) state
that they like to go on a cruise for the holidays – this applies to averagely
10 % in the other countries, and for Denmark, the number is just 5 %. Danes are
also less into holidays at a theme park (5 %), as opposed to Norway and
Sweden where one out of ten (11 % and 10 %) state that they like this kind of
holiday. (15th June 2021) (YouGov, Denmark) Source: YouGov | What are the most popular holiday types in the Nordics? |
|||||||||||||||||||||||||||||||||||||||||||||||||||||||||||||||||||||||||||||||||||||||||||||||||||||||||||||||||||||||||||||||||||||||||||||||||||||||||||||||||||||||||||||||||||||||||||||||||||||||||||||||||||||||||||||||||||||||||||||||||||||||||||||||||||||||||||||||||||||||||||||||||||||||||||||||||||||||||||||||||||||||||||||||||||||||||||||||||||||||||||||||||||||||||||||||||||||||||||||||||||||||||||||||||||||||||||||||||||||||||||||||||||||||||||||||||||||||||||||||||||||||||||||||||||||||||||||||||||||||||||||||||||||||||||||||||||||||||||||||||||||||||||||||||||||||||||||||||||||||||||||||||||||||||||||||||||||||||||||||||||||||||||||||||||||||||||||||||||||||||||||||||||||||||||||||||||||||||||||||||||||||||||||||||||||||||||||||||||||||||||||||||||||||||||||||||||||||||||||||||||||||||||||||||||||||||||||||||||||||||||||||||||||||||||||||||||||||||||||||||||||||||||||||||||||||||||||||||||||||||||||||||||||||||||||||||||||||||||||||||||||||||||||||||||||||||||||||||||||||