|
BUSINESS & POLITICS IN THE WORLD GLOBAL OPINION REPORT NO. 695-696 Week:
June 14 –June 27, 2021 Presentation:
July 05, 2021 16%
Pakistanis Claim To Have Bought Something Online During The Past 6 Months Awareness
Levels Of The New RTR Guidelines Amongst Consumers Is Quite Low 17% In South
Africa 4
In 10 (44%) Britons Believe That There Are Still Many Important Issues To
Finalise With The EU One
In Twelve Parents Say They Regret Having Children 1
In 5 Spaniards Will Continue To Use The Mask Despite Not Being Mandatory Nearly
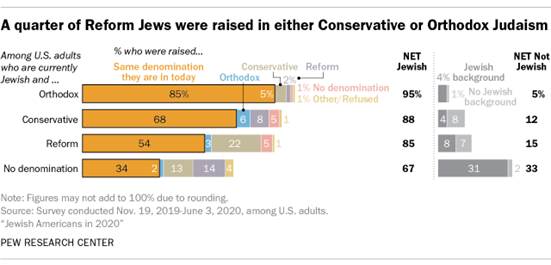
Nine-In-Ten U.S. Adults Who Were Raised Jewish (88%) Are Still Jewish Today About
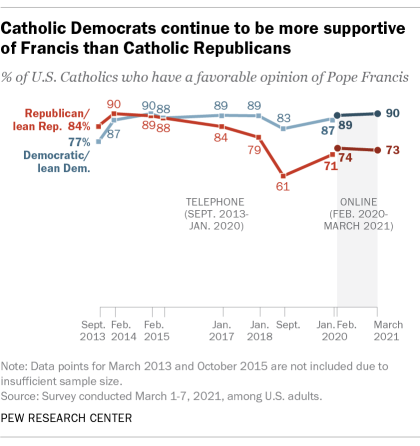
Six-In-Ten U.S Adults (63%) Have A “Very” Or “Mostly” Favorable Opinion Of
Pope Francis Eight
In Ten (82%) Canadians Vaccinated Or Awaiting Vaccine; Remaining 18% Need To
Be Convinced ALP
(50.5%) Leads L-NP (49.5%) On A Two-Party Preferred Basis – No Bounce For Pm
From G7 Trip Three
In Five Urban Indians Would Watch More Of Women’s Sport If It Was More
Accessible On TV YouGov In
Five Of Seven MENA States At Least 40 Percent Have A Favorable View Of France
Overall Global
Country Average Of 74% Say There Is At Least A Fair Amount Of Tension Between
Rich And Poor INTRODUCTORY NOTE
695-696-43-45/Commentary: 69% Americans Are Most Likely To Indicate They Will
Currently Still Wear A Mask On Airplanes Or Trains
We explored
where Americans will continue to wear masks, and whether they assume that
people wearing a mask have not been vaccinated. The questions about
mask-wearing were only asked to Americans because a greater proportion of the
American population is currently fully vaccinated. With second doses of
COVID-19 vaccines being available earlier in certain provinces, we also
explored Canadians’ perspectives on receiving a second dose. This survey is conducted in collaboration with the Association for
Canadian Studies (ACS) and published in the Canadian Press. This series
of surveys is available on Leger’s
website THE FUTURE
OF WEARING A MASK IN THE UNITED STATES
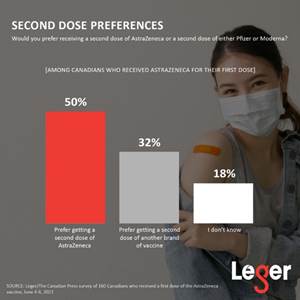
RECEIVING A
SECOND DOSE OF ASTRAZENECA
(Leger) June 15th,
2021 Source: https://leger360.com/surveys/legers-north-american-tracker-june-15-2021/ 695-696-43-46/Country Profile:
SUMMARY
OF POLLS
ASIA (Turkey) Among
White-Collar Employees, The Remote Working Practice, Which Was 13% Before The
Epidemic, Has Now Reached 59% In Turkey According to the data we gathered from
white-collar employees, the remote working practice, which was 13% before the
epidemic, has now reached 59%. In multinational companies or operating
in different fields, we see that remote working has increased from 21% to
94%. Decisions were made on which teams would come to the office, which teams
would work remotely, applications for those with chronic diseases,
performance system adaptations, working hours and how internal communication
activities would be carried out. (Ipsos Turkey) 21 June 2021 (Pakistan) 16% Pakistanis Claim To Have Bought
Something Online During The Past 6 Months According to a survey conducted by Gallup
& Gilani Pakistan, 16% Pakistanis claimed to have shopped online during
the past 6 months. A nationally representative sample of adult men and
women from across the four provinces was asked the following question, “Have you done any online shopping during the past
six months i.e. did you buy any thing/product online?” In
response to this question, 16% said ‘Yes’, 82% said ‘No’ while 2% did not
know/did not respond. (Gallup Pakistan) June 23, 2021 AFRICA (Nigeria) 88 Percent Of Nigerians Believe That Child Labor Is
Prevalent In Nigeria While 12 Percent Mentioned That It Is Not Prevalent To commemorate the Child Labour Day,
NOIPolls conducted a survey to gauge the opinion of Nigerians on child labour
and the result revealed that 88 percent of Nigerians believe that child
labour is prevalent in Nigeria while 12 percent mentioned that it is not
prevalent. This further corroborates the findings of the International Labour
Organisation (ILO) which states that there are 152 million children in the
whole world engaged in child labour while there are 15 million children
undergoing different forms of child labour in Nigeria which is the highest in
West Africa[3]. (NOI Polls) June 16, 2021 (South
Africa) 3 In Ten (27%) Adult South Africans And Four In Ten (37%)
Young People In The Country Are Looking For Work; Youth Day 2021 Figures from Statistics South Africa confirmed that the Youth unemployment
rate in South Africa increased to 63.3% in the first quarter of 2021 from
63.2% in the fourth quarter of 2020. By no means do we want to underplay the
dire need for job creation in our country, as roughly 3 in ten (27%) adult
South Africans and four in ten (37%) young people in the country are looking
for work. The frightening high figure of youth unemployment needs some
unpacking. (Ipsos South Africa) 16 June 2021 Awareness Levels Of The New RTR Guidelines
Amongst Consumers Is Quite Low 17% In South Africa The current awareness levels of the new RTR
guidelines amongst consumers are low - with only 17% of respondents saying
they have heard of it and have a good grasp or thorough knowledge of what the
new guidelines entail. The main advantages for consumers relate to “freedom
of choice” when choosing which warranty and/or maintenance plan to purchase.
This allows them to “shop around” and decide on where to service or repair
their vehicles. Further to this, 50% of consumers feel that RTR will
financially benefit them. (Ipsos South Africa) 17 June 2021 More Than Half 63% Of The Owners Of Small,
Medium And Micro Enterprises (SMME’s) Saying They Experienced Great
Uncertainty Regarding The Sustainability Of Their Businesses The impact of the pandemic and subsequent
lockdown on business performance have been significant, with 63% of SMME’s
stating that they are performing “Not Well” or “Not Very Well” after
lockdown, while larger enterprises are seemingly more resilient, with a third
(35%) stating that they are still performing “Well” or “Very Well” after
lockdown. (Ipsos South Africa) 27 June 2021 (Zimbabwe) 81% Zimbabweans Strongly Agree With The Fact That Even If
The Lockdown Had Negative Impacts But It Was Necessary A new Afrobarometer survey shows that even
though almost half of Zimbabwean households lost a primary source of income
during the COVID-19 pandemic, most citizens approve of the government’s
overall management of the pandemic. Most Zimbabweans endorse lockdowns and
school closures as painful but necessary. (Afrobarometer) 17 Jun 2021 WEST
EUROPE (UK) Only 6% Of Brits Think Increasing House Prices Would Be
Beneficial For The Country, But One-Fifth (20%) Say It Would Be Advantageous
For Their Personal Finances Most recent figures show that the housing
market is growing at its fastest rate in seven years – a jump of 9.5% in the year to May.
Experts suggest that ‘market activity continues to be
boosted by the government’s stamp duty holiday’ and that this boom period may
continue as the ‘unexpected savers’ of the pandemic look to invest their
extra money. Now, new YouGov tracking data shows that 58% of Brits expect
prices of homes to go up in the year ahead while 21% expect them to stay
about the same, and only 6% anticipate a dip. (YouGov UK) June 14, 2021 Three In Ten (31% Of 18-34’s) Football Fans
Say Live TV Is A Thing Of The Past (Compared To 20% Of Over 35s) Comparing football fans aged 18-34 and
over-35s reveals key differences in viewing preferences. While TV
is still the most popular way to watch the game, older fans are more likely
to turn on the telly to watch live football
(87% vs. 82% of 18-34s) and highlights (67% vs. 61% of 18-34s). (YouGov UK) June 17, 2021 Britons Will Miss Practicing Better Hygiene
(66%), Less Traffic On Roads At Peak Times (63%) And Quiet Shops And
Supermarkets (59%) New polling by Ipsos MORI shows that while
many will be ready to see the end of lockdown, there are plenty of aspects of
lockdown that will be missed. Among the things most likely to be looked back
on fondly are people practising better hygiene with two-thirds saying they
will miss this at least a fair amount (66%), less traffic on roads at peak
times (63%) and quiet shops and supermarkets (59%). (Ipsos MORI) 20 June 2021 4 In 10 (44%) Britons Believe That There
Are Still Many Important Issues To Finalise With The EU New polling by Ipsos MORI, in partnership
with UK
in a Changing Europe,
finds that 4 in 10 (44%) Britons believe that there are still many important
issues to finalise with the EU, with Remain voters most likely to feel this
way about negotiations (62%). In contrast, 30% of leave voters say
there are still many important issues to discuss. (Ipsos MORI) 23 June 2021 Around Two In Five (63%) Of The
Unvaccinated Are Convinced By Arguments Which Say There Hasn’t Been Enough
Time To See What The Side-Effects Of The Vaccine Might Be Before the vaccine roll-out began late last
year, the majority of Britons were convinced by the argument that there had
not been enough time to see the side-effects of the vaccine – now just two in
five (41%) think the same, down 20ppt. Similarly, only three in ten
(31%) are convinced by the argument that vaccine doses will be limited, and
others will need them more, 20ppt fewer than last November. (Ipsos MORI) 24 June 2021 One In Twelve Parents Say They Regret
Having Children YouGov data shows that while the vast
majority of parents (83%) insist they’ve never felt this way, a small number
admit to it. One in twelve parents (8%) say they regret having children,
while another 6% have previously had regrets but don’t now. While there’s no
difference between mothers and fathers, younger parents aged 25 to 34 are the
most likely to feel regretful, with one in five either rueing their choice
(13%) or having done so (9%). (YouGov UK) June 24, 2021 Despite General Hesitancy For Loosening
Restrictions, 61% Of The Public Support Lifting The Limit Of 30 Attendees In
Weddings Despite
general hesitancy for loosening restrictions, 61% of the public support
lifting the limit of 30 attendees. Perhaps unsurprisingly, three quarters
(74%) of those who are attending a wedding in the next month support the
measure, compared to 60% of people who will not be affected by the rule
change. Despite the delay to the roadmap, the government has stated that the
furlough scheme will be phased out from 1 July as planned. Through the
pandemic, furloughed workers have had 80% of their wage paid by the
government (YouGov UK) June 24,
2021 (Germany) Around 13,000 People In Germany Develop Blood Cancer Every
Year, For Which A Stem Cell Donation Is Often The Last Chance Of A Cure In addition to the 22 percent who are
already entered in a stem cell donor register or have even donated stem
cells, another 40 percent of those questioned are potential donors. One
in ten (10%) is already determined to register, almost one in three (30%) is
“perhaps ready”. Among the 18- to 34-year-olds, one in four (25%) is
already registered and, at 17 percent, a clearly above-average proportion
decided to register. Another 28 percent may be willing to donate stem
cells. The potential for potential donors is particularly high among
younger adults. (Ipsos Germany) June 24, 2021 (Italy) Nearly Half (48%) Of People Who Regularly Shop Online Would
Use “Buy Now, Pay Later” Service If It Were Available Italians are receptive to this
idea. In fact, nearly half (48%)
of people who regularly shop online would use such a service
if it were available. However, the new services are not yet well known: at
the moment in Italy there are three brands that offer this service, and
knowledge of all of them is still very limited: these are Scalapay (11%),
Klarna (5%) and Afterpay (3%) (YouGov Italy) June 14, 2021 (France) Since 2018, Internet Sales Are Twice As
Popular (Going From 11% To 22%) - Particularly By Women (28%) And Young
People (39% Of 25-34 Year Olds) Donations to associations come first (39%),
followed by internet sales (22%) and donations to people around them (14%). Since
2018, internet sales are twice as
popular (going from 11% to 22%) - particularly by women (28%)
and young people (39% of 25-34 year olds).
Note: 12% of respondents say they leave things they no longer carry in their
closet (-4 points since 2018) and 7% throw them in the trash. (YouGov France) June 14, 2021 (Spain) 1 In 5 Spaniards Will Continue To Use The Mask Despite Not
Being Mandatory Next Saturday one of the Covid-19 sanitary
measures that generated the most controversy from the beginning and that, in
turn, most bothered many will be modified: the mandatory use of masks outdoors . Although the
specific details are not yet known, starting next Saturday, June 26,
Spaniards will be able to walk through the streets, beaches and mountains
without having to use a complement that was already part of everyone's
routine. (Ipsos Spain) June 22, 2021 NORTH AMERICA (USA) 69% Americans Are Most Likely To Indicate They Will
Currently Still Wear A Mask On Airplanes Or Trains Americans are most likely to indicate they
will currently still wear a mask on
airplanes or trains (69%), at large stores (grocery, general goods, etc.)
(65%) and/or in small stores (convenience stores, etc.) (62%). More than
three-in-ten Americans who still wear a mask on airplanes/trains, at large
stores, at small stores, at sporting events or concerts, and/or at
bars/restaurants think they will not
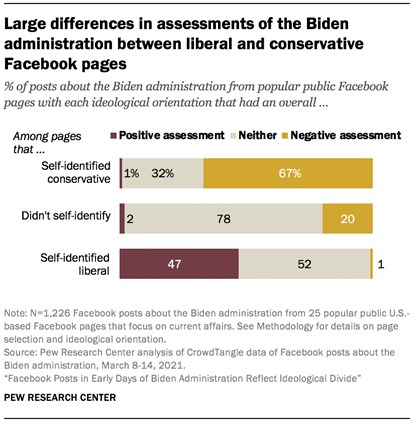
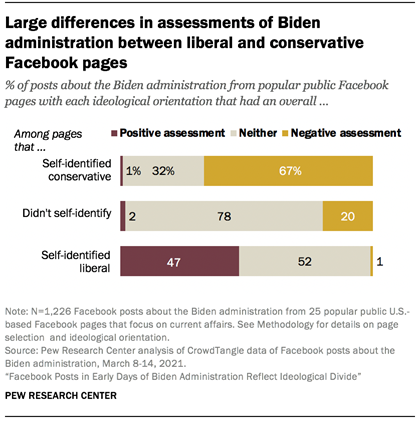
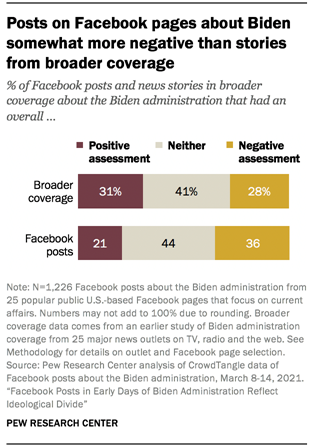
stop wearing a mask at/in each of these until 2022. (Leger) June 15th, 2021 About One-Third (32%) Of The Posts On
Conservative Facebook Pages And Roughly Half (52%) On Liberal Pages Were
Neither Positive Nor Negative Among popular Facebook pages that describe
themselves as conservative (12 of the 25 pages studied), 1% of posts
carried positive assessments of the Biden administration, while
67% were negative. For those pages that self-identified as liberal (11 of the
25), only 1% of the posts carried negative assessments while 47% had a
positive one. About one-third (32%) of the posts on conservative Facebook
pages and roughly half (52%) on liberal pages were neither positive nor
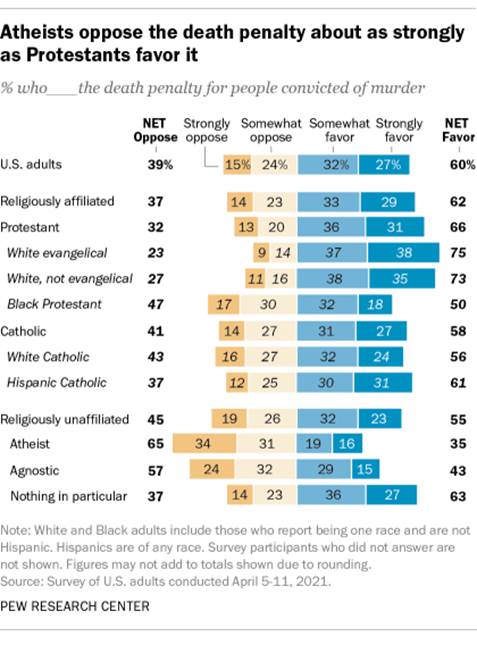
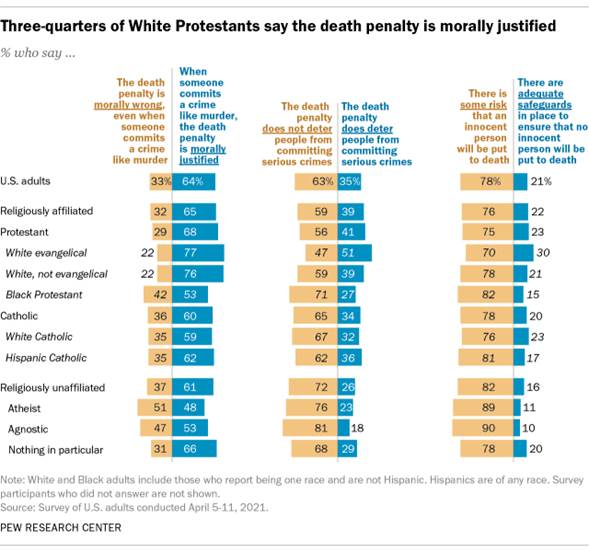
negative.2 (PEW) JUNE 14, 2021 Roughly Two-Thirds Of Atheists (65%) And
Six-In-Ten Agnostics (57%) Either “Strongly” Or “Somewhat” Oppose The Death
Penalty For People Convicted Of Murder Roughly two-thirds of atheists (65%) and
six-in-ten agnostics (57%) either “strongly” or “somewhat” oppose the death
penalty for people convicted of murder. Atheists and agnostics are small
religious groups, representing less than 10% of the adult population, but their share has grown in recent
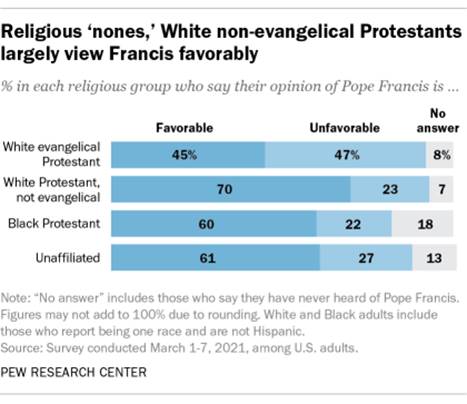
years. Meanwhile, 60% of U.S. adults overall favor the death penalty, including 75% of White
evangelical Protestants and 73% of White non-evangelical Protestants,
according to the survey, which was conducted in early April. White
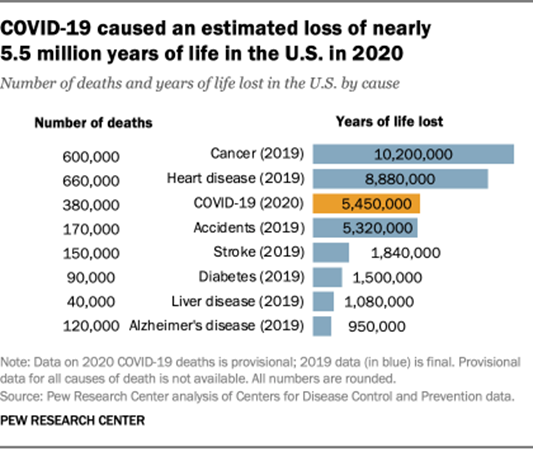
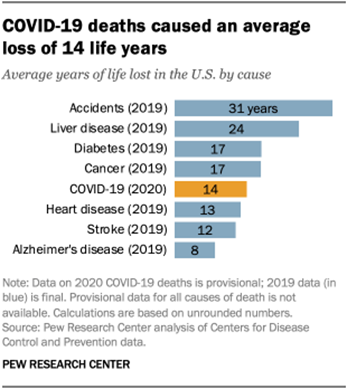
Protestants account for about 29% of the U.S. population, a share that has shrunk in recent years. (PEW) JUNE 15, 2021 Americans Lost More Years (5.5 Million) Of
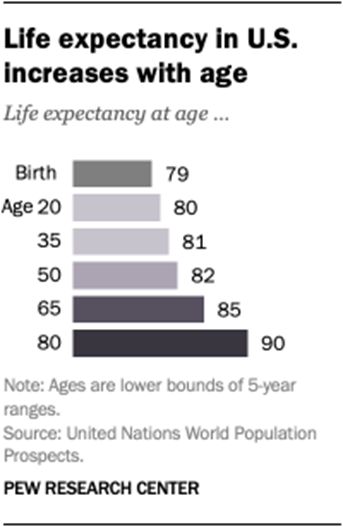
Life To Covid-19 In 2020 Than To All Accidents Combined In A Typical Year Average life spans change with age as
common causes of death shift over time. By the time a U.S. adult lives to 65,
they are unlikely to die from some common causes of death among younger
people, such as homicide, pregnancy complications or congenital diseases. At
the same time, older Americans are more likely than their younger
counterparts to die from causes including heart disease, Alzheimer’s – and
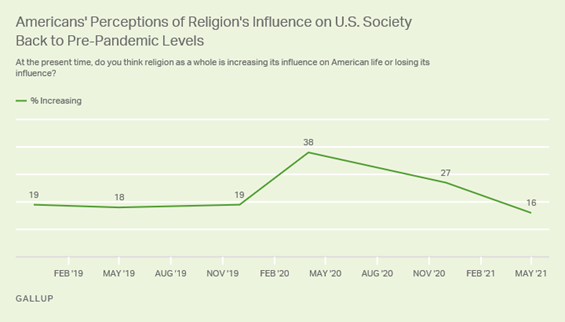
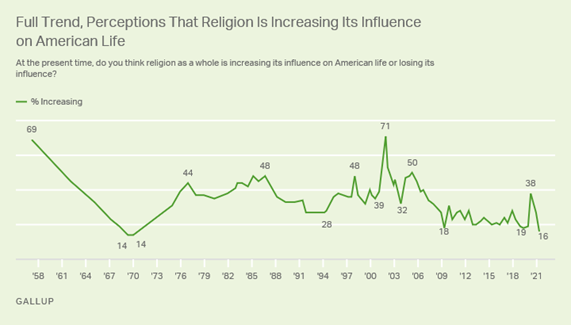
now COVID-19. (PEW) JUNE 16, 2021 The Percentage Of Americans Who Believe
That Religion Is Increasing Its Influence On American Life Has Retreated To
16%, In Line With Pre-Pandemic Levels After doubling last spring and staying
elevated in December, the percentage of Americans who believe that religion
is increasing its influence on American life has retreated to 16%, in line
with pre-pandemic levels. Line graph. Sixteen percent of U.S. adults say
religion is increasing its influence on American life, down from 38% in May
2020 and 27% in December 2020. In late 2018 and late 2019, a consistent 19%
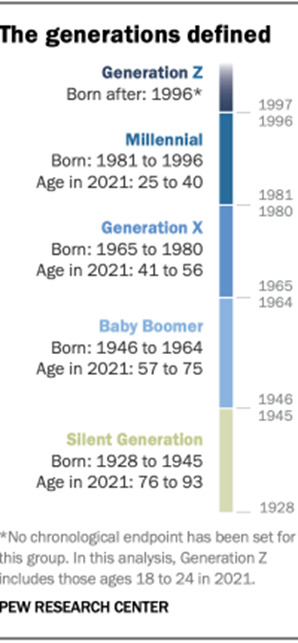
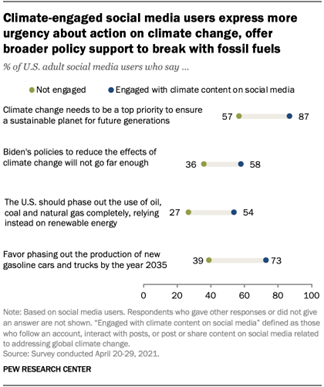
said religion was increasing its influence. (Gallup USA) JUNE 21, 2021 45% Of Gen Z Adults And 40% Of Millennials
Have Interacted With Content On Social Platforms That Focuses On The Need For
Action On Climate Change Among U.S. social media users, 45% of Gen Z
adults and 40% of Millennials have interacted with content on social
platforms that focuses on the need for action on climate change by following
an account, liking or commenting on a post, or posting or sharing content
about the need for action on climate change. By contrast, much smaller shares
of Gen X (27%) and Baby Boomer and older social media users (21%) have
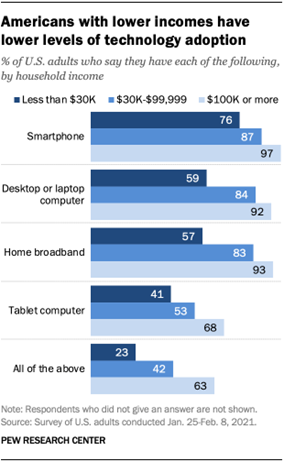
engaged with content about climate change in any of these ways. (PEW) JUNE 21, 2021 About Four-In-Ten Adults With Lower Incomes
Do Not Have Home Broadband Services (43%) Or A Desktop Or Laptop Computer
(41%) Roughly a quarter of adults with household
incomes below $30,000 a year (24%) say they don’t own a smartphone. About
four-in-ten adults with lower incomes do not have home broadband services
(43%) or a desktop or laptop computer (41%). And a majority of Americans with
lower incomes are not tablet owners. By comparison, each of these
technologies is nearly ubiquitous among adults in households earning $100,000
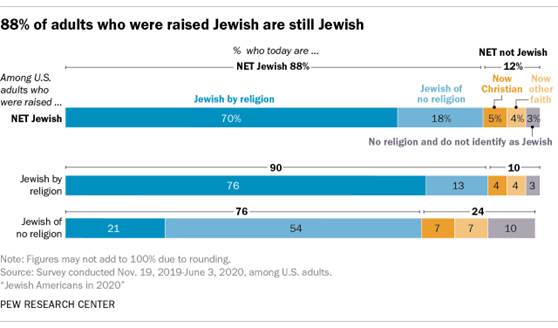
or more a year. (PEW) JUNE 22, 2021 Nearly Nine-In-Ten U.S. Adults Who Were
Raised Jewish (88%) Are Still Jewish Today Overall, nearly nine-in-ten U.S. adults who
were raised Jewish (88%) are still Jewish today. This includes 70% who
identify with the Jewish religion and 18% who don’t identify with any
religion but who consider themselves Jewish in some other way, such as
culturally, ethnically or by family background. (PEW) JUNE 22, 2021 About Six-In-Ten U.S Adults (63%) Have A
“Very” Or “Mostly” Favorable Opinion Of Pope Francis About six-in-ten U.S adults (63%) have a
“very” or “mostly” favorable opinion of Pope Francis, according to a Pew
Research Center survey conducted in March using the Center’s online American Trends Panel. This is nearly identical to the share of
adults who had a favorable view of Francis in February 2020 (64%). The pope’s
favorability also has remained steady among U.S. Catholics, with 82% of
Catholics in both the March 2021 and February 2020 surveys saying they have a
favorable opinion of the pope. (PEW) JUNE 25, 2021 (Canada) The Housing Crisis In Canada: Three-Quarters (75%) Of
Canadians Who Don’t Own A Home But Want To Buy One, Say They Can’t Afford To A new Ipsos poll conducted on behalf of
Manulife Bank reveals that there might be an affordability crisis in Canada,
with many struggling to keep up with the cost of living or admitting that
home ownership has become a pipe dream for them. The situation has developed
into a tragedy for many prospective homeowners, as three-quarters (75%) of
those who do not own a home but want to buy one feel like they can’t afford
to do so. What’s more, most (71%) of those who do not own a home worry about
saving up for one, including four in ten (39%) who worry a lot about this. (Ipsos Canada) 17 June 2021 Eight In Ten (82%) Canadians Vaccinated Or Awaiting
Vaccine; Remaining 18% Need To Be Convinced The poll found that nearly three-quarters
(73%) of Canadian adults say they have received at least one dose of a
vaccine and another 10% say that they would like to be vaccinated. With the
most recent data from the Government of Canada indicating that 70% of those
aged 12 years and older have received at least one dose,[1] these findings are in line with
overall population trends. (Ipsos Canada) 18 June 2021 Half (51%) Of Canadians Anxious About Returning To Normal
Life Following The Pandemic, Though Cautious Optimism Evident A recent Ipsos poll on conducted on behalf
of Global News finds that half (51%) of Canadians feel nervous about resuming
normal activities post-pandemic, and a third (35%) feel their province is
re-opening too quickly, suggesting that there may be a ways to go before we
truly feel “normal” again, and mixed feelings when it comes to changes many
may have been looking forward to for over a year. (Ipsos Canada) 19 June 2021 One Quarter Of Canadians (26%) Are Not Confident That Their
Family Would Be Able To Pay For Mortgage/Rent/Housing Costs, If They Were To
Pass Away Over the course of the pandemic, Canadians
admit they are having more frequent conversations about important topics.
According to a recent survey study done by Ipsos, over half of Canadian
parents (56%) are having more frequent conversations about their children’s
future. Additional conversations include concerns about finances/financial
goals/debt (38%), and family’s financial security if they were to pass away
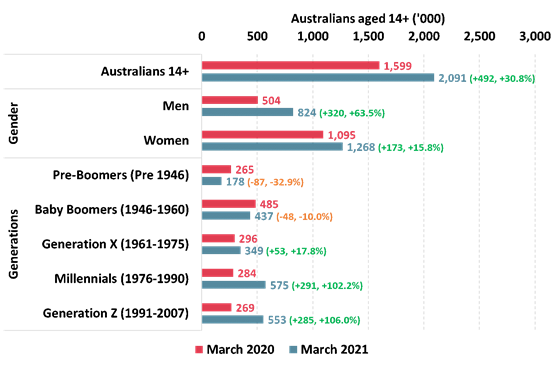
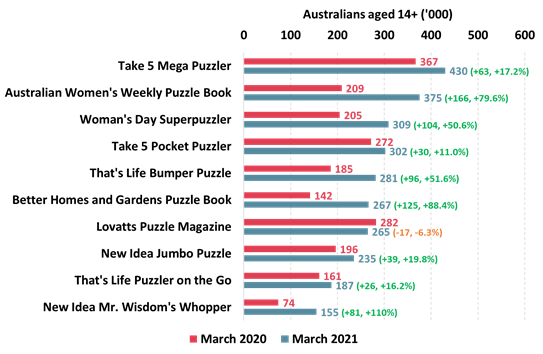
(28%). (Ipsos Canada) 22 June 2021 AUSTRALIA Over 2 Million Australians Are Now Reading Puzzle Magazines
– Up An Exceptional 492,000 (+30.8%) From A Year Ago Women are the most avid readers of puzzle
magazines – now read by 1,268,000 women, up 173,000 (+15.8%) from a year ago.
However, readership of puzzle magazines by men has increased far faster and
is up by 320,000 (+63.5%) to 824,000. There has also been growth among Gen X
with 349,000 now reading Puzzle Magazines, up 53,000 (+17.8%) from a year
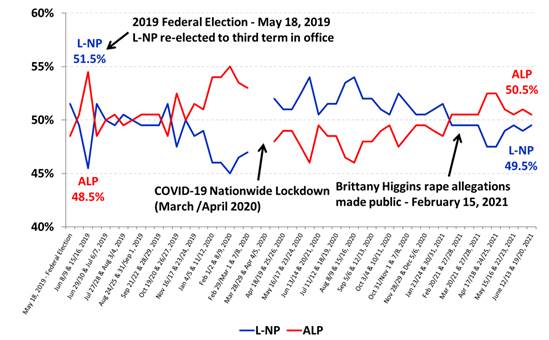
ago, but older generations have not seen growth over the last year. (Roy Morgan) June 21 2021 ALP (50.5%) Leads L-NP (49.5%) On A
Two-Party Preferred Basis – No Bounce For Pm From G7 Trip If a Federal Election were held now it
would be too close to call with a higher than usual 7.5% of electors
undecided about who they would vote for and with the real possibility
Australia would have a hung Parliament for the first time in nearly a decade.
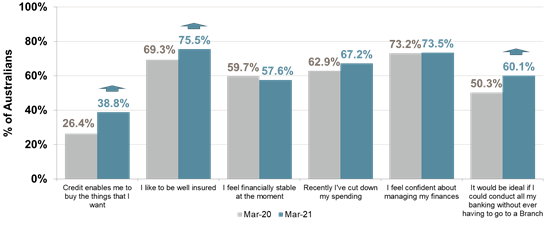
Normally around 3-4% of electors can’t say who they would vote for. (Roy Morgan) June 23 2021 In The 12 Months To March 2021 A
Fast-Rising 38.8% Of Australians Agree That ‘Credit Enables Me To Buy
The Things I Want’ – An Increase Of 12.4% Points From A Year Ago
Pre-Covid-19 In the 12 months to March 2021 a
fast-rising 38.8% of Australians agree that ‘Credit enables me to buy the things I want’ – an
increase of 12.4% points from a year ago pre-COVID-19. This is the largest
increase for any of the financial attitudes covered here and suggests the
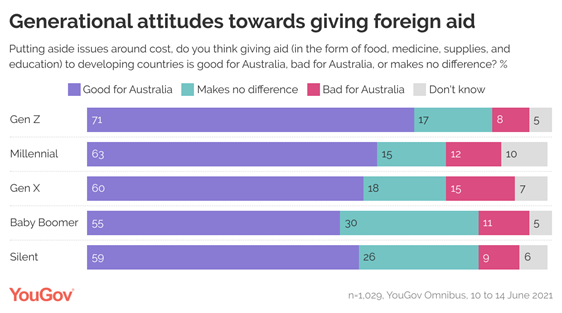
long-term decline in usage of credit is being reversed as alternative payment systems such as Zip and Afterpay enter the market. (Roy Morgan) June 25 2021 60% Of Australians Believe That Giving Aid
To Developing Nations Is Good For Australia, Compared With 21% Who Believe
That It Makes No Difference Data collected by YouGov, the international
data and polling company, shows that Australians are inclined to think that
sending aid to developing nations is good for their country. 60% of
Australians believe that giving aid to developing nations is ‘good for
Australia’, compared with 21% who believe that it ‘makes no difference’, and
just 12% that hold the opposite opinion that such aid is ‘bad for Australia’.
In turn, only half the British feel this way, and a quarter thinks it makes
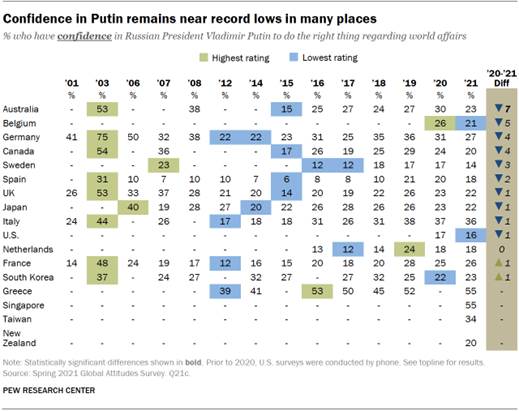
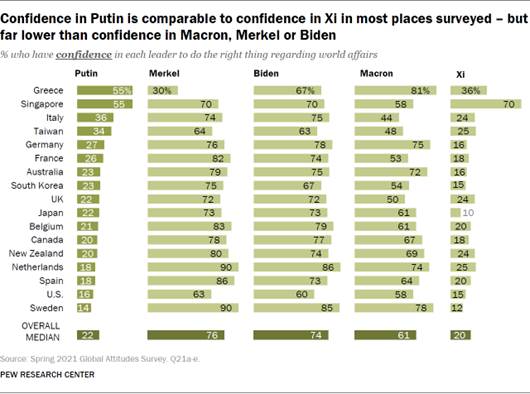
no difference. (YouGov Australia) June 23, 2021 MULTICOUNTRY STUDIES Among 17 Advanced Economies A Median Of 22% Say They Have
Confidence In Putin To Do The Right Thing In World Affairs, Compared With A
Median Of 74% Who Say They Have No Such Confidence Pew Research Center survey conducted this
spring in 17 advanced economies shows that negative views of him are at or
near historic highs in most places. Today, a median of 22% say they have
confidence in Putin to do the right thing in world affairs, compared with a
median of 74% who say they have no such confidence. Singapore (55%), Greece
(55%), Italy (36%) and Taiwan (34%) stand out as the only places surveyed
where roughly a third or more say they have confidence in the Russian
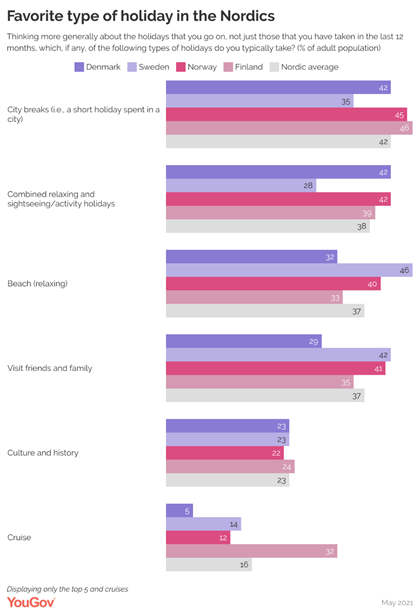
president. Confidence is lowest in Sweden (14%) and the United States (16%). (PEW) JUNE 14, 2021 People In The Nordics Are Mostly Into City
Breaks i.e. Short Holidays Spent In A City, With An Average Of 42 % People
Choosing This Type Of Holiday (Ranging From 35 % Of Swedes To 46 % Of Finns) Overall, people in the Nordics are mostly
into city breaks i.e. short holidays spent in a city, with an average of 42 %
people choosing this type of holiday (ranging from 35 % of Swedes to 46 % of
Finns). Next up are holidays that combine relaxing and sightseeing/activity,
with an average of 38 % – however, this applies to only 28 % of the Swedish
population. Holidays that involve culture and history are furthermore popular
across the Nordic countries (23 %). (YouGov Denmark) Source: https://yougov.dk/news/2021/06/15/most-popular-holiday-types-nordics/ 3 In 4 Britons Believe In The Right To Seek
Refuge, But 2 In 5 Want To Shut Borders Completely At This Time A global survey by Ipsos shows almost
three-quarters of Britons (73%) agree with the principle that people should
be able to take refuge in other countries, including Britain, to escape from
war or persecution. Only 17% of Britons disagree with this, which is lower
than the average across the 28 countries (23%). However, although the
proportion of people disagreeing with the right to seek refuge has remained
largely the same since 2020 (15%), the proportion of Britons agreeing has
decreased by 5 percentage points (78%). (Ipsos MORI) 16 June 2021 Canadians Agree (72%) People Should Be Able
To Seek Refuge From War And Persecution, But Few (10%) Like The Idea Of
Letting In More Refugees Post-Pandemic The attitudes of Canadians mirror those of
the broader international community: the global average shows that 47% agree
that refugees will integrate successfully into their new societies, while 44%
disagree. The attitudes of Canadians fall near the centre: they are not as
optimistic about refugee integration as respondents in Saudi Arabia (76%),
India (68%), or Argentina (60%), but neither are they as pessimistic as
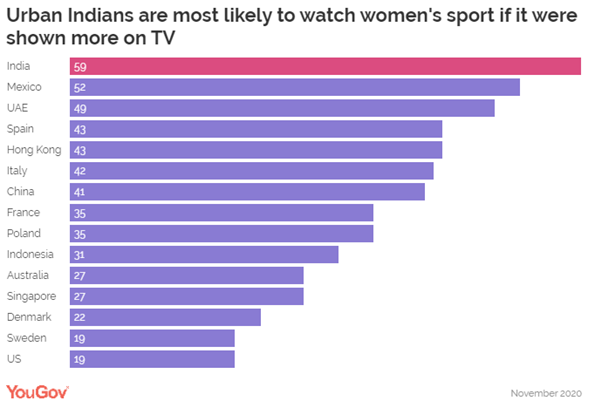
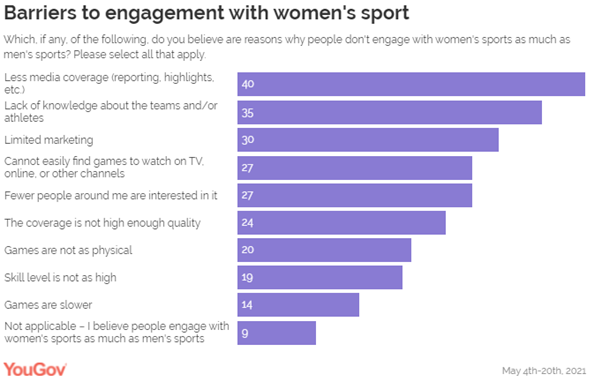
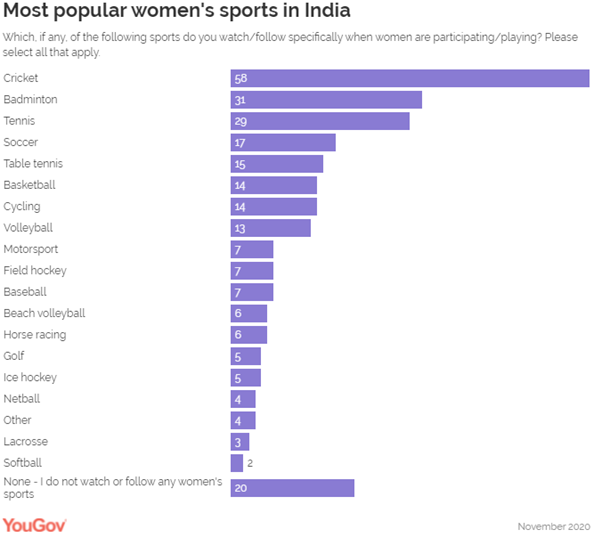
residents of South Korea (29%), France (25%), or Japan (23%). (Ipsos Canada) 22 June 2021 Three In Five Urban Indians Would Watch
More Of Women’s Sport If It Was More Accessible On TV YouGov Globally, a third of
people (33%) say they would watch more women’s sport if it was more
accessible on TV. Agreement with this statement is the highest in India,
followed by Mexico and UAE. The most popular reason people give around the
world for not following women’s sports is the lack of media coverage (40%).
Other supply-side factors acting as barriers to engagement include lack of
knowledge about women’s teams or athletes (35%), lack of marketing (30%) and
limited accessibility of women’s sport on TV (27%). The speed, quality and
physicality of women’s sport is much less likely to be a reason for not
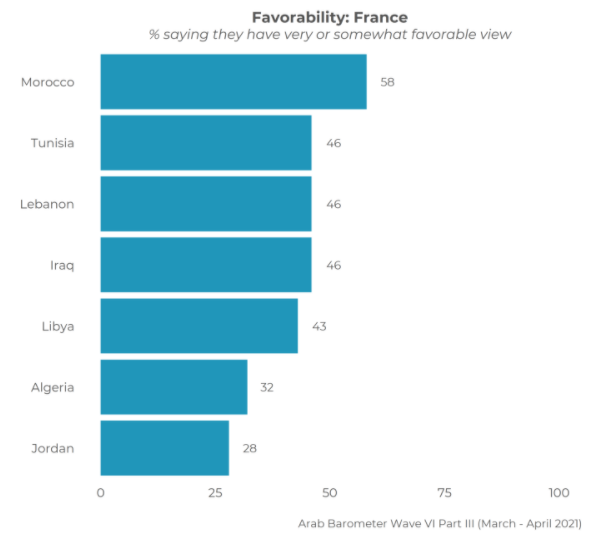
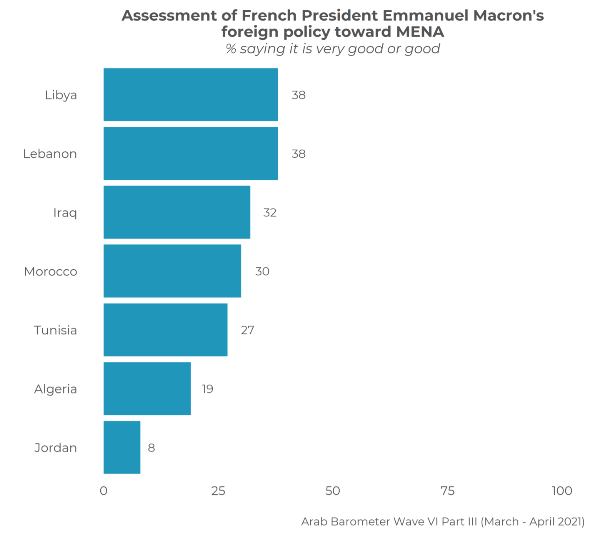
engaging. (YouGov India) Source: https://in.yougov.com/en-hi/news/2021/06/24/three-five-urban-indians-would-watch-more-womens-s/ In Five Of Seven MENA States At Least 40
Percent Have A Favorable View Of France Overall In 2020, he personally interceded to try to
find a solution to the crisis in Lebanon and has worked to deepen engagement
with other countries in the region. Nevertheless, his personal
engagement appears to have yielded limited results. Although views of France
are moderately positive across the countries surveyed in Arab Barometer’s sixth wave – in five of seven at least 40
percent have a favorable view of France overall – views of Macron himself lag
significantly. In no country surveyed do 40 percent of citizens have a
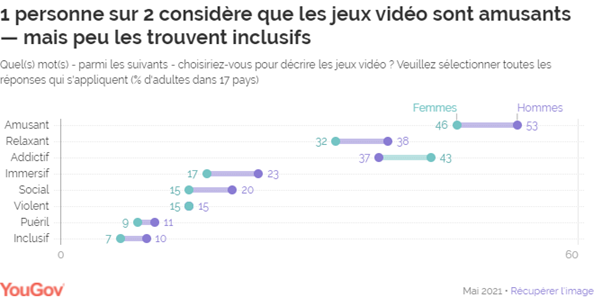
positive view of his policies. (Arabbarometer) June 24, 2021 Source: https://www.arabbarometer.org/2021/06/mena-pulse-on-france-macron/ In 17 Countries Only 8% Of Respondents
(Gamers And Non-Gamers) Would Describe Video Games As Inclusive A global study conducted in 17 countries
shows that only 8% of respondents (gamers and non-gamers) would describe
video games as “inclusive”. We observe that the French (22%) and the Danes (14%) are
the most likely to share this opinion. At the same time, nearly half (49%) of
global consumers rate video games as fun -
a figure that is on the rise by men (53%). While 35% find video games to
be relaxing , 40%
think they are addictive (43%
of women vs. 37% of men). (YouGov France) June 24, 2021 Source: https://fr.yougov.com/news/2021/06/24/comment-les-jeux-video-sont-ils-percus-en-2021/ In Many Markets Such As Spain, Mexico And
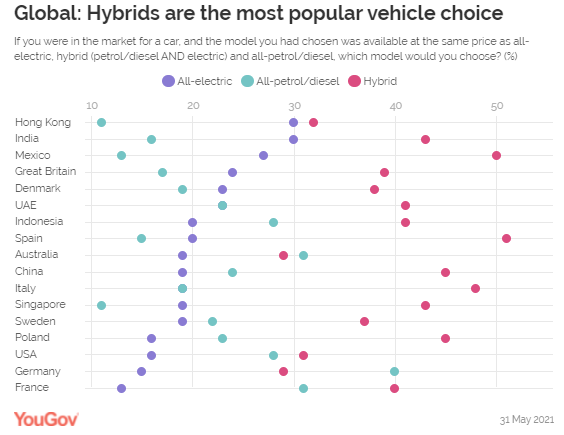
China, The Ratio Of People Who Prefer Hybrids To Electrics Is Around 2:1 Hong Kong is the only market where electric
cars come close to matching hybrids in terms of overall preference: three in
ten (30%) say they would opt for an electric car, all things being equal,
while nearly a third (32%) say they would go for a hybrid. In many markets such
as Spain (51% vs. 20%), Mexico (50% vs. 27%) and China (45% vs. 19%), the
ratio of people who prefer hybrids to electrics is around 2:1. (YouGov UK) June 24,
2021 Global Country Average Of 74% Say There Is
At Least A Fair Amount Of Tension Between Rich And Poor The poll,
which was conducted online between 23 December 2020 and 8 January 2021, shows
people in South Africa (58%), India (57%) and the US (57%) are most likely to
feel that their country is divided by “culture wars”, with a significant gap
in opinion between them and people in Brazil (47%), who are next most likely
to think their nation is divided in this way. Those in Germany (19%),
Russia (18%) and Japan (9%) are least likely to feel divided. In most
countries, relatively few actively disagree with the statement (Global
Country Average of 14%). (YouGov
Egypt) 25 June 2021 Source: https://www.ipsos.com/en-eg/culture-war-around-the-world ASIA
695-696-43-01/Poll Among White-Collar Employees, The Remote Working
Practice, Which Was 13% Before The Epidemic, Has Now Reached 59% In Turkey
The Biggest Change During the Pandemic
Period: The Increase in the Transition to «Remote Working» Application According to the data we gathered from
white-collar employees, the remote working practice, which was 13% before the
epidemic, has now reached 59%. In multinational companies or operating
in different fields, we see that remote working has increased from 21% to
94%.
Decisions were made on which teams would
come to the office, which teams would work remotely, applications for those
with chronic diseases, performance system adaptations, working hours and how
internal communication activities would be carried out.
Management staff in companies mostly
discussed and made decisions on issues related to «working hours and forms»; however,
awareness of these issues is low among white-collar employees.
Two out of every three white-collar workers
“have to go about their job on weekends and evenings”, “feel that their
private life is being taken over by technology” and “have to spend less time
with their family”.
Physical environments will be preferred to
provide team spirit and socialize White-collar employees welcome socialization
activities that can be done in the physical environment, such as
"planning department communication dinners every quarter, participating
in in-company trainings as a team, and getting teams together outdoors at
least once a year".
Here's Iraq in the Future Here, basic problems such as “work
mechanisation” and “no sense of belonging” are feared in the
future. Although different solutions are discussed, there is no
established practice. Therefore, the most fundamental problem that
awaits companies in the future will be to develop and sustain practices for
the sense of belonging. Ece Ertürk, Country Leader of Ipsos UU
& Public Affairs, commented on the subject: The effects of the pandemic on business
life as well as its effects on our social life continue to change and
transform according to new developments and expectations. As of the
pandemic, one of the biggest changes we have seen in business life has been
the transition to remote working with
a rate of 59% . This was followed by hybrid study models with a rate
of 49% . With the effect of these changes, working hours and styles , performance management and
productivity were the two topics that the management staff talked and
discussed the most. It is obvious that clarifying the decisions
and practices that are relatively clear for the management staff in this
period and minimizing uncertainties for the employees will have a positive
impact on the employee satisfaction and belonging issues that have been
damaged in the pandemic and are being tried to be redefined. In this
world, where the mechanized business cycle, decreasing corporate unity &
socialization during the pandemic period have reduced the commitment of
employees to their companies, companies and managers should not
allow what is out of sight to remain out of heart . (Ipsos Turkey) 21 June 2021 Source: https://www.ipsos.com/tr-tr/pandemi-uzaktan-calisma-uygulamasina-gecisi-artirdi 695-696-43-02/Poll 16%
Pakistanis Claim To Have Bought Something Online During The Past 6 Months
According to a survey conducted by Gallup
& Gilani Pakistan, 16% Pakistanis claimed to have shopped online during
the past 6 months. A nationally representative sample of adult
men and women from across the four provinces was asked the following
question, “Have you done any online
shopping during the past six months i.e. did you buy any thing/product
online?” In response to this question, 16% said ‘Yes’, 82%
said ‘No’ while 2% did not know/did not respond. (Gallup Pakistan) June 23, 2021 Source: https://gallup.com.pk/post/31906 AFRICA
695-696-43-03/Poll 88 Percent
Of Nigerians Believe That Child Labor Is Prevalent In Nigeria While 12
Percent Mentioned That It Is Not Prevalent
June 12th every year is a
day set aside by the United Nations and International Labour Organisation as
the Child Labour Day which is a day set aside to identify with children who
are caught in the web of the excruciating ventures of all forms of child
labour around the globe. The day also seek to showcase the progress made so
far in the fight against the menace of child labour and buttress the need to
bring it to a grinding halt. It is an opportunity to call on all stakeholders
on the fight against child labour to intensify effort towards eradicating the
menace that has robbed a lot of children of a glorious and productive future.
Additionally, the Child Labour Day seek to encourage actions towards
achieving the SDG 8.7 of the United Nations Millennium Development Goals.[1] The SDG 8.7 states thus “take
immediate and effective measures to eradicate forced labour, end modern
slavery and human trafficking and secure the prohibition and elimination of
the worst forms of child labour, including recruitment and use of child
soldiers, and by 2025 end child labour in all its forms”[2]. To commemorate the Child Labour Day,
NOIPolls conducted a survey to gauge the opinion of Nigerians on child labour
and the result revealed that 88 percent of Nigerians believe that child
labour is prevalent in Nigeria while 12 percent mentioned that it is not prevalent.
This further corroborates the findings of the International Labour
Organisation (ILO) which states that there are 152 million children in the
whole world engaged in child labour while there are 15 million children
undergoing different forms of child labour in Nigeria which is the highest in
West Africa[3]. The poll results which further revealed
that 85 percent of respondents stated that they see children engaged in child
labour within the North-East, South-East and South-South all tied at 92
percent, having the highest proportion of respondents who stated that they
see children engaged in child labour in their locality. The Child Rights Act
which was passed into law in 2003 stated that a child is one who is below the
age of eighteen years, and it provides that the interest of such shall be
paramount in all consideration. It is disappointing to note that eighteen
years after incorporating the Child Rights Act, millions of children have
continued to be involved in child labour in the country. This can be
buttressed with findings from the poll which revealed that children are often
seen engaged in different forms of labour which include; Street hawking (55
percent), Domestic work (14 percent), Street begging (9 percent) and
Construction site (7 percent). More findings revealed that poverty (55
percent) is the main cause of child labour in Nigeria. This is followed by
bad economy and Parental neglect (12 percent each), to supplement for the
family income (6 percent), unemployment (5 percent), population increase and
illiteracy (4 percent) amongst others. Subsequently, respondents were asked what should
be done to end child labour in the country and the poll result revealed that
26 percent of the respondents are of the opinion that creating jobs is the
solution to the problem of child labour. Other recommendations include;
encourage free education (23 percent), improve economy (18 percent), poverty
alleviation (15 percent) and child welfare (8 percent) amongst other
solutions proffered. Lastly, 70 percent of the respondent disclosed that the
incidence of child labour in the country has increase when compared to the
pre COVID-19 era. These are some of the key findings from the child labour
survey conducted in the week of 24th May 2021. Survey Findings The first question sought to know how
prevalent the issue of child labour is in the country and the survey
revealed that 88 percent of respondents stated that child labour is
prevalent in Nigeria, while 12 percent stated that child labour is not
prevalent in the country. Analysis across geo-political zones shows that
the South-South region (94 percent) has the highest proportion of
respondents who stated that child labour is prevalent, and this is followed
by respondents form the North-Central (90 percent). With regards to age
category, those aged 36-60 (90 percent) have the highest proportion of respondents
who stated that child labour is prevalent in Nigeria.
Trend analysis shows a 10 percent drop from
2013 to 2019 and 4 percent increase from 2019 to 2021 in terms of prevalence
of child labour in Nigeria.
Respondents were asked if they see children
in their locality engaged in child labour and the result revealed that
85 percent of the respondents acknowledged that they see children engaged in
child labour in their locality with the North-East, South-East and
South-South all having 92 percent of respondents who mentioned this. Also,
those aged 18-35 (88 percent) have the highest proportion of respondents who
stated that they see child children engaged in child labour.
Trend analysis shows a 5-point increase in
the incidence of child labour from 2019 to 2021 of the respondents who stated
that they see children engaged in child labour in the country.
Respondents who stated that they see
children engaged in child labour in their locality were asked the types of
labour they see children engaged in and the poll result revealed that street
hawking (55 percent) have the highest proportion of respondents who
stated that they see children participating in child labour with the
South-East (69 percent) having the highest proportion of respondents and then
followed by South-South and South-west all tied at 68 percent. Others
include domestic work (14 percent), street begging (9
percent), construction site (7 percent), scavenging (6 percent) and
farming (6 percent) amongst others.
Trend analysis shows that street hawking
increased by 2 percent from 2013 to 2016 and had an 11 percent increase in
2019 though decrease by 3 percent in 2021.
The poll findings also revealed that
55 percent of respondents stated that poverty is the cause of child labour
while 12 percent ascribed it to bad economy. Others include parental neglect
(12 percent), to supplement family income (6 percent), unemployment (5
percent), population increase and illiteracy (4 percent) amongst others.
Trend analysis show that poverty as a
reason for child labour experienced a 24-point decrease from 2013 to 2016 and
then 10-points increase from 2016 to 2019 and then 3-point increase from 2019
to 2021.
Furthermore, respondents were asked if
they have family members below age 18 who engage in labour/work and the poll
revealed that 35 percent disclosed that they have family members who engage
in farming, 29 percent mention family business, 22 percent stated auto
mechanic, 18 percent mention street hawking, 16 percent said domestic help and
10 percent mentioned bus conductor amongst other activities.
Respondents were asked about the solution
to child labour and the poll result revealed that 26 percent of the
respondents stated that more jobs should be created while 23 percent stated
that free education should be encouraged. Others include improve economy
(18 percent), poverty alleviation (15 percent), child welfare (8 percent),
awareness on effect of child labour (7 percent) amongst others.
Trend analysis reveals a 1 percent decrease
in job creation when current result is compared the result obtained in 2021.
With regards to reporting incidence of
child labour, the poll revealed that majority of the respondents (78 percent)
claimed that they do not know where to report incidence of child labour in
Nigeria. However, 22 percent disclosed that they are aware of reporting
channels with the North-East (30 percent) having the highest proportion of
respondents in this category.
Respondents were asked to compare child
labour incidence before COVID-19 era and now and findings revealed
that 70 percent of respondents stated that it has increased when
compared to pre COVID-19 era. On the other hand, 15 percent stated that it
has remained the same while another 15 percent stated that it has decreased. Analysis
across geo-political zones shows that North-Central region (80 percent) have
the highest proportion of respondents who stated that child labour has
increased compared to pre COVID-19 era and this is followed by South-South
(78 percent).
Conclusion In conclusion, it is disheartening to note
that there is still prevalence of child labour in the country as indicated by
88 percent of respondents in the survey. This is calling on all stakeholders
to expedite action in the elimination of child labour in the country so that
the children involved can be accorded at least basic education to lead
productive lives thereby making the society a better place for all. According
to 55 percent of the respondents, the survey also revealed that the activity
most children engage in is street hawking. Others include domestic work (14
percent), street-begging (9 percent), construction site (7 percent) amongst
others, these are ventures that expose children to all forms of child labour
and dangers that could threaten their lives and hence should be discouraged
by all and sundry. The implementation of the child right act will go a long
way in curbing this act of child labour, but unfortunately it has not been
implemented by the various states concerned, therefore exacerbating the
incidences of child labour. The survey also revealed the causes of
child labour which include poverty (55 percent), bad economy and parental
neglect (12 percent), to supplement family income (6 percent) among other
causes. Nigerians proffered solution to the menace of child labour which
include creating jobs (26 percent), encourage free education (23 percent),
improve economy (18 percent) and poverty alleviation (15 percent) among other
solutions. This is calling on all to implement the recommendation proffered
by Nigerians which will ultimately eradicate the child labour conundrum and
ultimately make our society a better place for our children who are the
fulcrum and the necessary ingredient for a better society. (NOI Polls) June 16, 2021 695-696-43-04/Poll 3 In Ten
(27%) Adult South Africans And Four In Ten (37%) Young People In The Country
Are Looking For Work; Youth Day 2021
Figures from Statistics South Africa confirmed that the Youth unemployment
rate in South Africa increased to 63.3% in the first quarter of 2021 from
63.2% in the fourth quarter of 2020. In the midst of the Covid-19 pandemic,
Ipsos undertook a project called Mzansi Roars, that focused on the lives and
livelihoods of South Africans, their incomes and spending patterns, what they
eat and what they value, nutrition and health, their satisfaction with life,
the financial situation of households, traditions and culture, their
life-worlds, dreams and aspirations. For Youth Day 2021 we will take a look
at how some of these aspects, probed in the Mzansi Roars project, continue to
influence the lives of young people. Unemployment, variable earnings and very
little money to go around By no means do we want to underplay the
dire need for job creation in our country, as roughly 3 in ten (27%) adult
South Africans and four in ten (37%) young people in the country are looking for
work. The frightening high figure of youth unemployment needs some unpacking. A large proportion of young South Africans
are studying to improve their chances of finding a job in the future, as is
evident from the 89% of 15-17 year olds, and 37% of 18-24 year olds who are
students. However, entrepreneurial spirit is alive and well among the young
people of South Africa, with a smaller number of youths creating a source of
income for themselves.
The contributions made to the income of the
younger age groups by means of Government Grants should not be
underestimated, with more than a third (35%) of 15-17 year olds receiving a
Government Grant. This support does get progressively less with age, with 29%
of 18-24 year olds and 27% of 25-34 year olds receiving Government Grants. The receipt of a regular income from a
Government Grant does however not guarantee a steady income. It is remarkable
that 44% of adult South Africans indicated that the amount of money they
receive on a monthly basis (from all sources) keeps on changing. This is an even bigger issue for younger
people, that complicates their planning for expenses and making accurate
budgeting near impossible.
With almost six in ten (59%) 15-17 year
olds and almost half (48%) of 18-24 year olds saying that they “never” have
any money left at the end of a month after personal and household expenses
are paid, it is another sign that numerous and varied demands are made on
their monthly income. In these circumstances where every rand is
turned over quite a few times before spending, it should not be surprising
that South Africans of all ages do not have money set aside for emergencies.
From the figure below it is clear that younger adults are definitely less
prepared for unforeseen situations than older people – although a dearth of
planning and provision for emergencies seem to be quite common.
Are young people more deprived? A good question is whether this might be an
indication that younger adults are more deprived than older South Africans. A
variety of circumstances can be investigated to prove or disprove this
notion. Access to clean water is regarded as a basic human right: Is it more
difficult or laborious for younger people to access water than for older
people? Although these figures are probably saying
a great deal more about the inefficiency and lack of delivery of basic
services from local governments in all areas of the country, it is clear that
a smaller proportion of young people than older people have access to running
water inside their houses – and thus they have to make more of an effort to
access clean water for daily use. This undoubtedly has an influence on the
time available for other activities, like work and studying. The entrepreneurial spirit, living
standards and hope for the future In an international Global Advisor study published by Ipsos in early
2021, it was found that South
Africans are some of the most entrepreneurial in the world1. Focusing specifically on young people, more
than a third aged 34 and below agrees that “One
needs to have your own business in order to have a secure lifestyle2”
, showing that entrepreneurial spirit in the country is alive and well – and
possibly fueled by a lack of other opportunities. Although moderate proportions of young
people agree that their standard of living is better now in relation to what
it was 5 years ago, they are definitely more confident that their
circumstances will improve in the future.
Politics are not high on the agenda3 However, this hope for the future is not
related to the political circumstances in the country. In fact, young people
(like older people) are rather unsure and apprehensive about the direction in
which the country is moving:
In addition, young people are not really
interested in politics and elections4, and about a third do not
want to vote in the upcoming Local Government Elections, and the same proportions do not feel
attached to any current political party in the country. This is about the
same proportion as older people in the country who feel this way. These opinions might be closely related to
the low levels of trust in politicians and political parties expressed by
young people (with the possible exception of the president). These figures
really bring the realisation home that political parties have their work cut
out before the Local Government Elections in October 2021, to convince young
people to go to the polls and participate in elections that can influence
their living conditions and local circumstances for the next five years. (Ipsos South Africa) 16 June 2021 Source: https://www.ipsos.com/en-za/youth-day-2021-some-desperation-and-despondency-big-dreams 695-696-43-05/Poll Awareness
Levels Of The New RTR Guidelines Amongst Consumers Is Quite Low 17% In South
Africa
A new online study by Ipsos, conducted
among car owners between 6 April to 10 May 2021, shows that respondents who
are aware of the new RTR Guidelines, share a positive outlook on the
implementation of these guidelines. This feeling was shared by respondents
who were not aware of the RTR Guidelines, but were informed during the
interviewing process. Competition Commission The Competition Commission has put out the final set of
guidelines for “Right to Repair” that has the potential to completely shake
up the automotive industry in terms of warranties and maintenance plans –
coming into effect on the 1st of July 2021. This ruling enables motorists to choose
independent service centres, without their dealership warranties being
affected. Not only will consumers be able to maintain a vehicle at
independent service centres without voiding their warranties, the way new
vehicles are quoted on and sold for will also change. Dealerships will be
required to split out the Warranty and Maintenance plan costs on the quote,
thereby giving the customer the option to include or exclude these, as part
of their vehicle purchase. This is a win for consumers, but it will
completely change the way the automotive industry operates and will elevate
the competitive landscape across the industry, more so in the small to medium
business sector. The nuts and bolts of the project The study used a multi-modal approach,
making use of qualitative and quantitative methodologies to gain a deep
understanding of consumers’ sentiments and the potential behaviour changes
due to RTR. Through the research, Ipsos was able to uncover the following
behaviours and consumer viewpoints on RTR:
Current low awareness The current awareness levels of the new RTR
guidelines amongst consumers are low - with only 17% of respondents saying
they have heard of it and have a good grasp or thorough knowledge of what the
new guidelines entail.
Positive reaction from consumers at first
glance The emotional impact was viewed in an
extremely positive light amongst respondents after they were made aware of
the RTR guidelines. There exists a genuine level of discomfort
from respondents that their warranties will be voided, should they choose to
service or repair their vehicles at any place other than the franchised
dealer. However, with the RTR guidelines, it is easing some of the discomfort
they are experiencing and providing them with peace of mind. The sentiment
from respondents was that the RTR guidelines will make them feel more
empowered and in control of their finances. Despite the RTR guidelines, respondents
indicated that they are still not comfortable with how disputes between
Original Equipment Manufacturers (OEM’s) and Independent Service Providers
(ISP’s) will affect them. 70% of respondents indicated that, due to this fact
they still believe there is a high potential risk of their warranties being voided.
Effect on Franchised Dealerships The perception is that consumers and the
ISP’s have more to gain through the RTR guidelines, with the OEM’s having
much more to lose. The main advantages for consumers relate to
“freedom of choice” when choosing which warranty and/or maintenance plan to
purchase. This allows them to “shop around” and decide on where to service or
repair their vehicles. Further to this, 50% of consumers feel that RTR will
financially benefit them. Taking a closer look at the advantages for
the Industry, respondents stated that these guidelines will create some
healthy competition in the market and empower smaller businesses to grow,
leading to job creation.
With consumers’ lack of knowledge and
understanding of the guidelines as it stands now, only 33% indicated that
they would continue servicing their vehicles at a franchised dealer, but that
they are eagerly waiting to have the freedom of choice to choose where to
send their vehicle, and possibly reaping the financial benefits.
(Ipsos South Africa) 17 June 2021 Source: https://www.ipsos.com/en-za/right-repair-consumer-sentiment-and-potential-behavioural-changes 695-696-43-06/Poll More Than
Half 63% Of The Owners Of Small, Medium And Micro Enterprises (SMME’s) Saying
They Experienced Great Uncertainty Regarding The Sustainability Of Their
Businesses
In October 2020, Ipsos shared insights into
the SMME
sector and how these businesses were impacted because of the Covid-19
pandemic,
with more than half of the owners of Small, Medium and Micro Enterprises
(SMME’s) saying they experienced great uncertainty regarding the
sustainability of their businesses. We continue the story by unpacking what
advice and support the SMME business owners state they need to recover in
these pressing times. A quick recap on the business impact: The impact of the pandemic and subsequent
lockdown on business performance have been significant, with 63% of SMME’s
stating that they are performing “Not Well” or “Not Very Well” after
lockdown, while larger enterprises are seemingly more resilient, with a third
(35%) stating that they are still performing “Well” or “Very Well” after
lockdown.
More than half (54%) of business owners
used their personal savings to keep their businesses running and 36% had to
revise their company spending to reduce expenses. Staff and suppliers were
also impacted, and about a quarter (26%) of businesses had to let staff go,
stating that they could not pay their suppliers or accounts. Nevertheless, South
African business owners stayed true to their entrepreneurial spirit, adapting to survive by implementing key
changes within their business model. What behaviour changes do business owners
say they will continue with? We asked business owners what the main
lessons were that they learnt during the pandemic and that they will continue
to do in the future, with the top 5 mentioned lessons being:
Taking a closer look at the marketing
changes that these business owners had to implement, we see that the SMME
sector still heavily relies on Word of Mouth as their main marketing source,
however a prominent shift towards digital marketing can be seen. This shift leans towards channels such as
their own websites (+12%) and other digital advertising channels such us
social media and Google Adverts (+8%). The largest decline of marketing
material used have been in the use of business cards, down by 11%.
What advice and support do SMME Business
Owners need With various external forces playing a role
in the impact on their businesses such as customers spending less (55%) and
price increases from suppliers (44%), the majority are still looking to
financial institutions for advice, with the top advisory need raised by
business owners being advice / support on how to increase their cashflow
(56%), followed by payment of UIF (24%) and a fifth requesting advice on how
to growth their businesses. However, advice / support on increasing
cashflow and growing businesses are broad topics that can include many
different elements, the top needs (10%+) provide more direction in terms of
which topics need more support and include topics such as Tax Assistance
(17%), Marketing and sales support and information (17%) and linking business
to bigger business (16%). With varying levels of digital marketing
experience and limited marketing budgets, it is no surprise that marketing
advice and support was called out as one of the top 10 advisory requirements
from SMME business owners.
Looking at how they prefer to receive
advice, it is interesting to see that 56% of business owners still prefer
email as the main communication method, followed closely by webinars (30%),
personal consultations (30%) and online platforms (29%).
(Ipsos South Africa) 27 June 2021 Source: https://www.ipsos.com/en-za/smmes-what-business-owners-say-they-need-recover-impact-covid-19 695-696-43-07/Poll 81%
Zimbabweans Strongly Agree With The Fact That Even If The Lockdown Had
Negative Impacts But It Was Necessary
A new Afrobarometer survey shows that even
though almost half of Zimbabwean households lost a primary source of income
during the COVID-19 pandemic, most citizens approve of the government’s
overall management of the pandemic. Most Zimbabweans endorse lockdowns and
school closures as painful but necessary. But very few report receiving
pandemic-related assistance from the government, and a majority believe that
COVID-19 resources were lost to government corruption. A majority doubt the government’s ability
to ensure that COVID-19 vaccines are safe, and fewer than half say they are
likely to try to get vaccinated. (Afrobarometer) 17 Jun 2021 WEST
EUROPE
695-696-43-08/Poll Only 6% Of Brits Think Increasing House Prices Would Be Beneficial
For The Country, But One-Fifth (20%) Say It Would Be Advantageous For Their
Personal Finances
Most recent figures show that the housing market is growing
at its fastest rate in seven years – a jump of 9.5% in the year to
May. Experts suggest
that ‘market activity continues to be boosted by the government’s
stamp duty holiday’ and that this boom period may continue as the ‘unexpected
savers’ of the pandemic look to invest their extra money. Now, new YouGov tracking data shows that 58% of Brits expect prices
of homes to go up in the year ahead while 21% expect them to stay about the
same, and only 6% anticipate a dip. When asked in February last year, prior to the beginning of the
pandemic, 43% expected house prices to go up, compared to only 8% who thought
they would drop. Fast-forward to April 2020 - just after the UK entered its
first lockdown – and the number of those that thought house prices would
increase tumbled to just 19%, while those who anticipated a fall, increased
to 41%. Opinion remained static for a couple of months, before beginning to
rise from June to August, at which point it levelled off once again at around
35%. The success of the vaccination programme caused confidence to rebound,
with the number expecting house prices to go up shooting up from 35% in
mid-January 2021 to 50% in mid-March. Expectations that house prices will
rise have grown further since that point, reaching 58% in early June. Half of Brits think it would be better for
the country if house prices dropped In general, 48% of the public say it would be better for Britain if
house prices went down, while a much smaller proportion (6%) think it would be
better if prices increased. Around a quarter (27%) believe it would be best
if it remained at the current level. When asked the same question, but this time thinking about personal
finances, One-fifth of Brits (20%) say they would be better off if prices
rose. A similar proportion (22%) say it would be beneficial if prices fell.
Half (48%) of Brits say it will make little difference to them
personally if house prices rise or fall. This is most apparent among those
aged 65+ (72%) compared to only 20% of those aged 18 to 24 (YouGov UK) June 14, 2021 695-696-43-09/Poll Three In Ten (31% Of 18-34’s) Football Fans Say Live TV Is A Thing Of
The Past (Compared To 20% Of Over 35s)
In April, as he
offered a defence of the European Super League, Real
Madrid President Florentino Pérez declared that “young people are
no longer interested in football”. Yet those arguments
haven’t seemed to worry UK broadcasters, who this month signed up to
roll-over their existing contracts with the Premier League in
a £4.7bn deal. So what does YouGov’s data tell us about young people
and the beautiful game – and how can marketers and advertisers more
effectively reach them? How they watch football Comparing football fans aged 18-34 and over-35s reveals
key differences in viewing preferences. While TV is still the most
popular way to watch the game, older fans are more likely
to turn on the telly to watch live football
(87% vs. 82% of 18-34s) and highlights (67% vs. 61% of 18-34s).
Younger fans are more sceptical of the box. While
four in five watch sport on live TV (82%), some may be doing so reluctantly.
Three in ten (31%) say live TV is a thing of the past (compared to 20% of
over 35s), and nearly as many say streaming is better than live
TV (28%) compared to one in seven (14%) older football
fans. Where they watch football Looking at the four major broadcasters involved in the renewed
football rights deal shows that older fans are more likely
to have recently watched Sky Sports (39% vs. 30% of 18-34s),
BBC Sport (24% vs. 17%), and BT Sport (24% vs. 21%). There’s more parity when
it comes to Amazon Prime Video (30% vs. 31% of 18-34s)
but we shouldn’t assume too much from this, given
that the service comes free with the overall Amazon
Prime package. The gap can be partially explained through simple household
economics. Two in five (39%) of the younger demographic live with
their parents and therefore may not have control over their household
TV situation – including which channels their household subscribes
to. But it’s likely no accident that Now TV, which doesn’t tie viewers to
a longer-term contract, is more popular among 18-34s than over-35s (11% vs.
8%). Four in five younger football fans say streaming services
have “changed TV watching” for them (82% vs. 53% of over-35s),
and the more long-term contracts offered by more
traditional broadcasters could be putting them off. Offering more
short-term viewing options to younger fans may help broadcasters reap greater
commercial rewards among this group. Younger fans notice marketing but
expect more from it Our data suggests that younger football
fans are more attentive to marketing – but also expect more from
it. For instance, fans aged 18-34 are more likely to say they notice
the brands that sponsor events (52% vs. 29% of over 35s). They’re also
more likely to think sponsorship can help companies stay socially
relevant (66% vs. 48% of over-35s), and nearly three in five agree that they
love seeing that their favourite team has cool sponsors (57% vs 32%
of over 35s). How and where to advertise to younger
fans However, with attention comes scrutiny. Fans aged 18-34 are more
likely to say that the brands that sponsor sports don’t make sense (71% vs.
63% of over-35s), and that they deserve special discounts from those
brands (44% vs. 34%).They may also have a poorer attention span: 18-34s are
much more likely to say they’re bored all the time (40% vs. 25%). So clubs, broadcasters, and marketers should take care
when addressing this audience: they watch the game
differently, and they respond to promotions and communications
differently too. For example, while they’re less likely to say that TV ads have
the biggest chance of getting their attention (20% vs. 34% of
over-35s), online ads are more likely to catch their eye (31%
vs. 19%). A quarter are also on TikTok (23%), so a short-form
social strategy could also pay off. But content is key. Younger fans want different messages and
messengers A big, bold message may be risky with over-35s (65% of
them vs. 43% of 18-34s think brands shouldn’t express views on
political or social issues), but most 18-34s think brands should be free to
speak out when they feel strongly about an issue (64% of 18-34s vs.
40% of over-35s). Marketers may also wish to consider how they select brand
ambassadors aimed at younger fans. Fans aged 18-34 are more likely
to cite wonderkids in continental
leagues like Kylian Mbappe (16% vs. 9% of over-35s)
and Erling Haaland (15% vs. 6% of over-35s)
as favourites, while over-35s prefer Premier League stalwarts like Harry
Kane (23% vs. 18% of 18-34s) and Mo Salah (20% vs. 16%). While a campaign that appeals to naked self-interest – i.e. a
shirt sponsor promising exclusive discounts to fans of a particular team –
may pay off, an ad fronted by Jadon Sancho that sensitively tackles themes of
social responsibility could be just as effective. 2021 is half over, and the Premier League has already seen off the
threat of a breakaway competition and the prospect of an open-market auction
over broadcast rights. But while the current TV deals are
preserved in amber until 2025, there’s evidence that fans may
be changing. Will clubs, marketers, and broadcasters change
with them? (YouGov UK) June 17, 2021 695-696-43-10/Poll Britons Will Miss Practicing Better Hygiene (66%), Less Traffic On
Roads At Peak Times (63%) And Quiet Shops And Supermarkets (59%)
New polling by Ipsos MORI shows that while many will be ready to see
the end of lockdown, there are plenty of aspects of lockdown that will be
missed. Among the things most likely to be looked back on fondly are people
practising better hygiene with two-thirds saying they will miss this at least
a fair amount (66%), less traffic on roads at peak times (63%) and quiet
shops and supermarkets (59%). Over half (53%) will miss spending more time with family, while a
quarter (24%) will be not be unhappy to leave it behind. However, people are
more enthusiastic about seeing family in real life as opposed to video call,
almost half (47% not very much/at all) will not miss speaking to family/
friends more via technology. And despite being fond of the time they’ve spent
with their families, half of parents are keen to see the back of
home-schooling (50%), while three in ten (28%) will miss it. Many will miss the calmness created by lockdown. Half (50%) say they
will miss tourist attractions and public places being quiet, whilst 42% will
miss quieter public transport. Those currently employed will miss aspects of their working life
during lockdown; 44% will miss being able to work more flexibly, while 40%
will miss not having to commute. Almost four in ten (38%) will miss not
having to dress smartly for work and around a third (36%) say they’ll miss
working from home full time. Opinion is split when it comes to socialising again. Four in ten
(39%) will miss not having to socialise with other people, while 45% will not
miss this. Britons are also divided as to whether they will miss getting to
know their neighbours and community better – a third (32%) say they will miss
this whilst another three in ten (30%) will not. Two in three (67%) will not miss government briefings, whilst around
one in five will (18%). Similarly, half (51%) will not miss having to pay
more attention to politics and the news. Three in five (59%) will not
miss having to wear face masks, however opinion is more split concerning
other measures put in place to stop the spread of COVID-19. Forty-four per
cent will be pleased to see the end of not greeting people with hugs, kisses
or handshakes, against another four in ten (38%) who will miss it.
We know that there are many things people
are looking forward to when the coronavirus restrictions end, including
getting proper face time with friends and family. But we’ve also seen that
there will be at least some aspects of lockdown that people will miss – again
partly the opportunity to spend more time with family (if not
home-schooling), but also the peace and quiet, and the reassurance provided
by people paying more attention to hygiene. (Ipsos MORI) 20 June 2021 Source: https://www.ipsos.com/ipsos-mori/en-uk/what-will-britons-miss-about-lockdown-ipsos-mori 695-696-43-11/Poll 4 In 10 (44%) Britons Believe That There Are Still Many Important
Issues To Finalise With The EU
New polling by Ipsos MORI, in partnership with UK in a Changing Europe,
finds that 4 in 10 (44%) Britons believe that there are still many important
issues to finalise with the EU, with Remain voters most likely to feel this
way about negotiations (62%). In contrast, 30% of leave voters say
there are still many important issues to discuss.
Five years after the referendum, the majority of Britons (56%) say it
hasn’t made any difference to their daily lives, however there is still a
significant split between leavers and remainers. Remainers are more
likely to say it has impacted their lives negatively (51%) and only 5% of
remain voters think it has made life better. Whilst only 1 in 10 leave voters
say it has impacted them negatively and 7 in 10 (71%) say it hasn’t changed
anything for them on a day-to-day basis.
When asked about whether they knew anyone whose job of business had
been impacted by Brexit, a quarter (25%) said they did know someone, compared
to 8% who said they knew someone that had been positively impacted. The
majority (59%) didn’t know anyone that had been affected by Brexit. Nearly half (47%) of people report that Brexit is working out as
expected, but unsurprisingly those that voted to remain in the EU are the
least positive – 48% of remainers say is working out worse, compared to 10%
of leave voters. Kelly Beaver, MD of Public Affairs, Ipsos
MORI, says: We are now five years on from Brexit and
the majority of people say it has no impact on their lives to date, however
nearly half of us also feel that we have many unresolved issues to negotiate
with the EU. The public remain divided on Brexit and there is potential
for this to become more pronounced when the pandemic ends and the spotlight
returns to the issue of Brexit. Will remainers be won over by new trade deals
and greater independence? Or will the reality of red tape on holidays
and promises that may not be fulfilled leave the leave voters feeling
disenchanted with Brexit? Paula Surridge, Deputy Director at UK in a
Changing Europe said: The full implications of the decision to
leave the European Union are not yet being felt widely among the British
public. The wider crisis of the last 18 months - tens of thousands of deaths,
an ever-growing health crisis, chaos in the school system, cancelled holidays
and lockdowns – may have both masked some impacts and changed what people
think is possible. But the Conservative majority is built on high
expectations for positive change as a result of Brexit, and it remains to be
seen, once other concerns have waned, whether the government is able to
convince them that Brexit has delivered. (Ipsos MORI) 23 June 2021 Source: https://www.ipsos.com/ipsos-mori/en-uk/five-years-brexit-they-think-its-all-over-it-isnt 695-696-43-12/Poll Around Two In Five (63%) Of The Unvaccinated Are Convinced By Arguments
Which Say There Hasn’t Been Enough Time To See What The Side-Effects Of The
Vaccine Might Be
Before the vaccine roll-out began late last year, the majority of
Britons were convinced by the argument that there had not been enough time to
see the side-effects of the vaccine – now just two in five (41%) think the
same, down 20ppt. Just six months ago, around half thought there had not been enough
time to test whether the vaccine really works – now just a third (35%) think
that is a persuasive reason to not get vaccinated (down 23ppt). Similarly,
only three in ten (31%) are convinced by the argument that vaccine doses will
be limited, and others will need them more, 20ppt fewer than last November.
Britons yet to be vaccinated are more susceptible towards arguments
against getting jabbed. Around two in five (63%) of the unvaccinated are
convinced by arguments which say there hasn’t been enough time to see what
the side-effects of the vaccine might be. This compares to a third of those
who had at least one dose (33%). Similarly, around half of people unvaccinated are convinced by
arguments against taking it such as there has not been enough time to test
whether it works (52%), doses of the vaccine will be limited and others will
need it more (50%) or they don’t trust the Government telling them to take it
(49%). Meanwhile, the majority of Britons are now convinced by all the
arguments tested in favour of taking the vaccine. Among the most convincing
is that a vaccine will reduce the risk of people becoming seriously ill if
they do catch COVID-19 (83%), along with the belief that getting vaccinated
will protect others from catching the virus (83%).
In fact, overall, confidence in the vaccine remains high, as results
from our latest KnowledgePanel survey show. However, there are concerns about
its effectiveness against new variants of COVID-19; half (48%) say they are
worried about this. Despite these concerns, the survey of over 8,000 adults
in the UK shows that nine in ten people (91%) say it is important to get the
vaccine to stop the spread of new variants. In general, concerns about the effectiveness of the vaccine against
new variants do not seem to be diminishing intentions to have it; 94% of
people say they have already had the vaccine or will have it. However,
worries about its effectiveness are higher amongst groups with lower existing
levels of confidence in the vaccine. For example, concern is highest amongst
young people aged 16-24 and people from an ethnic minority (both 60%). Anna Quigley, Research Director at Ipsos
MORI, said of the findings: While results from both our Omnibus and UK
KnowledgePanel surveys show high levels of confidence in the COVID-19
vaccine, there is still a need to engage with those that remain worried and
doubtful. Some arguments against the vaccine are holding strong, while there
are worries about how effective it will be against new variants, highlighting
the need for more conversation in these areas. (Ipsos MORI) 24 June 2021 695-696-43-13/Poll One In Twelve Parents Say They Regret Having Children
Online forums such as Mumsnet, Reddit and Quora are full of threads
with guilt-ridden parents who desperately ask if anyone else regrets
having children too. YouGov data shows that while the vast majority of parents (83%)
insist they’ve never felt this way, a small number admit to it. One in twelve
parents (8%) say they regret having children, while another 6% have
previously had regrets but don’t now.
Those aged 55+, for most of whom tantrum-throwing toddlers and sleep
deprivation are a fading memory, are the least woeful. Only one in ten are
unhappy with their decision to have children (6%) or have questioned it in
the past (4%). Among the 8% of parents who still regret having kids, 5% say it’s to
a small extent, while for 2% it’s to a moderate degree, and for 1% to a large
extent. The pattern is fairly similar among mothers and fathers who have
previously been unhappy with parenthood, with 5% insisting their regrets were
minor, and 1% saying they regretted it to a moderate degree. Three in ten parents wish they’d had more
children While some 8% of parents currently feel regretful about their
offspring, a separate survey shows that only half as many (4%) say they would
not have had children if they could do it all again. A similar figure say
they would have had fewer kids (4%). It’s much more common for people to wish
they’d had more children, at 29%. The majority (54%) would have the same
number if given the option again. A third of younger parents aged 25 to 49 (32%) wish they’d had more
children, while parents in the oldest age group, 65+, are the least likely to
say so at 25%. The UK’s fertility
rate is much lower today than in the 1960s and 70s, meaning younger
Britons tend to have fewer children than their parents’ generation. In this instance there is also a difference between the genders, with
a third of mothers (32%) wishing they’d had more children, compared with one
in four fathers (24%). (YouGov UK) June 24, 2021 695-696-43-14/Poll Despite General Hesitancy For Loosening Restrictions, 61% Of The
Public Support Lifting The Limit Of 30 Attendees In Weddings
The Government recently announced that the
final phase of the roadmap has been pushed back by four weeks, but they did
change some of the rules around weddings for the period between 21 June and
19 July. The 30-guest limit has been lifted, but other rules around social
distancing, dancing and table service remain in place. New YouGov polling
finds that the British public are generally supportive of the cautious
approach. Despite general hesitancy for loosening
restrictions, 61% of the public support lifting the limit of 30 attendees.
Perhaps unsurprisingly, three quarters (74%) of those who are attending a
wedding in the next month support the measure, compared to 60% of people who
will not be affected by the rule change.
The measure with the weakest support is the
ban on indoor dancefloors, although even here, 50% of Britons support the
measure. Amongst people who said that they will be attending a wedding or
civil ceremony or getting married themselves, support drops to 39%, with the
majority (56%) opposing the ban. Public split on whether to extend the
furlough scheme Despite the delay to the roadmap, the
government has stated that the furlough scheme will be phased out from 1 July
as planned. Through the pandemic, furloughed workers have had 80% of their
wage paid by the government – this will now be rolled back in stages, with
the government covering 70% of wages in July, 60% in August and 50% in
September, before the scheme ends completely on 30 September. As it stands,
the scheme has cost the government £64 billion.
Continued confidence in the vaccine rollout As part of the roadmap announcement, the
government also revised its vaccination target, bringing forward its goal of
giving all adults their first dose of the vaccination in line with the new
'Freedom Day'. Seven in ten Britons (71%) are confident that the government
can hit this target, although there may be some concern that the largest
remaining group to receive their first vaccinations – 18-24 year olds – are
the least confident that this goal will be met (55%). (YouGov UK) June 24, 2021 695-696-43-15/Poll Around 13,000 People In Germany Develop Blood Cancer Every Year, For
Which A Stem Cell Donation Is Often The Last Chance Of A Cure
Great potential for possible donors,
especially among younger people Fear of intervention is the biggest barrier
to stem cell donation
Widespread lack of information about stem
cell donation The rumor persists that stem cells are removed from the spinal
cord. Even a majority of those who say they are “at least somewhat
informed” are of this opinion. Only one in three knows that there are
several donation registers (35%) and two different methods (from the
bloodstream / from the bone marrow) of stem cell collection (31%). Media The most important source of
information on stem cell (Ipsos Germany) June 24, 2021 Source: https://www.ipsos.com/de-de/studie-die-grossten-barrieren-bei-der-stammzellspende 695-696-43-16/Poll Nearly Half (48%) Of People Who Regularly Shop Online Would Use “Buy
Now, Pay Later” Service If It Were Available
These are applications (or electronic services that can also be used
at points of sale) that allow you to divide the amount due into three or four
installments to be paid in the following months, without interest - and are
different from financing, as they do not require any pre-approval, and can
also be used on small amounts. Italians are receptive to this idea. In fact, nearly half (48%) of people who regularly shop
online would use such a service if it were available.
But the functioning of fractional payment apps, different from
classic retail credit, could be the key to paving the way for more flexible
lending services adapted to people's daily needs. (YouGov Italy) June 14, 2021 Source: https://it.yougov.com/news/2021/06/14/app-di-pagamenti-rate-online-grande-potenziale-ma-/ 695-696-43-17/Poll Since 2018, Internet Sales Are Twice As Popular (Going From
11% To 22%) - Particularly By Women (28%) And Young People (39% Of 25-34 Year
Olds)
What do the French do with the clothes they
no longer wear? Donations to associations come first (39%), followed by internet
sales (22%) and donations to people around them (14%). Since 2018, internet sales are
twice as popular (going from 11% to 22%) - particularly by
women (28%) and young people (39% of 25-34 year olds). Note: 12% of respondents say they leave
things they no longer carry in their closet (-4 points since 2018) and 7%
throw them in the trash. The most used sales platforms Vinted leads
the way and has gained 16 points since
2018 : among the French who say they sell their clothes
online when they no longer wear them, 85% use this platform, against 69%
three years earlier.
Leboncoin and Facebook Marketplace maintain their positions (2 nd and
3 rd respectively ) but the use of these platforms is
decreasing for this type of activity. Indeed, Leboncoin goes from 52% to
31% and Facebook Marketplace from 25% to 13%. How often and what income? The vast majority of French people who sell their clothes on the
internet do so at least once every 6
months (82%) . Note: 42% of respondents even say they do
it at least once a month. This activity generates less than € 100 in income for 55% of
respondents, between € 100 and € 200 in income for 21% and more than € 200
for 14%. It can be seen that the frequency of sales
and the income generated remain stable compared to 2018 . This activity has therefore mainly
evolved in terms of the number of people who practice it and the platforms
used. (YouGov France) June 14, 2021 Source: https://fr.yougov.com/news/2021/06/14/la-seconde-vie-du-pret-porter/ 695-696-43-18/Poll 1 In 5 Spaniards Will Continue To Use The Mask Despite Not Being
Mandatory
Next Saturday one of the Covid-19 sanitary measures that generated
the most controversy from the beginning and that, in turn, most bothered many
will be modified: the mandatory use of
masks outdoors . Although the specific details are not
yet known, starting next Saturday, June 26, Spaniards will be able to walk
through the streets, beaches and mountains without having to use a complement
that was already part of everyone's routine. Aware of the controversy generated around the decision of the central
executive, Ipsos has carried out a
consultation among Spaniards through its What & Why community , in order to analyze their opinion on
the change in health measures that will live from this end of week. Regarding the decision that masks are no longer mandatory in open
spaces, 26% of those interviewed say
they do not agree with this new measure . A measure that
for 38% is something hasty . A
percentage that also corresponds to those who think that this decision should
have come once group immunity was
achieved . In addition, 23% of them affirm that they still do not
feel comfortable or safe not wearing a mask. However, the percentage of citizens interviewed who do agree with the
measure that will be implemented as of this Saturday is higher than those who
do not. Since 72% say they are in
favor of this change, although even so, 19% say that they will continue to
use the mask until they achieve group immunity. On when to use it, 2 out of 5 declare that they will wear it
depending on the influx of the space where they are and 28% say that they
will always carry a mask with them in case at any time they need to use
it. “As of Saturday we will experience a new
rule change regarding the management of the pandemic, the use of the mask has
deeply penetrated society, and although many want to take it off as soon as
possible, many have also decided to continue using it or at least on certain
occasions, even after the pandemic is over. Taking off the mask generates
hope and suspicion in equal parts about the end and control of the crisis ” ,
says Vicente Castellanos, Director of
Public Opinion and Political Studies at Ipsos in Spain. In this same consultation, Ipsos wanted to know the position on the
possibility that those vaccinated with
a complete schedule could stop using a mask in any field . Faced
with this question, only 14% would
agree that the vaccinated should stop using the mask both in
open and closed spaces, while 25% would agree if it is only like that
outside. Although 34% are
inclined because the rules should be the same for everyone and
that not because they have received the vaccine should they stop using the
mask. And it is that, in this regard, 27% also consider that those
vaccinated should also use it since there is still a probability of
contagion. Although, for many, the change in regulations that will take place on
the 26th will not mean a change in habits, the study also suggests that if
once the pandemic is over they consider that the use of a mask should be mandatory when they have symptoms of flu or
cold, something with which 40% of those interviewed would agree. Meanwhile,
almost half of those surveyed (49%) affirm that they would agree that it
should be taken, but not as a mandatory matter, but as a
recommendation. For their part, 11% would not support this measure. (Ipsos Spain) June 22, 2021 NORTH
AMERICA
695-696-43-19/Poll 69% Americans Are Most Likely To Indicate They Will
Currently Still Wear A Mask On Airplanes Or Trains
We explored where Americans will continue to wear masks, and whether
they assume that people wearing a mask have not been vaccinated. The
questions about mask-wearing were only asked to Americans because a greater
proportion of the American population is currently fully vaccinated. With
second doses of COVID-19 vaccines being available earlier in certain
provinces, we also explored Canadians’ perspectives on receiving a second
dose. This survey is conducted in collaboration
with the Association for Canadian Studies (ACS) and published in the Canadian
Press. This series of surveys is available on Leger’s website THE FUTURE OF WEARING A MASK IN THE UNITED STATES
RECEIVING A SECOND DOSE OF ASTRAZENECA
(Leger) June 15th, 2021 Source: https://leger360.com/surveys/legers-north-american-tracker-june-15-2021/ 695-696-43-20/Poll About One-Third (32%) Of The Posts On Conservative Facebook Pages And
Roughly Half (52%) On Liberal Pages Were Neither Positive Nor Negative
A new study of posts on popular public Facebook pages about the early
days of the Biden administration finds that the focus of these posts, as well
as the assessments of the new president, differed widely by the ideological
orientation of the pages.
The popular pages included all have a focus on current affairs and
are a mix of political groups like Occupy Democrats or Team Trump; figures
such as Barack Obama or Donald Trump Jr.; commentators like Ben Shapiro or
Robert Reich; and news outlets like The Western Journal and NowThis. Among popular Facebook pages that describe themselves as conservative
(12 of the 25 pages studied), 1% of posts carried positive
assessments of the Biden administration, while 67% were negative.
For those pages that self-identified as liberal (11 of the 25), only 1% of
the posts carried negative assessments while 47% had a positive one. About
one-third (32%) of the posts on conservative Facebook pages and roughly half
(52%) on liberal pages were neither positive nor negative.2 These differences in assessments follow the same pattern found in
the broader
news media study and are another reminder of the deeply
polarized information environment in the country. (It is important
to note that while the ideological groupings for the Facebook pages were
based on self-descriptions, the groupings in the broader study were based
on audience
makeup – a metric not available for Facebook pages.)
Facebook posts covered similar topics as
broader coverage but were more negative This report also compares Facebook posts about the Biden
administration with coverage in the broader mix of outlets studied in our
previous report. Both samples analyzed here include only posts or stories
from the week of March 8-14, 2021. The outlets studied in the previous
research include 25 major news outlets on TV, radio and the web; Facebook
pages of these outlets were not included in this analysis. These two samples
covered the new administration using the same mix of topics but carried a
more negative assessment on Facebook. Among all Facebook posts studied, the economy was the leading subject
(28% of all posts), as was the case in the study of broader coverage from TV,
radio and the web, where 36% of all stories about Biden focused on that
topic. The top five Biden topics were the same in both samples, although there
was a slightly larger emphasis on immigration on Facebook pages (19%) than in
the broader coverage (11%), and the broader coverage emphasized health care
(21%) more than Facebook posts did (12%). The two samples did differ, however, in the overall assessments they
offered of the Biden administration. On popular Facebook pages, posts with
negative assessments outnumbered positive ones by 36% to 21%. But in the
broader coverage of Biden, it was almost an even split, with 31% of stories
offering a positive assessment compared with 28% carrying a negative one. A
plurality of coverage in both groups offered neither a positive nor negative
assessment. One contributing factor to this difference in coverage may be the
self-described ideological orientation of the 25 popular Facebook pages
studied compared with the political leaning of audiences across the 25 news
outlets in the broader coverage. For the 25 Facebook pages,
self-identifications were almost equally divided between conservative (12)
and liberal (11), while in the broader analysis, there were far more news
outlets with audiences that lean to the left politically (13) than with
audiences that lean to the right (6), which reflects the lower
levels of trust of many major outlets among Republicans. Higher engagement with Facebook posts that
had a positive assessment of the Biden administration or mentioned Trump
One catalyst for engagement was the former president. Posts that
mentioned Donald Trump averaged about 19,800 interactions, more than twice as
much engagement as posts that did not invoke the former president (roughly
9,200). Liberal and conservative Facebook pages
offered very different views of the Biden administration
Of the 25 popular current affairs-oriented public Facebook pages
examined in this report, nearly all gave some indication of an ideological
orientation. Pages that identified as liberal described themselves as
liberal, progressive, Democratic, or opposed to conservativism or
Republicans, while pages that identified as conservative described themselves
as conservative, Republican, or opposed to liberalism or Democrats.
Researchers used these descriptions to classify the ideology of the page as
liberal, conservative, or neither. In all, 11 of the 25 pages self-described as liberal and 12 as
conservative. Just two pages did not describe themselves as favoring one side
of the political spectrum; these were classified as “didn’t self-identify”
and are less of a focus of this analysis.3
Among the self-described conservative pages, however, two-thirds of
the posts (67%) had a negative assessment of Biden and his administration,
while about another third (32%) did not have a clearly negative or positive
assessment. And, in sharp contrast to the liberal Facebook pages, just 1% of
posts on conservative pages offered a positive assessment of the new
administration. Popular liberal and conservative pages also focused most of their
attention on different topics related to the Biden presidency. By far, the
dominant topic of the posts on the liberal pages was the economy (46% of all
posts on liberal pages), likely reflecting Biden’s signing of the $1.9
trillion coronavirus relief bill during the week studied. The next most
common topic among liberal pages was health care, well behind at 16% of
posts. No other topic was the focus of more than one-in-ten posts.
There is an even starker difference between the two types of Facebook
pages on one of the biggest issues of the day: the coronavirus
pandemic. In addition to whether COVID-19 was the main topic of a post,
researchers also analyzed whether COVID-19 was mentioned in the text of the
post or in the link or video contained in the post.5 Roughly
two-thirds of posts (68%) from liberal pages mentioned the coronavirus – more
than twice the proportion as conservative pages (28%). There was a smaller
difference in mentions of former President Donald Trump in posts.
Conservative pages were somewhat less likely to mention Trump, who appeared
in 15% of their posts, compared with 22% of posts on liberal pages. Facebook posts and broader news coverage
about early Biden days are similar on topic, less so on tone This report also examines how Facebook posts about the new Biden
administration compare with the stories examined in a recent Pew
Research Center analysis of coverage of the administration by 25
news outlets drawn from television, radio and the web. To make as effective a
comparison as possible, data from the previous analysis, which spanned the
first 60 days of the new administration, were reanalyzed to include only the
week of March 8-14, the same period in which these Facebook posts were
studied. Coverage from this broader
sample encompassed TV, radio and web stories from a wide range of
sources from CNN to Newsmax and from The New York Times to the Washington
Examiner.
The most common topic in each analysis was the economy – which was
the focus of 28% of all the Facebook posts studied, modestly less than the
36% of stories in the broader media sample that were devoted to that subject.
And the ranking of topics was similar as well, with the economy at the top
spot followed by a mix of health care, immigration, political skills and
appointments, although there was greater emphasis on immigration among the
Facebook posts.
In the sample of broader coverage during that week of March, a
roughly equal proportion of stories carried a positive assessment (31%) as a
negative assessment (28%) of the Biden administration. But Facebook posts
were 15 percentage points more likely to have a negative than a positive
assessment (36% vs. 21%). For both posts and stories, however, a plurality of coverage was
neither negative nor positive (44% of posts and 41% of stories). Positive posts about Biden administration
generated highest engagement
Comparing these popular Facebook pages by their self-described
ideology, liberal pages, which also published far more positive posts about
the administration, generated somewhat higher engagement per post than
conservative pages. On average, posts about the administration in the week
studied received roughly 12,500 interactions on liberal pages, about 11% more
than posts from conservative pages (about 11,300). Engagement for liberal pages was buoyed in part by the positive posts
they published, which generated about 14,100 interactions on average, 27%
higher than the average engagement generated by other posts from those pages
(about 11,100 interactions). In contrast, conservative pages saw very little
engagement difference between negative posts about the administration and
their other posts (roughly 11,200 vs. 11,600 average interactions,
respectively). There were also different levels of engagement by topic. Among the
five most common topics, posts about Biden’s political skills received about
20,000 interactions on average, compared with about 12,000 average
interactions for posts about health care, about 10,900 interactions on posts
about business and the economy, and fewer than 10,000 interactions on posts
about the president’s nominations (9,600) or immigration (9,400).7 Mentions of Donald Trump in a post proved to be a major catalyst for
engagement. Posts that did not mention Trump, on average, generated roughly
9,200 interactions, while those that included the former president had more
than double that number – about 19,800. Popular pages frequently linked to their
own external content
Many of these posts – especially on the conservative pages – linked
to their own content rather than to content from another website (e.g., a
post on the Pew Research Center Facebook page posting a link to
pewresearch.org vs. another site). Overall, four-in-ten posts (40%) linked to
their own content; this number rose to 72% for posts on conservative pages
but was just 4% for posts on liberal pages. (PEW) JUNE 14, 2021 695-696-43-21/Poll Roughly Two-Thirds Of Atheists (65%) And Six-In-Ten Agnostics (57%)
Either “Strongly” Or “Somewhat” Oppose The Death Penalty For People Convicted
Of Murder
A majority of adults in the United States favor
the death penalty for people convicted of murder, according to a
recent Pew Research Center survey. However, views about the death penalty
vary by religion – with atheists and agnostics opposing this form of
punishment at about the same rate as Americans overall support it.
Roughly two-thirds of atheists (65%) and six-in-ten agnostics (57%)
either “strongly” or “somewhat” oppose the death penalty for people convicted
of murder. Atheists and agnostics are small religious groups,
representing less
than 10% of the adult population, but their share has grown in recent
years. Meanwhile, 60% of U.S. adults overall favor the death penalty, including 75% of White
evangelical Protestants and 73% of White non-evangelical Protestants,
according to the survey, which was conducted in early April. White Protestants
account for about 29%
of the U.S. population, a share that has shrunk in recent years. How we did this Atheists and agnostics are the only religious groups in this analysis
that are more likely to oppose the death penalty than to support it. Groups
with majorities in favor of executing convicted murderers include Hispanic
Catholics (61%) and people who describe themselves, religiously, as “nothing
in particular” (63%). Black Protestants are divided in their views on the
death penalty, with 50% in favor and 47% opposed, mirroring
a broader trend of lower support for the death penalty among Black
Americans overall. Due to sample size limitations, this analysis does not include some smaller
religious groups, including Jewish and Muslim Americans. Views of the death penalty also differ by political orientation, race
and age – characteristics that tend to vary between religious groups. For
example, atheists are
younger and more politically liberal than White evangelicals on
average. Still, while these differences account for some of the variation
across religious groups, religious differences in support for the death
penalty remain even after accounting for these other traits. In addition to exploring levels of support for the death penalty, the
survey asked respondents whether they feel this form of punishment is morally
justified, whether it acts as a deterrent, whether there are adequate
safeguards to ensure that no innocent person is put to death, and whether
sentencing for the same crime varies by race. Again, on several of these questions, atheists and agnostics fall on
one end of the spectrum and White Protestants on the other. Roughly half of
atheists (51%) and agnostics (47%) say the death penalty is morally wrong,
even for people who commit crimes like murder. Fewer than half as many White
Protestants (22%) – evangelical and not
evangelical – feel the same way, with more than three-quarters in these
groups saying the death penalty is morally justified when someone commits a
crime like murder.
White evangelical Protestants are also the only religious group in
which a plurality (51%) say the death penalty deters people from committing
serious crimes. By comparison, about half as many Black Protestants (27%)
believe the death penalty acts as a deterrent. Generally speaking, people
with any religious affiliation are more likely than those without one to say
that the threat of the death penalty deters serious crimes: 39% of affiliated
adults say this, compared with 26% of the unaffiliated. Large majorities in every religious group say there is some risk that
an innocent person will be put to death. However, White evangelical
Protestants are more likely than any other group analyzed to say there are
adequate safeguards in place to ensure that no innocent person will be put to
death, with three-in-ten taking this position. Among religiously unaffiliated
Americans, only about one-in-ten atheists and agnostics say adequate
safeguards are in place to prevent innocent people from being executed.
Unaffiliated people who say their religion is “nothing in particular” are
twice as likely to say the same (20%). There also are wide differences over whether the death penalty is
applied equally by race. About nine-in-ten Black Protestants (88%) say Black
people are more likely than White people to be sentenced to death for
committing similar crimes, while nearly seven-in-ten White evangelicals (68%)
say that White and Black people are equally likely to be sentenced to death.
Roughly half of White non-evangelicals (53%) and Catholics (47%) believe the
death penalty is applied equally between these two races (PEW) JUNE 15, 2021 695-696-43-22/Poll Americans Lost More Years (5.5 Million) Of Life To Covid-19 In 2020
Than To All Accidents Combined In A Typical Year
About 600,000 Americans have died of COVID-19 since the coronavirus
outbreak began. But behind that huge figure is a more nuanced one
that brings the human toll of the virus into even sharper relief. In addition to the overall number of deaths from a given cause,
researchers can estimate the number of “life years” lost due to it – a
statistic that takes life expectancy into account. For example, if a person
with a life expectancy of 80 dies at age 50, they are estimated to have lost
30 years of life. Examining this statistic underscores the extent to which
the virus has cut Americans’ lives short.
In 2020 alone, the coronavirus was responsible for about 380,000
deaths and roughly 5.5 million years of lost life in the United States,
according to a Pew Research Center analysis of provisional data from the
Centers for Disease Control and Prevention. That number of life years lost is
more than the number lost in a typical calendar year to all accidents
combined – including traffic accidents, drownings, firearm accidents, drug
overdoses and other poisonings – and more than triple the number of life
years lost in a normal calendar year due to liver disease or diabetes. (This analysis compares provisional 2020 data for coronavirus deaths
with final 2019 data for all other causes of death. We took this approach for
several reasons: Only provisional data is currently available for COVID-19
deaths in 2020; detailed provisional data is not currently available for all other causes of death
in 2020; and the pandemic affected mortality patterns for non-coronavirus causes in 2020, too.
That makes 2019 a suitable comparison point for the typical number of deaths
from various causes in a given year.
The same figures reveal that the average number of life years lost
per U.S. coronavirus death in 2020 was 14 years. This is comparable to the
average number of years lost per heart disease death in the U.S. in 2019 (13
years) and somewhat lower than the average number of years lost per cancer or
diabetes death that year (17 years). But it is far below the average number
of years lost per liver disease (24 years) or accidental death (31 years). Life expectancy increases with age The large number of life years lost due to COVID-19 in 2020 may not
be widely appreciated because people ages 65 and older account for a large
majority (approximately 80%) of U.S. coronavirus deaths to date. Some
observers have raised the point that the public may believe that these older
Americans were nearing
the end of their lives anyway. But life expectancy statistics tell a different story. In fact, life
expectancy increases with age. While babies born in the U.S. today can expect
to live to be 79, Americans who are 65 today can expect to live to 85,
according to the United
Nations World Population Prospects. Current 80-year-olds, in turn, can
expect to live to an average age of 90.
The pandemic, in other words, has killed many Americans who otherwise
might have expected to live for years or even decades longer. A 65-year-old
who dies from COVID-19 might ordinarily have expected to live until 85 – a
difference of two decades, or roughly a quarter of the average American’s total expected life span at birth. Average life spans change with age as common causes of death shift
over time. By the time a U.S. adult lives to 65, they are unlikely to die
from some common causes of death among younger people, such as homicide,
pregnancy complications or congenital diseases. At the same time, older
Americans are more likely than their younger counterparts to die from causes
including heart disease, Alzheimer’s – and now COVID-19. (PEW) JUNE 16, 2021 695-696-43-23/Poll The Percentage Of Americans Who Believe That Religion Is Increasing
Its Influence On American Life Has Retreated To 16%, In Line With
Pre-Pandemic Levels
WASHINGTON, D.C. -- After doubling last spring and staying elevated
in December, the percentage of Americans who believe that religion is
increasing its influence on American life has retreated to 16%, in line with
pre-pandemic levels.
Line graph. Sixteen percent of U.S. adults say religion is increasing
its influence on American life, down from 38% in May 2020 and 27% in December
2020. In late 2018 and late 2019, a consistent 19% said religion was
increasing its influence. Eighty-two percent of U.S. adults now say religion is losing its influence,
up from 58% in April 2020. The latest results are based on Gallup's annual Values and Beliefs
poll, conducted May 3-18. The 2020 spike could have been a reaction to the
coronavirus pandemic, as Americans likely perceived people were turning to religion
to help them cope with the crisis. Every major subgroup of Americans showed an increased belief that
religion was becoming more influential in U.S. life last year, followed by a
sharp decline in those attitudes this year. As a result, nearly every group
has views that are similar today to what they were in 2019. Two notable
exceptions are Republicans and Americans with no religious preference, as
both are now less likely to perceive religion as influential. Recent Changes in Perceptions That Religion Is Increasing Its
Influence on American Life, by Subgroup
Perceptions of Religious Influence Near
Record Low Gallup has asked Americans to say whether religion is becoming more
influential for more than 60 years, including at least annually since 1997.
The current 16% who see religion as increasing its influence is just two
percentage points above the historical low point -- 14%, registered in 1969
and 1970 polls. For most of the trend, less than a majority of Americans have said
that religion is increasing its influence. One major exception came in the
wake of the 9/11 terrorist attacks in late 2001, when a record-high 71% of
U.S. adults thought religion was becoming more influential as the nation
dealt with that crisis and threat to safety. The 32-point increase in 2001
before and after 9/11 is the only surge in Gallup's trend bigger than the
19-point jump seen last year.
Line graph. In the more than 60 years Gallup has asked Americans
whether religion is increasing its influence on American life, there have
been only a few instances in which at least half have agreed. These include
69% in 1957, 71% in 2001 and 50% in 2005. Currently, 16% say it is increasing
its influence. Bottom Line Americans have long thought that religion is losing rather than
increasing its influence on U.S. society, but those views eased last year as
the U.S. dealt with the onset of the coronavirus pandemic. Now, with many
Americans vaccinated against the disease and COVID-19 infections falling,
U.S. public opinion on the influence of religion has returned to pre-pandemic
levels, sitting just slightly above the historical low point. These results come as more
Americans attend church in person than did so a year ago, but at a
time when reports of church attendance still lag behind what they were before
the pandemic and remain lower than in previous decades. Additionally, the
percentage of U.S. adults who belong
to a formal place of worship has fallen below the majority level for
the first time. With increasing numbers of U.S. adults, particularly young
adults, lacking
a religious affiliation, the likelihood of religion becoming more
influential seems low. However, as Gallup's trends show, in times of national
crisis Americans perceive that religion is becoming more influential, at
least temporarily. (Gallup USA) JUNE 21, 2021 Source: https://news.gallup.com/poll/351329/pandemic-eases-fewer-religion-gaining-influence.aspx 695-696-43-24/Poll 45% Of Gen Z Adults And 40% Of Millennials Have Interacted With
Content On Social Platforms That Focuses On The Need For Action On Climate
Change
Gen Z and Millennial social media users are more likely than older
generations online to engage with climate change content on social media and
to express a range of emotions when they see climate-related content there –
including anxiety about the future and anger that not enough is being done,
according to a new Pew
Research Center survey.
Younger adults have taken on prominent roles in efforts to stop
climate change, with groups and individuals such as climate activist Greta
Thunberg and the Sunrise
Movement among those working to address the issue. Among U.S. social media users, 45% of Gen Z adults and 40% of
Millennials have interacted with content on social platforms that focuses on
the need for action on climate change by following an account, liking or commenting
on a post, or posting or sharing content about the need for action on climate
change. By contrast, much smaller shares of Gen X (27%) and Baby Boomer and
older social media users (21%) have engaged with content about climate change
in any of these ways.
Gen Z adults, born
after 1996, have lived their whole lives in an internet and social media
era. These young adults, along with the Millennial generation, were among the
first to incorporate social media use into their everyday lives and are much
more likely than older generations to say they are
online “almost constantly.” Gen Zers and Millennials express intense emotional reactions to
seeing climate change content on social platforms compared with older
generations. For instance, majorities of Gen Z (69%) and Millennial social
media users (59%) say it made them feel anxious about the future the last
time they saw content on social media about addressing climate change. Fewer
than half of Gen X (46%) and Baby Boomer and older social media users (41%)
say they felt this way the last time they saw climate content. Similarly, Gen
Zers and Millennials are more likely than older social media users to say
they felt angry the last time they saw climate content because not enough is
being done to address the issue. Generations also differ when it comes to positive emotional
reactions: 54% of Gen Z and 53% of Millennial social media users say they
felt motivated to learn more about climate change issues the last time they
saw climate content on social platforms, compared with 43% of Gen X and 39%
of Baby Boomer and older users.
Those social media users who engage with climate change content
online – a group that skews younger than the general population – stand out
from those who do not engage online in their views about a range of
climate-related policies. Among climate-engaged social media users, 73% favor phasing out the
production of new gasoline-powered cars and trucks by the year 2035, and 54%
think the U.S. should phase out the use of fossil fuels in energy production
entirely. By contrast, much smaller shares of social media users who do not
engage with climate content support either of these two proposals (39% and
27%, respectively). And when it comes to the approach of the Biden administration on
climate issues, a majority of the social media climate-engaged (58%) think
the administration will not go far enough to reduce the effects of climate
change; far fewer among social media users who do not engage with climate
content express this view (36%). (PEW) JUNE 21, 2021 695-696-43-25/Poll About Four-In-Ten Adults With Lower Incomes Do Not Have Home
Broadband Services (43%) Or A Desktop Or Laptop Computer (41%)
More than 30 years after the debut of the World
Wide Web, internet use, broadband adoption and smartphone ownership have
grown rapidly for all Americans – including those who are less
well-off financially. However, the digital lives of Americans with lower and
higher incomes remain markedly different, according to a Pew Research Center
survey of U.S. adults conducted Jan. 25-Feb. 8, 2021. In fact, the shares of
Americans in each income tier who have home broadband or a smartphone have
not significantly changed from 2019 to 2021.
Roughly a quarter of adults with household incomes below $30,000 a
year (24%) say they don’t own a smartphone. About four-in-ten adults with
lower incomes do not have home broadband services (43%) or a desktop or
laptop computer (41%). And a majority of Americans with lower incomes are not
tablet owners. By comparison, each of these technologies is nearly ubiquitous
among adults in households earning $100,000 or more a year. Americans with higher household incomes are also more likely to have
multiple devices that enable them to go online. Roughly six-in-ten adults
living in households earning $100,000 or more a year (63%) report having home
broadband services, a smartphone, a desktop or laptop computer and a tablet, compared with 23% of
those living in lower-income households. Conversely, 13% of adults with household incomes below $30,000 a year
do not have access to any of these technologies at home, while only 1% of
adults from households making $100,000 or more a year report a similar lack
of access.
With fewer options for online access at their disposal, Americans
with lower incomes are relying more on smartphones. As of early 2021, 27% of
adults living in households earning less than $30,000 a year are
smartphone-only internet users – meaning they own a smartphone but do not
have broadband internet at home. This represents a substantial increase from
12% in 2013. In contrast, only 6% of those living in households earning
$100,000 or more fall into this category in 2021. These shares are
statistically unchanged since 2019, when the Center last polled on this
topic. This reliance on smartphones also means that the less affluent are
more likely to use them for tasks traditionally reserved for larger screens.
For example, smartphone owners with lower incomes were especially likely to
use their mobile device when seeking out and applying for jobs, according to
a 2015
Pew Research Center report. The disparity in online access is also apparent in what has been
called the “homework gap” – the gap between school-age children who have
access to high-speed internet at home and those who don’t. In 2015, 35% of
lower-income households with school-age children did not have a broadband
internet connection at home, according to a Pew
Research Center analysis of U.S. Census Bureau data. The digital divide has been a central topic in tech circles for
decades, with researchers, advocates and policymakers examining this issue.
However, this topic has gained special
attention during the coronavirus
outbreak as much of daily life (such as work and school)
moved online, leaving families with lower incomes more likely to face
obstacles in navigating this increasing digital environment. For
example, in April 2020, 59%
of parents with lower incomes who had children in schools that were
remote due to the pandemic said their children would likely face at least one
of three digital obstacles to their schooling, such as a lack of reliable
internet at home, no computer at home, or needing to use a smartphone to
complete schoolwork. (PEW) JUNE 22, 2021 695-696-43-26/Poll Nearly Nine-In-Ten U.S. Adults Who Were Raised Jewish (88%) Are Still
Jewish Today
The American Jewish population, like other religious groups, is in
constant flux. Some people who were raised as Jews have left the religion,
while some who were raised outside the faith now identify with it. Many
others have switched denominations within Judaism
– a trend that has seen the Reform movement grow modestly and Conservative
Judaism experience a net loss, according to a recent Pew
Research Center survey. Overall, nearly nine-in-ten U.S. adults who were raised Jewish (88%)
are still Jewish today. This includes 70% who identify with the Jewish
religion and 18% who don’t identify with any religion but who consider
themselves Jewish in some other way, such as culturally, ethnically or by
family background.
On the other hand, 12% of U.S. adults who were raised as Jewish are
no longer Jewish, including 5% who are now Christians. The “retention rate” is higher among people who say they were brought
up in the Jewish religion than it is among those who were raised as atheist,
agnostic or no particular religion, but who had a Jewish parent and were
raised as Jewish in some other way, such as culturally or ethnically. Nine-in-ten
of these “Jews by religion” are still Jewish today, compared with 76% of
those were raised as “Jews of no religion.” How do these figures compare with the retention rates of other
religious groups? We don’t have an exact apples-to-apples comparison because
Jews view their identity as a matter not just of religion but also of ancestry
and culture. Other U.S. religious groups, such as Protestants and
Catholics, are defined in Pew Research Center surveys solely by
identification with a religion. (That is why there is a “Jews of no religion”
category but not a “Protestants of no religion” category, for example.) Given this imbalance, perhaps the fairest comparison focuses on the
percentage of people raised as Jews by religion who are still Jews by religion (76%). That
figure is roughly
on par with the retention rates among U.S. Hindus and Muslims and
higher than the retention rates among evangelical Protestants and Catholics,
according to the Center’s 2014 U.S. Religious Landscape Study. It’s important
to note, however, that the 2014 survey was conducted by telephone, unlike the
new survey of U.S. Jews, which was conducted online and by mail. Changes in
survey mode can
affect results. Switching has resulted in gains for some
branches of Judaism Within Judaism, denominational switching has led to the largest net
losses for the Conservative movement, which, in the 1950s and 1960s, was the
largest branch of American Jewry.
In the new survey, a quarter of adults who are currently Jewish or
were raised that way say they were brought up in Conservative Judaism, while
15% identify as Conservative Jews today. For every person who has joined
Conservative Judaism, nearly three people who were raised in the Conservative
movement have left it. By contrast, Reform Judaism – now the largest American Jewish
denomination – has experienced a net gain due to religious switching; 28% of
current or former U.S. Jews say they were raised as Reform Jews, while 33%
currently identify with the Reform movement. Jews with no denominational affiliation also have experienced a net
gain. About one-in-six current or former U.S. Jews (17%) say they were raised
in no particular branch of Judaism, while 29% currently identify with no
branch. For every person who has left this group (either to join another
branch or to leave Judaism altogether), nearly three people have joined the
ranks of U.S. Jews who do not affiliate with any particular Jewish
denomination. Meanwhile, one-in-ten current or former U.S. Jews say they were
raised in Orthodox Judaism, and 8% currently identify as Orthodox.
Despite this small net loss from denominational switching, some social
scientists project that the Orthodox share of the Jewish population is likely to
increase in the future, because Orthodox Jews are younger and have a
higher fertility rate than non-Orthodox Jews, on average. Orthodox and Reform Judaism have the
highest retention rates Another way of examining changes in denominational affiliation is to
calculate retention rates: Among adults who were raised in a given branch of
Judaism, what percentage still identify with that branch today? And where did
the rest go?
Orthodox and Reform Judaism have the highest retention rates of the
three major branches. Two-thirds of adults who were raised as Orthodox (67%)
and Reform Jews (65%) still identify with those branches, respectively. The
retention rate of Conservative Judaism is lower: About four-in-ten people
raised as Conservative Jews (42%) continue to identify with Conservative
Judaism as adults. Adults who no longer identify with their childhood denomination tend
to have moved in the direction of less traditional, more theologically
liberal forms of Judaism – or to have left Judaism altogether – rather than
in the direction of more traditional branches. For example, 57% of people
raised within Conservative Judaism now either identify with Reform Judaism
(30%), don’t identify with any particular branch of Judaism (15%) or are no
longer Jewish (7%), while only 2% now identify with Orthodox Judaism. Many Reform Jews were raised in more
traditional branches Yet another way of looking at denominational switching is to
calculate “accession rates”: Among adults who identify with a given branch of
Judaism today, what percentage were not raised
in that branch, and where did they come from?
Most Orthodox Jewish adults (85%) and Conservative Jewish adults
(68%) were raised in their current denomination. In other words, just 15% of
today’s Orthodox Jews came from outside Orthodoxy, including 5% who were
raised as Conservative and 2% who were raised as Reform. Meanwhile, about a
third of today’s Conservative Jews (32%) were not raised in that movement, including 6% who were
brought up as Orthodox and 8% who were raised as Reform. The Reform movement has a somewhat higher accession rate. Nearly half
(46%) of today’s Reform Jews have come from outside the Reform movement. A
quarter of today’s Reform Jews were raised as either Conservative (22%) or
Orthodox (3%). The group with the highest accession rate, however, is Jews with no
denominational affiliation. Two-thirds (66%) of adults in this category were
raised in other groups, including 13% who were raised as Conservative Jews,
14% who were raised as Reform Jews and 33% who say they were not raised as Jewish
at all (though most say they had a Jewish parent). A relatively small proportion of respondents identify as Jewish today
but say they did not have a Jewish parent and were not raised Jewish in any
way. This group makes up 8% of adult Conservative Jews, 7% of Reform Jews, 2%
of Jews with no denominational affiliation and 1% of Orthodox Jews. The
survey did not ask whether they have gone through a formal Jewish conversion. (PEW) JUNE 22, 2021 695-696-43-27/Poll About Six-In-Ten U.S Adults (63%) Have A “Very” Or “Mostly” Favorable
Opinion Of Pope Francis
Pope Francis’ popularity
dropped in the United States a few years ago amid a sex abuse crisis
in the U.S. Catholic Church. But Americans’ opinions of the pontiff have
since rebounded, and between February 2020 and March 2021 – 13 months
that included moves by Francis to expand
the role of women in the church as well as a widening debate about
whether President Joe Biden should
be denied Communion – views toward Francis remained fairly stable. About six-in-ten U.S adults (63%) have a “very” or “mostly” favorable
opinion of Pope Francis, according to a Pew Research Center survey conducted
in March using the Center’s online American
Trends Panel. This is nearly identical to the share of adults who had a
favorable view of Francis in February 2020 (64%). The pope’s favorability also has remained steady among U.S.
Catholics, with 82% of Catholics in both the March 2021 and February 2020
surveys saying they have a favorable opinion of the pope. These March 2021 and February 2020 results are not entirely
comparable to figures from earlier surveys the Center conducted by telephone.
Online and phone surveys sometimes produce
disparate results, a polling phenomenon called a mode
effect. One key difference is that online polls tend to result in fewer
respondents declining to answer the question if there are fewer
opportunities to express “no opinion.” This analysis indicates that any
change in the results between January 2020 (when this question was last asked
on the phone) and March 2021 was likely due to fewer people declining to give
an opinion on the web survey.
How does the shift from phone to web
surveys affect opinions of Pope Francis?
Views of Pope Francis have remained fairly stable among Catholic
subgroups, too. For example, Catholics who identify as Democrats or who lean
toward that party continue to have a more positive opinion of Francis than
their Republican counterparts, a partisan pattern that has held since 2018.
In the latest survey, 90% of Catholic Democrats expressed a favorable opinion
of the pope, compared with 73% of Catholic Republicans and GOP leaners. Moreover, the latest survey finds little difference in opinions of
Francis among Catholics who attend Mass regularly and those who go less often
– consistent with patterns seen in previous years. Among weekly Mass-goers,
84% said in March that they have a very or mostly favorable opinion of the
pope, as did 82% of Catholics who attend Mass less often, including those who
say they never go.
Among non-Catholics, views about Pope Francis also have not changed
much. In the March survey, majorities of White Protestants who do not
identify as evangelical (70%), religiously unaffiliated adults (61%) and
Black Protestants (60%) say they have a favorable opinion of him. White
evangelical Protestants are more divided in their opinion of the pontiff,
with similar shares expressing favorable (45%) and unfavorable (47%) views.
Due to sample size limitations, this analysis does not separately report on
some smaller religious groups, including Jewish and Muslim Americans. (PEW) JUNE 25, 2021 695-696-43-28/Poll The Housing Crisis In Canada: Three-Quarters (75%) Of Canadians Who
Don’t Own A Home But Want To Buy One, Say They Can’t Afford To
Toronto, Ontario, June 16, 2021 — A
new Ipsos poll conducted on behalf of Manulife Bank reveals that there might
be an affordability crisis in Canada, with many struggling to keep up with
the cost of living or admitting that home ownership has become a pipe dream
for them. The situation has developed into a tragedy for many prospective
homeowners, as three-quarters (75%) of those who do not own a home but want
to buy one feel like they can’t afford to do so. What’s more, most (71%) of
those who do not own a home worry about saving up for one, including four in
ten (39%) who worry a lot about this. Even many of those who were able to purchase a home, struggled to do
so. As many as one in three (33%) Canadian homeowners (aged 20-69, HHOLD
income $40k+) admit they needed help from their parents, when purchasing
their first home. The younger generations in particular are having more
difficulty purchasing their first home, as nearly half of all Gen Z (aged
18-24) and Millennial (aged 25-40) homeowners needed help from their parents.
The older generations have felt the strain, as well, with nearly one in ten
(7%) claiming to have helped their adult children purchase a home, during the
pandemic. Five percent (5%) of those with a mortgage even went one step
further and used equity from their own home to help their adult children
purchase a home. The survey yields evidence suggesting that wages might not be keeping
up with inflation, as three in five (61%) Canadians (aged 20-69, HHOLD income
$40k+) report that the cost of living for their household has increased, over
the past year, and half (51%) of those with mortgages worry about making the
payments. Two-thirds (67%) worry about housing prices in their local
community, suggesting that many can no longer afford to purchase a home in
the community in which they live and would have to move elsewhere, to do so.
Given the current housing market situation, it follows that a vast majority
(85%) of those who have young children are worried about the future
affordability of real-estate for their children when they are ready for home
ownership. While there are plenty of reasons to be concerned about the
affordability of life in Canada, the data suggests many could be doing a
better job at financial planning and management. Indeed, most (72%) Canadians
(aged 20-69, HHOLD income $40k+) do not have a written financial plan. And
only about one-third (35%) of those who are in debt have an established
strategy to repay their debts. (Ipsos Canada) 17 June 2021 695-696-43-29/Poll Eight In Ten (82%) Canadians Vaccinated Or Awaiting Vaccine;
Remaining 18% Need To Be Convinced
Toronto, ON, June 18, 2021 – Prime
Minister Trudeau introduced the phrase ‘one-dose summer’ to Canadians’
vocabulary in mid-May, raising hopes of this summer being a return to some
kind of normal, but dependent on the state of vaccination across the country.
A recent Ipsos poll on behalf of Global News has found while over eight in
ten (83%) Canadians adults say they have received at least one dose of a
COVID-19 vaccine or are interested in getting vaccinated, there remains a
sizeable portion still hesitant to roll up their sleeves. Vaccine hesitancy
remains a challenge to the large-scale public health effort underway in
hospitals, pharmacies, convention centres, and stadia all over the country. Five Million Adults May Go Unvaccinated,
Especially Women and Younger Canadians The poll found that nearly three-quarters (73%) of Canadian adults
say they have received at least one dose of a vaccine and another 10% say
that they would like to be vaccinated. With the most recent data from the
Government of Canada indicating that 70% of those aged 12 years and older
have received at least one dose,[1] these
findings are in line with overall population trends. However, the remaining two in ten (18%) are vaccine hesitant, meaning
that they are either unsure whether they will get the vaccine (9%) or that
they are ‘definitely not’ getting the vaccine (9%). This skepticism (or in
some cases flat-out refusal) means that as many as five million adult
Canadians may not receive the vaccine, posing a major challenge to mass
vaccination efforts. Women are more likely than men to express these vaccine-hesitant
attitudes (20% v. 14%) and are also more likely to say that they are
‘definitely not’ getting the vaccine (11% v. 6%). In addition, younger
Canadians are also showing signs of being more hesitant towards the COVID-19
vaccine than older age groups. Self-reported vaccination rates in younger age
groups trail behind those of older age groups, partially due to the vaccine
only being available very recently to these groups. However, even when
accounting for these who say they have not yet been vaccinated but want to
be, a quarter (25%) of Canadians aged 18-34 express reluctance towards the
COVID-19 vaccine, compared to 18% of those aged 35-54 and 11% of those aged
55+ years. Have you received a vaccination against
COVID-19?
How High Can We Go? As shipments of vaccines continue to arrive, the question remains as
to how high of a vaccination rate can Canada achieve. This aversion may be
rooted in concerns ranging from personal religious beliefs to skepticism
towards a vaccine that was developed and approved so quickly. When presented with various incentives, such as a chance to win $1
million in a lottery, cash reward valued at $100, and a paid day off from
work, roughly half of unvaccinated Canadians could be convinced to change
their minds. Incentives to Motivate Getting a COVID-19
Vaccine (among those having not yet received a
vaccine dose)
If offered a chance at an Alberta-style lottery drawing of $1
million, over one-third (35%) say they would get the vaccine, with another
21% saying that they maybe would get vaccinated. This means that 45% of
unvaccinated Canadians would still turn down the chance to become a
millionaire if it meant getting the COVID-19 vaccine. Manitoba has opted for
a similar approach, but instead offering several prizes of $100,000. If
offered this option, three in ten (31%) unvaccinated Canadians would choose
to get the vaccine, with another 25% who could be swayed. Even if unvaccinated Canadians may not be the gambling type,
preferring instead a guaranteed payout instead of entering a lottery, only
one-third (32%) say a cash or reward valued at $100 would be enough for them
to get the vaccine and another 25% say they could be convinced. This leaves
43% of those who have not yet received the COVID-19 vaccine saying they could
not even be motivated to do so by a guaranteed payment of $100. As Canada tries to break records in terms of proportion of the
population that is vaccinated, the fact that a significant number of
individuals appear to be unmoved by monetary incentives hints at underlying
barriers to vaccination for a small minority of Canadians that may not be so
easily overcome. (Ipsos Canada) 18 June 2021 Source: https://www.ipsos.com/en-ca/news-polls/Eight-in-Ten-Canadians-Vaccinated-Remaining-Need-Convinced 695-696-43-30/Poll Half (51%) Of Canadians Anxious About Returning To Normal Life
Following The Pandemic, Though Cautious Optimism Evident
Toronto, ON, June 19, 2021 – Summer
2021 has many of the markers of a typical Canadian summer: daylight hours are
getting longer, the school year is ending, and restaurant patios are opening.
However, the COVID-19 pandemic has had a lasting impact on Canadians, though
there is evidence that the country has cautious optimism about moving forward
over the coming months. A recent Ipsos poll on conducted on behalf of Global News finds that
half (51%) of Canadians feel nervous about resuming normal activities
post-pandemic, and a third (35%) feel their province is re-opening too
quickly, suggesting that there may be a ways to go before we truly feel
“normal” again, and mixed feelings when it comes to changes many may have
been looking forward to for over a year. Canadians Anxious about Returning to New
Normal, Despite Recent Improvements in Mental Health Ipsos data shows that Canadians are divided on how they feel about
returning to normal life: half (51%) of Canadians agree that they feel
anxious about resuming normal activities, while 49% disagree. Notably, those
in Quebec are more likely to feel relaxed about their new normal (only 36%
report feeling anxious about resuming normal activities vs. 51% SK/MB, 51%
ATL, 53% AB, 56% ON, 62% BC), in line with many of the province’s major urban
areas having recently moved into the second-lowest stage of COVID-19 alert
(and all other areas in the lowest). There is also a pronounced difference by age when it comes to anxiety
about the future: younger people are more likely to say they feel anxious
about resuming normal activities: (58% among ages 18-34 v. 47% 35-54, 50%
55+). Greater likelihood among older Canadians to have more stable income,
more developed social support networks, and employment stability or
flexibility may have contributed to the confidence among this group when it
comes to mental health impacts of the pandemic. Despite these feelings of anxiety, a majority of Canadians have
noticed a difference in their mental health as the country begins to return
to the “new normal”: 71% reported that their mental health is improving as
vaccinations become more widespread and things re-open. This is positive news
considering half of Canadians are considered “high risk” in terms of mental
health, according to recent Ipsos data from March 2021.[1] Most Confident in Upcoming Plans, Younger
Canadians More Hesitant Seven in ten (68%) Canadians agree that they are confident in their
province’s reopening plan, though not emphatically – while 54% say they
somewhat agree, just 13% say they strongly agree, suggesting a cautious
optimism about the future. Women (75%) report feeling more confident than men
(61%) in their province’s reopening plan. Those in Quebec (84%), British
Columbia (81%), and Atlantic Canada (76%) are significantly more likely to
agree that they are confident in their province’s reopening plan compared to
other regions, especially Alberta (43%) and those in the Prairies
(Saskatchewan and Manitoba, 53%). Younger people were again more likely to be cautious: 60% of those
aged 18-34 feel confident in their province’s reopening plan, a lower portion
than among those in older age groups (70% 35-54, 71% 55+). In addition to feeling confident in
their province’s plan, most Canadians also feel comfortable with the pace of
reopening (65%), though a third (35%) of Canadians feel that their province
is reopening too fast. Consistent with the tentative confidence surrounding
reopening plans, sentiment is not extreme; there are relatively few (19%) who
strongly disagree that their province is re-opening too fast. However, there are key regional differences about the pace of
reopening, in line with the different experiences with COVID-19 across the
country. Compared to the rest of Canada, in which the portion of those
agreeing that their province is re-opening too fast ranges between 30% and
38%, over half (53%) of those in Alberta feel the reopening is happening too
quickly. This caution among Albertans is unsurprising, given their recent
experiences with high COVID-19 caseloads over the last year, and the
potential contradiction between having a significant COVID-19 caseload in
early 2021 while also having a re-opening target of early June. Contrary to the idea that younger Canadians may be eager to return to
socializing in public venues, younger people are also more likely to feel
that their province is reopening too fast (44% agree) compared to those in
older age groups, especially those ages 55 and older, among whom 29% agreed
that their province is reopening too fast. Younger Canadians’ hesitancy about
reopening overall may be, in part, explained by their greater likelihood to
be returning to school, to be among those working essential, front-line
services in retail, and to be last in line when it comes to receiving their
vaccines compared to older age groups. Canadians Negotiating What Measures Are
Needed for the Return to Work For many, the return to normal also means a return to the office.
Over half (56%) of working Canadians agreed that their workplace should make
vaccination a condition of employment. However, when it comes to other safety
measures, including working from home regularly, there is only lukewarm
agreement. Three in ten (28%) of Canadians agree that if their workplace
doesn’t allow them to work from home at least once a week, they would
consider quitting. Younger Canadians were far more likely to feel strongly
about work from home measures for returning to work post-COVID: 42% of those
aged 18-35 agreed that if their workplace does not allow them to work from
home at least once a week, they would consider quitting. Compared to the
national average, this suggests that upcoming generations of workers will
want to see greater flexibility in their working arrangements into the future
and may be more willing to take a hard stance if needed. (Ipsos Canada) 19 June 2021 695-696-43-31/Poll One Quarter Of Canadians (26%) Are Not Confident That Their Family
Would Be Able To Pay For Mortgage/Rent/Housing Costs, If They Were To Pass
Away
Toronto, ON, June 22, 2021 — Over
the course of the pandemic, Canadians admit they are having more frequent
conversations about important topics. According to a recent survey study done
by Ipsos, over half of Canadian parents (56%) are having more frequent
conversations about their children’s future. Additional conversations include
concerns about finances/financial goals/debt (38%), and family’s financial
security if they were to pass away (28%). The survey found that six in ten (63%) believe insurance coverage is
a way to take control over an unpredictable situation. However, more than
one-third (35%) of Canadians say they do not have life insurance. Lack of Financial Confidence While a majority of Canadians express confidence in their family’s
ability to manage financially without them, if they were to pass away without
life insurance, there remains a significant portion of Canadians who are not
confident in their family’s ability to manage. A quarter (26%) of Canadians
are not confident their family would be able to pay for the
mortgage/rent/housing costs if they were to pass away. Those aged 35-54 are the least confident in their family’s ability in
paying for things such as childcare expenses (33%), housing costs (32%),
food, clothing, and other necessities (22%). Understanding Life Insurance Over the course of the past year, a third (28%) of Canadians indicate
they have been evaluating their insurance coverage. However, many Canadians still
do not understand the different types of life insurance policies that are
available to them. Nearly four in ten do not understand term life insurance
(38%) or whole life/permanent life insurance (39%). The knowledge gap becomes
larger for universal life insurance and term-to-100 life insurance. A
majority do not understand universal life insurance (51%), or term-to-100
(56%). (Ipsos Canada) 22 June 2021 AUSTRALIA
695-696-43-32/Poll Over 2 Million Australians Are Now Reading Puzzle Magazines – Up An
Exceptional 492,000 (+30.8%) From A Year Ago
New research from Roy Morgan shows puzzle
magazines are now read by over 2 million Australians aged 14+ in an average
month, a significant increase of 492,000 (+30.8%) from a year ago and the
growth is driven by Millennials and Generation Z. Leading puzzle magazines are often closely associated with a higher
circulation magazine such as Take 5, Australian Women’s Weekly, Woman’s Day,
Better Homes and Gardens, That’s Life and New Idea and help to raise the
profile, and readership, of the primary magazine. Leading puzzle magazines measured include Take 5 Mega Puzzler, Take 5
Pocket Puzzler, Australian Women’s Weekly Puzzle Book, Woman’s Day Superpuzzler,
Better Homes and Gardens Puzzle Book, That’s Life Bumper Puzzle, That’s Life
Puzzler on the Go, New Idea Jumbo Puzzler, New Idea Mr. Wisdom’s Whopper and
Lovatts Puzzle Magazines. Women are the biggest readers of puzzle
magazines, but men are up most from a year ago Women are the most avid readers of puzzle magazines – now read by
1,268,000 women, up 173,000 (+15.8%) from a year ago. However, readership of
puzzle magazines by men has increased far faster and is up by 320,000
(+63.5%) to 824,000. Roy Morgan’s readership figures are based on in-depth personal
interviews with over 60,000 Australians over the last 12 months including
around 5,000 interviews each month. The full Roy Morgan March 2021 magazine
readership figures are available to view
here. Readership of puzzle magazines by Gender
& Generations: March 2020 vs. March 2021
Millennials and Generation Z drive growth
in puzzle magazine readership during pandemic The strong growth in readership of puzzle magazines has been driven
by the two youngest generations. In fact, readership of puzzle magazines has
more than doubled over the past year for both Millennials and Generation Z –
roughly those aged under 45 years of age. There are now 575,000 Millennials reading puzzle magazines, up
291,000 (+102.2%) from a year ago, and 553,000 Gen Z reading puzzle
magazines, up 285,000 (+106.0%) on a year ago. The nation-wide lockdowns caused by the COVID-19 pandemic during 2020
has provided a definite boost to readership of puzzle magazines among younger
Australians although this surge in readership for those aged under 45 has not
been replicated for older generations. There has also been growth among Gen X with 349,000 now reading
Puzzle Magazines, up 53,000 (+17.8%) from a year ago, but older generations
have not seen growth over the last year. A year ago, Baby Boomers were the biggest readers of Puzzle
Magazines, but this has fallen slightly from a year ago to 437,000, down
48,000 (-10.0%). There has been an even bigger decline amongst the older
Pre-Boomers down 87,000 (-32.9%) to a readership of 178,000 in this
generation. Take 5 Mega Puzzler and Australian Women’s
Weekly Puzzle Book are the top puzzle magazines A look at the leading puzzle magazine titles shows that Take 5 Mega
Puzzler is the leader with a readership of 430,000, an increase of 63,000
(+17.2%) on a year ago. In a clear second place is Australian Women’s Weekly
Puzzle Book with a readership of 375,000 and with the biggest increase of
166,000 (+79.6%) on a year ago. Two further widely read puzzle magazines are Woman’s Day Superpuzzler
with a readership of 309,000, an increase of 104,000 (+50.6%) on a year ago
and Take 5 Pocket Puzzler just behind on a readership of 302,000, up 30,000
(+11.0%). Readership of leading puzzle magazines:
March 2021 vs. March 2020
Michele Levine, CEO, Roy Morgan, says the
COVID-19 pandemic and the requirement to stay at home for extended periods
due to lockdowns, as well as in the interests of personal safety, has seen
readership of puzzle magazines soar – particularly among younger Australians: “New Roy Morgan research shows puzzle
magazines have been one of the big winners out of the COVID-19 pandemic with
readership up nearly half-a-million (+30.8%) from a year ago to over 2
million in the year to March 2021. “The big driver of the increase has been
soaring readership of puzzle magazines amongst younger Australians with
readership amongst Millennials and Generation Z both more than doubling from
a year ago. Now 575,000 Millennials (aged 30-45) and 553,000 Generation Z
(under 30) read print magazines in an average month. “Younger demographics now comprise over 50%
of the readership of puzzle magazines – up from around a third a year ago
before the COVID-19 pandemic began. As the vaccinations continue to roll out
around Australia over the next few months and life returns to a
‘COVID-normal’ the publishers of puzzle magazines will need to work extra
hard to retain their new-found audience. “Take 5 Mega Puzzler has been Australia’s
most widely read puzzle magazine for some time now and has an impressive
readership of 430,000 – up 63,000 (+17.2%) on a year ago. The biggest
increases over the last year have been for Australian Women’s Weekly Puzzle
Book, up 166,000 (+79.6%) to 375,000 and for Better Homes & Gardens
Puzzle Book, up 125,000 (+88.4%) to 267,000. “As well as these top-line readership
figures Roy Morgan collects in-depth data on Australia’s puzzle magazine
readers that provides publishers and advertisers with the ability to
precisely target existing and potential customers.” (Roy Morgan) June 21 2021 695-696-43-33/Poll ALP (50.5%) Leads L-NP (49.5%) On A Two-Party Preferred Basis – No
Bounce For Pm From G7 Trip
ALP support is now 50.5% (down 0.5% points
since early June) cf. L-NP on 49.5% (up 0.5% points) on a two-party preferred
basis following Prime Minister Scott Morrison’s overseas trip to the G7 in
the United Kingdom according to the latest Morgan Poll on Federal voting
intention. If a Federal Election were held now it would be too close to call
with a higher than usual 7.5% of electors undecided about who they would vote
for and with the real possibility Australia would have a hung Parliament for
the first time in nearly a decade. Normally around 3-4% of electors can’t say
who they would vote for. Interviewing for the latest Morgan Poll was conducted over the
weekends of June 12/13 & June 19/20, 2021 with a nationally
representative cross-section of 2,782 Australian electors using a
combination of telephone and online interviews (multi-mode).
Primary support for the L-NP increased 1.5% points to 41.5% compared
to the ALP on 34.5% (down 1% point). Greens support was up 0.5% points to
12%. Support for One Nation was up 0.5% points to 3.5% while support for
Independents/Others has dropped by 1.5% points to 8.5%.
Voting analysis by State shows the ALP’s national two-party preferred
lead is built upon a strong two-party preferred result in Victoria with the
ALP 55% (up 1.5% points since early June) cf. L-NP 45% (down 1.5% points)
after the State emerged from a short two-week lockdown in mid-June. This result represents a swing of 1.9% points to the ALP in Victoria
since the 2019 Federal Election. However, the L-NP leads in Australia’s other three largest States. In
NSW the L-NP holds a narrow two-party preferred lead of L-NP 51% (up 1.5%
points since early June) cf. ALP 49% (down 1.5% points). Despite the L-NP’s
lead this result represents a swing of 0.8% points to the ALP since the 2019
Federal Election. The L-NP has its strongest result In Queensland with a large lead of
L-NP 56% (up 3% points since early June) cf. ALP 44% (down 3% points) on a
two-party preferred basis. However, despite this comfortable lead this
represents a swing of 2.4% points to the ALP since the 2019 Federal Election. In Western Australia the L-NP holds a two-party preferred lead of
L-NP 52% (up 1% point since early June) cf. ALP 48% (down 1% point) which
represents a swing to ALP of 3.6% points since the 2019 Federal Election. The ALP holds a two-party preferred lead in the smaller States with
the ALP 52% (up 2.5% points since early June) cf. L-NP 48% (down 2.5% points)
in South Australia, a swing of 1.3% points to the ALP since the 2019 Federal
Election and in Tasmania the ALP 57% cf. L-NP 43% - a swing of 1% point to
the ALP since the 2019 Federal Election.
The Roy Morgan Government Confidence Rating is up 1pt from early June
to 114. Now 49% (up 0.5% points since early June) of Australians say the
country is ‘heading in the right direction’, while slightly more than a
third, 35% (down 0.5% points) say the country is ‘heading in the wrong
direction’. The latest Government Confidence Ratings by State paint a contrasting
picture and is above average in the three States with majority support for
the L-NP, and below average for those supporting the ALP. Government Confidence in Western Australia is far higher than anywhere
else with a very high 127.5 in mid-June – more than 10pts above the national
figure. Government Confidence is also above average in Queensland at 118 and
NSW at 115.5 – although the latest outbreak of COVID-19 may dent this figure
in the next few weeks. In contrast, Government Confidence is below average in the three
States in which a majority of electors support the ALP including Tasmania and
South Australia (both 108.5) and Victoria on only 105 nearly 10pts below the
national average. Michele Levine, CEO, Roy Morgan says Prime Minister Scott Morrison’s
trip to the G7 Summit in Cornwall has provided only a small increase in
support for the L-NP with the ALP 50.5% still leading the L-NP 49.5% on a
two-party preferred basis: “Today’s Morgan Poll on Federal voting
intention shows the ALP (50.5%) maintaining its narrow two-party preferred
lead over the L-NP (49.5%) despite the media attention paid to the Prime
Minister’s trip to meet foreign leaders in the UK last week. Prime Minister
Morrison is now quarantining for two weeks in The Lodge. “There is certainly plenty for the Prime
Minister to think about during his stint in quarantine with Barnaby Joyce
returning as National Party Leader after more than three years on the
backbench and an outbreak of COVID-19 in NSW set to test that State’s ability
to handle the virus without resorting to city-wide or state-wide lockdowns. “The questions about Australia’s vaccine
roll-out are also continuing to mount with only around 3% of Australians now
fully vaccinated against COVID-19 compared to around 50% in the UK and USA
and even 7% in nearest neighbour New Zealand. “The slow vaccine rollout is being used by
States such as Victoria to justify the recent two-week lockdown and also
domestic State border closures in response to any outbreaks. The most recent
example of this is the targeted border closures of several States to certain
suburbs of Sydney in response to the current outbreak concentrated in
Sydney’s Eastern suburbs. “A look at the voting figures on a
State-by-State basis continues to show the ALP riding high in Victoria and
now leading by 10% points on a two-party preferred basis: ALP 55% cf. L-NP
45%. The ALP currently holds 21 seats in Victoria compared to 15 for the
L-NP. “The ALP’s strength in Victoria underlies
their national competitiveness with the L-NP leading on a two-party preferred
basis in New South Wales, Queensland and Western Australia in which the L-NP
holds 55 seats compared to 35 for the ALP. “At present all signs point to another very
close election either later this year or early next year although there are
obvious risks for the Morrison Government with the vaccine roll-out
progressing at a slower rate than many had expected.” Electors were asked: “If an
election for the House of Representatives were held today – which party will
receive your first preference? and “Generally speaking, do you feel that things in Australia are
heading in the right direction or would you say things are seriously heading
in the wrong direction?” This Roy Morgan Poll on Federal voting intention and Roy Morgan
Government Confidence was conducted via telephone and online interviewing
last weekend. Roy Morgan interviewed 2,782 Australian electors aged 18+ on
the weekends of June 12/13 & June 19/20, 2021. A higher than usual 7.5%
of electors (up 2% points from early June) can’t say who they support. Australian Federal Voting Intention:
Two-Party Preferred (2019-2021)
Source: Roy Morgan Single Source. Average interviews per
fortnight n=2,000. May 2019–Jun 2021. Base:
Australian electors 18+. (Roy Morgan) June 23 2021 Source: https://www.roymorgan.com/findings/8736-federal-voting-intention-june-2021-202106230548 695-696-43-34/Poll In The 12 Months To March 2021 A Fast-Rising 38.8% Of Australians
Agree That ‘Credit Enables Me To Buy The Things I Want’ – An
Increase Of 12.4% Points From A Year Ago Pre-Covid-19
New research from Roy Morgan shows the COVID-19 pandemic has had a
big impact on key financial and shopping attitudes with big increases in
those willing to use credit to buy the things they want, who like being well
insured, who go out of their way for a bargain and more. In the 12 months to March 2021 a fast-rising 38.8% of Australians
agree that ‘Credit enables me to buy
the things I want’ – an increase of 12.4% points from a year
ago pre-COVID-19. This is the largest increase for any of the financial
attitudes covered here and suggests the long-term decline in usage of credit
is being reversed as alternative payment
systems such as Zip and Afterpay enter the market. The COVID-19 pandemic has also had a large impact on how Australians
conduct their banking and over three-fifths (60.1%) now agree ‘It would be ideal if I could conduct all my
banking without ever having to go to a Branch’ – an increase
of 9.8% points from a year ago pre-COVID-19. The stay-at-home orders and potential risk of catching COVID-19 while
out and about in the community has clearly diminished the attraction of
waiting in long queues at the local branch when the ease of use of websites
and apps to conduct banking transactions is easier than ever before. There is also good news for insurers with over three-quarters of
Australians, 75.5%, now agreeing that ‘I
like to be well insured’ – an increase of 6.2% points from a
year ago pre-COVID-19. There are other attitudes on which COVID-19 has had a lesser impact. Now 67.2% (up 4.3% points from a year ago) of Australians say
that ‘Recently I’ve cut down my
spending’, and slightly fewer, 57.6% (down 2.1% points) agree
that ‘I feel financially stable at
the moment’ – both movements in a negative direction but not
as great as one would have feared a year ago. The financial impact of COVID-19 hasn’t shaken people’s self-belief
about their own financial management with a virtually unchanged 73.5% of
Australians saying ‘I feel confident
about managing my finances’. The data comes from Roy Morgan Single Source, the nation’s largest
and longest-running program of research into consumer behaviour and
attitudes, continuously conducted year-round. Key financial attitudes: Pre COVID-19
(March 2020) vs. During COVID-19 (March 2021)
Compared to pre-COVID, Australians are more
likely to search for a bargain and try out new brands. COVID-19 has clearly had an impact on Australians’ attitudes towards
how they shop, and none bigger than increasing the bargain-hunting instincts
of many. Now a clear majority of 56% of Australians say ‘I’ll go out of my way in search of a
bargain’ – an increase of 11.9% points from a year ago
pre-COVID-19. From a low base there are now 18.2% who claim they were ‘born to shop’, an increase of 7.5%
points on a year ago pre-COVID-19. The strong retail sales figures over the
last year since the introduction of the $89 billion JobKeeper wage subsidy,
the increased JobSeeker rate and the $36 billion superannuation withdrawal
program have powered ABS retail sales figures to record highs since May 2019. The latest ABS
Retail Sales figures for April 2021 showed retail sales at a record
high of over $31 billion – or more than $1 billion per day. Australians are also increasingly looking for new brands with 56.6%,
up 5.7% points, saying ‘I am always
ready to try new and different products’ although also being
more cost-conscious than prior to the pandemic with nearly half, 44.7% (up
5.9% points) saying ‘I buy more
store’s own products than well-known brands’. Key shopping attitudes: Pre COVID-19 (March
2020) vs. During COVID-19 (March 2021)
The COVID-19 pandemic has had a huge impact
on our lives over the last year-and-a-half and some of the changes to the way
we think and act are set to prove enduring – including the way we deal with
financial decisions and how we shop says Roy Morgan CEO, Michele Levine: “The COVID-19 pandemic provided a huge
shock to the Australian economy and way of life in early 2020 and these
effects continue to linger on with attitudes to many financial questions and
shopping behaviours still changing. “Now over three-quarters of Australians
(75.5%) said they ‘like to be well insured’ – up significantly by 6.2% points
compared to pre-pandemic. The way Australians conduct their banking has also
been heavily impacted with 60.1% saying ‘It would be ideal if I could conduct
all my banking without ever having to go to a branch’ – up nearly 10% points
in only a year. “The desire to conduct all financial
affairs without heading into a branch has been a long-developing trend which
COVID-19 has accelerated as banking by website and app becomes increasingly
the norm. “However, perhaps the most interesting
trend over the past year has been the sharp increase in those Australians
saying that ‘Credit enables me to buy the things that I want’ – now at 38.8%
(up a large 12.4% points on pre-pandemic). “This is the largest increase for any
financial attitude and suggests that new forms of ‘credit’ such as the
‘buy-now-pay-later’ services Zip and Afterpay are now driving a change in
these attitudes alongside the financial challenges driven by the pandemic.
The latest Roy Morgan Digital Payments Report shows 72.4% of Australians are aware of
‘buy-now-pay-later’ services –
almost double the figure of 36.9% in less than three years ago in late 2018. “The increasing uptake of new digital
payment services that defer immediate payment plays into the changing
attitudes of shoppers. Now over half of Australians (56%) say ‘I will go out
of my way in search of a bargain’ – an increase of 11.9% points on
pre-pandemic. “Shoppers are also on the lookout for
bargains generally with 56.6% (up 5.7% points) saying ‘I am always ready to try
new and different products’ and 44.7% (up 5.9% points) saying ‘I buy more
store’s own products than well-known brands’. “Taken all together the changing attitudes
of Australians is being driven not only by the forced restrictions of the
COVID-19 pandemic with lockdowns and stay-at-home orders, but also the
increasing availability of new technology that enables frictionless banking
and shopping without having to even leave one’s house. “COVID-19 has accelerated these trends,
which were already evident pre-pandemic, and they present both great
opportunities to find new channels to reach potential customers, as well as
challenges to old ways of doing business.” (Roy Morgan) June 25 2021 Source: https://www.roymorgan.com/findings/8733-shopping-attitudes-march-2021-202106250709 695-696-43-35/Poll 60% Of Australians Believe That Giving Aid To Developing Nations Is
Good For Australia, Compared With 21% Who Believe That It Makes No Difference
Data collected by YouGov, the international data and polling company,
shows that Australians are inclined to think that sending aid to developing
nations is good for their country. 60% of Australians believe that giving aid
to developing nations is ‘good for Australia’, compared with 21% who believe
that it ‘makes no difference’, and just 12% that hold the opposite opinion
that such aid is ‘bad for Australia’. In turn, only half the British feel
this way, and a quarter thinks it makes no difference. Responses in Australia vary along gender and generational lines.
Women are more likely than men to see aid as a good thing for Australia (63%
compared to 58%), whereas men are more likely than women to think that
sending aid overseas makes no difference for the country (25% compared to
18%). Seven-in-ten of Generation Z (71%) think giving aid is beneficial for
Australia, whereas just over half of Baby Boomers (55%) hold the same
opinion. In contrast, ambivalence towards the effect of aid for Australia is
prevalent amongst the older demographic, with Baby Boomers (30%) and the
Silent generation (26%) thinking that giving aid does makes any difference
for the nation. This reflects a generational divide in how the role and
impact of aid is being perceived in Australia.
(YouGov Australia) June 23, 2021 Source: https://au.yougov.com/news/2021/06/23/aussies-are-more-likely-brits-think-giving-aid-dev/ MULTICOUNTRY
STUDIES
695-696-43-36/Poll Among 17 Advanced Economies A Median Of 22% Say They Have Confidence
In Putin To Do The Right Thing In World Affairs, Compared With A Median Of
74% Who Say They Have No Such Confidence
Russian President Vladimir Putin’s global image has been consistently
low for years in many countries, and a Pew Research Center survey conducted
this spring in 17 advanced economies shows that negative views of him are at
or near historic highs in most places. Today, a median of 22% say they have
confidence in Putin to do the right thing in world affairs, compared with a
median of 74% who say they have no such confidence. Singapore (55%), Greece (55%), Italy (36%) and Taiwan (34%) stand out
as the only places surveyed where roughly a third or more say they have
confidence in the Russian president. Confidence is lowest in Sweden (14%) and
the United States (16%). In both of these countries, as well as in the
Netherlands, the United Kingdom, Canada, Australia, France, New Zealand and
Belgium, at least 45% or more say they have no confidence at all in him. While confidence in Putin has been quite low in many countries for
much of the last decade –particularly following the annexation of Crimea in
2014 – it has dropped even further in the past year in Australia
(down 7 percentage points).
Across many places surveyed, younger people have more confidence in
Putin than their older counterparts. The largest difference by far is in
Japan (44 percentage points between the youngest and oldest respondents)
though there are differences of at least 20 points in the UK, Spain,
Australia, France and New Zealand. Though the difference is smaller in the
U.S., Americans under 30 are also more likely to have confidence in Putin,
with roughly a fifth of 18- to 29-year-olds saying so, compared with only 9%
of those 65 and older. These age-related patterns have often
been prevalent in views of Putin. And when it comes to opinion
about Russia more generally, younger adults also tend to have more
favorable views of the country than older people. In some countries, men are more confident in Putin than women. For
example, in Germany, 36% of men say they have confidence in Putin to do the
right thing in world affairs, while just 19% of women agree. Double-digit
differences are also present in France, Italy and Belgium, while gender
differences are smaller in Canada, Spain and New Zealand. Those with less
education also have more confidence in Putin than those with more education
in about half the countries surveyed. In Italy, for example, roughly a
quarter of those with a postsecondary degree or higher have confidence in
Putin, while nearly four-in-ten of those with no postsecondary degree have
confidence in him. Similar differences persist across eight other countries
polled.
In Europe, supporters
of populist parties, both right- and left-wing, are more likely to have
confidence in Putin than those who don’t support such parties. For example,
in Italy, those with a favorable view of right-wing Lega are more than twice
as likely to have confidence in Putin as those with an unfavorable view (62%
vs. 26%, respectively). The same goes for supporters of Forza Italia –
roughly half have confidence in Putin to do the right thing, while roughly a
quarter of nonsupporters say the same. In the U.S., Republicans and Republican-leaning independents tend to
have more confidence in Putin than Democrats and Democratic-leaning
independents (20% vs. 12%, respectively). Still, overwhelming majorities in
both parties lack confidence in Putin. More broadly, in some countries people who identify themselves as
ideologically right-leaning are more likely than those on the left to have
confidence in Putin. The largest such difference is, again, in Italy, where a
majority (56%) of those on the right say they have confidence in Putin while
just 19% on the left agree. In Sweden, Greece, France, Canada, Germany,
Australia, the UK and the U.S., there are also double-digit differences
between the right and left. When it comes to comparisons with other global leaders, confidence in
Putin is substantially below that in German Chancellor Angela Merkel, U.S.
President Joe Biden and French President Emmanuel Macron. Yet his ratings are
quite comparable – and slightly better in some of the European countries
surveyed – to Chinese President Xi Jinping’s.
Confidence in Xi and confidence in Putin are closely related: Places
with higher levels of confidence in one tend to also have higher levels of
confidence in the other. The opposite is true of Merkel – places with higher
levels of confidence in Merkel tend to have less confidence in Putin. (PEW) JUNE 14, 2021 695-696-43-37/Poll People In The Nordics Are Mostly Into City Breaks i.e. Short Holidays
Spent In A City, With An Average Of 42 % People Choosing This Type Of Holiday
(Ranging From 35 % Of Swedes To 46 % Of Finns)
The global pandemic heavily influenced last summer’s holiday season
in the Nordics, but as vaccinations are rolling and restrictions are
gradually easing, more and more start planning and dare to book a holiday
abroad. Which holiday types do the people in the
Nordics generally prefer? In May, we measured the holiday types people in Sweden, Denmark,
Norway and Finland typically take.
Overall, people in the Nordics are mostly into city breaks i.e. short
holidays spent in a city, with an average of 42 % people choosing this type
of holiday (ranging from 35 % of Swedes to 46 % of Finns). Next up are
holidays that combine relaxing and sightseeing/activity, with an average of
38 % – however, this applies to only 28 % of the Swedish population. People in the Nordics generally like to visit friends and family in
the holidays (37 %). Especially Swedes (42 %) and Norwegians (41 %) practice
this kind of vacation activity, while it is slightly less popular in Denmark
(29 %). Holidays that involve culture and history are furthermore popular
across the Nordic countries (23 %). Swedes prefer beach holidays, while many
Finns choose a cruise Looking at the countries separately, there are several national
differences. Focusing on Sweden, the most popular holiday activity is simply
relaxing at the beach. Almost half of the Swedes (46 %) choose this type of
holiday, while only a third of Finns (33 %) and Danes (32 %) state the same. The Finns have another favorite in their top 5. A third of the
population (32 %) state that they like to go on a cruise for the holidays –
this applies to averagely 10 % in the other countries, and for Denmark, the
number is just 5 %. Danes are also less into holidays at a theme park (5 %), as opposed
to Norway and Sweden where one out of ten (11 % and 10 %) state that they
like this kind of holiday. (YouGov Denmark) Source: https://yougov.dk/news/2021/06/15/most-popular-holiday-types-nordics/ 695-696-43-38/Poll 3 In 4 Britons Believe In The Right To Seek Refuge, But 2 In 5 Want
To Shut Borders Completely At This Time
A global survey by Ipsos shows almost three-quarters of Britons (73%)
agree with the principle that people should be able to take refuge in other
countries, including Britain, to escape from war or persecution. Only 17% of
Britons disagree with this, which is lower than the average across the 28
countries (23%). However, although the proportion of people disagreeing with
the right to seek refuge has remained largely the same since 2020 (15%), the
proportion of Britons agreeing has decreased by 5 percentage points (78%). The survey, conducted online among adults aged under 74 across 28
countries, finds that despite wide support for the right to take refuge,
opinion remains split as to whether Britain must close its borders at the
current time. Around 2 in 5 Britons (42%) agree we must close our borders to
refugees entirely and that we cannot accept any refugees at this time
(similar to last year), while around half disagree (49%). Britons are
slightly less in favour of closing borders to refugees than elsewhere. On
average, across the 28 countries surveyed, half (50%) agree to closing
borders, while 43% disagree – largely unchanged since 2020. More than half of Britons are sceptical about those trying to get
into the country as refugees. Fifty-six per cent say most foreigners trying
to come into Britain really aren’t refugees and that instead they just want
to come here for economic reasons or to take advantage of our welfare
services. This is an increase of 5 percentage points since 2020 (51%). A
third (34%) disagree with this – a similar picture to last year (34%).
Britons are less sceptical compared with the global country average,
where, 62% agree with this and 3 in 10 (30%) disagree. Opinion is split as to whether refugees successfully integrate into
their new society. Almost half of Britons (48%) agree most refugees will
successfully integrate, while 41% disagree. This picture remains largely
unchanged since 2020 (when 51% agreed and 39% disagreed) and is similar to
the average across the 28 countries for 2021 (47%). Four in ten Britons (39%) say we should be less open to accepting
refugees than before the COVID-19 outbreak. This is broadly in line with the
global country average, where 42% want their countries to become less open to
accepting refugees. However,1 in 5 Britons (19%) say we should be more open,
which is higher than the global country average (14%) and an increase of 4
percentage points since 2020. Around a third of Britons (32%) say we should
be as open as we were before the outbreak – largely unchanged since 2020
(33%). Similarly, around 1 in 5 Britons (18%) say we should increase the
level of spending on support for refugees around the world due to the due to
the outbreak of COVID-19 – this is slightly higher than the global country
average (14%) and an increase of 6 percentage points since 2020. However,
four in ten (39%) want Britain to decrease the amount it spends on support
for refugees around the world and around a third (32%) want to keep the same
level of spending as before the pandemic – largely unchanged since last
year. You can read more about the global results, and the results of other countries on
our global website or in the charts linked at the bottom of the page. Ben Page, CEO of Ipsos MORI, said: These new findings
suggest a hardening of attitudes towards refugees entering the UK.
Although a majority believe that people should be able to seek refuge
in another country in principle, there is also growing cynicism about whether
those entering the country are genuinely seeking refuge, with a growing
number of Britons saying that they believe the majority of arrivals to be
economic migrants. (Ipsos MORI) 16 June 2021 695-696-43-39/Poll Canadians Agree (72%) People Should Be Able To Seek Refuge From War
And Persecution, But Few (10%) Like The Idea Of Letting In More Refugees
Post-Pandemic
Toronto, ON June 21, 2021 — A
new global Ipsos study, carried out to mark World Refugee Day 2021, paints a
mixed picture of attitudes towards refugees. Although Canadians agree (72%)
with the idea that
persons should be able to seek refuge from war and persecution, when it comes
to putting principle into practice very few (10%) are willing to open up
their borders to more refugees. Coupled with widespread skepticism (52%) over
whether those seeking refuge are genuine, Ipsos data paints a picture that
shows Canadians may not be as welcoming as our global reputation suggests. However, Canada is certainly not an anomaly: across 28 countries
surveyed, no country showed a majority in favour of increasing the number of
refugees allowed into their country following the Coronavirus/COVID-19
outbreak, and there is little support for greater government spending on
refugees around the world. Despite half saying that refugees in Canada
integrate well, four in ten declare we must close our borders entirely Recent polling shows Canadians are divided in their attitudes towards
refugees: half (54%) agree that most refugees that come to Canada will
successfully integrate into their new society, while 37% disagree. On this
particular metric, the attitudes of Canadians mirror those of the broader
international community: the global average shows that 47% agree that
refugees will integrate successfully into their new societies, while 44%
disagree. The attitudes of Canadians fall near the centre: they are not as
optimistic about refugee integration as respondents in Saudi Arabia (76%),
India (68%), or Argentina (60%), but neither are they as pessimistic as
residents of South Korea (29%), France (25%), or Japan (23%). Canadians are split on isolationist issues: when provided with the
statement “we must close our borders to refugees entirely – we can’t accept
any at this time,” 50% disagree, but 42% agree. In short, four in ten believe
Canada should close its border to all
refugees. While this may seem severe, of the 28 countries polled,
Canadians fall within the ten least
restrictive-– those in Poland (34%), Japan (38%), the United
States (41%) are least supportive of a closed border policy while those in
Malaysia (82%), Turkey (75%), and India (69%) show stronger support for
border closures. Perhaps less surprising, in light of the global recession resulting
from the pandemic, is the results showing that few Canadians want to open up
their wallets and pay more to
support refugees. When asked, “do you think the government in Canada should
increase or decrease the amount it spends on support for refugees around the
world due to coronavirus/COVID-19 or do you think it should keep spending the
same as before the outbreak?” a majority agree that funding should remain the
same (36%) or be decreased (42%), with only 8% electing to increase spending. Canadians on par with global average
regarding principle of refugeehood, but more fiscally conservative towards
refugees than most other nations While these figures may seem a departure for a nation that prides
itself on being welcoming to refugees, a broader lens shows that Canadians
are not alone in their split attitudes. The views of Canadians towards
the principle of
refuge (72% agree) are in line with the global average (70% globally
agree with principle of refuge) and highly comparable to other nations of
similar wealth and influence, including Great Britain (73% agree with
principle of refuge), or the United States (71% agree with principle of
refuge). Furthermore, the data show the proportion of Canadians who feel we
should be less open to refugees than
before the pandemic (42%) is right on track with the global average (42%). However, Canadians are more fiscally conscious than many other
nations: only 8% believe the Canadian government should increase spending to support
refugees around the world due to COVID-19, below the 14% global average. On
this particular metric, Canadians are some of the most fiscally cautious, second only to
the authoritarian nations of Russia (8% increase spending) and Turkey (8%
increase spending) in their reluctance to increase spending for refugee
supports. Considering the dichotomy of broad support for the principle of seeking refuge despite
widespread skepticism about whether refugees are genuine, the data suggests
that there are no clear-cut attitudes towards refugees in Canada, or the
international community. The data does indicate that there is a long way to
go in both Canada, and in many nations, to improve attitudes towards refugees
in practice rather than theory. (Ipsos Canada) 22 June 2021 695-696-43-40/Poll Three In Five Urban Indians Would Watch More Of Women’s Sport If It
Was More Accessible On TV YouGov
YouGov’s latest report reveals three in five (59%) urban Indians feel
they would watch more of women’s sport if it were shown more on the television. “Women in Sport Report
2021” explores how women’s sport is perceived
around the globe – with the aim of giving marketers an inside track on
identifying where the greatest value lies. Globally, a third of people (33%) say they would watch more
women’s sport if it was more accessible on TV. Agreement with this
statement is the highest in India, followed by Mexico and UAE.
Around the globe, the popularity of women’s sports is much lower than
men’s sports across all the sporting categories. The difference is most
pronounced in the category of professional sport: respondents are almost
twice as likely to watch or follow men’s sport than women’s sport
(40% vs 19%). The most popular reason people give around the world for not
following women’s sports is the lack of media coverage (40%). Other
supply-side factors acting as barriers to engagement include lack of
knowledge about women’s teams or athletes (35%), lack of marketing (30%) and
limited accessibility of women’s sport on TV (27%). The speed, quality and
physicality of women’s sport is much less likely to be a reason for not
engaging.
The data shows women’s soccer has the highest following of any
women’s sport (at 26%) globally, followed by
tennis, basketball and volleyball. This varies across
countries. In India, the popularity of cricket far exceeds the global
popularity of soccer, with nearly three in ten following women’s cricket
(58%).
Popularity of these events is one of the highest in India, especially
for Women’s Tennis Association and FIFA Women’s World Cup. Talking about the future of women’s sport, a large majority of urban
Indian respondents (84%) say there has been an enhancement in the quality of
women’s games in the last five years. Around three- quarters perceive there
has been progress in areas like live coverage of women’s sport, availability
of news on women’s games and sponsorship for them. The data gives a sense of optimism for women’s sport as nearly
three-quarters of public in India (73%) would like to see more exposure for
it. This could bear potential rewards for brands considering support for
sport. Urban Indians tell us that a brand’s association with women’s
professional sport is less likely to make them think more positively about
the brand than an association with men’s pro sport (53% men vs 43%
women). Having said that, women are more likely to look on a brand’s
support favourably than men (37% men vs 43% women). Speaking about this, Joseph
Eapen of YouGov, said, “Across
the globe, there are big differences in the way people perceive and consume
women’s sports. Although currently it is less popular than men’ sports, there
is potential for growth of women’s sport in the future. While this presents a
commercial opportunity, the challenge for sports marketers is to find a way
to build interest in athletes and teams and create narratives to make women’s
sport more appealing to its audiences.” (YouGov India) Source: https://in.yougov.com/en-hi/news/2021/06/24/three-five-urban-indians-would-watch-more-womens-s/ 695-696-43-41/Poll In Five Of Seven MENA States At Least 40 Percent Have A Favorable
View Of France Overall
France has a long history of engagement with MENA, including as a
colonial power and through numerous military interventions. More recently,
Emmanuel Macron has sought to increase
France’s influence across MENA. In 2020, he personally interceded to
try to find a solution to the crisis in Lebanon and has worked to deepen
engagement with other countries in the region. Nevertheless, his
personal engagement appears to have yielded limited results. Although views
of France are moderately positive across the countries surveyed in Arab
Barometer’s sixth wave – in five of seven at least 40 percent have a
favorable view of France overall – views of Macron himself lag significantly.
In no country surveyed do 40 percent of citizens have a positive view of his
policies. Likely, his controversial statements
about Islam and limited
success in resolving the crisis in Lebanon have contributed to his
lower overall ratings compared with the country he leads.
(Arabbarometer) June 24, 2021 Source: https://www.arabbarometer.org/2021/06/mena-pulse-on-france-macron/ 695-696-43-42/Poll In 17 Countries Only 8% Of Respondents (Gamers And Non-Gamers) Would
Describe Video Games As Inclusive
A global study conducted in 17 countries shows that only 8% of
respondents (gamers and non-gamers) would describe video games as
“inclusive”. We observe that the
French (22%) and the Danes (14%) are the most likely to
share this opinion.
In addition, we note that nearly one in five consumers consider that
gaming creates social links (17%). During
the COVID-19 crisis, video games have indeed taken an important place in the
lives of many people. Several games have grown in popularity, including
the online multiplayer deduction game Among
Us , the Jackbox quizzes and
the social simulation game Animal
Crossing: New Horizon . Finally, we observe that only
15% of respondents consider video games to be violent , which
suggests that the prejudices that have hung over this industry for decades
are fading. Note: the French are the most likely to
qualify video games as violent, at 25%, at the same level as Mexicans. (YouGov France) June 24, 2021 Source: https://fr.yougov.com/news/2021/06/24/comment-les-jeux-video-sont-ils-percus-en-2021/ 695-696-43-43/Poll In Many Markets Such As Spain, Mexico And China, The Ratio Of People
Who Prefer Hybrids To Electrics Is Around 2:1
As governments across the globe introduce
legislation to encourage consumers to buy battery-powered vehicles – and
crucially, to eventually stop the sale of new petrol/diesel cars – the auto
industry is looking at an increasingly electric future. What’s more, there’s
evidence that consumers are embracing the idea: in Britain, for example,
people think electric cars beat petrol cars in several key areas, with
the notable exception of convenience. The most commonly-selected barrier
was cost (selected by 26% of drivers). Global YouGov data suggests that, even if
you remove the extra costs of buying an electric car from the equation, they
still aren’t consumers’ first choice. We asked people in 17 different markets
if they would prefer an electric, hybrid, or petrol/diesel car if they were
buying a new vehicle; the models were the same; and they were all the same
price. In most countries and territories, hybrid vehicles were the first
choice (except for Germany, where 40% opted for petrol/diesel cars, with
hybrids the second choice). Hong Kong is the only market where electric
cars come close to matching hybrids in terms of overall preference: three in
ten (30%) say they would opt for an electric car, all things being equal,
while nearly a third (32%) say they would go for a hybrid. In many markets
such as Spain (51% vs. 20%), Mexico (50% vs. 27%) and China (45% vs. 19%),
the ratio of people who prefer hybrids to electrics is around 2:1. This suggests that, while cost may be the
top barrier overall, the day-to-day convenience of owning an electric car
remains a major sticking point. While there are nine markets in our study
where people are at least as likely to go for the electric car as they are to
choose the petrol or diesel vehicle, there are still several markets where
cars powered by fossil fuels win out. Add that to the fact that majority of
consumers globally would opt for the hybrids, and both auto manufacturers and
policy-makers may need to do more to increase the attractiveness of the fully
electric car. (YouGov UK) June 24, 2021 695-696-43-44/Poll Global Country Average Of 74% Say There Is At Least A Fair Amount Of
Tension Between Rich And Poor
The poll, which was conducted online
between 23 December 2020 and 8 January 2021, shows people in South Africa
(58%), India (57%) and the US (57%) are most likely to feel that their
country is divided by “culture wars”, with a significant gap in opinion between
them and people in Brazil (47%), who are next most likely to think their
nation is divided in this way. Those in Germany (19%), Russia (18%) and
Japan (9%) are least likely to feel divided. In most countries, relatively
few actively disagree with the statement (Global Country Average of
14%). Instead the level of don’t knows is often notable (19% Global
Country Average, while 32% take a neutral position), suggesting this is not a
concept that many are familiar with.
People in the 28 countries surveyed were
asked to rate their feelings about political correctness on a scale from 0 to
7, with 0 meaning many people are too easily offended and 7 meaning people
need to change the way they talk to be more sensitive to those from different
backgrounds. Overall, in most of the countries most people leaned
towards believing we need to change the way people talk (in the Global
Country Average, 31% placed themselves 0 to 3 on the scale and 60% 4 to 7).
(YouGov Egypt) 25 June 2021 Source: https://www.ipsos.com/en-eg/culture-war-around-the-world |
|||||||||||||||||||||||||||||||||||||||||||||||||||||||||||||||||||||||||||||||||||||||||||||||||||||||||||||||||||||||||||||||||||||||||||||||||||||||||||||||||||||||||||||||||||||||||||||||||||||||||||||||||||||
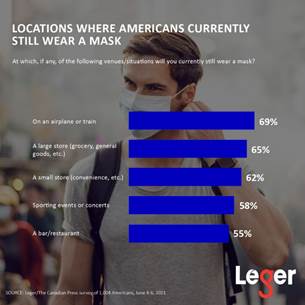


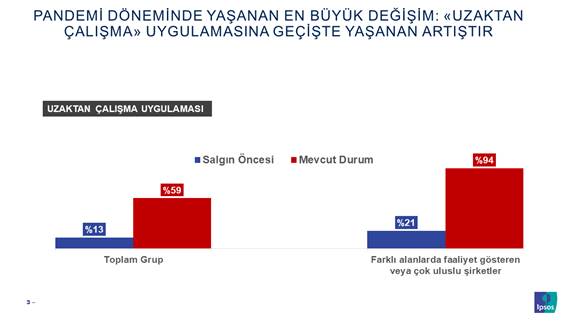
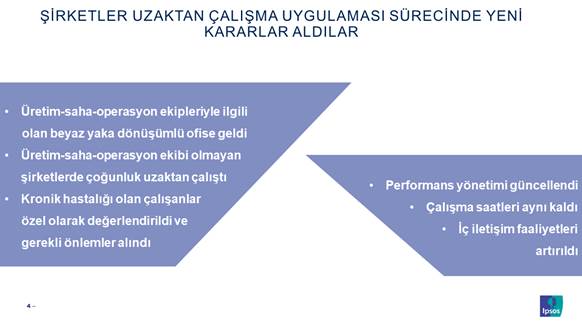
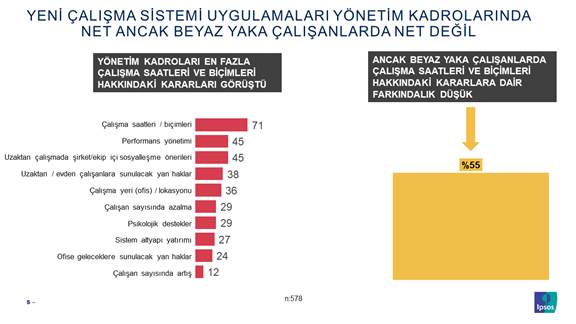
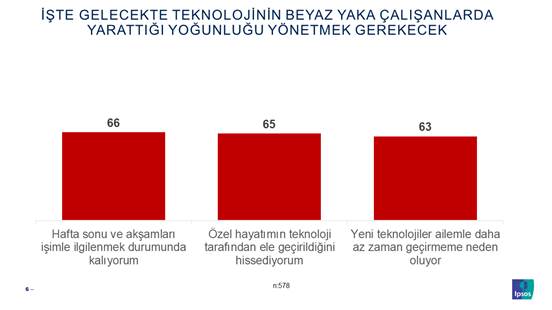

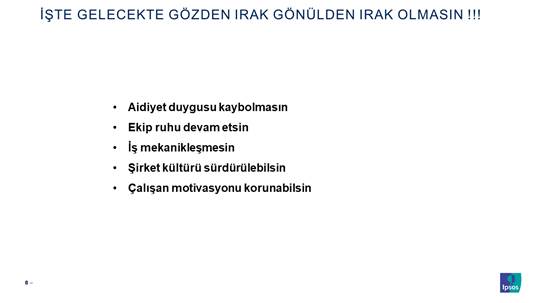

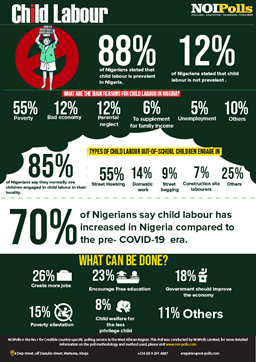
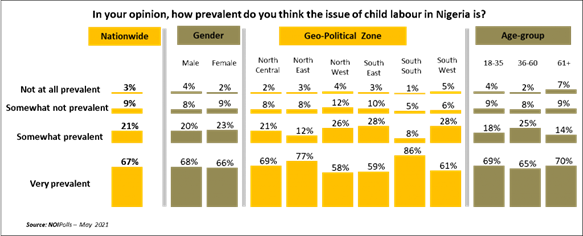
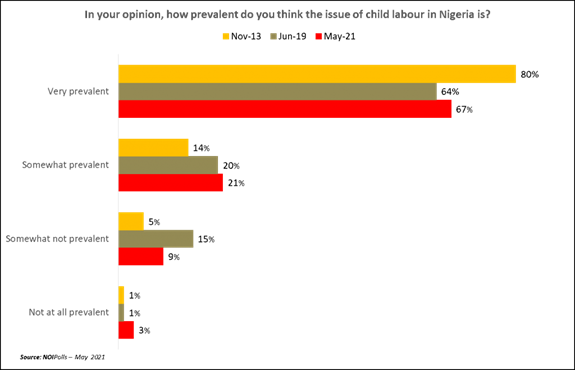
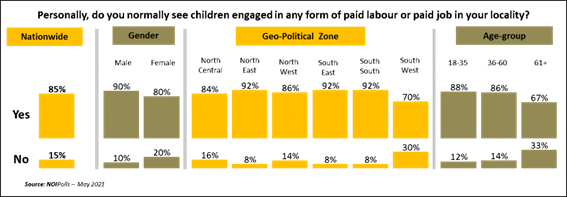
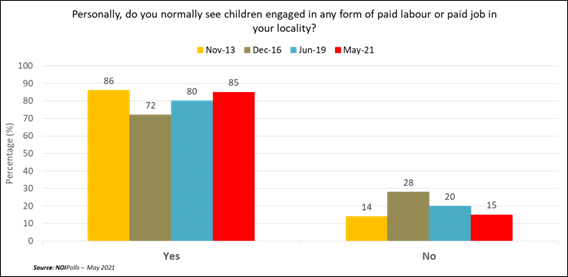
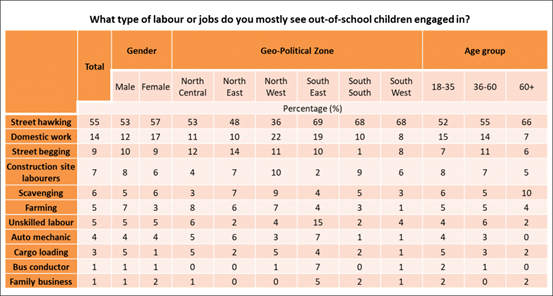
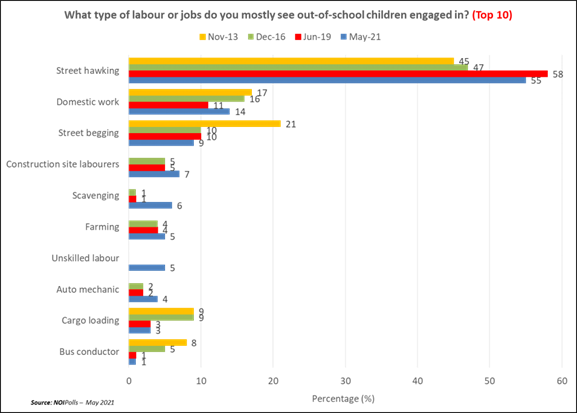
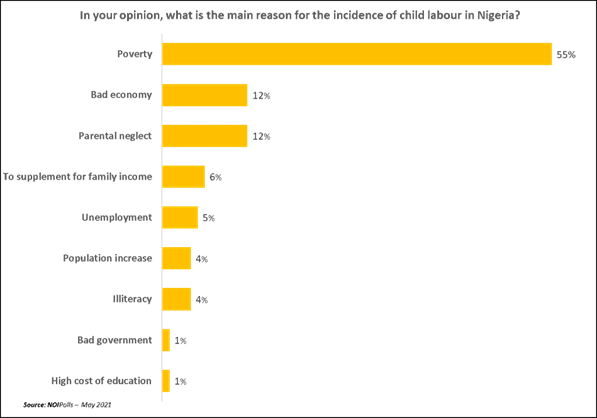
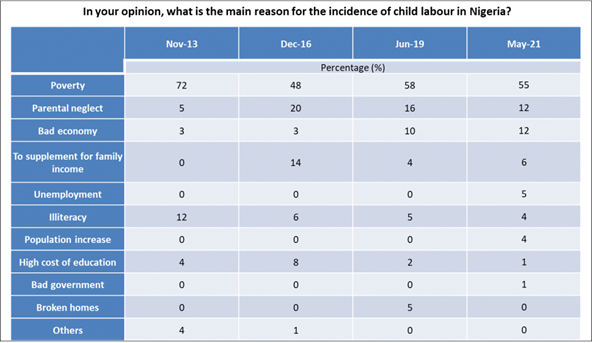
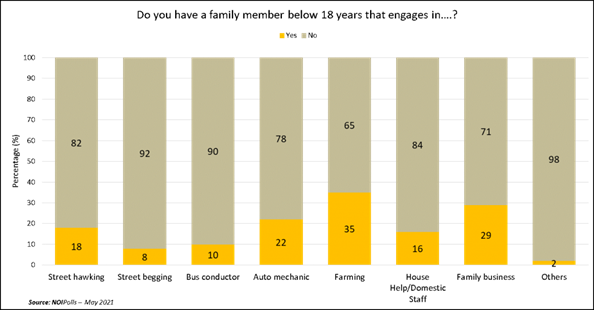
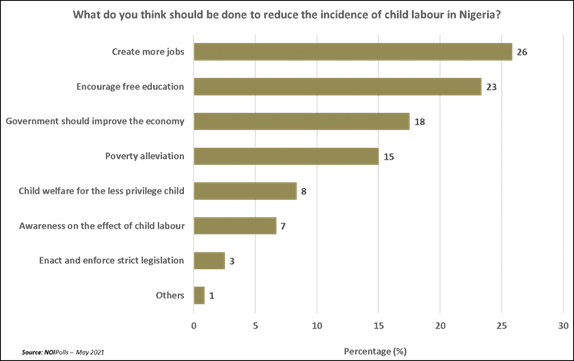
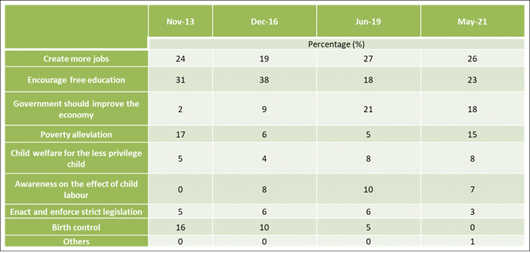
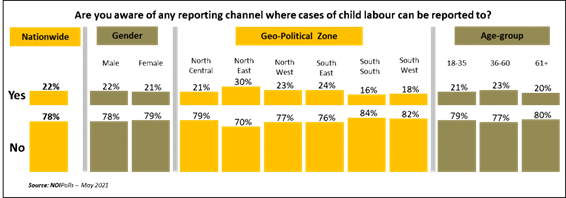
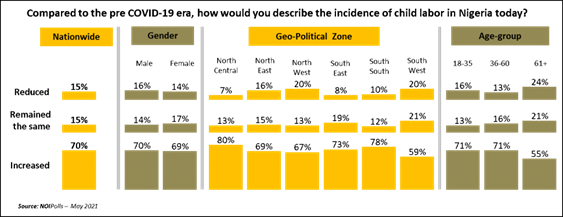
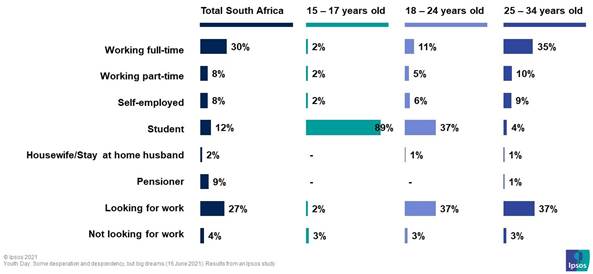
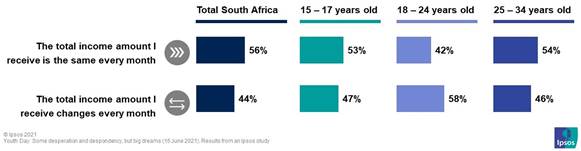
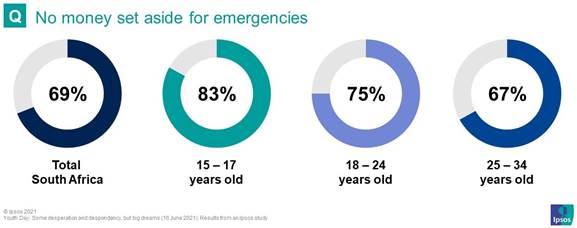
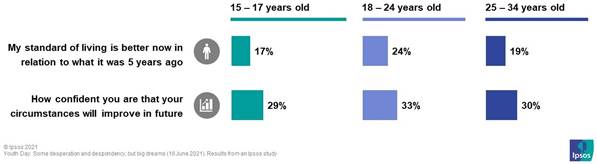
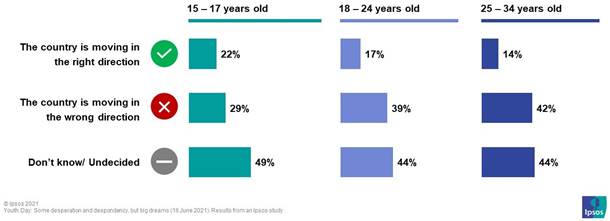
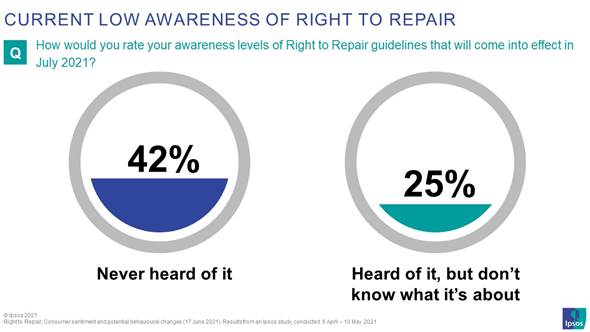
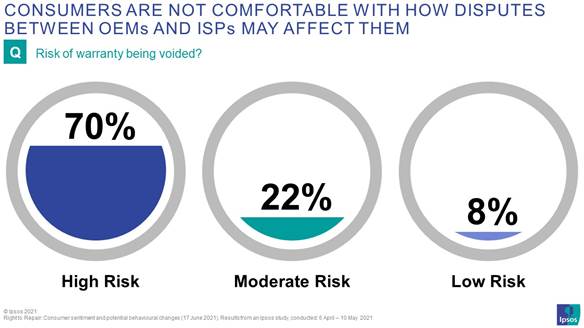
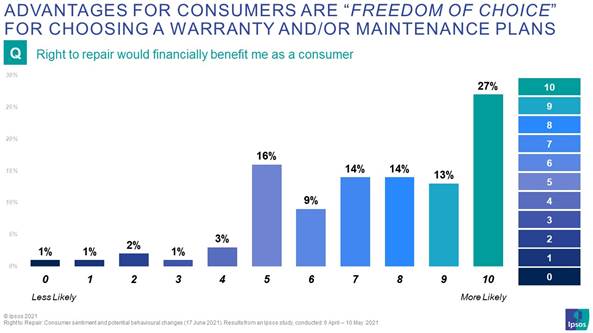
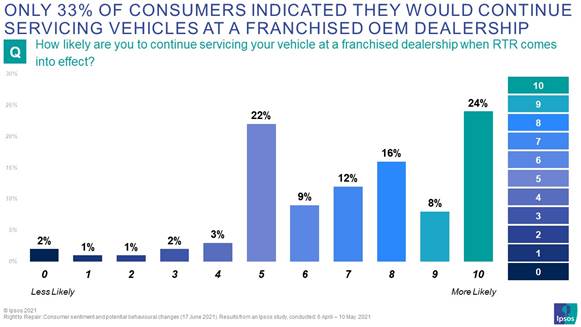
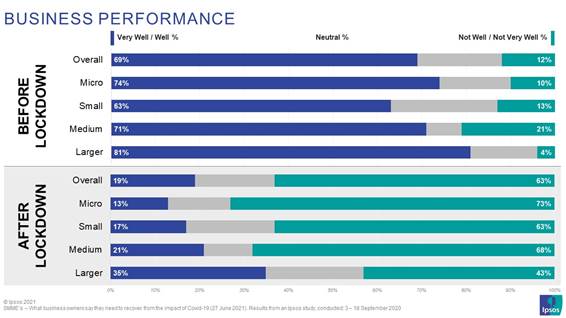
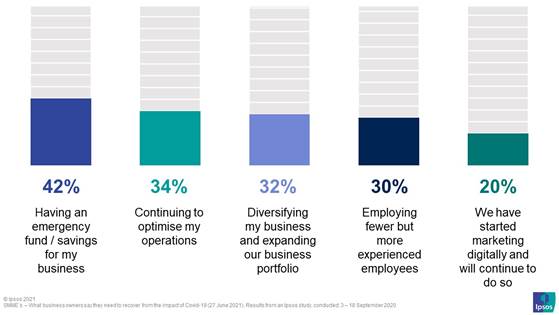
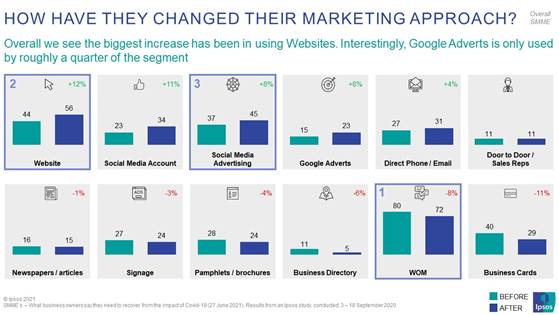

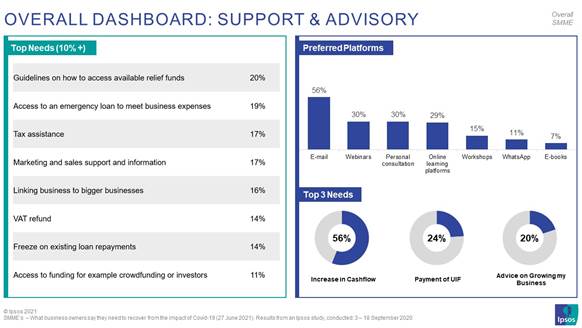
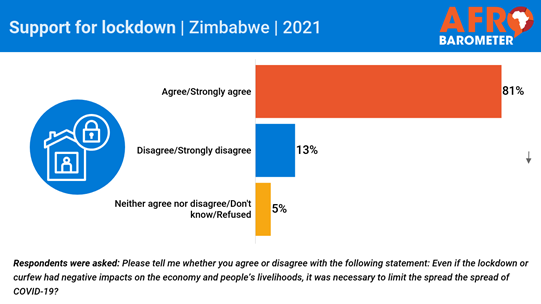
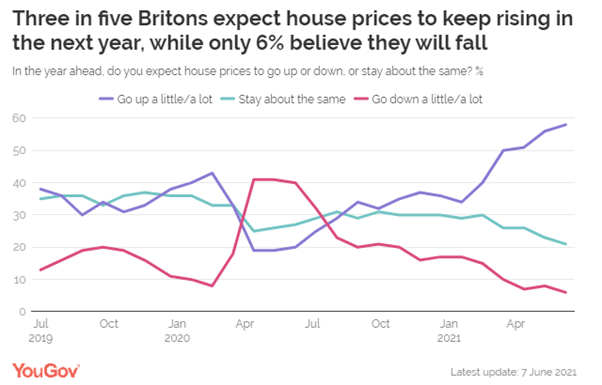
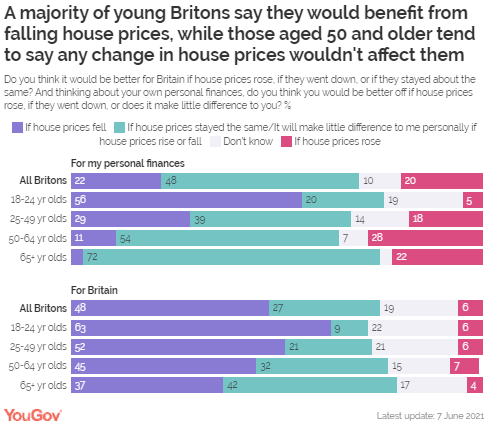
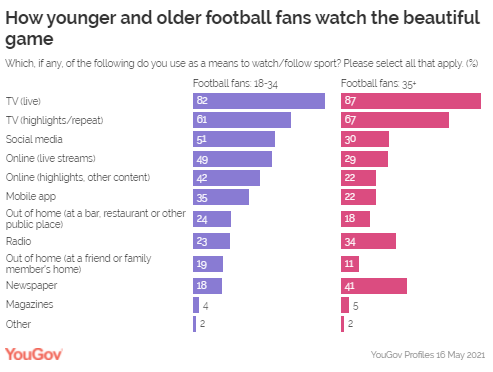
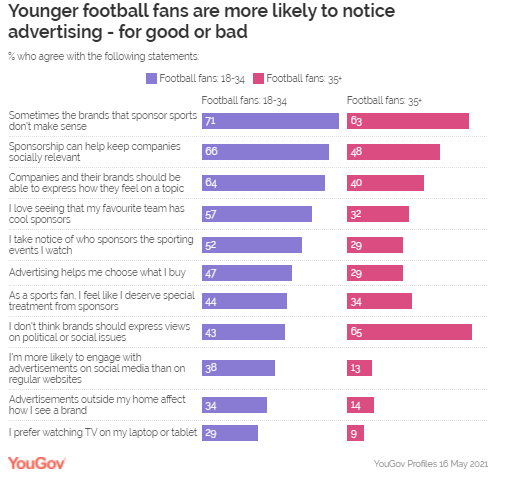
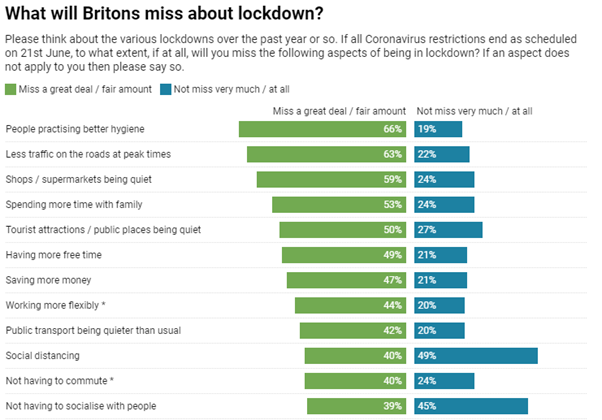
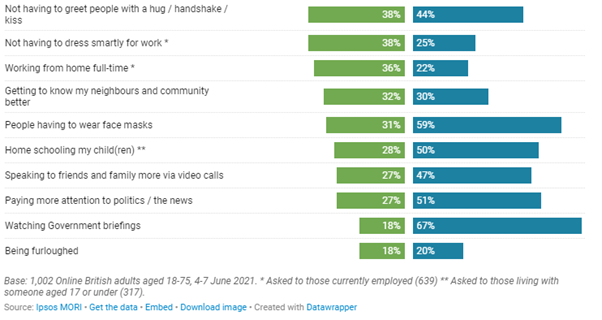
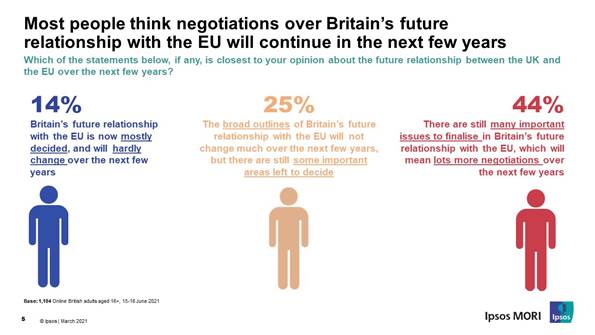
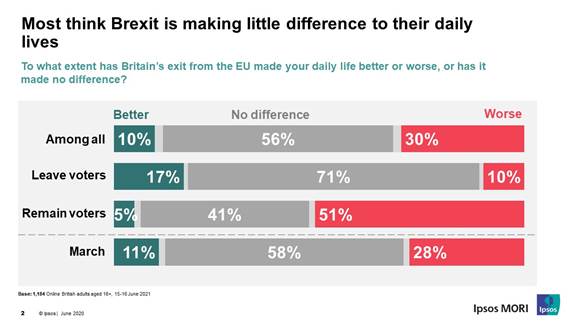

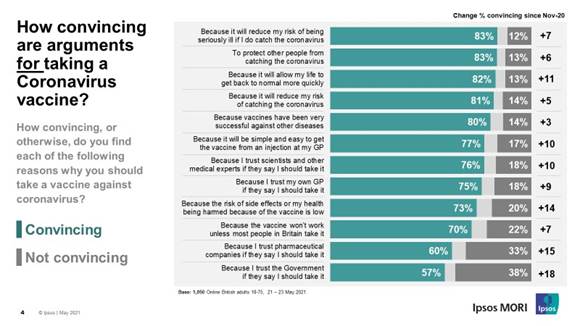
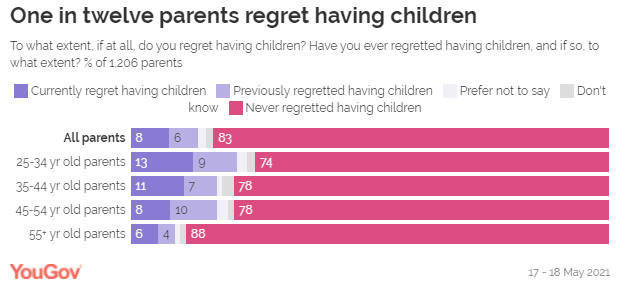
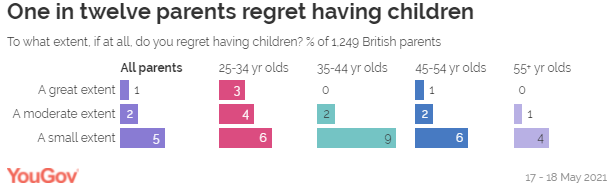
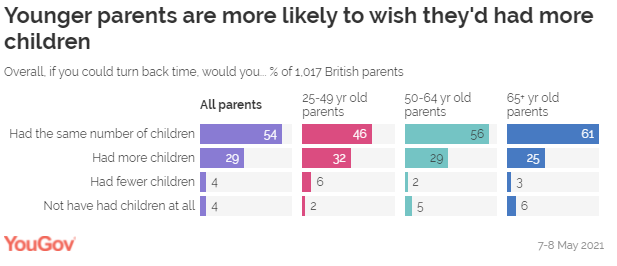
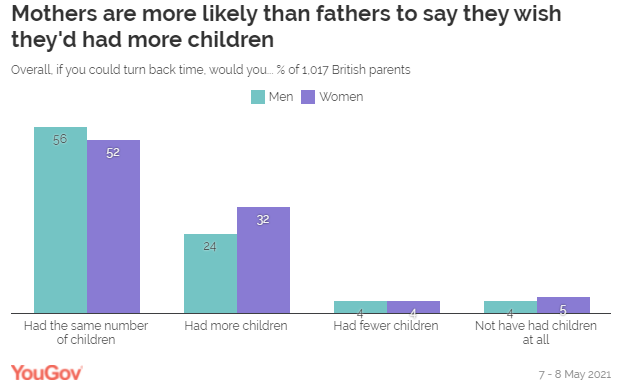
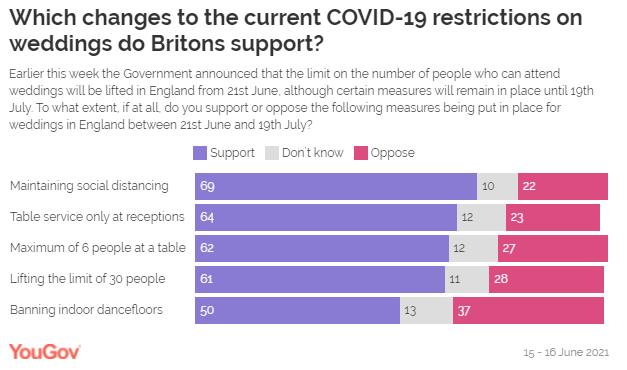
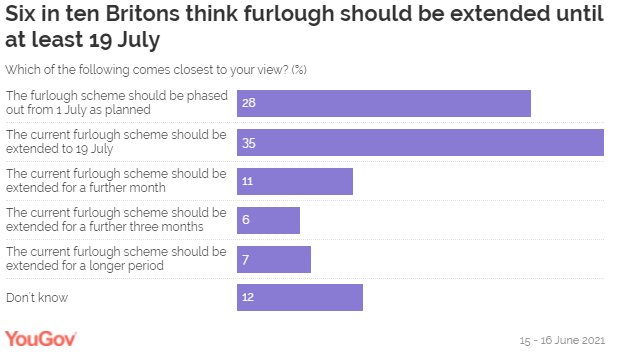
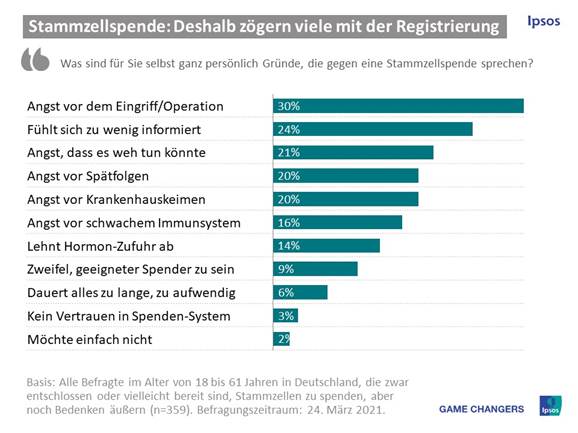
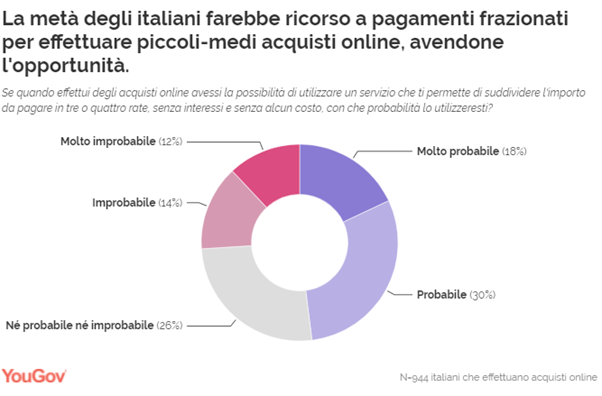

.png)