|
BUSINESS & POLITICS IN THE WORLD GLOBAL OPINION REPORT NO. 701 Week:
July 26 –August 01, 2021 Presentation:
August 06, 2021 According
To 55% Of Tunisians Democracy Is Always Preferable 80
Percent of Adult Nigerians Do Not Support Scrapping of the National Youth
Service Corps (NYSC) Over
half of Britons’ 55% say they would struggle to pay their bills if interest
rates double Between
21 And 22 The Minimum Wage Is 55p Lower Than It Is For Those 23 And Over, At
£8.36 Per Hour One
In Four Businesses Intend To Allow All Workers To Work From Home At Least
Some Of The Time On
The Road To Vacation, More Than 1 In 4 French People Throw Their Waste Out Of
Their Car Window The
majority of Germans are in favor of butcher shops, but buy meat in the
supermarket 54%
Of Black Americans Report Unfair Treatment In At Least One Situation Unemployment
Increased More Sharply Among Immigrants 15.3% During Pandemic 47%
Say U.S Military Involvement In Afghanistan Was A Mistake 46% Say It Was Not Most
Canadians Worried About COVID-19 Variants (81%), Fourth Wave (69%) Support
For New Zealand’s Labour/Greens Government Dropped 1.5% Points To 49.5% In
July Those
On Ideological Right Favor Fewer Covid-19 Restrictions In Most Advanced
Economies INTRODUCTORY NOTE
701-43-23/Commentary:
On
Average, 56% Agree Their Country’s Society Is Broken And 57% Agree That Their
Country Is In Decline
Majorities
of citizens in most of 25 countries surveyed by Ipsos express feelings of
alienation when thinking about their country. The survey of more than 19,000
adults finds perceptions of a broken political and economic system prevailing
in most countries, often accompanied by populist and anti-elite sentiment and
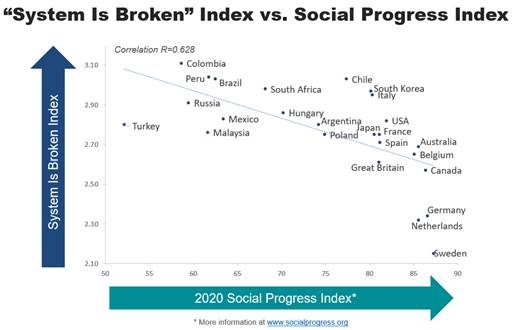
nativist views. Broken-System Sentiment On average,
56% agree their country’s society is broken and 57% agree that their country
is in decline. To fully grasp the prevalence of social and political
disaffection, Ipsos designed the “System Is Broken” Index, based on the level
of agreement with five statements:
The four
countries with the highest levels of alienation are all in Latin America – Colombia,
Peru, Brazil, and Chile. Since 2016,
broken-system sentiment has gained ground most in Japan, South Africa,
Sweden, the United States, and Argentina; it has receded most in Spain,
Mexico, and France. Compared to 2019, months before the pandemic, it has
increased most in Malaysia and decreased most in Great Britain. Broken-system
sentiment is highly linked to populist sentiment, resentment of elites, and
natives-first/anti-immigration views. Ipsos also found that its System Is
Broken Index is highly correlated with both the Social Progress
Imperative’s Social Progress Index,
an outcomes-based indicator of how well citizens’ social and environmental
needs are met, and Transparency International’s Corruption Perceptions Index. Countries
with higher levels of wellness, equality, inclusion, sustainability, personal
freedom, and safety and those with lower levels of perceive public-sector
corruption tend to show lower levels of broken-system sentiment. Since 2016,
broken-system sentiment has gained ground most in Japan, South Africa,
Sweden, the United States, and Argentina; it has receded most in Spain,
Mexico, and France. Compared to 2019, months before the pandemic, it has
increased most in Malaysia and decreased most in Great Britain.
Populism and Resentment of Elites On average
across the 25 countries:
Populist/anti-elite
sentiment is strongly correlated with broken-system sentiment; it is most
prevalent in Chile, Hungary, Colombia, Peru, and Russia. The “elite”
is widely perceived across the world as a closely connected group making
decisions based on their interest and ignoring the needs of others. On
average, 15% of those surveyed identify in any way with their country’s
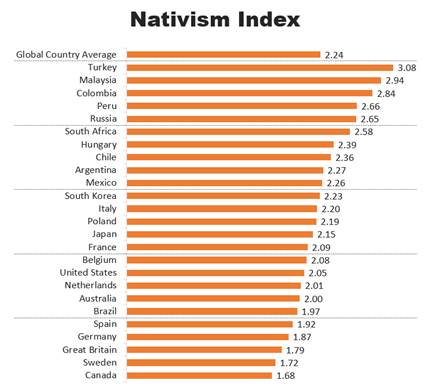
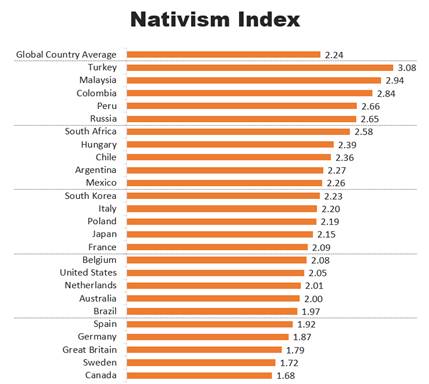
elite; Americans and Japanese are those least likely to do so. Nativist Views The “average
global citizen” is ambivalent about immigration, leaning toward a
natives-first view:
The Nativism
Index is strongly correlated with the “System Is Broken” Index, indicating
how much social and political alienation and anti-immigration views tend to
go hand-in-hand. Since 2016,
nativist sentiment has grown most in Peru, Sweden (where it was marginal),
Japan, South Africa, South Korea, and Turkey. Meanwhile, it has receded most
in the U.S., Canada, Spain, Italy, and Hungary. (Ipsos MORI) 28 July 2021 ASIA (India) A
Fourth (23%) Of The Polled Respondents Who Said They Were Planning To
Purchase A Two-Wheeler A Majority Went Ahead With Their Plan (56%), A
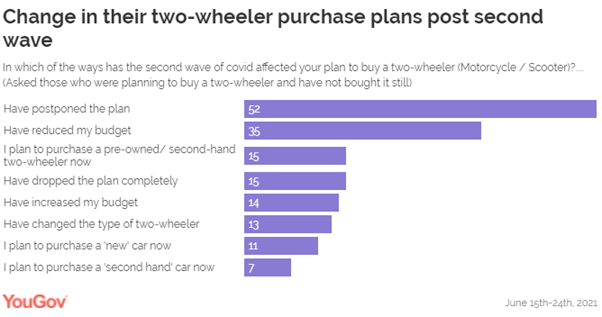
Sizeable Proportion (44%) Are Yet To Act On It A vast majority (84%) among those who
intended to buy a two-wheeler and haven’t bought it yet said that the second
wave of the pandemic impacted their purchase plan in some form. The most
common impact (52%) was the postponement of the plan. While over a third have
reduced their budget (35%), there are some who have increased it (14%).
Notably, this increase in budgets is mostly reported by the millennials and
those who reside in the tier 1 cities, who might have saved up during
the second lockdown and have now decided to spend more on their two-wheeler
purchase. (YouGov India) July 27, 2021 (Turkey) 7 Out Of 10 People Who Have Heard Of The Delta Variant
Think That The 4th Wave Will Be Experienced Because Of This Variant 71% of those who know about the delta
variant think that there will be a 4th wave in the epidemic because of this
variant. The rate of those who thought this way in the previous week was
63%. Only 17% think that a new wave will not occur. Parallel to the
increase in both the delta variant and the number of cases, 68% of the
population think that the epidemic can be brought under control later than
2021. (Ipsos Turkey) 26 July 2021 MENA (Tunisia) According To 55% Of Tunisians Democracy Is Always
Preferable As Tunisia’s major political crisis unfolds,
some commentators have argued that the country’s citizens never wanted democracy in
the first place.
However, data from Arab Barometer presents a different picture. In recently
conducted surveys from the Arab Barometer’s sixth
wave, a majority of Tunisians say that democracy
is always preferable to other forms of government compared to just a quarter
who say non-democratic governments can sometimes be better. Moreover,
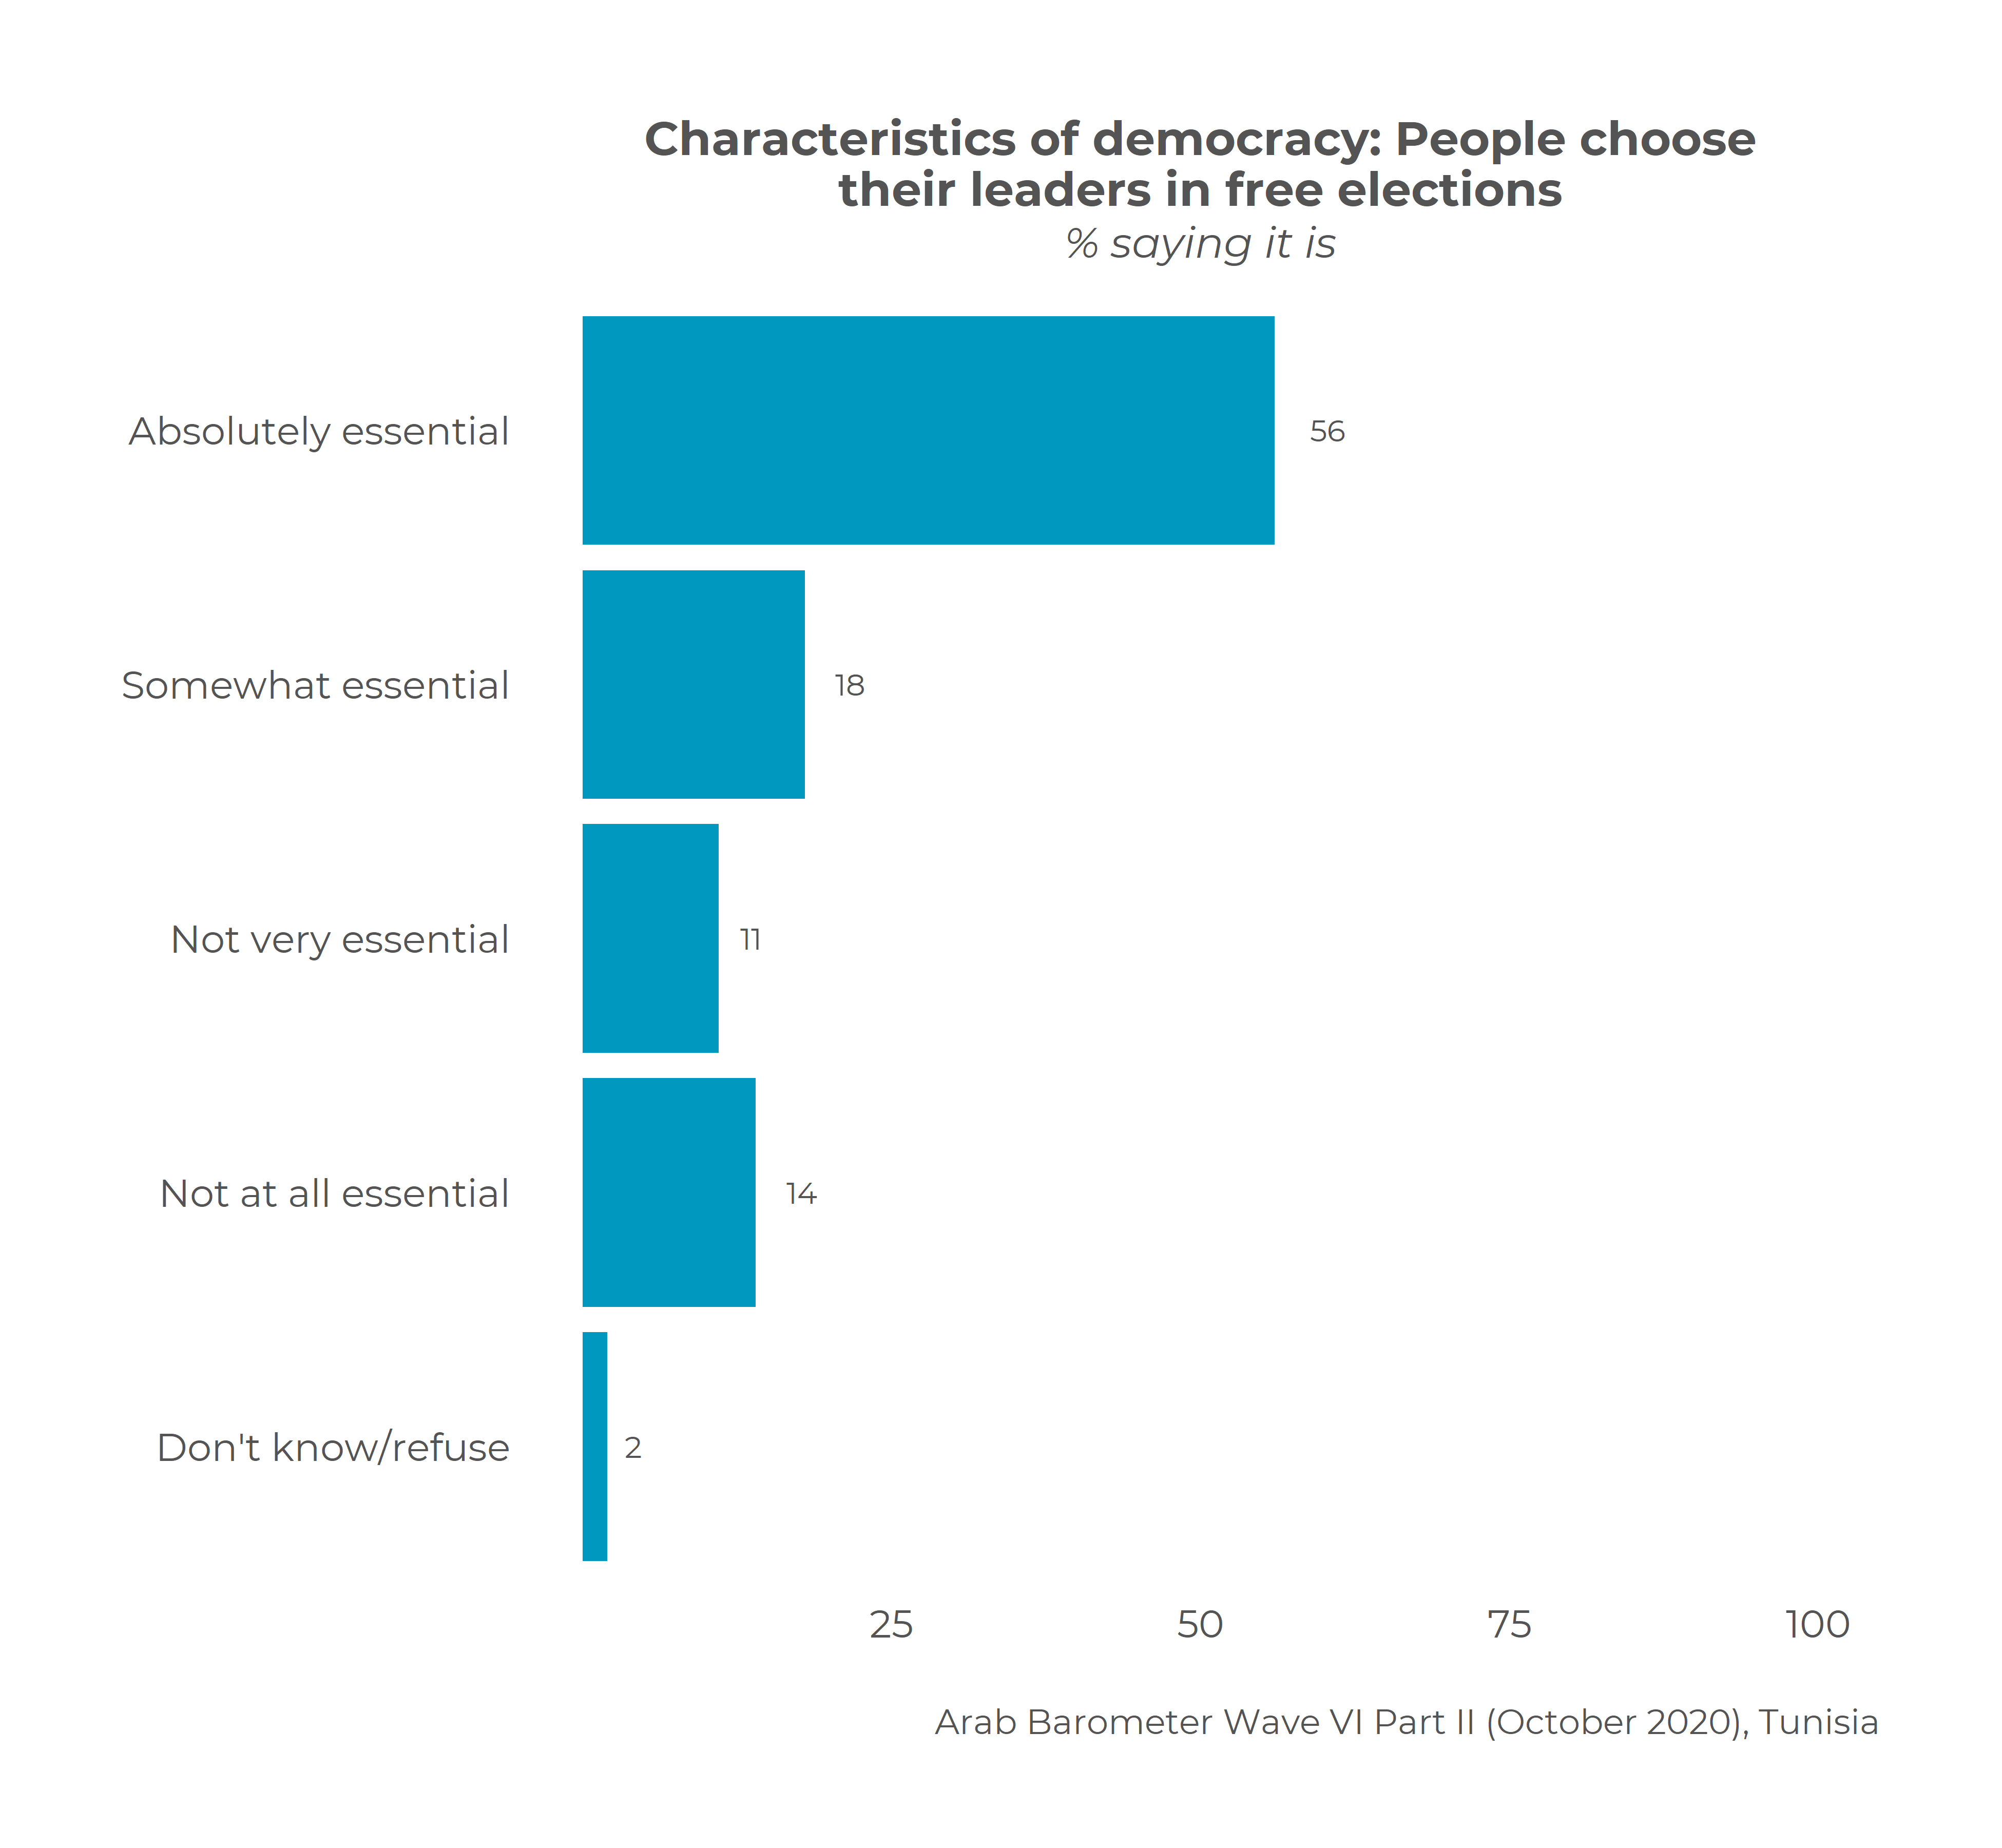
three quarters of Tunisians say that freely choosing leaders in free and fair
elections is an essential characteristic of democracy. (Arabbarometer) July 29, 2021 AFRICA (Nigeria) 80 Percent of Adult Nigerians Do Not Support Scrapping of
the National Youth Service Corps (NYSC) A new public opinion poll conducted by
NOIPolls has revealed that 8 in 10 adult Nigerians do not support the
scrapping of the National Youth Service Corps (NYSC) and there are more
Nigerians from the North-East zone (88 percent) who made this assertion. This
is in line with the position of the Sultan of Sokoto, Sa’ad Abubakar, who
spoke when he hosted some selected members of NYSC Batch A stream 2 Corps
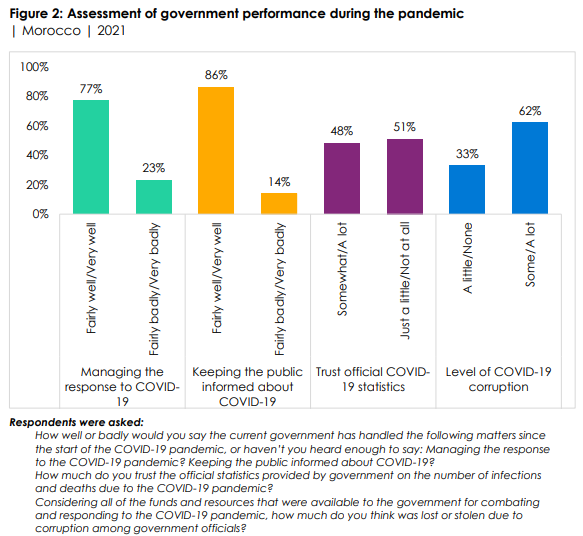
members posted to Sokoto state in his palace in May 2021. (NOI Polls) July 28, 2021 (Morocco) Large Majorities Say The Government Has Done “Fairly Well”
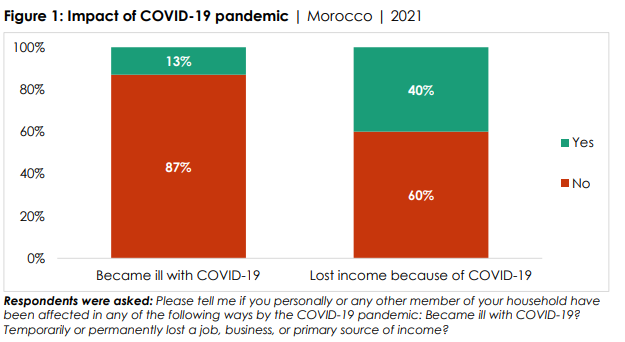
Or “Very Well” In Managing The Response To The Pandemic (77%) About one in eight citizens (13%) say they
or a member of their family became ill with COVID-19, and four in 10 (40%) say someone
in their household lost a primary source of income because of the pandemic. But only
about half (48%) say they trust official COVID-19 statistics provided by the
government, and six out of 10 (62%) believe that “some” or “a lot” of
COVID-19 relief resources have been lost to government corruption. (Afrobarometer) 29 Jul 2021 (Zimbabwe) Almost Three-Fourths (73%) Of Citizens Say The National
Dialogue Process In Zimbabwe Should Go Beyond Political Parties Almost three-fourths (73%) of citizens say
the national dialogue process in Zimbabwe should go beyond political parties to
include other stakeholders, such as businesses, churches, and civil society organizations.
About one in four citizens (28%) say that the ongoing POLAD framework is the
only option for bringing about national stability and development in
Zimbabwe. Almost as many (23%) disagree with this assertion, while almost
half (47%) neither agree nor disagree, “don’t know,” or refused to answer the
question. (Afrobarometer) 26 July 2021 WEST
EUROPE (UK) Over half of Britons’ 55% say they would struggle to pay
their bills if interest rates double New polling suggests a rise in interest
rates could lead to financial hardship for many. At least half of
Britons said they would be worse off than they are today (55%), that they
would find bills a real burden (52%) and they would start to find themselves
financially stretched (51%), should interest rates double from the current
base rate. More than 4 in 10 (44%) would have to use savings to make ends
meet, 42% say this is unlikely. (Ipsos MORI) 29 July 2021 Between 21 And 22 The Minimum Wage Is 55p Lower Than It Is
For Those 23 And Over, At £8.36 Per Hour The minimum wage is not the same for
everyone however. For those between 21 and 22 the minimum wage is 55p lower
than it is for those 23 and over, at £8.36 per hour, while for those aged
between 18 and 20 it is £2.34 lower, at £6.56 per hour. Many argue that the
minimum wage is not in fact enough to live on, arguing instead for a ‘living wage’
of £9.50 an hour (£10.85 an hour in London) and against the banding of wage by
age. Now new YouGov data finds that a plurality believe that the minimum wage
should be higher, and a majority oppose the banding of wage by age. (YouGov UK) July 29, 2021 One In Four Businesses Intend To Allow All Workers To Work
From Home At Least Some Of The Time Two in five businesses will allow all (24%)
or most (18%) employees to work from home with the last coronavirus
restrictions lifting. This is a considerable increase compared with before
the pandemic, when only one in four businesses (24%) had this policy,
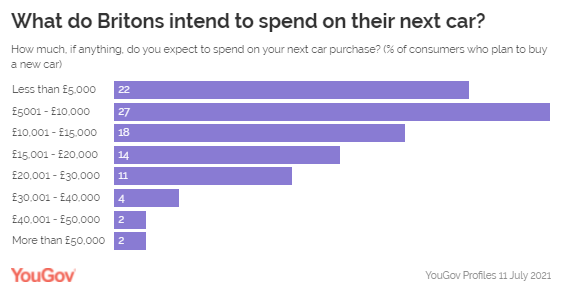
including 17% who allowed all staff to work remotely. (YouGov UK) July 29, 2021 Half (49%) Of Britons Have A Budget Of £10,000 Or Less,
With Less Than One In Ten (8%) Planning To Spend More Than £30,000 Data from YouGov Profiles shows that most
Britons have a budget of £15,000 or less (67%) when it comes to buying their
next car. Half (49%) have a budget of £10,000 or less, with less than one in
ten (8%) planning to spend more than £30,000. In terms of preferred features,
both higher and lower budget buyers are most likely to prioritise parking
sensors (57% vs. 48%), a rear parking cam (57% vs. 38%), and smartphone
integration (48% vs. 35%). As you can see, consumers with more than 30k to
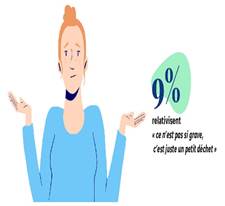
spend are more likely in each instance to desire the feature. (YouGov UK) August 01, 2021 (France) On The Road To Vacation, More Than 1 In 4 French People
Throw Their Waste Out Of Their Car Window Despite certain practices that are
progressing in the right direction, the survey reveals the persistence of
uncivil behavior that is too widespread , starting with the propensity
of more than 1 in 4 drivers to throw their waste out of their car
window - even if this is often comes at the cost of a feeling of
guilt. Each day, an average of 25 tonnes of litter is collected along
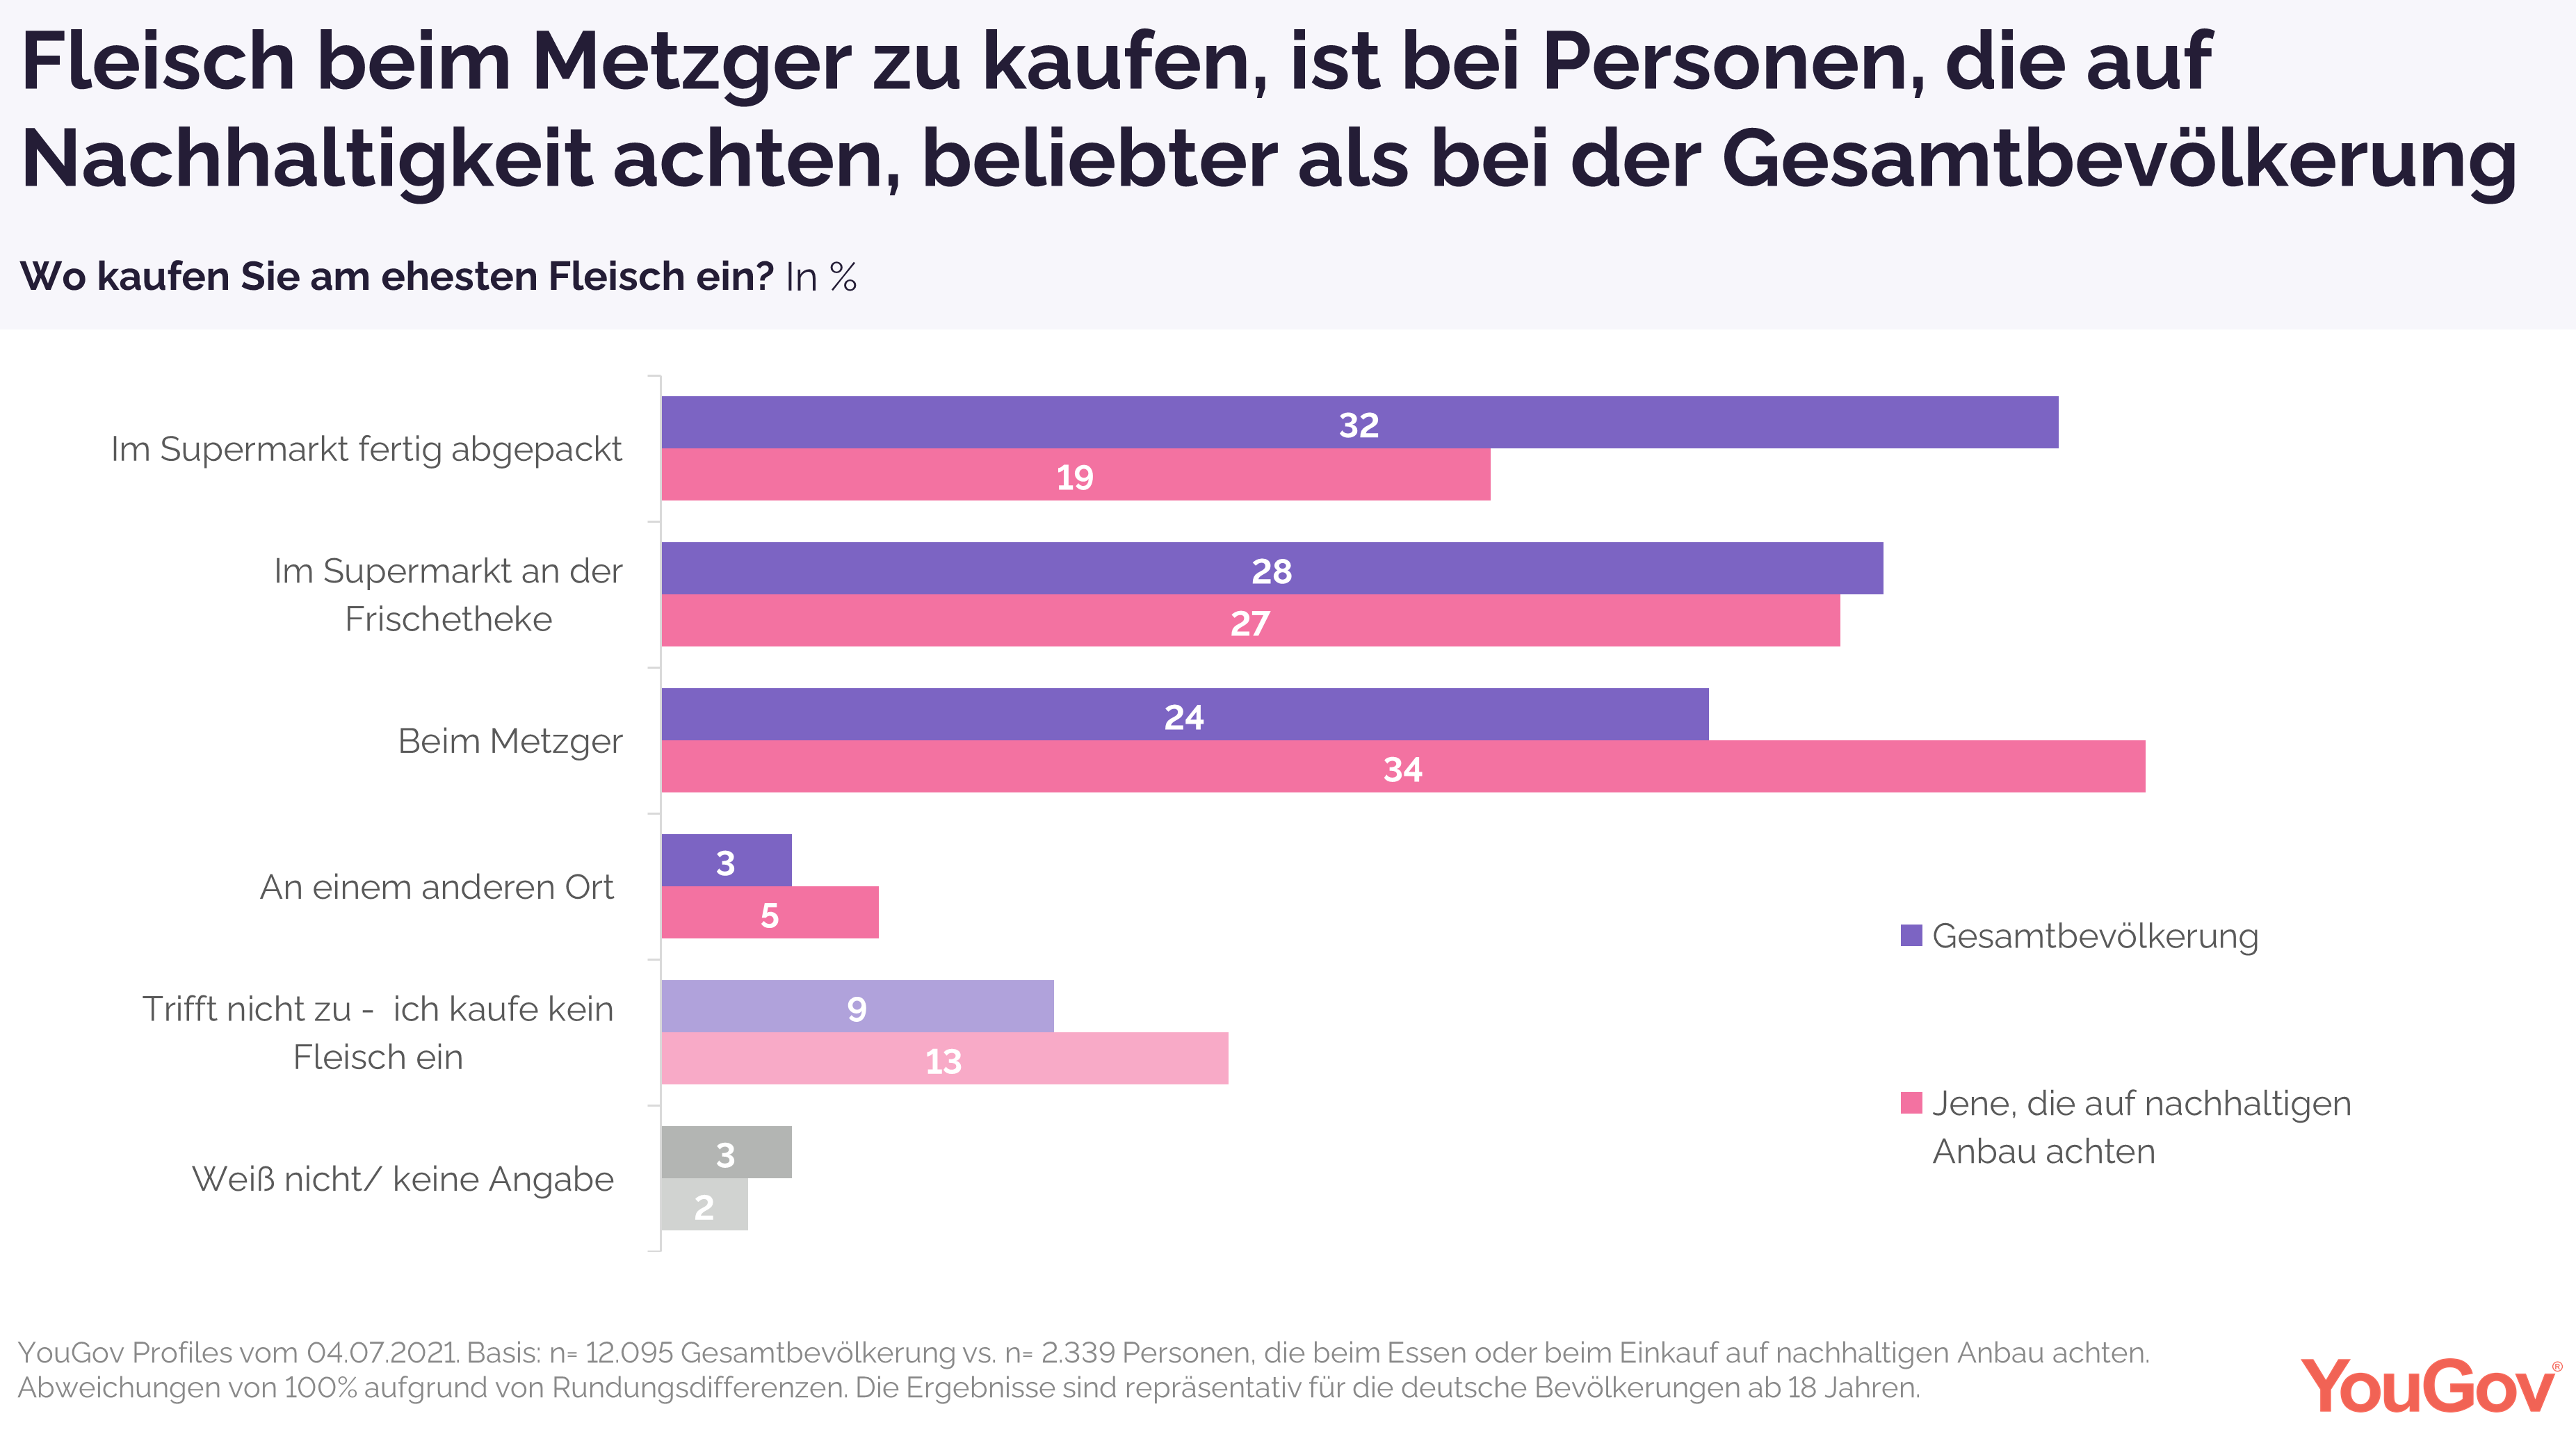
the highways by highway workers. (Ipsos France) July 30, 2021 (Germany) The majority of Germans are in favor of butcher shops, but
buy meat in the supermarket Butchers are becoming increasingly rare in
the cityscape. The majority of German consumers (60 percent) state that
they are now most likely to buy their meat in the supermarket, either
pre-packaged (32 percent) or at the fresh food counter (28 percent). A
quarter of those surveyed (24 percent) say that they are most likely to buy
meat and sausage products from the butcher. The percentage distribution
among people who pay attention to sustainable cultivation when eating and
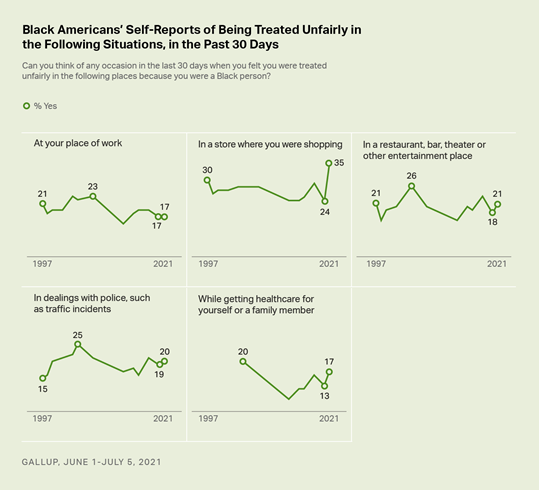
shopping is somewhat different. (YouGov Germany) July 28, 2021 NORTH AMERICA (USA) 54% Of Black Americans Report Unfair Treatment In At Least
One Situation WASHINGTON, D.C. -- Black Americans' self-reports
of being treated unfairly in a variety of situations are generally steady or
higher rather than declining. This includes a new high of 35% who say they
personally were treated unfairly while shopping during the past 30 days, up
from 24% last year. In five other situations, reports of recent unfair
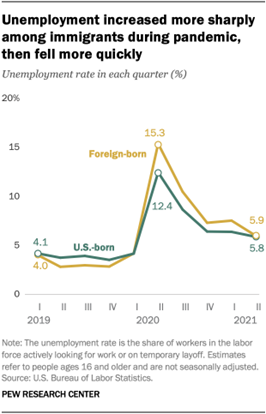
treatment are similar to a year ago, and range from 17% to 21%. (Gallup) JULY 27, 2021 Unemployment Increased More Sharply Among Immigrants 15.3%
During Pandemic In the first quarter of 2019, immigrant and
U.S.-born workers each had an unemployment rate of about 4.0%. It dipped
below that level for much of 2019 for both groups, but more so for
immigrants. By the first quarter of 2020, the unemployment rate for
foreign-born workers (4.1%) was back on par with that of U.S.-born workers,
not seasonally adjusted. The onset of the pandemic sent the unemployment rate
for immigrants soaring higher than the rate for U.S.-born workers. By the
second quarter of 2020, the unemployment rate for foreign-born workers had
reached 15.3%, compared with 12.4% for U.S.-born workers. (PEW) JULY 26, 2021 47% Say U.S Military Involvement In
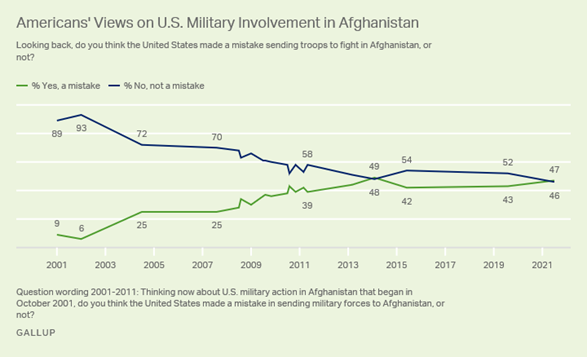
Afghanistan Was A Mistake 46% Say It Was Not As the U.S. military continues its drawdown
of troops in Afghanistan, Americans are evenly divided in their views on
whether it was a mistake for the U.S. to send troops into the country nearly
20 years ago. This is in contrast with most of the readings over the past two
decades, which have found Americans generally more positive than negative
toward the effort there. This is only the second time that less than half of
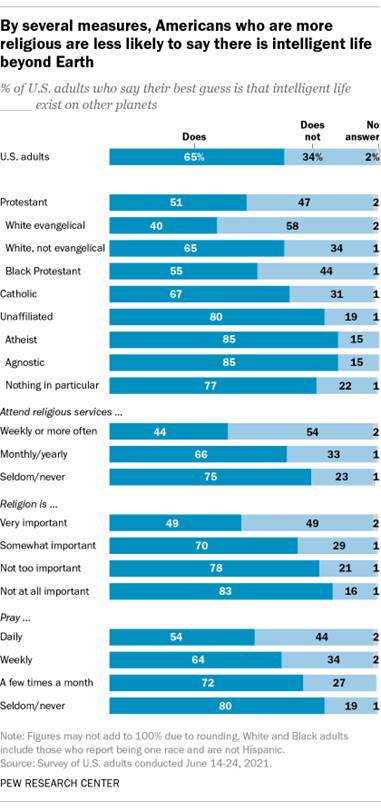
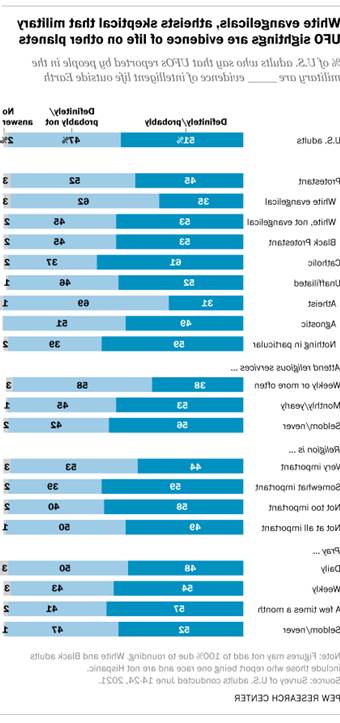
Americans (46%) say U.S. involvement was not a mistake. (Gallup) JULY 26, 2021 Around Half Of Americans Who Say Religion
Is Very Important To Them (49%) Say Their Best Guess Is That Intelligent Life
Exists On Other Planets This is evidenced by a variety of measures
of religious engagement. For example, U.S. Christians are far less likely
than religiously unaffiliated Americans to say that their “best guess” is
that intelligent life exists on other planets (57% vs. 80%). And U.S. adults
who attend religious services on at least a weekly basis are considerably
less likely than those who seldom or never attend services to say that
intelligent life exists elsewhere (44% vs. 75%). (PEW) JULY 28, 2021 (Canada) Half (49%) Of Canadians Say Recent Events Make Addressing
Climate Change More Urgent, But Are Less Willing To Pay To Help Younger Canadians are more likely to say
their opinion about climate change has changed, and they feel more urgent
about climate change than in the past (56% 18-34 vs.43% 35-54, 49% 55+). As
well, those with a university degree are more likely to say they feel more
urgent about climate change than in the past (58% univ grad, 47% post sec,
47% high school, 40% less than high school). Older Canadians (46% 55+, 46%
35-54, 34% 18-35) are more likely to say their opinion has not changed. (Ipsos Canada) 28 July 2021 Most Canadians Worried About COVID-19 Variants (81%),
Fourth Wave (69%) A recent Ipsos poll on conducted on behalf
of Global News finds that though six in ten (62%) feel the current uptake of
the vaccine will help Canada avoid a fourth wave of the pandemic, the
majority (81%) of Canadians say they are worried that the new COVID-19
variants will delay a return to normal. While there are few highly
significant differences by age or gender in terms of sentiment on Canadians’
future with COVID, region plays a large role in opinion, linked to the
differences in how Canadians in different parts of the country experienced
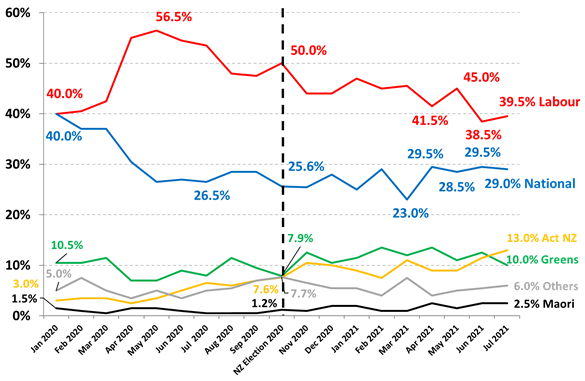
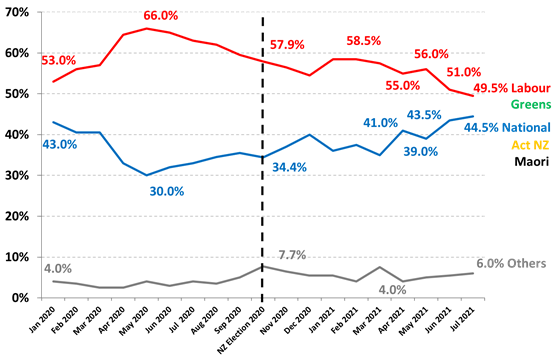
the pandemic over the last year. (Ipsos Canada) 29 July 2021 AUSTRALIA (New Zealand) Support For New Zealand’s Labour/Greens Government Dropped
1.5% Points To 49.5% In July Support for National was virtually unchanged
at 29%, down 0.5% points, while the big mover was Act NZ which increased its
support by 1.5% points to a record high 13%. This is the first time since
2002 that Act NZ has gained a higher level of support than the Greens.
Support for the Maori Party was unchanged at 2.5%. A small minority of 6% of
electors support other minor parties outside Parliament with support for The
Opportunities Party up 1% point to a record high 3%, support for NZ First up
0.5% points to 2% in July. (Roy Morgan) July 30 2021 MULTICOUNTRY STUDIES On Average, 56% Agree Their Country’s Society Is Broken And
57% Agree That Their Country Is In Decline On average, 56% agree their country’s
society is broken and 57% agree that their country is in decline. To fully
grasp the prevalence of social and political disaffection, Ipsos designed the
“System Is Broken” Index, based on the level of agreement with five
statements, “The economy is rigged to favor the rich and powerful” (averaging
71% agree in the 25 countries surveyed), Traditional parties and politicians
don’t care about people ‘like me’” (68%),“Local experts don’t understand the
lives of people ‘like me’” (65%),The country “needs a strong leader to take
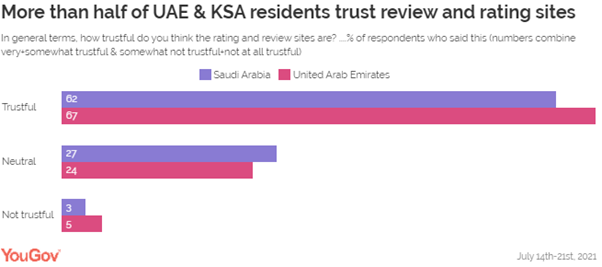
the country back from the rich and powerful” (64%) (Ipsos MORI) 28 July 2021 More Than Half Of UAE & KSA Residents
67% And 62% Trust Review And Rating Sites And Find Them To Be Useful In UAE, more than two-third (67%) of
residents trust review and rating sites, while only 5% indicated a distrust.
Similar attitudes are held by the KSA public, where 62% showed confidence in
these sites, and a very small number said they do not trust them (3%). Notably,
a sizable proportion of consumers in both countries haven’t made up their
minds about these sites and remain undecided about their reliability (27% in
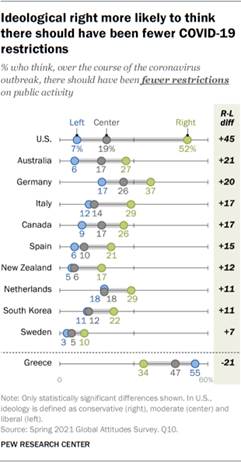
KSA & 24% in UAE). (YouGov MENA) July 29, 2021 Source: https://mena.yougov.com/en/news/2021/07/29/more-half-uae-ksa-residents-trust-review-and-ratin/ Those On Ideological Right Favor Fewer
Covid-19 Restrictions In Most Advanced Economies In most
countries surveyed, those on the ideological right are particularly likely to
say there should have been fewer restrictions on public activity over the
course of the coronavirus outbreak. In keeping with previous findings, ideological divides between the left and
right are
largest in the United States with 52% of conservatives and 7% of liberals
saying there should have been fewer restrictions. (The U.S. portion of the
survey was conducted earlier than others, in early February.) Right-leaning
people are significantly more likely to say restrictions went too far in nine
other nations surveyed. (PEW) JULY 30,
2021 ASIA
701-43-01/Polls A Fourth
(23%) Of The Polled Respondents Who Said They Were Planning To Purchase A
Two-Wheeler A Majority Went Ahead With Their Plan (56%), A Sizeable Proportion
(44%) Are Yet To Act On It
New data from a recent YouGov study among
2022 urban Indians shows prior to the second wave (before March 2021) of
Covid almost a fourth (23%) of the polled respondents said they were planning
to purchase a two-wheeler. While a majority went ahead with their plan (56%),
a sizeable proportion (44%) are yet to act on it. A vast majority (84%) among those who
intended to buy a two-wheeler and haven’t bought it yet said that the second
wave of the pandemic impacted their purchase plan in some form. The most
common impact (52%) was the postponement of the plan. While over a third have
reduced their budget (35%), there are some who have increased it (14%).
Notably, this increase in budgets is mostly reported by the millennials and
those who reside in the tier 1 cities, who might have saved up during
the second lockdown and have now decided to spend more on their two-wheeler
purchase. Few others (close to 1 out of 5) intend to
buy a car (new/second hand), while 15% would go for secondhand two-wheeler
and a similar proportion have completely dropped their plan to buy a
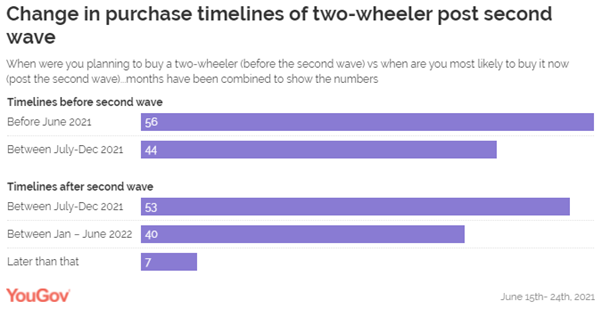
two-wheeler. The second wave of the pandemic brought
about changes in the purchase timelines as well. Initially (before the second
wave), 56% of urban Indians were planning to buy a two-wheeler before June
2021, and 44% had planned to buy it in the latter half of the year (Jul-Dec
2021). With the emergence of the second wave, more
than half (53%) plan to purchase a two-wheeler in the upcoming festive season
(July-December 2021). The rest, however, (47%) are likely to hold onto their
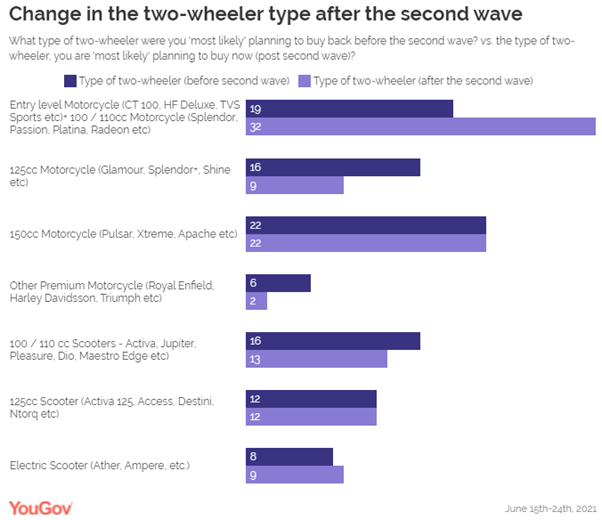
plans a bit longer and will consider making a purchase sometime next year. While the budgets have increased (14%) or
decreased (35%), from a vehicle type perspective the demand sees a surge (19%
to 32%) for 100/110 cc motorcycle. Fall in intent to purchase 125cc
motorcycle has been observed, while intention for other vehicle types remain
stable.
(YouGov India) July 27, 2021 Source: https://in.yougov.com/en-hi/news/2021/07/27/more-half-pent-demand-2-wheelers-likely-be-recover/ 701-43-02/Poll 7 Out Of 10
People Who Have Heard Of The Delta Variant Think That The 4th Wave Will Be
Experienced Because Of This Variant
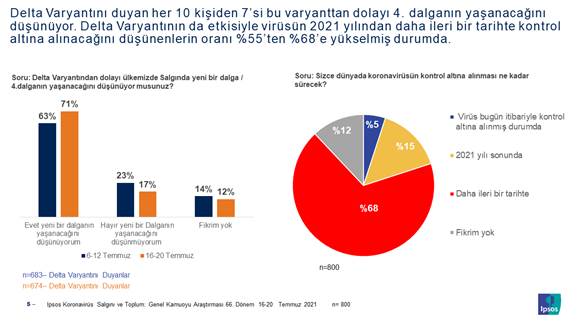
7 out of 10 people think this variant will
cause the 4th wave in the epidemic 71% of those who know about the delta
variant think that there will be a 4th wave in the epidemic because of this
variant. The rate of those who thought this way in the previous week was
63%. Only 17% think that a new wave will not occur. Parallel to the
increase in both the delta variant and the number of cases, 68% of the population
think that the epidemic can be brought under control later than 2021.
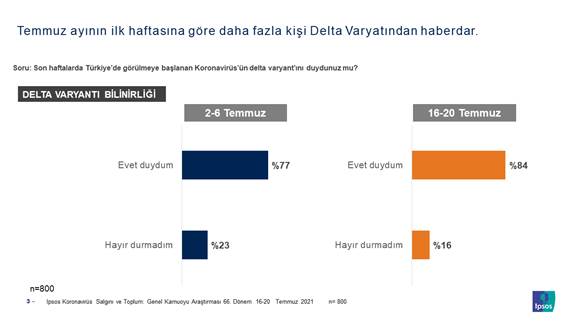
According to the research conducted by the
Ipsos research company; The awareness of the Delta Variant, which spread
rapidly both in the world and in Turkey, increased by 7 points compared to
the first week of July and reached 84%. The rate of those who have not
heard of this variant is 16%.
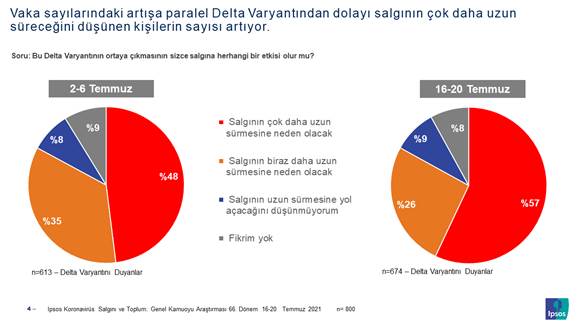
The majority of people who know the delta
variant think that the duration of the epidemic will be prolonged because of
this variant. 57% of individuals state that this variant will cause the
epidemic to last much longer, while 26% state that it will last a little
longer. The rate of those who think that it will take much longer has
increased by 9 points compared to the previous period.
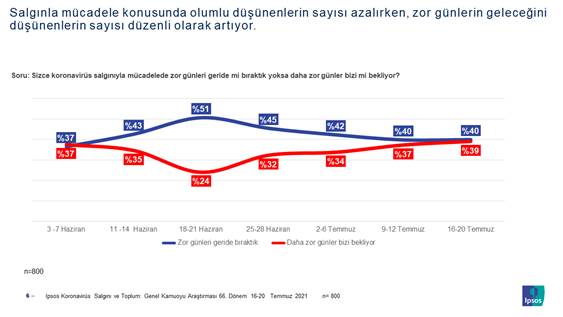
While the society thinks more positively
about the course of the epidemic in mid-June, the number of those who think
that more difficult days will come today, with the increase in the number of
cases, is increasing. While the rate of those who think that difficult
days will come on 18-21 June is 24%, this rate rises to 39% in the week of 16-20
July.
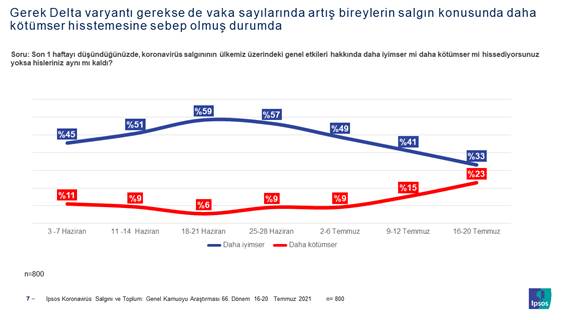
Society Is More Pessimistic About The
Impact Of The Pandemic On Our Country Again, while the rate of those who felt
more optimistic about the impact of the epidemic on our country in mid-June
was 59%, this optimistic view dropped rapidly to 33% in the week of July
16-20. The rate of those who feel pessimistic due to the effect of the
epidemic is increasing. Today, ¼ of the society is more pessimistic
about the general effects of the coronavirus epidemic on our country.
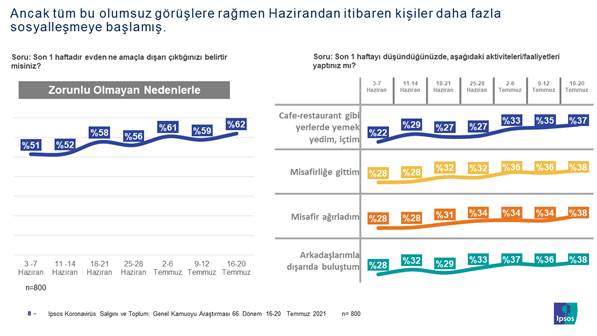
Despite the negative opinions in the
society due to the delta variant, individuals have started to socialize more
with the warming of the weather and the lifting of the bans. While 51%
of the society went out for non-essential reasons at the beginning of June,
this rate has increased to 62% today. 4 out of 10 people have been
involved in activities such as eating out, meeting with friends, visiting or
hosting in the last week.
Ipsos, Social Research and Qualitative
Research Service Units Leader, Executive Board Member Ece Ertürk made the
following evaluations about the data;With the Delta
variant, awareness and knowledge increase. With the increase of this
awareness, it is thought that Delta Variant will have a negative impact on
the course of the process. Compared to the previous weeks, the rate of
those who think that the Delta Variant will affect the longevity of the
epidemic has increased by 9 points to 57%. In other words, about 60% of
the population believe that the delta variant will have a serious effect on
prolonging the process. In relation to this, the expectation for the 4th
Wave has increased and the expectation that the epidemic will end at the end
of 2021 has shifted to a later date with a very high rate of 68%. With
the effect of the Delta Variant, the relaxation of socialization with the
normalization and the increase in numbers again, a negative and pessimistic
atmosphere began to form in the society. The thought of harder days to
come makes people feel hopeless. While we expect a different order in
business life and education at the end of the summer than 2020, it is obvious
that social and individual responsibilities should be remembered again so
that our hopes are not delayed with these trends and developments. don't let
it come to spring. (Ipsos Turkey) 26 July 2021 MENA
701-43-03/Poll According To
55% Of Tunisians Democracy Is Always Preferable
As Tunisia’s major political crisis unfolds,
some commentators have argued that the country’s citizens never wanted democracy in
the first place.
However, data from Arab Barometer presents a different picture. In recently
conducted surveys from the Arab Barometer’s sixth
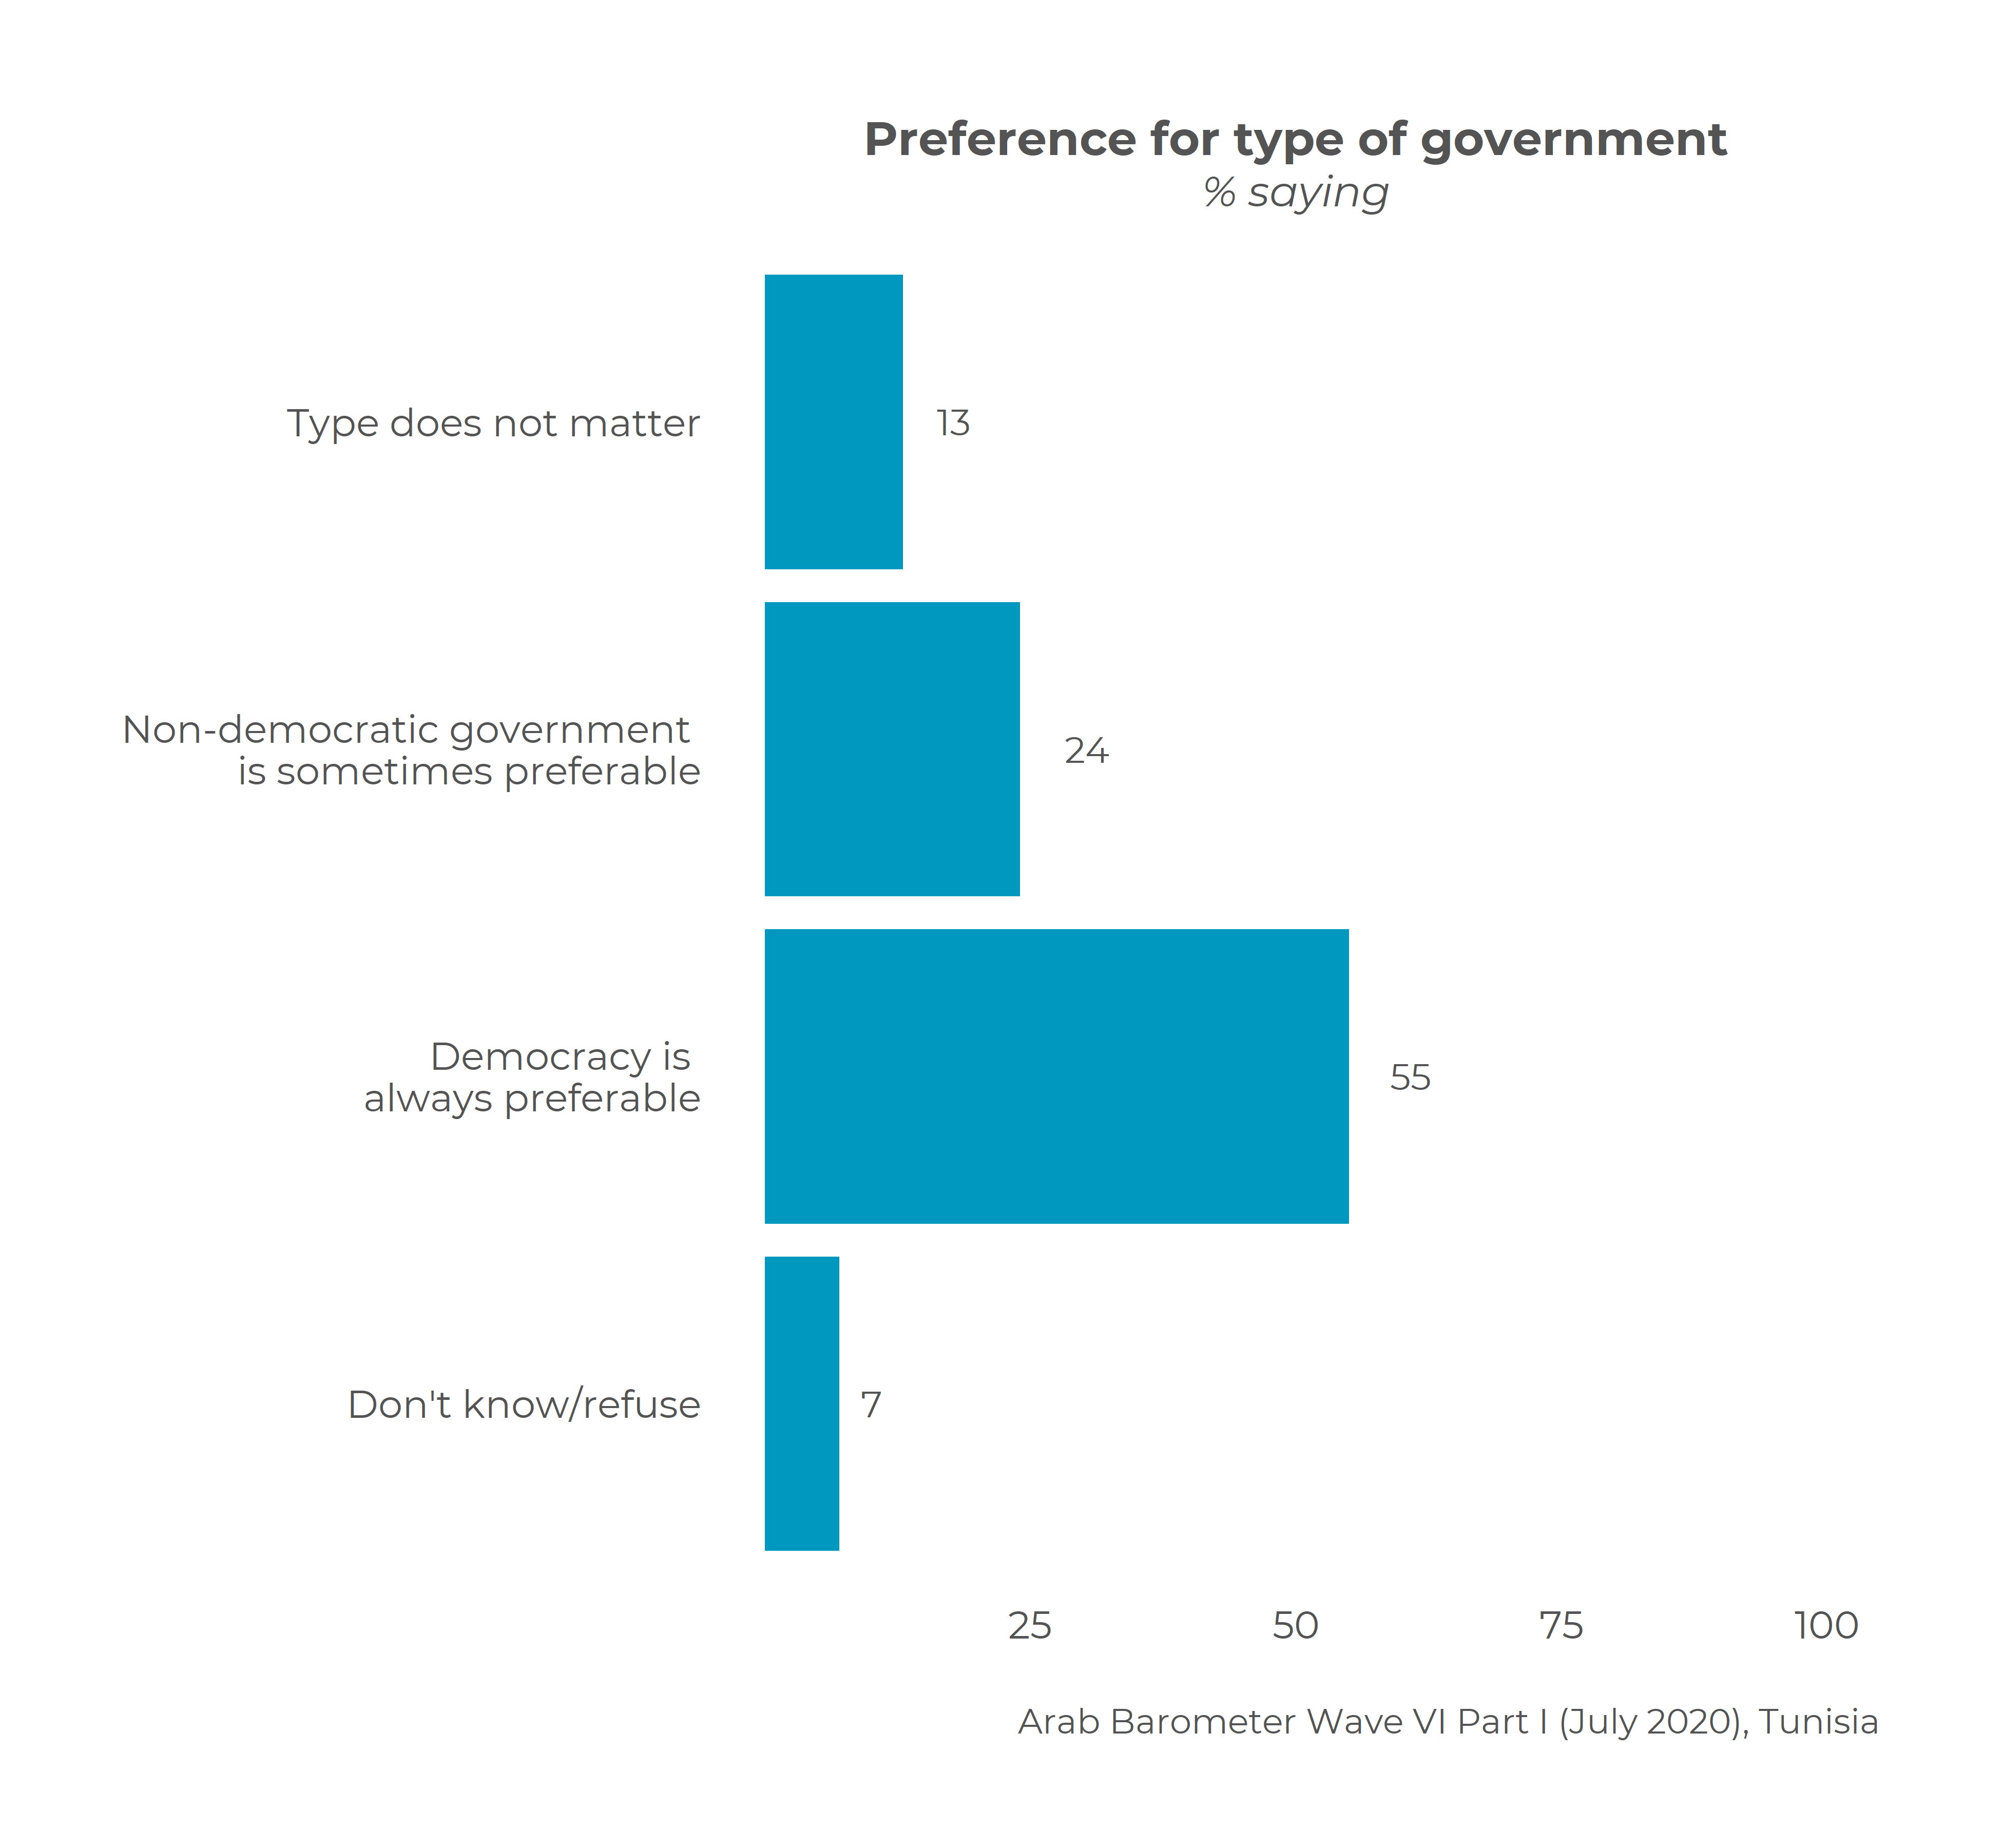
wave, a majority of Tunisians say that democracy
is always preferable to other forms of government compared to just a quarter
who say non-democratic governments can sometimes be better. Moreover,
three quarters of Tunisians say that freely choosing leaders in free and fair
elections is an essential characteristic of democracy.
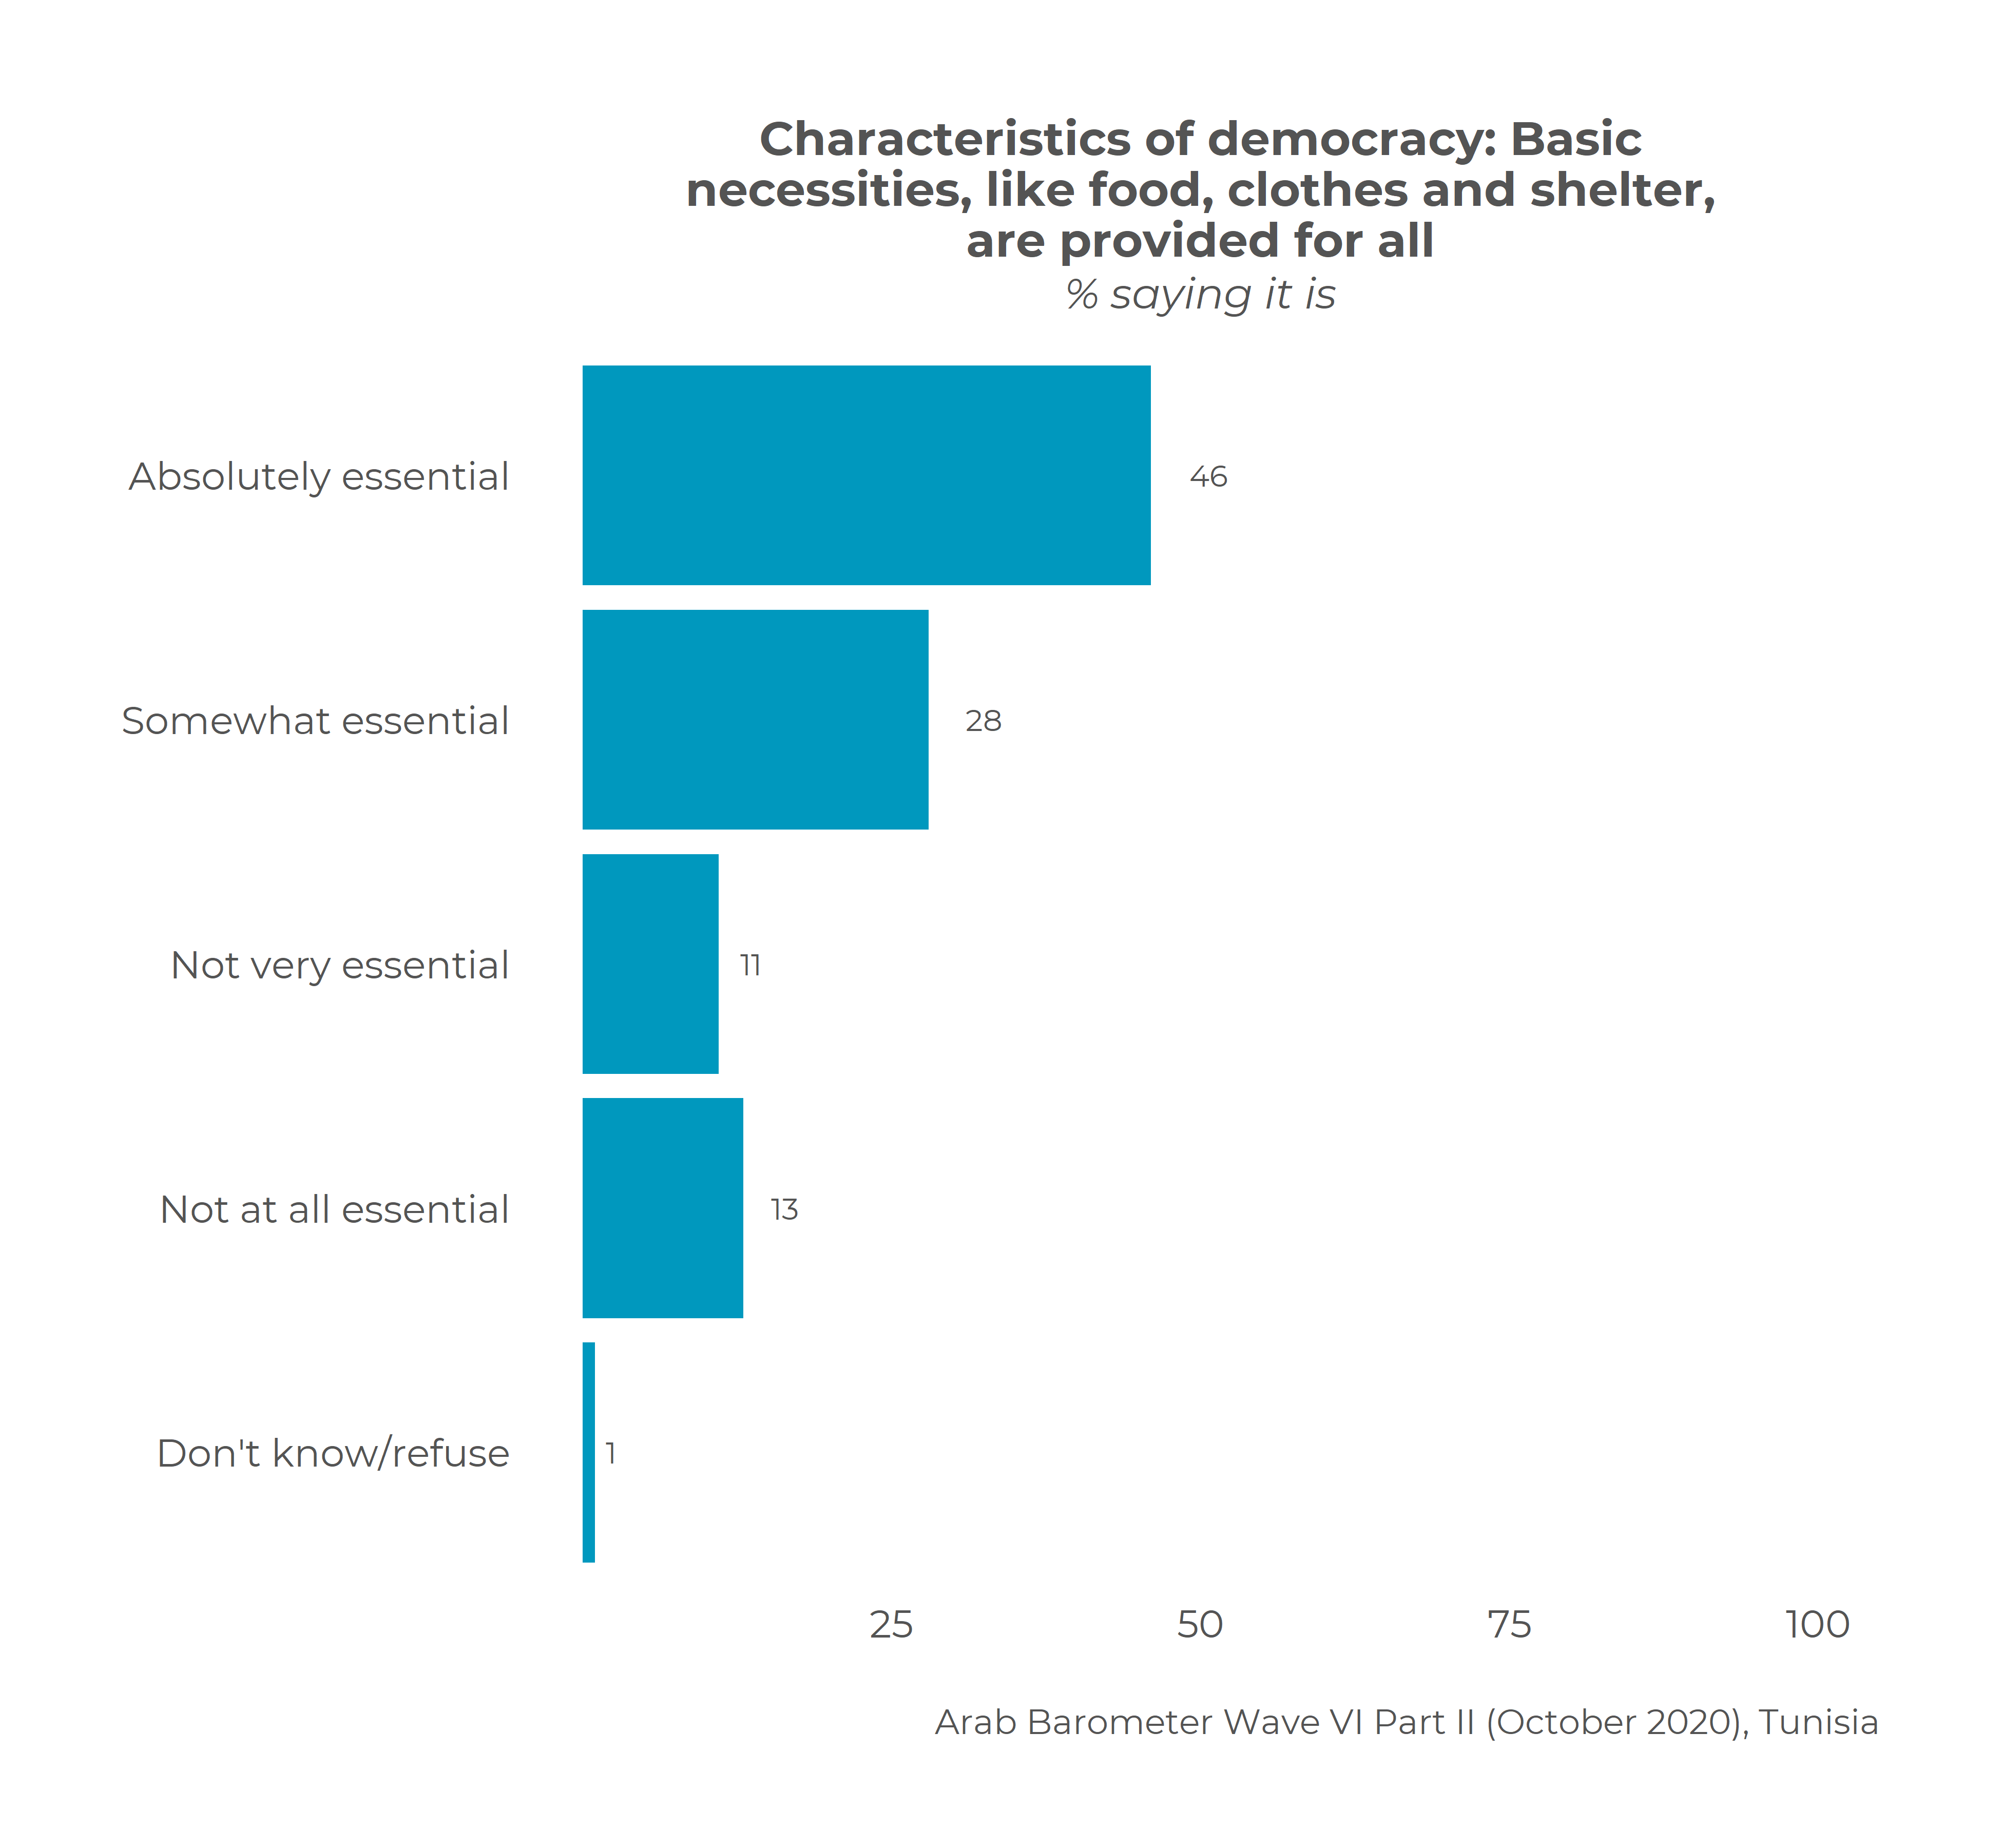
At the same time Tunisians also define
democracy in terms of economic outcomes. Three-quarters also say that an
essential characteristic of democracy is ensuring all citizens have basic
necessities like food, clothing, and shelter. Given the dismal state of
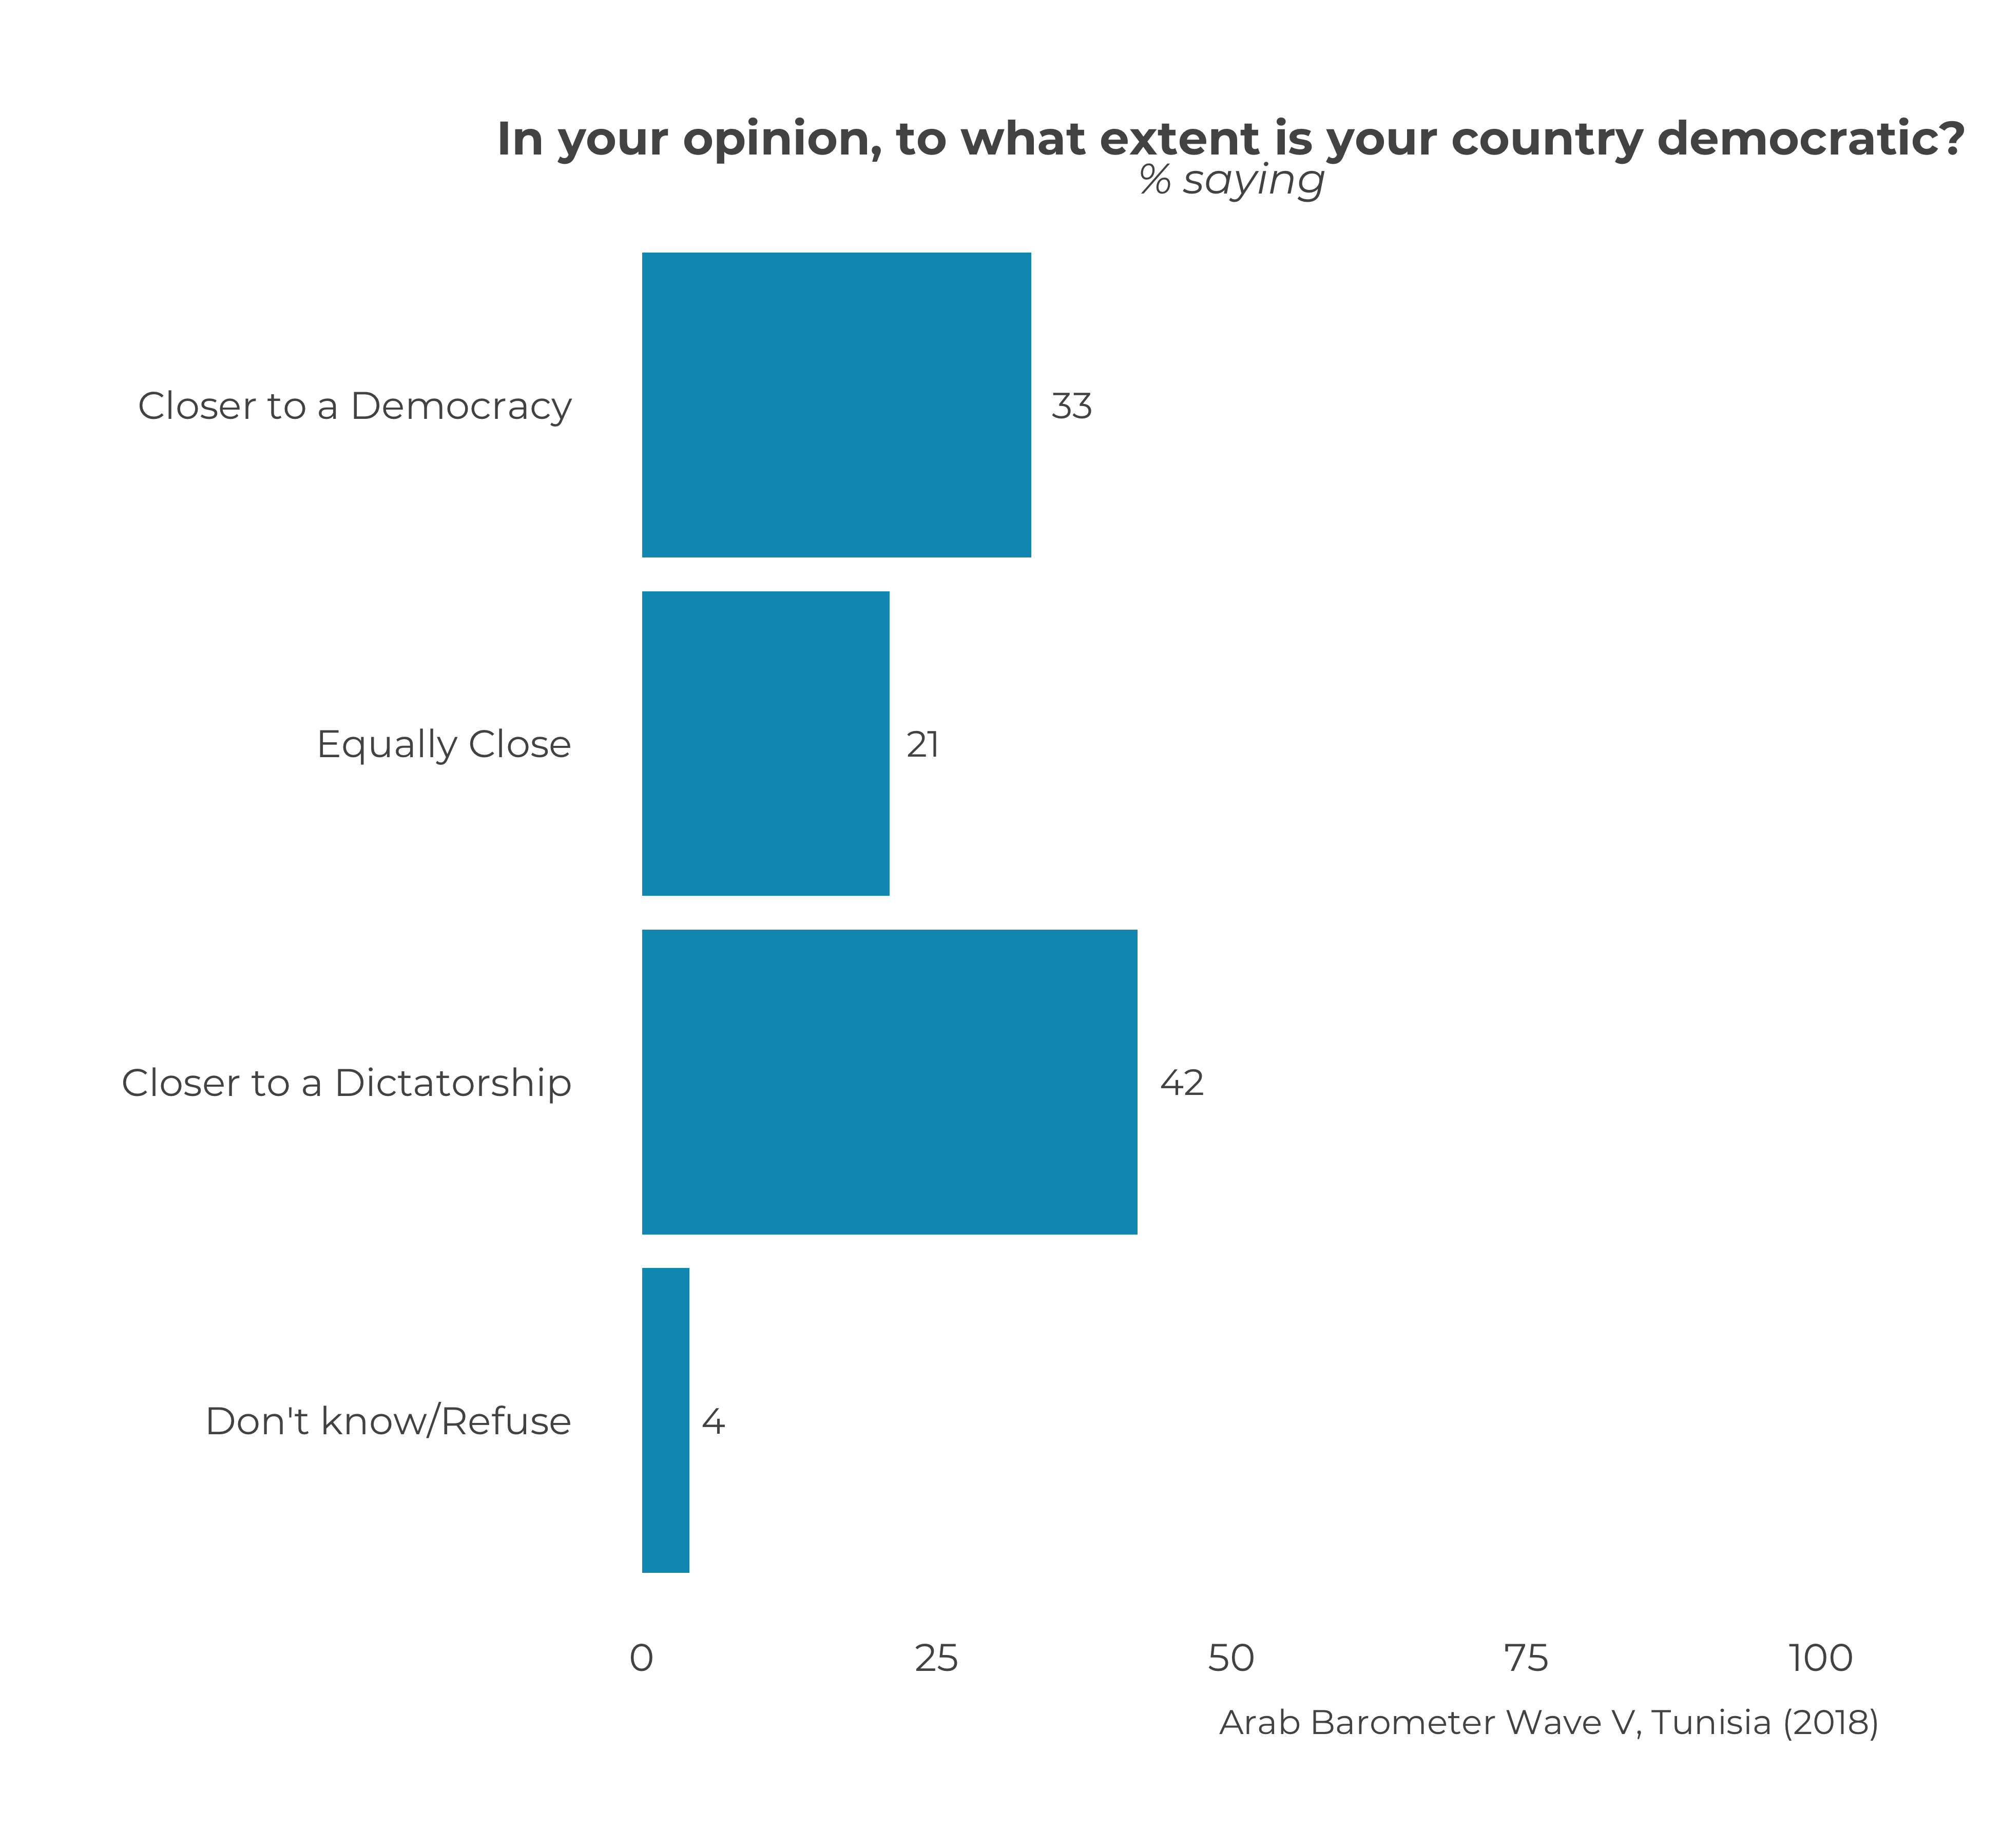
economic conditions in recent years, Tunisians
have become increasingly frustrated with
their political system. Perhaps this is why in 2018, only a third of citizens
rated Tunisia as being closer to a democracy than a dictatorship.
In short, Arab Barometer results make clear
that Tunisians want democracy. What pundits seem to have missed is that
relatively few Tunisians believe they currently live in a democracy. Building
a full and inclusive democracy that meets the basic demands of citizens is
what Tunisians have been demanding for years. Unfortunately, political elites
have failed to deliver those outcomes since the revolution of 2011. (Arabbarometer) July 29, 2021 Source: https://www.arabbarometer.org/2021/07/tunisias-democratic-pulse/ AFRICA
701-43-04/Poll 80 Percent
of Adult Nigerians Do Not Support Scrapping of the National Youth Service Corps
(NYSC)
Abuja, Nigeria 20th July
2021 – A new public opinion poll conducted by
NOIPolls has revealed that 8 in 10 adult Nigerians do not support the
scrapping of the National Youth Service Corps (NYSC) and there are more
Nigerians from the North-East zone (88 percent) who made this assertion. This
is in line with the position of the Sultan of Sokoto, Sa’ad Abubakar, who
spoke when he hosted some selected members of NYSC Batch A stream 2 Corps
members posted to Sokoto state in his palace in May 2021.[1] The emir further explained that the
NYSC scheme was established to foster the nation’s unity and strengthen ties
among Nigerians. According to him, the NYSC scheme is the most needed
programme in view of the present situation when Nigeria is almost divided
along ethnic and religious lines.[2] More findings revealed that out of the 80
percent who do not support the scrapping of the scheme, a larger proportion
(30 percent) believe that the scheme encourages cultural integration in the
country. While 27 percent consider it to be an avenue for exposure and
self-development, 17 percent believe it helps the youths in various ways.
However, of the 13 percent of Nigerians who support the scrapping of the
scheme, 56 percent based their reason mostly on current security challenges
in the country. The poll results further indicated that
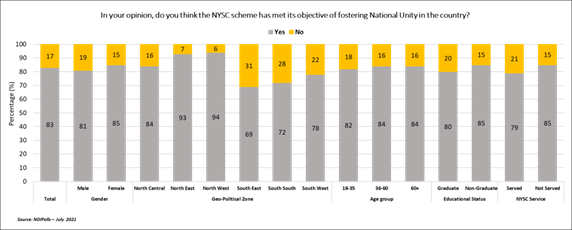
most Nigerians (83 percent) who were interviewed admitted that the scheme has
met its objectives of fostering National Unity in the country. Interestingly,
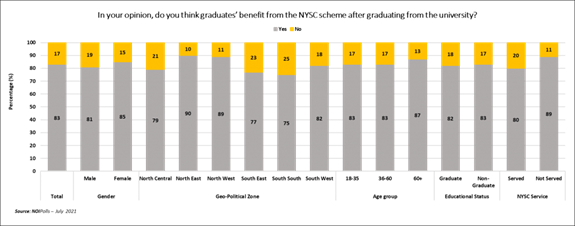
83 percent stated that graduates do benefit from the scheme and when probed
further, monthly allowance (30 percent), intercultural relationship (17
percent), and self-development (12 percent) were the three top benefits
mentioned amongst others. In a country where some families toil day and
night to make ends meet, the impact of the N33,000 monthly allowance paid to
Youth Corps members cannot be undermined considering the adverse effect of
scrapping the scheme. With regards to modifying the scheme, 24
percent of adult Nigerians would like the scheme to be modified in such a way
that the corps members get employed immediately after their service year.
Therefore, rather than scrapping it, the government and concerned
stakeholders should laisse with private companies and organizations to
gainfully employ a certain percentage of Youth Corps members after completing
their service year. These are some of the key findings from the NYSC poll
conducted in the week commencing 12th July
2021. Survey Background The NYSC service was created as a federal
government response to the gulf of divide and disunity that existed amongst
Nigerians after the 30 grueling months of the civil war, which gulped
thousands of lives and left in its wake wanton destructions of properties of
monumental proportions. The cardinal reason for the creation of the service
scheme is to heal the wounds the nation is nursing as an effect of the
unfortunate and undesired civil war. It was meant to reconstruct, reconcile,
and rebuild the country after the Nigerian Civil war. The NYSC service scheme was created on the
22nd of May 1973 by decree No.24 which stated that the NYSC
service scheme is established “with a view to the proper encouragement and
development of common ties among the youths of Nigeria and the promotion of
national unity”. The scheme has the primary purpose of inculcating in
Nigerian Youths the spirit of selfless service to the community, and to
emphasize the spirit of oneness and brotherhood of all Nigerians,
irrespective of cultural or social background.[3] After more than four decades of the
establishment of the scheme, the debate has always reared on whether the
scheme has achieved its aim or not and if there is a need to scrap the NYSC
and replace it with another scheme. It is, however, a matter of debate in the
National assembly if the scheme should be scrapped or not. The proponents of
the scrapping are sighting issues of insecurity, unemployment, influencing
posting among corps members as some of the reasons for the scrapping of the
scheme while those opposing the scheme are citing the gains of fostering
unity amongst Nigerians which the scheme has achieved over the years, as the
reason why the scheme should continue to exist. It is indeed common knowledge that corps
members are now posted to states within the region of their origin thereby
questioning the issue of fostering unity which the scheme seeks to
achieve. “If you
cannot be posted out of your region due to insecurity, then why mobilizing
people for the scheme and where is the unity the scheme seeks to achieve?” queried
a concerned citizen. Whether or not the service scheme will be scrapped is
left to be seen but the debate rages on and Nigerians of different walks of
life are sharply divided amongst the lines of scrapping or not. In the heat
of the debate, NOIPolls conducted a poll to gauge the opinions of Nigerians
regarding the 1-year service scheme. Survey Findings To enable Nigerian youths, acquire the
spirit of self-reliance by encouraging them to develop skills for
self-employment. To contribute to the accelerated growth of the national
economy. To develop common ties among the Nigerian youths and promote
national unity and integration.[4] Given the above, 83 percent of adult
Nigerians interviewed disclosed that the NYSC scheme has met its objectives
especially in fostering National Unity in the country. Interestingly, further analysis revealed
that there are slightly more non-graduates (85 percent) than graduates (80
percent) who believe that the NYSC scheme has met its objectives in the
country. Likewise, respondents who did not participate in the 1-year NYSC
program are more (85 percent) than the respondents who have gone through the
scheme.
With regards to the benefit of the scheme,
83 percent of adult Nigerians admitted that the Nigerian graduates benefit
from the NYSC scheme after graduating from the University. Nigerians residing
in the North East (90 percent) had more respondents who indicated that the
NYSC scheme is beneficial to graduate. Also, respondents who did not
participate in the 1-year NYSC program are more (89 percent) than those (80
percent) who have gone through the scheme.
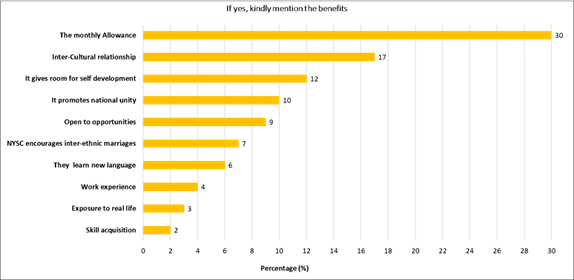
Subsequently, the poll result revealed that
monthly allowance (30 percent) is the main benefit of the NYSC scheme as
mentioned by 30 percent of the respondents who indicated that there are
benefits from the scheme. Other mentions include intercultural relationships
(17 percent), self-development (12 percent), promotes national unity (10 percent),
and access to various opportunities amongst other benefits.
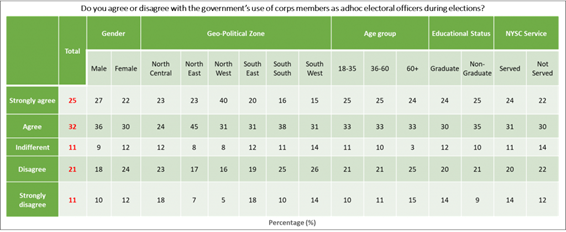
Furthermore, when asked about the
government’s use of corps members as Adhoc staff during elections, a majority
of the respondents (57 percent) agreed with the government’s use of corps members
as Adhoc electoral officers during elections in the country. On the other hand, 32 percent of the
respondents disagreed with the government’s use of corps members as Adhoc
staff whereas 11 percent did not have a definite opinion on the topic as they
neither agree nor disagree with the use of corps members as Adhoc staff
during elections.
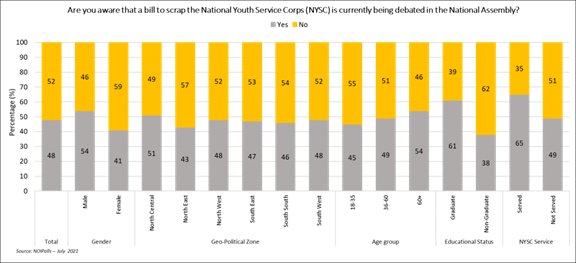
With regards to a bill to scrap NYSC which
is currently being debated in the National Assembly, 52 percent of adult
Nigerians claimed that they are not aware that a bill to scrap the scheme is
being debated in the National Assembly. On the contrary, 48 percent
acknowledged awareness of the bill being debated in the National Assembly. The poll further revealed that respondents
who are aware of this bill are mostly Nigerians (65 percent) who have
participated in the scheme in the past. Also, there are more graduates (61
percent) than non-graduates (38 percent) who are aware of the bill in the
National Assembly.
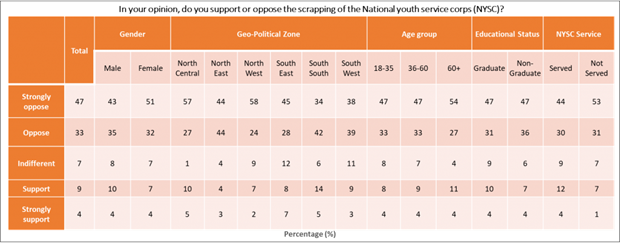
Regardless of awareness, when respondents
were asked if they support or oppose the scrapping of the NYSC, the poll
result revealed that 80 percent of adult Nigerians do not support the
scrapping of the NYSC scheme. Analysis by geo-political zone revealed that
there are more Nigerians from the North-East zone (88 percent) who made that
assertion. Contrarily, 13 percent of the respondents support the scrapping of
the scheme while 7 percent neither support nor oppose the bill. It is worthy to note that analysis by
educational status shows that there are more non-graduates (83 percent) than
graduates (78 percent) who do not support the scrapping of NYSC. Likewise,
there is a large proportion of respondents (84 percent) who did not
participate in the scheme yet do not support that it should be scrapped.
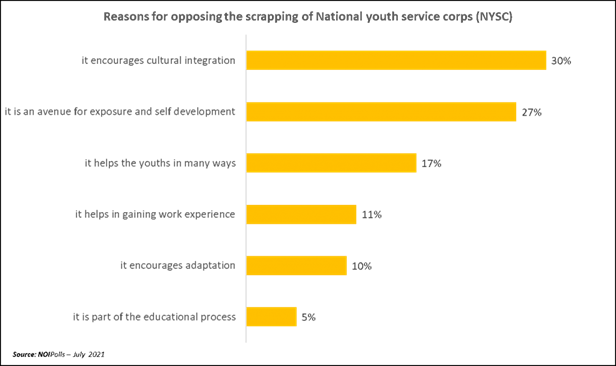
Further probing revealed that out of the 80
percent, a larger proportion of adult Nigerians (30 percent) who do not
support the scrapping of the NYSC scheme believe that the scheme
encourages cultural integration. While 27 percent consider it to be an avenue
for exposure and self-development, 17 percent believe it helps the youths in
various ways. Other reasons include gaining work experience (11 percent),
adaptation (10 percent), and completing the educational process.
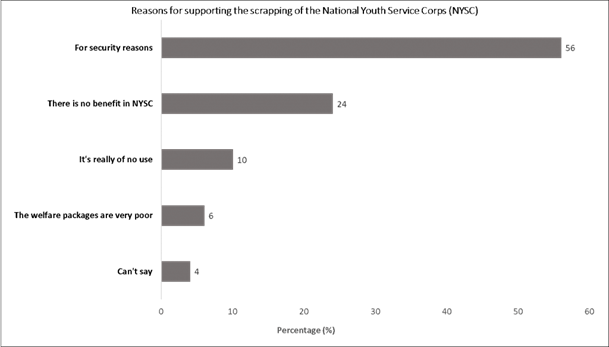
Of the 13 percent who supports the
scrapping of the scheme, 56 percent mentioned security challenges as the main
reason why they want the NYSC to be scrapped. While 24 percent stated that
the scheme has no benefit, 10 percent say it is of no use as well as a meager
6 percent who mentioned that the welfare packages are very poor.
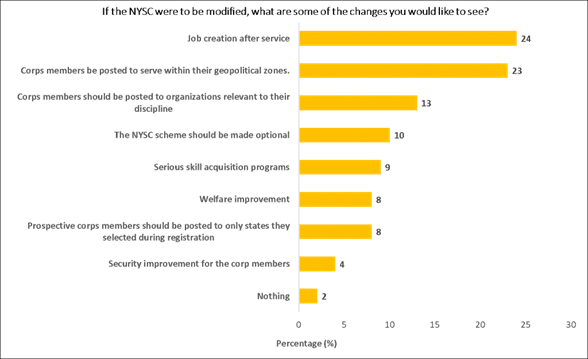
When asked: if the NYSC were to be
modified, what are some of the changes you would like to see? The finding
revealed that 24 percent of adult Nigerians would like the scheme to be
modified in such a system that the corps members get employed immediately
after their service year. This is closely followed by 23 percent who
mentioned that corps members should be posted for the 1-year scheme within
their geopolitical locations. In addition, 13 percent were concerned
about the specialization of the graduates as they stated that corps members
should be posted to organizations relevant to their discipline. it is also,
worthy to note that 1 in 10 adult Nigerians (10 percent) clearly mentioned
that the 1-year national service should be modified to be made optional.
Conclusion In conclusion, the poll has revealed that
most Nigerians do not support the scrapping of the NYSC scheme mainly due to
cultural integration. Asides the 83 percent assertion that the scheme has met
its objectives of fostering National Unity in the country, 83 percent also
believe that graduates do benefit from the scheme. Some of those benefits
include monthly allowance (30 percent), intercultural relationship (17
percent), and self-development (12 percent) amongst other benefits. Finally, 24 percent of adult Nigerians
would like the scheme to be modified in such a way that the corps members get
employed immediately after their service year. Therefore, rather than
scrapping it, the government and concerned stakeholders should laisse with
private companies and organizations to gainfully employ a certain percentage
of Youth Corpers after completing their service year. These are some of the
key findings from the NYSC poll conducted in the week commencing 12th July 2021. (NOI Polls) July 28, 2021 701-43-05/Poll Large
Majorities Say The Government Has Done “Fairly Well” Or “Very Well” In
Managing The Response To The Pandemic (77%)
A majority of Moroccans applaud the
government’s performance in managing the response to COVID-19 pandemic, including keeping the
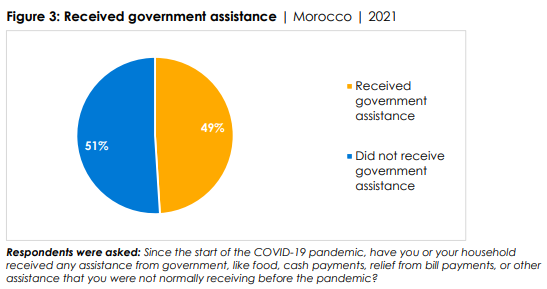
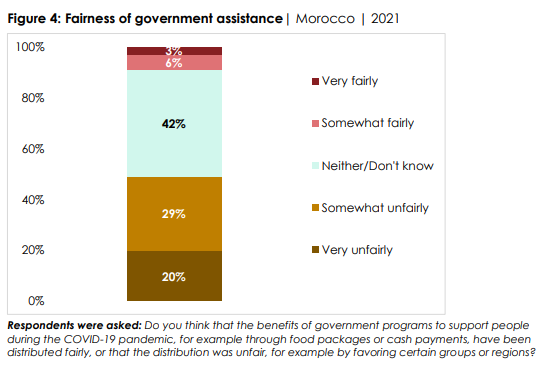
public informed, a new Afrobarometer survey shows. While half of citizens say they received
government assistance during the pandemic, a similar proportion believe the assistance was not
distributed fairly. Moreover, a majority of citizens believe
that at least some relief resources were lost to corruption. Key findings ▪ About one in eight citizens (13%)
say they or a member of their family became ill with COVID-19, and four in 10 (40%) say someone
in their household lost a primary source of income because of the pandemic (Figure
1). ▪ Large majorities say the government
has done “fairly well” or “very well” in managing the response to the pandemic (77%) and
keeping the public informed (86%) (Figure 2). ▪ But only about half (48%) say they
trust official COVID-19 statistics provided by the government, and six out of 10 (62%) believe
that “some” or “a lot” of COVID-19 relief resources have been lost to government
corruption. ▪ Half (49%) of Moroccans say their
household received special government assistance during the pandemic (Figure 3). ▪ But the same proportion (49%)
believe that government assistance was not distributed fairly (Figure 4). And 55% say the government is not doing
enough to support people who lost their jobs due to COVID-19. ▪ More than eight in 10 citizens
(82%) say they are “somewhat likely” or “very likely” to try to get vaccinated if a vaccine is available
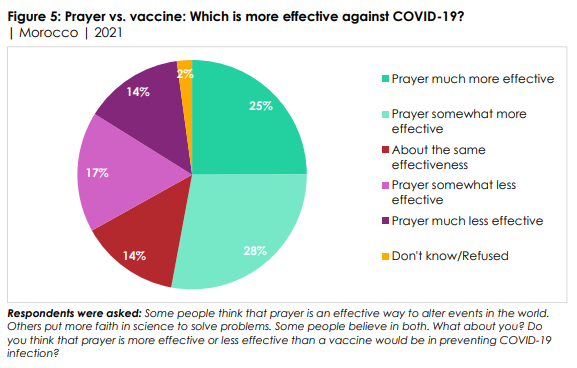
and the government says it is safe. ▪ But half (53%) of citizens say
prayer is more effective than a vaccine would be in preventing COVID-19 infection (Figure 5). (Afrobarometer) 29 Jul 2021 701-43-06/Poll Almost
Three-Fourths (73%) Of Citizens Say The National Dialogue Process In Zimbabwe
Should Go Beyond Political Parties
A new Afrobarometer survey shows that most Zimbabweans
think that the national dialogue process should go beyond political parties
and include participation by other stakeholders, including businesses, churches, and civil
society. But only about one in four citizens endorse
the Political Actors Dialogue (POLAD) framework as the only viable option for bringing
stability and development to Zimbabwe, while almost half of citizens do not offer an opinion on
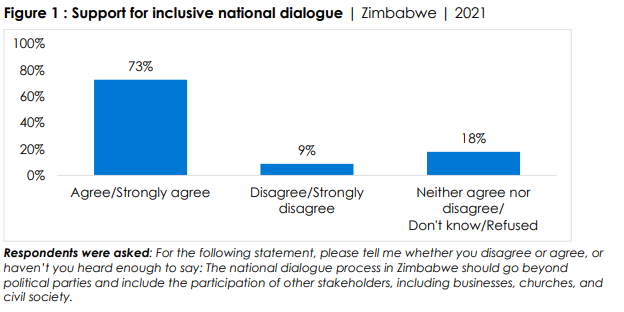
the POLAD framework. Key findings Almost three-fourths (73%) of
citizens say the national dialogue process in Zimbabwe should go beyond political parties to
include other stakeholders, such as businesses, churches, and civil society organizations
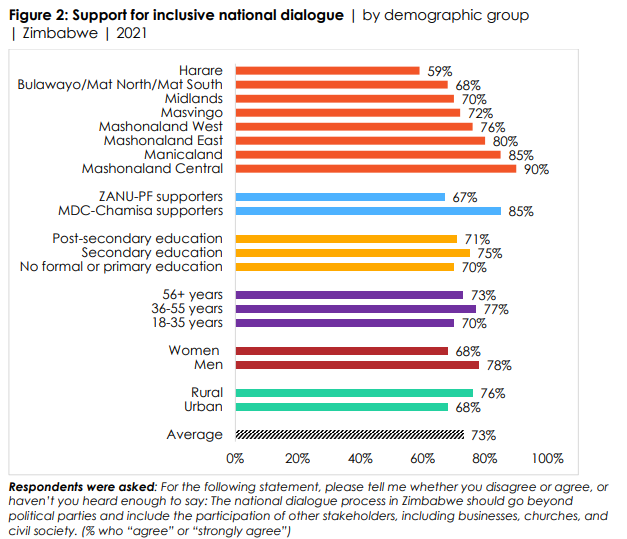
(Figure 1). The call for an inclusive national
dialogue process is more prevalent among rural residents (76%) than urbanites (68%) and
among men (78%) than women (68%). It is also more common among MDC-Chamisa
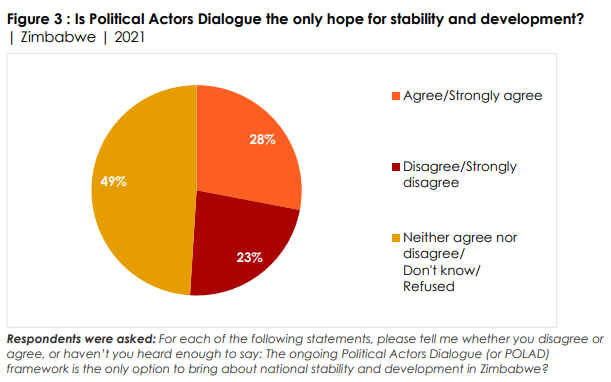
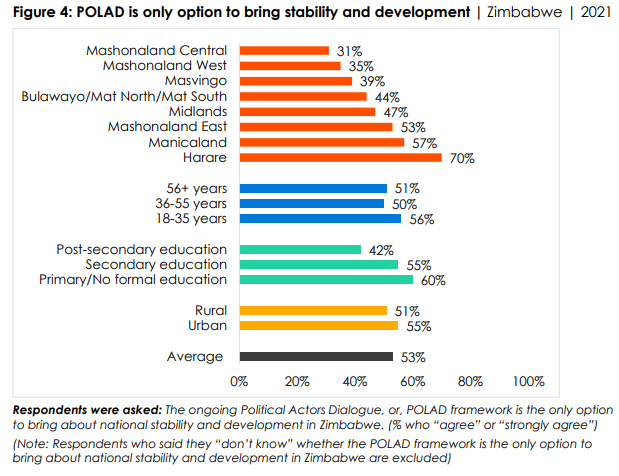
supporters (85%) than among ZANU-PF adherent (67%) (Figure 2). About one in four citizens (28%)
say that the ongoing POLAD framework is the only option for bringing about national
stability and development in Zimbabwe. Almost as many (23%) disagree with this assertion,
while almost half (47%) neither agree nor disagree, “don’t know,” or refused to
answer the question (Figure 3). Among those who offer an opinion
on POLAD, citizens with post-secondary education are least likely to see it as the
only option (42%, compared to 60% among those with primary schooling or no formal
education). This view is dominant in Harare (70%) but far less common in Mashonaland
Central (31%) and West (35%) (Figure 4). (Afrobarometer) 26 July 2021 WEST
EUROPE
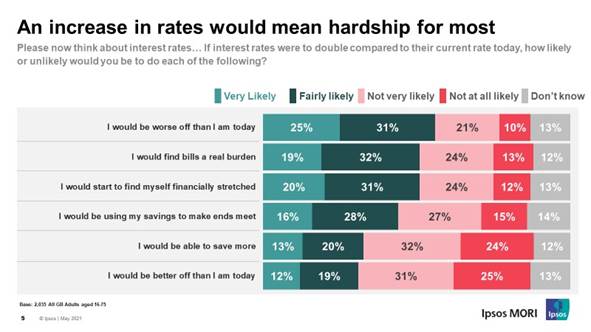
701-43-07/Poll Over half of Britons’ 55% say they would struggle to pay their bills
if interest rates double
New polling suggests a rise in interest rates could lead to financial
hardship for many. At least half of Britons said they would be worse
off than they are today (55%), that they would find bills a real burden (52%)
and they would start to find themselves financially stretched (51%), should
interest rates double from the current base rate. More than 4 in 10 (44%)
would have to use savings to make ends meet, 42% say this is unlikely.
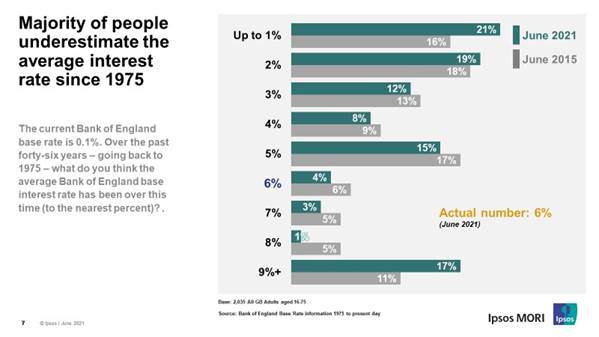
Half (53%) of Britons think that the average interest rate since 1975
is 3% or less – the real average is higher at 6%. While the average of
answers given is correct, only 4% were exactly right, choosing 6% as the
average Bank of England base interest rate.
Inflation On average Britons believe the highest level of inflation in the UK
since 2001 is 10%, in reality inflation has only reached 5.2% in the past two
decades. The most common answer given, however, is much more accurate, 15% of
respondents think inflation has only ever reached 5% in the last 20%, while
11% say a level of 3% and 1 in 10 (9%) say inflation peaked at 4% in this
time period. Despite misconceptions in levels of inflation, a strong majority of
Britons say they are confident they would be able to explain what inflation
is, almost two-thirds (64%) say they can define it, compared to a third (32%)
who would not be confident doing so. Confidence is significantly higher among
men (72% vs. 57% of women) and older generations (75% among 55-75s). Although
most people are confident in their ability to explain inflation, this is
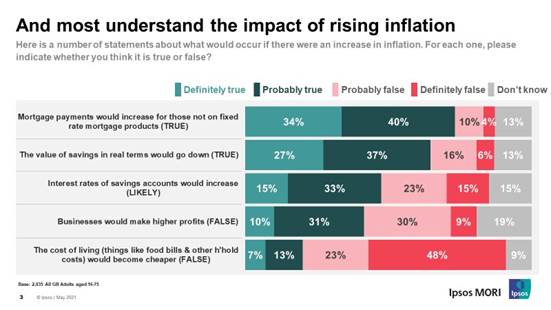
self-defined. People also appear to understand the impact of higher inflation
rates. Three-quarters (74%) say it is true that, should inflation rates
increase, mortgage payments would increase for those not on fixed rate
mortgage products. Almost two-thirds (64%) believe it is true that the value
of savings in real terms would go down if rates increased while 6 in 10 (58%)
say interest rates of savings accounts would increase. Only 1 in 5 (20%) say
the cost of living would become cheaper should inflation rise, almost 6 in 10
(57%) say this is false.
While only a third of people can accurately
quote what the current rate is, it’s great to see that most would know what
the impact of higher inflation would have on their circumstances. Given our
new found freedoms, people are likely to be out spending, which may bring
inflation back into line, however should that not be the case and we find
inflation continuing to rise, and the furlough scheme shortly coming to an
end, the proportions of those who are financially vulnerable are likely to
increase. For many the boom bust years of inflation are distant memory, while
we can hope it stays that way, this research shows that while people may have
got used to low inflation and low interest rates, we need to think about who
could be affected if the situation changes. (Ipsos MORI) 29 July 2021 701-43-08/Poll Between 21 And 22 The Minimum Wage Is 55p Lower Than It Is For Those
23 And Over, At £8.36 Per Hour
The minimum wage was first introduced in
the UK under Tony Blair in 1999 with the aim of cracking down on the
exploitation of low paid employees. Since then, the minimum wage has risen
from £3.60 per hour in 1999, to its current
rate of £8.91 in April, for those aged 23 and over. The minimum wage is not the same for everyone however. For those
between 21 and 22 the minimum wage is 55p lower than it is for those 23 and
over, at £8.36 per hour, while for those aged between 18 and 20 it is £2.34
lower, at £6.56 per hour. Many argue that the minimum wage is not
in fact enough to live on, arguing instead for a ‘living wage’ of £9.50 an hour
(£10.85 an hour in London) and against the banding of wage by age.
Now new YouGov data finds that a plurality believe that the minimum wage
should be higher, and a majority oppose the banding of wage by age. Do Brits still support the idea of a
minimum wage? When it comes to general support for the minimum wage, support is
near universal. Only 5% of Brits oppose the minimum wage policy, with 89%
supporting it. Majority support is seen across all political and demographic
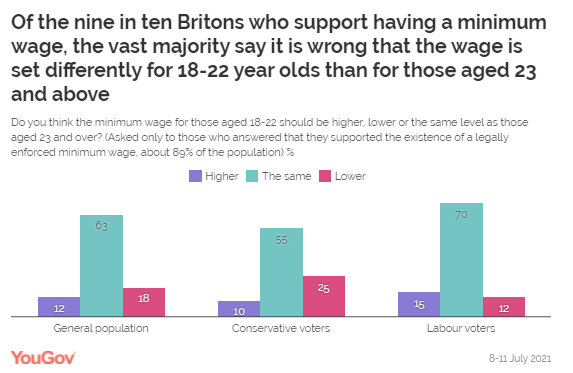
groups. Is it right to set the minimum wage lower
for younger people? Most Britons who support having a minimum wage say the minimum
wage should be set at the same rate for those between 18 and 22 as it is for
those aged 23 and over (63%). Only 18% believed it should be lower, with 12%
believing it should in fact be higher for those under 23. Views differ across
party affiliation: one in four Conservative voters (25%) say that the minimum
wage should be lower for 18-22 year olds compared to half as many Labour
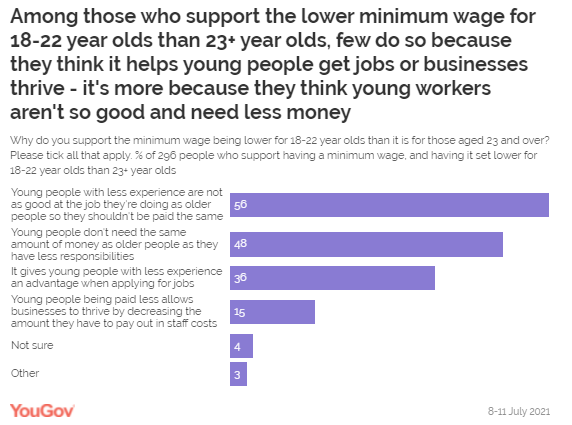
(12%) and Lib Dem (14%) voters. Why do some believe that the minimum wage
for younger people should be lower? In 2015, then junior minister Matt Hancock caused quite a stir
by claiming that
young people were not as productive at work as older people and therefore did
not deserve to be paid the same. When asked why they believe younger people
should be paid less, a majority of that 18% who believe the minimum wage
should be lower for younger people agree with Hancock - 56% feel that younger
people are not as good at their jobs as older people. The next most common reason for their view is that young people don’t
need the same amount of money as older people because they have fewer
responsibilities (48%), followed by the idea that it gives young people an
advantage when applying for jobs (36%). Only 15% are motivated by the idea
that it helps businesses to thrive by decreasing staffing costs. At what rate should the minimum wage be
set? When we asked the specific rate that people who support having a
minimum wage think it should be set at for the current age categories,
we found that a large proportion (48-51%) are unsure. But across all
three, the median answer from those who did give a number was the same: £10
an hour. In fact, almost all of those who came up with a number gave a figure
higher than the current minimum wage for each group. Just 2-6% suggested
a value that would represent a cut for minimum wage workers. This could
indicate widespread support for increasing the minimum wage, although it is
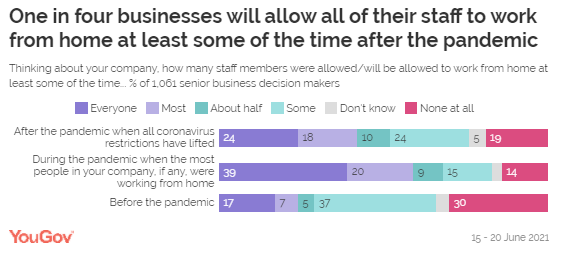
not clear how many are aware what the current rate is. (YouGov UK) July 29, 2021 701-43-09/Poll One In Four Businesses Intend To Allow All Workers To Work From Home
At Least Some Of The Time
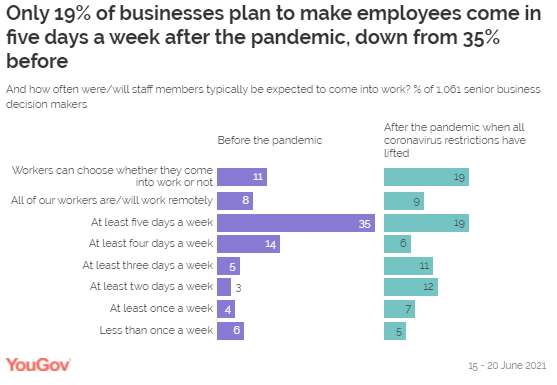
Only a fifth of business decision makers
say their company will require workers to come in five days a week after the
pandemic – down from one in three before The government has now dropped the “work from home if you
can” guidance. The return to offices will be a welcome end to an “aberration” according
to Goldman Sachs CEO, David Solomon. But new YouGov data suggests that many
business decision makers don’t have the same urge to return to “normal”. Two in five businesses will allow all (24%) or most (18%) employees
to work from home with the last coronavirus restrictions lifting. This
is a considerable increase compared with before the pandemic, when only one
in four businesses (24%) had this policy, including 17% who allowed all staff
to work remotely.
It appears hybrid working will become
increasingly common Struggling lunch places, gyms and shops in the city centres are desperate
for the return of office workers, but they’re unlikely to see the
same influx of people as previously. Only one in five business decision makers (19%) say their company
plans to require all workers to come in five days a week – down from one in
three (35%) before COVID-19. Meanwhile, many are only asking their employees to come in one (7%),
two (12%), three (11%) or four (6%) days. A fifth of businesses (19%) plan to let their staff choose whether to
come in at all once all restrictions end – up from 11% before the coronavirus
crisis. There does not appear to be any rise in businesses cutting costs and
making all of their staff work remotely at 9% - similar to before the
pandemic (8%).
(YouGov UK) July 29, 2021 701-43-10/Poll Half (49%) Of Britons Have A Budget Of £10,000 Or Less, With Less
Than One In Ten (8%) Planning To Spend More Than £30,000
Data from YouGov Profiles shows that most Britons have a budget of
£15,000 or less (67%) when it comes to buying their next car. Half (49%) have
a budget of £10,000 or less, with less than one in ten (8%) planning to spend
more than £30,000. But while this high-budget group is small, they’re also potentially
lucrative to automakers. So what are the meaningful differences between the
group of bigger spenders and those with a smaller budget? In terms of the type of car they prefer to buy, high-budget
consumers are less likely to buy a petrol car (43% vs 59% of
lower-budget buyers). But that doesn’t mean these customers are all rushing
out to buy electric. Although those with more than £30k to spend are more
likely to consider an electric vehicle (31% vs. 24% of those with under
£30k), there is also a significant proportion who plan to buy a diesel (26% vs
33% of those with smaller budgets). High vs. low budget priority features In terms of preferred features, both higher and lower budget buyers
are most likely to prioritise parking sensors (57% vs. 48%), a rear parking
cam (57% vs. 38%), and smartphone integration (48% vs. 35%). As you can see,
consumers with more than 30k to spend are more likely in each instance to
desire the feature. Lower down the list, the gaps between expectation on features go even
wider. If you want keyless entry, for example, you’re twice as likely to have
a budget over 30k (45% vs. 22%). The same goes for a lane departure warning
system (40% vs. 18%). And you’re also more likely to want a touchscreen (43%
vs. 27%) or a blindspot monitor (41% vs. 23%). Attitudes of higher budget vs. lower-budget
consumers Higher-budget and lower-budget customers have some key attitudinal
differences. For example, those with more than £30k to spend are less
likely to care about fuel consumption than those with under £30k (50% vs.
60%). It’s also not especially shocking that higher-budget customers are more
likely to say they would “never buy an ugly car” (69% vs. 50%), or that they
like a car with a powerful engine (67% vs. 52%). . Marketing aimed at
higher-budget customers should focus on design and raw horsepower. Lower-budget buyers are more likely to skip car ownership
entirely: 55% of this group (vs. 39% of higher-budget consumers) say it’s too
expensive, while 31% say they don’t want to be locked into vehicle ownership
(compared to 17% of those with a higher budget). To attract lower budget
buyers, it be worth emphasising alternative models of payment and mobility
ownership, where available. Car ownership might not be as alluring as it once
was – which may be good news for the mobility as subscription business model. (YouGov UK) August 01, 2021 701-43-11/Poll On The Road To Vacation, More Than 1 In 4 French People Throw Their
Waste Out Of Their Car Window
Despite certain practices that are
progressing in the right direction, the survey reveals the persistence of
uncivil behavior that is too widespread ,
starting with the propensity of more
than 1 in 4 drivers to throw their waste out of their car window -
even if this is often comes at the cost of a feeling of guilt. Each day,
an average of 25 tonnes of litter is collected along the highways by highway
workers. Daily eco-gestures: no increase in the
number of followers, but more regularity among those who practice them If eco-responsible behavior is generally stable among the French,
those who adopt it do so more and more regularly, even systematically for
certain actions.
Others are becoming more regular, without
being adopted systematically:
Finally, some good practices are
stagnating:
If the French feel they are making efforts
for the environment on a daily basis, and even,
for 25% of them (+3 points compared to 2020), to have reduced their negative
impact compared to before the crisis health, they are much less convinced than others do the same :
they attribute an average of 8.2 eco-gestures but identify only 5.3 on
average among their fellow citizens. Thus, 97% of French people
regularly turn off the light when they leave a room, but they are only 43% to
think that the others do it (ie 54 points difference…). Similarly, 67%
of them travel regularly on foot or by bicycle for short trips, but only 29%
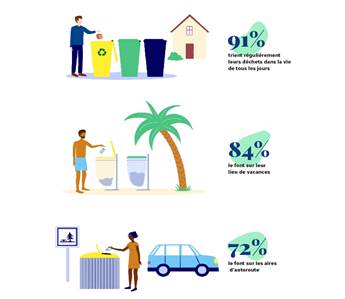
consider that the others do so (38 points difference…). Waste sorting stagnates and its practice
decreases during the holidays If waste sorting is now one of the most widespread eco-gestures, the
French are however less exemplary when they move away from home - and
behavior is improving only slowly. If 91% of them sort their waste
regularly in everyday life (including 72% still), they are 84% (+ 1 point
only compared to 2015) to do so at their place of vacation (including 58 %
still) and 72% (+ 1 point compared to
2015) to do so on motorway rest areas (including 44% still), i.e. 19 points
less than in their daily life.However, 99% of the areas of the
concession motorway network are equipped for selective sorting. Those
who do not always sort their waste on the highway justify this by indicating
that they choose the nearest trash can (38%), that they hesitate in front of
the bins to use (34%) or finally, that they take their waste with them so as
not to touch the bins (22%) - a possible consequence of the health crisis.
The best waste is the one that we do not
produce The French adopt certain good practices to
reduce their waste in everyday life. Some
practices are well anchored in habits, and others are emerging: thus 94% of
French people use a reusable bag to do their shopping (including 77% still),
65% drink tap water to avoid '' buy bottled water (of which 47% still) and
20% now rent or borrow objects that they need only occasionally rather than
buying them (including 5% still; vs. 16% in 2015). This concern to limit packaging is also present
among a certain number of French people when they have to take their meals
outside.for a picnic, at the office or on the road: 86% of them
take care to reduce them to a minimum by taking care of their quantity and
materials (including 41% a lot). To do this, they adapted their
practices by using a reusable lunch box (93%), reusable cutlery (92%) or a
gourd rather than a plastic bottle or can (83%). So many good habits to multiply to avoid the
production of unnecessary waste and the risk of finding it on the roads or in
public spaces. Litter abandoned in the street or on the
roads: what if we wondered about our own practices? More than 1 in 4 French people (28%) admit
throwing their waste out of their car window on the motorway. Although
down slightly compared to 2020 (- 2 points), this uncivil behavior remains
too widespread. It even grows in everyday life. Thus, 40% of French people admit that they sometimes
throw waste on the public highway (+2 points compared to
2020). The cigarette butt throw, in particular, remains very frequent
compared to the number of smokers: 9% of French people, or more than 1 in 4 smokers , throw
their butts out of their car window (-3 points) and 14% do so. on the
sidewalk or in the gutter (+ 1 point). Finally,
a sign of willful negligence,9% of French people (14% of those
under 35) admit that they sometimes drop paper, handkerchief or packaging in
the street and do not pick it up and 4% leave a plastic bottle or can on
public roads (8% of under 35s). The same is true of masks, which 4% of
them (and up to 7% of those under 35) sometimes throw onto the public
highway, i.e. the equivalent of nearly 2 million people reported to the
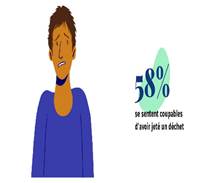
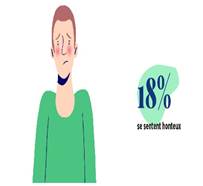
general population. Sign of the internalization of the general
disapproval in the face of this type of incivility, the French who throw
their waste out of the trash cans feel a negative feeling of
it, 76% of guilt (58%)
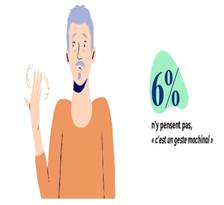
or of shame when we see them ( 18%). Conversely, nearly 1 in 5 (24%)
minimizes the scope of their gesture: 9% by claiming that "it's not
serious, it's just a little waste ..." (core, paper, butt …), 6% who
“don't really think about it”, recognizing that it is a mechanical gesture,
5% who “hesitate for a moment but do it anyway” and 4% who… “do not file ”.
When it comes to explaining these
behaviors, the French once again show a certain leniency towards themselves
but much greater severity towards others. Thus,
77% of them justify their action by the absence of bins nearby or by
over-full bins, while only 35% retain this excuse for others. 39% also
explain their gesture by refusing to keep their waste with them to put it in
the trash later and 31% believe that the taxes they pay should be used to
collect this litter. In addition, the French are unanimous (95%) in thinking that the
presence of litter harms the image of a place. More and more people are
also complaining about the dirtiness of the roads, especially in and around
urban areas. Thus, 72% of them consider that the ring roads and
peripherals around cities are dirty and 61% that the same is true for roads
and streets inside cities. Asked to establish a ranking of the
cleanest countries among 8 countries in Europe ,
the French place three countries in the lead: Switzerland in 1st position
(70%), ahead of Sweden (58%) and Germany (36%) and relegate the other
countries far behind with Great Britain (9%), France (7%), Greece (5%), Italy
(3%) and Spain (3%). According to them, the reasons which explain the
cleanliness of these countries are above all the discipline , more present in their culture
(68%), a more developed environmental
awareness (47%) as well as a stricter regulation.(43%). But even though they are
quick to invoke the lack of trash cans to justify their action in their own
country, the vast majority (90%) do not consider the countries they consider
exemplary better equipped in this area. (Ipsos France) July 30, 2021 701-43-12/Poll The majority of Germans are in favor of butcher shops, but buy meat
in the supermarket
Butchers are becoming increasingly rare in the cityscape. The
majority of German consumers (60 percent) state that they are now most likely
to buy their meat in the supermarket, either pre-packaged (32 percent) or at
the fresh food counter (28 percent). A quarter of those surveyed (24
percent) say that they are most likely to buy meat and sausage products from
the butcher. The percentage distribution among people who pay attention
to sustainable cultivation when eating and shopping is somewhat
different. With the help of YouGov ProfilesThe
study of this target group has shown that a third (34 percent) buy their meat
from the butcher, which is 10 percentage points more than the general
population. Overall, however, 46 percent of those consumers who pay
attention to sustainable cultivation say that they buy meat in the
supermarket, either packaged (19 percent) or at the fresh food counter (27 percent).
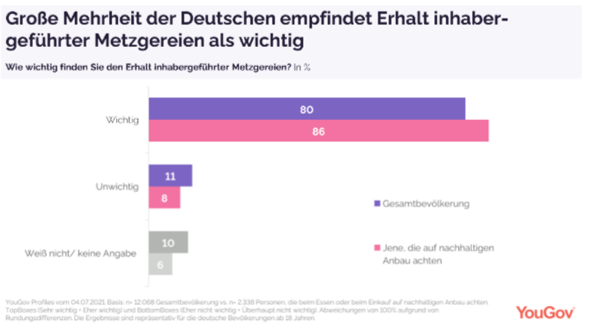
MOST OF THE TIME FOR THE MAINTENANCE OF
OWNER-MANAGED BUTCHER SHOPS Although only a quarter of German consumers buy sausage and meat
products mainly in a butcher's shop, 80 percent of Germans say that they
think it is important to maintain owner-managed butchers. Among
respondents who pay attention to sustainable cultivation when eating and
shopping, the figure is 86 percent.
(YouGov Germany) July 28, 2021 Source: https://yougov.de/news/2021/07/28/mehrheit-der-deutschen-kauft-fleisch-im-supermarkt/ NORTH
AMERICA
701-43-13/Poll 54% Of Black Americans Report Unfair Treatment In At Least One
Situation
WASHINGTON, D.C. -- Black Americans' self-reports of being treated
unfairly in a variety of situations are generally steady or higher rather
than declining. This includes a new high of 35% who say they personally were treated
unfairly while shopping during the past 30 days, up from 24% last year. In
five other situations, reports of recent unfair treatment are similar to a
year ago, and range from 17% to 21%. In general, Black Americans are no less likely to report being
treated unfairly in any of the five situations now than they were when Gallup
first asked the items in 1997. The healthcare item was first asked in 2004.
Five line graphs showing whether Black Americans say they have been
treated unfairly in the past 30 days because they were Black, in the
following situations: at work; in a store where they were shopping; in a
restaurant, theater, bar or other entertainment place; in dealing with
police, such as traffic incidents; and while getting healthcare for themselves
or a family member. Seventeen percent in 2021 say they were treated unfairly
at work, compared with 17% in 2020, a high of 23% in 2003 and 2007, and 21%
when first asked in 1997. A new high of 35% in 2021 say they were treated
unfairly in a store, compared with 24% in 2020 and 30% in 1997. Twenty-one
percent in 2021 say they were treated unfairly in a restaurant, bar, theater
or other entertainment place, compared with 18% in 2020, a high of 26% in
2004, and 21% in 1997. Twenty percent in 2021 say they were treated unfairly
in dealings with police, compared with 19% in 2020, a high of 25% in 2004 and
15% in 1997. Seventeen percent say they were treated unfairly while getting
healthcare, compared with 13% in 2020 and the high of 20% when it was first asked
in 2004. The results are based on a June 1-July 5 Gallup survey that included
oversamples of Black and Hispanic adults to allow for more precise estimates
of those subgroups. The questions about unfair treatment were asked of Black
and Hispanic respondents only. While the oversamples are large enough to
report reliable estimates of Black and Hispanic Americans overall, they are
not sufficiently large to report results for subgroups of Black or Hispanic
adults. Before this year, the percentage of Black adults who reported
mistreatment at stores in the past 30 days ranged from 24% to 30%. For the other items, the high points were registered in 2002, 2004 or
2007 surveys. The current figures are statistically on par with these, except
for the 17% of Black respondents currently reporting unfair treatment at
work. This is significantly lower than the prior high of 23% reported in 2002
and 2007. It is possible the increase in remote work brought about by the
COVID-19 pandemic has been a factor in the lower percentages perceiving
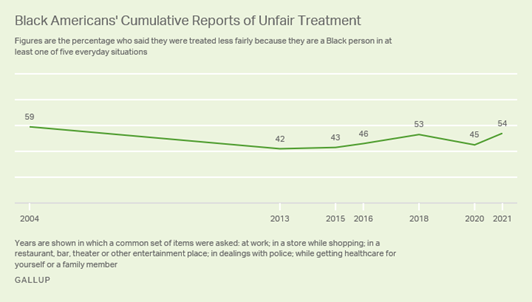
unfair treatment in 2020 and 2021 compared with 2018 and most prior years. While none of the individual items comes close to the majority level,
the majority of Black Americans, 54%, say they have been treated unfairly in
at least one of the five situations. Forty-five percent have not experienced
unfair treatment in any of the situations in the past 30 days. In past years in which the same set of five items have been asked,
the percentage of Black Americans reporting unfair treatment in at least one
of the situations has been close to 50% -- above it in some years but below
it in others.
Line graph. Trend in the percentage of Black Americans who said they
were treated unfairly in at least one of the following situations -- at work;
in a store while shopping; in a restaurant, bar, theater or other
entertainment place; in dealings with police; while getting healthcare for
themselves or a family member. The graph shows the percentage treated
unfairly in at least one of the situations for the years in which those five
items were asked. It was 59% in 2004, 42% in 2013, 43% in 2015, 46% in 2016,
53% in 2018, 45% in 2020 and 54% in 2021. Hispanic Americans Less Likely to Say They
Have Been Treated Unfairly Hispanic Americans are less likely than Black Americans to report
unfair treatment in the same situations, especially while shopping at stores
(16%) or in dealings with police (11%). Hispanic Americans are most likely to
say they have been treated unfairly at a restaurant in the past 30 days, with
19% saying this has happened to them, on par with the 21% of Black Americans
who were treated unfairly at a restaurant. Black and Hispanic Americans' Reports of Unfair Treatment in
Different Situations Can you think of any occasion in the last 30 days when you felt you
were treated unfairly in the following places because you were
Black/Hispanic?
Gallup has asked Hispanic Americans about unfair treatment twice previously,
in 2013 and 2015 surveys. The responses in prior years were generally similar
to the current data, with the exceptions of fewer Hispanic Americans in 2015
saying they were treated unfairly in a store while shopping (7%); in a
restaurant, bar, theater or other entertainment place (9%); and while getting
healthcare (9%). Overall, 34% of Hispanic Americans this year say they have been
treated unfairly in at least one of the five situations in the past 30 days,
while 66% have not been treated unfairly in any of them. In 2013, 32% of Hispanic Americans said they were treated unfairly in
at least one of the five situations, while in 2015, 25% did. Bottom Line The majority of Black Americans say they have been treated unfairly
in at least one of five everyday situations, with mistreatment most commonly
occurring at stores. The question asks about a limited time frame of 30 days,
and it is likely that many more Black Americans have been treated unfairly in
one of those situations outside that narrow window. Moreover, many Black
Americans who have not been personally mistreated may
know a family member or close friend who has been. These results come at a time when there is greater awareness and
sensitivity to racial inequities in U.S. society. One sign of real progress
in the treatment of Black people would be to see the percentage who report
unfair treatment go down over time. But since Gallup began tracking these in
1997, the figures have held steady or increased. (Gallup) JULY 27, 2021 Source: https://news.gallup.com/poll/352580/black-americans-reports-mistreatment-steady-higher.aspx 701-43-14/Poll Unemployment Increased More Sharply Among Immigrants 15.3% During
Pandemic
As businesses across the United States return to near-normal
operations, public attention has shifted to reports of labor shortages and rising
prices. But even as hiring
picks up in the wake of the COVID-19
outbreak, the labor market is not fully healed. Some 9.5 million U.S.
workers were unemployed in June 2021,
compared with 5.7 million in
February 2020, and the unemployment rate stood at 5.9%, up from 3.5%,
seasonally adjusted.
Immigrants were hit harder than U.S.-born workers at the beginning of
the pandemic, but they have since closed the gap, according to a new Pew
Research Center analysis of government data. There were 27.3 million foreign-born workers
in the U.S. in 2020, accounting for 17.0% of the total labor force.
They entered the pandemic on the same footing as U.S.-born workers but saw
their unemployment rate increase more sharply with the onset of the COVID-19
recession. A year later, with the economic recovery gaining momentum,
unemployment among immigrants is about equal with that of U.S.-born workers.
However, for both groups, the unemployment rate remains greater than the
pre-pandemic level. In the first quarter of 2019, immigrant and U.S.-born workers each
had an unemployment rate of about 4.0%. It dipped below that level for much
of 2019 for both groups, but more so for immigrants. By the first quarter of
2020, the unemployment rate for foreign-born workers (4.1%) was back on par
with that of U.S.-born workers, not seasonally adjusted. The onset of the pandemic sent the unemployment rate for immigrants
soaring higher than the rate for U.S.-born workers. By the second quarter of
2020, the unemployment rate for foreign-born workers had reached 15.3%,
compared with 12.4% for U.S.-born workers. Unemployment among both groups
decreased as the economy began to recover, but more so among immigrants. By
the second quarter of 2021, the unemployment rate for immigrants (5.9%) was
back at parity with the unemployment rate for U.S.-born workers (5.8%). The unemployment rate for foreign-born workers also increased more
than the rate for U.S.-born workers in
the Great Recession, although not to the extent seen in 2020. Immigrants
tend to be more vulnerable in recessions because they are less likely to have
attended college and many
are unauthorized. Among men, immigrants are also more likely than
U.S.-born workers to hold jobs in construction, an industry that was
vulnerable in the housing
market crash that accompanied the Great Recession. Among women,
immigrants are relatively more likely to work in the leisure and hospitality
and other services sectors – also a liability in the pandemic as social
distancing rules had a severe
impact on those businesses.
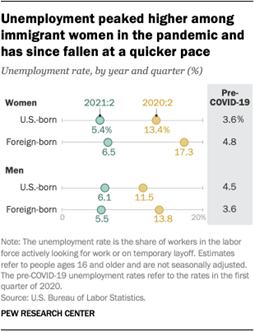
The pandemic-driven volatility in unemployment was most notable among
immigrant women. Prior to the pandemic, the unemployment rate for
foreign-born women (4.8%) was slightly higher than the 3.6% rate for
U.S.-born women. As the recession hit, the unemployment rate for foreign-born
women jumped to 17.3% in the second quarter of 2020, a greater increase than
was experienced by U.S.-born women, whose rate peaked at 13.4%. The recovery
has proceeded at a faster pace for immigrant women, however. As of the second
quarter of 2021, the unemployment rate for immigrant women (6.5%) was greater
than the rate for U.S.-born women (5.4%), but the gap was no greater than in
the pre-COVID-19 period. Foreign-born men also saw a sharper increase in unemployment than
U.S.-born men at the beginning of the pandemic. From the first to the second
quarter of 2020, the unemployment rate for foreign-born men increased from
3.6% to 13.8%. This was greater than the increase experienced by U.S.-born
men, whose unemployment rate went up from 4.5% to 11.5%. By the second
quarter of 2021, the unemployment rate for immigrant men (5.5%) had dropped
below the rate for U.S.-born men (6.1%), restoring the status quo from before
the pandemic.
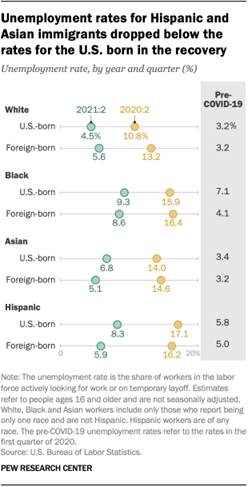
Hispanic and Asian immigrants, who collectively account for nearly
three-in-four foreign-born
workers in the U.S., initially saw their unemployment rates increase
in tandem with the rates for U.S.-born Hispanic and Asian workers. Among
Hispanic workers, the unemployment rate for immigrants increased from 5.0%
pre-COVID-19 to 16.2% in the second quarter of 2020. U.S.-born Hispanic
workers saw their unemployment rate rise from 5.8% to 17.1%. Similarly, the
unemployment rate among immigrant and U.S.-born Asian workers increased by
about 11 percentage points each with the onset of the pandemic. But the economic recovery has opened a wider gap in the unemployment
rate in favor of Hispanic and Asian immigrants. Among Asian workers,
immigrants had a lower unemployment rate (5.1%) than the U.S. born (6.8%) in
the second quarter of 2021, compared with a state of parity prior to the pandemic.
Among Hispanic workers, the unemployment rate for immigrants (5.9%) in the
second quarter of 2021 was further below the rate for U.S.-born Hispanic
workers (8.3%) than where it stood prior to the pandemic. In contrast, White and Black immigrants have lost ground to U.S.-born
White and Black workers over the course of the pandemic. Among White workers,
immigrants and the U.S. born had the same unemployment rate prior to the
pandemic. But, as of the second quarter of 2021, the unemployment rate among
White immigrants (5.6%) stood above the rate for U.S.-born White workers
(4.5%). Among Black workers, the unemployment rate for immigrants (4.1%) was
notably lower than the rate for the U.S. born (7.1%) prior to the pandemic.
This edge had dissipated by the second quarter of 2021, with U.S.-born and
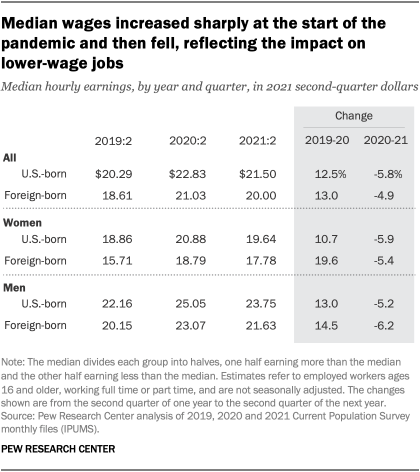
immigrant Black workers experiencing an unemployment rate of about 9% each. Wages fluctuated greatly along with
unemployment Job losses in the COVID-19 recession were particularly severe in
sectors in which social distancing of workers is difficult. The leisure and
hospitality sector alone accounted for more than a third of all nonfarm jobs
lost from the first to the second quarter of 2020, shedding 38% of its
workforce in that period, according to government
data. Many of these workers were at the lower
end of the wage scale.
As the pandemic struck, the economy-wide median hourly wage increased
sharply from 2019 to 2020, reflecting the fact that higher-wage workers were
more likely to have held on to their jobs. Among immigrants, the median wage
increased from $18.61 in the second quarter of 2019 to $21.03 in the second
quarter of 2020, an increase of 13.0%. U.S.-born workers registered a similar
increase, as their median wage increased by 12.5%, from $20.29 to $22.83.
(All wages are expressed in 2021 second-quarter dollars.) The restoration of jobs generally, and particularly so in the leisure
and hospitality and other services sectors, has at least partly pushed the median wage
down since the initial shock of the pandemic. For immigrants, the
median wage has fallen 4.9% from the second quarter of 2020 to the second
quarter of 2021. The median wage of U.S.-born workers has fallen 5.8% in the
same period. But for both groups of workers, wages have increased
substantially from 2019 to 2021 – a comparison less affected by large swings
in unemployment, albeit not entirely so. Immigrant women, who experienced the sharpest rise in unemployment in
the pandemic, also appeared to see the sharpest increase (19.6%) in the
median wage from 2019 to 2020. Since then, their median wage has fallen by
about the same measure as among U.S.-born women and both immigrant and
U.S.-born men. Overall, the longer-term impact of the pandemic on the
earnings of workers may not be clear until the labor market has healed more
fully, with employment and labor force participation back to near
pre-pandemic levels. (PEW) JULY 26, 2021 701-43-15/Poll 47% Say U.S Military Involvement In Afghanistan Was A Mistake 46% Say
It Was Not
WASHINGTON, D.C. -- As the U.S. military continues its drawdown of
troops in Afghanistan, Americans are evenly divided in their views on whether
it was a mistake for the U.S. to send troops into the country nearly 20 years
ago. This is in contrast with most of the readings over the past two decades,
which have found Americans generally more positive than negative toward the
effort there. This is only the second time that less than half of Americans
(46%) say U.S. involvement was not a
mistake.
Line graph. Americans' views of whether or not they think the U.S.
made a mistake sending troops to fight in Afghanistan since 2001. The latest
readings find 47% think it was a mistake and 46% say it was not. This is only
the second time that less than half of Americans say U.S. involvement
was not a mistake. President Joe Biden's July 8 announcement confirming that the United
States' military mission in Afghanistan will conclude on Aug. 31 came just
after the start of Gallup's July 6-21 poll. Biden, who has long been critical
of the Afghanistan War, first announced in April that he would remove U.S.
troops before the 20th anniversary of 9/11, which
precipitated the military action. All told, the war has claimed the lives of
more than 2,400 U.S. service members, resulted in injury to more than 20,000
U.S. troops and cost the U.S. more than $2 trillion. Views of the nation's longest war have evolved since shortly after it
began in October 2001, when the U.S. public
largely supported it. In early 2002, a record-high 93% of Americans said
it was not a mistake to have sent troops to Afghanistan. Between 2004 and
2013, majorities continued to hold this belief, albeit in declining
numbers. In
2014, U.S. adults were for the first time as likely to say it was a
mistake as to say it was not; however, public opinion once again tilted
against it being a mistake in 2015 and 2019.
This year's reading is on par with the 2014 finding. Gallup surveys tracking Americans'
perceptions of previous wars, including Iraq, Vietnam and Korea, have
found majorities at some point describing those efforts as a mistake,
something that has not occurred with respect to Afghanistan. Partisans' Views of Afghanistan War Remain
Divergent President George W. Bush first ordered U.S. troops to strike
Afghanistan several weeks after 9/11 to destroy al Qaeda's base of operations
and prevent future terrorist attacks against the U.S. The action initially
enjoyed broad bipartisan support; yet, by 2004, 41% of Democrats considered
the war in Afghanistan to be a mistake while 9% of Republicans and 31% of
independents agreed. This pattern has generally persisted throughout the course of the
war, with Democrats more likely than Republicans and independents to be
critical of the war. With few exceptions, at least half of Democrats viewed
the war as a mistake during the presidencies of Barack Obama and Donald
Trump. The last time less than half of Democrats said the war was a mistake
was in
May 2011 after Osama bin Laden was killed in Pakistan. Currently,
56% of Democrats, 29% of Republicans and 54% of independents think the U.S.
made a mistake in sending troops to Afghanistan.
Line graph. Partisans' views of whether or not they think the U.S.
made a mistake sending troops to fight in Afghanistan since 2001. The latest
readings find 56% of Democrats, 29% of Republicans and 54% of independents
think it was a mistake. Bottom Line As the U.S. military continues its withdrawal from Afghanistan, the
public is now divided over whether embarking on the war was a mistake, which
is among the least positive assessments in the past two decades. Still, it is
more positive than some other prolonged military engagements. Biden and those who support the drawdown assert that the U.S. has
accomplished its goals in Afghanistan -- finding the terrorists who
orchestrated the 9/11 attacks, killing Osama bin Laden and trying to limit
the country's base of operations for terrorists. They assert that
nation-building was not part of the strategy and that it has dragged on for
too long and cost the U.S. too many lives and too much money. At the same
time, critics of the drawdown cite concerns about the Taliban taking control
of the country, more terrorist attacks against the U.S. and harm to Afghan
citizens. What ultimately happens after U.S. troops have withdrawn from
Afghanistan will likely affect not only Americans' perceptions of whether the
war was a mistake but history's judgment as well. (Gallup) JULY 26, 2021 Source: https://news.gallup.com/poll/352793/americans-split-whether-afghanistan-war-mistake.aspx 701-43-16/Poll Around Half Of Americans Who Say Religion Is Very Important To Them
(49%) Say Their Best Guess Is That Intelligent Life Exists On Other Planets
Religious and secular thinkers alike have long discussed what
the implications
for religion would be if humans discovered intelligent life on other
planets. In the United States, highly religious adults are much more
skeptical about the possibility of extraterrestrial life compared with those
who are less religious, according to a recent Pew
Research Center survey.
This is evidenced by a variety of measures of religious engagement.
For example, U.S. Christians are far less likely than religiously
unaffiliated Americans to say that their “best guess” is that intelligent
life exists on other planets (57% vs. 80%). And U.S. adults who attend
religious services on at least a weekly basis are considerably less likely
than those who seldom or never attend services to say that intelligent life
exists elsewhere (44% vs. 75%). Similarly, around half of Americans who say religion is very
important to them (49%) say their best guess is that intelligent life exists
on other planets. By comparison, roughly three-quarters of those who say that
religion is less important in their lives (76%) say that intelligent life
exists elsewhere. Adults who pray daily are also less likely than those who
seldom or never pray to say intelligent life exists on other planets (54% vs.
80%). White evangelical Protestants, who tend to be highly
religious, are less likely than other religious groups to say intelligent
life probably exists on other planets; 40% hold this view. Most White
non-evangelical Protestants (65%), Catholics (67%) and religiously
unaffiliated adults (80%) say their best guess is that there is intelligent life beyond Earth.
Black Protestants are more divided on the topic, with 55% saying their best
guess is that intelligent life exists on other planets and 44% expressing the
opposite opinion. (Due to sample size limitations, this analysis does not
show some smaller religious groups, including Jewish and Muslim Americans.) The June survey also asked Americans whether they believe recent UFO
sightings by people in the military are evidence of intelligent life beyond
Earth. (The survey was conducted just before the U.S. military’s recent
release of a report
about UFO sightings.)
Americans who attend religious services weekly or more often are less
inclined than others to see military UFO sightings as evidence of
extraterrestrial life. This also varies by religious affiliation – though the
pattern differs somewhat from the broader question about the existence of
life beyond Earth. In fact, while the vast majority of self-described
atheists (85%) say their best guess is that intelligent life exists on other
planets, far fewer (31%) say that UFOs reported by the military are
definitely or probably evidence of this. On this question, atheists are about
as skeptical as White evangelical Protestants, 35% of whom see UFOs as
evidence of extraterrestrial life. When it comes to whether UFOs are friendly or a threat to U.S. national
security, opinions vary modestly along religious lines. Majorities across
religious groups say they think UFOs are neither friendly nor unfriendly, and
relatively few people – regardless of religion – view UFOs as a major threat
to U.S. national security. (PEW) JULY 28, 2021 701-43-17/Poll Half (49%) Of Canadians Say Recent Events Make Addressing Climate
Change More Urgent, But Are Less Willing To Pay To Help
Toronto, ON, July 28, 2021 – As
Canada has been experiencing extreme weather events, from heat waves, to
forest fires, to tornados, a majority (49%) of Canadians say the need is
becoming more urgent to address climate change, according to a new Ipsos poll
conducted on behalf of Global News. Notably, four in ten (43%) say their
opinion has not changed despite the recent extreme weather events, and one in
ten (8%) say they it is less urgent about climate change than in the past. Younger Canadians are more likely to say their opinion about climate
change has changed, and they feel more urgent about climate change than in
the past (56% 18-34 vs.43% 35-54, 49% 55+). As well, those with a university
degree are more likely to say they feel more urgent about climate change than
in the past (58% univ grad, 47% post sec, 47% high school, 40% less than high
school). Older Canadians (46% 55+, 46% 35-54, 34% 18-35) are more likely to
say their opinion has not changed. Surprisingly, not all regions that are experiencing climate related
events feel an increased urgency towards acting on climate change. The
increase in urgency about climate change is more pronounced among those
residing in Quebec and BC than the other provinces (56% Quebec, 55% BC, 46%
Alberta, 45% Ontario, 45% Atlantic provinces, 44% SK/MB). Conservative voters are more likely to say their opinion on climate
change has not changed compared to the other party voters (55% cons vs 35%
NDP, 32% Bloc, 27% Liberal, 13% Green). As well, those who disapprove of
Trudeau are more likely to say their opinion has not changed on climate
change (52% vs 33% approve). Canadians Becoming Less Willing to Pay More
to Fight Climate Change Despite the extreme weather events that Canada has experienced
throughout the summer, more Canadians are unwilling to pay to help the fight:
over half (52%) of Canadians say they would not be willing to spend extra
(i.e. increased taxation, goods or services costing more, etc.) to help the
fight against climate change, an increase of six points from 2019. Four in
ten (38%) of Canadians say they are willing to spend an extra $1 to $500
dollars a year, with one in five (21%) who are willing to spend $1-$100 per
year. This leaves one in ten (10%) who say they would spend $500 or more a
year. Those aged 18-34 are more likely to say they would spend an extra
$100 per year to help fight against climate change (30% 18-34, 19% 35-54, 17%
55+). As well, a majority (60%) of those residing in BC say they would be
willing to spend money to help fight against climate change. Women are more likely to say they would not be willing to spend extra
per year to help fight climate change (58% vs 47% men). As well, older
Canadians say they would not be willing to spend extra per year (62% 55+, 56%
35-54, 35% 18-34). Moreover, those residing in the Atlantic provinces are
more likely to say they would not be willing to spend extra (60% Atlantic,
58% Quebec, 55% SK/MB, 52% Ontario, 51% Alberta, 39% BC).
Those who say they feel more urgent about climate change are willing
to spend an extra $100 per year (28% vs 15% opinion has not changed, 10% less
urgent). On the other hand, three quarters of those who say their opinion has
not changed say they would not be willing to spend extra per year (74%
opinion has not changed vs 59% less urgent, 33% more urgent). (Ipsos Canada) 28 July 2021 Source: https://www.ipsos.com/en-ca/news-polls/Half-Say-Recent-Events-Make-Climate-Change-More-Urgent 701-43-18/Poll Most Canadians Worried About COVID-19 Variants (81%), Fourth Wave
(69%)
Toronto, ON, July 29, 2021 – As
reopening plans are rolled out across Canada, and as more Canadians enter
into what Justin Trudeau hoped would be their “one-dose summer” following
increased vaccine distribution, most Canadians say they are still concerned
about COVID-19 variants delaying a return to normal life and the potential
for a fourth wave. A recent Ipsos poll on conducted on behalf of Global News finds that
though six in ten (62%) feel the current uptake of the vaccine will help
Canada avoid a fourth wave of the pandemic, the majority (81%) of Canadians
say they are worried that the new COVID-19 variants will delay a return to
normal. While there are few highly significant differences by age or gender
in terms of sentiment on Canadians’ future with COVID, region plays a large
role in opinion, linked to the differences in how Canadians in different
parts of the country experienced the pandemic over the last year. Eight in Ten Canadians Worried About
COVID-19 Variants, and Most Worried About a Fourth Wave Ipsos data shows that the majority of Canadians (81%) are worried
that the new COVID-19 variants will delay things getting back to normal (27%
strongly agree, 54% somewhat agree). This worry is felt most strongly among
those from Atlantic Canada (89%), who, on the tail end of an overwhelming
variant-driven third wave after several periods of low cases and normalcy,
may be hoping that the end could be in sight. Ontarians are also
significantly more likely to express worry about the COVID-19 variants (85%),
after an exhausting 16 months of rolling lockdowns (SK/MB 83%, BC 77%, QC
77%, AB 73%). The majority of Canadians are also worried about the potential of a
fourth wave of the pandemic in the country (69%), with those in Atlantic
Canada (82%) and British Columbia (76%) most likely to feel worried (compared
to SK/MB 74%, ON, 72% AB 66%, QC 57%). Notably, those in Quebec are least
likely to feel worried about the potential for a fourth wave. This is
consistent with a level of optimism seen in previous research among
Quebecers,[1] who
may be feeling a sense of relief amidst vaccine rollouts after having some of
the highest COVID-19 caseloads in the country over the course of the
pandemic. Six in ten (62%) express some level of agreement that the current
uptake of the COVID-19 vaccine will be enough to avoid a fourth wave of the
pandemic in Canada. Compared to the level of worry about the spread of
variants prolonging the pandemic, however, this may suggest that Canadians
feel the country could be approaching a vaccination saturation point, as
vaccination opportunities become more available and there remains a portion
of the population still holding off from receiving a shot. On the other hand, the majority of Canadians would support further
lockdown measures if there is a fourth wave of COVID-19 (69%), though there
are key regional differences in sentiment when it comes to lockdowns. Those
in British Columbia (84%) and Atlantic Canada (79%) are most likely to
indicate support for more lockdowns, while those in Alberta (60%) and Quebec
(62%) are less likely than other regions (vs. ON 70%, SK/MB 68%). British
Columbia may be feeling the after-effects of their third wave, the variant
having originated in Canada on the west coast, while Atlantic Canadians have
made rapid lockdowns part of their COVID strategy since the beginning of the
pandemic. On the other hand, Albertans have generally been less supportive of
lockdowns than in other parts of the country, and Quebecers may be reacting
to a recent announcement made by their government that there will be no more
lockdowns, instead requiring vaccine passports as an alternative. Consensus on New Normal Is Split by Region As Canadians prepare for what the new normal could look like,
sentiment on how to navigate living with COVID-19 post-pandemic is less
clear-cut, especially by region. Just over two-thirds (67%) agree that we
should learn to live with active COVID-19 cases as long as hospitals aren’t
overwhelmed, indicating a certain level of acceptance that COVID may be here
to stay. There is less consensus on the trade-off between unrestricted daily
life and the spread of COVID-19 cases. Overall, 56% of Canadians feel that
the spread of less-serious COVID-19 cases is acceptable in order to live
without restrictions. This sentiment is most strongly felt in Quebec (63%)
and less common in British Columbia (47%), compared to other regions (ATL
60%, AB 58%, SK/MB 57%, ON 54%). After living through the epicenter of the
pandemic in Canada, Quebecers’ may have a higher tolerance of less-serious
COVID-19 cases in favour of enjoying unrestricted life again. (Ipsos Canada) 29 July 2021 Source: https://www.ipsos.com/en-ca/news-polls/Most-Canadians-Worried-About-COVID-19-Variants-Fourth-Wave AUSTRALIA
701-43-19/Poll Support For New Zealand’s Labour/Greens Government Dropped 1.5%
Points To 49.5% In July
Support for New Zealand’s Labour/Greens government dropped
1.5% points to 49.5% in July – the lowest for the Government since the
COVID-19 pandemic began. Support for the Labour Party was up 1% point to
39.5% but support for the Greens dropped 2.5% points to 10%. This is the
lowest level of support for the Greens since last year’s election. The
governing parties are now just 5% points ahead of the Parliamentary
opposition National/Act NZ/ Maori Party on 44.5%, up 1% point since June.
This is the highest level of support for the Parliamentary Opposition since
October 2019 and the closest they’ve been to the Government since Jacinda
Ardern became Prime Minister in October 2017 nearly four years ago. Support
for National was virtually unchanged at 29%, down 0.5% points, while the big
mover was Act NZ which increased its support by 1.5% points to a record high
13%. This is the first time since 2002 that Act NZ has gained a higher level
of support than the Greens. Support for the Maori Party was unchanged at
2.5%. A
small minority of 6% of electors support other minor parties outside
Parliament with support for The Opportunities Party up 1% point to a record
high 3%, support for NZ First up 0.5% points to 2% in July. This
latest New Zealand Roy Morgan Poll on voting intention was conducted by
telephone – both landline and mobile – with a New Zealand-wide cross-section
of 945 electors during July. Electors were asked: “If a New Zealand Election were held today which
party would receive your party vote?” Of all electors
surveyed an unchanged 4.5% didn’t name a party. New Zealand Government Confidence Rating drops 3pts to
pandemic low of 121 in July The
Roy Morgan Government Confidence Rating dropped by 3pts in July to 121 – the
lowest it has been since Jacinda Ardern became Prime Minister in October 2017
nearly four years ago. In
July a reduced majority of 55.5% (down 1.5% points) of New Zealand electors
said New Zealand was ‘heading in the right direction’ compared to over a
third, 34.5% (up 1.5% points) who said New Zealand was ‘heading in the wrong
direction’ – the highest figure for this indicator since Prime Minister
Jacinda Ardern came to power in October 2017. The
latest monthly ANZ-Roy Morgan Consumer Confidence Rating was
down slightly by 1pt to 113.1 in July but is still well above the
corresponding Consumer Confidence figure in Australia of
100.7 on July 24/25, 2021 as
that country battles a renewed outbreak of COVID-19 in Sydney. Analysing
voting intentions by gender reveals where Prime Minister Jacinda Ardern’s
strength lies. A
clear majority of 58.5% of Women support either Labour (46.5%) or the Greens
(12%) compared to only 40.5% of men supporting either Labour (32.5%) or the
Greens (8%) – a massive ‘gender gap’ of 18% points in favour of Ardern’s
Labour Party among Women. In
fact a majority of men support the Parliamentary opposition with 52.5%
supporting either National (32.5%), Act NZ (17.5%) or the Maori Party (2.5%)
compared to only 36.5% of Women supporting either National (25.5%), Act NZ
(8.5%) or the Maori Party (2.5%). Roy Morgan Government Confidence Rating is 130 for Women
compared to 112 for men The
trends are confirmed by the latest Roy Morgan Government Confidence figures
which show 59% of Women say New Zealand is ‘heading in the right direction’
compared to 52% of men and only 29% of Women say New Zealand is ‘heading in
the wrong direction’ compared to 40% of men. Overall,
this produces a Roy Morgan Government Confidence Rating of 130 for Women
compared to only 112 for men – a gap of 18 points. Party vote analysis by Gender
*The Roy Morgan Government Confidence Rating is 100 plus
the difference between the percentage of Kiwis who say the country is
“heading in the right direction” and the percentage who say the country is
“seriously heading in the wrong direction”. Michele Levine, CEO Roy Morgan, says a huge ‘gender gap’
has opened up in NZ politics with Prime Minister Jacinda Ardern’s
Labour-Greens Government enjoying the support of 58.5% of Women but a
majority of 52.5% of men supporting the Parliamentary Opposition: “Today’s Roy Morgan New Zealand Poll shows the Labour-led
Government has the support of 49.5% of New Zealand electors with support for
the Labour Party at 39.5% and a further 10% supporting the Greens. “Support for the Government is down 1.5% points on June
and is the lowest support for the Labour-led Government since coming to power
in October 2017. The Parliamentary Opposition is now supported by 44.5% of electors
with support split between National (29%), Act NZ (13%) and the Maori Party
(2.5%). “However, the top-line results don’t tell the full story
and there is a large difference between who Women and men support. Women’s
support for Prime Minister Ardern’s Government (58.5%) remains strong with
high support for Labour (46.5%) and the Greens (12%). “In contrast, a majority of men support the Parliamentary
Opposition (52.5%) with nearly a third supporting National (32.5%) and
one-in-five supporting either Act NZ (17.5%) or the Maori Party (2.5%). “Overall, the ‘gender gaps’ are significant with 58.5% of
Women supporting Labour-Greens compared to only 40.5% of men – a ‘gender gap’
of 18.5% points. This gap is slightly larger than the advantage men give to the
grouping of National-Act NZ-Maori Party which is supported by 52.5% of men
and 36.5% of Women – a ‘gender gap’ of 16.5% points. “The ‘gender split’ is currently working in favour of the
Government with support from Women for Prime Minister Ardern’s Government
holding up and support on the centre-right being increasingly split between
National and the libertarian-minded Act NZ – which has now reached a record
high result of 13% in July. “The slow pace of New Zealand’s vaccine rollout isn’t
helping with only 13% of the population fully vaccinated and just over 1.8 million doses of
COVID-19 vaccines so far administered and New Zealand’s international
borders set to remain closed until at least early 2022. “This is a stark contrast to the scenes from the UK over
the last few weeks as the country celebrated it’s so-called ‘Freedom Day’
with nearly 90% of British adults receiving at least one vaccine dose and
around 70% of adults now fully vaccinated. “The slow rate of the vaccine rollout is also a
significant factor in the Government’s decision to suspend the travel bubble
with Australia for the next two months following a large outbreak of COVID-19
in Sydney. Although the decision is necessary given the risks of the highly
contagious Delta variant entering the country it will nevertheless disrupt
the travel plans of tens of thousands of New Zealanders hoping to ‘hop across
the ditch’.” New Zealand Party Vote: 2020-21
New Zealand Party Vote: NZ Govt. v Parliamentary Opposition
Roy Morgan NZ Government Confidence Rating vs. ANZ-Roy
Morgan NZ Consumer Confidence
Voting Intention Summary The
following table compares the latest New Zealand Roy Morgan Polls on Voting Intention
with the result from the September 23, 2017 General Election:
*The 1996 Election was the first New Zealand Election
contested via MMP (Mixed Member Proportional). At the 1996 Election the
Greens Party contested as part of the “Alliance” political grouping with four
other political parties. Two-Party Preferred: Labour Party-led Government vs.
Parliamentary Opposition Parties
*At the 2020 NZ Election the Labour party secured 50.01%
of the vote which was enough to govern in their own right but Labour opted to
sign a ‘Cooperation Agreement’ with the Greens, who won 7.86% of the vote.
There were three Parties elected to Parliament not in Government led by
National (25.58%), Act NZ (7.59%) and the Maori Party (1.17%). (Roy
Morgan) July
30 2021 Source: https://www.roymorgan.com/findings/8759-nz-national-voting-intention-july-2021-202107300142 MULTICOUNTRY
STUDIES
701-43-20/Poll On Average, 56% Agree Their Country’s Society Is Broken And 57% Agree
That Their Country Is In Decline
Majorities of citizens in most of 25 countries surveyed by Ipsos
express feelings of alienation when thinking about their country. The survey
of more than 19,000 adults finds perceptions of a broken political and
economic system prevailing in most countries, often accompanied by populist
and anti-elite sentiment and nativist views. Broken-System Sentiment On average, 56% agree their country’s society is broken and 57% agree
that their country is in decline. To fully grasp the prevalence of social and
political disaffection, Ipsos designed the “System Is Broken” Index, based on
the level of agreement with five statements:
The four countries with the highest levels of alienation are all in
Latin America – Colombia, Peru, Brazil, and Chile. Since 2016, broken-system sentiment has gained ground most in Japan,
South Africa, Sweden, the United States, and Argentina; it has receded most
in Spain, Mexico, and France. Compared to 2019, months before the pandemic,
it has increased most in Malaysia and decreased most in Great Britain. Broken-system sentiment is highly linked to populist sentiment, resentment
of elites, and natives-first/anti-immigration views. Ipsos also found that
its System Is Broken Index is highly correlated with both the Social Progress
Imperative’s Social Progress Index,
an outcomes-based indicator of how well citizens’ social and environmental
needs are met, and Transparency International’s Corruption Perceptions Index. Countries
with higher levels of wellness, equality, inclusion, sustainability, personal
freedom, and safety and those with lower levels of perceive public-sector corruption
tend to show lower levels of broken-system sentiment. Since 2016, broken-system sentiment has gained ground most in Japan,
South Africa, Sweden, the United States, and Argentina; it has receded most
in Spain, Mexico, and France. Compared to 2019, months before the pandemic,
it has increased most in Malaysia and decreased most in Great Britain.
Populism and Resentment of Elites On average across the 25 countries:
Populist/anti-elite sentiment is strongly correlated with
broken-system sentiment; it is most prevalent in Chile, Hungary, Colombia,
Peru, and Russia. The “elite” is widely perceived across the world as a closely
connected group making decisions based on their interest and ignoring the
needs of others. On average, 15% of those surveyed identify in any way with
their country’s elite; Americans and Japanese are those least likely to do
so. Nativist Views The “average global citizen” is ambivalent about immigration, leaning
toward a natives-first view:
The Nativism Index is strongly correlated with the “System Is Broken”
Index, indicating how much social and political alienation and
anti-immigration views tend to go hand-in-hand. Since 2016, nativist sentiment has grown most in Peru, Sweden (where
it was marginal), Japan, South Africa, South Korea, and Turkey. Meanwhile, it
has receded most in the U.S., Canada, Spain, Italy, and Hungary. (Ipsos MORI) 28 July 2021 701-43-21/Poll More Than Half Of UAE & KSA Residents 67% And 62% Trust Review
And Rating Sites And Find Them To Be Useful
As the world becomes more digitalized, online reputation can be the
strongest asset and at the same time the biggest liability. Online reviews
matter and are often used by consumers as their sidekick before making
important decisions. YouGov’s latest study reveals the power of review and
rating sites (like Google Reviews, Glassdoor, etc.) and the trust that people
have in them. In UAE, more than two-third (67%) of residents trust review and
rating sites, while only 5% indicated a distrust. Similar attitudes are held
by the KSA public, where 62% showed confidence in these sites, and a very
small number said they do not trust them (3%).
Notably, a sizable proportion of consumers in both countries haven’t
made up their minds about these sites and remain undecided about their
reliability (27% in KSA & 24% in UAE). When it comes to checking the reviews or ratings of different
products and services, KSA residents (48%) were more likely than people in
UAE (44%) to turn to online critiques in the past 12 months while deciding on
a place to eat (restaurants, cafes). Even for products like household
appliances (37% in KSA & 27% in UAE) and makeup & personal care (29%
vs 18%), consumers in KSA seem to be more reliant on websites for reviews and
ratings than those in UAE.
Like movies, app ratings and reviews also have a significant impact
on a consumer’s decision to download an app. Compared to people in the UAE,
residents in KSA are more likely to check app reviews (38% vs 31%). However,
when it comes to healthcare providers, UAE residents claim to be dependent on
public’s opinion on review sites than their Saudi counterparts (28% in UAE vs
17% in KSA). Furthermore, in the past 12 months, almost a fourth (24%) in UAE- and
one in five (19%) in KSA have headed to sites like Glassdoor to find reviews
and ratings of their potential employers. With vaccination efforts ramped up and travel resuming, people can
finally look forward to their travel plans. Sites like TripAdvisor, Travel
Expedia, etc. played an important role in shaping up the holiday plans of
people in UAE and KSA, as many claim to have used them (in the past 12
months) for either researching travel accommodations or hotels (30% in UAE
& 25% in KSA) or finding suitable travel destinations or attractions (27%
in UAE & 25% in KSA). The pandemic has brought about changes in the way consumers shop and
consume services. The lockdowns and subsequent absence of in-store shopping
during the pandemic might have made people more reliant on reviews from
current consumers. Apart from the products and services mentioned earlier,
consumers claim to have accessed review websites for Tech products (23% in
UAE vs. 20% in KSA), videogames (16% vs 22%), vehicle models (27% vs 26%),
banks and financial products (30% vs 23%), fashion products/accessories (25%
vs24%), books (16% vs 21%) and educational institutes (22% vs 18%). Data also shows that an overwhelming majority of respondents in both
UAE and KSA find these sites to be useful. The numbers are more pronounced in
the UAE as compared to KSA (83% vs 79%).
(YouGov MENA) July 29, 2021 Source: https://mena.yougov.com/en/news/2021/07/29/more-half-uae-ksa-residents-trust-review-and-ratin/ 701-43-22/Polls Those On Ideological Right Favor Fewer Covid-19 Restrictions In Most
Advanced Economies
In many countries around the world,
government attempts to impose coronavirus-related restrictions on public
activity have encountered resistance and mass
protest movements aimed at lockdowns. With the fast-spreading
delta variant threatening a new wave of infections among the
unvaccinated and slow,
unequal vaccine rollouts globally, governments may yet again be
forced to consider implementing restrictions on public activity.
Majorities in most of the 17 advanced
economies Pew Research Center surveyed in spring 2021
say the restrictions that had been imposed over the course of the pandemic
were about right or that there should have been more restrictions. But
significant minorities say there should have been fewer restrictions,
suggesting they may be resistant to renewed lockdowns and social distancing
requirements. In most countries surveyed, those on the
ideological right are particularly likely to say there should have been fewer
restrictions on public activity over the course of the coronavirus
outbreak. In keeping with previous findings, ideological
divides between the left and right are largest in the United States
with 52% of conservatives and 7% of liberals saying there should have been
fewer restrictions. (The U.S. portion of the survey was conducted earlier
than others, in early February.) Right-leaning people are significantly more
likely to say restrictions went too far in nine other nations surveyed. The only country where these ideological
patterns are reversed is Greece – the public that also reports the highest
proportion saying there should have been fewer restrictions. A majority (55%)
of left-leaning Greeks say there should have been fewer restrictions, while
only about a third (34%) of right-leaning Greeks hold that view.
This may be, in part, due to opinions among
supporters of Greece’s left-leaning populist party Syriza, who are
significantly more likely than Syriza detractors to say there should have
been fewer restrictions (55% compared with 39%, respectively). Syriza leader
Alexis Tsipras has accused the center-right government of using
the pandemic as a pretext to restrict democratic rights and
freedoms. On the other hand, support for right-wing
populist parties in most European countries is associated with more hostile
views toward pandemic restrictions. In the Netherlands, those with favorable
views of the right-wing populist parties Forum for Democracy (FvD) and Party
for Freedom (PVV) are more likely to think restrictions went too far. The
pattern among right-wing populist supporters to favor fewer restrictions is
also particularly prominent among Alternative for Germany (AfD) supporters in
Germany, Lega supporters in Italy and Vox supporters in Spain.
In some countries surveyed, younger adults
are more likely to favor fewer coronavirus restrictions than are older
adults. The age gap is largest in Greece, where 58% of 18- to 29-year-olds
say there should have been fewer restrictions, compared with a quarter of
those 65 and older – a difference of 33 percentage points. Significant
differences also appear in Belgium, France, Canada, the Netherlands, Spain
and Singapore. Younger people in the U. S. and South Korea
are less likely to
say there should have been fewer restrictions on public activity over the
course of the coronavirus outbreak. For example, 8% of younger South Koreans
say there should have been fewer restrictions, compared with 20% of older
South Koreans. Americans ages 18 to 29 are about 11 points less likely to say
there should have been fewer restrictions than Americans ages 65 and older
(19% and 30%, respectively).
In the U. S., this may be, in part, due to
dynamics in party identification and age differences. Younger
Americans are more likely to lean Democratic than older Americans
and there are large partisan differences on the question: 51% of Republicans
and Republican-leaning independents say there should have been fewer
restrictions, compared with just 6% of Democrats and Democratic leaners. In
the U.S., age gaps are much smaller when partisanship is taken into account.
Among Republicans, those ages 50 and older are about as likely as those ages
18 to 49 to say there should have been fewer restrictions. Younger Democrats
are more likely than older Democrats to say there should have been fewer
restrictions, in line with patterns in other advanced economies. Still,
Democrats as a whole overwhelmingly say there should have been more restrictions on public
activity (81%). Views of the economy are also tied to views
about restrictions in about half of the publics surveyed. For example, 51% of
Greeks who say the current economic situation is bad also say there should
have been fewer restrictions, compared with a fifth of Greeks who think the
economic situation is good. Additionally, opinions about restrictions
appear to be related to the actual strength of restrictions in each public
during the fielding period as reported by the Oxford
COVID-19 Government Response Tracker. Governments with the highest level
of restrictions while the survey was fielding, such as Greece and Germany,
also report some of the highest shares saying there should have been fewer
restrictions over the course of the coronavirus outbreak. (PEW) JULY 30, 2021 |
||||||||||||||||||||||||||||||||||||||||||||||||||||||||||||||||||||||||||||||||||||||||||||||||||||||||||||||||||||||||||||||||||||||||||||||||||||||||||||||||||||||||||||||||||||||||||||||||||||||||||||||||||||||||||||||||||||||||||||||||||||||||||||||||||||||||||||||||||||||||||||||||||||||||||||||||||||||||||||||||||||||||||||||||||||||||||||||||||||||||||||||||||||||||||||||||||||||||||||||||||||||||||||||||||||||||||||||||||||||||||||||||||||||||||||||