|
BUSINESS & POLITICS IN THE WORLD GLOBAL OPINION REPORT NO. 702 Week:
August 02 –August 08, 2021 Presentation:
August 13, 2021 8
out of 10 Employees Worried About Losing Their Job 83%
Citizens Of Eswatini Are Satisfied With The Government’s Efforts To Manage
The Covid-19 Response Three
Quarters Of Britons Support Doctor-Assisted Suicide, Just One In Three Mps
Say The Same 30%
Of Britons Think Things In Britain Are Heading In The Right Direction 21%
Of French People Say They Often Go To A Cultural Place Such As A Museum Or A
Foundation The
Vaccination Pass: A Subject Of Contention Between Relatives For 41% Of French
People About
58% Of Households Headed By Black Or African American Adults Rent Their Homes Women
Represent Attendees At 21% Of Mosques In US By 2020, Which Was 14% In 2011 Inflation
Expectations increase to 4.1% in July, highest for nearly 2 years since Oct
2019 Australian
Employment Dropped By 176,000 In July As All Five Mainland States Experienced
Lockdowns Global
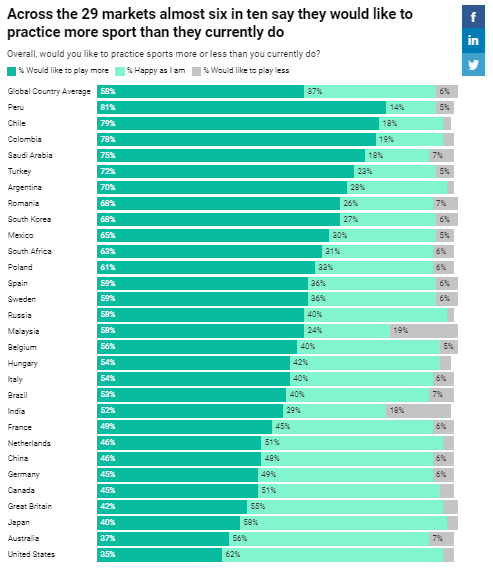
views on sports: 58% globally would like to practice more Only
7% Citizens Believe Their Country's Economy Has Already Recovered Globally,
on average, 70% of citizens are very or quite satisfied with the lifestyle
they lead INTRODUCTORY NOTE
702-43-22/Commentary:
30%
Of American Adults Say They Own A Gun, While Another 11% Say Another Member
Of Their Household Does
Gun owners
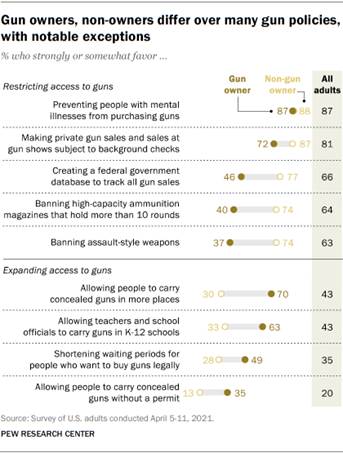
in the United States have long favored more permissive gun policies while
adults who do not own guns have tended to favor more restrictive policies.
This pattern continues today. For example, 37% of gun owners favor banning
assault-style weapons, compared with twice as many (74%) non-gun owners – and
this gap has grown in recent years, according to a new analysis of Pew
Research Center surveys conducted in April and June 2021. How we did this Yet these
differences in opinion between gun owners and non-owners do not apply to all
gun policies. Gun owners are roughly as likely as non-owners to support
preventing people with mental illnesses from obtaining guns. And sizable
majorities of adults who own guns and those who do not both favor background
checks for private gun sales and sales at gun shows.
Non-owners
are 31 percentage points more likely than gun owners to say they favor
creating a federal database to track all gun sales (77% vs. 46%), and there
are similar sized gaps in opinion over banning high-capacity magazines and
banning assault-style weapons, according to the analysis, which is based on
an April
2021 survey on Americans’ attitudes about gun
policy and a June 2021 survey on gun ownership. The June
2021 survey, which was conducted June 14-27 among 10,606 adults, finds that
30% of adults say they own a gun, while another 11% say they personally do
not own a gun but another member of their household does. Self-reported
gun ownership has changed little in recent years. Majorities
of gun owners say they favor allowing concealed carry in more places and
allowing teachers to carry guns in K-12 schools, but only about a third of
non-owners support these policies. While gun owners are split over shortening
waiting periods for those who legally want to buy guns (49% favor, 51% oppose),
just 28% of non-owners support this. Most Americans – regardless of whether
or not they own guns – oppose concealed carry without a permit, but gun
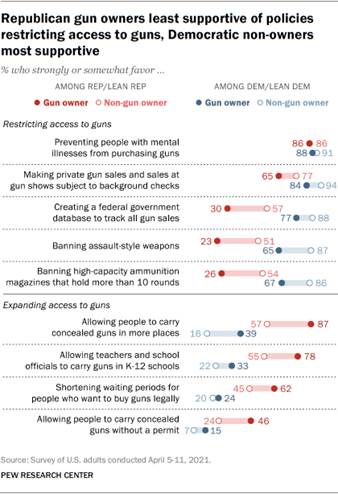
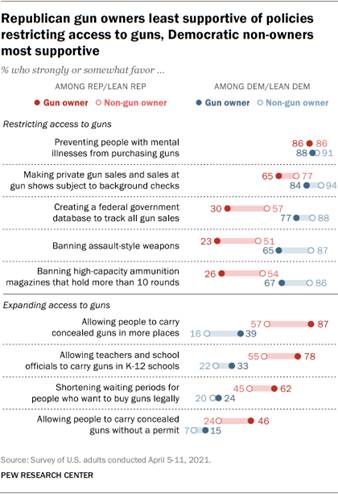
owners (35%) are more likely than non-owners (13%) to support this. Views on gun policies linked to both gun ownership and partisanship While gun
ownership is associated with views on gun policies, the sizable
partisan differences in these policy attitudes are
reflected among owners and non-owners as well. In general, Republican gun
owners are less likely than GOP non-owners – and both Democratic owners and
non-owners – to favor policies that restrict access to guns. Democratic
non-owners are more likely than others to favor restrictions.
Gun owners
and non-owners within each party differ on their views on gun policies.
However, these differences are more pronounced among Republicans and
Republican-leaning independents than they are among Democrats and Democratic
leaners. (Note: Republicans
are about twice as likely as Democrats to say they own a gun.) Among
Republicans, a 57% majority of those who don’t own a gun say they favor
creating a federal government database to track all gun sales. By comparison,
three-in-ten Republican gun owners say the same. There is a similar-sized gap
among Republicans who own guns and those who do not on banning assault-style
weapons and high-capacity magazines. On proposals
to expand access to guns, Republicans who own guns are much more likely to
support these proposals than are non-owners. For example, an overwhelming
majority of Republican gun owners (87%) say they favor allowing people to
carry concealed guns in more places, while a smaller majority of those who
don’t own a gun (57%) say the same. There are
modest differences among Democrats on gun policies by gun ownership. For
instance, while majorities of Democratic gun owners and non-owners both favor
banning assault-style weapons and banning high-capacity magazines, Democratic
gun owners are about 20 percentage points less likely to say this. Democrats
who own guns (39%) also are more likely than those who do not (16%) to say
people should be allowed to carry concealed guns in more places. While there
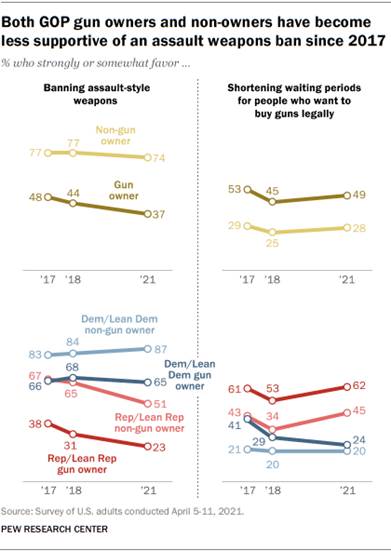
has been a modest decline in support for an assault weapons ban among the
public overall, much of this change is attributable to declining support for
the policy among Republican gun owners and non-owners alike. Among
Republican gun owners, there has been a 15 percentage point decrease in
support for banning assault-style weapons since 2017 (down from 38% to 23%
today). There has been a similar 16-point decrease among Republicans who
don’t own a gun on this proposal.
Democrats –
both owners and non-owners – are about as likely as they were in 2017 to say
they favor banning assault-style weapons. While
Republican gun owners and non-owners are both more likely to say they favor
shorter waiting periods for people who want to buy guns legally today than
they were in 2018, current opinions are similar to views in 2017. By contrast,
support for shorter waiting periods has declined among Democratic gun owners.
In 2017, 41% of Democrats who owned a gun said they favored this policy.
Today, about a quarter (24%) say this. Just 20% of Democrats who don’t own
guns favor shorter waiting periods, which has remained virtually unchanged
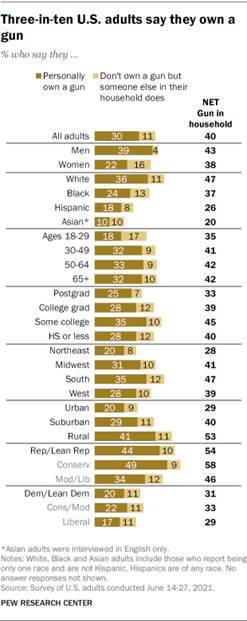
over the last few years. Gun ownership more common among men, rural and White adults Four-in-ten
U.S. adults report that there is a gun in their household: Three-in-ten say
they personally own a gun, while 11% say that they don’t own a gun, but
someone else in their household does. Gun
ownership varies across demographic groups. About four-in-ten men say they
personally own a gun, compared with 22% of women.
While 36% of
White adults say they personally own a gun, smaller shares of Black (24%),
Hispanic (18%) and Asian (10%) adults report owning a gun. Adults under
30 are less likely to own a gun than those in older age groups: 18% of 18- to
29-year-olds own a gun, compared with a third of those ages 30 and older. Americans
who live in the Northeast are the least likely to say they own a gun, with
20% saying this. Americans who live in the South (35%), Midwest (31%) and the
West (28%) are more likely to report owning a gun. Gun ownership
also widely varies by community type, with those who live in rural areas much
more likely to say they own a gun. Overall, 41% of Americans who live in
rural areas own a gun, compared with 29% of those in suburban areas and 20%
of Americans who live in urban areas. There are
clear partisan divides when it comes to gun ownership: 54% of Republicans and
Republican-leaning independents either personally own a gun (44%) or live in
a house where someone else owns one (10%). By comparison, about three-in-ten
(31%) Democrats and Democratic-leaning independents live in a household with
a gun, with 20% reporting personally owning a gun. While there
are ideological differences on gun ownership in both parties, they are wider
among Republicans. Nearly half of conservative Republicans say they own a gun
(49%), while 34% of moderate and liberal Republicans say they do.
Conservative and moderate Democrats are slightly more likely than liberal
Democrats to say they own a gun (22% vs. 17%). (PEW) AUGUST 4,
2021 702-43-23/Country Profile:
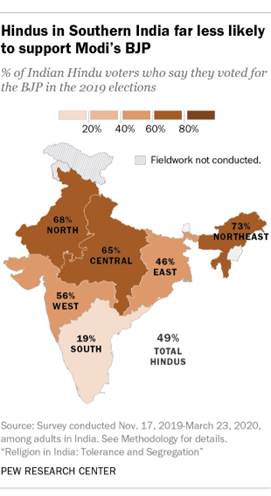
ASIA (India) Among
Hindus, The BJP Received Some Of Its Highest Vote Shares In The Northern
(68%) And Central (65%) Regions Of The Country Among Hindus, the BJP received some of its
highest vote shares in the Northern (68%) and Central (65%) regions of the
country, which include India’s capital, Delhi, and its most populous state,
Uttar Pradesh. By comparison, 46% of Hindu voters in the East and just 19% in
the South say they voted for the BJP, according to the Center’s survey. In
2019, roughly half of Hindu voters (49%) supported the BJP, giving the party
a majority in the Lok Sabha – India’s lower house of parliament – and
allowing Prime Minister Narendra Modi a second term to lead the country. (PEW) AUGUST 5, 2021 (Turkey) 8 out of 10 Employees Worried About Losing Their Job According to the research carried out by
the Ipsos research company, with the increase in the number of cases both in
the world and in Turkey, the feeling of anxiety is increasing in the
society. This sense of anxiety and the lifting of the ban on dismissal
at the same time cause the employees to worry about losing their
jobs. While 44% of employees felt very worried about losing their job
before the holiday, the rate of those who are very worried has increased to
59% today. When we include those who are partially worried, the rate of
those who are worried in the week of 27-30 July is 81% in total. (Ipsos Turkey) 2 August 2021 AFRICA (Eswatini) 83% Citizens Of Eswatini Are Satisfied With The
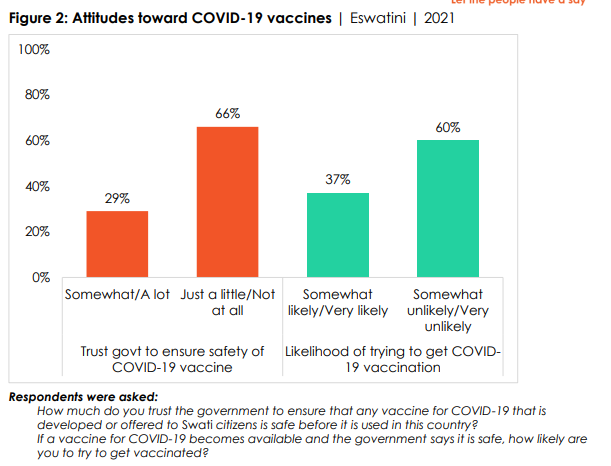
Government’s Efforts To Manage The Covid-19 Response Only 38% say they trust official COVID-19
statistics, and more than threefourths (77%) believe that “some” or “a lot”
of the resources available for responding to the pandemic were lost to
government corruption. Fewer than one-third (29%) of citizens say they trust
the government to ensure the safety of any COVID-19 vaccine, and only a
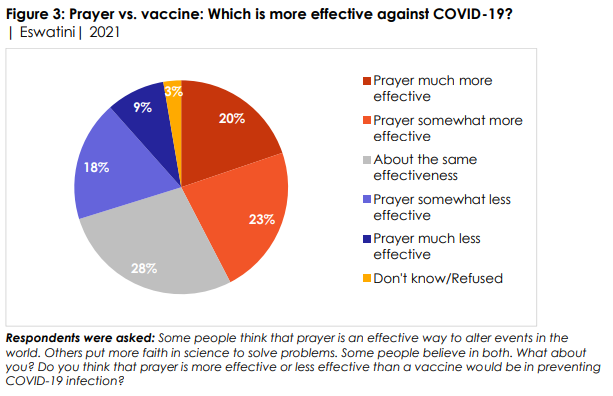
minority (37%) indicate that they are likely to try to get vaccinated. More
than four in 10 emaSwati (43%) believe that prayer is more effective than a vaccine
would be in preventing COVID-19 infection. (Afrobarometer) 5 August 2021 WEST
EUROPE (UK) Three
Quarters Of Britons Support Doctor-Assisted Suicide, Just One In Three Mps
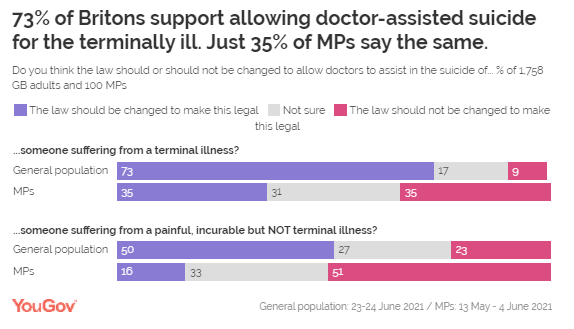
Say The Same Almost three quarters of Britons (73%)
think the law should be changed to allow doctors to assist in the suicide of
someone suffering from a terminal illness, including 74% of Conservative
voters and 76% of Labour voters. However, just 35% of MPs feel the same way. MPs are just as likely to say they oppose
such a move, at 35%. This is four times as high as the rate among the general
public (9%). Britons also tend to support allowing doctors to assist in the
suicide of someone suffering from a painful, incurable – but not terminal –
illness, by 50% to 23%. Again, MPs are far more reluctant to see such a
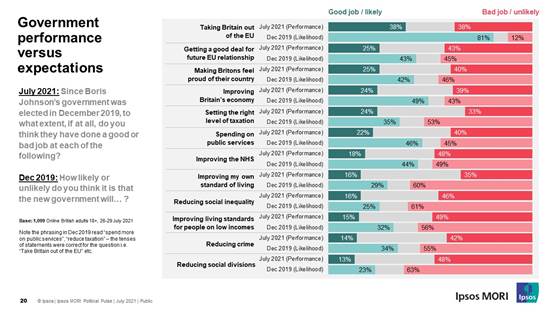
change, with only 16% in support compared to 51% opposed. (YouGov UK) August 04, 2021 30% Of Britons Think Things In Britain Are Heading In The
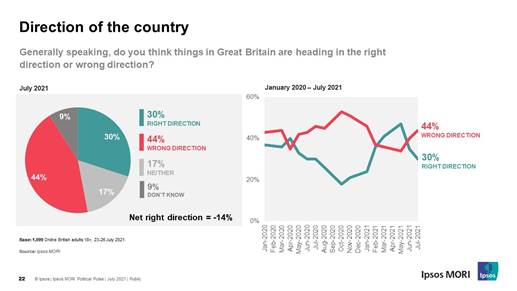
Right Direction 30% of Britons think things in Britain are
heading in the right direction (-5 pts from June), 44% think things are
heading in the wrong direction (+4). The net rating on this measure of
-14 is the lowest since January this year. Optimism has fallen particularly
among 2019 Conservative voters, from 63% last month to 49% this month (among
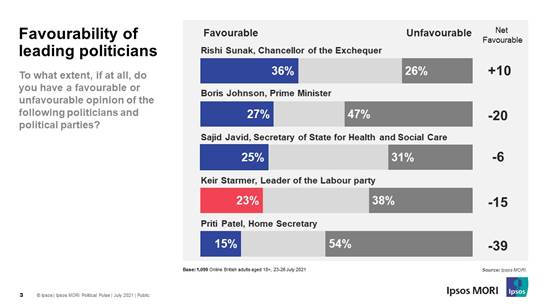
Labour voters, there has been little change at 22% from 19%). Favourability
towards Boris Johnson has also fallen again this month, to 27% favourable (-6
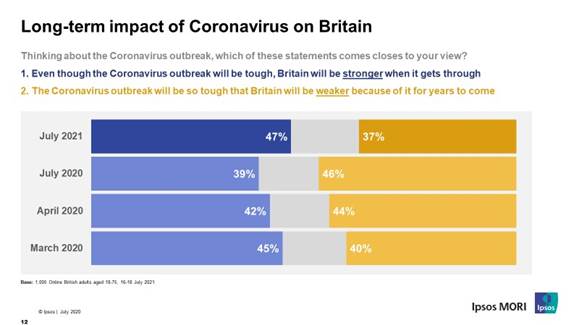
pts since June) and 47% unfavourable (nc). (Ipsos MORI) 4 August 2021 Almost Half (47%, Up From 39% Last Year)
Believe Britain Will Be Stronger When It Gets Through The Pandemic Looking to the future, Britons have become
more hopeful since last year. Almost half (47%, up from 39% last year)
believe Britain will be stronger when it gets through the pandemic, even
though it will be tough. However, a sizeable minority are less optimistic,
37% say the pandemic will make Britain weaker for years to come (although this
is down from 46% last year). Top concerns for the rest of the year
include the spread of a new vaccine-resistant variant (80%) and another wave
of cases (79%), including around half who are very concerned. (Ipsos MORI) 6 August 2021 One In Six Britons From Black, Asian And
Minority Ethnic Communities (17%) Know A Victim Of Knife Crime Closely Or
Have Been One Themselves One in six Britons from Black, Asian and
minority ethnic communities (17%) know a victim of knife crime closely or
have been one themselves. This is nearly twice the rate as among the wider
population, at 9%. Among those aged 25 to 49, the difference is more than
two-fold, at 18% vs 8%. Among ethnic minority Britons, 6% say a family member
has been a victim of knife crime, while 8% say the same about a close friend
and 4% have experienced it themselves. (YouGov UK) August 06, 2021 (France) 21% Of French People Say They Often Go To A Cultural Place
Such As A Museum Or A Foundation Almost a third of French people say they go
at least once a quarter to a cultural place such as a museum or a foundation
(32%). Contrary to what many might think, 18-34 year olds are not the
least inclined to visit the museum. 21% say they often go to a cultural
place such as a museum or a foundation (vs. 9% of 55+). Overall, French
museums enjoy a good image among French people of all
generations. Indeed, 49% consider
that they are enriching and only 5% that they are boring. (YouGov France) The Vaccination Pass: A Subject Of
Contention Between Relatives For 41% Of French People The health pass and vaccination are
sensitive subjects: 41% of French people believe that having discussed
with their relatives has caused tensions or serious conflicts between
them and 31% do not intend to discuss these subjects in their entourage
this summer. 60% say they are in favor of the health pass to access
cafes, restaurants, shopping centers, planes, trains, long-distance coaches
and medical establishments. They will a priori be tolerant if one of
their companions has neither a health pass nor a PCR test to access the
places where they will be requested: 73% say that they will not go either and
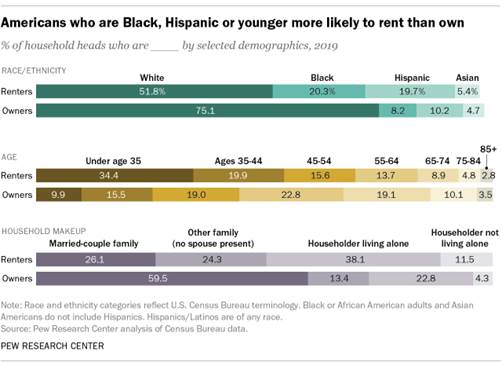
will stay with him. (Ipsos France) 4 August 2021 NORTH AMERICA (USA) About 58% Of Households Headed By Black Or African American
Adults Rent Their Homes One big disparity among renters is race and
ethnicity. Nationwide, about 58% of households headed by Black or African
American adults rent their homes, as do nearly 52% of Hispanic- or Latino-led
households, according to Pew Research Center’s analysis of census data. By contrast, roughly a quarter of
households led by non-Hispanic White adults (27.9%) are rentals, as are just
under 40% of Asian-led households. Younger people – those below the age of 35
– are far more likely to rent than are other age groups: About two-thirds
(65.9%) of this age group lives in rentals. This compares with, for example,
42% of those ages 35 to 44, and less than a third (31.5%) of 45- to
54-year-olds. (PEW) AUGUST 2, 2021 Women Represent Attendees At 21% Of Mosques
In US By 2020, Which Was 14% In 2011 Despite the increase, men continue to
account for the vast majority of attendees at Friday prayer services at most
U.S. mosques. Men make up the majority of Jumah prayer attendees in 94% of
mosques, and there were no mosques in which men make up fewer than
three-in-ten attendees at Friday prayer. The survey also found that while 44%
of mosques have no children at the Friday prayer service (which typically
happens during the school day), children were present in 55% of mosques. (PEW) AUGUST 4, 2021 30% Of American Adults Say They Own A Gun,
While Another 11% Say Another Member Of Their Household Does Gun owners in the United States have long
favored more permissive gun policies while adults who do not own guns have
tended to favor more restrictive policies. This pattern continues today. For
example, 37% of gun owners favor banning assault-style weapons, compared with
twice as many (74%) non-gun owners – and this gap has grown in recent years,
according to a new analysis of Pew Research Center surveys conducted in April
and June 2021. (PEW) AUGUST 4, 2021 Most Black Americans, 58%, Do Not Have A
Preference Between The Terms "Black" And "African
American" As A Term They Would Rather People Use To Describe Their
Racial Group Most Black Americans, 58%, do not have a
preference between the terms "Black" and "African
American" when asked which term they would rather people use to describe
their racial group. The one in three who express a preference divide evenly
between preferring each term. Black Americans were fairly mixed on the
question, with a slight preference for "Black" (52%) over
"African American" (44%). Four percent had no opinion either way. (Gallup) AUGUST 4, 2021 AUSTRALIA Inflation Expectations increase to 4.1% in July, highest
for nearly 2 years since Oct 2019 In July 2021 Australians expected inflation
of 4.1% annually over the next two years, up 0.1% and the highest Inflation
Expectations for nearly two years since October 2019. Inflation Expectations
are now up 0.9% points since the pandemic low of 3.2% a year ago in August
2020. Inflation Expectations are still 0.6% points below their long-term
average of 4.7% but are now 0.6% points higher than the 2020 monthly average
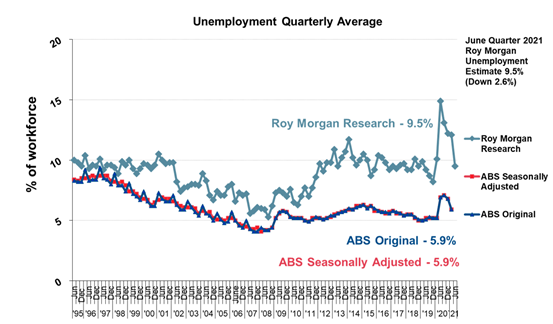
of 3.5% and 0.7% points higher than a year ago in July 2020 (3.4%). (Roy Morgan) August 03 2021 Australian Employment Dropped By 176,000 In
July As All Five Mainland States Experienced Lockdowns Latest Roy Morgan employment series data
shows 1.42 million Australians were unemployed in July, up 28,000 on June,
for an unemployment rate of 9.7% (up 0.3% points), while 1.33 million, up
77,000 on June, were under-employed, an under-employment rate of 9.1% (up
0.6% points). Australian employment was down by 176,000 to 13,198,000 in July
including 8,765,000 workers employed full-time, a drop of 61,000 from June.
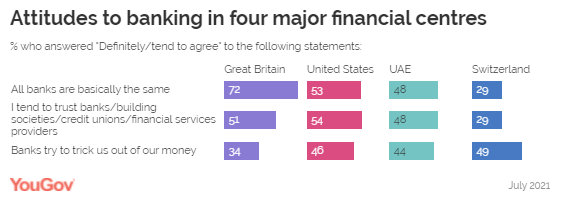
There was also a decrease in part-time employment, down by 115,000 to 4,433,000. (Roy Morgan) August 06 2021 MULTICOUNTRY STUDIES Seven In Ten Britons Believe “All Banks Are Basically The
Same”, Compared To Just Over Half Of Americans (53%) Seven in ten Britons, for example, believe
“all banks are basically the same”, compared to just over half of Americans
(53%), nearly half of Emiratis (48%), and three in ten Swiss consumers (29%).
While each of these countries boasts a major financial services hub for its
respective region, in Switzerland – where the banking sector is tied up with
national identity – they may seem less homogenous than they do elsewhere. In
Britain, then, financial services companies may need to do more to
differentiate themselves from the competition. (YouGov UK) August 02, 2021 Source: https://yougov.co.uk/topics/consumer/articles-reports/2021/08/02/perceptions-banking-four-major-hubs Global views on sports: 58% globally would like to practice
more A new Global Advisor study reveals that
people from the Netherlands are the most physically active of 29 nations. On
average they report spending 12.8 hours a week (almost two hours per day)
doing physical exercise or team sports, double the average of 6.1 across 29
markets. People from Germany and Romania are the next most active, carrying
out 11.1 and 11 hours of exercise per week respectively. (Ipsos Canada) 3 August 2021 Source: https://www.ipsos.com/en-ca/news-polls/global-views-to-sports-2021 The Dutch Are The Most Physically Active Nation (Exercising
12.8 Hours Per Week) , The Brazilians Are The Least A new global Ipsos study reveals that
people from the Netherlands are the most physically active of 29 nations. On
average they report spending 12.8 hours a week (almost two hours per day)
doing physical exercise or team sports, double the average of 6.1 across 29
markets. People from Germany and Romania are the next most active, carrying
out 11.1 and 11 hours of exercise per week respectively. At the other end of
the scale, Brazilians are the least physically active, spending three hours
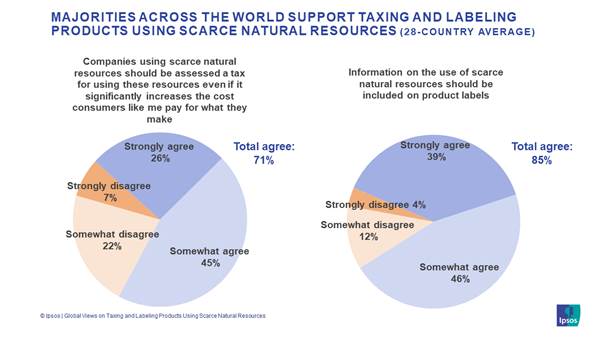
per week doing physical exercise on average (26 minutes per day). (Ipsos MORI) 3 August 2021 Source: https://www.ipsos.com/ipsos-mori/en-uk/dutch-are-most-physically-active-nation-brazilians-are-least Spain (89%) Is The European Country, And
The Sixth In The World, That Is Most In Favor Of Including This Measure In
Products Globally, on average, 71% of citizens agree
that companies have to pay a tax for using scarce natural resources, even if
this means that consumers have to pay more for products. This percentage
is in line with Spain (72%), which ranks as the second European country where
this idea is most supported, just behind Italy (73%). After Spain we
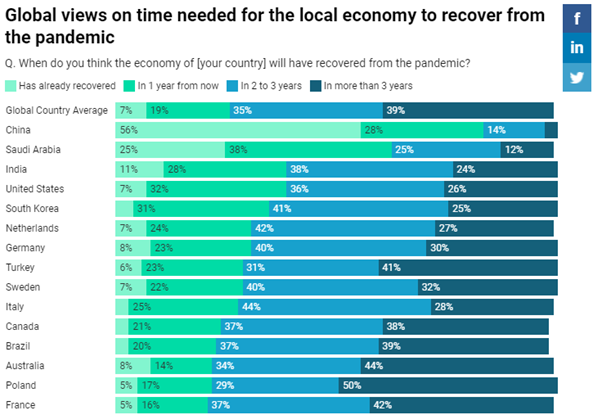
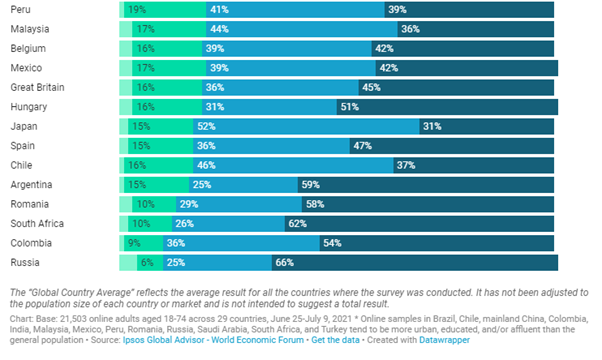
find Belgium (70%), the United Kingdom (69%) and the Netherlands (67%). (Ipsos Spain) 4 August 2021 Only 7% Citizens Believe Their Country's
Economy Has Already Recovered On average, globally, Only 7% believe their
country's economy has already recovered; this view is most widely held in
China (the only country where it is by a majority of those surveyed—56%) and
in Saudi Arabia (by 25%). 19% believe their economy will have recovered in a
year from now – a sentiment that is most prevalent in Saudi Arabia (38%), the
United States (32%), and South Korea (31%). (Ipsos Egypt) 5 August 2021 Source: https://www.ipsos.com/en-eg/local-economic-recovery-wef-ipsos-global-advisor-survey Globally, on average, 70% of citizens are
very or quite satisfied with the lifestyle they lead Globally, on average, 70% of citizens are
very or quite satisfied with the lifestyle they lead. This percentage is
repeated in Spain, which, compared to neighboring countries, ranks as
the third European country that is least satisfied with its lifestyle ,
only ahead of Hungary (62%) and Italy (59%). On the opposite side are
the Netherlands (85%) and the United Kingdom (81%), as the most satisfied at
European level. (Ipsos Spain) 6 August 2021 Source: https://www.ipsos.com/es-es/espana-cuarto-pais-europeo-con-mas-poblacion-sedentaria ASIA
702-43-01/Polls Among
Hindus, The BJP Received Some Of Its Highest Vote Shares In The Northern
(68%) And Central (65%) Regions Of The Country
India’s ruling party, the Bharatiya Janata
Party (BJP), is sometimes said to prioritize Hindu interests. Hindus were the religious group most
likely to say they voted for the BJP in the country’s most recent
parliamentary election, but there are vast differences in how Hindus from
different regions voted, according to a recent Pew Research Center survey of nearly 30,000 Indian adults. These
regional political differences are connected to Hindu attitudes on a range of
issues including language, diet and religious observance.
In 2019, roughly half of Hindu voters (49%)
supported the BJP, giving the party a majority in the Lok Sabha – India’s
lower house of parliament – and allowing Prime Minister Narendra Modi a second term to lead the country. Among Hindus, the BJP received some of its
highest vote shares in the Northern (68%) and Central (65%) regions of the
country, which include India’s capital, Delhi, and its most populous state,
Uttar Pradesh. By comparison, 46% of Hindu voters in the East and just 19% in
the South say they voted for the BJP, according to the Center’s survey. In the South, significant shares of Hindu
voters (20%) say they instead supported the Indian National Congress (INC),
which has led the country for most of the years since its independence.
Regional parties, including the Telangana
Rashtra Samithi and
the Yuvajana Sramika Rythu Congress Party, also received significant vote shares
among Southern Hindus (both 11%). Southern states tend to have higher per capita income and have experienced faster economic
growth than most Northern and Central states. Differences in voting patterns between
Southern Hindus and those who live in the Northern and Central regions are
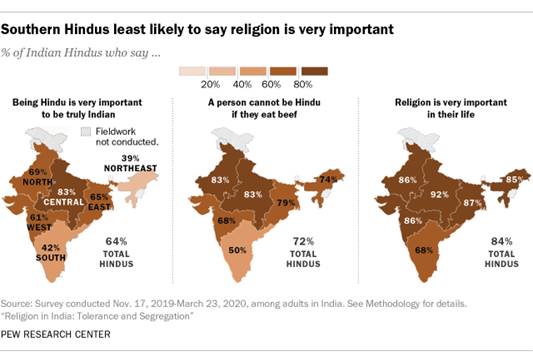
part of broader regional differences among Hindus in India. For example,
Hindu nationalist sentiments appear to have a smaller foothold in the South.
Nationally, 64% of Hindus in India say being a Hindu is very important to
being truly Indian. But while this share is as high as 83% in the Central
region, it falls to 42% in the South.
A closely related sentiment is the
importance of the Hindi language to national identity: The majority of Hindus
in the Central (87%) and Northern (71%) regions say that speaking Hindi is
very important to being truly Indian, while just 27% of Southern Hindus say
this. Among the dozens of commonly spoken Indian languages, Hindi is the most
widespread. However, while it is often spoken in the Northern and Central
parts of the country, it is far less common in the South. Views on the connection between the Hindu
religion, Hindi language and Indian identity are highly correlated with support for the BJP – a party
that has supported making Hindi the national language and has enacted laws (such as restricting cow slaughter) that are seen as favorable to Hindus. Indeed, attitudes about cow slaughter and
beef consumption mark another division between the South and other regions of
the country. Many Hindus consider cows sacred animals, but there are mixed
views about whether eating beef disqualifies a person from being a Hindu.
Most Hindus in the Northern and Central regions (both 83%) say someone who
eats beef cannot be Hindu, compared with half of Southern Hindus. And
attitudes about beef and Hindu identity are correlated with support for the
BJP: Hindus who say they voted for the BJP are more likely than other Hindu
voters to say someone who eats beef cannot be Hindu (77% vs. 66%). Southern Hindus also differ in their
religious observance. For instance, while 92% of Hindus in the Central region
say religion is very important in their life, the share is substantially
lower among Southern Hindus (68%). More religious Hindus tend to support the
country’s ruling party: About half of Hindus who say religion is very
important in their lives (52%) voted for the BJP in 2019, compared with
around a third of Hindus (32%) who say religion is less important in their
lives. Views of the BJP differ along other
religious lines in India, too. Among minority religions analyzed in the
Center’s report, Jains appear to be the only group who strongly embrace the
BJP. While the survey did not include enough Jain voters to report how they
voted in the 2019 election, 70% of Jains said in a separate question that
they feel closest to the BJP, regardless of whether they voted in the last
election. Meanwhile, other religious groups showed less support for the
ruling party: Fewer than a third of Buddhists (29%), Muslims (19%), Sikhs
(19%) and Christians (10%) say they voted for the BJP in the 2019
parliamentary election. Many voters from minority religions opted
to vote for parties other than the BJP or INC. For example, 14% of Buddhists
say they voted for the Bahujan
Samaj Party (BSP),
a national party focused primarily on the welfare of lower castes and
minority religions; 89% of Buddhists are members of Scheduled Castes. Support for regional parties is also tied
to religion. For instance, 16% of Sikhs say they voted for Shiromani
Akali Dal (SAD)
in 2019. SAD is a regional party representing Punjabi interests; according to
the most recent national census, conducted in 2011, 77% of India’s Sikhs live
in Punjab. (PEW) AUGUST 5, 2021 702-43-02/Polls 8 out of 10
Employees Worried About Losing Their Job
According to the research carried out by
the Ipsos research company, with the increase in the number of cases both in
the world and in Turkey, the feeling of anxiety is increasing in the
society. This sense of anxiety and the lifting of the ban on dismissal
at the same time cause the employees to worry about losing their
jobs. While 44% of employees felt very worried about losing their job
before the holiday, the rate of those who are very worried has increased to
59% today. When we include those who are partially worried, the rate of
those who are worried in the week of 27-30 July is 81% in total.
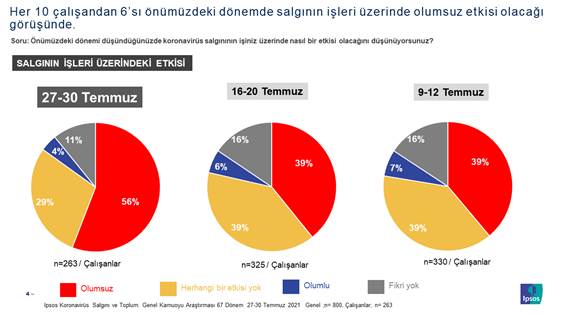
59% of Employees Think the Pandemic Will
Have a Negative Impact on Their Jobs in the Future The rate of employees who think that the
epidemic will have a negative impact on their workplaces increased by 17
points compared to the beginning of July and rose to 59%. Today, 6 out
of 10 employees are more hopeless about the future of their jobs.
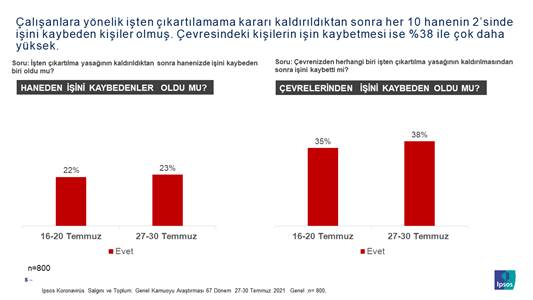
At least one person lost his job in 23% of
households after layoffs The end of the ban on dismissal also has an
effect on the increase in the sense of anxiety among the
employees. After the ban was lifted, 23% of the households lost their
job. In their environment, this rate is 38%.
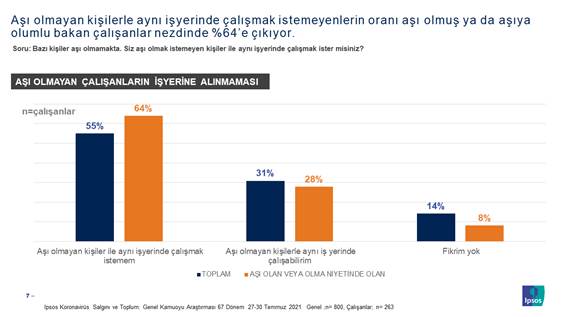
The Ratio of People Who Do Not Want to Work
in the Same Workplace as Unvaccinated People Increases When it comes to the week of 27-30 July,
55% of employees state that they do not want to work in the same workplace
with people who do not want to be vaccinated. This rate was 41% the
previous week. On the other hand, one-third of employees say that they
can work in the same workplace with people who are not vaccinated.
Higher Percentage of Employees Who Are Not
Against Vaccination (Who Have Got Vaccinated Or Will Be Vaccinated When It
Comes To Be Vaccinated) While 55% of all employees state that they
do not want to work in the same workplace with unvaccinated people, this rate
is 64% for employees who have been vaccinated or who will be vaccinated in
their turn.
Sidar Gedik, CEO of Ipsos Turkey, made the
following evaluations about the data; We have
been following the effects of the epidemic on our society for 67
weeks. We are in constant motion when we say increases and decreases in
the number of cases, consecutive waves, restrictions, quarantines,
vaccination campaigns, new virus variants. The situation has not been
stable, and it still is not. We are in a period when the number of cases
started to increase again with the introduction of the Delta
variant. Meanwhile, the restrictions are almost lifted. (Ipsos Turkey) 2 August 2021 Source: https://www.ipsos.com/tr-tr/her-10-calisandan-8i-isini-kaybetme-endisesi-tasiyor AFRICA
702-43-03/Polls 83% Citizens
Of Eswatini Are Satisfied With The Government’s Efforts To Manage The
Covid-19 Response
With the looming threat of a third wave of
COVID-19 infections in Eswatini, the latest Afrobarometer survey shows that most
citizens are satisfied with the government’s overall management of the pandemic even though many
found it difficult to comply with lockdown restrictions and most felt that the schools
were closed for too long. However, a majority of Emaswati believe
that government assistance was distributed unfairly and that resources intended for the
pandemic response were lost to government corruption. A majority do not trust the government to
ensure that COVID-19 vaccines are safe, and only about one-third say they are likely to try
to get vaccinated. Almost half say they would choose prayer over a vaccine to prevent
getting COVID-19. Key findings Overall, most citizens are satisfied with
the government’s efforts to manage the COVID-19 response (83%) and keep the public
informed (90%) (Figure 1). o However, only 38% say they trust official
COVID-19 statistics, and more than threefourths (77%) believe that “some” or
“a lot” of the resources available for responding to the pandemic were lost to
government corruption. Fewer than one-third (29%) of citizens say
they trust the government to ensure the safety of any COVID-19 vaccine, and only a
minority (37%) indicate that they are likely to try to get vaccinated (Figure 2). More than four in 10 emaSwati (43%) believe
that prayer is more effective than a vaccine would be in preventing COVID-19
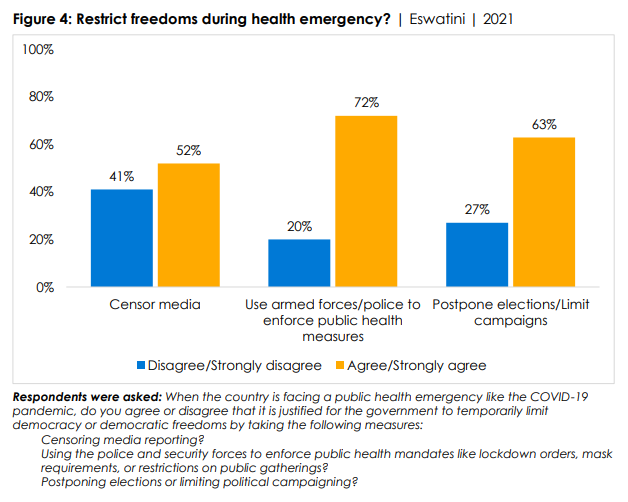
infection (Figure 3). A majority of citizens say the government
is justified in using measures that infringe on democratic freedoms during a public health
emergency, such as censoring the media (52%), using security forces to
enforce public health mandates (72%), and postponing elections or limiting political
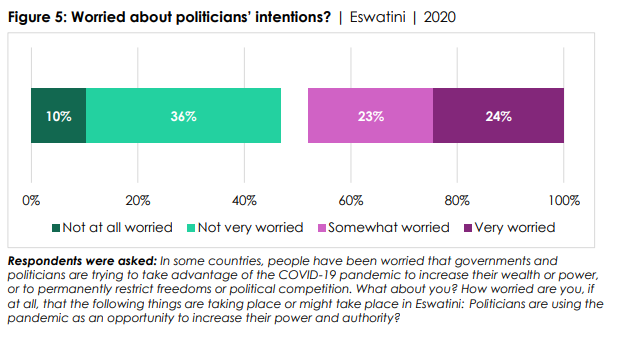
campaigns (63%) (Figure 4). o However, 47% of citizens say they are
worried about politicians taking advantage of the pandemic to increase their power and
authority (Figure 5). (Afrobarometer) 5 August 2021 WEST
EUROPE
702-43-04/Polls Three Quarters Of Britons Support Doctor-Assisted Suicide, Just One
In Three Mps Say The Same
The public and MPs are also out of step when it comes to allowing
assisted suicide for non-terminally ill patients suffering from painful
incurable diseases Back in 2019, a YouGov
study on left and right wing beliefs showed that support for
assisted dying was the nation’s most closely bipartisan view. Now new YouGov research shows that there is overwhelming public
support for doctor-assisted suicide for patients suffering from a terminal
illness, but that MPs are heavily divided on this issue. Almost three quarters of Britons (73%) think the law should be
changed to allow doctors to assist in the suicide of someone suffering from a
terminal illness, including 74% of Conservative voters and 76% of Labour
voters. However, just 35% of MPs feel the same way. MPs are just as likely to say they oppose such a move, at 35%. This
is four times as high as the rate among the general public (9%). MPs are also more likely to be unsure on the subject, at 31% compared
to 17% of all Britons. Britons also tend to support allowing doctors to assist in the
suicide of someone suffering from a painful, incurable – but not terminal –
illness, by 50% to 23%. Again, MPs are far more reluctant to see such a
change, with only 16% in support compared to 51% opposed. (YouGov UK) August 04, 2021 702-43-05/Polls 30% Of Britons Think Things In Britain Are Heading In The Right
Direction
30% of Britons think things in Britain are heading in the right
direction (-5 pts from June), 44% think things are heading in the wrong
direction (+4). The net rating on this measure of -14 is the lowest
since January this year. Optimism has fallen particularly among 2019 Conservative voters, from
63% last month to 49% this month (among Labour voters, there has been little
change at 22% from 19%).
How favourable are the public towards the
parties and leading politicians?
How are the Conservatives delivering in
government?
Impact of leaving the EU
Commenting on the findings, Ipsos MORI Head
of Politics Gideon Skinner said: The optimistic national mood we saw in the
Spring is slipping away, and with it favourability towards Boris Johnson and
his party. Having said that, there is still little sign so far of Keir
Starmer and Labour pulling strongly ahead in the public’s affectations,
although they have at least arrested their own fall. (Ipsos MORI) 4 August 2021 702-43-06/Polls Almost Half (47%, Up From 39% Last Year) Believe Britain Will Be
Stronger When It Gets Through The Pandemic
As COVID-19 restrictions were about to be lifted, Britons had become
slightly more optimistic for the future than they were a year ago. However,
many concerns remain – particularly over the spread of another variant, and
the economy going into recession (although few prioritise economic concerns
over people’s health).
Reflecting this range of concerns, 4 in 10 (42%) say the Government
should continue to prioritise people’s health over the economic health by
having more restrictions if the virus continues to spread, while 15%
prioritise reducing restrictions to help the economy, and another 4 in 10
(38%, up from 32% in November) believing the two concerns should be given
equal weight. The pattern of opinion is broadly the same if people are
asked what happens if the virus continues to spread after all adults have
been offered a second dose of the vaccine. Comparing 5 potential effects of the virus on the country, Britons
are most likely to identify increased deaths as a direct result of catching
COVID-19 as the most serious (34%). A quarter (25%) view increased deaths due
to fewer healthcare resources to treat and identify medical conditions other
than the coronavirus as the most serious issue facing the country while 16% name
the effect the virus will have on the economy and jobs. Thirteen per cent say
the effect the virus will have on mental health issue is a key issue for the
country while 7% name the effect on children and education. Compared
with July last year, there has been a small increase placed in the emphasis
on indirect deaths due to healthcare resources being prioritised for
COVID-19, and on mental health issues, and slightly less emphasis given to
direct deaths and the economy. Gideon Skinner, Head of Political Research
at Ipsos MORI, said: Compared with where we were a year ago, and
with the success of the vaccine programme, Britons have become a bit more
hopeful that the country will be able to recover when it gets through the
pandemic. However, many people are still wary, particularly about the
chances of another variant leading to another wave of cases, although worries
about the economy are not far behind, so this optimism is fragile at best.” (Ipsos MORI) 6 August 2021 702-43-07/Polls One In Six Britons From Black, Asian And Minority Ethnic Communities
(17%) Know A Victim Of Knife Crime Closely Or Have Been One Themselves
The Mayor of London, Sadiq Khan, has warned that the lifting of
coronavirus restrictions is likely to lead to an
increase in knife crime. But the impact from rising knife crime will
likely be felt to a greater extent among Britain’s ethnic minority communities,
who YouGov data shows are disproportionally affected by it. One in six Britons from Black, Asian and minority ethnic communities
(17%) know a victim of knife crime closely or have been one themselves. This
is nearly twice the rate as among the wider population, at 9%. Among those
aged 25 to 49, the difference is more than two-fold, at 18% vs 8%. Among ethnic minority Britons, 6% say a family member has been a
victim of knife crime, while 8% say the same about a close friend and 4% have
experienced it themselves. In contrast, of all people in Britain, only 3% have a family member
who has been a knife crime victim, one in twenty (5%) have a close friend,
and 2% have experience of it first-hand. Young people from ethnic minorities aged 18-24 are the most likely to
know several victims, including themselves, when comparing across age and
with the general public. One in twenty (5%) say they have been a victim,
while respectively 11% and 9% say a family member and/or close friend has. In contrast, among all Britons aged 18 to 24, a statistical 0% say
they have been a victim, while 4% have a family member who has, and 9% a
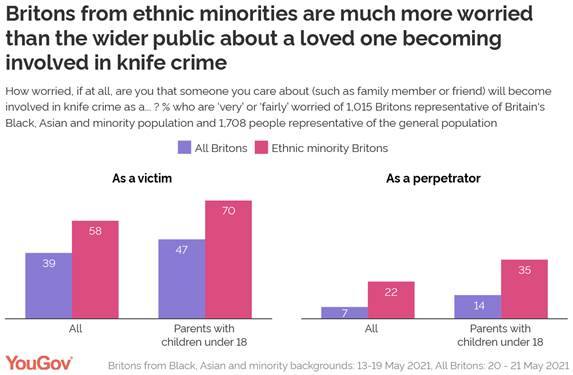
close friend. Ethnic minority parents are much more
worried about knife crime The impact of knife crime on ethnic minority communities is also
evident in how many Britons from such backgrounds, and those with children
under 18 in particular, worry about a loved one becoming involved. A majority of ethnic minority Britons (58%) are scared that someone
they care about will be a victim of knife crime, including three in ten (29%)
who are very worried. This is much higher than among the 39% in the wider
population, of whom 12% feel very anxious.
Parents from ethnic minority backgrounds with children under the age
of 18 are the most prone to worrying, with seven in ten (70%) fearing that a
loved one could become a victim of knife crime. This includes one in three
parents (34%) who are very scared of the prospect. In contrast, just under half of all parents
with children under 18 (47%) share the same fear, and only one in eight (13%)
are very worried. The public are generally much less anxious about someone they hold
dear becoming a perpetrator of knife crime, with only 7% of people worrying
about this. While the same is true for Britons from ethnic minorities, they
are still three times as likely to be concerned about it, at 22%. This
includes 10% who are very worried. The same disparity is clear among parents. One in three ethnic
minority parents with children under 18 (35%) are scared a loved one will
become a perpetrator of knife crime, including one in seven (17%) who are
deeply concerned. This is more than twice the rate as among all parents with a child
under the age of 18, of whom only 14% are concerned someone they care about
could commit knife crime, including 8% who are very worried. (YouGov UK) August 06, 2021 702-43-08/Polls 21% Of French People Say They Often Go To A Cultural Place Such As A
Museum Or A Foundation
Almost a third of French people say they go at least once a quarter
to a cultural place such as a museum or a foundation (32%). Contrary to
what many might think, 18-34 year olds are not the least inclined to visit
the museum. 21% say they often go to a cultural place such as a museum
or a foundation (vs. 9% of 55+). Note: 49% of French people aged 18 to 24
know that French national museums are free for them. Overall, French museums enjoy a good image among French people of all
generations. Indeed, 49% consider
that they are enriching and only 5% that they are boring. The Louvre and the Center Pompidou are
unbeatable The Louvre Museum
is the most famous museum (85%) and the most visited by the French
(61%). Note that the branches of the most visited museum in the world
(Louvre - Lens and Louvre - Abu Dhabi) remain much less known to the French
(the same goes for the Messina branch of the Center Pompidou). Nearly 4 in 10 French people have visited the Center Pompidou (43%) - a figure
that is on the rise by men (48% vs. 38% of women). Note, despite its
recent opening, nearly one in 10 French people say they know the Bourse de
Commerce - Pinault Collection.
Faced with the opening of major cultural venues by private actors,
such as the Bourse de Commerce, we notice that the French rather favor the
involvement of private figures: three
quarters of French people (75%) find that this is a good
thing, even if 33% of them believe that it should be more supervised in order
to prevent art from being privatized. Museums with strong local roots In general, museums have a stronger influence on the territory in
which they are located. Not only are the inhabitants of the region in
which a museum is located are more likely to say they know it and visit it,
but we also note that the French are attached to this territorial anchoring
of heritage: indeed, 59% of the French
believe that a museum must represent the city or territory in which it is
located . An even higher score among people who frequent
museums regularly (69%). What the French think of the sponsorship of
cultural places More than two-thirds of French people consider it relevant for a
brand to sponsor an exhibition or give its name to a cultural place
(69%). Still in connection with anchoring in the territory, 33% think
that this is relevant if this brand is a contributor to French or world
heritage. The vast majority of people who often visit museums or foundations
say that they pay attention to partners in permanent exhibitions or
collections (82%). Of these, 67% have a better image of partners in
cultural venues. (YouGov France) Source: https://fr.yougov.com/news/2021/08/02/musees-et-fondations/ 702-43-09/Polls The Vaccination Pass: A Subject Of Contention Between Relatives For
41% Of French People
The health pass and vaccination are sensitive subjects: 41% of
French people believe that having discussed with their relatives has caused
tensions or serious conflicts between them and 31% do not intend to
discuss these subjects in their entourage this summer. 60% say they are in favor of the health pass to access cafes,
restaurants, shopping centers, planes, trains, long-distance coaches and
medical establishments. They will a priori be tolerant if one of their
companions has neither a health pass nor a PCR test to access the places where
they will be requested: 73% say that they will not go either and will stay
with him, knowing that the situations are very different between having a
coffee or the train, which is less improvised! It is mid-September that we will check whether 2/3 of French people
will really give up an activity because someone around them does not have a
pass or PCR ; already, 21% do not hesitate to say that they
would go to the restaurant or elsewhere… without him, which promises
interesting exchanges between “friends” afterwards. (Ipsos France) 4 August 2021 Source: https://www.ipsos.com/fr-fr/le-passe-vaccinal-sujet-de-discorde-entre-proches-pour-41-des-francais NORTH
AMERICA
702-43-10/Polls About 58% Of Households Headed By Black Or African American Adults
Rent Their Homes
The nationwide
moratorium on evictions – put in place nearly 11 months ago by the
Centers for Disease Control and Prevention as an emergency measure – expired
this past weekend, although President
Joe Biden has proposed extending it. The end of the moratorium, which was
intended to protect tenants who couldn’t make their rent payments because of
the COVID-19
pandemic, has alarmed tenant advocates, housing experts and others who
fear that potentially millions of renters could
be put out of their homes. Renters headed about 36% of the nation’s 122.8 million households in
2019, the last year for which the Census Bureau has reliable
estimates. Because certain demographics – young people, racial and ethnic
minorities, and those with lower incomes – are more likely to rent, those
groups likely will be disproportionately affected when evictions resume. But setting policies to help
renters in need without hurting landlords is complicated. Landlords
aren’t a homogenous group of faceless corporations. In fact, fewer than
one-fifth of rental properties are owned by for-profit businesses of any
kind. Most rental properties – about seven-in-ten – are owned by individuals,
who typically own just one or two properties, according to 2018 census data.
And landlords have complained about being
unable to meet their obligations,
such as mortgage payments, property taxes and repair bills, because of a
falloff in rent payments. One big disparity among renters is race and ethnicity. Nationwide,
about 58% of households headed by Black or African American adults rent their
homes, as do nearly 52% of Hispanic- or Latino-led households, according to
Pew Research Center’s analysis
of census data. By contrast, roughly a quarter of households led by
non-Hispanic White adults (27.9%) are rentals, as are just under 40% of
Asian-led households.
White, non-Hispanic householders account for three-quarters of all owner-occupied housing units in
the United States, but just over half of all renter-occupied units. Younger people – those below the age of 35 – are far more likely to
rent than are other age groups: About two-thirds (65.9%) of this age group
lives in rentals. This compares with, for example, 42% of those ages 35 to
44, and less than a third (31.5%) of 45- to 54-year-olds. Though renter-occupied households are almost evenly split between
families (50.4%) and non-families (49.6%), people living alone account for
the biggest single group of renters (38.1%, or nearly four-in-ten). (The Census
Bureau defines a “family” as any group of two or more people related by
birth, marriage or adoption who live together.)
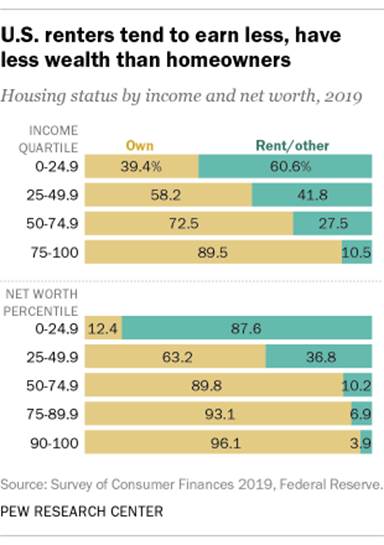
Renters skew to the lower ends of income
and wealth distributions, according to data from the Federal
Reserve’s 2019 Survey of Consumer
Finances. About three-fifths of people in the lowest income quartile
(60.6%) rent their homes, as do 87.6% of people with net worths below the
25th percentile. In both cases, as one goes up the income or net worth
distribution scale, the share of people who are renters falls: Only 10.5% of
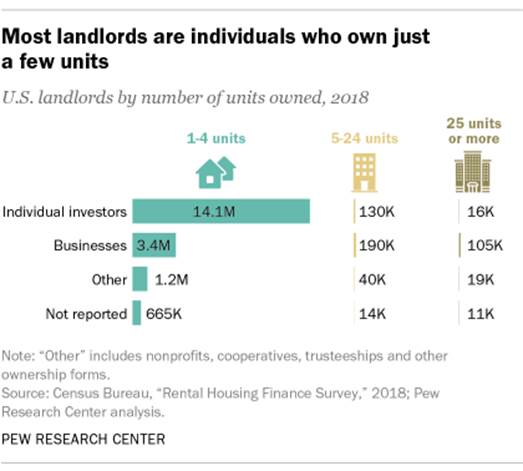
people in the top income quartile, for example, are renters. If those are the renters, then who are the landlords? The Census
Bureau counted nearly 20 million rental properties, with 48.2 million
individual units, in its 2018 Rental Housing Finance Survey, the most recent
one conducted. Individual investors owned nearly 14.3 million of those
properties (71.6%), comprising almost 19.9 million units (41.2%). For-profit
businesses of various sorts owned 3.7 million properties, or 18.8%, but their
holdings totaled 21.7 million units, or 45% of the total. Entities such as
housing cooperative organizations and nonprofits owned smaller shares of the
total.
Businesses own larger shares of units because individuals, while far
more numerous, tend to own one or two properties at most, while businesses’
holdings are larger. In fact, 72.5% of single-unit rental properties are
owned by individuals, while 69.5% of properties with 25 or more units are
owned by for-profit businesses. Most rental properties are owned by individuals, but only a small
share of individuals own rental property, according to IRS
income-tax data. In 2018, 6.7% of individual tax filers (about 10.3
million) reported owning rental properties. Those filers reported owning 1.72
properties on average. There was a notable increase in both the number and share of
individual filers reporting rental property during and after the 2007-08
mortgage crisis. In 2006, 8.3 million tax returns (6%) reported ownership of
rental property. By 2014, that number had risen to nearly 10.7 million
(7.2%). One researcher at the Department of Housing and Urban Development
(HUD) has suggested that those figures reflect a surge of individuals buying
foreclosed homes on the cheap and renting them out. Tax data on businesses that own rental property is harder to come by.
However, that same HUD researcher has estimated that there are fewer than 1
million “business entity” landlords, adding that they “likely own an average
of more than 20 units, with many managing hundreds of units.” Individual landlords received $353.7 billion in rental income in
2018, which sounds like (and is) a lot of money. But as any businessperson
knows, top-line revenue doesn’t necessarily lead to bottom-line profit.
Indeed, only about half of individual landlords reported net income in 2018, with the rest
losing money on their properties. Such losses can, under certain conditions,
be used to offset other taxable income. Regardless of whether the landlord is making money, rent makes up a
big chunk of many tenants’ expenses. Of the nearly 44.1 million renter households
in 2019, more than 45% paid rent equal to 30% or more of their gross
household income (30% being a common
rule of thumb for how much of a person’s gross income should be
spent on housing). That’s actually down from 2013, when nearly half (49.7%)
of renter households were paying 30% or more in rent. (PEW) AUGUST 2, 2021 702-43-11/Polls Women Represent Attendees At 21% Of Mosques In US By 2020, Which Was 14%
In 2011
Women continue to be less involved than men in mosque life in the
United States, but the pattern appears to be changing, according to a recent
survey of American houses of worship. The share of mosques in which adult women account for more than a
quarter of all attendees at the Friday Jumah prayer service grew between 2011
and 2020, according to the new study,
conducted by Ihsan Bagby,
an associate professor of Islamic studies, as part of the 2020 Faith Communities Today
(FACT) study. Women represented more than a quarter of attendees at
just 14% of U.S. mosques in 2011, a share that rose to 21% of mosques by
2020. Despite the increase, men continue to account for the vast majority
of attendees at Friday prayer services at most U.S. mosques. Men make up the
majority of Jumah prayer attendees in 94% of mosques, and there were no
mosques in which men make up fewer than three-in-ten attendees at Friday
prayer. The survey also found that while 44% of mosques have no children at
the Friday prayer service (which typically happens during the school day), children
were present in 55% of mosques. The relatively small share of women among Friday mosque congregants
aligns with results from previous Pew Research Center surveys
of Muslim American adults. The Center’s most recent study, conducted in
2017, found that Muslim women were less likely than men to attend religious
services at a mosque each week (37% vs. 48%), and less likely to say they
were satisfied with the quality of mosques where they live (67% vs. 78%) –
despite being no less likely to pray all five daily prayers (45% vs. 39%). At least in part, this may reflect a traditional understanding among
many Muslims that attendance at the Friday services is required of men but
not women. Indeed, around the world, Muslim men are often much
more likely than Muslim women to say they regularly attend mosque,
even though there is no such gender gap when it comes to frequency
of prayer or the self-described importance
of religion in Muslims’ lives in most countries surveyed.
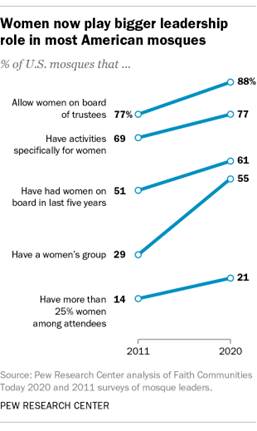
Though women make up a relatively small share of the attendees at
Friday prayer services, the new FACT study found that most U.S. mosques (55%)
have a dedicated women’s group, and roughly three-quarters (77%) have
activities or programs specifically for women. On both of these measures,
mosques’ efforts have grown since 2011. At that point, only 29% of mosques
had a women’s group, and seven-in-ten (69%) had activities or programs
specifically for women. Women also have been gaining more representation on mosque boards.
About nine-in-ten U.S. mosques (88%) allow women on their board of trustees
(or a similar administrative body), and 61% say that women have served on the
board at some point in the last five years. By comparison, a decade ago about
three-quarters of mosques (77%) allowed women to serve on their board of
directors, and only about half (51%) said that women had served in the last
five years. (PEW) AUGUST 4, 2021 Source: https://www.pewresearch.org/fact-tank/2021/08/04/women-are-becoming-more-involved-in-u-s-mosques/ 702-43-12/Polls 30% Of American Adults Say They Own A Gun, While Another 11% Say
Another Member Of Their Household Does
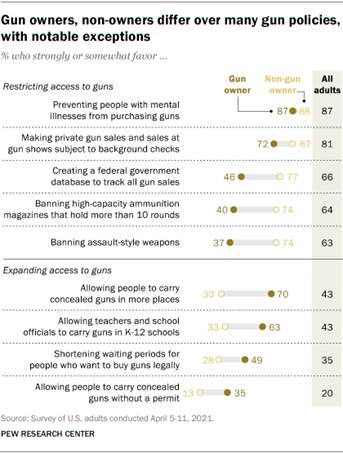
Gun owners in the United States have long favored more permissive gun
policies while adults who do not own guns have tended to favor more
restrictive policies. This pattern continues today. For example, 37% of gun
owners favor banning assault-style weapons, compared with twice as many (74%)
non-gun owners – and this gap has grown in recent years, according to a new
analysis of Pew Research Center surveys conducted in April and June 2021. How we did this Yet these differences in opinion between gun owners and non-owners do
not apply to all gun policies. Gun owners are roughly as likely as non-owners
to support preventing people with mental illnesses from obtaining guns. And
sizable majorities of adults who own guns and those who do not both favor
background checks for private gun sales and sales at gun shows.
Non-owners are 31 percentage points more likely than gun owners to
say they favor creating a federal database to track all gun sales (77% vs.
46%), and there are similar sized gaps in opinion over banning high-capacity
magazines and banning assault-style weapons, according to the analysis, which
is based on an April
2021 survey on Americans’ attitudes about gun policy and a June 2021
survey on gun ownership. The June 2021 survey, which was conducted June 14-27 among 10,606
adults, finds that 30% of adults say they own a gun, while another 11% say
they personally do not own a gun but another member of their household
does. Self-reported
gun ownership has changed little in recent years. Majorities of gun owners say they favor allowing concealed carry in
more places and allowing teachers to carry guns in K-12 schools, but only
about a third of non-owners support these policies. While gun owners are
split over shortening waiting periods for those who legally want to buy guns
(49% favor, 51% oppose), just 28% of non-owners support this. Most Americans
– regardless of whether or not they own guns – oppose concealed carry without
a permit, but gun owners (35%) are more likely than non-owners (13%) to
support this. Views on gun policies linked to both gun
ownership and partisanship While gun ownership is associated with views on gun policies,
the sizable
partisan differences in these policy attitudes are reflected among
owners and non-owners as well. In general, Republican gun owners are less
likely than GOP non-owners – and both Democratic owners and non-owners – to
favor policies that restrict access to guns. Democratic non-owners are more
likely than others to favor restrictions.
Gun owners and non-owners within each party differ on their views on
gun policies. However, these differences are more pronounced among Republicans
and Republican-leaning independents than they are among Democrats and
Democratic leaners. (Note: Republicans
are about twice as likely as Democrats to say they own a gun.) Among Republicans, a 57% majority of those who don’t own a gun say
they favor creating a federal government database to track all gun sales. By
comparison, three-in-ten Republican gun owners say the same. There is a
similar-sized gap among Republicans who own guns and those who do not on
banning assault-style weapons and high-capacity magazines. On proposals to expand access to guns, Republicans who own guns are
much more likely to support these proposals than are non-owners. For example,
an overwhelming majority of Republican gun owners (87%) say they favor
allowing people to carry concealed guns in more places, while a smaller
majority of those who don’t own a gun (57%) say the same. There are modest differences among Democrats on gun policies by gun
ownership. For instance, while majorities of Democratic gun owners and
non-owners both favor banning assault-style weapons and banning high-capacity
magazines, Democratic gun owners are about 20 percentage points less likely
to say this. Democrats who own guns (39%) also are more likely than those who
do not (16%) to say people should be allowed to carry concealed guns in more
places. While there has been a modest decline in support for an assault
weapons ban among the public overall, much of this change is attributable to
declining support for the policy among Republican gun owners and non-owners
alike. Among Republican gun owners, there has been a 15 percentage point
decrease in support for banning assault-style weapons since 2017 (down from
38% to 23% today). There has been a similar 16-point decrease among
Republicans who don’t own a gun on this proposal.
Democrats – both owners and non-owners – are about as likely as they
were in 2017 to say they favor banning assault-style weapons. While Republican gun owners and non-owners are both more likely to
say they favor shorter waiting periods for people who want to buy guns
legally today than they were in 2018, current opinions are similar to views
in 2017. By contrast, support for shorter waiting periods has declined among
Democratic gun owners. In 2017, 41% of Democrats who owned a gun said they
favored this policy. Today, about a quarter (24%) say this. Just 20% of
Democrats who don’t own guns favor shorter waiting periods, which has
remained virtually unchanged over the last few years. Gun ownership more common among men, rural
and White adults Four-in-ten U.S. adults report that there is a gun in their household:
Three-in-ten say they personally own a gun, while 11% say that they don’t own
a gun, but someone else in their household does. Gun ownership varies across demographic groups. About four-in-ten men
say they personally own a gun, compared with 22% of women.
While 36% of White adults say they personally own a gun, smaller
shares of Black (24%), Hispanic (18%) and Asian (10%) adults report owning a
gun. Adults under 30 are less likely to own a gun than those in older age
groups: 18% of 18- to 29-year-olds own a gun, compared with a third of those
ages 30 and older. Americans who live in the Northeast are the least likely to say they
own a gun, with 20% saying this. Americans who live in the South (35%),
Midwest (31%) and the West (28%) are more likely to report owning a gun. Gun ownership also widely varies by community type, with those who
live in rural areas much more likely to say they own a gun. Overall, 41% of
Americans who live in rural areas own a gun, compared with 29% of those in
suburban areas and 20% of Americans who live in urban areas. There are clear partisan divides when it comes to gun ownership: 54%
of Republicans and Republican-leaning independents either personally own a
gun (44%) or live in a house where someone else owns one (10%). By comparison,
about three-in-ten (31%) Democrats and Democratic-leaning independents live
in a household with a gun, with 20% reporting personally owning a gun. While there are ideological differences on gun ownership in both
parties, they are wider among Republicans. Nearly half of conservative
Republicans say they own a gun (49%), while 34% of moderate and liberal
Republicans say they do. Conservative and moderate Democrats are slightly
more likely than liberal Democrats to say they own a gun (22% vs. 17%). (PEW) AUGUST 4, 2021 702-43-13/Polls Most Black Americans, 58%, Do Not Have A Preference Between The Terms
"Black" And "African American" As A Term They Would
Rather People Use To Describe Their Racial Group
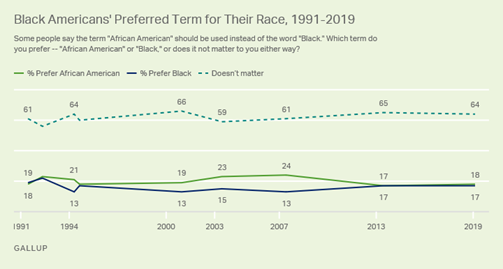
WASHINGTON, D.C. -- Most Black Americans, 58%, do not have a
preference between the terms "Black" and "African
American" when asked which term they would rather people use to describe
their racial group. The one in three who express a preference divide evenly
between preferring each term. Black Americans' Preferred Term for Their Racial Subgroup The terms "Black" and "African American" are both
used to refer to this racial subgroup of Americans. Which term do you think
should generally be used -- Black, African American, another term, or does it
not matter to you either way?
These findings from a June 1-July 5 Gallup poll are similar to Gallup's
prior tracking of Black Americans' preferred terms using a
differently worded question asked from 1991 to 2019. The new wording makes it
clear that the question is asking what the group should be called -- not how
the respondent prefers to be referred to, themselves. The earlier surveys
also found majorities saying it didn't matter to them which term was used,
and usually, no clear preferred term was identified among those who did have
a preference. Although the term "African American" was used as early as
1782, it was popularized in the late 1980s by a group of Black leaders,
including Rev. Jesse Jackson, who argued that this term had "cultural
integrity." But like Gallup's findings today, the Black public mostly
had no preference between the two terms in the early 1990s and the following
decades, while similarly sized minorities preferred one over the other.
Line graph. Black Americans' preferred term for their race, from 1991
through 2019. In 2019, 64% of Black Americans did not have a preference
between "Black" and "African American," while 18% favored
"African American" and 17% preferred "Black." Style guides of the Associated Press and the National Association of
Black Journalists say that both "Black" and "African
American" are acceptable terms -- but not necessarily interchangeable
ones -- and advise reporters use the preferred terms of their subjects. Societally accepted terms do change over time. Gallup found in
1969 that "negroes" was the most popular term among Black Americans at
the time, while "colored people" and "Blacks" were about
equally as preferred, each by about one in five, and
"Afro-Americans" were favored by one in 10. Gallup primarily used the term "negro" in early decades of
polling, including its very
first question about Black people in 1939, though the term
"colored people" was used as well. Both terms were retired by the
company in the early 1970s, when "Black" became a staple term
Gallup used to poll about Black Americans thereon. If They Had to Choose, Most Black Adults
Would Choose "Black" In the current survey, for the first time, Gallup asked a follow-up
question of Black respondents who did not have a preference whether they lean
toward one term over the other if they had to choose. Black Americans were fairly mixed on the question, with a slight
preference for "Black" (52%) over "African American"
(44%). Four percent had no opinion either way. Black Americans' Preferred Term for Their Racial Subgroup, if They
Had to Choose If you had to choose, which term do you lean toward --
"African-American" or "Black"?
Most Hispanic Adults Have No Preference on
Subgroup Label Hispanic respondents were asked a similar question about their preference
among the terms "Hispanic," "Latino" and
"Latinx" -- with this final option being a newer, gender-neutral
term favored by some Hispanic Americans. Most Hispanic adults (57%) say it does not matter to them which term
is used, though nearly one in four (23%) prefer "Hispanic" and 15%
prefer "Latino." Few expressed a preference for "Latinx"
(4%). Hispanic Americans' Preferred Term for Their Ethnic Subgroup The terms "Hispanic," "Latino," and
"Latinx" are used to refer to this ethnic subgroup of Americans.
Which term do you think should generally be used -- Hispanic, Latino, LatinX,
another term, or does it not matter to you either way?
These findings are fairly consistent with a differently
worded question Gallup polled among Hispanic Americans in 2013 that
also found that most said the term used did not matter, though
"Hispanic" was slightly preferred over "Latino." "Hispanic" the Most Preferred
Term by Hispanic Adults When Asked to Choose In the follow-up question in which Hispanic respondents were asked
which term they lean toward, most prefer "Hispanic" (57%), while
more than a third choose "Latino" (37%). Five percent prefer
"Latinx." Hispanic Americans' Preferred Term for Their Ethnic Subgroup, if They
Had to Choose If you had to choose, which term do you lean toward -- Hispanic,
Latino or Latinx?
Bottom Line American language and terminology evolve, as do the terms certain
groups use to refer to themselves. As for the terms "Black" and "African American,"
however, both terms have been accepted by most Black Americans for at least
three decades -- though sizable and roughly equal, minorities of Black adults
have had a preference for one of the terms in particular. Today, when they
must choose one, "Black" enjoys a slight preference, though many
opt for "African American" as well. Most Hispanic Americans, too, are content with the use of multiple
terms to describe their subgroup. Most favor "Hispanic," though
many prefer "Latino," while few have adopted "Latinx" as
their preferred term. Gallup's historical polls illustrate the extent to
which preferences can change over time, however, and future updates will tell
if this new, lesser-used term is on the rise -- and also if even newer labels
have emerged to rival it. (Gallup) AUGUST 4, 2021 Source: https://news.gallup.com/poll/353000/no-preferred-racial-term-among-black-hispanic-adults.aspx AUSTRALIA
702-43-14/Polls Inflation Expectations increase to 4.1% in July, highest for nearly 2
years since Oct 2019
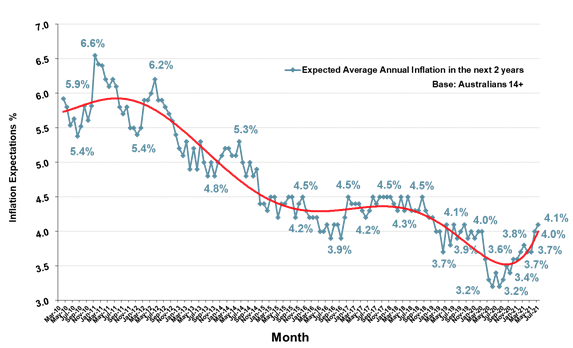
In July 2021 Australians expected inflation of 4.1% annually over the
next two years, up 0.1% and the highest Inflation Expectations for nearly two
years since October 2019. Inflation Expectations are now up 0.9% points since
the pandemic low of 3.2% a year ago in August 2020. Inflation Expectations are still 0.6% points below their long-term
average of 4.7% but are now 0.6% points higher than the 2020 monthly average
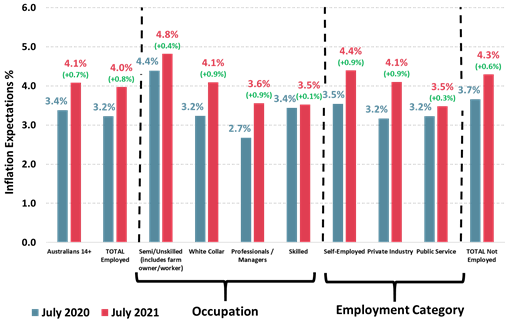
of 3.5% and 0.7% points higher than a year ago in July 2020 (3.4%). A look at Inflation Expectations by occupation and employment
category compared to a year ago shows increases across the board. Inflation
Expectations for employed Australians increased by 0.8% points to 4.0% but
still trail those of Australians who are not employed at 4.3%, an increase of
0.6% points from July 2020. Private industry workers have much higher
Inflation Expectations than workers in the public service Self-Employed Australians now have the highest Inflation Expectations
of any employment category at 4.4% in July, up a large 0.9% points since July
2020 while there has been a similar increase for Australians employed in
private industry with Inflation Expectations of 4.1%, up 0.9% points.
However, those in the public service have a different view and their
Inflation Expectations have only increased 0.3% points to 3.5%. For occupation types it is Semi/Unskilled workers who again have the
highest Inflation Expectations at 4.8%, up 0.4% points from a year ago while
the lowest is held by Skilled workers at 3.5% (up 0.1% points) and
Professionals/Managers at 3.6% (up 0.9% points). Inflation Expectations by Occupation &
Employment Category: July 2020 cf. July 2021
Inflation Expectations are now highest in
Queensland and Tasmania and again lowest in SA On a State-based level Inflation Expectations are slightly higher
than the national average and now highest in Queensland and Tasmania at 4.2%
in July. Inflation Expectations are in-line with the national average in both
NSW and Western Australia at 4.1% in July. These are the highest Inflation
Expectations for folks in Western Australia for exactly two years since July
2019. Slightly below the national average are South Australia and Victoria
which have Inflation Expectations of 4% in July. Despite being lower than
most other States this is the highest Inflation Expectations have been in
Victoria for nearly two years since October 2019. The ANZ-Roy
Morgan Consumer Confidence Rating for July was at 108.6, an increase of
17.8pts (+19.6%) from July 2020 a year ago. The figure for the month
of July is higher than the current figure for the first week of August which
is at 101.8 after the extension of Sydney’s month-long lockdown and recent
lockdowns of at least a week in Melbourne, Adelaide, and now Brisbane. Inflation Expectations Index long-term
trend – Expected Annual Inflation in next 2 years
See below for a comprehensive list of RBA interest rate changes
during the time-period charted above. “Inflation Expectations increased by 0.1%
points to 4.1% in July and are up 0.9% points from the low-point reached in
August 2020 (3.2%) during Victoria’s second wave of COVID-19. Inflation
Expectations are now 0.6% points above the yearly average of 3.5% for 2020
and have been driven higher by increases across a diverse range of employment
categories over the last year. “One of the biggest differences to emerge
is the diverging view on Inflation between those who work in the public
service and those working in private industry or self-employed. “The Inflation Expectations of the
self-employed have increased by 0.9% points over the last year to now be at
4.4% - well above the national average of all Australians. There has been a
similar trend for those working in private industry who now have Inflation
Expectations of 4.1% - an increase of 0.9% points from a year ago. “These big increases in Inflation
Expectations have been larger than that for the population at large and this
is explained when one considers those working in the public service. For
public servants Inflation Expectations have only increased by 0.3% points to
3.5% - well below those of average Australians. “These figures give an indication about who
is feeling the rise in prices most keenly and it is those working in private
sector jobs who are most at risk from repeated lockdowns and border closures
that disrupt their ability to conduct their business. “Since mid-May there have now been eight
lockdowns around Australia including two lockdowns in Melbourne and Brisbane,
short lockdowns in Perth, Darwin and South Australia, and an extended
lockdown of over a month in Greater Sydney. “Unfortunately for private industry these
lockdowns are set to remain an ever-present possibility over the next few
months as Australia’s vaccine rollout continues. The latest figures from
the Department of Health show about 12.5 million
vaccine doses have been administered in Australia covering just over 40% of
Australians aged 16+.”
The Roy Morgan Consumer Confidence Report –
Including Inflation Expectations To learn more about the trends for Inflation Expectations as well as
Consumer Confidence for different segments and demographics throughout the
Australian community, purchase the Roy
Morgan Consumer Confidence Monthly Report. The questions used to calculate the Monthly
Roy Morgan Inflation Expectations Index. 1) Prices: “During the next 2 years, do you think that
prices in general will go up, or go down, or stay where they are now?”
The Roy Morgan Inflation Expectations Index is a forward looking
indicator unlike the Consumer Price Index (CPI) and is based on continuous
(weekly) measurement, and monthly reporting. The Roy Morgan Inflation
Expectations Index is current and relevant.
RBA interest rates changes during the time
period measured: 2010-2020. (Roy Morgan) August 03 2021 Source: https://www.roymorgan.com/findings/8761-australian-inflation-expectations-july-2021-202108030239 702-43-15/Polls Australian Employment Dropped By 176,000 In July As All Five Mainland
States Experienced Lockdowns
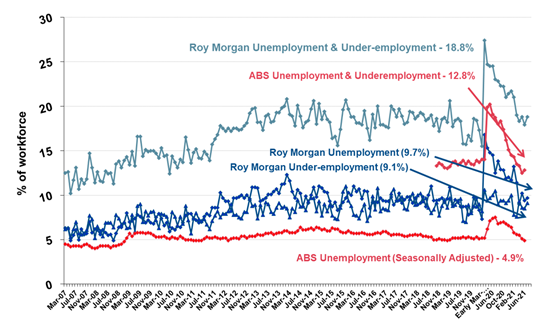
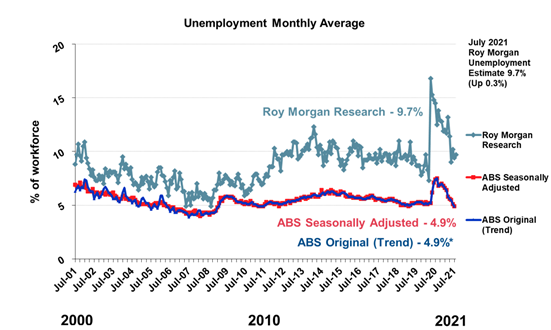
Latest Roy Morgan employment series data shows 1.42 million
Australians were unemployed in July, up 28,000 on June, for an unemployment
rate of 9.7% (up 0.3% points), while 1.33 million, up 77,000 on June, were
under-employed, an under-employment rate of 9.1% (up 0.6% points).
Roy Morgan Unemployment &
Under-employment (2019-2021)
Source: Roy Morgan Single Source January 2019 – July 2021.
Average monthly interviews 5,000. Roy Morgan’s unemployment figure of 9.7%
for July is nearly 5% points higher than the current ABS estimate for June 2021 of 4.9%.
However, the ABS figure for June counts as employed an additional 157,000
Australians who were working zero hours for ‘economic reasons’. If these
non-workers are added back the ABS unemployment estimate for June increases
to 836,000 (6.0%). The ABS also claims there are nearly 1.1 million
Australians (7.9%) under-employed for a total of over 1.93 million unemployed
or under-employed (14.0% of the workforce).
In addition to those who were unemployed, 1.33 million Australians
(9.1% of the workforce) were under-employed – working part-time but looking
for more work, an increase of 77,000 (up 0.6% points) from June.
“The latest Roy Morgan employment estimates
for July show unemployment up 0.3% points to 9.7% and under-employment up
0.6% points to 9.1%. This means a total of 2.76 million Australians (18.8% of
the workforce) were either unemployed or under-employed in July, the highest
monthly figure since February 2021 (3.07 million, 21.0% of the workforce). “The increases in both unemployment and
under-employment in July are not surprising when one considers the number of
lockdowns around Australia over the last few months. There have been three
lockdowns of Victoria, two lockdowns in Queensland, a lockdown of South
Australia, a lockdown of Greater Perth, a lockdown of Darwin and an extended
lockdown in Greater Sydney which began in late June and is set to continue
until at least the end of August. “The multiple lockdowns are especially
detrimental to travel and tourism industries and for those in the retail and
hospitality sectors. Already Qantas has stood down 2,500 staff as hundreds of
flights are cancelled due to the lockdowns and State border closures and the
damage to the retail and hospitality sectors continues with trade disrupted
and stores forced to close again. “The renewed lockdowns in SE Queensland and
Victoria, as well as the extended Greater Sydney lockdown, will cause more
economic damage and higher unemployment and under-employment in August with
more than half of the population now in lockdown. The contagiousness of the
‘Delta variant’ means these lockdowns could continue throughout August and
beyond. “Nevertheless, the increasing support
provided by Federal and State Governments to businesses and employees forced
to deal with the lockdowns and border closures is having an impact. The July
2021 unemployment estimate of 9.7% is well down from July 2020 (12.5%) and
during the remainder of 2020 unemployment only dipped below 12% once – after
Victoria’s long second lockdown ended. “Of course, the key to ending the lockdowns
is a high enough vaccination coverage of the population to prevent the spread
of COVID-19 getting out of control. The latest projections show Australia is
not likely to reach the target of at least 70% of adults fully vaccinated
until around the end of the year. “The latest Health Department figures show 13 million vaccine
doses have been administered to 42% of Australians aged 16+. To reach the threshold of 70% fully vaccinated
approximately 29 million vaccine doses need to be administered. Australia is
still around 16 million vaccine doses short of this mark and at the rate of 1
million vaccine doses a week will reach this level in early December. “Until then, the next four months are set
to be an unpredictable period for businesses with the chance of snap
lockdowns ever-present. Just this week there has been a new outbreak of cases
in Victoria and the State has been plunged into an unprecedented sixth lockdown. “As lockdowns are now the preferred policy
response of both the Federal & State Governments to deal with the highly
contagious Delta variant it is imperative that both levels of Government are
on the front foot to offer businesses impacted by these lockdowns all the
support they require. “Australia’s largely successful management
of the COVID-19 pandemic has been one of the best in the world over the last
18 months and there is no point letting all the good work we’ve undertaken so
far be undone by decisions made in the final months of the vaccination push.” This Roy Morgan survey on Australia’s unemployment and ‘under-employed’* is based on weekly interviews of
770,676 Australians aged 14 and over between January 2007 and July 2021 and
includes 5,992 telephone and online interviews in July 2021. *The ‘under-employed’ are those people who are in
part-time work or freelancers who are looking for more work. Contact Roy Morgan to learn more about Australia’s unemployed and under-employed;
who and where they are, and the challenges they face as they search for
employment opportunities. Visit the Roy Morgan Online Store to purchase employment profiles,
including for Australians who are employed, unemployed, under-employed, employed
part-time, employed
full-time, retired, studying and
many more. Roy Morgan Unemployed and ‘Under-employed’*
Estimates
*Workforce
includes those employed and those looking for work – the unemployed. Roy Morgan Research cf. ABS Unemployment Estimates
Roy Morgan Research cf. ABS Unemployment
Estimates
(Roy Morgan) August 06 2021 Source: https://www.roymorgan.com/findings/8762-australian-unemployment-estimates-july-2021-202108060502 MULTICOUNTRY
STUDIES
702-43-16/Polls Seven In Ten Britons Believe “All Banks Are Basically The Same”,
Compared To Just Over Half Of Americans (53%)
Data from YouGov Profiles allows us to look at how consumers perceive
banks in markets all over the world. Zeroing in on four major financial
centres – Great Britain, the US, the United Arab Emirates, and Switzerland –
reveals a range of different attitudes. Seven in ten Britons, for example, believe “all banks are basically
the same”, compared to just over half of Americans (53%), nearly half of
Emiratis (48%), and three in ten Swiss consumers (29%). While each of these
countries boasts a major financial services hub for its respective region, in
Switzerland – where the banking sector is tied up with national identity –
they may seem less homogenous than they do elsewhere. In Britain, then,
financial services companies may need to do more to differentiate themselves
from the competition. But if Swiss customers don’t think all banks are the same, this may
not necessarily be to the banks’ advantage. Among all four markets, they are
the most likely to be suspicious of these organisations: just three in ten
(29%) say banks and financial services providers can be trusted compared to
over half of Americans (54%) and Britons (51%), and nearly as many Emirati
customers (48%). Swiss consumers are also most likely to say that banks try
to trick people out of their money (49%) compared to just a third (34%) of
Britons. It seems likely that major banking scandals such as SwissLeaks –
most recently including reputational damage to institutions such as Credit
Suisse from the Greensill and Archegos affairs – could be having an effect on
popular perceptions of an important industry. (YouGov UK) August 02, 2021 Source: https://yougov.co.uk/topics/consumer/articles-reports/2021/08/02/perceptions-banking-four-major-hubs 702-43-17/Polls Global views on sports: 58% globally would like to practice more
A new Global Advisor study reveals that people from the Netherlands
are the most physically active of 29 nations. On average they report spending
12.8 hours a week (almost two hours per day) doing physical exercise or team
sports, double the average of 6.1 across 29 markets. People from Germany and
Romania are the next most active, carrying out 11.1 and 11 hours of exercise
per week respectively. Most commonly practiced sports The five most frequently practiced team sports and activities across
the 29 markets in a normal week are fitness
(20%), running (19%), cycling (13%), soccer (10%) and swimming (9%). However,
the largest proportion say they do no team sport (38%).
Barriers to further participation Almost six in ten citizens across the 29
markets say they would like to play more sports than they currently do (58%).
The top three nations where people are most likely to say they would like to
play more sport than they currently do are all in Latin America – Peru (81%),
Chile (79%) and Colombia (78%). Americans are least likely to say they would
like to play more sports than they currently do (35%), while more than six in
ten say they are happy with the amount of sport they currently play (62%).
(Ipsos Canada) 3 August 2021 Source: https://www.ipsos.com/en-ca/news-polls/global-views-to-sports-2021 702-43-18/Polls The Dutch Are The Most Physically Active Nation (Exercising 12.8
Hours Per Week) , The Brazilians Are The Least
A new global Ipsos study reveals that people from the Netherlands are
the most physically active of 29 nations. On average they report spending
12.8 hours a week (almost two hours per day) doing physical exercise or team
sports, double the average of 6.1 across 29 markets. People from Germany and
Romania are the next most active, carrying out 11.1 and 11 hours of exercise
per week respectively. At the other end of the scale, Brazilians are the least physically
active, spending three hours per week doing physical exercise on average (26
minutes per day). Four other countries report doing less than four hours of
physical exercise on average per week – France (3.7), Chile (3.7), Italy
(3.6) and Japan (3.3). One third of Japanese citizens report doing no exercise at all in an
average week (34%), more than double the average across 29 countries (14%).
Three in ten Brazilians (31%) and a quarter of Poles and Italians (both 26%)
also report doing no exercise at all. Among those from the Netherlands just
four per cent say they do no exercise at all in a week. Most commonly practiced sports The five most frequently practiced team sports and activities across
the 29 markets in a normal week are fitness (20%), running (19%), cycling
(13%), soccer (10%) and swimming (9%). However, the largest proportion say
they do no team sport (38%).
Barriers to further participation Almost six in ten citizens across the 29 markets say they would like
to play more sports than they currently do (58%). The top three nations where
people are most likely to say they would like to play more sport than they
currently do are all in Latin America – Peru (81%), Chile (79%) and Colombia
(78%). Americans are least likely to say they would like to play more sports
than they currently do (35%), while more than six in ten say they are happy
with the amount of sport they currently play (62%). The biggest obstacle to further participation across all counties is
a lack of time: 37% say this is a barrier. The next biggest barriers are a
lack of money (cited by 18%) and the weather being too hot or too cold (17%).
Just over one in five say there are no barriers to their participation in sport
(22%).
(Ipsos MORI) 3 August 2021 Source: https://www.ipsos.com/ipsos-mori/en-uk/dutch-are-most-physically-active-nation-brazilians-are-least 702-43-19/Polls Spain (89%) Is The European Country, And The Sixth In The World, That
Is Most In Favor Of Including This Measure In Products
In an increasingly globalized environment, companies carry out the
production of their products using the best materials, with the aim of
guaranteeing quality and meeting consumer demand. However, many
companies use natural resources such as trees or water. Resources widely
used throughout history, but in addition to being limited, right now they are
already classified as scarce. This has led the market to adopt new
measures that promote sustainability and the responsible use of natural
resources, such as eco-labeling of products, in order to minimize the
environmental impacts generated by production with these raw materials. To better understand the relationship of citizens with the production
methodology of companies, Ipsos, together with the World Economic Forum, has
prepared a study in 28 countries to find out the perceptions of new measures
in this regard, such as taxation and labeling of products that use scarce
natural resources. Globally, on average, 71% of citizens agree that companies have to
pay a tax for using scarce natural resources, even if this means that
consumers have to pay more for products. This percentage is in line with
Spain (72%), which ranks as the second European country where this idea is
most supported, just behind Italy (73%). After Spain we find Belgium
(70%), the United Kingdom (69%) and the Netherlands (67%). The greatest support for this tax is registered in emerging countries
such as China (85%), India (84%) or Colombia (84%), unlike in countries such
as the United States (60%), Poland (50%) and Japan (47%), who are the least
supportive of this idea. New labeling on the use of scarce natural
resources When asking respondents if they would agree to add information labels
to those products that use scarce natural resources, globally, on average,
there is broad consensus, since 85% of citizens are in favor of implementing
this idea. Support is even higher in Spain (89%), being the first
European country, and the sixth worldwide, which is most in favor of
including these labels. Behind the Spanish population is Hungary (89%),
Sweden (84%) and France (83%). For its part, Germany (73%) is the
European country that most rejects the use of this measure.
According to Antonio Hernando,
Director of Clients of Ipsos in Spain , “the data from this survey show that clients
increasingly demand greater transparency from companies in all areas, but
especially with regard to the manufacture of their products. Consumers
pay more attention to labeling, they are informed about what they buy to make
sure they make sustainable decisions, thus responding to their need to be
respectful with the environment, a trend that already existed before the pandemic
but that in recent months we have seen that it has increased. Companies
must respond to this demand and offer the information and transparency that
their clients are demanding, only in this way will their future be guaranteed
”. (Ipsos Spain) 4 August 2021 702-43-20/Polls Only 7% Citizens Believe Their Country's Economy Has Already
Recovered
New York, NY, August 5, 2021 —
A new Ipsos survey for the World Economic Forum finds that, on average, about
three in four adults across 29 countries believe it will take at least two
more years for their country's economy to recover from the COVID-19 pandemic.
Only seven percent believe their country's economy has already recovered from
the pandemic and 19% that it will have recovered one year from now. Optimism
is most prevalent in China where 56% think their economy has already
recovered and most scarce in Russia where 66% say recovery will take more
than three years.
How long until the economy recovers from
the pandemic In the 29-country survey, Ipsos asked the global public whether their
local economy had already recovered from the pandemic or how long they
thought it would take for it to do so.
Who to trust to lead economic recovery When asked which group or institution they trust most to take primary
responsibility for recovering the economy in their countries, citizens tend
to cite their country’s government ahead of other options: on average, across
the 29 countries, it is mentioned of 53% of those surveyed, including 34% for
whom it is the first answer. Large/multinational businesses are mentioned
nearly as often overall (by 52%), but not as often as a first answer (17%). Expectations about the various entities to
drive the economic recovery vary widely across countries.
In general, high expectations from the government to lead the
recovery tend to align with high expectations from large/multi-national
businesses and with lower expectations from both consumers and small
businesses. Conversely, lower expectations from government and big businesses
align with higher expectations from both consumers and small businesses. Signs of economic recovery Survey respondents were presented with nine occurrences and asked,
for each occurrence, to what extent they would view it as an indicator of
recovery of their local economy. Those most widely seen as a sign the local
economy has at least partly recovered are people getting called back to work
or getting new jobs (global country average of 79%), new businesses opening
(78%), and more tourists (72%).
(Ipsos Egypt) 5 August 2021 Source: https://www.ipsos.com/en-eg/local-economic-recovery-wef-ipsos-global-advisor-survey 702-43-21/Polls Globally, on average, 70% of citizens are very or quite satisfied
with the lifestyle they lead
Physical exercise is associated with multiple benefits on our health
and helps us lead a healthy and balanced lifestyle. Whether in a gym,
hiking in the mountains or swimming in the pool, the arrival of summer and
holidays encourage sport to be a good leisure option to beat the heat and
stay in shape. To better understand the relationship of
citizens with sport, Ipsos, together with the World Economic Forum, has
prepared a study on the practice of exercise and team sports in 29
countries. Globally, on average, 70% of citizens are very or quite satisfied
with the lifestyle they lead. This percentage is repeated in Spain, which, compared to neighboring countries,
ranks as the third European country that is least satisfied with its
lifestyle , only ahead of Hungary (62%) and Italy
(59%). On the opposite side are the Netherlands (85%) and the United
Kingdom (81%), as the most satisfied at European level. When asked about the hours they dedicate weekly to exercising, on a
global level, on average, citizens dedicate 6.1 hours. In the case of
Spaniards, the average drops to 5.2 hours. Furthermore, Spain ranks as
the fourth European country where there is a higher percentage of the
population that does not do any sport (15%). Ahead of Spain are Italy
and Poland (both 26%) and France (22%). For its part, the Netherlands
(12.8 hours) tops the list of countries interviewed where they dedicate the
most hours to sport per week, as well as the one with the least population
declaring that they do not exercise at all (4%). What kinds of sports do citizens
choose The sports most practiced globally are fitness (20%), running (19%),
cycling (13%) and soccer (10%). In
Spain, fitness also ranks first with the same percentage (20% ),
being the fourth European country that most performs this activity, behind
Sweden (26%), Germany (21%) and the Netherlands (21% ). In addition to
fitness, Spaniards also practice swimming
(11%), running and cycling (9%) and soccer (8%). Expectations and barriers when playing
sports When it comes to knowing if respondents are satisfied with the level
of physical activity they do, globally, on average, 58% of people say they
would like to do more sport, a percentage that rises one point in Spain (59%
), being the second European country with the largest population that
confirms this desire, only behind Poland (61%). In the same way, 37% of those surveyed globally, on average, are
happy with the exercise they do. In the case of the Spanish population, 36% of citizens are happy
with the sport they practice, being the second least satisfied country in
Europe , behind Poland (33%). The European countries
that are most satisfied are the United Kingdom (55%), the Netherlands (51%)
and Germany (49%), where half of their population is happy in that sense. If the desire to do more sport is present,
what is it that prevents you from practicing it? Globally,
the most prominent reason is lack of time (37%), followed by lack of money
(18%) and weather conditions (17%). In the case of Spain, this same
trend continues, where the Spanish population blames lack of time (34%) as the main cause
for not doing more sport, followed by lack
of money (15%) and weather
conditions (14 %) . Some percentages that place Spain in
a medium term at the European level, where the lack of time is the most
indicated in countries such as Hungary (44%), while the lack of money is the
most pronounced in Belgium (18%) or the Environmental conditions affect the
most in Hungary (18%). (Ipsos Spain) 6 August 2021 Source: https://www.ipsos.com/es-es/espana-cuarto-pais-europeo-con-mas-poblacion-sedentaria |
|||||||||||||||||||||||||||||||||||||||||||||||||||||||||||||||||||||||||||||||||||||||||||||||||||||||||||||||||||||||||||||||||||||||||||||||||||||||||||||||||||||||||||||||||||||||||||||||||||||||||||||||||||||||||||||||||||||||||||||||||||||||||||||||||||||||||||||||||||||||||||||||||||||||||||||||||||||||||||||||||||||||||||||||||||||||||||||||||||||||||||||||||||||||||||||||||||||||||||||||||||||||||||||||||||||||||||||||||||||||||||||||||||||||||||||||||||||||||||||||||||||||||||||||||||||||||||||||||||||||||