|
BUSINESS & POLITICS IN THE WORLD GLOBAL OPINION REPORT NO. 705 Week:
August 23 –August 29, 2021 Presentation:
September 03, 2021 705-43-24/Commentary:
62% Of Americans Say The War In Afghanistan Was Not Worth Fighting About
7 in 10 Adult Nigerians Support Electronic Transmission of Election Results;
New Poll Reveals Fewer
Than Two In Five South Africans Trust The President Somewhat Or A Lot A
Majority Of Ugandans 62% Say The Level Of Corruption In The Country Increased
Last Year 48%
NHS Workers Say Coronavirus Restrictions Ended Too Soon A
Third Of Ethnic Minority Football Fans Have Experienced Racism At Stadiums A
Third Of Adults Say Afghanistan Exodus Is Among The Top Three Issues Facing
The UK Thirty-Two
Percent People Mention Climate Change And Pollution As A Major Issue For
Britain 22
Percent Of The German Citizens Entitled To Vote State That They Will Vote For
The CDU / CSU About
Four-In-Ten Americans Say Social Media Is An Important Way Of Following
Covid-19 Vaccine News 62%
Of Americans Say The War In Afghanistan Was Not Worth Fighting Half
(51%) Insist We Must Balance Economic Considerations With Environmental
Concerns A
Third (33%) Of Canadians Believe The Next Federal Government Should Focus On
Balancing The Budget More
than 20 million Australians continue to read news Support
For New Zealand’s Labour/Greens Government Increased 2% Points To 51.5% In
August Only
48% Agree That Globalization Is A Good Thing For Their Country Angela
Merkel’s Legacy, According To Europeans And Americans 25
Percent Of Respondents Have Found It Harder To Pay Their Rent INTRODUCTORY NOTE
705-43-24/Commentary:
62%
Of Americans Say The War In Afghanistan Was Not Worth Fighting
Public
opinion relating to the U.S. and Afghanistan can be divided into four
categories: (1) Americans' basic assessments of the 20-year U.S. military
involvement in Afghanistan, (2) Americans' views of the decision to
completely withdraw U.S. troops at this point, (3) Americans' views of the
way in which the withdrawal was handled and (4) the longer-term political
impact. U.S. Involvement Retrospective
approval of U.S. involvement in Afghanistan is at or below the majority level
and appears to be getting more negative as time goes on. Americans at this
point have significant doubts about the country's 20-year military
involvement in Afghanistan -- the longest war in U.S. history, estimated to
have cost over $2 trillion and almost 200,000 total deaths. Gallup's
July 6-21 update of
a trend question asking if the U.S. made a mistake sending military troops to
Afghanistan found 47% saying yes and 46% saying no. This "mistake"
percentage is as high as at any time since just after troops were first sent
to Afghanistan in November 2001, with the exception of one 49% reading in
February 2014. The most
recent Gallup poll was completed prior to much of the news coverage of the
speed with which the Taliban regained control of Afghanistan. More recent
polling (but conducted before the massive Aug. 26 explosion that killed U.S.
service members and many civilians) generally shows a majority negative
assessment of U.S. involvement in Afghanistan. These include an NBC News poll
conducted Aug. 14-17 showing that 61% of Americans say the Afghanistan War
was not worth it -- "When it
comes to Afghanistan, do you think the war was worth it or not worth
it?" -- and an AP-NORC poll from Aug. 12-16 finding that
62% of Americans say the war in Afghanistan was not worth fighting. The Decision to Withdraw U.S. Troops President
Joe Biden announced his decision on April 14 to withdraw all U.S. troops from
Afghanistan. As we would expect given the underlying negative views of U.S.
involvement in Afghanistan, surveys thereafter showed significant public
support for Biden's decision. An Ipsos survey conducted April 16-18 found 50%
supported the idea of the U.S. bringing home "all of its troops from
Afghanistan immediately," while 27% opposed. The 2021 Chicago Council
Survey, conducted July 7-26, found 70% support for the decision to withdraw
U.S. troops from Afghanistan by Sept. 11. A Quinnipiac poll in May found 62%
support. A Fox News poll conducted after the April announcement gave
respondents two options -- removing all troops or leaving some U.S. troops in
Afghanistan for counterterrorism operations -- and found 50% opted for the
latter choice, while 37% said that all troops should be removed. More
recently, even as reports of the Taliban takeover began to dominate the news,
Americans appeared to be sticking to their support for the U.S. getting out
of Afghanistan. A CBS News poll from Aug. 18-20 found 63% approval of the
U.S. removing troops from Afghanistan. A Morning Consult/Politico poll found somewhat more
muted support in its Aug. 16-19 poll among registered voters, with 53%
supporting and 36% opposing the decision. The wording of that poll -- "As you may know, United States President Joe
Biden announced the start of a withdrawal of U.S. military presence in
Afghanistan beginning May 1, with all troops returning home by Sept. 11,
2021. Based on what you know, do you support or oppose President Biden's
decision?" -- explicitly mentioned Biden, which may help
explain the lower level of support compared with the CBS News survey, which
did not mention the president. Several
commentators have noted a particularly loaded wording in another question
included in Morning Consult/Politico polling: "Do you believe the U.S. should still withdraw its military
presence in Afghanistan if it means it creates an opening for al Qaeda and
other terrorist groups to establish operations in Afghanistan?" Even with
this "directed verdict question," 45% of Americans agreed that
troops should be withdrawn, compared with 40% who said they should not. This
is taken, I think correctly, as an indicator of the degree to which the
public is behind the withdrawal. The Fox News poll from April, however,
suggests there may have been at least some public support for a more limited
withdrawal had Biden articulated that as an option. Assessment of the Way the Withdrawal Has Been Handled Given that
the majority of Americans believe the time has come for the U.S. to get out
of its military involvement in Afghanistan, I think it is fair to conclude
that Biden has -- in concept -- been carrying out the broad will of the
American public. Support for
the idea of U.S. disinvolvement in Afghanistan is, however, separate from
views on how well such withdrawal has been conducted. Recent surveys show the
majority of Americans believe the whole process has been handled poorly, and
Biden himself receives low marks for his handling of the situation. In short,
perceptions of the competence and execution of the actions in Afghanistan are
much more negative than perceptions of the objective or intent of the
actions. Several
recent polls support this conclusion. The NBC News poll shows 25% of
Americans approve of the way Biden is handling the Afghanistan situation. The
CBS News poll finds 74% say the removal of the troops has been handled badly
by the U.S. and 67% say that Biden did not have a clear plan for evacuating
American civilians. An Aug. 13-16 Morning Consult/Politico poll shows that 31% of registered voters
approve of Biden's handling of Afghanistan, while 57% say (at the time of the
poll) that the withdrawal is not going well. And the USA Today/Suffolk poll shows a 27%
approval rating for Biden's handling of Afghanistan. Long-Term Impact The only
really accurate way to assess the long-term impact of any specific event is
to wait for the long term and see what happens. But this evident fact of life
doesn't prevent us from looking at data-driven possibilities. One of the
most frequent focal points for consideration of the long-term impact of what
we are witnessing in Afghanistan concerns Biden and the Democrats. The
president's overall approval rating appears to be edging down, measured by
Gallup's Aug. 2-17 poll at
49% -- by one percentage point, the lowest of his administration. And, as my colleague
Jeff Jones noted, "Interviews conducted in the last three days of the
poll's field period, after Kabul fell, showed slightly less positive ratings
for Biden than those conducted earlier." Other polls
show similar declines, and one -- conducted Aug. 19-23 by Suffolk University
for USA Today --
shows Biden's approval rating dropping all the way to 41%, which is either an
outlier or a portent of further drops to come (no other poll has measured
Biden's approval nearly that low). But, as is
usually the case, it is difficult to disentangle the exact causes for
presidential approval movement. Recent data show there is much more on
Americans' minds than Afghanistan, suggesting caution in ascribing changes in
Biden's approval rating to any one factor. Gallup's Aug. 2-17 update,
for example, shows that less than 1% of Americans mention the situation in
Afghanistan as the most important problem facing the U.S. today, while
COVID-19 has increased significantly as the perceived top problem, followed
by mentions of the government, immigration and the economy. The NBC News poll
similarly shows no significant mention of Afghanistan when respondents are
asked to name the most important issue facing the country. The images
coming out of Kabul and elsewhere in Afghanistan bring back memories of the
dramatic fall of Saigon at the end of April 1975, as the North Vietnamese
surged south and took control of the city. Gerald Ford was president at that
time, although the last combat troops had left Vietnam in the spring of 1973,
with Richard Nixon in the White House. A review of
Gallup polling in 1975 finds little evidence that the takeover of the country
and the dramatic evacuations from South Vietnam had a direct effect on Ford's
approval rating. A Gallup retrospective published
when Ford died in 2006 showed his previously anemic ratings appeared to have
improved significantly in the weeks after the fall of Saigon, but this most
likely reflected the United States' handling of the capture of the SS Mayaguez by Cambodian Khmer
Rouge rebels. Americans' views of the most important problem facing the
nation after April 1975 -- as is the case now -- show very little mention of
any international issues. Most Americans' concerns in 1975 were focused on
domestic issues, including rampant inflation and a poor economy. In short,
the dramatic events taking place overseas in Vietnam in 1975, even if they
should have been anticipated by American leaders, didn't seem to have had
much of a direct impact on Americans' views of either the president or the
most important problem facing the nation. (Gallup polling showed that by the
late 1960s, a majority of Americans thought U.S. involvement in Vietnam had
been a mistake.) Bottom Line Americans
believe Biden did the right thing in withdrawing U.S. troops from
Afghanistan. Americans are as likely to view the whole 20-year experience in
that country as a mistake as to say it was not, while recent polling shows
the majority say involvement there was not worth it. But the extremely rapid
movement of the Taliban to wrest back control of the country has left
Americans with the perception that the withdrawal has not been handled well.
Biden is given low marks for his handling of the situation, although --
despite commentary to the contrary -- it is too early to know what the
long-term impact will be for Biden or for Democratic performance in next
year's midterm elections. It is always possible that the events taking place
now could result in a counterintuitive rally
effect of sorts. At this
point in history, Americans' concerns about Afghanistan are competing for
attention with other issues, particularly COVID. It is possible that new
events in Afghanistan in the weeks and months ahead could shift Americans'
attention and result in different views of the situation along with changes
in attitudes about the wisdom of the U.S. decision to withdraw all troops. (Gallup) AUGUST 27,
2021 705-43-25/Country Profile:
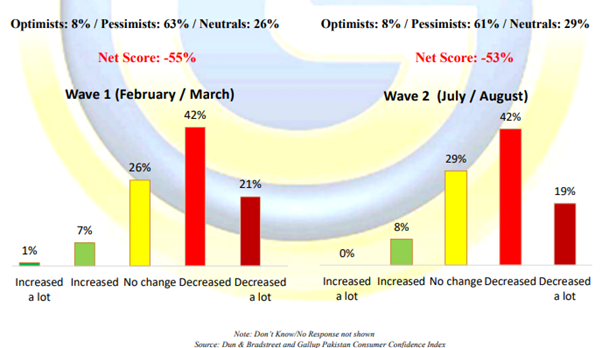
ASIA (Pakistan) 2
In 3 Pakistanis (61%) Reported Their Household Savings Had Reduced In The
Last 6 Months (Dun&Bradstreet And Gallup Pakistan Consumer Confidence
Index) A nationally
representative sample of adult men and women from across the four provinces
was asked the following question, “Do you think, in comparison to last 6
months, your household savings increased, decreased or remained the same?” In
response to this question, 8% said increased, 29% said no change, 42% said
decreased while 19% said decreased a lot. (Gallup
Pakistan) 26th August,
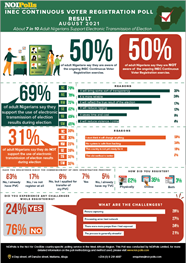
2021 AFRICA (Nigeria) About
7 in 10 Adult Nigerians Support Electronic Transmission of Election Results;
New Poll Reveals A new public opinion poll conducted by
NOIPolls has revealed that 69 percent of adult Nigerians nationwide support
the electronic transmission of election results during elections. This
assertion cuts across gender, geo-political zones, and age-group with at
least 62 percent representation from each category. The reason given by
Nigerians are as follows; it will bring about some sort of transparency
during elections (26 percent), it is more reliable (24 percent), it will reflect
the true result of elections (17 percent), and reduce rigging during
elections (12 percent) amongst other reasons. (NOI Polls) August 24, 2021 (South
Africans) Fewer
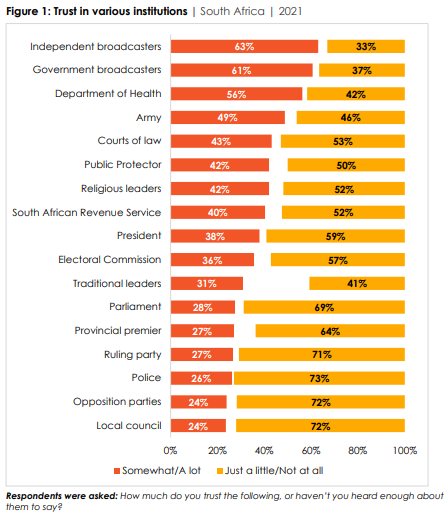
Than Two In Five South Africans Trust The President Somewhat Or A Lot Fewer than two in five South Africans trust
the president “somewhat” or “a lot,” and more than two-thirds have “just a
little” or “no trust at all” in Parliament, the police, and their local
council, according to a new Afrobarometer survey. Public trust in elected representatives
is particularly low, and only a quarter of South Africans express trust in
either the ruling or opposition parties. Trust in nearly all institutions is
low – and declining. Only media broadcasters, both independent (63%) and
government (61%), and the Department of Health (56%) enjoy the trust of most citizens. (Afrobarometer) 24 August 2021
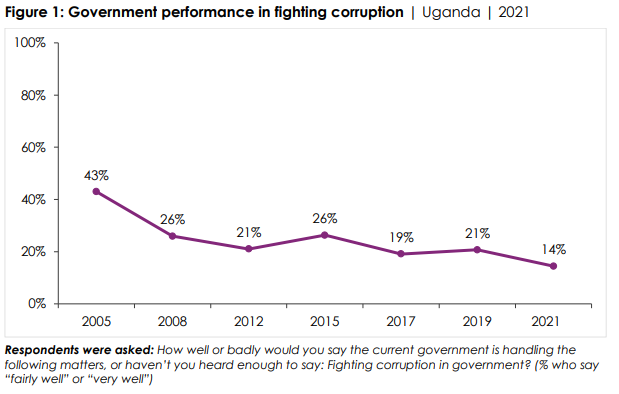
14%
Of Ugandans Say The Government Is Performing “Fairly Well” Or “Very Well” In
Combating Corruption Seven in 10 Ugandans say their government
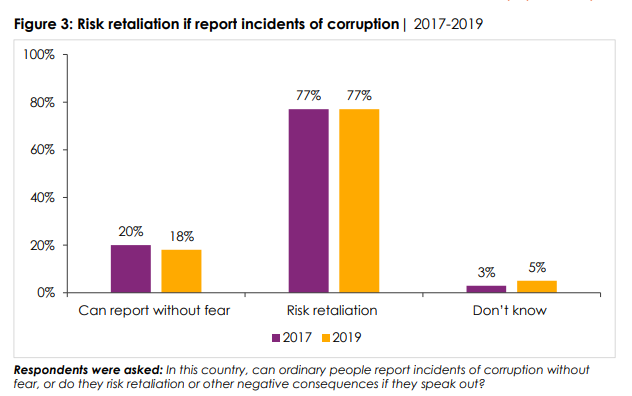
is performing “fairly badly” or “very badly” in combating corruption. More
than three-quarters of Ugandans believe that citizens who report corruption
to the authorities risk retaliation or other negative consequences.
Government’s office and a statehouse anti-corruption unit, have not persuaded
the public that the level of corruption in the country is decreasing. A
corruption-free Uganda is one of five targets that President Yoweri Museveni
has tasked his new cabinet with focusing on over the next five years. (Afrobarometer) 26 August 2021 A
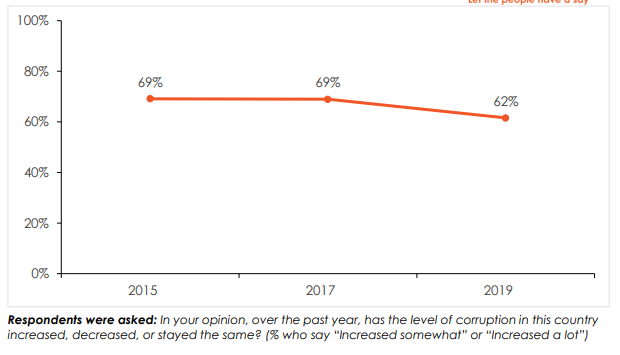
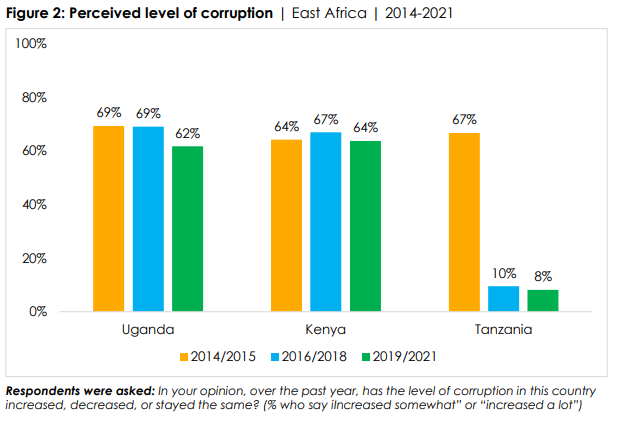
Majority Of Ugandans 62% Say The Level Of Corruption In The Country Increased
Last Year Six in 10 Ugandans (62%) say corruption in
the country increased “somewhat” or “a lot” during the year preceding the
survey. This reflects a 7-percentage-point decrease compared to 2017. Similarly,
the proportion of Ugandans who mention corruption as the most important
problem government should address has dropped from 20% in 2017 to 13%.
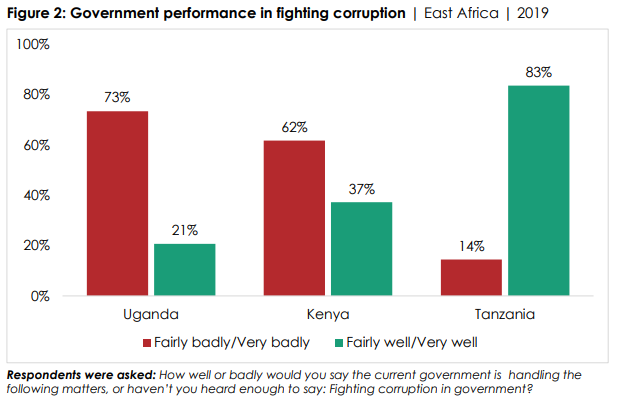
Compared to other East African countries, the proportions of Ugandans who see
corruption as increasing is similar to perceptions in Kenya but far less
promising than in Tanzania, where this proportion dropped from 67% in 2014 to
8% in 2021 (Afrobarometer) 26 August 2021 WEST
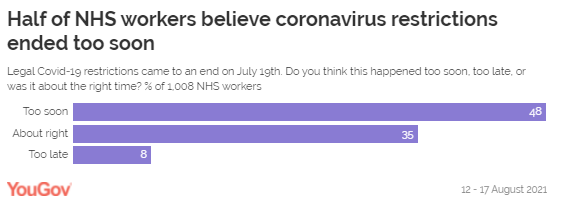
EUROPE (UK) Half of all NHS staff believe the
government jumped the gun with ‘Freedom Day’: 48% say coronavirus
restrictions ended too soon. Around one in three say the timing was about
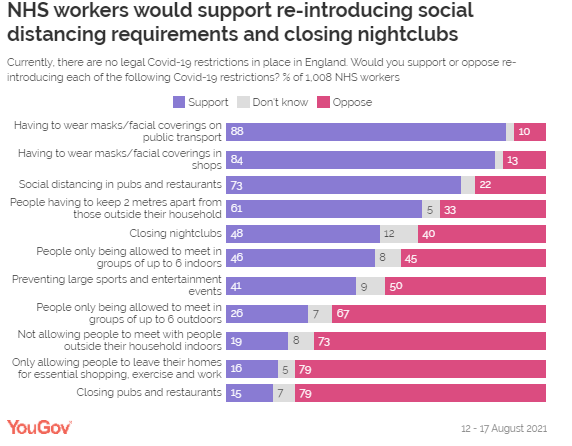
right, while only 8% say it happened too late. Support is highest making it a
legal requirement for people to wear masks on public transport and in shops
again, with respectively 88% and 84% in favour. While companies can still
demand that customers wear masks to use their services, this stopped being
legally required on 19 July. (YouGov UK) August 24, 2021 A
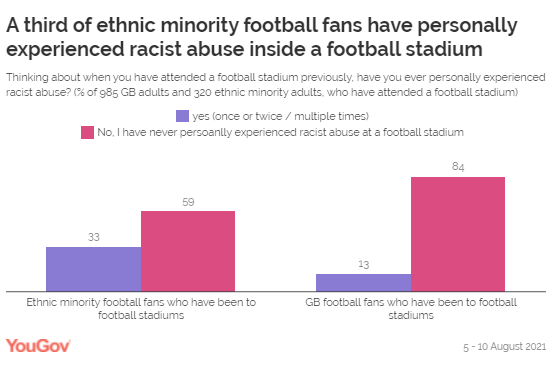
Third Of Ethnic Minority Football Fans Have Experienced Racism At Stadiums Our research finds that a third (33%) of
ethnic minority football fans who have watched a match at a stadium have
personally experienced racist abuse while there, including 8% saying this has
happened to them “many” times. This figure rises to 43% when we look at those
who go to football stadiums at least once a year. A parallel poll of all
football fans in Britain mirrors, these findings with 29% of those who have
been to a football ground saying they have witnessed racist abuse at least
once. (YouGov UK) August 26, 2021 A
Third Of Adults Say Afghanistan Exodus Is Among The Top Three Issues Facing
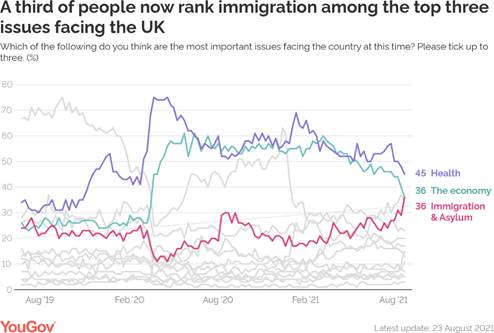
The UK Some 36% of people rank currently
immigration and asylum as one of the three most pressing issues affecting the
country, up seven points since 16 August, and tying for importance with the
economy. The only issue more commonly ranked as more important by the general
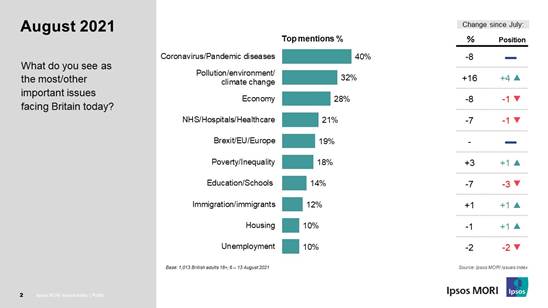
public is health (45%). (YouGov UK) August 25, 2021 Thirty-Two
Percent People Mention Climate Change And Pollution As A Major Issue For
Britain The August 2021 Ipsos MORI issues Index
reveals spontaneous public concern about the environment has jumped sixteen
percentage points since July. Thirty-two per cent mention climate change and
pollution as a major issue for Britain, making it the second-biggest concern
for the country. Fieldwork was conducted between 6 and 13 August, covering
the launch of the Sixth Assessment Report of the International Panel on
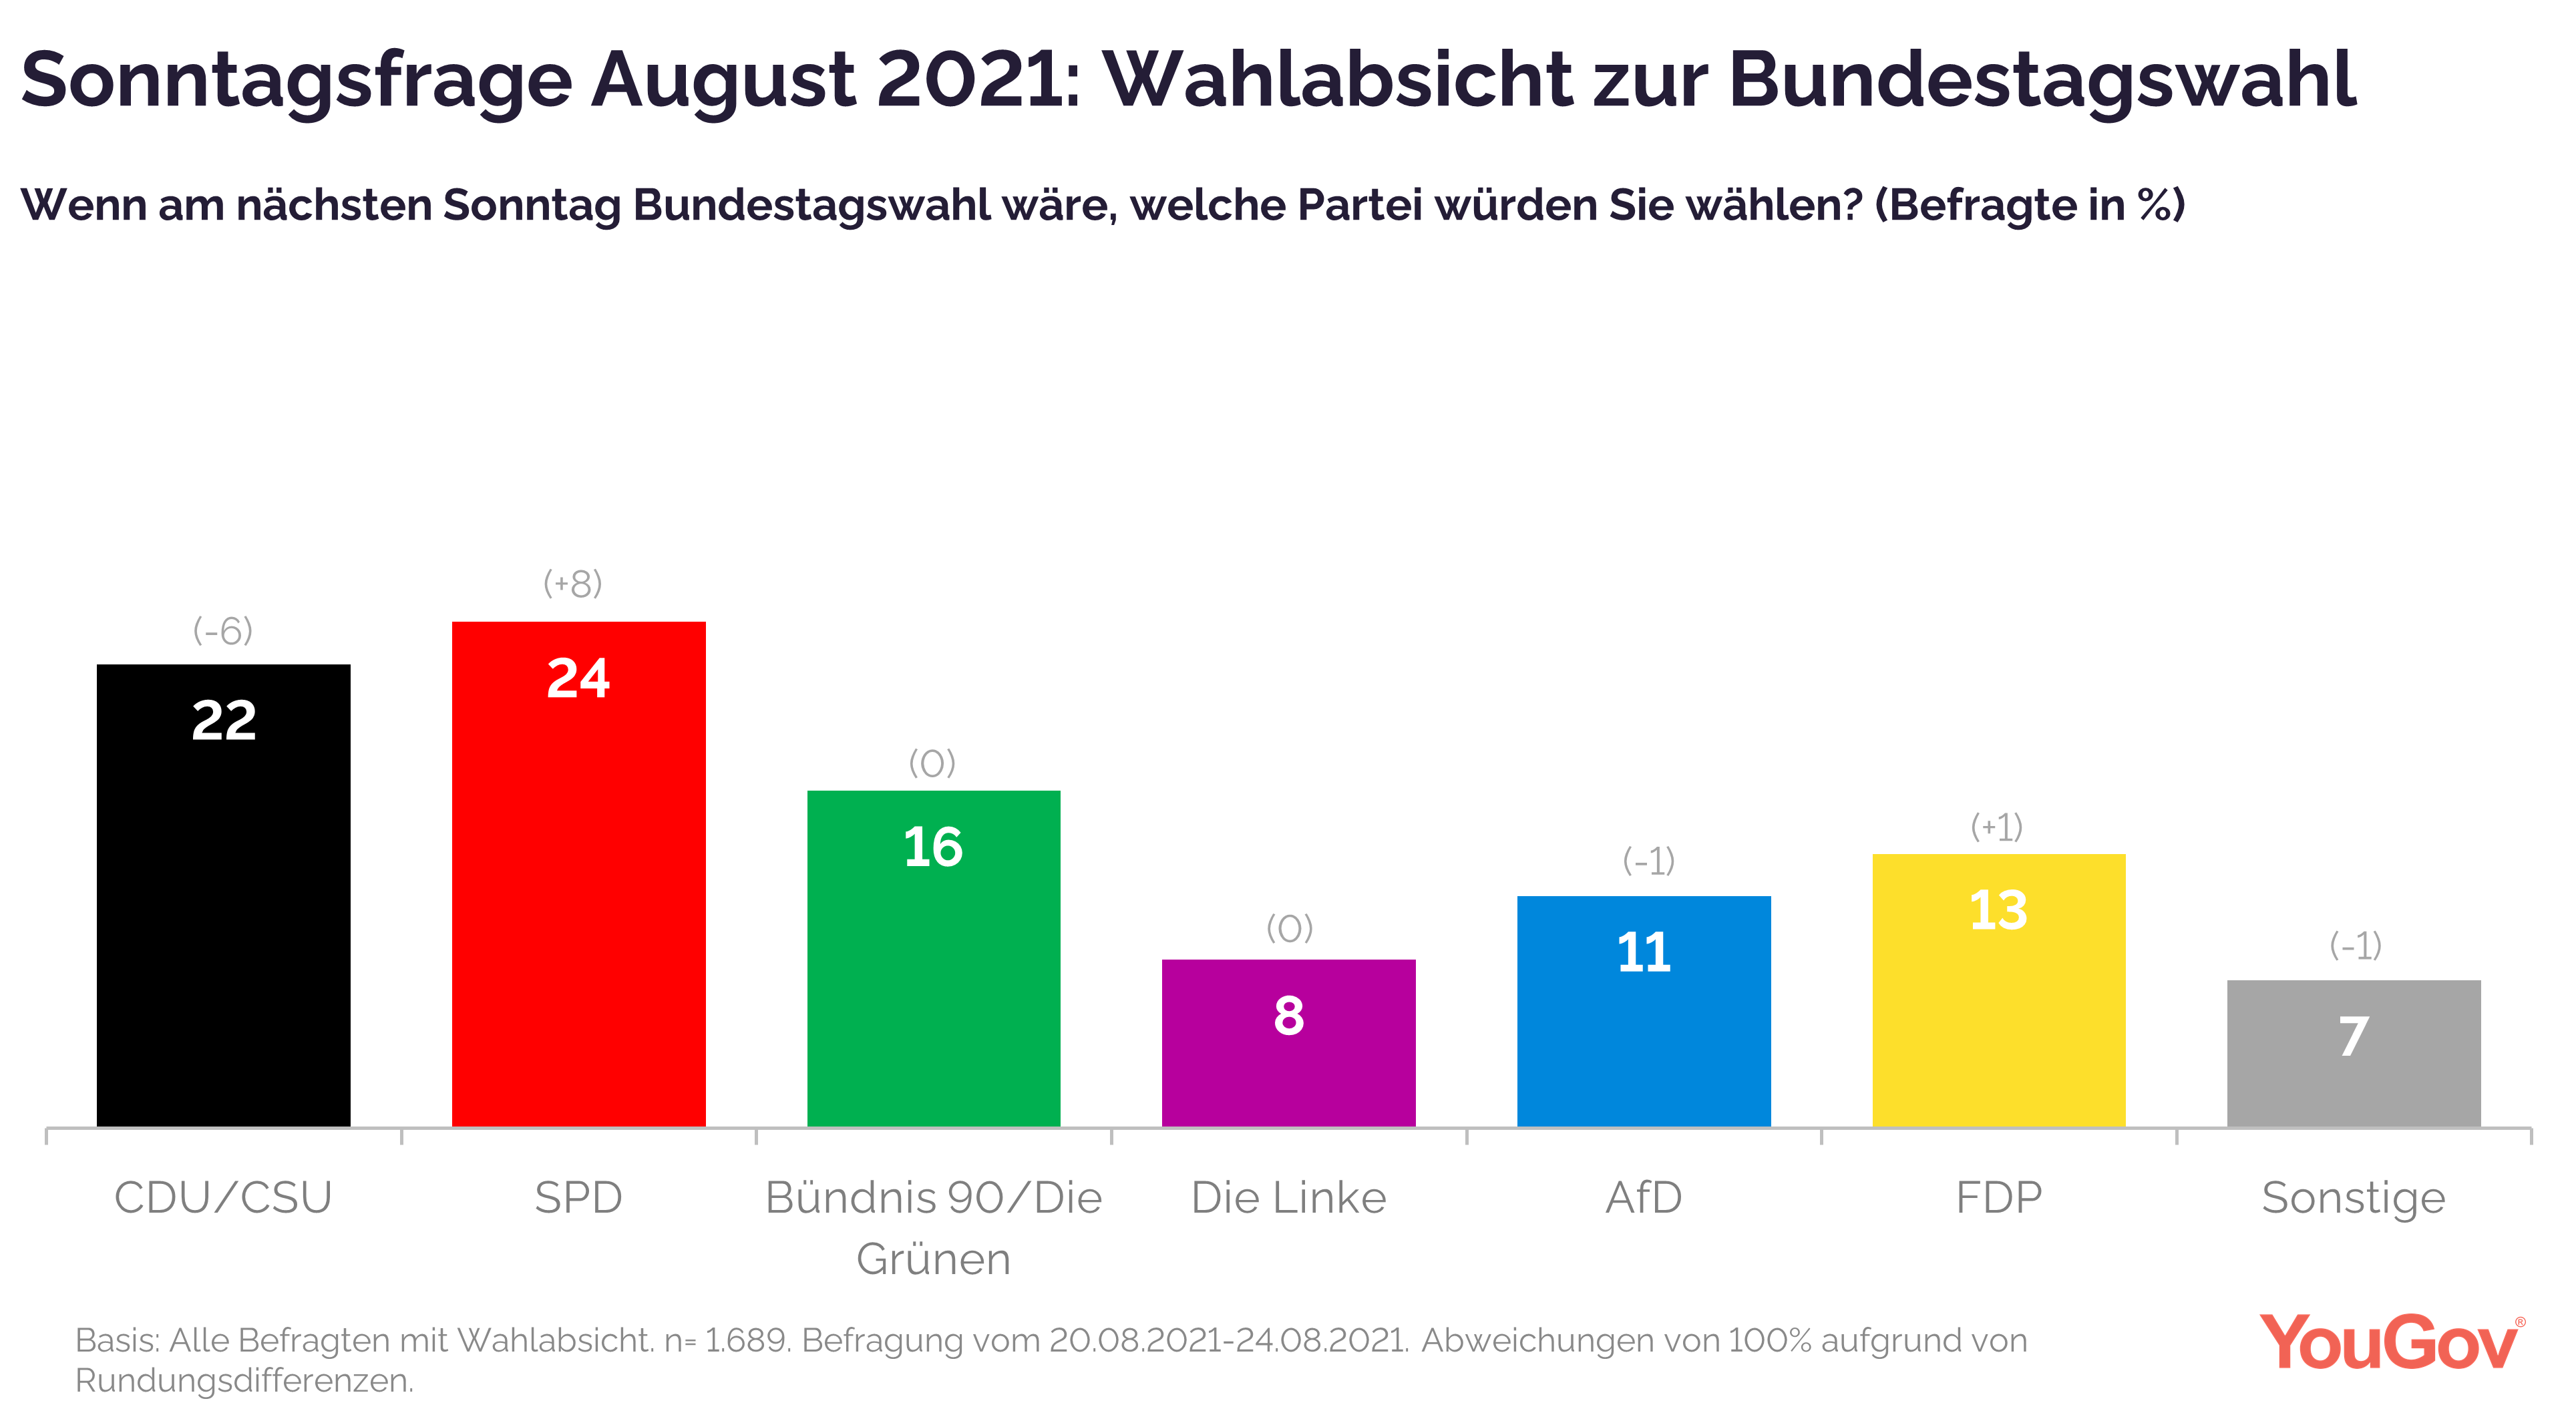
Climate Change. (Ipsos MORI) 27 August 2021 (Germany) 22
Percent Of The German Citizens Entitled To Vote State That They Will Vote For
The CDU / CSU 22 percent of the German citizens entitled
to vote state that they will vote for the CDU / CSU if there would be a
general election next Sunday. This value is 6 percentage points lower
compared to the previous month. The SPD, on the other hand, can gain 8
percentage points and lands at 24 percent. With this, the SPD has
overtaken the Union in terms of the Germans' intention to vote. Alliance
90 / The Greens remain unchanged compared to the previous month at 16
percent. (YouGov Germany) August 27, 2021 NORTH AMERICA (USA) About Six-In-Ten Adults (61%) Say The Declining Proportion
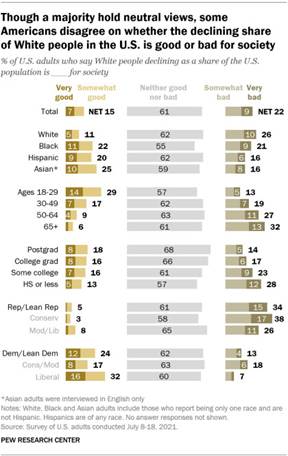
Of Americans Who Identify As White Is Neither Good Nor Bad For Society About six-in-ten adults (61%) say the
declining proportion of Americans who identify as White – a trend documented
this month in new data from the Census Bureau about Americans who identify as
solely White and not Hispanic – is neither good nor bad for society. About
two-in-ten (22%) say it is bad, including 9% who say it is very bad. Slightly
fewer (15%) say it is good for society, including 7% who say it is very good,
according to the survey of 10,221 adults, conducted July 8-18, 2021. (PEW) AUGUST 23, 2021 A Quarter Of Investors Say They Have Heard A Lot (6%) Or A
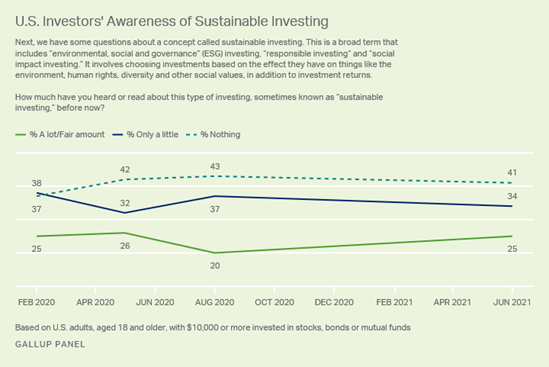
Fair Amount (19%) About Social Impact Investing A recent Gallup survey of U.S. adults with
$10,000 or more in investments finds no change over the past year in these
investors' awareness of sustainable investing -- also known as
"responsible investing," "social impact investing," or
"environmental, social and governance" investing. A quarter of
investors say they have heard a lot (6%) or a fair amount (19%) about this
type of investing. Another third have heard a little about it, while four in
10 have heard nothing. (Gallup) AUGUST 23, 2021 About Four-In-Ten Americans Say Social Media Is An
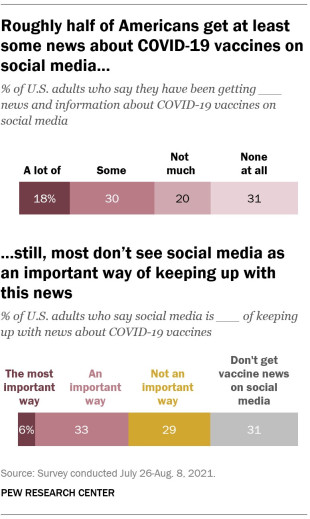
Important Way Of Following Covid-19 Vaccine News Among the 53% of Americans who say they
regularly get news from at least one of the 10 social media sites asked
about, close to three-quarters say they have gotten a lot (30%) or some (43%)
news and information about COVID-19 vaccines on social media. And about
six-in-ten of this group (61%) say that social media is an important way of
keeping up with news about COVID-19 vaccines, though just 11% say it is
the most important
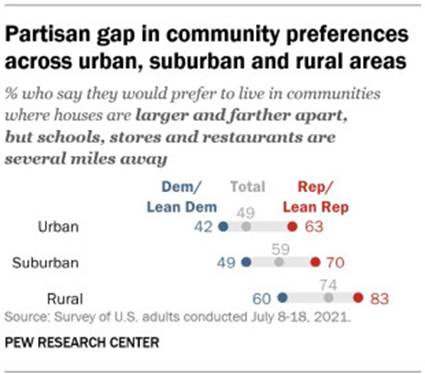
way. (PEW) AUGUST 24, 2021 Six-In-Ten U S Adults Say They Would Prefer To Live In A
Community With Larger Homes With Greater Distances To Retail Stores And
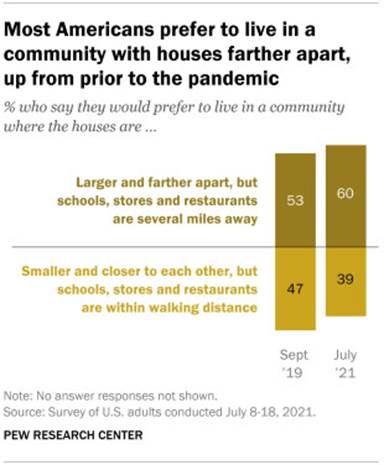
Schools This shift has occurred during the coronavirus outbreak and the accompanying period of
telework, remote schooling and pandemic-related restrictions on indoor dining
and other indoor activities. Today, six-in-ten U.S. adults say they would
prefer to live in a community with larger homes with greater distances to
retail stores and schools (up 7 percentage points since 2019), while 39% say
they prefer a community with smaller houses that are closer together with
schools, stores and restaurants within walking distance (down 8 points since
2019). (PEW) AUGUST 26, 2021 62% Of Americans Say The War In Afghanistan Was Not Worth
Fighting Gallup's July 6-21 update of a trend question asking if the
U.S. made a mistake sending military troops to Afghanistan found 47% saying
yes and 46% saying no. This "mistake" percentage is as high as at
any time since just after troops were first sent to Afghanistan in November
2001, with the exception of one 49% reading in February 2014. (Gallup) AUGUST 27, 2021
Half (51%) Insist We Must Balance Economic Considerations
With Environmental Concerns With 2021 seeing record-setting heat waves
afflicting Canadians from coast to coast and one of the worst wildfire
seasons in recent memory, Canadians indicate climate change is one of
their Top 5 issues in the 44th Federal
Election. While agreement is strong that something needs to be done about climate change (77%
agree Canada needs to do more than it is, -1 pt from 2019), the question
of what should be done remains
unclear, especially since half (51% -5 pts from 2019) believe we need to
balance economic considerations with environmental efforts. (Ipsos Canada) 26 August 2021 Singh Emerges As Most Likeable Leader(With Net Rating
Of +6); Negative Perceptions Highest
For Trudeau Currently, 93% of Liberal voters have a
favourable view of Prime Minister Justin Trudeau, and 92% of NDP voters are
favourable towards Jagmeet Singh. Nine in ten Bloc voters (89%) are also
favourable towards Yves-François Blanchet. However, it is a completely
different story for Erin O’Toole: only 69% of current Conservative voters are
favourable towards O’Toole, while two in ten (18%) are unfavourable towards
the leader. One in ten (13%) say they still don’t know enough about him to
say either way. (Ipsos Canada) 27 August 2021 A Third (33%) Of Canadians Believe The Next Federal
Government Should Focus On Balancing The Budget A third (33%, +2) of Canadians believe the
next federal government should focus on balancing the budget, even if it
means spending cuts or tax increases. This opinion is more pronounced among
men (37% vs 29% for women). Regionally, there does not appear to be any
significant differences, however, Alberta and Quebec are directionally more likely to believe the next
federal government should focus on balancing the budget (35% Alberta, 35%
Quebec, 33% Ontario, 31% SK/MB 29% BC, 29% Atlantic). As well, those with a
household income of $60-$100k are more likely to believe balancing the budget
should be the focus compared to the other household income levels (39%
$60-$100k vs 36% $100k+, 31% <$40k, 27% $40k-$60k). (Ipsos Canada) 28 August 2021 AUSTRALIA More than 20 million Australians continue to read news The readership figures, produced for the
first time by Roy Morgan for ThinkNewsBrands, refer to the 12 months to June
2021 and show that Total News reaches 97 per cent of the population aged 14+.
Total News consists of all news brands (print and digital) and digital news
websites. Digital news maintains its position of strength with
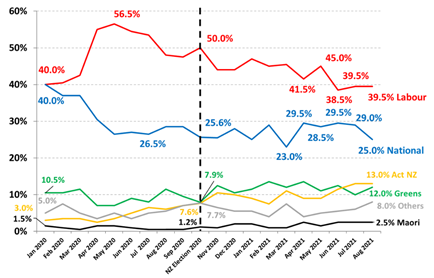
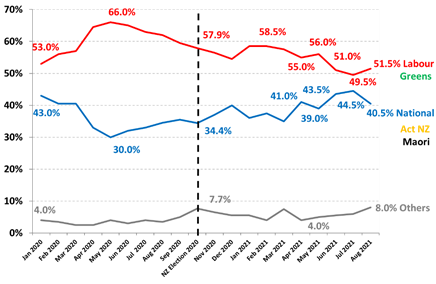
readership of 19.1 million, 90 per cent of the population aged 14+. (Roy Morgan) August 23 2021 (New Zealand) Support For New Zealand’s Labour/Greens Government
Increased 2% Points To 51.5% In August The governing parties are now 11% points
ahead of the Parliamentary opposition National/Act NZ/ Maori Party on 40.5%,
down 4% points since July. The drop was due to a loss in support for National
which was down 4% points to 25%, the lowest since March. Support for Act NZ
was unchanged at a record high of 13% while support for the Maori Party was
unchanged at 2.5%. A small minority of 8% of electors support other minor
parties outside Parliament with support for The Opportunities Party down 1%
point to 2% and support for NZ First up 0.5% points to 2.5% in August. (Roy Morgan) August 27 2021 MULTICOUNTRY STUDIES Only 48% Agree That Globalization Is A Good Thing For Their
Country The survey findings uncover a mix of
polarization and ambivalence among the public throughout the world about free
trade, globalization, and protectionist policies. On average, only 48% agree
that globalization is a good thing for their country. This is 10 percentage
points less than in 2019, before the COVID-19 pandemic. While favorability
toward globalization is down in all countries, it continues to vary widely
among them, ranging from 72% in Malaysia to 27% in France. (Ipsos Denmark) 23 August 2021 Source: https://www.ipsos.com/en-dk/ambivalence-characterizes-attitudes-globalization-and-trade Angela Merkel’s Legacy, According To Europeans And
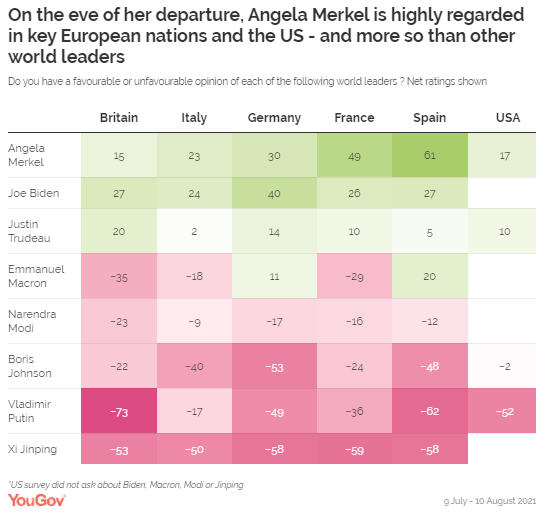
Americans Merkel receives positive net ratings in all
six countries surveyed, from a ‘low’ of +15 in Britain to a high of +61 in
Spain. In her native Germany she scores +30. The French public score Merkel
+49, and in Italy she receives a rating of +23. In Nordic nations Sweden and
Denmark the chancellor receives net scores of +47 and +64, respectively. People
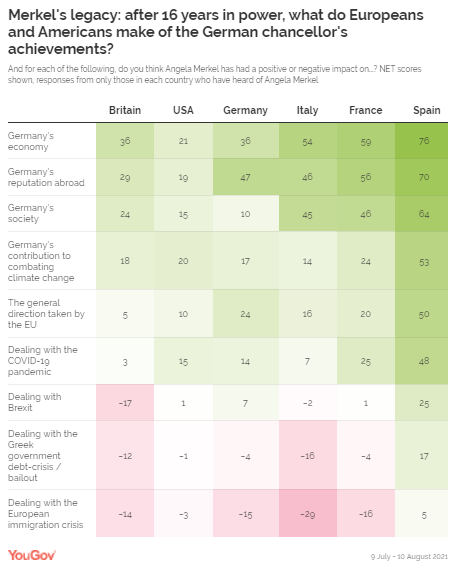
are most impressed with Merkel’s stewardship of the German economy, which has
grown 17% since 2005. Her performance in this area, among people in each
country who know who she is, ranges from +21 in the United States to +76 in
Spain. (YouGov Germany) August 26, 2021 Source: https://yougov.dk/news/2021/08/26/angela-merkels-legacy-according-europeans-and-amer/ 25 Percent Of Respondents Have Found It
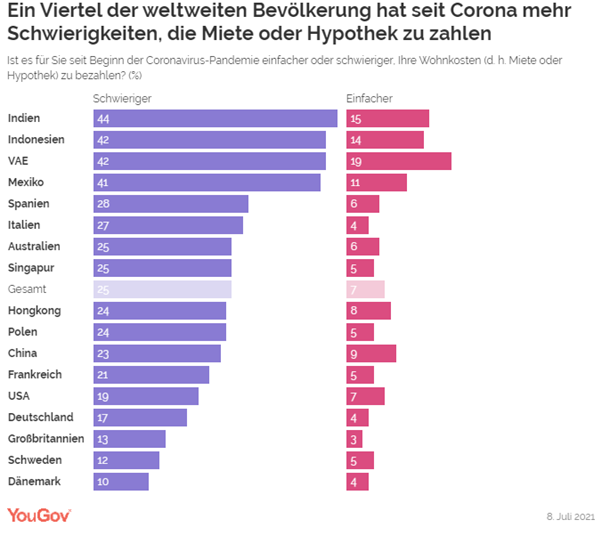
Harder To Pay Their Rent Global YouGov data shows that 25 percent of
respondents in the 17 markets youGov studied have found it harder to pay
their rent. Only 7 percent of all respondents say that it has become
easier for them. Indians (44 percent), Indonesians, and people in the
United Arab Emirates (42 percent each) were most likely to report having more
difficulty paying their rent or mortgage. However, respondents from
these three countries also say more often than most of the other respondents
that it has become easier for them (UAE 19 percent, India 15 percent;
Indonesia 14 percent). (YouGov Germany) August 27, 2021 Source: https://yougov.de/news/2021/08/27/wohnkosten-der-corona-krise-fur-ein-viertel-der-me/ ASIA
705-43-01/Polls 2 In 3 Pakistanis (61%)
Reported Their Household Savings Had Reduced In The Last 6 Months
(Dun&Bradstreet And Gallup Pakistan Consumer Confidence Index) According to
Dun&Bradstreet and Gallup Pakistan Consumer Confidence Index, 61%
Pakistanis reported their household savings decreased in the last 6 months.
The Consumer Confidence Index (CCI) is a reflection of current sentiments and
future outlook as seen through the eyes of consumers across Pakistan. The CCI
score is an indicator of consumer optimism/ pessimism about the economy, as
well as their own financial situation. Consumer Confidence Index is a leading
indicator of the economic health and social well-being. A nationally
representative sample of adult men and women from across the four provinces
was asked the following question, “Do you think, in comparison to last 6
months, your household savings increased, decreased or remained the same?” In
response to this question, 8% said increased, 29% said no change, 42% said
decreased while 19% said decreased a lot. Question: “Do you think, in
comparison to last 6 months, your household savings increased, decreased or
remained the same?”
(Gallup
Pakistan) 26th August,
2021 Source: https://gallup.com.pk/wp/wp-content/uploads/2021/08/26-Aug.pdf AFRICA
705-43-02/Polls About 7 in
10 Adult Nigerians Support Electronic Transmission of Election Results; New
Poll Reveals
Abuja, Nigeria. 17th August
2021 – A new public opinion poll conducted by
NOIPolls has revealed that 69 percent of adult Nigerians nationwide support
the electronic transmission of election results during elections. This
assertion cuts across gender, geo-political zones, and age-group with at
least 62 percent representation from each category. The reason given by
Nigerians are as follows; it will bring about some sort of transparency
during elections (26 percent), it is more reliable (24 percent), it will
reflect the true result of elections (17 percent), and reduce rigging during
elections (12 percent) amongst other reasons. However, in July 2021, both chambers of
Nigeria’s National Assembly passed the electoral amendment act, voting
against electronic transmission of election results insisting that the
Independent National Electoral Commission (INEC) does not have the capacity
to transmit election results electronically nationwide. On the contrary,
INEC, through its National Chairman and Commissioner for Information and
Voter Education, Mr. Festus Okoye, dismissed insinuations about the
commission’s ability to transmit election results electronically during an
interview on Channels television. He further stated that the commission has
the capacity for electronic transmission of results from remote areas of the
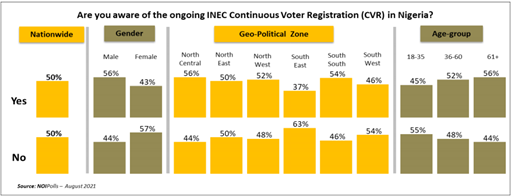
country.[1] More findings revealed an even split as 50
percent of adult Nigerians acknowledged awareness of the ongoing Continuous
Voter Registration (CVR) however, the other half (50 percent) claimed not to
be aware. Given this level of awareness, INEC needs to aggressively embark on
further awareness campaigns across the country. Analysis by geographical
location showed that the Northcentral has more Nigerians (56 percent) who are
aware of the exercise whereas, the South East (37 Percent) has the lowest
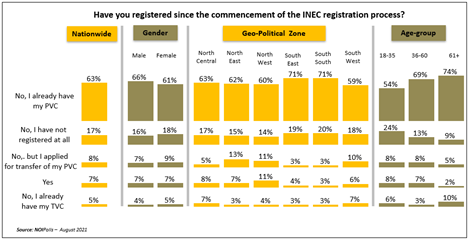
number of Nigerians who are aware of the exercise. Furthermore, Nigerians were asked about
their voter registration status and the poll result revealed that 7 percent
of adult Nigerians claimed to have registered since the commencement of the
online and physical registration exercise on June 28th and July 26th
respectively. According to the 2018 projected adult population by the Nigeria
Population Commission, this figure represents about 7.4 million adult
Nigerians who claimed to have registered since the commencement of this
exercise. The last available data from NEC shows that as of 7 am on Monday
26th July 2021, the number of new registrants had risen to 1,006,661.[2] In addition, the NOIPolls survey
finding by age group revealed that the highest proportion of adult Nigerians
who claimed to have registered were among those aged 18 – 35 years,
representing about 600,000 adult Nigerians between 18 – 35 years who have
registered since the commencement of this exercise. This finding corroborates
with the figures obtained by INEC from the distribution of registrants which
indicated that a higher percentage of those that have so far applied were
youths aged between 18 and 34.[3] It is gratifying to know that 63 percent of
adult Nigerians disclosed that they already have their Permeant Voters Card
(PVC), 8 percent applied for the transfer of the PVC to their current
location, while 5 have their Temporary Voters Card (TVC). Cumulatively, this
percentage implies that about 81 million Nigerians have already been
identified and included in the voters’ register of INEC. On the flip side, 17
percent of adult Nigerians indicated that they have not registered at all.
Analysis by age group revealed that those aged 18 – 35 years accounted for
the highest number of Nigerians (24 percent) in this category. Finally, more needs to be done on the part
of INEC to ensure that more Nigerians are registered before the
electioneering activities commence as 17percent of adult Nigerians stated
that they are yet to register. There is need for more awareness and voter
education especially on online registration as it will go a long way in
easing the stress of registration created by manual and physical
registration. Similarly, INEC needs to improve on some of the challenges
highlighted by fresh registrants to make the process worthwhile as well as ensure
that eligible Nigerians will be captured in the registration exercise.
Lastly, it is crucial for the Government to critically scrutinize the
exclusion of electronic transmission of election results as 69 percent of
adult Nigerians support the transmission of election results by INEC during
elections. These are some of the key findings from the poll conducted in the
week commencing August 9th,
2021. The constitution of Nigeria empowers and
mandates INEC to conduct credible elections that will usher in new leaders at
all levels in the country. In carrying out the mandate, INEC is expected to
ensure that every Nigerian, regardless of ethnicity or background is giving
such privileges without being disenfranchised. It is worth noting that the
elections are preceded by voter registration in which every Nigerian who has
turned 18 is expected to be registered so the individual can participate in
elections. INEC, in carrying out this task is expected to be fair,
transparent, just, and coordinated in the registration process. Additionally,
every Nigerian is expected to be registered at his preferred registration
point, provided the individual will vote at the location. To ameliorate most of the challenges
encountered by INEC during registration, the Commission decided to commence
the voter registration, many months before the commencement of the general
elections. This is heart-warming as it will give Nigerians above the age of
18 the opportunity to register early enough before the election. This process
will ensure that every eligible voter has registered within this ample time.
It is also worthy to know that the commission introduced online registration
which will ultimately be the icing on the cake regarding elections in
Nigeria. Online registration is indeed a welcome
development and the way forward as it will help see off most of the
challenges experienced during registration. About a month into the
commencement of the registration, the Commission has already recorded over a
million new registrations with the hope that many more will partake in the
online registration as time goes on.[4] Against this backdrop, NOIPolls
conducted a poll to gauge the opinion of Nigerians regarding the commencement
of the continuous voters’ registrations as well as the mode of transmission
of election results. Survey Findings The first question sought the level of
awareness of Nigerians on the ongoing INEC Continuous Voter Registration
exercise. The poll result revealed an even split as 50 percent of the
respondents acknowledge awareness of the exercise whereas the other half (50
percent) claimed that they are not aware. Analysis by geographical location showed
that the Northcentral has more Nigerians (56 percent) who are aware of the
exercise however, the South East (63 Percent) has the highest number of
Nigerians who are not aware of the ongoing registration. Further analysis
also showed that awareness was lowest among those aged 18 – 35 years. Continuous Voter Registration (CVR) is an
exercise meant for the registration of citizens who turned 18 years of age
after the last registration exercise; or those who for one reason or another
could not register in the previous exercises. Given the above statement, respondents were
asked about their registration status and the poll result revealed that 7
percent of adult Nigerians claimed to have registered since the commencement
of the online and physical registration exercise on June 28th and
July 26th respectively. According to the 2018 projected adult
population by the Nigeria Population Commission, this figure represents about
7.4 million adult Nigerians who claimed to have registered since the
commencement of this exercise. In addition, analysis by age group revealed
that those aged 18 – 35 years have the highest number of adult Nigerians who
claimed to have registered. Also, this figure represents about 600,000 adult
Nigerians between 18 – 35 years who have registered since the commencement of
this exercise. Furthermore, it is gratifying to know that
63 percent of adult Nigerians disclosed that they already have their Permeant
Voters Card (PVC), 8 percent applied for the transfer of the PVC to their
current location, while 5 have their Temporary Voters Card (TVC). Generally,
this implies that 81 million adult Nigerians have already been identified and
included in the voters’ register of INEC. On the other hand, 17 percent of adult
Nigerians disclosed that they have not registered at all. Analysis by age
group revealed that those aged 18 – 35 years accounted for the highest number
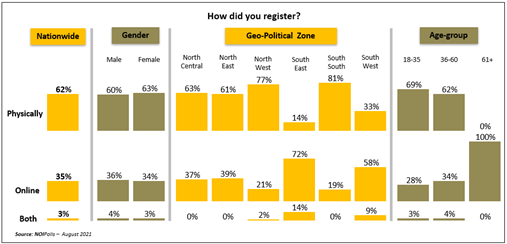
of Nigerians (24 percent) in this category. Subsequently, Nigerians who stated that
they have registered were further probed on the mode of their registration.
The poll result indicated that out of the 7 percent, 62 percent stated that
they registered physically, 35 percent said online, while 3 percent mentioned
that they used both the online and the physical processes. Interestingly, while the South-South and
North-West zones had more Nigerians who stated that they registered
physically, the South East and the South West zones had more Nigerians who
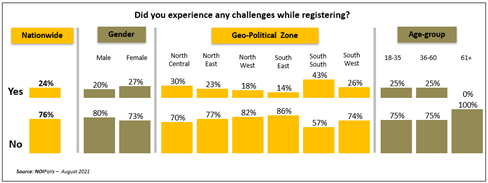
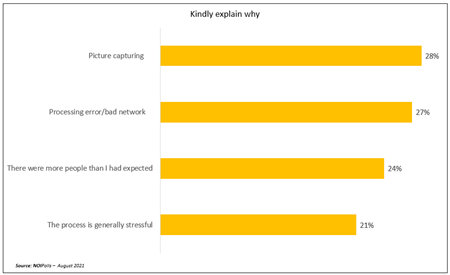
took advantage of the online registration method More findings revealed that the fresh
registrants were saddled with some form of challenges during the registration
process as reported by 24 percent of the respondents who recently used the
online method or visited an INEC registration center for fresh registration.
While registration challenges are experienced across the country as shown in
the chart below, Nigerians residing in the South-South zone are more likely
to face issues during registration. Further probe showed that 28 percent of the
respondents revealed that picture capturing was the major challenge faced at
the registration center and during the online registration. This is closely
followed by 27 percent who stated that processing error/bad network was also
a serious challenge during the registration process. In addition, while 24
percent stated that they were more people than expected, 21 percent disclosed
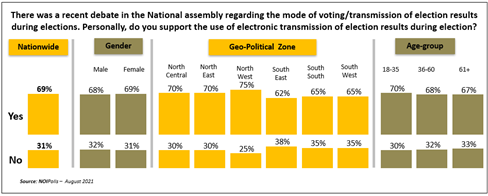
that the process was generally stressful. Consequently, opinions of Nigerians were sought
regarding the mode of transmission of election results during elections. The
poll result revealed that 69 percent of adult Nigerians nationwide prefer the
adoption of electronic transmission of election results during elections in
the country. This assertion cuts across gender, geo-political zones, and
age-group with at least 62 percent representation. On the contrary, 31
percent disclosed that they do not support the electronic transmission of
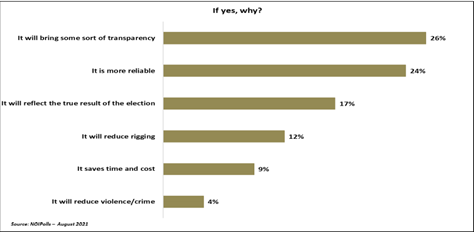
election results during elections. When respondents were further probed, 26
percent of those who support electronic transmission stated that the main
reason for their support is that it will bring some sort of transparency
during the election. This is followed by 24 percent who stated that
electronic transmission of election results is more reliable. While 17
percent mentioned that it will reflect the true result of the election, 12
percent asserted that it would reduce rigging during elections. Other reasons
mentioned are that it will save time and cost (9 percent) as well as reduce
violence or crime during elections (4 percent).
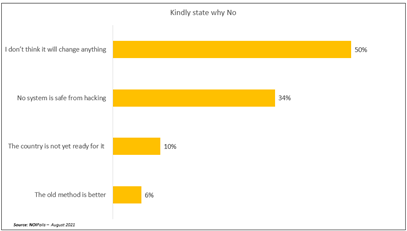
Concerning Nigerians who do not support the
electronic transmission of election results, 50 percent believe that
electronic transmission will not change the status quo, while 34 percent do
not support it because they believe that the server will be hacked. In
addition, while 10 percent believe that the country is not ready for
electronic transmission of election results, 6 percent stated that they
prefer the old method of transmitting election results. Conclusion In conclusion, the poll results have shown
that 69 percent of Nigerians are in support of electronic transmission of
elections results by INEC during elections. Therefore, it is pertinent that
the President embarks on wider consultations before assenting to the Bill as
a significant proportion of Nigerians believe that it will bring about some
sort of transparency (28 percent), reduce rigging (17 percent), save time and
cost (9 percent) as well as reduce election violence (4 percent). On awareness, INEC should synergies with
the National Orientation Agency (NOA) and Civil Society Organizations (CSOs)
to drive the process of enlightening the citizens, particularly those in the
rural areas and those aged between 18 – 35 years, on the electoral processes
and the ongoing Continuous Voter Registration as this report revealed that 50
percent of Nigerians claimed not to be aware of the ongoing Continuous
Voter’s Registration which commenced on June 28th and July 26th respectively. Finally, on the e-registration, Nigerians,
during the survey, commended INEC for the introduction of the online
registration mainly due to overcoming the distance barrier and enhancing
smooth registration process. However, INEC needs to improve on picture capturing
as 28 percent of those who experienced challenges pointed out and this will
go a long way in increasing the number of Nigerians registered per day. (NOI Polls) August 24, 2021 705-43-03/Polls Fewer Than
Two In Five South Africans Trust The President Somewhat Or A Lot
Fewer than two in five South Africans trust
the president “somewhat” or “a lot,” and more than two-thirds have “just a
little” or “no trust at all” in Parliament, the police, and their local
council, according to a new Afrobarometer survey. Public trust in elected
representatives is particularly low, and only a quarter of South Africans
express trust in either the ruling or opposition parties. Several rounds of
the Afrobarometer survey reveal a clear downward trend in South Africans’
trust in public institutions over the past decade. In the wake of widespread
rioting and looting that gripped South Africa’s two most populous provinces
in July 2021, Afrobarometer data from May-June 2021 point to a lack of trust
in state institutions as a possible factor undermining government authority
and legitimacy. Key findings §
Trust in nearly all institutions is low – and declining. Only media
broadcasters, both independent (63%) and government (61%), and the Department
of Health (56%) enjoy the trust of most citizens (Figure 1). §
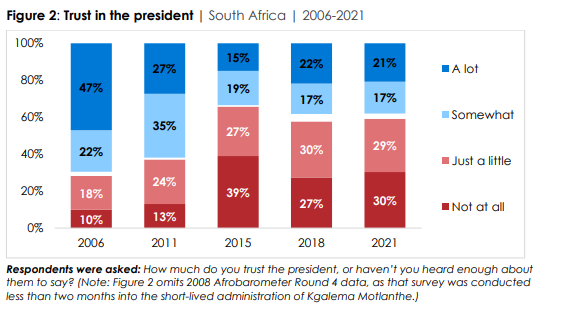
Only a minority of South Africans say they trust the president “somewhat”
(17%) or “a lot” (21%). Close to one-third of South Africans say that they do
not trust the president “at all” (30%), while a similar share say they trust
the president “just a little” (29%) (Figure 2). §
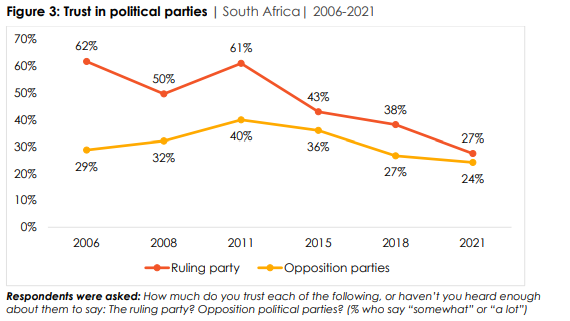
Trust in both the ruling party (27% “somewhat” or “a lot”) and opposition
parties (24%) continue to decline. Over the past decade, trust in the ruling
party and opposition parties has declined from 61% and 40%, respectively
(Figure 3). §
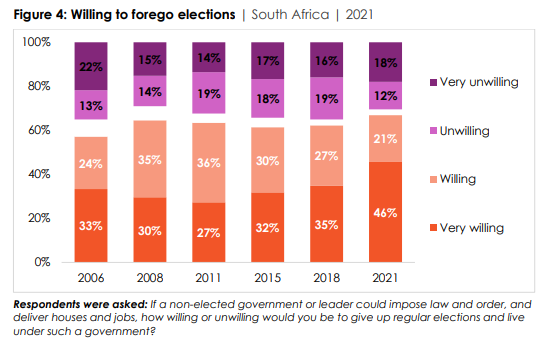
Two-thirds (67%) of South Africans would be willing to give up elections if a
nonelected government could provide security, housing, and jobs. Nearly half
(46%) say they would be “very willing” to do so (Figure 4). (Afrobarometer) 24 August 2021 705-43-04/Polls 14% Of
Ugandans Say The Government Is Performing “Fairly Well” Or “Very Well” In
Combating Corruption
Ugandans are increasingly dissatisfied with
their government’s performance in fighting corruption, according to
Afrobarometer survey findings. Seven in 10 Ugandans say their government
is performing “fairly badly” or “very badly” in combating corruption. More than three-quarters of Ugandans
believe that citizens who report corruption to the authorities risk
retaliation or other negative consequences Government anti-corruption efforts,
including the establishment of the Inspector General of Government’s office and a statehouse
anti-corruption unit, have not persuaded the public that the level of
corruption in the country is decreasing. A corruption-free Uganda is one of
five targets that President Yoweri Museveni has tasked his new cabinet with
focusing on over the next five years. Key findings Only 14% of Ugandans say the government is
performing “fairly well” or “very well” in combating corruption. Satisfaction
with government efforts against corruption has dropped by two-thirds since
2005 (Figure 1). Compared to other East African governments,
Uganda’s anti-corruption efforts receives worse public ratings. Tanzania is
rated best, with 83% of citizens saying their government is performing
“fairly well” or “very well” (Figure 2). More than three-quarters (77%) of Ugandans
believe that citizens who report corruption to the authorities risk
retaliation or other negative consequences (Figure 3).
(Afrobarometer) 26 August 2021 705-43-05/Polls A Majority
Of Ugandans 62% Say The Level Of Corruption In The Country Increased Last
Year
A majority of Ugandans say the level of
corruption in the country increased last year, according to a recent
Afrobarometer survey. While somewhat fewer citizens see increasing corruption
than in previous survey rounds, many Ugandans still report having to pay
bribes to obtain public services. Government anti-corruption efforts,
including the establishment of the Inspector General of Government’s office
and a statehouse anti-corruption unit, have not persuaded the public that the
level of corruption in the country is decreasing. A corruption-free Uganda is
one of five targets that President Yoweri Museveni has tasked his new cabinet
with focusing on over the next five years. Key findings Six in 10 Ugandans (62%) say corruption in
the country increased “somewhat” or “a lot” during the year preceding the
survey. This reflects a 7-percentage-point decrease compared to 2017 (Figure
1). Similarly, the proportion of Ugandans who
mention corruption as the most important problem government should address
has dropped from 20% in 2017 to 13%. Compared to other East African
countries, the proportions of Ugandans who see corruption as increasing is
similar to perceptions in Kenya but far less promising than in Tanzania,
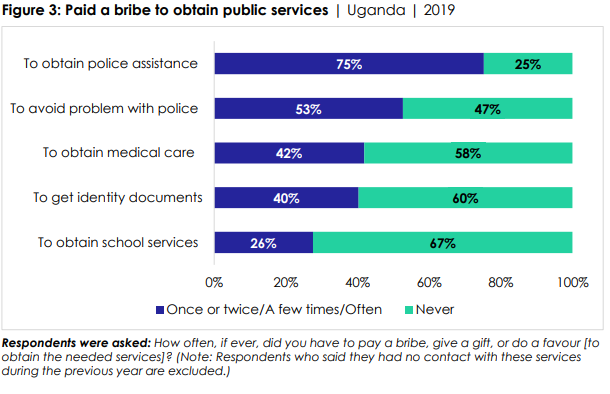
where this proportion dropped from 67% in 2014 to 8% in 2021 (Figure 2) Among Ugandans who had contact with key
public services during the previous year, three-quarters (75%) say they had
to pay a bribe to obtain police assistance. Four in 10 say they had to pay a
bribe to obtain medical care (42%) or to get a government document (40%)
(Figure 3). (Afrobarometer) 26 August 2021 WEST
EUROPE
705-43-06/Polls 48% NHS Workers Say Coronavirus Restrictions Ended Too Soon
The UK is slowly approaching something similar to a pre-pandemic
“normal”, with nearly all coronavirus restrictions having lifted on 19 July.
But many NHS workers feel uneasy about the return to a time with crowded
nightclubs, hugging, and maskless strangers standing closely on trains and in
pubs, while coronavirus cases are rising. Half of all NHS staff believe the government jumped the gun with
‘Freedom Day’: 48% say coronavirus restrictions ended too soon. Around one in
three say the timing was about right, while only 8% say it happened too late. These figures are similar
to those among the English public when YouGov asked in late July. Among 11 previous restrictions we asked about, NHS staff support
reintroducing five. Support is highest making it a legal requirement for people to wear
masks on public transport and in shops again, with respectively 88% and 84%
in favour. While companies can still demand that customers wear masks to use
their services, this stopped being legally required on 19 July. Three quarters of NHS workers (73%) also believe the social
distancing rule in restaurants and pubs should be put back on the menu, while
three in five (61%) would like the two-metre rule to still apply between
separate households, effectively outlawing hugs and handshakes again. More NHS staff than not are also in favour of nightclubs closing
their doors again, at 48% vs 40% who are opposed. These figures are largely in line with sentiment
among the wider English public, who would also back reintroducing the
same five restrictions as NHS, although support is slightly lower in most
cases. Meanwhile, there is little support for other restrictions such as
closing pubs and restaurants (15% in favour), limiting the purposes people
are allowed to leave their home for (16%) and banning indoor meetups with
others from outside the household (19%). (YouGov UK) August 24, 2021 705-43-07/Polls A Third Of Ethnic Minority Football Fans Have Experienced Racism At Stadiums
With most sport being played behind closed doors over the last 18
months, many fans were itching to return to football grounds as the new
premier league kicked off earlier this month. To coincide with the new
season, YouGov has partnered with Sky News and Sky Sports to take a look at
racism in stadiums, focusing specifically on the experiences of ethnic
minority football fans. Our research finds that a third (33%) of ethnic minority football
fans who have watched a match at a stadium have personally experienced racist
abuse while there, including 8% saying this has happened to them “many”
times. This figure rises to 43% when we look at those who go to football
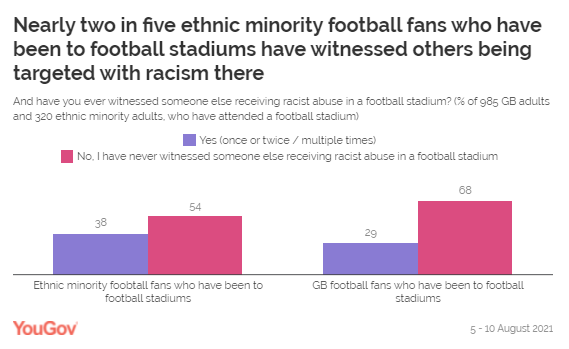
stadiums at least once a year. A parallel poll of all football fans in
Britain mirrors, these findings with 29% of those who have been to a football
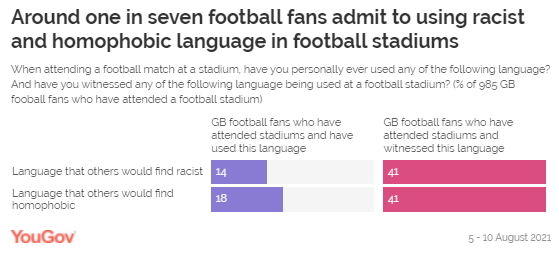
ground saying they have witnessed racist abuse at least once. When it comes to racist language being used in stadiums, such as
during chants, 41% of all football fans who have attended a stadium say they
have heard such language, with this figure rising to 56% amongst those from
an ethnic minority background. Indeed, 14% of football fans admit to having
used racist language when they have watched a game at a stadium. More
generally, six in 10 (63%) have heard language that others may find
offensive, while 40% say they have used this language themselves.
There is general acceptance amongst all football fans that current
measures to tackle racism in stadiums need improvement. Six in ten (60%) say
the current punishments for racism abuse are not harsh enough, 18% think they
are about right while just 4% think they are too harsh. (YouGov UK) August 26, 2021 705-43-08/Polls A Third Of Adults Say Afghanistan Exodus Is Among The Top Three Issues
Facing The UK
The UK has promised to take in 20,000 refugees from Afghanistan
across the next five years – with many saying the commitment is not
enough. YouGov polling for The Times last week revealed Britons to be
broadly in favour of resettling
Afghan refugees, and our latest issues tracker shows that “immigration
and asylum” has become one of the most important issues facing the country.
Some 36% of people rank currently immigration and asylum as one of
the three most pressing issues affecting the country, up seven points since
16 August, and tying for importance with the economy. The only issue more
commonly ranked as more important by the general public is health (45%).
The issue of immigration and asylum has risen in importance among
both Conservative voters (55%, +7), and Labour voters (19%, + 8). The shared
increase across voting groups suggests at least part of this rise is a
humanitarian concern: although generally more sceptical about admitting
migrants and asylum seekers to the UK, our previous poll showed a plurality
of Conservatives (45%) in support of taking on Afghan asylum seekers. Among
Labour voters, this figure is 69%. The crisis unfolding in Kabul is also likely to be the reason behind
those listing defence and security as a top-three issue rising from 5% to
10%. This includes a 10-point rise among Conservatives (28%) but only a
three-point rise in Labour voters (6%). (YouGov UK) August 25, 2021 705-43-09/Polls Thirty-Two Percent People Mention Climate Change And Pollution As A
Major Issue For Britain
The August 2021 Ipsos MORI issues Index reveals spontaneous public
concern about the environment has jumped sixteen percentage points since
July. Thirty-two per cent mention climate change and pollution as a major
issue for Britain, making it the second-biggest concern for the country.
Fieldwork was conducted between 6 and 13 August, covering the launch of the
Sixth Assessment Report of the International Panel on Climate Change. This is the second highest-level of concern recorded about the
environment since it was added as an option to the survey in 1988: in July
1989, when the highest temperature since 1976 was recorded at Heathrow, 35%
mentioned environmental issues as a worry. COVID-19 remains the biggest issue for Britain, however just 40%
mention it as a big issue this month – down eight points from July and 35
percentage points below the highest score this year (75% in January). The level of concern about three other issues has also fallen this
month: worry about the economy has dropped by eight percentage points (36% to
28%) and there has been a seven percentage-point fall in the proportion who
see the NHS and education as big issues (28% to 21% and 21% to 14%
respectively).
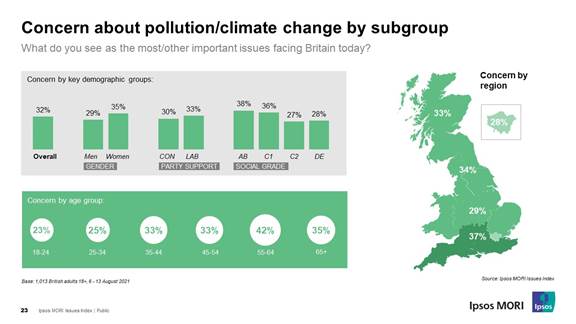
While environmental concern has risen generally, there remain
differences between different groups of the population:
Mike Clemence, a researcher at Ipsos MORI,
said: Public concern about the environment has
reached an historically high level this month, with publication of the new
IPCC report and reports of fires and flooding around the world. But this jump
in concern is built on a steady rise in the level of worry on this topic
which has been building since around 2015. (Ipsos MORI) 27 August 2021 705-43-10/Polls 22 Percent Of The German Citizens Entitled To Vote State That They
Will Vote For The CDU / CSU
22 percent of the German citizens entitled to vote state that they
will vote for the CDU / CSU if there would be a general election next
Sunday. This value is 6 percentage points lower compared to the previous
month. The SPD, on the other hand, can gain 8 percentage points and
lands at 24 percent. With this, the SPD has overtaken the Union in terms
of the Germans' intention to vote. Alliance 90 / The Greens remain
unchanged compared to the previous month at 16 percent.
The FDP lands at 13 percent (12 percent in the previous month), the
AfD at 11 percent (12 percent in the previous month), and Die Linke remains
unchanged at 8 percent. 7 percent of the vote goes to the other parties.
Olaf Scholz's popularity is increasing,
Armin Laschets is decreasing If they could elect the Federal Chancellor directly, 26 percent of
Germans eligible to vote would currently vote for Olaf Scholz, the SPD's
candidate for chancellor. The second most popular is currently Christian
Lindner from the FDP with 10 percent, followed by Annalena Baerbock from the
Greens with 9 percent. Armin Laschet from the CDU currently only
achieves 8 percent. Alice Weidel from the AfD would vote 5 percent of eligible Germans if
they could directly elect the Federal Chancellor. Tino Chrupalla, also
AfD, would vote 1 percent directly. Left-wing politician Janine Wissler
also got 1 percent, and left-wing parliamentary group leader Dietmar Bartsch
got 2 percent. 26 percent of eligible Germans say that they would not
vote for any of the eight named.
According to the Germans, the election
campaign posters of the individual parties were rather unsuccessful 33 percent of Germans state that they have not succeeded in finding
the poster motifs for the CDU / CSU election campaign that are currently on
the streets; only 19 percent think they are successful. When it comes to
advertising for the SPD, the answers are somewhat more balanced: 28 percent think
they are unsuccessful, 26 percent find them successful. A third of those
questioned (32 percent) said that they did not find the posters of the
Greens, and 21 percent said they were successful. With regard to all
three parties, the proportion of those who state that they have not seen any
poster advertising is 28 to 30 percent each. 11 percent of Germans say that they make their decision as to which
party they will vote for in the federal election in September dependent on
the parties' advertising campaigns. The majority of Germans (79 percent)
do not make their decision dependent on it. (YouGov Germany) August 27, 2021 Source: https://yougov.de/news/2021/08/27/sonntagsfrage-spd-uberholt-cducsu/ NORTH
AMERICA
705-43-11/Polls About Six-In-Ten Adults (61%) Say The Declining Proportion Of
Americans Who Identify As White Is Neither Good Nor Bad For Society
A majority of U.S. adults say the decreasing share of Americans who identify
their race as White is neither good nor bad for society, according to a
recent Pew Research Center survey.
About six-in-ten adults (61%) say the declining proportion of
Americans who identify as White – a trend documented this month in new
data from the Census Bureau about Americans who identify as solely
White and not Hispanic – is neither good nor bad for society. About
two-in-ten (22%) say it is bad, including 9% who say it is very bad. Slightly
fewer (15%) say it is good for society, including 7% who say it is very good,
according to the survey of 10,221 adults, conducted July 8-18, 2021. Majorities across demographic and political groups have neutral views
about the changing racial makeup of the U.S. population. But there are
substantial differences in the shares who have a positive or negative opinion
about the declining proportion of White people in the country. Differences by age are especially pronounced. Among those ages 18 to
29, around three-in-ten (29%) say the fact that White people are declining as
a share of the U.S. population is good for society, compared with 13% who say
it is bad. By contrast, 32% of Americans ages 65 and older say this
demographic shift is bad for society and only 6% say it is good. Views also differ sharply by partisanship and ideology, even as
nearly identical majorities of Republicans and Democrats (61% vs. 62%) say it
is neither good nor bad for society that White people are declining as a
share of the population. About a third of Republicans and GOP-leaning independents (34%) say
the decline of the White share of the population is bad for society,
including 38% of conservative Republicans and 26% of moderate and liberal
Republicans. Few Republicans (5%) say it is good for society. By contrast, around a quarter of Democrats and Democratic leaners
(24%) say this demographic shift is a good thing. However, liberal Democrats
are more likely than conservative and moderate Democrats (32% vs. 17%) to say
the declining share of White people is good for society, while conservative
and moderate Democrats are more likely than their liberal counterparts (18%
vs. 7%) to say this shift is bad.
Across racial and ethnic groups, majorities of Americans say it is
neither good nor bad that White people are a declining share of the U.S.
population, though White adults (26%) are somewhat more likely than Black
(21%), Hispanic and Asian adults (16% each) to say the change is bad for
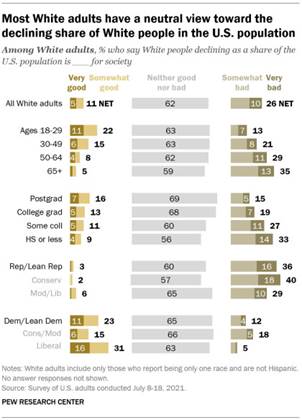
society. Among White adults, views differ little from the pattern in the
overall public. About six-in-ten White adults of all ages say the declining
share of White people in the population is neither good nor bad for society.
But about a third of White adults 65 and older (35%) say it is bad for
society, while just 13% of those under 30 say the same. And consistent with
the overall partisan differences in these views, White Democrats (23%) are
far more likely than White Republicans (3%) to say the declining share of
White people in the U.S. population is good for society. Conversely, White
Republicans are three times as likely as White Democrats (36% vs. 12%) to say
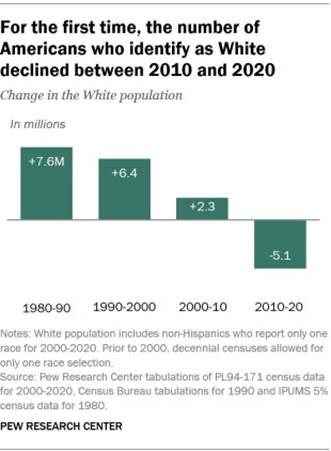
this change is bad. How the U.S. White population has changed
over the decades For the first time, the 2020 census showed the U.S. had a shrinking
non-Hispanic White population that identifies with a single race, down 3% –
or about 5.1 million people – from 2010 to 2020. The decline was widespread
geographically, with 35 states seeing drops in their non-Hispanic White
populations.
In previous decades, White people had still increased in numbers, but
at a
slower pace than other racial and ethnic groups, in particular
Hispanic and Asian populations. (Unless otherwise specified, all racial
groups in this analysis refer to non-Hispanics who identify with a single
race.) Despite its decline since 2010, the non-Hispanic White population of
the U.S. stood at nearly 192.0 million in 2020 and remained the nation’s
single-largest racial or ethnic group. In 32 states, the overall population increased from 2010 to 2020,
even as the non-Hispanic White population decreased. In these states, the
largest decreases in the non-Hispanic White population came in Connecticut
(-10%), while California, Maryland and New Jersey saw the next biggest
decreases (-8% each). West Virginia, Illinois and Mississippi were the only
states to see their total population decrease along with its non-Hispanic
White population. Only 15 states and the District of Columbia saw increases in their
non-Hispanic White populations from 2010 to 2020, with the largest coming in
D.C. (+25%), Utah (+11%) and Idaho (+10%).
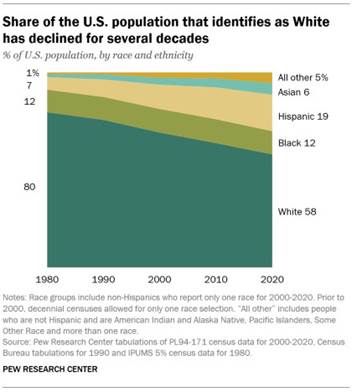
The share of
people in the U.S. who identify as non-Hispanic White and no other race has
also declined in recent years, falling from 64% in 2010 to 58% in 2020,
according to the new census data. This trend stretches back several decades:
Non-Hispanic White people declined as a share of the U.S. population from
1980 to 1990 (80% to 76%) and in every decade since then. The non-Hispanic White share of the U.S. population remains far
higher than the shares who identify as Hispanic (19%), Black (12%) or Asian
(6%). Another 4% identify with two or more races and are not Hispanic. This
pattern is due to several factors. The White population is
older than other groups and aging faster, contributing to a lower
birth rate and an increased number of deaths. In addition, immigration is not
a source of significant growth for the White population. Immigrants account
for a significantly smaller share of the White population than of other
groups, in particular Asians
and Hispanics. The non-Hispanic White population in the U.S. that identifies with a
single race is expected to fall below 50% by 2045, according to Census
Bureau projections. However, this date
is speculative, due in part to the nation’s growing
multiracial population, changing demographic trends and uncertainty over
how people’s views of their own identity may shift over time. Racial identification in the 2020 census Some people who identify their race as White also identify with
another race or as Hispanic – or both as Hispanic and with another race. This
more broadly defined White population saw modest growth of 2% from 2010 to
2020, increasing from 231.0 million to 235.4 million. However, the
group’s share of the
U.S. population declined over the past decade, from 75% to 71%. The population growth of this racial group, referred to in census
data as “White alone or in combination,” is due entirely to an increase in
the number of people who identified as White and another race. From 2010 to
2020, their numbers grew from 5.0 to 12.2 million for non-Hispanics, and 2.5
million to 18.9 million for Hispanics. These trends reflect broader societal changes in the U.S., such as
the rising
share of newlyweds who marry someone of another race and the growing
number of multiracial
or multiethnic babies. Americans’ views of their racial and ethnic
identities also change over time, which can result
in changes in how they report their race on census forms. Another
contributing factor is that the format of the race questions in the 2020
census, as well as the way responses
were coded, differed from previous versions of the decennial census. (PEW) AUGUST 23, 2021 705-43-12/Polls A Quarter Of Investors Say They Have Heard A Lot (6%) Or A Fair
Amount (19%) About Social Impact Investing
WASHINGTON, D.C. -- A recent Gallup survey of U.S. adults with $10,000
or more in investments finds no change over the past year in these investors'
awareness of sustainable investing -- also known as "responsible
investing," "social impact investing," or "environmental,
social and governance" investing. A quarter of investors say they have
heard a lot (6%) or a fair amount (19%) about this type of investing. Another
third have heard a little about it, while four in 10 have heard nothing.
Line graph. Trend from February 2020 through June 2021 in U.S.
investors' awareness of sustainable investing, also known as environmental,
social and governance investing; responsible investing; and social impact
investing. The percentage who have heard a lot or a fair amount about this
type of investing is 25% in June 2021, similar to the 20% to 25% found across
three surveys in 2020. Current awareness of sustainable investing is on par with Gallup's
2020 readings, with a quarter reporting they had heard a lot or a fair amount
about this type of investing in February and May surveys, while slightly
fewer had heard this much in August. The latest results are based on the second quarter Gallup
Investor Optimism Index survey, conducted June 22-29. For this
survey, investors are defined as adults 18 and older who have $10,000 or more
invested in stocks, bonds or mutual funds, either within or outside of a
retirement account. Approximately four in 10 U.S. adults meet this criterion. Awareness of sustainable investing is higher among male, younger and
wealthier investors than among their counterparts. There is no difference by
whether one has a financial adviser, either paid or unpaid. U.S. Investor Awareness of Sustainable Investing, by Key Subgroup
Investor Interest in Sustainable Investing
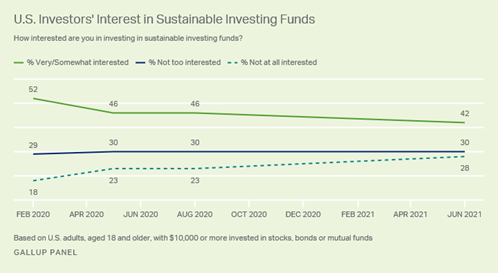
Is Down From Before the Pandemic Investors' interest in sustainable investing is significantly lower
than it was just before the start of the coronavirus pandemic. After initially dipping from 52% in February 2020 to 46% in May and
staying at that level in August, the percentage who are very or somewhat
interested is now 42%. Meanwhile, the percentage not at all interested has
increased from 18% to 28%, and the 29% "not too interested" has
stayed about the same.
Line graph. Trend from February 2020 through June 2021 in U.S.
investors interest in sustainable investing funds. The percentage very or
somewhat interested declined from 52% last February to 46% in May 2020 and is
42% today. Meanwhile the percentage not at all interested rose from 18% in
February 2020 to 28% today. The survey doesn't address what has dampened investors' interest in
sustainable investing. While it may reflect less desire to use their
investments to address societal issues at a fragile time, economically, it
could simply reflect investors' broader wariness of exposing themselves to
market risk. Evidence for the latter hypothesis comes from the first quarter
survey, which found 60% of investors saying they are holding back money they
could invest in the stock market and keeping it in cash instead. This was
mostly because of fear of a market downturn or because they needed the money
for other things. Compared with February 2020, investor interest in sustainable
investing has fallen the most among some groups that were initially the most
interested -- women, Democrats and, to a lesser extent, higher-asset
investors. On the other hand, investors aged 18 to 49, who were drawn to
sustainable investing the most of all age groups last February, have largely
retained their interest, while interest among older investors has fallen. These declines in interest by demographic group have happened
gradually over the past 18 months rather than being apparent only in the
latest results. Change in Investor Interest in Sustainable Investing From Before
Pandemic % Very/Somewhat interested
As of today, interest in sustainable investing is similar by gender
and investor class; at the same time, it differs strongly by political party
and age. Roughly six in 10 Democrats versus fewer than two in 10 Republicans
are at least somewhat interested. Also, investors aged 18 to 49 are nearly
twice as likely as those 50 and older to be interested. Investor Interest in Sustainable Investing, June 2021
Investors Expect Sustainable Investment
Returns To Follow Market Average Most investors, 70%, believe sustainable investing funds generally
perform on par with the market average, but many more still think they
perform worse (25%) than say they perform better (5%), as was the case in
2020. The balance of views at the margins is a bit less negative among
women, younger investors and Democrats than their counterparts. These groups
are only somewhat more likely to believe sustainable investing funds perform
worse than the market average, rather than better. However, the vast majority
of all groups still say they perform the same. Investors' Perceptions of How Sustainable Investing Funds Perform Do you believe sustainable investing funds generally perform better,
the same or worse than the market average?
Investors' reports that they have money invested in sustainable
investing funds remain similar to last year, with 9% now, compared with an
average 12% in 2020, saying they do. Roughly half (48%) say they do not have
any money invested in such funds, while 43% are unsure. Bottom Line Sustainable investing has become increasingly relevant in the
investing community writ large as the call for companies to disclose metrics
allowing investors to evaluate their environmental, social and corporate
governance performance has intensified. Investments with a sustainable
investment component are also multiplying. For instance, according to
nasdaq.com, "ESG-integrated strategies assets under management"
listed on that exchange grew 34% between 2018 and 2020. Despite its growing importance in the capital markets, news about
sustainable investing or ESG funds has not trickled down to average U.S.
investors. And with the pandemic perhaps shifting investors' economic
priorities, they are expressing less interest in such funds for themselves. Still,
the future of sustainable investing looks promising, with younger investors
paying closer attention to it and expressing greater interest than older
working-age investors and retirees. (Gallup) AUGUST 23, 2021 Source: https://news.gallup.com/poll/353879/investor-familiarity-sustainable-investing-remains-low.aspx 705-43-13/Polls About Four-In-Ten Americans Say Social Media Is An Important Way Of
Following Covid-19 Vaccine News
Amid debates about the role social media has played in the spread
of misinformation
related to COVID-19 vaccines, roughly half of Americans say that they
have been getting some (30%) or a lot (18%) of news and information about
these vaccines on social media. The other half (51%) say they have been
getting not much news or none at all this way, according to a new Pew
Research Center survey conducted July 26-Aug. 8, 2021. How we did this
While about half of U.S. adults get some or a lot of vaccine news on
social media, just 6% find it the most important way, and 33% say it’s
important but not the most important way. For the majority of Americans
(60%), social media is not an important way to keep up with COVID-19
vaccine news. This includes the 31% who don’t get any vaccine information
on social media at all. The share of Americans who say social media is an important source of
COVID-19 vaccine news increases among those who regularly go to social media
platforms for news. Among the 53% of Americans who say they regularly get news from at
least one of the 10 social media sites asked about, close to three-quarters
say they have gotten a lot (30%) or some (43%) news and information about
COVID-19 vaccines on social media. And about six-in-ten of this group (61%)
say that social media is an important way of keeping up with news about
COVID-19 vaccines, though just 11% say it is the most important way.
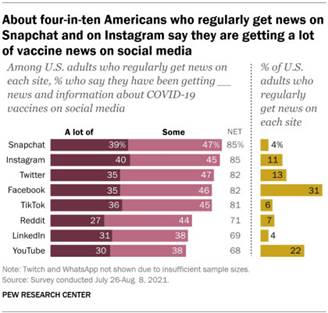
Looking at individual social media sites, the vast majority of
Americans who regularly get news from each site get at least some vaccine-related
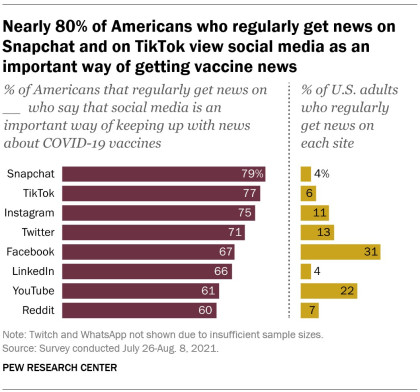
news on social media, and many get a lot. About four-in-ten Americans who
regularly get news on Snapchat (39%) and Instagram (40%) say they have been
getting a lot of vaccine-related news and information on social media. The
same is true of about a third of Americans who regularly get news on Twitter,
on Facebook and on TikTok. Closer to three-in-ten of those who regularly get
news on LinkedIn, on YouTube and on Reddit say they are getting a lot of news
about COVID-19 vaccines on social media. For two of the sites asked about –
WhatsApp and Twitch – not enough Americans rely on them for news to be able
to analyze their responses to these questions individually.
Three-quarters or more of Americans who regularly turn to Snapchat
(79%), TikTok (77%) and Instagram (75%) for news say social media is an
important way of keeping up with COVID-19 vaccine news. All in all, 60% or
more of Americans who regularly get news from each of the eight sites
individually analyzed say social media is an important way of keeping up with
this news. The ultimate reach of COVID-19 vaccine information on social media is
also impacted by the share of Americans who use each site for news. For
example, while 31% of Americans say they turn to Facebook for news, just 4%
turn to Snapchat for news. Demographically, younger Americans and women are more likely than
older Americans and men, respectively, to get COVID-19 vaccine news and
information on social media and to say it’s an important way for them to get
this type of news, but much of that is tied to the fact that these
individuals are more likely to use social media for news in the first place. (PEW) AUGUST 24, 2021 705-43-14/Polls Six-In-Ten U S Adults Say They Would Prefer To Live In A Community
With Larger Homes With Greater Distances To Retail Stores And Schools
Americans today are more likely than they were in the fall of 2019 to
express a preference for living in a community where “houses are larger and
farther apart, but schools, stores and restaurants are several miles away,”
according to a Pew Research Center survey conducted July 8-18, 2021.
There has been a corresponding drop in the share saying they would
prefer to live somewhere with smaller houses that are “closer to each other,
but schools, stores and restaurants are within walking distance.” This shift has occurred during the coronavirus
outbreak and the accompanying period of telework, remote schooling
and pandemic-related restrictions on indoor dining and other indoor
activities. Today, six-in-ten U.S. adults say they would prefer to live in a
community with larger homes with greater distances to retail stores and
schools (up 7 percentage points since 2019), while 39% say they prefer a
community with smaller houses that are closer together with schools, stores
and restaurants within walking distance (down 8 points since 2019). Preferences for communities where houses are larger and farther from
retail shops, dining and schools has increased across partisan, age,
educational and racial and ethnic groups.
As in the past, Republicans and Republican-leaning independents are
more likely than Democrats and Democratic leaners to say they want to live in
a community with larger houses even if there are greater distances to
schools, shops and restaurants. Today, 73% of Republicans say this, up from
65% in September 2019. About half of Democrats (49%) now say they would
prefer to live in a more widely spaced community, up from 42%. In 2019, a 58%
majority of Democrats expressed a preference for communities with smaller
houses and greater proximity to schools and amenities. While communities with larger houses have generally become more
appealing to Americans over the past two years, preferences continue to vary
among demographic groups.
About three-quarters of Americans who describe their own communities
as rural (74%) say they would prefer to live in places where houses are
larger and farther apart. A narrower majority of suburban Americans (59%)
also say they prefer places with larger houses. Americans in urban
communities are about evenly split: 49% say they would prefer a community
with larger houses that are farther from schools, stores and restaurants,
while 50% say they would prefer a community with smaller houses, closer to
schools, stores and restaurants. Majorities of White (63%), Black (60%) and Hispanic adults (56%) say
they would prefer communities that are more spread out. By comparison,
roughly six-in-ten Asian American adults (58%) say they would prefer to live
in communities with smaller houses that are closer together, with greater
proximity to schools, stores and restaurants. While majorities of those in all age groups express a preference for
communities that are more widely spaced, those between the ages of 30 and 64
(64%) are more likely than either those under 30 (55%) or those ages 65 and
older (55%) to say this. Americans with a college degree – particularly those with
postgraduate degrees – are less likely than those with less formal education
to express a preference for communities with larger houses that are farther
apart. More than six-in-ten of those with some college experience or less
education (64%) say they prefer living in communities that are more spread
out, compared with 56% of those with a bachelor’s degree and 49% of those
with a postgraduate degree. About three-quarters of conservative Republicans (77%) say they prefer
communities with larger houses, as do 67% of moderate and liberal
Republicans. A narrower majority of conservative and moderate Democrats also
say they prefer larger houses, even if farther from schools, stores and
restaurants (55%). By comparison, nearly six-in-ten liberal Democrats (57%)
express a preference for smaller houses in places where they could walk to
schools, stores and restaurants. Among urban, suburban and rural residents, Republicans are much more
likely than Democrats to say they want to live in communities where houses
are larger and more spread apart.
While about eight-in-ten rural Republicans (83%) say they prefer more
spread out communities, a narrower majority of rural Democrats (60%) say the
same. Among those who live in urban communities, 63% of Republicans say they
would prefer to live somewhere where homes are large, far apart and require
driving to other parts of the community; a smaller share of Democrats (42%)
express this preference. (PEW) AUGUST 26, 2021 705-43-15/Polls 62% Of Americans Say The War In Afghanistan Was Not Worth Fighting
Public opinion relating to the U.S. and Afghanistan can be divided
into four categories: (1) Americans' basic assessments of the 20-year U.S.
military involvement in Afghanistan, (2) Americans' views of the decision to
completely withdraw U.S. troops at this point, (3) Americans' views of the
way in which the withdrawal was handled and (4) the longer-term political
impact. U.S. Involvement Retrospective approval of U.S. involvement in Afghanistan is at or
below the majority level and appears to be getting more negative as time goes
on. Americans at this point have significant doubts about the country's
20-year military involvement in Afghanistan -- the longest war in U.S.
history, estimated to have cost over $2 trillion and almost 200,000 total
deaths. Gallup's July 6-21 update of
a trend question asking if the U.S. made a mistake sending military troops to
Afghanistan found 47% saying yes and 46% saying no. This "mistake"
percentage is as high as at any time since just after troops were first sent
to Afghanistan in November 2001, with the exception of one 49% reading in
February 2014. The most recent Gallup poll was completed prior to much of the news
coverage of the speed with which the Taliban regained control of Afghanistan.
More recent polling (but conducted before the massive Aug. 26 explosion that
killed U.S. service members and many civilians) generally shows a majority
negative assessment of U.S. involvement in Afghanistan. These include an NBC
News poll conducted Aug. 14-17 showing that 61% of Americans say the
Afghanistan War was not worth it -- "When
it comes to Afghanistan, do you think the war was worth it or not worth
it?" -- and an AP-NORC poll from Aug. 12-16 finding that
62% of Americans say the war in Afghanistan was not worth fighting. The Decision to Withdraw U.S. Troops President Joe Biden announced his decision on April 14 to withdraw
all U.S. troops from Afghanistan. As we would expect given the underlying
negative views of U.S. involvement in Afghanistan, surveys thereafter showed
significant public support for Biden's decision. An Ipsos survey conducted
April 16-18 found 50% supported the idea of the U.S. bringing home "all
of its troops from Afghanistan immediately," while 27% opposed. The 2021
Chicago Council Survey, conducted July 7-26, found 70% support for the
decision to withdraw U.S. troops from Afghanistan by Sept. 11. A Quinnipiac
poll in May found 62% support. A Fox News poll conducted after the April
announcement gave respondents two options -- removing all troops or leaving
some U.S. troops in Afghanistan for counterterrorism operations -- and found
50% opted for the latter choice, while 37% said that all troops should be
removed. More recently, even as reports of the Taliban takeover began to
dominate the news, Americans appeared to be sticking to their support for the
U.S. getting out of Afghanistan. A CBS News poll from Aug. 18-20 found 63%
approval of the U.S. removing troops from Afghanistan. A Morning Consult/Politico poll found somewhat more
muted support in its Aug. 16-19 poll among registered voters, with 53%
supporting and 36% opposing the decision. The wording of that poll -- "As you may know, United States President Joe
Biden announced the start of a withdrawal of U.S. military presence in
Afghanistan beginning May 1, with all troops returning home by Sept. 11,
2021. Based on what you know, do you support or oppose President Biden's
decision?" -- explicitly mentioned Biden, which may help
explain the lower level of support compared with the CBS News survey, which
did not mention the president. Several commentators have noted a particularly loaded wording in
another question included in Morning Consult/Politico polling: "Do you believe the U.S. should still
withdraw its military presence in Afghanistan if it means it creates an
opening for al Qaeda and other terrorist groups to establish operations in
Afghanistan?" Even with this "directed verdict question," 45% of
Americans agreed that troops should be withdrawn, compared with 40% who said
they should not. This is taken, I think correctly, as an indicator of the
degree to which the public is behind the withdrawal. The Fox News poll from
April, however, suggests there may have been at least some public support for
a more limited withdrawal had Biden articulated that as an option. Assessment of the Way the Withdrawal Has
Been Handled Given that the majority of Americans believe the time has come for
the U.S. to get out of its military involvement in Afghanistan, I think it is
fair to conclude that Biden has -- in concept -- been carrying out the broad
will of the American public. Support for the idea of U.S. disinvolvement in Afghanistan is,
however, separate from views on how well such withdrawal has been conducted.
Recent surveys show the majority of Americans believe the whole process has
been handled poorly, and Biden himself receives low marks for his handling of
the situation. In short, perceptions of the competence and execution of the
actions in Afghanistan are much more negative than perceptions of the
objective or intent of the actions. Several recent polls support this conclusion. The NBC News poll shows
25% of Americans approve of the way Biden is handling the Afghanistan
situation. The CBS News poll finds 74% say the removal of the troops has been
handled badly by the U.S. and 67% say that Biden did not have a clear plan
for evacuating American civilians. An Aug. 13-16 Morning Consult/Politico poll shows that 31% of
registered voters approve of Biden's handling of Afghanistan, while 57% say
(at the time of the poll) that the withdrawal is not going well. And
the USA Today/Suffolk poll
shows a 27% approval rating for Biden's handling of Afghanistan. Long-Term Impact The only really accurate way to assess the long-term impact of any
specific event is to wait for the long term and see what happens. But this
evident fact of life doesn't prevent us from looking at data-driven
possibilities. One of the most frequent focal points for consideration of the
long-term impact of what we are witnessing in Afghanistan concerns Biden and
the Democrats. The president's overall approval rating appears to be edging
down, measured by Gallup's Aug. 2-17 poll at
49% -- by one percentage point, the lowest of his administration. And, as my
colleague Jeff Jones noted, "Interviews conducted in the last three days
of the poll's field period, after Kabul fell, showed slightly less positive
ratings for Biden than those conducted earlier." Other polls show similar declines, and one -- conducted Aug. 19-23 by
Suffolk University for USA Today --
shows Biden's approval rating dropping all the way to 41%, which is either an
outlier or a portent of further drops to come (no other poll has measured
Biden's approval nearly that low). But, as is usually the case, it is difficult to disentangle the exact
causes for presidential approval movement. Recent data show there is much
more on Americans' minds than Afghanistan, suggesting caution in ascribing
changes in Biden's approval rating to any one factor. Gallup's Aug.
2-17 update,
for example, shows that less than 1% of Americans mention the situation in
Afghanistan as the most important problem facing the U.S. today, while
COVID-19 has increased significantly as the perceived top problem, followed
by mentions of the government, immigration and the economy. The NBC News poll
similarly shows no significant mention of Afghanistan when respondents are
asked to name the most important issue facing the country. The images coming out of Kabul and elsewhere in Afghanistan bring
back memories of the dramatic fall of Saigon at the end of April 1975, as the
North Vietnamese surged south and took control of the city. Gerald Ford was
president at that time, although the last combat troops had left Vietnam in
the spring of 1973, with Richard Nixon in the White House. A review of Gallup polling in 1975 finds little evidence that the
takeover of the country and the dramatic evacuations from South Vietnam had a
direct effect on Ford's approval rating. A Gallup retrospective published
when Ford died in 2006 showed his previously anemic ratings appeared to have
improved significantly in the weeks after the fall of Saigon, but this most
likely reflected the United States' handling of the capture of the SS Mayaguez by Cambodian Khmer
Rouge rebels. Americans' views of the most important problem facing the
nation after April 1975 -- as is the case now -- show very little mention of
any international issues. Most Americans' concerns in 1975 were focused on
domestic issues, including rampant inflation and a poor economy. In short,
the dramatic events taking place overseas in Vietnam in 1975, even if they
should have been anticipated by American leaders, didn't seem to have had
much of a direct impact on Americans' views of either the president or the
most important problem facing the nation. (Gallup polling showed that by the
late 1960s, a majority of Americans thought U.S. involvement in Vietnam had
been a mistake.) Bottom Line Americans believe Biden did the right thing in withdrawing U.S. troops
from Afghanistan. Americans are as likely to view the whole 20-year
experience in that country as a mistake as to say it was not, while recent
polling shows the majority say involvement there was not worth it. But the
extremely rapid movement of the Taliban to wrest back control of the country
has left Americans with the perception that the withdrawal has not been
handled well. Biden is given low marks for his handling of the situation,
although -- despite commentary to the contrary -- it is too early to know
what the long-term impact will be for Biden or for Democratic performance in
next year's midterm elections. It is always possible that the events taking
place now could result in a counterintuitive rally
effect of sorts. At this point in history, Americans' concerns about Afghanistan are
competing for attention with other issues, particularly COVID. It is possible
that new events in Afghanistan in the weeks and months ahead could shift
Americans' attention and result in different views of the situation along
with changes in attitudes about the wisdom of the U.S. decision to withdraw
all troops. (Gallup) AUGUST 27, 2021 705-43-16/Polls Half (51%) Insist We Must Balance Economic Considerations With
Environmental Concerns
Toronto, ON, August 25, 2021 — With
2021 seeing record-setting heat waves afflicting Canadians from coast to
coast and one of the worst wildfire seasons in recent memory, Canadians
indicate climate change is one of their Top
5 issues in the 44th Federal Election. While
agreement is strong that something needs
to be done about climate change (77% agree Canada needs to do more than it
is, -1 pt from 2019), the question of what
should be done remains unclear, especially since half (51% -5
pts from 2019) believe we need to balance economic considerations with
environmental efforts. The remaining half of Canadians are divided: 35% (+4 pts from 2019)
believe we need to do everything we can to fight climate change immediately,
even if the economy slows as a result, while 13% (+1 pt from 2019) feel there
is no urgency to fight climate change if it comes at the expense of our
economy. While there is little variation by gender or generation, these
attitudes largely map according to political parties supported:
Conservative voters are significantly more likely than all other major party
supporters to agree that there needs to be a balance between the economy and
environment (67% vs 48% Lib, 42% NDP, 41% Bloc, 38% Green), or that there can
be no urgency to fight climate change if it comes at the expense of the
economy (19% vs. 13% Bloc, 7% NDP, 6% Lib, 3% Green). Conversely, Green party
voters favour combating climate change even if the economy slows (60% vs. 51%
NDP, 47% Lib, 47% Bloc, 14% Cons). However, even among the Greens, for whom
climate action is a pillar, support is not unanimous: four in ten (38%) agree
there needs to be a balance of economy and environment in fighting climate
change. Extreme weather making climate change clear
for many The recent extreme weather appears to be increasing concerns about
climate change. More than eight in ten (84%) Canadians agree that extreme
weather (like extended heat warnings, drought and wildfires) is more of a
concern for them now than it was five years ago, perhaps a result of two
thirds (66%) of Canadians saying they have been directly impacted by extreme
weather. Canadians seem to be more concerned
about climate change because of
extreme weather (77%), while eight in ten (81%) feel that government should
do more to support people impacted by extreme weather. Given the record-breaking heat waves experienced this year on the
West coast, residents of British Columbia are significantly more likely to
agree with all the above statements, closely followed by residents of Quebec,
who were battling a heat wave at the time they were surveyed. Respondents
from these regions were more likely to agree that:
We should do something to fight climate
change, but what? While the data show that extreme weather appears to have made climate
change more personal for many, how to combat climate change remains unclear.
Three quarters (74%, +1 pt since 2019) agree that Canada has an obligation to
lead on climate change globally. A majority of voters for all political
parties except the People’s Party agree with this statement (92% BQ, 85% Lib,
83% NDP, 81% Green, 58% Cons, 15% PPC), indicating this will need to be a
mandate for the next prime minister. Statements that downplay the impact of climate change or Canada’s
ability to combat it see relatively low agreement, although there is some
shifting since the last election:
However, some pessimism is evident as half (49%, +8 pts from 2019)
agree that no matter how hard we try, we won't be able to significantly
reduce carbon emissions over the next decade and six in ten (58%, +4 pts from
2019) say that in order to combat climate change, the solutions will cause
economic hardship in Canada. That said, a majority (74%, -7 pts from 2019) of Canadians agree they
would be more supportive of a carbon tax if they knew the money collected was
going directly to initiatives to combat climate change, suggesting this may
be an avenue of interest for whomever occupies the Prime Minister’s Office
after this election. (Ipsos Canada) 26 August 2021 Source: https://www.ipsos.com/en-ca/news-polls/canadians-agree-we-need-to-do-more-on-climate 705-43-17/Polls Singh Emerges As Most Likeable Leader(With Net Rating Of +6); Negative Perceptions Highest For
Trudeau
Toronto, ON, Aug 26, 2021 — While
his party is firmly in third place, NDP leader Jagmeet Singh has emerged as
the leader with the highest favourability ratings, according to a new Ipsos
poll conducted for Global News. This is clearly good news for the NDP, given
that earlier Ipsos polling revealed that many voters were not yet certain of
their vote choice, and the NDP is far and away the second choice of voters
overall.
Examining the challenges and/or opportunities for each leader:
These data can also give clues about how enthusiastic voters of each
party are about their leader, which could impact voter turnout for each party
in the advance polls or on E-day. Currently, 93% of Liberal voters have a
favourable view of Prime Minister Justin Trudeau, and 92% of NDP voters are
favourable towards Jagmeet Singh. Nine in ten Bloc voters (89%) are also
favourable towards Yves-François Blanchet. However, it is a completely different story for Erin O’Toole: only
69% of current Conservative voters are favourable towards O’Toole, while two
in ten (18%) are unfavourable towards the leader. One in ten (13%) say they
still don’t know enough about him to say either way. This clearly poses a
risk the Tory leader and suggests that his grasp on the Tory vote is
presently tenuous. This could explain why previous Ipsos polling failed to
point to a potential ballot-box bonus for the Conservatives. If they’re not
enthusiastic about their leader, they may be more reluctant to actually show
up and cast their ballot for his party. Annamie Paul is also struggling, with only 54% of current Green
voters saying they have a favourable assessment of her, 22% are unfavourable
and 24% are unsure. (Ipsos Canada) 27 August 2021 Source: https://www.ipsos.com/en-ca/news-polls/singh-emerges-as-most-likeable-leader 705-43-18/Polls A Third (33%) Of Canadians Believe The Next Federal Government Should
Focus On Balancing The Budget
Toronto, ON, August 28, 2021 — The
federal election will be a key test for what Canadians would like to see in a
post-COVID-19 economic plan. At the moment there appears to be no clear
consensus among Canadians about what the priority should be for balancing the
budget, lowering taxes, or investing in government programs. A third (33%, +2) of Canadians believe the next federal government
should focus on balancing the budget, even if it means spending cuts or tax
increases. This opinion is more pronounced among men (37% vs 29% for women).
Regionally, there does not appear to be any significant differences, however,
Alberta and Quebec are directionally more
likely to believe the next federal government should focus on
balancing the budget (35% Alberta, 35% Quebec, 33% Ontario, 31% SK/MB 29% BC,
29% Atlantic). As well, those with a household income of $60-$100k are more
likely to believe balancing the budget should be the focus compared to the
other household income levels (39% $60-$100k vs 36% $100k+, 31% <$40k, 27%
$40k-$60k). Both Bloc Quebecois and Conservative party voters are more likely to
believe the next federal government should focus on the budget than voters
supporting other parties (47% BC, 46% Cons, 34% Green, 27% Libs, 23% NDP). Given the economic strain COVID-19 has put on Canadians, it is no
surprise that over a third (37%, +1) of Canadians believe lowering taxes,
even if it means continued budget deficits and spending cuts, should be the
focus for the next federal government. This belief decreases with an increase
in higher education (56% <HS vs 41% HS, 36% Post Sec, 23% Univ Grad).
Similarly, to balancing the budget, Conservative party voters are more likely
to believe that this should be the focus of the next federal government (40%
Cons vs 32% BC, 31% Libs, 30% NDP, 19% Green). The remaining third (30%, -3) believe the next federal government
should focus on investing in government programs, even if it means no tax
cuts or continued budget deficits. In contrast to balancing the budget, women
are more likely to believe the federal government should invest in government
programs compared to men (33% women vs 27% men). The younger and older cohort are directionally more likely to agree that the next
federal government should focus on investing in government programs compared
to the 35-54 age group (33% 18-34, 26% 35-54, 32% 55+). This is likely a
result of increased expenses the two cohorts face, whether that is
post-secondary fees and the rental market, or health-care cost and retirement
plans. Green, NDP, and Liberal voters are more likely to say they believe
the focus should be investing in government programs, with Conservative
voters the least likely to agree (47% Green, 46% NDP, 42% Libs, 21% BQ, 14%
Cons). University graduates are more likely to believe the federal
government should invest in government programs (41% vs 29% post sec, 27% HS,
23% <HS). Notably, there is a higher proportion of university graduates
who believe that the federal government should invest in government programs,
compared to balancing the budget or lowering taxes. Agreement about voting, by Stated Vote
Intention
(Ipsos Canada) 28 August 2021 AUSTRALIA
705-43-19/Polls More than 20 million Australians continue to read news
The first release of Total News readership shows news is holding
strong with 20.4 million Australians consuming news in a four-week period, an
increase of 1 per cent compared to the same period last year.
ThinkNewsBrands General Manager Vanessa Lyons said: “With all of us
feeling the impact of the ongoing Covid health crisis, trusted, timely news
has never been more important. This is very clearly reflected in the first
release of Total News readership figures which shows news maintaining robust
audiences.” “This is a great step forward for the industry with news now
displayed as a stand-alone media channel inside Asteroid, the most used
planning software. This enables media planners to easily assess the reach of
news relative to other channels.” (Roy Morgan) August 23 2021 705-43-20/Polls Support For New Zealand’s Labour/Greens
Government Increased 2% Points To 51.5% In August
The governing parties are now 11% points
ahead of the Parliamentary opposition National/Act NZ/ Maori Party on 40.5%,
down 4% points since July. The drop was due to a loss in support for National
which was down 4% points to 25%, the lowest since March. Support for Act NZ
was unchanged at a record high of 13% while support for the Maori Party was
unchanged at 2.5%. A small minority of 8% of electors support
other minor parties outside Parliament with support for The Opportunities
Party down 1% point to 2% and support for NZ First up 0.5% points to 2.5% in
August. This latest New Zealand Roy Morgan Poll on
voting intention was conducted by telephone – both landline and mobile – with
a New Zealand-wide cross-section of 940 electors during August. Electors were
asked: “If a New Zealand Election were
held today which party would receive your party vote?” Of all
electors surveyed a larger than usual 7%, up 2.5% points, didn’t name a party. New Zealand Government Confidence Rating
drops 6pts to pandemic low of 115 in August The Roy Morgan Government Confidence Rating
dropped by 6pts in August to 115 – the lowest it has been since Jacinda
Ardern became Prime Minister in October 2017 nearly four years ago. In August a slim majority of 52.5% (down 3%
points) of New Zealand electors said New Zealand was ‘heading in the right
direction’ compared to over a third, 37.5% (up 3% points) who said New
Zealand was ‘heading in the wrong direction’ – the highest figure for this
indicator since Prime Minister Jacinda Ardern came to power in October 2017. The latest monthly ANZ-Roy Morgan Consumer Confidence Rating
was down by 3.5pts to 109.6 in August but is still well above the corresponding Consumer Confidence figure in Australia of
101.6 on August 21/22, 2021 as
that country battles extensive outbreaks of COVID-19 in Sydney and Melbourne. Massive ‘Gender gap’ as Women favour
Labour-Greens and men favour National-Act NZ Prime Minister Jacinda Ardern’s strength
lies with the massive edge in support that the Labour Party receives from
women. A large majority of 60.5% of women support either Labour (48%) or the
Greens (12.5%) compared to only 42.5% of men supporting either Labour (31%)
or the Greens (11.5%) – a massive ‘gender gap’ of 17% points in favour of
Ardern’s Labour Party among women. Men are more likely to support the
Parliamentary opposition with a large plurality of 47.5% supporting either
National (28%), Act NZ (17.5%) or the Maori Party (2%) compared to only a
third, 33%, of Women supporting either National (21.5%), Act NZ (8.5%) or the
Maori Party (3%). Roy Morgan Government Confidence Rating is
120 for Women compared to 109.5 for men The trends are confirmed by the latest Roy
Morgan Government Confidence figures which show 53% of women say New Zealand
is ‘heading in the right direction’ compared to 51.5% of men but only 33% of
women say New Zealand is ‘heading in the wrong direction’ compared to 42% of
men. Overall, this produces a Roy Morgan
Government Confidence Rating of 120 for women compared to only 109.5 for men
– a gap of 10.5 points. Party vote analysis by Gender
*The Roy Morgan Government Confidence
Rating is 100 plus the difference between the percentage of Kiwis who say the
country is “heading in the right direction” and the percentage who say the
country is “seriously heading in the wrong direction”. “Today’s Roy Morgan New Zealand Poll shows
the Labour-led Government has the support of 51.5% of New Zealand electors in
August, up 2% points from July. Although Labour Party support is unchanged at
39.5%, support for the Greens is up 2% points to 12% in August. “Support for the Parliamentary Opposition
was down by 4% points to 40.5% in August with the main Opposition National
losing 4% points to 25%. Support for Act NZ is unchanged at a record high 13%
with the Maori Party again on 2.5%. “The slow pace of New Zealand’s vaccine
rollout ran into the highly contagious Delta variant of COVID-19 in
mid-August and in response to an outbreak in Auckland the entire country was
forced into a nation-wide lockdown on August 17. “The size of the latest outbreak is growing
and with over 200 active cases the current lockdown is set to continue well
into September. The experience across the Tasman in both Sydney and Melbourne
shows that stopping the spread of this latest variant is proving far harder
than for the earlier variants. “Although the results for August show the
current outbreak has yet to hurt the Government’s political standing the
longer it continues the questions about the slow-rate of the vaccination
rollout will mount. “The first impact from the slow vaccination
rollout and resultant nation-wide lockdown can be seen in the fourth straight
monthly decline in the Roy Morgan Government Confidence Rating, down 6pts to
115. Roy Morgan Government Confidence has now dropped by a significant
38.5pts since December 2020 while the latest ANZ-Roy
Morgan Consumer Confidence is down 3.5pts to 109.6 in August –
its lowest since November 2020. “An enduring feature of the latest results
is the continuing ‘gender gap’ between the two sides of politics. Women’s
support for the Labour-Greens government remains strong with a majority of
60.5% supporting either Labour (48%) or the Greens (12.5%) compared to only
42.5% of men who support either Labour (31%) or the Greens (11.5%). “In contrast, a plurality of men support
the Parliamentary Opposition (47.5%) with well over a quarter supporting
National (28%) and nearly one-in-five supporting either Act NZ (17.5%) or the
Maori Party (2%). “Overall, the ‘gender gaps’ are currently
working in favour of Prime Minister Jacinda Ardern. The Labour-Greens
government enjoys an 18% ‘gender gap’ in their favour amongst Women whereas
the ‘gender gap’ in favour of National-Act NZ amongst men is a smaller 15.5%. “The course of the current outbreak in
Auckland will have a big impact on the economy as long as New Zealand’s
largest city remains locked down. The political implications are less clear
but the longer the lockdown continues the more questions will be raised about
the Government’s handling of the vaccine rollout and their strategy for
dealing with so-called ‘COVID-normal’ when vaccination targets are met later
this year.” New Zealand Party Vote: 2020-21 New Zealand Party Vote: NZ Govt. v
Parliamentary Opposition
Source: Roy Morgan New Zealand Single Source. January 2020
– August 2021. Base: New
Zealand electors aged 18+. Average interviews per month = 928. Roy Morgan NZ Government Confidence Rating
vs. ANZ-Roy Morgan NZ Consumer Confidence
Voting Intention Summary The following table compares the latest New
Zealand Roy Morgan Polls on Voting Intention with the result from the
September 23, 2017 General Election:
*The 1996 Election was the first New
Zealand Election contested via MMP (Mixed Member Proportional). At the 1996
Election the Greens Party contested as part of the “Alliance” political
grouping with four other political parties. Two-Party Preferred: Labour Party-led
Government vs. Parliamentary Opposition Parties
*At the 2020 NZ Election the Labour party
secured 50.01% of the vote which was enough to govern in their own right but
Labour opted to sign a ‘Cooperation Agreement’ with the Greens, who won 7.86%
of the vote. There were three Parties elected to Parliament not in Government
led by National (25.58%), Act NZ (7.59%) and the Maori Party (1.17%). (Roy Morgan) August 27 2021 Source: https://www.roymorgan.com/findings/8789-nz-national-voting-intention-august-2021-202108270635 MULTICOUNTRY STUDIES
705-43-21/Polls Only 48% Agree That Globalization Is A Good Thing For Their Country
In our recent survey across 25 countries, most adults agree that
expanding trade is a good thing. Yet in most countries, more agree than
disagree that there should be more trade barriers to limit imports of foreign
goods and services. The survey findings uncover a mix of polarization and ambivalence
among the public throughout the world about free trade, globalization, and
protectionist policies. On average, only 48% agree that globalization is a
good thing for their country. This is 10 percentage points less than in 2019,
before the COVID-19 pandemic. While favorability toward globalization is down
in all countries, it continues to vary widely among them, ranging from 72% in
Malaysia to 27% in France. When asked whether globalization hinders the democratic process in
their country or the implementation of effective economic policies by their
national government, opinions also differ greatly across countries. However,
many provide neutral responses, signaling uncertainty about the issue. Although views on globalization are mixed, few disagree that
investment by global companies in their country is essential for its growth
and expansion. Support for expanding trade - but
with protectionist measures Majorities in all 25 countries surveyed agree that expanding trade is
a good thing, averaging at 75%. Only 5% disagree.
However, an average of 37% agrees there should be more trade barriers
to limit imports of foreign goods and services in their country vs. 27% who
disagree. About one-third (36%) are neutral or don’t have an opinion.
Mixed and declining sentiment toward
globalization An average of 48% globally agrees that globalization is a good thing
for their country while just 13% disagree and the rest are neutral or unsure.
In every one of the 23 countries where Ipsos had already asked the
same question in 2019, fewer agree that globalization is a good thing for
their country than they did then.
Public opinion across the world is divided on whether globalization
prevents national governments from implementing effective economic policies
or the proper functioning of democracy.
Majority support for foreign investment An average of 63% globally agrees that investment by global companies
in their country is essential for their growth and expansion while just 9%
disagree and the rest are neutral or not sure.
(Ipsos Denmark) 23 August 2021 Source: https://www.ipsos.com/en-dk/ambivalence-characterizes-attitudes-globalization-and-trade 705-43-22/Polls Angela Merkel’s Legacy, According To Europeans And Americans
Angela Merkel, the German Chancellor, is set to step down in late
September at the 2021 federal elections. She has led the country since 2005 –
a period that has seen France and America go through four presidents, the
coming and going of five British prime ministers, and as many as eight prime
ministers in Italy. On the eve of her departure, YouGov has looked at Merkel’s reputation
in key European nations and the US, and what people make of her legacy. Merkel is well-regarded abroad Merkel receives positive net ratings in all six countries surveyed,
from a ‘low’ of +15 in Britain to a high of +61 in Spain. In her native
Germany she scores +30. The French public score Merkel +49, and in Italy she receives a
rating of +23. In Nordic nations Sweden and Denmark the
chancellor receives net scores of +47 and +64, respectively. Only US president Joe Biden performs comparably well in European
public opinion, although the president has only been in post for half a year
(and doubtless still benefits from simply being ‘not Donald Trump’). Please
note also that the surveys in Europe were conducted in July, prior to
the Afghanistan crisis. Angela Merkel will be remembered most for
her economic success and improving Germany’s image abroad People are most impressed with Merkel’s stewardship of the German
economy, which has grown 17% since 2005. Her performance in this area, among
people in each country who know who she is, ranges from +21 in the United
States to +76 in Spain. Merkel also receives very high marks for improving Germany’s
reputation abroad – the aspect Germans themselves are most likely to say she
has done well (+47). Her handling of German society, climate change, the general direction
taken by the EU, and her response to the coronavirus crisis also tend to get favourable
reviews. People are much less sure that she handled other issues well. Britons
especially tend to think Merkel didn’t do well with Brexit (-17), with the
Italians (-2), French (+1) and Americans (+1) split. Germans themselves tend
to take a slightly more positive view (+7). When it comes to her management of the Greek bailout and the European
immigration crisis, in all countries except Spain people give her net
negative ratings for her performance. Italians in particular are very
negative about her role in the immigration crisis (-29). Where does Merkel rank among the world’s
most powerful? During the presidency of Donald Trump, some claimed that Angela
Merkel had become the leader
of the free world. Forbes magazine ranked Merkel the second
most powerful person in the world twice, in 2012 and 2015, but where
do Europeans and Americans place her? Most people in Germany, France, Spain and Italy who have heard of the
German leader rank her among the five most powerful global figures – in these
first three countries people are most likely to place her third,
specifically. This figure is slightly lower in the Nordic countries, at 45% in
Sweden and 49% in Denmark. It is lowest in the US and UK: only about a third
of Britons (31%) and Americans (36%) give Merkel a top five rating, although
people in these countries are also more likely to say don’t know where to
rank her (32-34% compared to 11-22% elsewhere). (YouGov Germany) August 26, 2021 Source: https://yougov.dk/news/2021/08/26/angela-merkels-legacy-according-europeans-and-amer/ 705-43-23/Polls 25 Percent Of Respondents Have Found It Harder To Pay Their Rent
COVID-19 has literally hit parts of the global public where they live. Some
have lost their jobs, others have lost their income - all of which are
potentially difficult factors in paying rent or mortgages. Global YouGov data shows that 25 percent of respondents in the 17
markets youGov studied have found it harder to pay their rent. Only 7
percent of all respondents say that it has become easier for
them. Indians (44 percent), Indonesians, and people in the United Arab
Emirates (42 percent each) were most likely to report having more difficulty
paying their rent or mortgage. However, respondents from these three
countries also say more often than most of the other respondents that it has
become easier for them (UAE 19 percent, India 15 percent; Indonesia 14
percent). Proportion of those for whom it makes no
difference is not insignificant Accordingly, respondents in the above-mentioned countries say less
than others that the crisis made no difference to them in this context
(Indians: 19 percent; Indonesians: 25 percent and respondents in the United
Arab Emirates: 28 percent). For Europeans, the crisis is least likely
to be a problem in terms of housing costs Among European consumers, those surveyed are the least likely to say
that they have had greater difficulties paying their housing costs since the
Corona crisis - 17 percent of Germans, 13 percent of British, 12 percent of
Swedes and 10 percent of Danes have felt this burden. But there are also
exceptions in Europe: In Spain, almost three in ten consumers (28 percent)
say that it has become more difficult for them to pay for their roof over
their heads, among Italians the proportion is almost as high (27 percent) . Most often, however, Europeans state that the crisis made no
difference to them (Denmark: 76 percent, Sweden: 73 percent, Germany: 66
percent, Great Britain: 55 percent). (YouGov Germany) August 27, 2021 Source: https://yougov.de/news/2021/08/27/wohnkosten-der-corona-krise-fur-ein-viertel-der-me/ |
||||||||||||||||||||||||||||||||||||||||||||||||||||||||||||||||||||||||||||||||||||||||||||||||||||||||||||||||||||||||||||||||||||||||||||||||||||||||||||||||||||||||||||||||||||||||||||||||||||||||||||||||||||||||||||||||||||||||||||||||||||||||||||||||||||||||||||||||||||||||||||||||||||||||||||||||||||||||||||||||||||||||||||||||||||||||||||||||||||||||||||||||||||||||||||||||||||||||||||||||||||||||||||||||||||||||||||||||||||||||||||||||||||||||||||||||||||||||||||||||||||||||||||||||||||||||||||||||||||||||||||||||||||||||||||||||||||||||||||||||||||||||||||||||||||||||||||||||||||||||||||||||||||||||||||||||||||||||||||||||||||||||||||||||||||||||||||||||||||||||||||||||||||||||||||||||||||||||||||||||||||||||||||||||||||||||||||||||||||||||||||||||||||||||||||||||||||||||||||||||||||||||||||||||||||||