|
BUSINESS & POLITICS IN THE WORLD GLOBAL OPINION REPORT NO. 706 Week:
August 30 –September 05, 2021 Presentation:
September 10, 2021 76%
Pakistanis Agree That The Government Of Pakistan Is Controlling The Covid-19
Situation Well Nearly
Eight In Ten NHS Workers Say Their Workplaces Remain Disrupted As A Result Of
COVID-19 7
Out Of 10 French People Think That PSG Can Win The Champions League This
Season Most
White Americans 59% Who Regularly Attend Worship Services Voted For Trump In
2020 Muslims
Are A Growing Presence In U S, But Still Face Negative Views From The Public 90%
Of Americans Say The Internet Has Been Essential Or Important To Them Two
Decades Later, The Enduring Legacy Of 9/11 Six
in Ten (60%) Canadians See Racism as a Serious Problem Facing the Country Alp
(54.5%) Increases Lead Over L-NP (45.5%) For Third Straight Interviewing
Period Back
To School 2021: 20% Of French People Would Be Against A New Closure Of
Schools Only
15 Percent Of Consumers Worldwide Say They Have Switched Provider Or Product
Due To Data Loss INTRODUCTORY NOTE
706-43-21/Commentary:
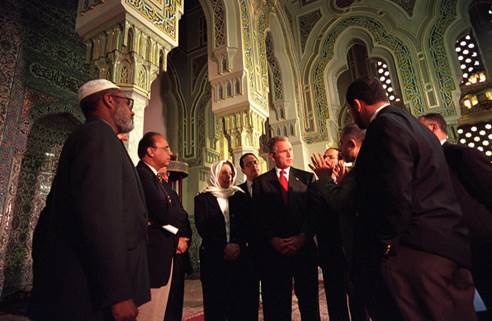
Muslims
Are A Growing Presence In U S, But Still Face Negative Views From The Public
An
unprecedented amount of public attention focused on Muslim Americans in the
wake of the terrorist attacks of Sept. 11, 2001. The U.S.
Muslim population has grown in the two decades since, but it is
still the case that many Americans know little about Islam or Muslims, and
views toward Muslims have become increasingly polarized
along political lines.
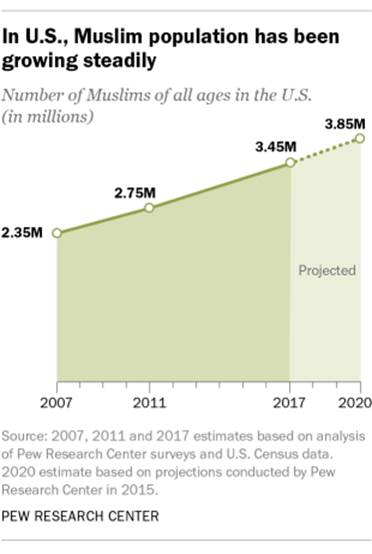
There were
about 2.35 million Muslim adults and children living in the United States in
2007 – accounting for 0.8% of the U.S. population – when Pew Research Center
began measuring this group’s size, demographic characteristics and views.
Since then, growth has been driven primarily by two factors: the continued
flow of Muslim immigrants into the U.S., and Muslims’ tendency to have more
children than Americans of other faiths. In 2015, the
Center projected that Muslims could number 3.85 million in the U.S. by 2020 –
roughly 1.1%
of the total population. However, Muslim population growth from
immigration may have slowed recently due to changes in federal
immigration policy. The number
of Muslim houses of worship in the U.S. also has increased over the last 20
years. A study conducted in 2000 by the Cooperative Congregational Studies
Partnership identified 1,209 mosques in the U.S. that year. Their follow-up
study in 2011 found that the number of mosques had grown to 2,106, and the
2020 version found 2,769 mosques – more than
double the number from two decades earlier. Alongside
their population growth, Muslims have gained a
larger presence in the public sphere. For example, in
2007, the 110th Congress included the
first Muslim member, Rep. Keith Ellison, D-Minn. Later in
that term, Congress seated a second Muslim representative, Rep. Andre Carson,
D-Ind. The current
117th Congress has two more Muslims alongside
Carson, the first Muslim women to hold such office: Reps. Ilhan Omar,
D-Minn., and Rashida Tlaib, D-Mich., first elected in 2018. As their
numbers have increased, Muslims have also reported encountering more
discrimination. In 2017, during the first few months of the Trump
administration, about half of Muslim American adults (48%) said they
had personally
experienced some form of discrimination because
of their religion in the previous year. This included a range of experiences,
from people acting suspicious of them to being physically threatened or
attacked. In 2011, by comparison, 43% of Muslim adults said they had at least
one of these experiences, and 40% said this in 2007.
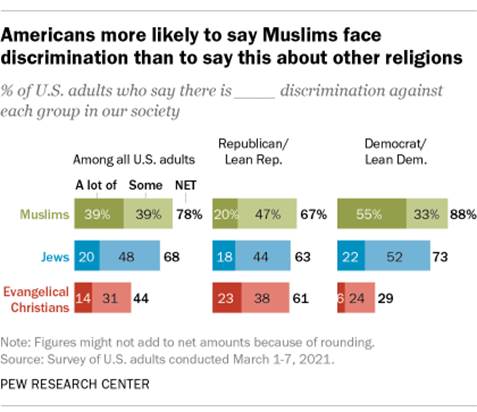
In a March
2021 survey, U.S. adults were asked how
much discrimination they think a number of religious groups face in society.
Americans were more likely to say they believe Muslims face “a lot” of
discrimination than to say the same about the other religious groups included
in the survey, including Jews and evangelical Christians. A similar pattern
appeared in previous surveys going back to 2009, when Americans were more
likely to say that there was a lot
of discrimination against Muslims than to say the
same about Jews, evangelical Christians, Mormons or atheists. A series of
Pew Research Center surveys conducted in 2014, 2017,
and 2019 separately
asked Americans to rate religious groups on a scale ranging from 0 to 100,
with 0 representing the coldest, most negative possible view and 100
representing the warmest, most positive view. In these surveys, Muslims were
consistently ranked among
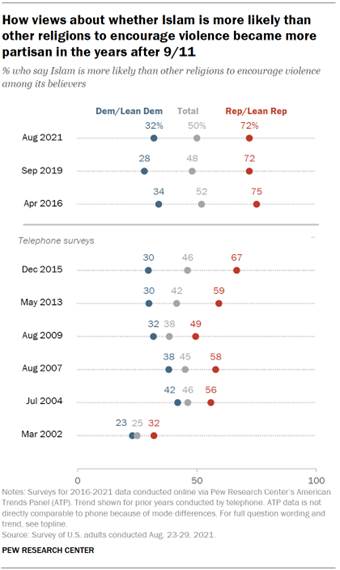
the coolest, along with atheists. Over the
last 20 years, the American public has been divided on whether Islam is more
likely than other religions to encourage violence, and a notable partisan
divide on this question has emerged. When the Center first asked this question
on a telephone survey in 2002, Republicans and Republican-leaning
independents were only moderately more likely than Democrats and Democratic
leaners to say that Islam encourages violence more than other religions – and
this was a minority viewpoint in both partisan groups. Within a few years,
however, Republicans began to grow more
likely to believe that Islam encourages violence.
Democrats, in contrast, have become more likely to say Islam does not
encourage violence. Now, Republicans are far more likely than Democrats to
say they believe Islam encourages violence more than other religions. Though many
Americans have negative views toward Muslims and Islam, 53% say they don’t
personally know anyone who is Muslim, and a similar share (52%) say they
know “not
much” or “nothing at all” about Islam.
Americans who are not Muslim and who personally know someone who is Muslim
are more likely to have a
positive view of Muslims, and they are less likely to believe that
Islam encourages violence more than other religions. (PEW) SEPTEMBER 1,
2021 706-43-22/Country Profile:
ASIA (Pakistan) 76%
Pakistanis Agree That The Government Of Pakistan Is Controlling The Covid-19
Situation Well According to a survey conducted by Gallup
& Gilani Pakistan, 76% Pakistanis agree that the government of Pakistan
is controlling the COVID-19 situation well. Complete report for Wave 11 of
the COVID-19 tracker survey can be accessed here. A nationally representative
sample of adult men and women from across the four provinces was asked the
following question, “To what extent do you agree or disagree with - The
government of Pakistan is controlling the COVID-19 situation well?” (Gallup Pakistan) September 2, 2021 MENA (UAE) UAE
Reveals Half (51%) Of The Respondents Are Likely To Hop On A Suborbital
Flight If The Price Wasn’t A Constraint YouGov’s latest study among 1028
respondents in the UAE reveals half (51%) of the respondents are likely to
hop on a suborbital flight if the price wasn’t a constraint, the rest remain
indecisive (25%) or are unlikely to buy a ticket even if they could afford it
(24%). Once regarded as a topic reserved for science fiction, space tourism
may very well soon be offered by private companies such as SpaceX, Blue Origin,
and Virgin Galactic. Interest in being a space tourist is higher (54%) among
younger adults (18-44 years), whereas older adults (45 years & above) are
comparatively less likely to be interested (41%). (YouGov MENA) September 1, 2021 WEST
EUROPE (UK) Just
12% Of Britons Say They Are At Least Somewhat Likely To Use Cryptocurrency In
The Next 12 Months Crypto-curious Britons (i.e. the 12% who
are at least somewhat open to using it) are overwhelmingly younger: nearly
two-thirds (64%) are aged 18-34, with three in ten (31%) aged 35-54. A mere
5% are over-55. The 88% of crypto-cynical Britons are more evenly split: 36%
are 18-34, 36% are 35-54, and more than a quarter are over-55. The
crypto-curious are also more likely to have a higher level of disposable
income: two in five have over £500 a month (41%) left over after taxes and
living expenses, compared to one in five crypto-cynics (19%). (YouGov UK) August 31, 2021 Nearly
Eight In Ten NHS Workers Say Their Workplaces Remain Disrupted As A Result Of
COVID-19 Approaching eight in ten NHS workers (79%)
say their services continue to be disrupted by the pandemic – this includes
27% who say services are still heavily disrupted and 2% who say services are
not running at all. This does, however, represent a significant
improvement from our previous survey in January, even if there is still
disruption. That 27% saying services are “heavily” disrupted is down 21pts
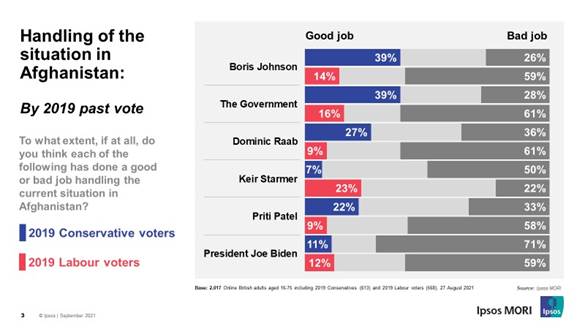
from 48% at the beginning of the year. (YouGov UK) September 01, 2021 Less Than A Quarter Think Boris Johnson And
The UK Government Have Handled The Situation In Afghanistan Well, But They’ve
Done A Better Job Than Biden More than 4 in 10 say Boris Johnson (41%),
the Government (44%), Dominic Raab (44%) and Priti Patel (42%) have done a
bad job in the way they have handled the current situation in Afghanistan. A
third (33%) say the same for Keir Starmer. However, no UK politician or
institution is viewed as harshly as the President of the USA, Joe Biden. Six
in 10 (59%) believe he has done a bad job. Four in 10 (39%) see both as
having handled the situation in Afghanistan well while 26% say the Prime
Minister has done a bad job and 28% say the same for the Government. (Ipsos MORI) 3 September 2021 (France) 7
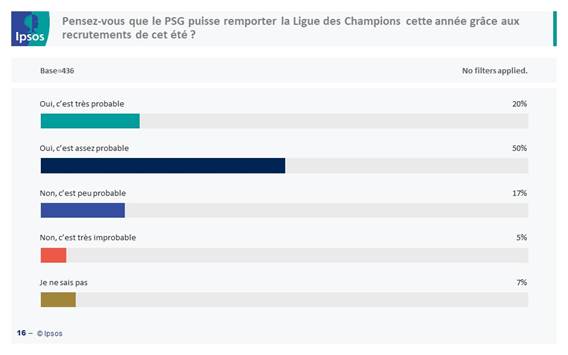
Out Of 10 French People Think That PSG Can Win The Champions League This
Season For football fans (who usually follow Ligue
1 matches), there is no doubt that Messi's talent will fully benefit his new
club, PSG, with a number of goals
scored which should exceed 15 or even 20 achievements over the entire season for
the "pulga" in the opinion of 61% of respondents (and even 75% of
opinions for men under 35). When we ask the French public if PSG will be able
to win the Champions League this year
thanks to the recruitments made this summer, 70% of people (and
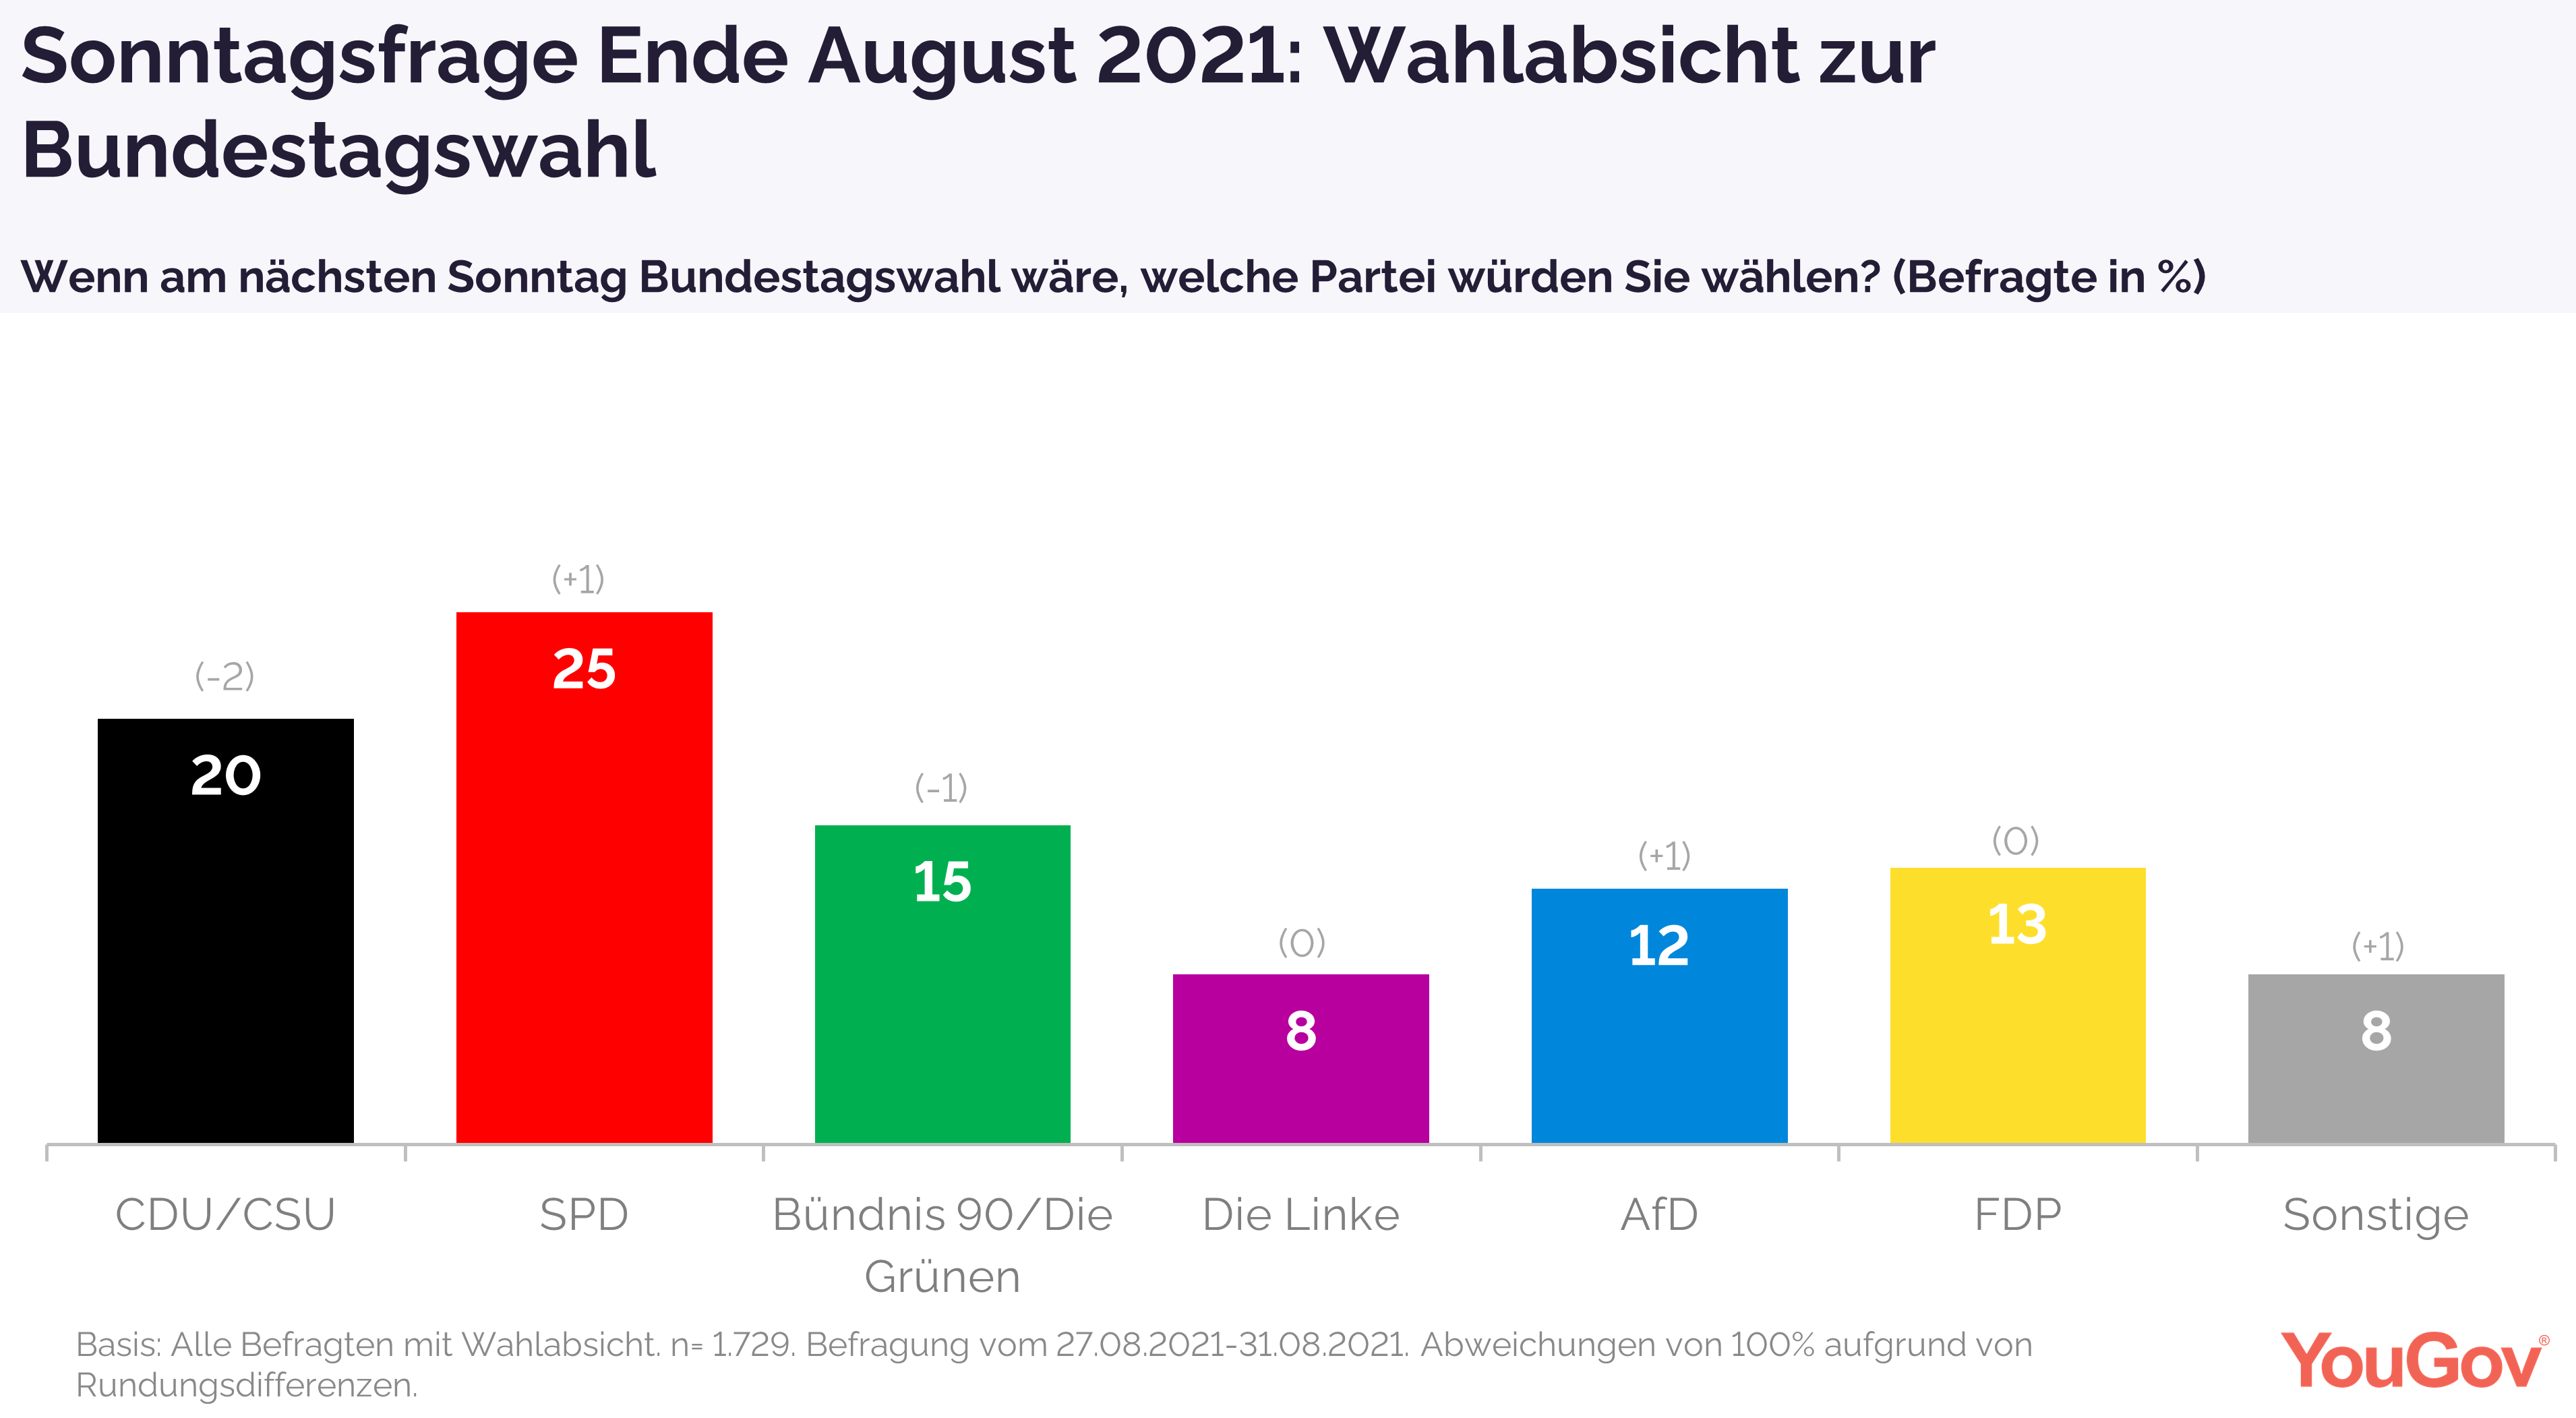
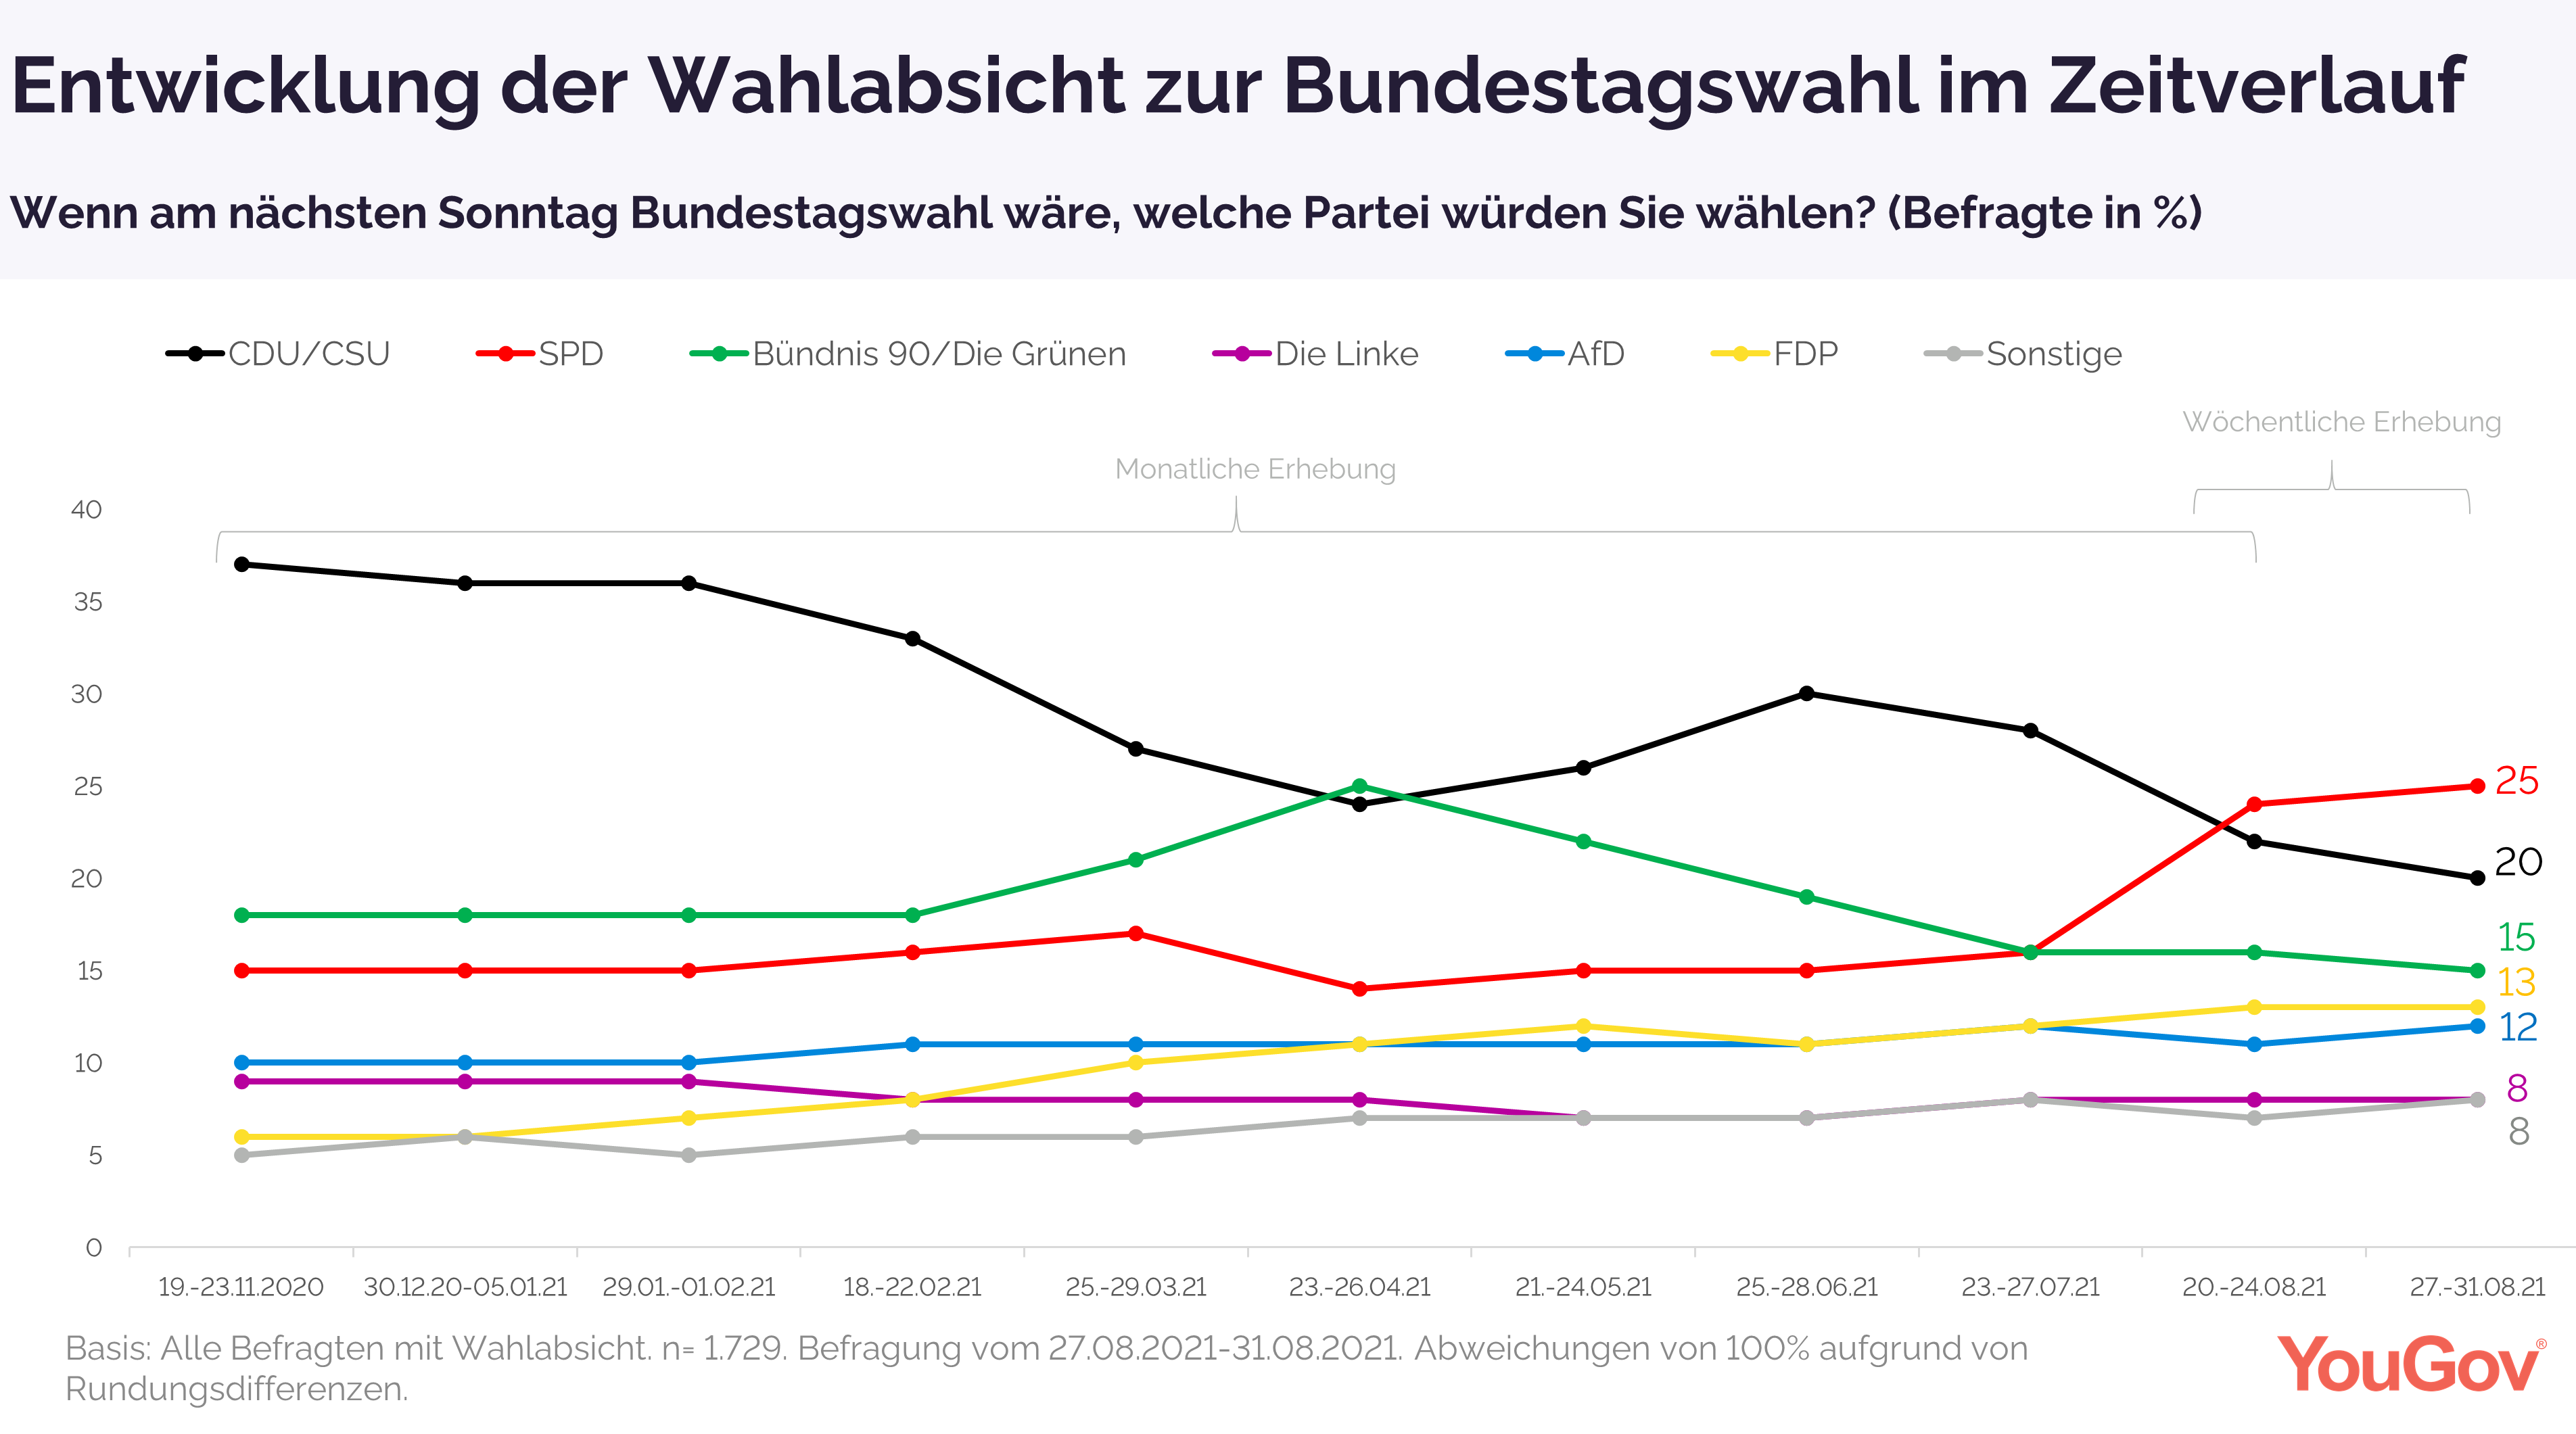
even 76% of men residing in Paris) consider the title as probable. (Ipsos France) September 3, 2021 (Germany) 20
Percent Of The German Citizens Entitled To Vote State That They Will Vote For
The CDU / CSU If There Would Be A General Election Next Sunday 20 percent of the German citizens entitled
to vote state that they will vote for the CDU / CSU if there would be a
general election next Sunday. This value is 2 percentage points lower
compared to the previous week. The SPD, on the other hand, can gain 1
percentage point (25 percent) and extends its lead over the Union with a 5
percentage point difference. Alliance 90 / The Greens reach 15 percent
(16 percent in the previous week). As before, the FDP reached 13 percent, and
Die Linke also remained unchanged at 8 percent. The AfD lands at 12
percent (11 percent in the previous week). Another 8 percent of the vote
goes to the other parties. (YouGov Germany) September 3, 2021 NORTH AMERICA (USA) Most White Americans 59% Who Regularly Attend Worship
Services Voted For Trump In 2020 Overall, 59% of voters who frequently
attend religious services cast their ballot for Trump, while 40% chose Biden.
Among those who attend services a few times a year or less, the pattern was
almost exactly reversed: 58% picked Biden, while 40% voted for Trump. However,
these patterns vary by race. Frequent religious service attenders’ preference
for Trump was apparent among White voters but largely absent among Black
voters. (Due to limitations in sample size, results among Hispanic and Asian
Americans could not be analyzed separately.) (PEW) AUGUST 30, 2021 Nearly Eight-In-Ten Democrats And Democratic-Leaning
Independents (78%) Say They Have “A Lot” Or “Some” Trust In The Information
That Comes From National News Organizations Nearly eight-in-ten Democrats and
Democratic-leaning independents (78%) say they have “a lot” or “some” trust
in the information that comes from national news organizations – 43
percentage points higher than Republicans and Republican leaners (35%) –
according to a new Pew Research Center survey conducted June 14-27, 2021.
This partisan gap is the largest of any time that this question has been
asked since 2016. And it grows even wider – to 53 points – between liberal
Democrats (83%) and conservative Republicans (30%). (PEW) AUGUST 30, 2021 Majority Of U S Public 54% Favors Afghanistan Troop
Withdrawal, Biden Criticized For His Handling Of Situation With the U.S. military evacuation of
Afghanistan completed – bringing America’s longest war to an end – 54% of
U.S. adults say the decision to withdraw troops from the country was the
right one, while 42% say it was wrong, according to a Pew Research Center
survey conducted Aug. 23-29. Just 7% of Republicans and Republican-leaning
independents rate the administration’s performance on Afghanistan positively,
and fewer than half of Democrats and Democratic leaners (43%) say it has done
an excellent or good job. (PEW) AUGUST 31, 2021 Muslims Are A Growing Presence In U S, But Still Face Negative
Views From The Public There were about 2.35 million Muslim adults
and children living in the United States in 2007 – accounting for 0.8% of the
U.S. population – when Pew Research Center began measuring this group’s size,
demographic characteristics and views. Since then, growth has been driven
primarily by two factors: the continued flow of Muslim immigrants into the
U.S., and Muslims’ tendency to have more children than Americans of other
faiths. (PEW) SEPTEMBER 1, 2021 90% Of Americans Say The Internet Has Been Essential Or
Important To Them The vast majority of adults (90%) say the
internet has been at least important to them personally during the pandemic,
the survey finds. The share who say it has been essential – 58% – is up slightly
from 53% in April 2020. There have also been upticks in the shares who say
the internet has been essential in the past year among those with a
bachelor’s degree or more formal education, adults under 30, and those 65 and
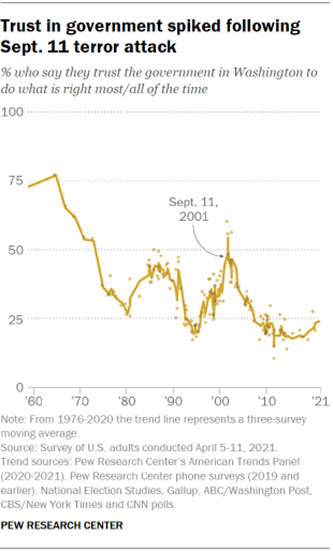
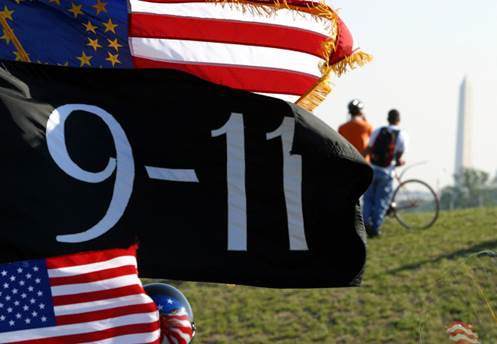
older. (PEW) SEPTEMBER 1, 2021 Two Decades Later, The Enduring Legacy Of 9/11 Americans watched in horror as the
terrorist attacks of Sept. 11, 2001, left nearly 3,000 people dead in New
York City, Washington, D.C., and Shanksville, Pennsylvania. Nearly 20 years
later, they watched in sorrow as the nation’s military mission in Afghanistan
– which began less than a month after 9/11 – came to a bloody and chaotic
conclusion. Shock, sadness, fear, anger: The 9/11 attacks inflicted a
devastating emotional toll on Americans. But as horrible as the events of
that day were, a 63% majority of Americans said they couldn’t stop watching
news coverage of the attacks. (PEW) SEPTEMBER 2, 2021 (Canada) Three Quarters (74%) Support Mandatory Vaccination for
Public-Facing Workers; 65% Support Same for Return-To-Office Mandatory vaccination has proven to be a
divisive issue among federal election candidates, as Conservative Party
leader Erin O’Toole continues to campaign against mandatory vaccination and
other leaders take advantage of public support for these measures in
campaigning against him. However, consistent with previous Ipsos polling,[1] Conservative voters continue to
express support for mandatory vaccine measures for public-facing workers
(70%), though at a lesser level than Liberal Party voters (88%) and NDP
voters (86%): (Ipsos Canada) 2 September 2021 Six in Ten (60%) Canadians See Racism as a Serious Problem
Facing the Country A recent Ipsos poll carried out on behalf
of Global News has found that a majority (60%) of Canadians believe to some
degree that racism is a serious problem facing the country. Though unchanged
from the same time last year, this proportion is still considerable jump from
Canadians’ perceptions of racism pre-pandemic. Increased awareness of
anti-Asian hate crimes during the pandemic, continued mistreatment against
Indigenous Canadians, domestic terrorism against Muslim Canadians, and
discrimination against Black Canadians have certainly contributed to the idea
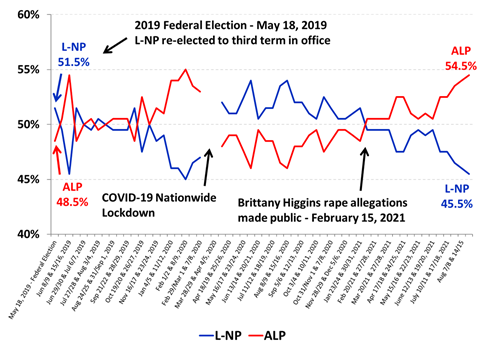
that Canada is not making much progress in tackling racism. (Ipsos Canada) 3 September 2021 AUSTRALIA Alp (54.5%) Increases Lead Over L-NP (45.5%) For Third
Straight Interviewing Period Voting analysis by State shows the ALP
leading on a two-party preferred basis in Australia’s two largest States of
Victoria and NSW and also holding leads in Western Australia, South Australia
and Tasmania. The LNP leads only in Queensland. The ALP leads strongly in
Victoria on 59.5% (down 0.5% points since mid-August) compared to the L-NP on
40.5% (up 0.5% points) on a two-party preferred basis. Victoria has now been
in its sixth lockdown for nearly a month. (Roy Morgan) September 01 2021 MULTICOUNTRY STUDIES On Average 23% Of Working Adults In 29 Countries Report
Working From Home More Often Than Before The Covid-19 Pandemic The online survey conducted between May 21
and June 4 of nearly 12,500 working adults reveals that on average, in 29 countries,
the proportion of those who are still working, most often or sometimes away
from home today hui (39%) is 15 points above pre-pandemic levels
(24%). Three-quarters of those who work away from home at least once in
a while say they do so because of Covid-19. 30 August 2021 Back To School 2021: 20% Of French People
Would Be Against A New Closure Of Schools For 1 in 3 French people (33%) the pandemic
risks leading to a drop in the level of qualification of young people ,
and 1 in 4 French people (26%) fear that they will experience a high level of
unemployment and a drop in income.2 in 10 French people (20%) would find
it unacceptable to close schools again in order to reduce the
transmission of the virus, against 18% on average for all respondents and 12%
in Spain alone. The French are among the most concerned about the
increase in disciplinary problems and unruly behavior, especially among 11-15
year olds (38% vs 32% globally), and those under 11 (34% vs 27% at the World
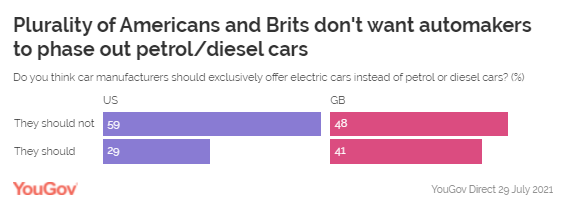
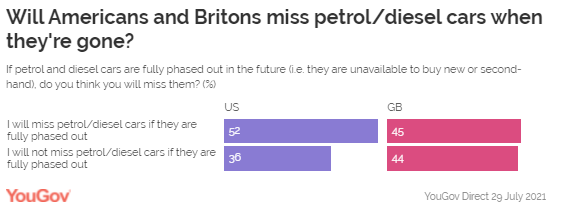
level). (Ipsos France) 31 August 2021 More Than Two In Five (45%) Britons And Over Half (52%)
Americans Say They Will Miss Petrol And Diesel Cars If They Are Ever Fully
Phased Out New YouGov Direct data suggests that
neither Americans nor Britons are yet ready to say goodbye to
petrol and diesel cars. In Britain, nearly half believe car manufacturers
should not exclusively offer electric cars (48%) – compared to two in five (41%)
who believe they should. In the US, the gap is even wider: while three in ten
(29%) think automakers should only sell electric vehicles, three in five
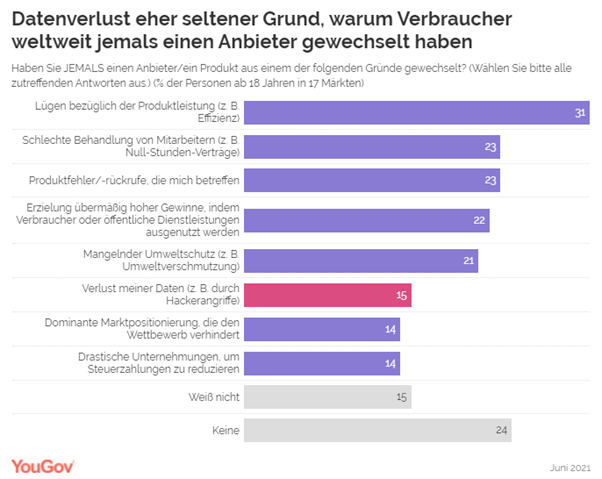
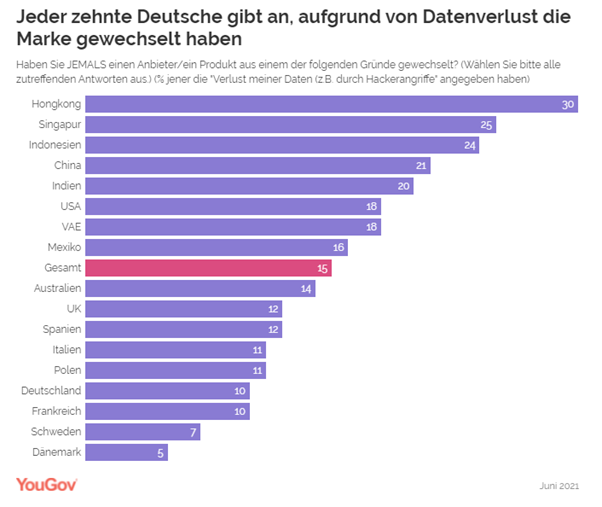
(59%) disagree. (YouGov UK) September 02, 2021 Only 15 Percent Of Consumers Worldwide Say They Have
Switched Provider Or Product Due To Data Loss American consumers are also more likely
than the global average (15 percent) to have changed brands when they lost
their data (18 percent). This statement is made less often among
Europeans: in the United Kingdom and Spain, 12 percent each say this, in
Italy and Poland 11 percent each, and in Germany and France 10 percent
each. Scandinavians are the least likely to say this: in Sweden it is 7
percent and in Denmark 5 percent. (YouGov Germany) September 3, 2021 Source: https://yougov.de/news/2021/09/03/wie-wirkt-sich-datenverlust-auf-die-kundentreue-au/ ASIA
706-43-01/Polls 76%
Pakistanis Agree That The Government Of Pakistan Is Controlling The Covid-19
Situation Well
According to a survey conducted by Gallup
& Gilani Pakistan, 76% Pakistanis agree that the government of Pakistan
is controlling the COVID-19 situation well. Complete report for Wave 11 of
the COVID-19 tracker survey can be accessed here. A nationally representative
sample of adult men and women from across the four provinces was asked the
following question, “To what extent do you agree or disagree with - The
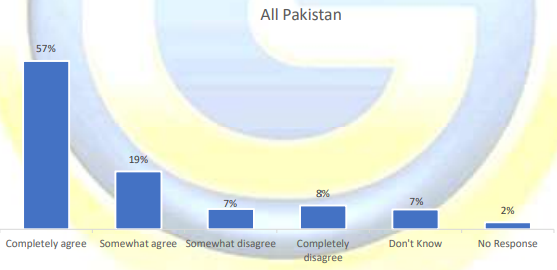
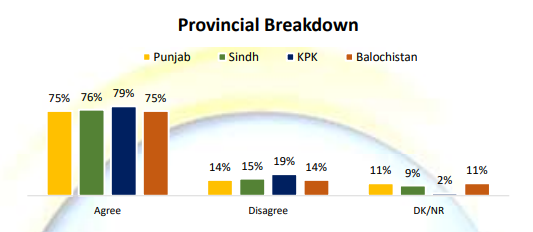
government of Pakistan is controlling the COVID-19 situation well?” In
response to this question, 57% completely agreed, 19% agreed somewhat, 7%
somewhat disagreed, 8% completely disagreed, 7% did not know and 2% did not
respond. Question: “To what extent do you agree or disagree with - The
government of Pakistan is controlling the COVID-19 situation well?”
Provincial Breakdown People in KP (79%) consider the government
of Pakistan to be controlling the COVID-19 situation well the most as compared
to other provinces.
(Gallup Pakistan) September 2, 2021 Source: https://gallup.com.pk/wp/wp-content/uploads/2021/09/2nd-Sept-21.pdf MENA
706-43-02/Polls UAE Reveals
Half (51%) Of The Respondents Are Likely To Hop On A Suborbital Flight If The
Price Wasn’t A Constraint
Billionaires like Richard Branson and Jeff
Bezos have marked a major milestone in space tourism, with their recent space
tours and plans of flying passengers to space in suborbital flights by early
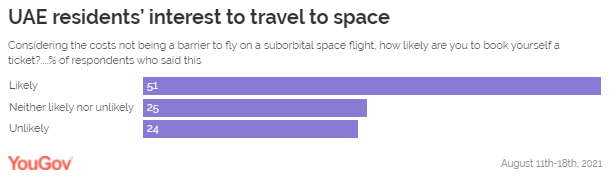
next year. But it’s not an excursion that appeals to everyone. YouGov’s latest study among 1028
respondents in the UAE reveals half (51%) of the respondents are likely to
hop on a suborbital flight if the price wasn’t a constraint, the rest remain
indecisive (25%) or are unlikely to buy a ticket even if they could afford it
(24%).
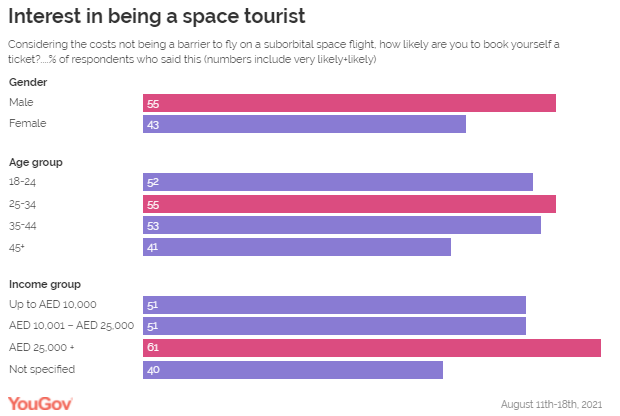
Similarly, men when compared to women are
more likely to get themselves a ticket for a suborbital flight, provided
money wasn’t a concern (55% vs 43%). The survey also shows that residents from
high-income groups (earning AED 25,000+) are more inclined towards space
travel compared to the other income groups.
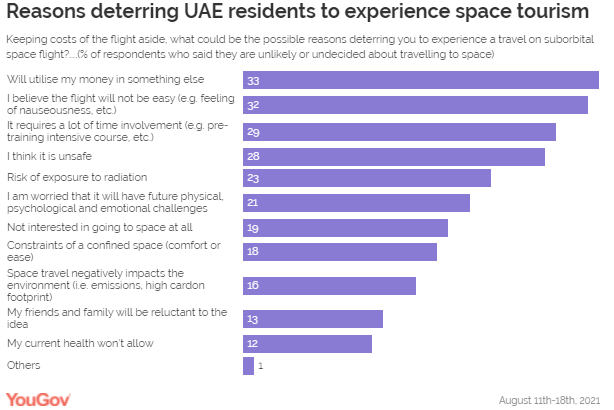
Out of those who were undecided or unlikely
to board a space flight even if money wasn’t a constraint, their main reason
to say so was that they think they could utilize the money in something else
(33%) or because they believe the flight would not be an easy one (32%).
With the current advancements in space
travel, there is every reason to believe that commercial space tourism will
have a significant impact on the economy, ultimately benefitting society at
large. When asked about the advantages of the evolvement of space tourism,
about half of the respondents in UAE feel it would lead to overall
technological development & innovation and serve as a source of
inspiration or education for the younger generation (50% and 47%
respectively). Many (37%) think it will yield economic benefits like the
creation of new spaceports, greater job opportunities for people. In addition to this, a little over a third
(36%) see it as an opportunity for transformational changes for mankind- like
the creation of hypersonic flights which would make travel between two ends
of the world a matter of just a few hours (London to Sydney in less than 4
hours). While space tourism remains largely an
accessible domain for the super-rich, a majority (60%) of surveyed
respondents think that in the next ten years or so, people will routinely
travel in space as tourists. Only a small number thinks it won’t happen
(12%), while almost three in ten (28%) remain undecided. (YouGov MENA) September 1, 2021 Source: https://mena.yougov.com/en/news/2021/09/01/if-price-were-not-constraint-half-uae-residents-wo/ WEST
EUROPE
706-43-03/Polls Just 12% Of Britons Say They Are At Least Somewhat Likely To Use
Cryptocurrency In The Next 12 Months
Cryptocurrency has been a staple news item over the past 12 months.
Amazon recently posted a job ad for a “digital currency and blockchain
product lead”; the Chancellor of the Exchequer has indicated that a
“Britcoin” digital currency could be offered to the public alongside
cash; Elon
Musk has announced that Tesla would be accepting Bitcoin, not accepting
Bitcoin, and possibly accepting it all over again as a form of
payment. But what do the public think? Those who say they are at least somewhat likely to use cryptocurrency
in the next 12 months amount to just 12% of Britons, with 88% saying they’re
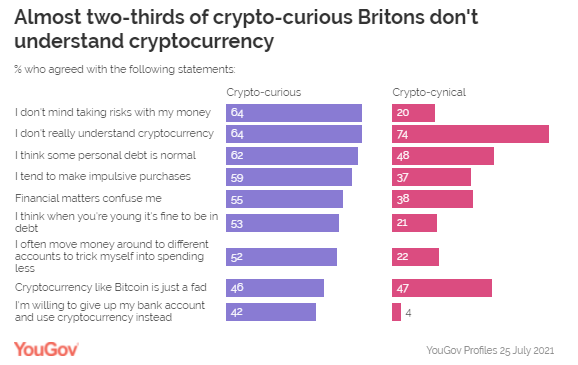
not very likely or not at all likely to use it. Crypto-curious Britons (i.e. the 12% who are at least somewhat open
to using it) are overwhelmingly younger: nearly two-thirds (64%) are aged
18-34, with three in ten (31%) aged 35-54. A mere 5% are over-55. The 88% of
crypto-cynical Britons are more evenly split: 36% are 18-34, 36% are 35-54,
and more than a quarter are over-55. The crypto-curious are also more likely to have a higher level of
disposable income: two in five have over £500 a month (41%) left over after
taxes and living expenses, compared to one in five crypto-cynics (19%). And
while two in five crypto-curious Britons also have less than £500 in
discretionary funds available every month (39%), this rises to half of
crypto-cynical Britons (51%). So people who are interested in these
currencies are younger and have more money to invest. They’re also more open to risk – which
can be a double-edged sword, as people who invest in cryptocurrencies are
at the mercy of high volatility. While nearly two-thirds say they don’t mind
taking risks with their money compared to 20% of crypto-cynics, this group
are also more likely to agree that they find financial matters confusing (55%
vs. 38% of crypto-cynics). Finally, while they’re open to investing in it,
they don’t necessarily fully comprehend it: 64% of the crypto-curious say
they don’t really understand it (next to 74% of crypto-cynics). On the whole, this is a group which is less educated about financial
matters – to the point where many, for all their excitement, may not even
know how cryptocurrencies actually work. It is perhaps no surprise that our
data shows that seven in ten crypto-cynics say they’ve never been victims of
a scam (69%) compared to just 37% of the crypto-curious. Marketing and advertising to crypto-curious
Britons Marketers and advertisers working in the cryptocurrency space can’t
just think about their commercial responsibilities: they may have a
responsibility to an under-informed and potentially quite vulnerable
audience. It is especially important to take a sensitive approach because the
crypto-curious are particularly sensitive to marketing and advertising. Half
of this group are more likely to say that they trust the advertisements they
say on posters or billboards (50%) next to just one in five (21%)
crypto-cynics – while three in five say that they often search for products
and services on their phones as a result of seeing these ads (62% vs. 27%).
This group are also more likely to engage with ads that they see on social
media compared to ads they see on regular websites (56% vs. 22%) – and with
ads of all kinds that are tailored to them. Perhaps most importantly, crypto-curious Britons are more than twice
as likely to agree that advertising helps them choose what to buy (64% vs.
31%). So marketers, then, have to walk a fine line: there is an obvious
commercial upside to targeting a young, engaged audience with money to spend
and an uncommon interest in advertising. But given this audience’s lack of
financial savvy, there is perhaps an even greater need than usual to present
campaigns as scrupulously and accurately as possible – especially given
reports of regulators
cracking down on misleading crypto ads. (YouGov UK) August 31, 2021 Source: https://yougov.co.uk/topics/technology/articles-reports/2021/08/31/marketing-crypto-curious-britons 706-43-04/Polls Nearly Eight In Ten NHS Workers Say Their Workplaces Remain Disrupted
As A Result Of COVID-19
The number of positive COVID-19 cases since the end of pandemic
restrictions on July 19th has been on par with the second
wave that occurred in early 2021. Yet, government data shows that hospital
admissions are only around a fifth of those seen earlier in the year, thanks
to the success of the vaccine rollout. However, despite admissions being low,
the latest YouGov survey of NHS staff reveals most are still feeling the
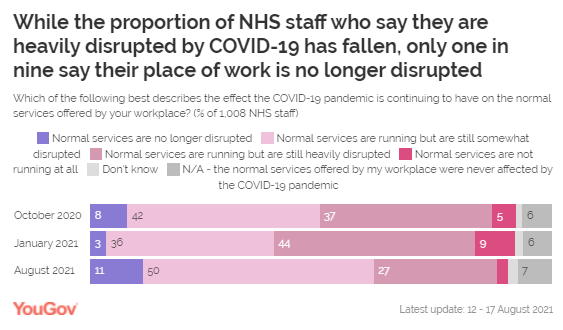
effects of the pandemic in the workplace. Approaching eight in ten NHS workers (79%) say their services
continue to be disrupted by the pandemic – this includes 27% who say services
are still heavily disrupted and 2% who say services are not running at all.
This does, however, represent a significant improvement from our
previous survey in January, even if there is still disruption. That 27%
saying services are “heavily” disrupted is down 21pts from 48% at the
beginning of the year. For the most part, assessments have shifted to saying
that services are now “somewhat” disrupted (up from 34% to 50%), although
some 11% of staff now say services are no longer disrupted (up from 3%). Current disruption due to COVID-19 is reported by 88% of staff in GP
surgeries, 83% of staff in mental health practices, and 80% of workers in
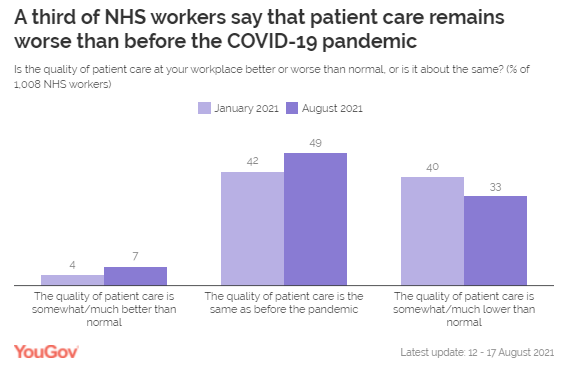
regular hospitals. Patient care remains affected, say a third
of NHS staff Further to this disruption, a third of NHS workers (33%) also report
that the quality of patient care has fallen compared to before the COVID-19
pandemic – although this has dropped from 40% who said the same in January
2021.
(YouGov UK) September 01, 2021 706-43-05/Polls Less Than A Quarter Think Boris Johnson And The UK Government Have
Handled The Situation In Afghanistan Well, But They’ve Done A Better Job Than
Biden
After the final flights have left Afghanistan, new polling by Ipsos
MORI shows Britons are significantly more likely to say the Prime Minister,
his Government and various politicians have done a bad job in handling the
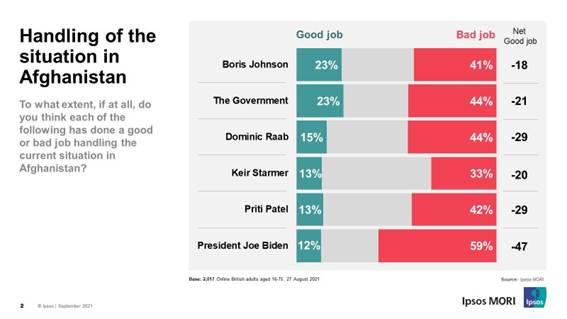
current situation in the country. More than 4 in 10 say Boris Johnson (41%), the Government (44%),
Dominic Raab (44%) and Priti Patel (42%) have done a bad job in the way they
have handled the current situation in Afghanistan. A third (33%) say the same
for Keir Starmer. However, no UK politician or institution is viewed as
harshly as the President of the USA, Joe Biden. Six in 10 (59%) believe he
has done a bad job. In fact, as 23% say Boris Johnson has done a good job, he received
the best net score among options listed in the survey of -18. The Government
received a score of -21, similar to Starmer’s -20. Dominic Raab and Priti Patel
receive net scores of -29, the lowest among Britons included in the survey.
President Biden receives a net score of -47.
Opinions of President Biden are similar across party lines, 11% of
Conservative voters say he has done a good job while 12% of Labour voters say
the same. Conservative supporters are significantly more likely to say he has
done a bad job, 71% compared to 59% of Labour voters. Keiran Pedley, Research Director at Ipsos
MORI, said: The British public take a dim view of how
its government and leading politicians have handled the situation in
Afghanistan. Fewer than one in four think the Prime Minister and his
government have done a good job, with almost twice as many saying the
opposite. However, the strongest criticism from Britons is reserved for
President Biden, with 6 in 10 thinking he has done a ‘bad job’ handling the
situation, a view shared across party lines. (Ipsos MORI) 3 September 2021 706-43-06/Polls 7 Out Of 10 French People Think That PSG Can Win The Champions League
This Season
Main attraction of this new season, PSG has indeed focused all the attention of supporters ,
with the arrival of an exceptional player, Messi from Barça; the
opportunity to examine the perception of the phenomenon by the French public.
Last observation on this world of the round
ball (valid for all our surveys already carried
out): we know that one in two French people are not passionate about football
competitions, and Ligue 1 is no exception to the rule, even if it is very
popular with an audience of fans, especially men under 35 living in Paris:
overall of the French population, 44%
of people say they follow the French Football Championship ,
if only for 'occasionally, a level
which therefore climbs to 65% of enthusiasts among the male public living in
the Paris region. (Ipsos France) September 3, 2021 706-43-07/Polls 20 Percent Of The German Citizens Entitled To Vote State That They
Will Vote For The CDU / CSU If There Would Be A General Election Next Sunday
20 percent of the German citizens entitled to vote state that they
will vote for the CDU / CSU if there would be a general election next
Sunday. This value is 2 percentage points lower compared to the previous
week. The SPD, on the other hand, can gain 1 percentage point (25
percent) and extends its lead over the Union with a 5 percentage point
difference. Alliance 90 / The Greens reach 15 percent (16 percent in the
previous week).
As before, the FDP reached 13 percent, and Die Linke also remained
unchanged at 8 percent. The AfD lands at 12 percent (11 percent in the
previous week). Another 8 percent of the vote goes to the other parties.
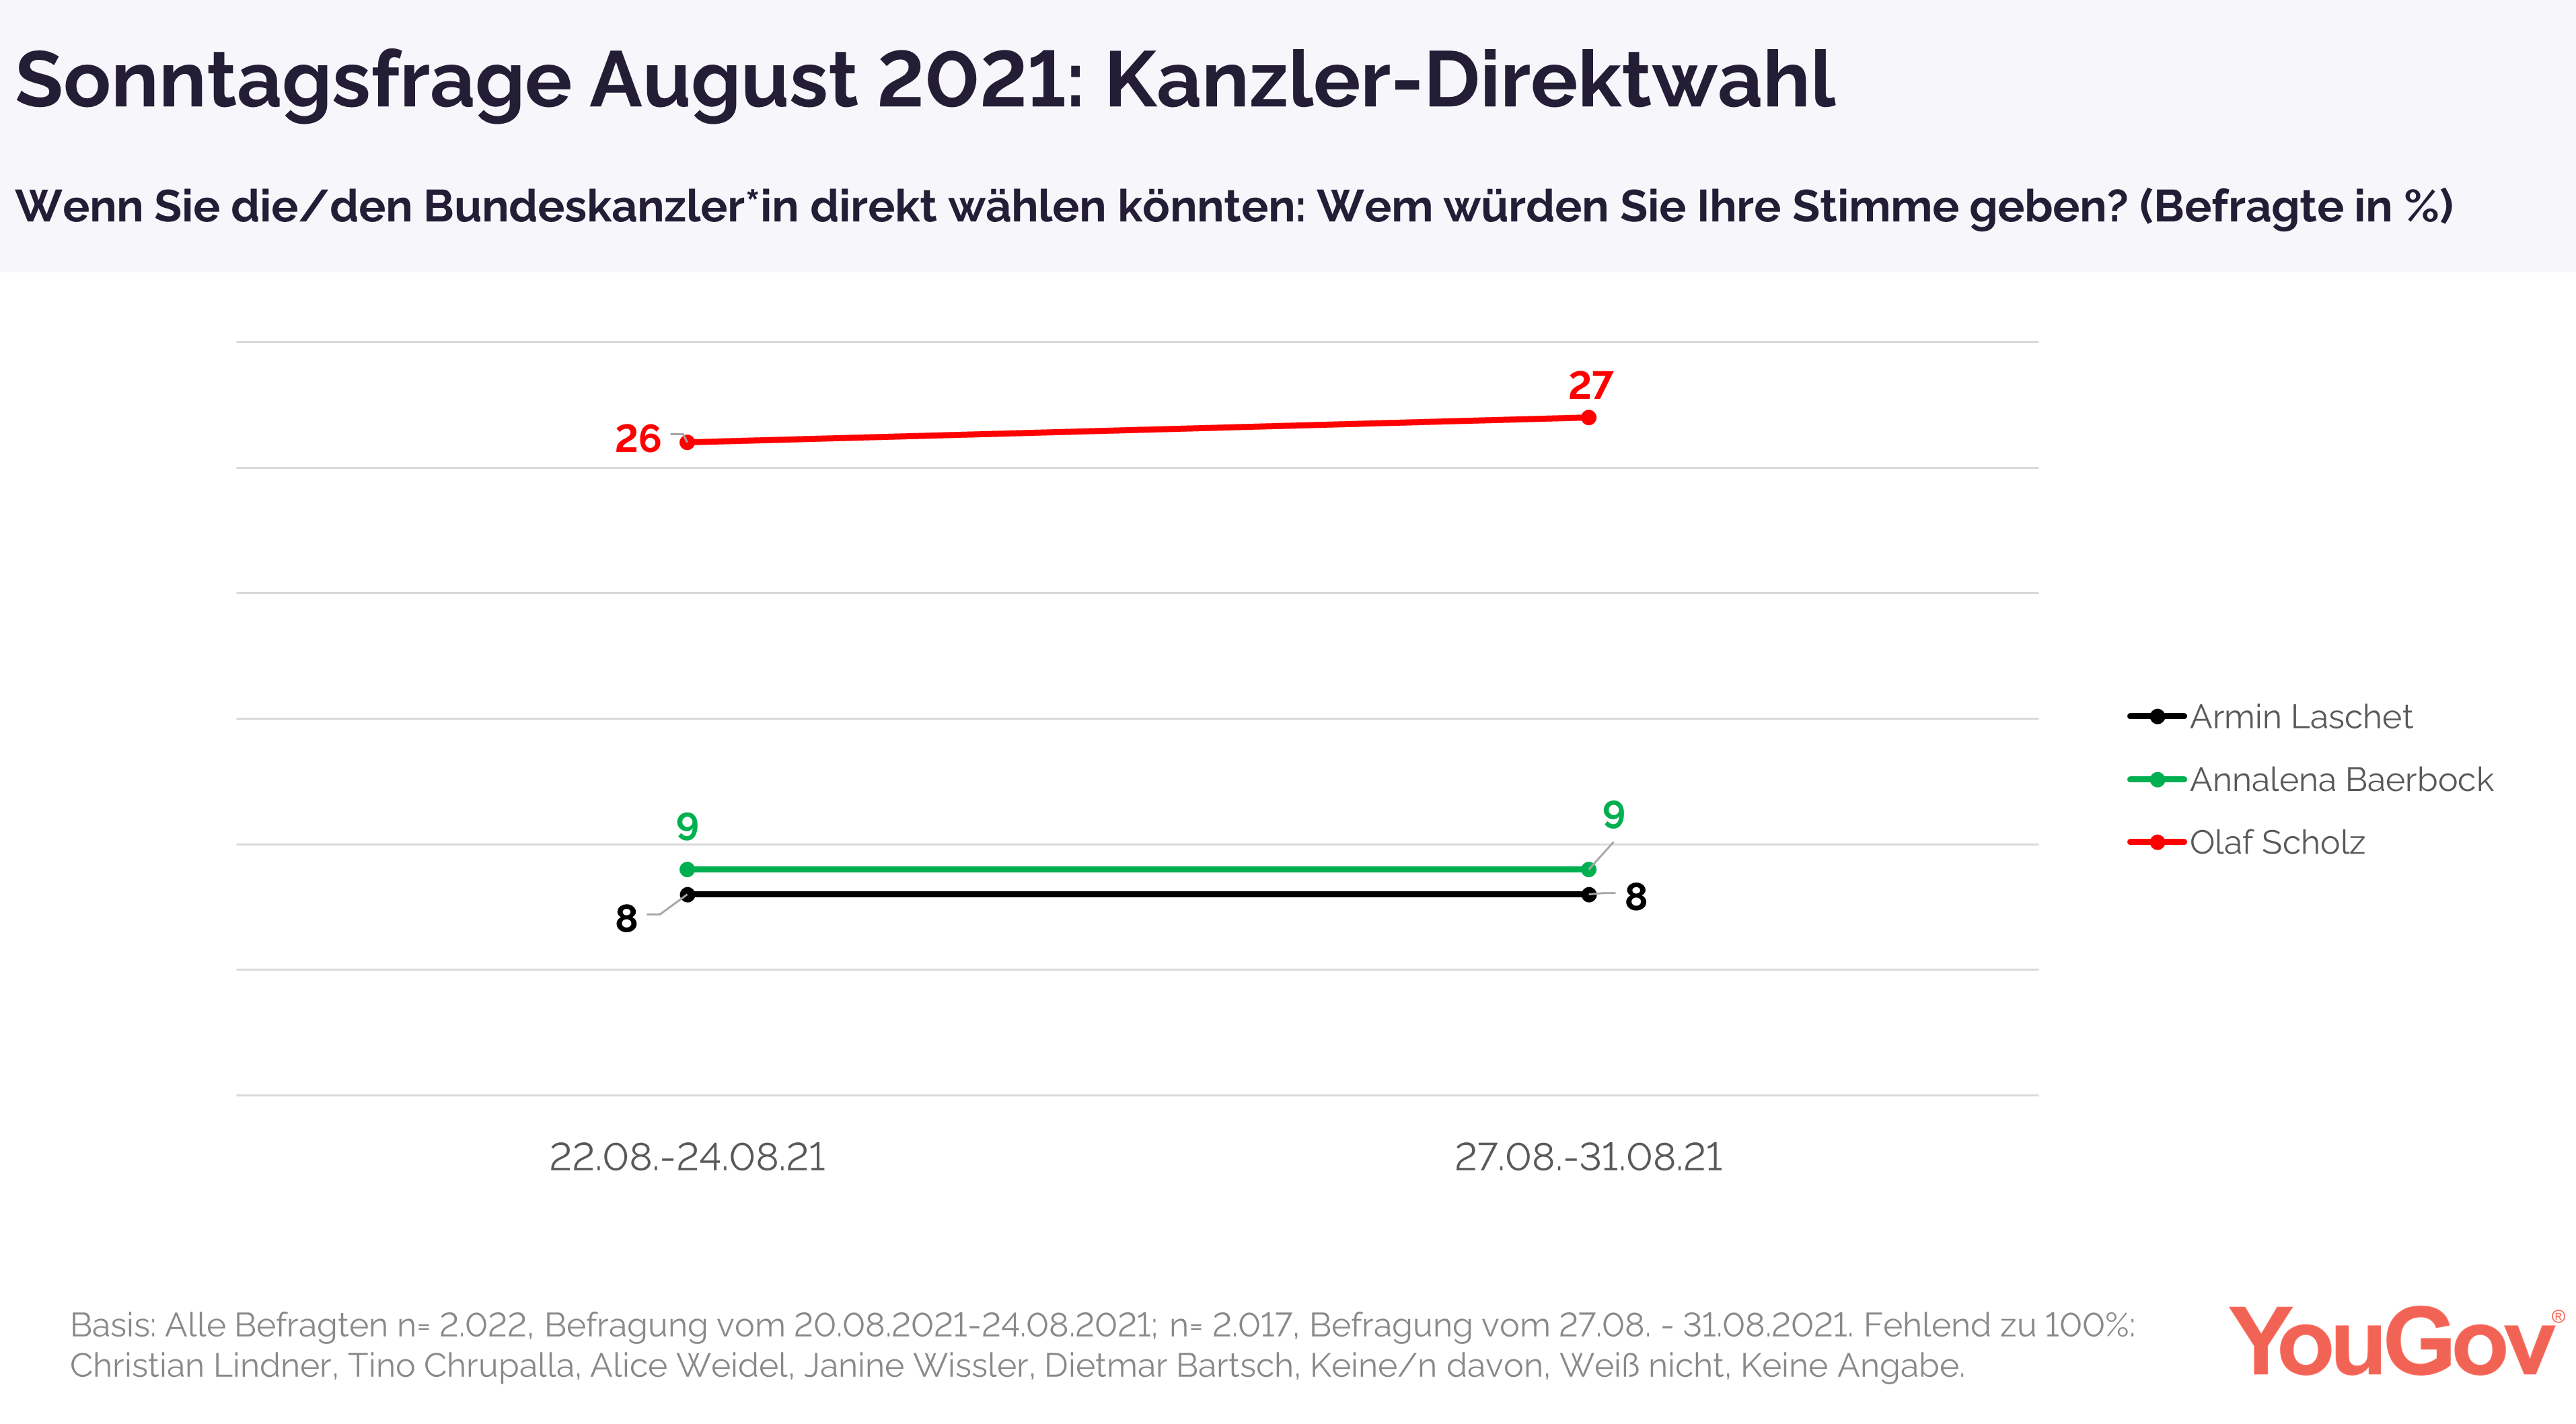
Olaf Scholz's popularity continues to grow If they could elect the Federal Chancellor directly, 27 percent of
Germans eligible to vote would currently vote for Olaf Scholz, the SPD's
candidate for chancellor. In the previous week it was 26
percent. This is what 8 percent say about Armin Laschet and 9 percent
about Annalena Baerbock. Both values are unchanged
compared to the previous week.
The second most popular after Olaf Scholz is currently Christian
Lindner from the FDP with 12 percent (10 percent in the previous week). However,
the survey also showed that 21 percent of those questioned would not vote for
any of the eight top politicians of all parties represented in the Bundestag
if they could directly elect the Federal Chancellor. (YouGov Germany) September 3, 2021 Source: https://yougov.de/news/2021/09/03/sonntagsfrage-union-verliert-weiter-spd-baut-vorsp/ NORTH
AMERICA
706-43-08/Polls Most White Americans 59% Who Regularly Attend Worship Services Voted
For Trump In 2020
Similar to past elections, religion played an important role in
the 2020
U.S. presidential contest: Republican candidate Donald Trump continued to
garner strong support from White evangelical Protestants, while Black
Protestants and the religiously unaffiliated backed the Democratic candidate
and eventual winner, President Joe Biden.
But religious identity alone does not tell the whole story. Among
White Americans, worship service attendance remains highly correlated with
presidential vote choice, according to a new Pew Research Center analysis of
2020 validated
voters. As in previous years,
voters who frequently go to religious services – defined as those who attend
at least monthly – were more likely to vote for the Republican candidate in
the most recent presidential election, while less frequent attenders were
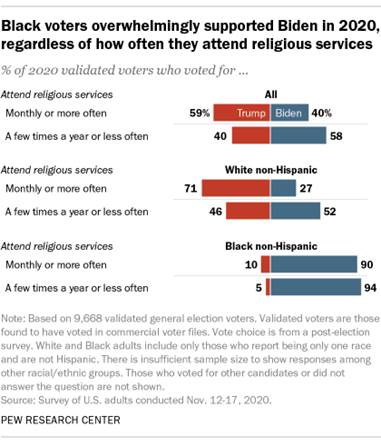
more likely to back the Democrat. Overall, 59% of voters who frequently attend religious services cast
their ballot for Trump, while 40% chose Biden. Among those who attend
services a few times a year or less, the pattern was almost exactly reversed:
58% picked Biden, while 40% voted for Trump. However, these patterns vary by race. Frequent religious service
attenders’ preference for Trump was apparent among White voters but largely
absent among Black voters. (Due to limitations in sample size, results among
Hispanic and Asian Americans could not be analyzed separately.) About seven-in-ten White, non-Hispanic Americans who attend religious
services at least monthly (71%) voted for Trump, while roughly a quarter
(27%) voted for Biden. Among White Americans who attend religious services a
few times a year or less, far fewer voted for Trump (46%), while around half
(52%) voted for Biden.
Among Black, non-Hispanic adults in the U.S., by comparison, there is
no such link between attendance and vote choice. Nine-in-ten Black Americans
who attend religious services monthly or more voted for Biden in 2020, as did
a similar share of Black voters who attend services less often (94%). Just
10% of Black frequent attenders and 5% of Black infrequent attenders voted for
Trump. Among White Americans, the extent to which vote choice is tied to
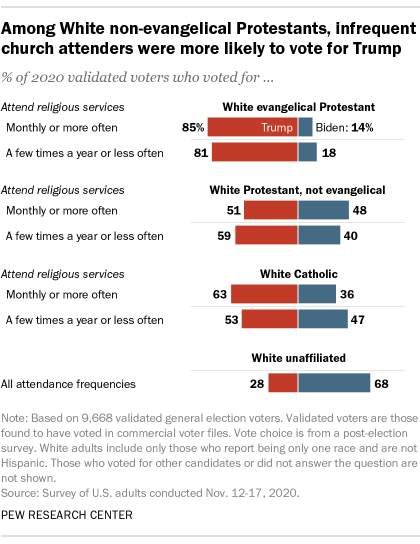
frequency of religious service attendance differs by affiliation. White evangelical Protestants have been among the Republican
Party’s most loyal constituencies, and this remained true in 2020. More
than eight-in-ten White evangelical Protestant voters who attend religious
services frequently (85%) voted for Trump in the most recent election, as did
81% of those who attend less frequently. White evangelical Protestants tend
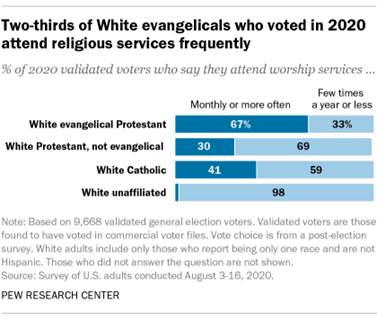
to be more
religious than other Christians by a number of measures, including
in their worship habits: Two-thirds of White evangelical voters attend
monthly or more often, while one-third attend less frequently.
White Protestants who are not evangelical,
however, do vary in terms of the connection between religious service
attendance and voting for Trump. In 2020, White non-evangelical Protestants
who attend services less than monthly favored Trump over Biden, 59% to 40%.
But among White non-evangelicals who attend services more frequently, the
vote was almost evenly divided, with 51% favoring Trump and 48% favoring
Biden. White Protestants who are not evangelical tend to attend church less
frequently than their evangelical counterparts: Three-in-ten White
non-evangelical Protestant validated voters say they go to church monthly or
more, while nearly seven-in-ten go a few times a year or less. White Catholics, meanwhile, follow yet another pattern. About
six-in-ten White Catholics who attend Mass monthly or more often (63%)
supported Trump in the 2020 election, while 36% supported Biden. Less
frequent Mass attenders expressed less support for Trump (53%) and more
support for Biden (47%). Finally, there are White adults who are religiously unaffiliated, a
group that makes up 26% of White voters overall. Historically, White
“religious nones” – who tend to rarely attend religious services – have
been trending
toward the Democratic Party, a pattern that persisted in 2020. Two-thirds
of White nones (68%) voted for Biden, while 28% voted for Trump. Nearly all
surveyed members of this group (98%) fall into the infrequent attender
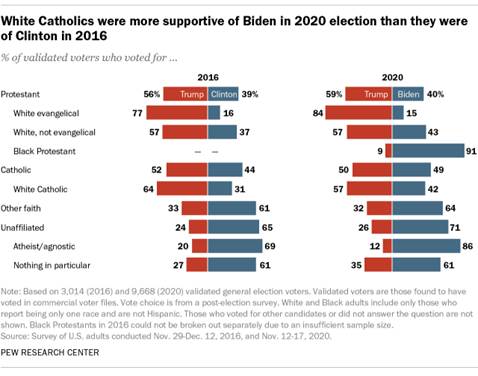
category. In addition to analyzing voters by frequency of worship attendance,
the Center’s validated voter study also shows how religious groups overall
voted in the 2020 presidential race. Trump expanded his support among White
evangelical Protestants slightly, winning 84% of their vote in 2020 after
receiving 77% in 2016, when he ran against Hillary Clinton. Trump held steady
among White non-evangelical Protestants (57% support in both elections). He
also received the votes of 57% of White Catholics, compared with 64% in 2016. Biden, meanwhile, gained some ground among White Catholics, garnering
42% of that vote, or 11 points more than Clinton did in 2016. What Biden
lacked in support from White Christians, he made up for with support from
Black Protestants and the religiously unaffiliated. An overwhelming majority
of Black Protestants who voted last year (91%) supported the Democratic
candidate, as did a large share of religiously unaffiliated voters (71%).
Biden’s support was particularly strong among voters who identify as atheist
or agnostic, with 86% of voters in this category backing him over Trump.
Biden also enjoyed a strong advantage among voters belonging to
non-Christian faiths – a group that consists of Jews, Muslims,
Buddhists, Hindus, and others – with 64% of these voters supporting him. That
is twice as many as the share who supported Trump. (The survey did not have
enough interviews with members of non-Christian faiths to report on each
group separately). Validated voters are members of the Center’s American Trends Panel
who are confirmed to have voted in the 2020 presidential election after being
matched to commercially available voter files. (PEW) AUGUST 30, 2021 706-43-09/Polls Nearly Eight-In-Ten Democrats And Democratic-Leaning Independents
(78%) Say They Have “A Lot” Or “Some” Trust In The Information That Comes
From National News Organizations
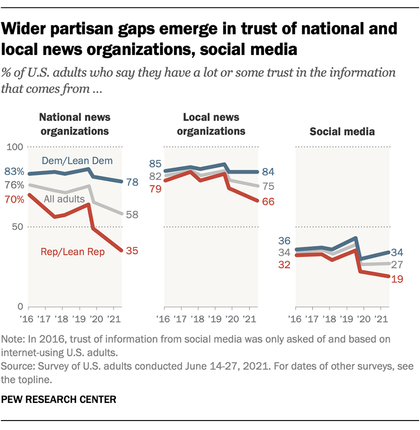
In just five years, the percentage of Republicans with at least some
trust in national news organizations has been cut in half – dropping from 70% in 2016 to 35%
this year. This decline is fueling the continued widening of the partisan gap
in trust of the media.
Nearly eight-in-ten Democrats and Democratic-leaning independents
(78%) say they have “a lot” or “some” trust in the information that comes
from national news organizations – 43 percentage points higher than
Republicans and Republican leaners (35%) – according to a new Pew Research
Center survey conducted June 14-27, 2021. This partisan gap is the largest of
any time that this question has been asked since 2016. And it grows even
wider – to 53 points – between liberal Democrats (83%) and conservative
Republicans (30%). The 35% of Republicans who have at least some trust in national news
organizations in 2021 is half that of in 2016 (70%) – and has dropped 14
points since late 2019 (49%). By comparison, Democrats have remained far more
consistent in the past five years, ranging somewhere between 78% and 86%. Overall, about six-in-ten U.S. adults (58%) say they have at least
some trust in the information that comes from national news organizations.
While still a majority, this is the smallest share over the past five years
this question was asked. When it was last asked in late 2019, 65% expressed
at least some trust. And far fewer (12%) express that they have “a lot”
of trust in the information that comes from national news organizations. Americans tend to have greater trust in local
news organizations – though there is somewhat of a decline here as
well. A large majority of Americans (75%) still say they have at least some
trust in the information that comes from local news organizations, modestly
lower than the shares who said the same in 2016 (82%) and in late 2019 (79%).
And again, far fewer express the highest level of trust (18%). A similar partisan divide emerges when it comes to local news, though
to a lesser extent. As of June 2021, Democrats are 18 percentage points more
likely than Republicans to have at least some trust in the information that
comes from local news organizations (84% vs. 66%, respectively) – a gap that
is again larger than at any time in recent years. Five years ago, 85% of Democrats
had at least some trust in local news organizations, while 79% of Republicans
did. Social media continues to engender a much lower level of trust. About
a quarter of Americans (27%) say they have at least some trust in the
information that comes from social networking sites, with just 4% expressing
that they have a lot of trust in it. This is about on par with late 2019 when
26% said they had at least some trust, but somewhat lower than the 34% who
said the same in 2016. (In 2016, this question was asked of internet-using
U.S. adults.) Social media is trusted by a minority of both parties, though a
partisan gap still exists. About a third of Democrats and Democratic-leaning
independents (34%) and 19% of Republicans and Republican leaners say they have
at least some trust in the information that comes from social media – a
15-point gap. This gap is larger than gaps from any other time in recent
years and has nearly doubled since late 2019. (PEW) AUGUST 30, 2021 706-43-10/Polls Majority Of U S Public 54% Favors Afghanistan Troop Withdrawal, Biden
Criticized For His Handling Of Situation
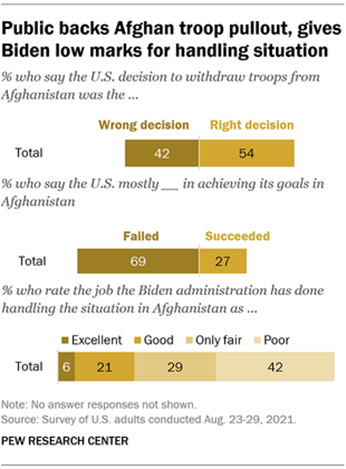
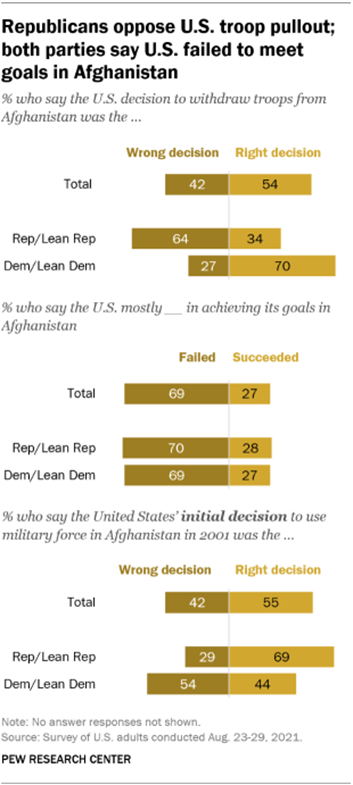
With the U.S. military evacuation of Afghanistan completed – bringing
America’s longest war to an end – 54% of U.S. adults say the decision to
withdraw troops from the country was the right one, while 42% say it was
wrong, according to a Pew Research Center survey conducted Aug. 23-29.
The survey, conducted before the U.S. military pullout was completed,
also finds that 69% of the public says the United States mostly failed in
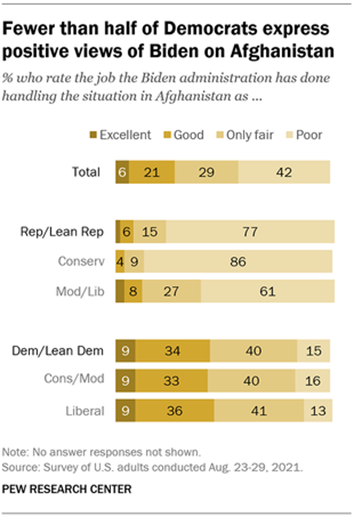
achieving its goals in Afghanistan. The public is also broadly critical of the Biden administration’s
handling of the situation in Afghanistan: Only about a quarter (26%) say the
administration has done an excellent or good job; 29% say the administration
has done an only fair job and 42% say it has done a poor job. Just 7% of Republicans and Republican-leaning independents rate the
administration’s performance on Afghanistan positively, and fewer than half
of Democrats and Democratic leaners (43%) say it has done an excellent or
good job. The survey was conducted as the U.S. was engaged in a massive
evacuation effort to bring Americans and Afghan allies of the U.S. out of
Afghanistan. Most of the survey was conducted before the Aug. 26 suicide
bombing at Kabul’s international airport that killed as many as 169 Afghans
and 13 U.S. service members. (The survey finds little overall change in
attitudes before and after the suicide attack.)
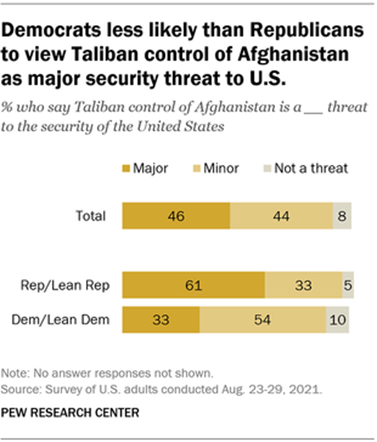
With the Taliban now in control of Afghanistan, most Americans
believe the situation in that country poses a security threat to the U.S.,
with 46% saying Taliban control represents a major threat and another 44%
saying it is a minor threat. Republicans (61%) are far more likely than
Democrats (33%) to view a Taliban-controlled Afghanistan as a major security
threat. Partisanship is evident in most, though not all, attitudes about the
emerging situation in Afghanistan. Views are most polarized when it comes to
the decision to withdraw: A sizable majority of Democrats (70%) support the
decision to withdraw U.S. forces from Afghanistan, while most Republicans
(64%) say it was the wrong decision.
Republicans and Democrats also differ (though to a lesser degree) on
the initial decision
to take military action in Afghanistan two decades ago. About two-thirds of
Republicans (69%) say the initial decision to use U.S. military force in
Afghanistan was right, compared with 44% of Democrats. Republicans have long
been more likely than Democrats to
view the initial decision as the right one. Yet there is notable agreement among members of both parties that the
U.S. mostly failed in achieving its goals in Afghanistan. Nearly identical
majorities of Republicans (70%) and Democrats (69%) say the U.S. failed to
accomplish its goals there. A large majority (71%) of Americans say the Biden administration has
done a poor (42%) or only fair (29%) job handling the situation in
Afghanistan. Just 26% say that the Biden administration has done an excellent
(6%) or good job (21%) handling the situation in Afghanistan.
Republicans overwhelmingly rate the administration’s handling of the
situation in Afghanistan as poor (77%), with just 7% rating it as either
excellent or good. Democratic opinion is more divided: About four-in-ten
(43%) rate the job the Biden administration has done as excellent or good,
while a narrow majority of Democrats (55%) say that the administration has
done an only fair (40%) or poor (15%) job. Conservative Republicans are more likely than moderate or liberal
Republicans (86% vs. 61%) to rate the job the Biden administration has done
as poor. Among Democrats, there are no ideological differences in evaluations
of the Biden administration’s handling of the situation in Afghanistan. (PEW) AUGUST 31, 2021 706-43-11/Polls Muslims Are A Growing Presence In U S, But Still Face Negative Views
From The Public
An unprecedented amount of public attention focused on Muslim
Americans in the wake of the terrorist attacks of Sept. 11, 2001. The U.S.
Muslim population has grown in the two decades since, but it is
still the case that many Americans know little about Islam or Muslims, and views
toward Muslims have become increasingly polarized
along political lines.
There were about 2.35 million Muslim adults and children living in
the United States in 2007 – accounting for 0.8% of the U.S. population – when
Pew Research Center began measuring this group’s size, demographic
characteristics and views. Since then, growth has been driven primarily by
two factors: the continued flow of Muslim immigrants into the U.S., and
Muslims’ tendency to have more children than Americans of other faiths. In 2015, the Center projected that Muslims could number 3.85 million
in the U.S. by 2020 – roughly 1.1%
of the total population. However, Muslim population growth from
immigration may have slowed recently due to changes in federal
immigration policy. The number of Muslim houses of worship in the U.S. also has increased
over the last 20 years. A study conducted in 2000 by the Cooperative
Congregational Studies Partnership identified 1,209 mosques in the U.S. that
year. Their follow-up study in 2011 found that the number of mosques had
grown to 2,106, and the 2020 version found
2,769 mosques – more than double the number from two decades earlier. Alongside their population growth, Muslims have gained a
larger presence in the public sphere. For example, in 2007, the 110th
Congress included the
first Muslim member, Rep. Keith Ellison, D-Minn. Later in that term,
Congress seated a second Muslim representative, Rep. Andre Carson, D-Ind.
The current
117th Congress has two more Muslims alongside Carson, the first
Muslim women to hold such office: Reps. Ilhan Omar, D-Minn., and Rashida
Tlaib, D-Mich., first elected in 2018. As their numbers have increased, Muslims have also reported
encountering more discrimination. In 2017, during the first few months of the
Trump administration, about half of Muslim American adults (48%) said they
had personally
experienced some form of discrimination because of their religion in
the previous year. This included a range of experiences, from people acting
suspicious of them to being physically threatened or attacked. In 2011, by
comparison, 43% of Muslim adults said they had at least one of these
experiences, and 40% said this in 2007.
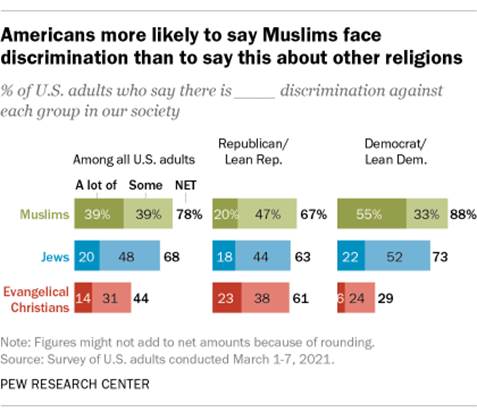
In a March
2021 survey, U.S. adults were asked how much discrimination they
think a number of religious groups face in society. Americans were more
likely to say they believe Muslims face “a lot” of discrimination than to say
the same about the other religious groups included in the survey, including
Jews and evangelical Christians. A similar pattern appeared in previous
surveys going back to 2009, when Americans were more likely to say that there
was a lot
of discrimination against Muslims than to say the same about Jews,
evangelical Christians, Mormons or atheists. A series of Pew Research Center surveys conducted in 2014, 2017,
and 2019 separately
asked Americans to rate religious groups on a scale ranging from 0 to 100,
with 0 representing the coldest, most negative possible view and 100
representing the warmest, most positive view. In these surveys, Muslims were
consistently ranked among
the coolest, along with atheists. Over the last 20 years, the American public has been divided on
whether Islam is more likely than other religions to encourage violence, and
a notable partisan divide on this question has emerged. When the Center first
asked this question on a telephone survey in 2002, Republicans and
Republican-leaning independents were only moderately more likely than
Democrats and Democratic leaners to say that Islam encourages violence more
than other religions – and this was a minority viewpoint in both partisan
groups. Within a few years, however, Republicans began to grow more
likely to believe that Islam encourages violence. Democrats, in
contrast, have become more likely to say Islam does not encourage violence.
Now, Republicans are far more likely than Democrats to say they believe Islam
encourages violence more than other religions. Though many Americans have negative views toward Muslims and Islam,
53% say they don’t personally know anyone who is Muslim, and a similar share
(52%) say they know “not
much” or “nothing at all” about Islam. Americans who are not Muslim and
who personally know someone who is Muslim are more likely to have a
positive view of Muslims, and they are less likely to believe that Islam
encourages violence more than other religions. (PEW) SEPTEMBER 1, 2021 706-43-12/Polls 90% Of Americans Say The Internet Has Been Essential Or Important To
Them
The coronavirus has
transformed many aspects of Americans’ lives. It shut down schools,
businesses and workplaces and forced millions to stay
at home for extended lengths of time. Public health authorities
recommended limits
on social contact to try to contain the spread of the virus, and
these profoundly altered the way many worked, learned, connected with loved
ones, carried out basic daily tasks, celebrated and mourned. For some, technology
played a role in this transformation. Results from a new Pew Research Center survey of U.S. adults
conducted April 12-18, 2021, reveal the extent to which people’s use of the
internet has changed, their views about how helpful technology has been for
them and the struggles some have faced. The vast majority of adults (90%) say the internet has been at least
important to them personally during the pandemic, the survey finds. The share
who say it has been essential –
58% – is up slightly from 53% in April 2020. There have also been upticks in
the shares who say the internet has been essential in the past year among
those with a bachelor’s degree or more formal education, adults under 30, and
those 65 and older. A large majority of Americans (81%) also say they talked with others
via video calls at some point since the pandemic’s onset. And for 40% of
Americans, digital tools have taken on new relevance: They report they used
technology or the internet in ways that were new or different to them. Some also
sought upgrades to their service as the pandemic unfolded: 29% of broadband
users did something to improve the speed, reliability or quality of their
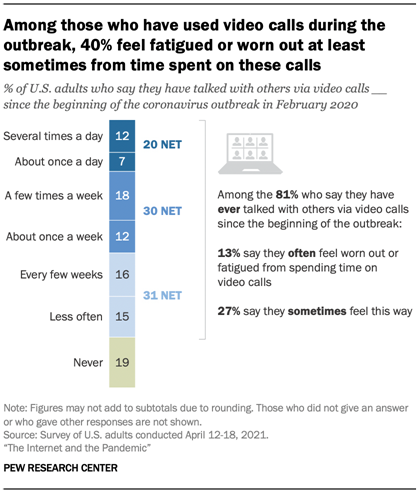
high-speed internet connection at home since the beginning of the outbreak. Still, tech use has not been an unmitigated boon for everyone. “Zoom fatigue” was
widely speculated to be a problem in the pandemic, and some Americans report
related experiences in the new survey: 40% of those who have ever talked with
others via video calls since the beginning of the pandemic say they have felt
worn out or fatigued often or sometimes by the time they spend on them.
Moreover, changes
in screen time occurred for Americans
generally and for parents
of young children. The survey finds that a third of all adults
say they tried to cut back on time spent on their smartphone or the internet
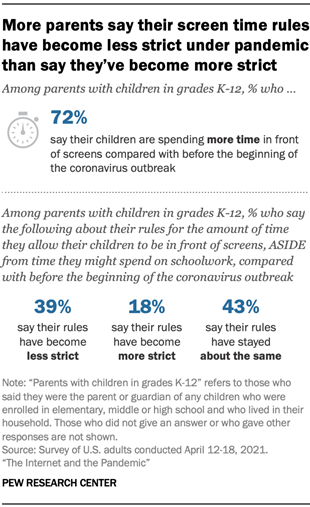
at some point during the pandemic. In addition, 72% of parents of children in
grades K-12 say their kids are spending more time on screens compared with
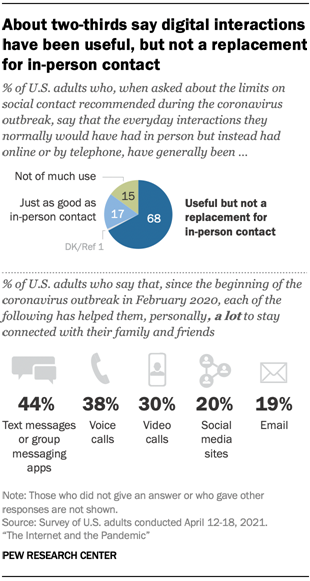
before the outbreak.1 For many, digital interactions could only do so much as a stand-in
for in-person communication. About two-thirds of Americans (68%) say the
interactions they would have had in person, but instead had online or over
the phone, have generally been useful – but not a replacement for in-person
contact. Another 15% say these tools haven’t been of much use in their
interactions. Still, 17% report that these digital interactions have been
just as good as in-person contact.
Some types of technology have been more helpful than others for
Americans. For example, 44% say text messages or group messaging apps have
helped them a lot to stay connected with family and friends, 38% say the same
about voice calls and 30% say this about video calls. Smaller shares say
social media sites (20%) and email (19%) have helped them in this way. The survey offers a snapshot of Americans’ lives just over one year
into the pandemic as they reflected back on what had happened. It is
important to note the findings were gathered in April 2021, just before all
U.S. adults became eligible for coronavirus vaccines. At the time, some
states were beginning
to loosen restrictions on businesses and social encounters. This
survey also was fielded before the delta variant became
prominent in the United States, raising
concerns about new and evolving
variants. Here are some of the key takeaways from the survey. Americans’ tech experiences in the pandemic
are linked to digital divides, tech readiness Some Americans’ experiences with technology haven’t been smooth or
easy during the pandemic. The digital divides related to internet
use and affordability were
highlighted by the pandemic and also emerged in new ways as life moved
online. For all Americans relying on screens during the pandemic, connection
quality has been important for school assignments, meetings and
virtual social encounters alike. The new survey highlights difficulties for
some: Roughly half of those who have a high-speed internet connection at
home (48%) say they have problems with the speed, reliability or quality
of their home connection often or sometimes.2 Beyond that, affordability remained
a persistent concern for a portion of digital tech users as the
pandemic continued – about a quarter of home broadband users (26%) and
smartphone owners (24%) said in the April 2021 survey that they worried a lot
or some about paying their internet and cellphone bills over the next few
months. From parents of children facing the “homework
gap” to Americans struggling to afford
home internet, those with lower incomes have been particularly likely to
struggle. At the same time, some of those with higher incomes have been
affected as well.
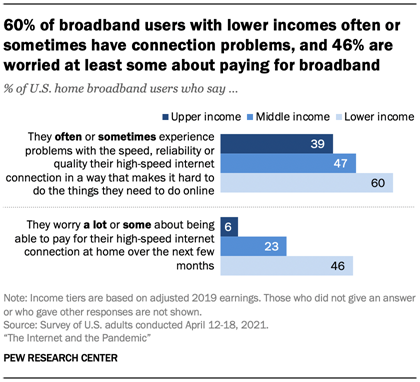
Affordability and connection problems have hit broadband users with
lower incomes especially hard. Nearly half of broadband users with lower
incomes, and about a quarter of those with midrange incomes, say that as of
April they were at least somewhat worried about paying their internet bill
over the next few months.3 And
home broadband users with lower incomes are roughly 20 points more likely to
say they often or sometimes experience problems with their connection than
those with relatively high incomes. Still, 55% of those with lower incomes
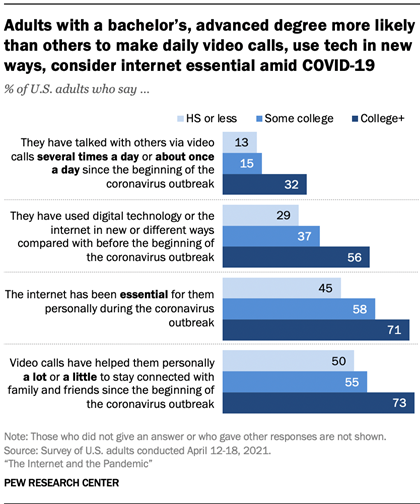
say the internet has been essential to them personally in the pandemic. At the same time, Americans’ levels of formal education are
associated with their experiences turning to tech during the pandemic.
Those with a bachelor’s or advanced degree are about twice as likely
as those with a high school diploma or less formal education to have used
tech in new or different ways during the pandemic. There is also roughly a 20
percentage point gap between these two groups in the shares who have made
video calls about once a day or more often and who say these calls have
helped at least a little to stay connected with family and friends. And 71%
of those with a bachelor’s degree or more education say the internet has been
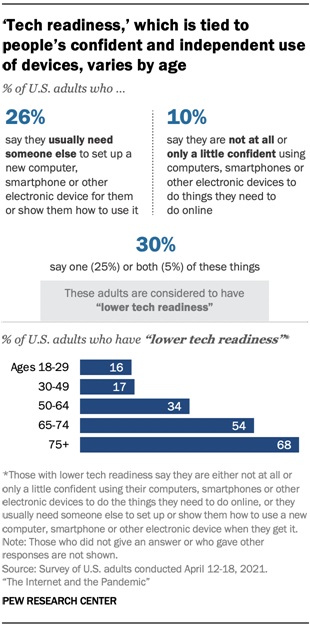
essential, compared with 45% of those with a high school diploma or less. More broadly, not all Americans believe they have key tech skills. In
this survey, about a quarter of adults (26%) say they usually need someone
else’s help to set up or show them how to use a new computer, smartphone or
other electronic device. And one-in-ten report they have little to no
confidence in their ability to use these types of devices to do the things
they need to do online. This report refers to those who say they experience
either or both of these issues as having “lower tech readiness.” Some 30% of
adults fall in this category. (A full description of how this group was
identified can be found in Chapter
3.)
These struggles are particularly acute for older adults, some of whom
have had to learn
new tech skills over the course of the pandemic. Roughly two-thirds
of adults 75 and older fall into the group having lower tech readiness – that
is, they either have little or no confidence in their ability to use their
devices, or generally need help setting up and learning how to use new
devices. Some 54% of Americans ages 65 to 74 are also in this group. Americans with lower tech readiness have had different experiences
with technology during the pandemic. While 82% of the Americans with lower
tech readiness say the internet has been at least important to them
personally during the pandemic, they are less likely than those with higher
tech readiness to say the internet has been essential (39% vs. 66%). Some 21%
of those with lower tech readiness say digital interactions haven’t been of
much use in standing in for in-person contact, compared with 12% of those
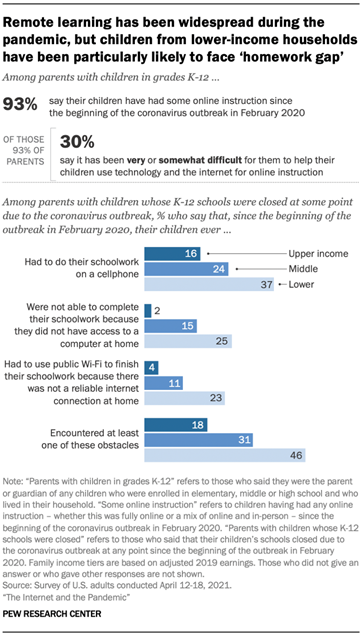
with higher tech readiness. 46% of parents with lower incomes whose
children faced school closures say their children had at least one problem
related to the ‘homework gap’ As school moved online for many families, parents and their children
experienced profound changes. Fully 93% of parents with K-12 children at home
say these children had some online instruction during the pandemic. Among
these parents, 62% report that online learning has gone very or somewhat
well, and 70% say it has been very or somewhat easy for them to help their
children use technology for online instruction. Still, 30% of the parents whose children have had online instruction
during the pandemic say it has been very or somewhat difficult for them to
help their children use technology or the internet for this.
The survey also shows that children from households with lower
incomes who faced school closures in the pandemic have been especially likely
to encounter tech-related obstacles in completing their schoolwork – a
phenomenon contributing to the “homework
gap.” Overall, about a third (34%) of all parents whose children’s schools
closed at some point say their children have encountered at least one of the
tech-related issues we asked about amid COVID-19: having to do schoolwork on
a cellphone, being unable to complete schoolwork because of lack of computer
access at home, or having to use public Wi-Fi to finish schoolwork because
there was no reliable connection at home. This share is higher among parents with lower incomes whose
children’s schools closed. Nearly half (46%) say their children have faced at
least one of these issues. Some with higher incomes were affected as well –
about three-in-ten (31%) of these parents with midrange incomes say their
children faced one or more of these issues, as do about one-in-five of these
parents with higher household incomes.
Prior Center work has documented this “homework
gap” in other contexts – both before
the coronavirus outbreak and near
the beginning of the pandemic. In April 2020, for example, parents with
lower incomes were particularly likely to think their children would face
these struggles amid the outbreak. Besides issues related to remote schooling, other changes were afoot
in families as the pandemic forced many families to shelter in place. For
instance, parents’ estimates of their children’s screen time – and family
rules around this – changed in some homes. About seven-in-ten parents with
children in kindergarten through 12th grade (72%) say their children were
spending more time on screens as of the April survey compared with before the
outbreak. Some 39% of parents with school-age children say they have become
less strict about screen time rules during the outbreak. About one-in-five
(18%) say they have become more strict, while 43% have kept screen time rules
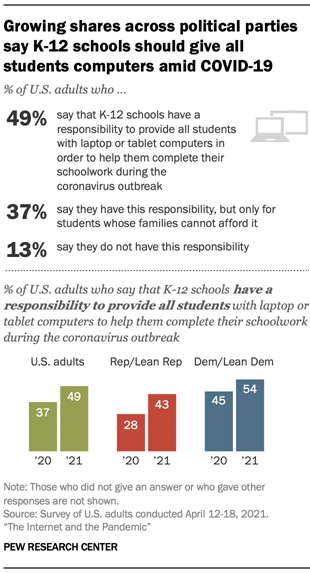
about the same. More adults now favor the idea that schools
should provide digital technology to all students during the pandemic than
did in April 2020 Americans’ tech struggles related to digital divides gained attention
from policymakers and news
organizations as the pandemic progressed. On some policy issues, public attitudes changed over the course of
the outbreak – for example, views on what K-12 schools should provide to students
shifted. Some 49% now say K-12 schools have a responsibility to provide all
students with laptop or tablet computers in order to help them complete their
schoolwork during the pandemic, up 12 percentage points from a year ago.
The shares of those who say so have increased for both major
political parties over the past year: This view shifted 15 points for
Republicans and those who lean toward the GOP, and there was a 9-point
increase for Democrats and Democratic leaners. However, when it comes to views of policy solutions for internet
access more generally, not much has changed. Some 37% of Americans say that
the government has a responsibility to ensure all Americans have high-speed
internet access during the outbreak, and the overall share is unchanged from
April 2020 – the first time Americans were asked this specific question about
the government’s pandemic responsibility to provide internet access.4 Democrats are more likely than Republicans to say the government has
this responsibility, and within the Republican Party, those with lower
incomes are more likely to say this than their counterparts earning more money. Video calls and conferencing have been part
of everyday life Americans’ own words provide insight into exactly how their lives
changed amid COVID-19. When asked to describe the new or different ways they
had used technology, some Americans mention video calls and conferencing
facilitating a variety of virtual interactions – including attending events
like weddings, family holidays and funerals or transforming where and how
they worked.5 From
family calls, shopping for groceries and placing takeout orders online to
having telehealth visits with medical professionals or participating in
online learning activities, some aspects of life have been virtually
transformed: “I’ve gone from not even knowing remote
programs like Zoom even existed, to using them nearly every day.” – Man, 54 “[I’ve been] handling … deaths of family
and friends remotely, attending and sharing classical music concerts and
recitals with other professionals, viewing [my] own church services and Bible
classes, shopping. … Basically, [the internet has been] a lifeline.” “I … use Zoom for church youth activities.
[I] use Zoom for meetings. I order groceries and takeout food online. We
arranged for a ‘digital reception’ for my daughter’s wedding as well as live
streaming the event.” – Woman, 44
When asked about video calls specifically, half of Americans report
they have talked with others in this way at least once a week since the
beginning of the outbreak; one-in-five have used these platforms daily. But
how often people have experienced this type of digital connectedness varies
by age. For example, about a quarter of adults ages 18 to 49 (27%) say they
have connected with others on video calls about once a day or more often,
compared with 16% of those 50 to 64 and just 7% of those 65 and older. Even as video technology became a part of life for users, many accounts
of burnout surfaced and some speculated that “Zoom fatigue” was
setting in as Americans grew weary of this type of screen time. The survey
finds that some 40% of those who participated in video calls since the
beginning of the pandemic – a third of all Americans – say they feel worn out
or fatigued often or sometimes from the time they spend on video
calls. About three-quarters of those who have been on these calls
several times a day in the pandemic say this. Fatigue is not limited to frequent users, however: For example, about
a third (34%) of those who have made video calls about once a week say they
feel worn out at least sometimes. These are among the main findings from the survey. Other key results
include: Some Americans’ personal lives and social
relationships have changed during the pandemic: Some
36% of Americans say their own personal lives changed in a major way as a
result of the coronavirus outbreak. Another 47% say their personal lives
changed, but only a little bit. About
half (52%) of those who say major change has occurred in their personal lives
due to the pandemic also say they have used tech in new ways, compared with
about four-in-ten (38%) of those whose personal lives changed a little bit
and roughly one-in-five (19%) of those who say their personal lives stayed
about the same. Even as tech helped some to stay connected, a quarter of Americans
say they feel less close to close family members now compared with before the
pandemic, and about four-in-ten (38%) say the same about friends they know
well. Roughly half (53%) say this about casual acquaintances. The majority of those who tried to sign up
for vaccine appointments in the first part of the year went online to do
so: Despite early problems with vaccine rollout and online
registration systems, in the April survey tech problems did not appear to be major struggles
for most adults who had tried to sign up online for COVID-19 vaccines. The
survey explored Americans’ experiences getting these vaccine appointments and
reveals that in April 57% of adults had tried to sign themselves up and 25%
had tried to sign someone else up. Fully 78% of those who tried to sign
themselves up and 87% of those who tried to sign others up were online
registrants. When it comes to difficulties with the online vaccine signup process,
29% of those who had tried to sign up online – 13% of all Americans – say it
was very or somewhat difficult to sign themselves up for vaccines at that
time. Among five reasons for this that the survey asked about, the most common major reason was lack of available
appointments, rather than tech-related problems. Adults 65 and older who
tried to sign themselves up for the vaccine online were the most likely age
group to experience at least some difficulty when they tried to get a vaccine
appointment. Tech struggles and usefulness alike vary by
race and ethnicity. Americans’ experiences also
have varied across racial and ethnic groups. For example, Black Americans are
more likely than White or Hispanic adults to meet the criteria for having
“lower tech readiness.”6 Among
broadband users, Black and Hispanic adults were also more likely than White
adults to be worried about paying their bills for their high-speed internet
access at home as of April, though the share of Hispanic Americans who say
this declined sharply since April 2020. And a majority of Black and Hispanic
broadband users say they at least sometimes have experienced problems with
their internet connection. Still, Black adults and Hispanic adults are more likely than White
adults to say various technologies – text messages, voice calls, video calls,
social media sites and email – have helped them a lot to stay connected with
family and friends amid the pandemic. Tech has helped some adults under 30 to
connect with friends, but tech fatigue also set in for some. Only
about one-in-five adults ages 18 to 29 say they feel closer to friends they
know well compared with before the pandemic. This share is twice as high as
that among adults 50 and older. Adults under 30 are also more likely than any
other age group to say social media sites have helped a lot in staying
connected with family and friends (30% say so), and about four-in-ten of
those ages 18 to 29 say this about video calls. Screen time affected some negatively, however. About six-in-ten
adults under 30 (57%) who have ever made video calls in the pandemic say they
at least sometimes feel worn out or fatigued from spending time on video
calls, and about half (49%) of young adults say they have tried to cut back
on time spent on the internet or their smartphone. (PEW) SEPTEMBER 1, 2021 Source: https://www.pewresearch.org/internet/2021/09/01/the-internet-and-the-pandemic/ 706-43-13/Polls Two Decades Later, The Enduring Legacy Of 9/11
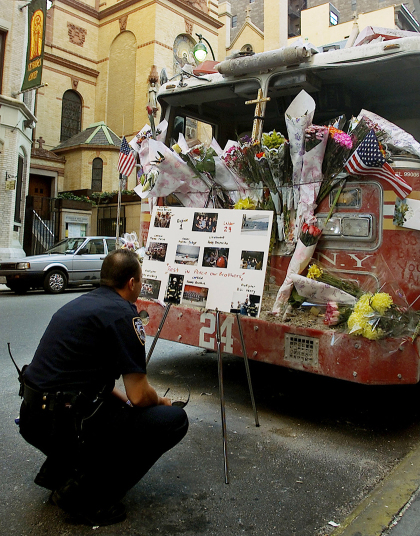
Americans watched in horror as the terrorist attacks of Sept. 11,
2001, left nearly 3,000 people dead in New York City, Washington, D.C., and
Shanksville, Pennsylvania. Nearly 20 years later, they watched in sorrow as
the nation’s military mission in Afghanistan – which began less than a month
after 9/11 – came to a bloody and chaotic conclusion.
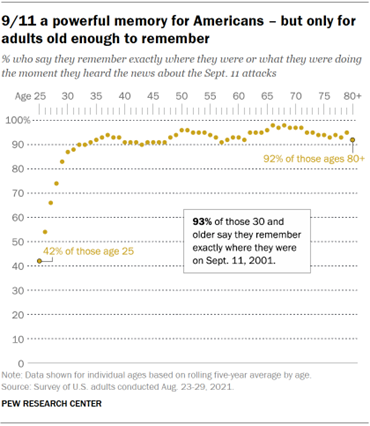
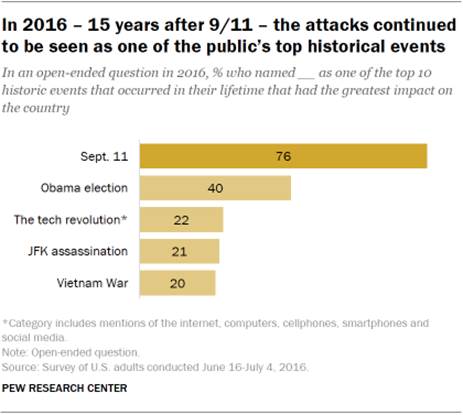
The enduring power of the Sept. 11 attacks is clear: An overwhelming
share of Americans who are old enough to recall the day remember where they
were and what they were doing when they heard the news. Yet an ever-growing
number of Americans have no personal memory of that day, either because they
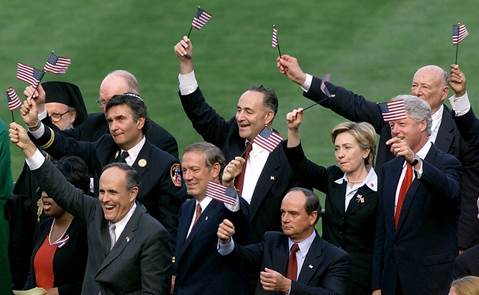
were too young or not yet born. A review of U.S. public opinion in the two decades since 9/11 reveals
how a badly shaken nation came together, briefly, in a spirit of sadness and
patriotism; how the public initially rallied behind the wars in Afghanistan
and Iraq, though support waned over time; and how Americans viewed the threat
of terrorism at home and the steps the government took to combat it. As the country comes to grips with the tumultuous exit of U.S.
military forces from Afghanistan, the departure has raised long-term
questions about U.S. foreign policy and America’s place in the world. Yet the
public’s initial judgments on that mission are clear: A majority endorses the
decision to withdraw from Afghanistan, even as it criticizes the Biden
administration’s handling of the situation. And after a war that cost
thousands of lives – including more than 2,000 American service members – and
trillions of dollars in military spending, a new Pew Research Center survey
finds that 69% of U.S. adults say the United
States has mostly failed to achieve its goals in Afghanistan. A devastating emotional toll, a lasting
historical legacy Shock, sadness, fear, anger: The 9/11 attacks inflicted a devastating
emotional toll on Americans. But as horrible as the events of that day were, a
63% majority of Americans said they couldn’t stop watching news coverage of
the attacks.
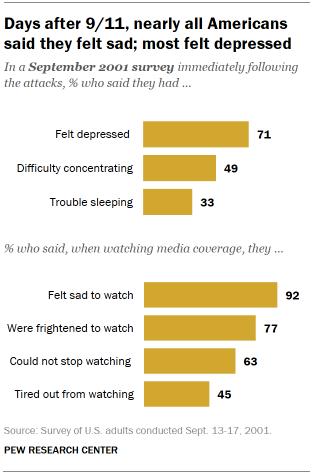
Our first survey following
the attacks went into the field just days after 9/11, from Sept. 13-17, 2001.
A sizable majority of adults (71%) said they felt depressed, nearly half
(49%) had difficulty concentrating and a third said they had trouble
sleeping. It was an era in which television was still the public’s dominant
news source – 90% said they got most of their news about the attacks from
television, compared with just 5% who got news online – and the televised
images of death and destruction had a powerful impact. Around nine-in-ten
Americans (92%) agreed with the statement, “I feel sad when watching TV
coverage of the terrorist attacks.” A sizable majority (77%) also found it
frightening to watch – but most did so anyway. Americans were enraged by the attacks, too. Three
weeks after 9/11, even as the psychological stress began to ease
somewhat, 87% said they felt angry about the attacks on the World Trade
Center and Pentagon. Fear was widespread, not just in the days immediately after the
attacks, but throughout the fall of 2001. Most Americans said they were very
(28%) or somewhat (45%) worried about
another attack. When asked a
year later to describe how their lives changed in a major way, about
half of adults said they felt more afraid, more careful, more distrustful or
more vulnerable as a result of the attacks.
A New York City police officer pauses at a makeshift memorial on the
firetruck of Ladder Company 24 on Sept. 13, 2001, in New York City. Hundreds
of the city’s firefighters lost their lives in the 9/11 attacks on the World
Trade Center. (Jose Jimenez/Primera Hora/Getty Images) Even after the immediate shock of 9/11 had subsided, concerns over
terrorism remained at higher levels in major cities – especially New York and
Washington – than in small towns and rural areas. The personal impact of the
attacks also was felt more keenly in the cities directly targeted: Nearly
a year after 9/11, about six-in-ten adults in the New York (61%) and
Washington (63%) areas said the attacks had changed their lives at least a
little, compared with 49% nationwide. This sentiment was shared by residents
of other large cities. A quarter of people who lived in large cities
nationwide said their lives had changed in a major way – twice the rate found
in small towns and rural areas. The impacts of the Sept. 11 attacks were deeply felt and slow to
dissipate. By the following August, half of U.S. adults said the country “had
changed in a major way” – a number that actually increased, to 61%, 10
years after the event. A year after the attacks, in an open-ended question, most Americans –
80% – cited 9/11 as the most important event that had occurred in the country
during the previous year. Strikingly, a larger share also volunteered it as
the most important thing that happened to them personally in the prior year (38%)
than mentioned other typical life events, such as births or deaths. Again,
the personal impact was much greater in New York and Washington, where 51%
and 44%, respectively, pointed to the attacks as the most significant
personal event over the prior year.
Just as memories of 9/11 are firmly embedded in the minds of most
Americans old enough to recall the attacks, their historical importance far
surpasses other events in people’s lifetimes. In a survey conducted by Pew
Research Center in association with A+E Networks’ HISTORY in 2016 – 15 years
after 9/11 – 76% of adults named the Sept. 11 attacks as one of the 10
historical events of their lifetime that had the greatest impact on
the country. The election of Barack Obama as the first Black president was a
distant second, at 40%. The importance of 9/11 transcended age, gender, geographic and even
political differences. The 2016 study noted that while partisans agreed on
little else that election cycle, more than seven-in-ten Republicans and
Democrats named the attacks as one of their top 10 historic events.
New York City Mayor Rudolph Giuliani leads a group in flag waving,
including New York Gov. George Pataki, acting New Jersey Gov. Donald
DiFrancesco, New York Fire Department Rabbi Joseph Potasnik, Sens. Chuck
Schumer and Hillary Clinton, former President Bill Clinton and former New
York City Mayor Ed Koch, at a memorial service at Yankee Stadium on Sept. 23,
2001. (Jeff Haynes/AFP via Getty Images) 9/11 transformed U.S. public opinion, but
many of its impacts were short-lived It is difficult to think of an event that so profoundly transformed
U.S. public opinion across so many dimensions as the 9/11 attacks. While
Americans had a shared sense of anguish after Sept. 11, the months that
followed also were marked by rare spirit of public unity.
Patriotic sentiment surged in the aftermath of 9/11. After the U.S.
and its allies launched airstrikes against Taliban and al-Qaida forces in
early October 2001, 79% of adults said they had displayed an American flag. A
year later, a 62% majority said they had often felt patriotic as a result of
the 9/11 attacks. Moreover, the public largely set aside political differences and
rallied in support of the nation’s major institutions, as well as its
political leadership. In October 2001, 60% of adults expressed trust
in the federal government – a level not reached in the previous
three decades, nor approached in the two decades since then. George W. Bush, who had become president nine months earlier after a
fiercely contested election, saw his job approval rise 35 percentage points
in the space of three weeks. In late September 2001, 86% of adults –
including nearly all Republicans (96%) and a sizable majority of Democrats
(78%) – approved of the way Bush was handling his job as president. Americans also turned to religion and faith in large numbers. In the
days and weeks after 9/11, most Americans said they were praying more often.
In November 2001, 78% said religion’s influence in American life was
increasing, more than double the share who said that eight months earlier and
– like public trust in the federal government – the
highest level in four decades. Public esteem rose even for some institutions that usually are not
that popular with Americans. For example, in November 2001, news
organizations received record-high ratings for professionalism. Around
seven-in-ten adults (69%) said they “stand up for America,” while 60% said
they protected democracy. Yet in many ways, the “9/11 effect” on public opinion was
short-lived. Public trust in government, as well as confidence in other
institutions, declined throughout the 2000s. By 2005, following another major
national tragedy – the government’s mishandling of the relief effort for
victims of Hurricane Katrina – just 31% said they trusted the federal
government, half the share who said so in the months after 9/11. Trust has
remained relatively low for the past two decades: In
April of this year, only 24% said they trusted the government just
about always or most of the time. Bush’s approval ratings, meanwhile, never again reached the lofty
heights they did shortly after 9/11. By the end of his presidency, in
December 2008, just
24% approved of his job performance.
U.S. military response: Afghanistan and
Iraq With the U.S. now formally out of Afghanistan – and with the Taliban
firmly in control of the country – most Americans (69%) say the U.S.
failed in achieving its goals in Afghanistan.
But 20 years ago, in the days and weeks following 9/11, Americans
overwhelmingly supported military action against those responsible for the
attacks. In mid-September 2001, 77% favored U.S. military action, including
the deployment of ground forces, “to retaliate against whoever is responsible
for the terrorist attacks, even if that means U.S. armed forces might suffer
thousands of casualties.” Many Americans were impatient for the Bush administration to give the
go-ahead for military action. In a late September 2001 survey, nearly half
the public (49%) said their larger concern was that the Bush administration
would not strike quickly enough against the terrorists; just 34% said they
worried the administration would move too quickly. Even in the early stages of the U.S. military response, few adults
expected a military operation to produce quick results: 69% said it would
take months or years to dismantle terrorist networks, including 38% who said
it would take years and 31% who said it would take several months. Just 18%
said it would take days or weeks. The public’s support for military intervention was evident in other ways
as well. Throughout the fall of 2001, more Americans said the best way to
prevent future terrorism was to take military action abroad rather than build
up defenses at home. In early October 2001, 45% prioritized military action
to destroy terrorist networks around the world, while 36% said the priority
should be to build terrorism defenses at home.
Construction workers in Times Square put up American flags and signs
on Sept. 13, 2001. (Joe Raedle/Getty Images) Initially, the public was confident that the U.S. military effort to
destroy terrorist networks would succeed. A sizable majority (76%) was
confident in the success of this mission, with 39% saying they were very
confident. Support for the war in Afghanistan continued at a high level for
several years to come. In a survey conducted in early 2002, a few months
after the start of the war, 83% of Americans said they approved of the
U.S.-led military campaign against the Taliban and al-Qaida in Afghanistan.
In 2006, several years after the United States began combat operations in
Afghanistan, 69% of adults said the U.S. made the right decision in using
military force in Afghanistan. Only two-in-ten said it was the wrong
decision.
But as the conflict dragged on, first through Bush’s presidency and
then through Obama’s administration, support wavered and a growing share of
Americans favored the withdrawal of U.S. forces from Afghanistan. In June
2009, during Obama’s first year in office, 38% of Americans said U.S. troops
should be removed from Afghanistan as soon as possible. The share favoring a
speedy troop withdrawal increased over the next few years. A turning point
came in May 2011, when U.S. Navy SEALs launched a risky operation against
Osama bin Laden’s compound in Pakistan and killed the al-Qaida leader. The public reacted to bin Laden’s death with more of a
sense of relief than jubilation. A month later, for
the first time, a majority of Americans (56%) said that U.S. forces
should be brought home as soon as possible, while 39% favored U.S. forces in the
country until the situation had stabilized. Over the next decade, U.S. forces in Afghanistan were gradually drawn
down, in fits and starts, over the administrations of three presidents –
Obama, Donald Trump and Joe Biden. Meanwhile, public support for the decision
to use force in Afghanistan, which had been widespread at the start of the
conflict, declined.
Today, after the tumultuous exit of U.S. troops from Afghanistan, a slim
majority of adults (54%) say the decision to withdraw troops from the country
was the right decision; 42% say it was the wrong decision. There was a similar trajectory in public attitudes toward a much more
expansive conflict that was part of what Bush termed the “war on terror”: the
U.S. war in Iraq. Throughout the contentious, yearlong debate before the U.S.
invasion of Iraq, Americans widely supported the use of military force to end
Saddam Hussein’s rule in Iraq. Importantly, most Americans thought – erroneously, as it turned out –
there was a direct connection between Saddam Hussein and the 9/11 attacks. In
October 2002, 66% said that Saddam helped the terrorists involved in the 9/11
attacks on the World Trade Center and the Pentagon. In April 2003, during the first month of the Iraq War, 71% said the
U.S. made the right decision to go to war in Iraq. On the 15th anniversary of
the war in 2018, just
43% said it was the right decision. As with the case with U.S.
involvement in Afghanistan, more Americans said that the U.S. had failed
(53%) than succeeded (39%) in achieving its goals in Iraq.
Tom Ridge, then director of the White House’s Office of Homeland
Security, presents a new color-coded terrorist threat warning system in March
2002 in Washington, D.C. (Joshua Roberts/AFP via Getty Images) The ‘new normal’: The threat of terrorism
after 9/11 There have been no terrorist attacks on the scale of 9/11 in two
decades, but from the public’s perspective, the threat has never fully gone
away. Defending the country from future terrorist attacks has been at
or near the top of Pew Research Center’s annual survey on policy
priorities since 2002.
In January 2002, just months after the 2001 attacks, 83% of Americans
said “defending the country from future terrorist attacks” was a top priority
for the president and Congress, the highest for any issue. Since then,
sizable majorities have continued to cite that as a top policy priority. Majorities of both Republicans and Democrats have consistently ranked
terrorism as a top priority over the past two decades, with some exceptions.
Republicans and Republican-leaning independents have remained more likely
than Democrats and Democratic leaners to say defending the country from
future attacks should be a top priority. In recent years, the partisan gap
has grown larger as Democrats began to rank the issue lower relative to other
domestic concerns. A 2010
analysis of the public’s terrorism concerns found that the share of
Americans who said they were very concerned about another attack had ranged
from about 15% to roughly 25% since 2002. The only time when concerns were
elevated was in February 2003, shortly before the start of the U.S. war in
Iraq. In recent years, the share of Americans who point to terrorism as a
major national problem has declined sharply as issues such as the economy,
the COVID-19 pandemic and racism have emerged as more pressing problems in
the public’s eyes.
In 2016, about half of the public (53%) said terrorism was a very big
national problem in the country. This declined to about four-in-ten from 2017
to 2019. Last year, only a quarter of Americans said that terrorism was a
very big problem. This year, prior to the U.S. withdrawal of forces from Afghanistan
and the subsequent Taliban takeover of the country, a somewhat larger share
of adults said domestic
terrorism was a very
big national problem (35%) than said the same about international
terrorism. But much larger
shares cited concerns such as the affordability of health care (56%) and the
federal budget deficit (49%) as major problems than said that about either
domestic or international terrorism. Still, recent events in Afghanistan raise the possibility that
opinion could be changing, at least in the short term. In a late August
survey, 89% of Americans said the Taliban takeover of Afghanistan was a
threat to the security of the U.S., including 46% who said it was a major
threat.
A Transportation Security Administration worker screens a traveler
departing from O’Hare International Airport in Chicago in September 2002.
(Tim Boyle/Getty Images) Addressing the threat of terrorism at home
and abroad Just as Americans largely endorsed the use of U.S. military force as
a response to the 9/11 attacks, they were initially open to a variety of
other far-reaching measures to combat terrorism at home and abroad. In the
days following the attack, for example, majorities favored a requirement that
all citizens carry national ID cards, allowing the CIA to contract with
criminals in pursuing suspected terrorists and permitting the CIA to conduct
assassinations overseas when pursuing suspected terrorists.
However, most people drew the line against allowing the government to
monitor their own emails
and phone calls (77% opposed this). And while 29% supported the establishment
of internment camps for legal immigrants from unfriendly countries during
times of tension or crisis – along the lines of those in which thousands of
Japanese American citizens were confined during World War II – 57% opposed
such a measure. It was clear that from the public’s perspective, the balance between
protecting civil liberties and protecting the country from terrorism had
shifted. In September 2001 and January 2002, 55% majorities said that, in
order to curb terrorism in the U.S., it was necessary for the average citizen
to give up some civil liberties. In 1997, just 29% said this would be
necessary while 62% said it would not. For most of the next two decades, more Americans said their bigger
concern was that the government had
not gone far enough in protecting the country from terrorism than
said it went too far in restricting civil liberties. The public also did not rule out the use of torture to extract
information from terrorist suspects. In a 2015
survey of 40 nations, the U.S. was one of only 12 where a majority
of the public said the use of torture against terrorists could be justified
to gain information about a possible attack.
President George W. Bush talks with community leaders before
delivering a speech at the Islamic Center of Washington on Sept. 17, 2001.
(Smith Collection/Gado/Getty Images). Views of Muslims, Islam grew more partisan
in years after 9/11 Concerned about a possible backlash against Muslims in the U.S. in
the days after 9/11, then-President George W. Bush gave a speech to the
Islamic Center in Washington, D.C., in which he declared: “Islam is peace.”
For a brief period, a large segment of Americans agreed. In November 2001,
59% of U.S. adults had a favorable view of Muslim Americans, up from 45% in
March 2001, with comparable majorities of Democrats and Republicans
expressing a favorable opinion.
This spirit of unity and comity was not to last. In a September 2001
survey, 28% of adults said they had grown more suspicious of people of Middle
Eastern descent; that grew to 36% less than a year later. Republicans, in particular, increasingly came to associate Muslims
and Islam with violence. In 2002, just a quarter of Americans – including 32%
of Republicans and 23% of Democrats – said Islam was more likely than other
religions to encourage violence among its believers. About twice as many
(51%) said it was not. But within the next few years, most Republicans and GOP leaners said
Islam was more likely than other religions to encourage violence. Today, 72%
of Republicans express this view, according to an August 2021 survey. Democrats consistently have been far less likely than Republicans to
associate Islam with violence. In the Center’s latest survey, 32% of
Democrats say this. Still, Democrats are somewhat more likely to say this
today than they have been in recent years: In 2019, 28% of Democrats said
Islam was more likely than other religions to encourage violence among its
believers than other religions. The partisan gap in views of Muslims and Islam in the U.S. is evident
in other meaningful ways. For example, a 2017
survey found that half of U.S. adults said that “Islam is not part
of mainstream American society” – a view held by nearly seven-in-ten
Republicans (68%) but only 37% of Democrats. In a separate survey conducted
in 2017, 56% of Republicans said there was a great deal or fair amount of
extremism among U.S. Muslims, with fewer than half as many Democrats (22%)
saying the same. The rise of anti-Muslim sentiment in the aftermath of 9/11 has had
a profound
effect on the growing number of Muslims living in the United States.
Surveys of U.S. Muslims from 2007-2017 found increasing shares saying they
have personally experienced discrimination and received public expression of
support.
Flags fly during a ceremony at the Pentagon marking the one-year
anniversary of the 9/11 terrorist attacks. (Robyn Beck/AFP via Getty Images) It has now been two decades since the terrorist attacks on the World
Trade Center and Pentagon and the crash of Flight 93 – where only the courage
of passengers and crew possibly prevented an even deadlier terror attack. For most who are old enough to remember, it is a day that is
impossible to forget. In many ways, 9/11 reshaped how Americans think of war
and peace, their own personal safety and their fellow citizens. And today,
the violence and chaos in a country half a world away brings with it the
opening of an uncertain new chapter in the post-9/11 era. (PEW) SEPTEMBER 2, 2021 Source: https://www.pewresearch.org/politics/2021/09/02/two-decades-later-the-enduring-legacy-of-9-11/ 706-43-14/Polls Three Quarters (74%) Support Mandatory Vaccination for Public-Facing
Workers; 65% Support Same for Return-To-Office
Toronto, ON, Sept. 2, 2021 — As
more businesses and institutions across the country make plans for a return
to work and school this fall, a strong majority of Canadians (74%) agree
public-facing workers, such as healthcare workers, transit workers, servers,
or grocery store clerks, should be required to be vaccinated. Half (51%) say
they strongly agree with this sentiment (22% somewhat agree). When returning
to the workplace, 65% of Canadians agree (28% somewhat/38% strongly) that
businesses should implement mandatory vaccinations in their return-to-office
plans. Mandatory vaccination has proven to be a divisive issue among federal
election candidates, as Conservative Party leader Erin O’Toole continues to
campaign against mandatory vaccination and other leaders take advantage of
public support for these measures in campaigning against him. However,
consistent with previous Ipsos polling,[1] Conservative
voters continue to express support for mandatory vaccine measures for
public-facing workers (70%), though at a lesser level than Liberal Party
voters (88%) and NDP voters (86%): Agreement by Stated Vote Choice (Strongly/somewhat agree)
Canadians also support work-from-home measures as a means of curbing
the spread of COVID-19: 78% agree (39% somewhat/40% strongly) that, if able
to, work from home should continue in the fall due to the rise in Delta
cases. Two-thirds (65%) of Canadians agree that Canada should have a
federal-level vaccination passport (26% somewhat/40% strongly). While
previous Ipsos polling regarding vaccine passports saw 72% of Canadians
supporting vaccine passports being required to enter restaurants, gyms, or
other indoor spaces, support for a federal-level implementation is not quite
as strong, in part driven by large differences among regions in the country. Those in British Columbia are significantly more likely to support
(79%) than other regions, and those in Atlantic Canada (55%) and Quebec (59%)
least likely to support (67% ON, 66% AB, 64% SK/MB). In the aftermath of hackers
gaining access to Quebec’s just-launched provincial vaccine passport, those
without a current or announced vaccine passport system, such as Atlantic
Canadians, may be skeptical of its usefulness. Those from Quebec may not see
the need for a federal passport with their own provincial passport already in
place. Border Opening with US Too Soon, Say
Canadians When it comes to border restrictions, Canadians have reservations
that re-opening was a sound decision, undoubtedly informed by the current wave
of variant COVID-19 infections across the US. Two-thirds (66%) agree that
Canada should have waited to re-open the US/Canada border (34% somewhat/32%
strongly), compared to the fifth (18%) who feel Canada should have re-opened
our border earlier. Just under four in ten (39%) agree that Canada should be
doing more than it currently is to push the US to open its borders to fully
vaccinated travelers (24% somewhat/14% strongly). The majority of Canadians remain optimistic about the country’s
economic future in light of keeping the US/Canada border closed, though not
emphatically so. While 61% agree that they are confident that Canada’s
economy can thrive even if borders to the US are closed, this is driven by
those who somewhat agree (44%) more than strongly agree (17%). Lowering Income Taxes, Addressing
Affordability, and Universal Basic Income Most Important to Getting Canadian
Economy Back on Track Looking ahead, when it comes to getting the economy back on track
after the pandemic, the top priorities in Canadians’ minds are lowering
income taxes (39%), addressing affordability issues (37%), universal basic
income (26%), and tax relief for small businesses (24%). Canadians place the
least importance on lowering corporate taxes (5%) and rental assistance for
businesses (6%). There are key differences by demographic groups when it comes to
which factors are deemed most important. Men (24%) are significantly more
likely than women (16%) to feel eliminating the budget deficit is most
important, while women are more likely to think addressing affordability
issues should be a key area of focus following the pandemic (women 42%, men
32%). Younger Canadians are also more likely to think addressing
affordability issues is most important compared to those aged 55+ (42% 18-34,
41% 35-54, 30% 55+), in addition to prioritizing increasing income assistance
(19% 18-34, 11% 35-54, 8% 55+). Voters in the 55+ category see eliminating
the budget deficit (27% 55+, 17% 35-54, 13% 18-34), providing tax relief to
small businesses (27% 55+, 17% 35-54, 13% 18-34), targeted programs for
regions with high unemployment (16% 55+, 13% 35-54, 9% 18-34), and programs
for underemployed youth (20% 55+, 12% 35-54, 11% 18-34) as most important. It
may be the case that older voters are more economically established and thus
feel looking forward to what can be done to help the country is more
important, compared to younger voters, who may need more immediate help in
light of increased cost of living and a nationwide housing affordability
crisis. Voters for each of the federal parties have different priorities for
getting the Canadian economy back on track. Conservative voters are
significantly more likely to prioritize lowering income taxes (47%, compared
to 38% BQ, 34% Lib., 32% NDP, 27% Green), while Liberal voters are more
likely to have subsidies for companies to create new jobs top-of-mind
compared to other groups (16%, compared to 14% Green, 13% Cons., 9% BQ, 8%
NDP). NDP voters place more significantly importance on addressing
affordability issues (50%, compared to 37% Green, 36% BQ, 35% Lib., 30%
Cons.), and universal basic income (46%, compared to 32% Lib., 27% Green, 14%
Cons., 9% BQ) compared to others. While O’Toole has made GST holiday an
integral part of his campaign, this item does not fall within the top five
priorities for Canadians overall (18%), though Conservative and Bloc
Quebecois voters are more likely to be enticed by this strategy than others
(23% Cons., 23% BQ, 18% Green, 14% NDP, 13% Lib.). Priorities for Getting Canada's Economy
Back on Track Post-Pandemic, by Stated Vote Choice
When comparing Canadians who say they are certain of their vote
choice and those who are not (i.e. not certain that the party they indicated
they would vote for will be the one to receive their vote on election day),
those who are uncertain are
more likely to feel universal basic income (36%) is most important than those
who are certain (26%), which could be an area of opportunity for federal
candidates in garnering the vote of those likely to switch. (Ipsos Canada) 2 September 2021 706-43-15/Polls Six in Ten (60%) Canadians See Racism as a Serious Problem Facing the
Country
Toronto, ON, September 3, 2021 — A
recent Ipsos poll carried out on behalf of Global News has found that a
majority (60%) of Canadians believe to some degree that racism is a serious
problem facing the country. Though unchanged from the same time last year,
this proportion is still considerable jump from Canadians’ perceptions of
racism pre-pandemic. Increased awareness of anti-Asian hate crimes during the
pandemic, continued mistreatment against Indigenous Canadians, domestic
terrorism against Muslim Canadians, and discrimination against Black
Canadians have certainly contributed to the idea that Canada is not making
much progress in tackling racism. In order to add more nuance to the findings, the poll also asked
respondents select with which ethnic or cultural background(s) they
self-identify. Not surprisingly, perceptions of racism in Canada differ
between those who identify as being only ‘white’ and those who do not. Canadians of All Backgrounds Still See
Racism as a Serious Problem When asked how serious of a problem they consider racism to be in
Canada today, six in ten (60%) believe in some way that racism is a serious
problem. This includes 4% who say that racism is ‘the most serious problem
facing Canada,’ another two in ten (19%) who say that it is ‘one of the most
serious problems,’ and nearly four in ten (27%) who say that it is a ‘fairly
serious problem.’ This proportion remains unchanged since July 2020 but is a
double-digit increase from the end of 2019 (43%, +17). There is little difference between those self-identifying as only
‘white’ and those who do not when it comes to thinking that racism is a
serious problem in general (60% among those self-identifying as only ‘white’
v. 64% among those who do not). However, within this aggregated measure,
Canadians who self-identify in a way other than exclusively ‘white’ tend to
see the issue as slightly more pressing. Those who identify in a way other
than only ‘white’ are more likely to say racism is ‘one of the most serious
problems’ facing the country (27% v. 17%), whereas those identifying as only
‘white’ are more likely to choose a less intense stance, saying it is a
‘fairly serious problem’ (40% v. 31%). Views on Racism in Canada[1]
A third (33%) think racism is not a serious problem, with a quarter
(25%) saying it is ‘a minor problem compared to other issues’ and 8% saying
it is ‘not really a problem in Canada today.’ Though a relatively small
proportion, men are more likely than women to say that racism is ‘not really
a problem in Canada today’ (11% among men v. 5% among women). Furthermore,
those in Quebec are more likely to say that it is not really a problem (13%). The remaining 7% of respondents are unsure as to whether racism is a
serious problem in Canada. Among 18-34 year-olds, this proportion climbs to
12% (v. 5% of 35-54 year-olds and 4% among 55+ year-olds). More Canadians Believe Racism Has Increased
Over Past Five Years When asked whether racism has increased in their community over the
past five years, a quarter (24%) of Canadians say there has been an increase,
a four-point increase from May 2019 (20%). Among those who self-identify to
some extent as not exclusively ‘white,’ this proportion climbs to 33% (compared
to 21% among those self-identifying as only ‘white’). Furthermore, those
living in British Columbia are more likely to say that there has been an
increase in racism over the past five years (37%). Whatever level of racism they perceive there to be in the country
already, half (51%) of Canadians believe that there has been neither an
increase nor decrease (-6 from May 2019), with those identifying as
exclusively ‘white’ more likely to believe so (55%, v. 44% among those not
identifying as exclusively ‘white’). One in ten (10%) think there has been a
decrease over the last five years (-1), with the remaining 15% say they don’t
know (+3). Canadians aged 18-34 years are more likely to say there has been a
decrease in racism in their community over the past five years (18%, vs. 6%
among 35-54; 6% among 55+). Diving a little deeper into this age group, those
aged 18-24 years are also more likely to say they don’t know (15%). These
figures about how young Canadians perceive racism in their immediate surroundings
possibly speaks to not only the kind of company young Canadians may be
keeping, but also to their being too young to meaningfully evaluate of how
racism may have changed over the past five years. The latest figures point to the idea that Canadians have not been
making much progress lately when it comes to addressing racism; however, this
is not a recent trend. Previous Ipsos polling using the exact same question
shows that 17% in 1992 believed that there has been an increase in racism and
that 19% in 2017 believed that there had been an increase. (Ipsos Canada) 3 September 2021 AUSTRALIA
706-43-16/Polls Alp (54.5%) Increases Lead Over L-NP (45.5%) For Third Straight
Interviewing Period
This is the largest two-party preferred lead for the ALP since the
national bushfires crisis of last year when the ALP enjoyed a maximum lead of
10% points on a two-party preferred basis in early February 2020 (ALP 55% cf.
L-NP 45%).
Importantly, the ALP has increased its two-party preferred lead in
NSW with the ALP on 53% (up 1% point since mid-August) cf. L-NP on 47% (down
1% point) which represents a swing of 4.8% points to the ALP since the 2019
Federal Election. The longer the current two-month lockdown in New South
Wales continues the higher the ALP’s two-party preferred vote goes. The L-NP has its strongest result in Queensland with the LNP on 53.5%
(up 1.5% points since mid-August) cf. ALP 46.5% (down 1.5% points) on a
two-party preferred basis. However, despite the LNP’s lead this represents a
substantial swing of 4.9% points to the ALP since the 2019 Federal Election. The ALP maintains a narrow lead in Western Australia with the ALP on
51% (down 3.5% points since mid-August) cf. L-NP on 49% (up 3.5% points).
This results represents a large swing of 6.6% points to the ALP since the
2019 Federal Election. The ALP holds large two-party preferred leads in the smaller States
with the ALP 57.5% (up 3% points since mid-August) cf. L-NP 42.5% (down 3%
points) in South Australia. This represents a swing of 6.8% points to the ALP
since the 2019 Federal Election. The ALP’s strongest performance is in
Tasmania with the ALP 63.5% cf. L-NP 36.5% - a swing of 7.5% points to the
ALP since the 2019 Federal Election. Roy Morgan Government Confidence falls
further into negative territory at 93.5 The Roy Morgan Government Confidence Rating has fallen further to
93.5 in late August, down 3.5pts since mid-August. Now 40% of Australians say
the country is ‘heading in the right direction’, down 1% point since
mid-August, while 46.5%, up 2.5% points, say the country is ‘heading in the
wrong direction’. There is a wide divergence between the States with Government
Confidence well below 100 in the lockdown States of NSW and Victoria and the
tourism-dependent Tasmania but in positive territory above 100 in the three
other States. Government Confidence in both NSW and Victoria is at only 86 in late
August with both States in extended lockdowns that are set to continue
throughout the month of September. Despite the lockdowns the COVID-19
outbreaks in both States are continuing to grow. However, Government
Confidence is lowest of all in tourism-dependent Tasmania at only 77.5 in
late August. In contrast, Western Australia is in a far more positive frame of
mind and has the highest Government Confidence Rating of 117. Western
Australia has not been in lockdown since early July and was this week was
confirmed as the host of the AFL Grand Final for the first time. Government Confidence is marginally in positive territory in both
Queensland at 104 and South Australia at 102.5. Both States experienced short,
sharp and effective lockdowns in late July and early August but have been
largely free of COVID-19 over the last few weeks. Michele Levine, CEO, Roy Morgan says the
ALP has strengthened its lead over the L-NP to an election-winning 54.5% cf.
45.5% as the lockdowns in NSW and Victoria hand the ALP big two-party
preferred leads in both States: “Today’s Roy Morgan Poll on Federal voting
intention shows the ALP increasing its lead for the third straight survey on
a two-party preferred basis. The ALP on 54.5% (up 0.5% points since
mid-August) is now a large 9% points ahead of the L-NP on 45.5% (down 0.5%
points). “This is the largest two-party preferred
lead for the ALP since early February 2020 during the national bushfires
crisis when the ALP briefly enjoyed a 10% point lead: ALP 55% cf. L-NP 45%.
The ALP has steadily built its lead since mid-June when the two parties were
in a tight race with the ALP 50.5% narrowly ahead of the L-NP 49.5%. “Of course a lot has changed since mid-June
when the current outbreak of the Delta strain of COVID-19 began when a Bondi
limousine driver tested positive on June 16. Just over a week later Greater
Sydney went into a lockdown that continues to this day and ever since that
point support for the Morrison Government has consistently dropped. “The primary responsibility for the current
lockdowns of over 15 million Australians in NSW, Victoria and the ACT has
been placed at the feet of the Federal Government for a slow vaccine roll-out
around the country. The ALP enjoys a huge advantage in Victoria with the ALP
on 59.5% cf L-NP 40.5% on a two-party preferred basis and the ALP also leads
in NSW: ALP 53% cf. L-NP 47%. “As of this week the latest Health Department figures show over 19.3 million
vaccine doses have been administered to 59% of Australians aged 16+. A closer look at the vaccination data shows 63%
of Australians aged 70+ and 52% of those aged 50+ are now fully vaccinated. “However, the key target is the full
vaccination of Australians aged 16+. Only 35% of people aged 16+ are now
fully vaccinated which is well short of the 70% and 80% targets outlined as
the key to ending restrictions and lockdowns. “To reach the threshold of 80% fully
vaccinated approximately 33 million vaccine doses need to be administered.
Australia is still around 14 million vaccine doses short of this mark and at
the rate of 1 million vaccine doses a week will reach this level in early
December. “One outcome of the outbreaks in NSW,
Victoria and the ACT is that people in these locations are now racing to get
vaccinated and will reach the vaccination targets ahead of other States. This
staged re-opening is set to create further headaches for the Federal
Government towards the end of the year as although some State borders are
likely to open others are likely to remain closed.” Electors were asked: “If an
election for the House of Representatives were held today – which party will receive
your first preference?" and “Generally speaking, do you feel that things in Australia are heading
in the right direction or would you say things are seriously heading in the
wrong direction?” This Roy Morgan Poll on Federal voting intention and Roy Morgan
Government Confidence was conducted via telephone and online interviewing
last weekend. Roy Morgan interviewed 2,735 Australian electors aged 18+ on
the weekends of August 21/22 & 28/29, 2021. A higher than usual 8% of
electors (up 0.5% points from mid-August) can’t say who they support. For further information:
Australian Federal Voting Intention:
Two-Party Preferred (2019-2021)
(Roy Morgan) September 01 2021 Source: https://www.roymorgan.com/findings/8782-federal-voting-intention-september-2021-202109010638 MULTICOUNTRY
STUDIES
706-43-17/Polls On Average 23% Of Working Adults In 29 Countries Report Working From
Home More Often Than Before The Covid-19 Pandemic
A new Ipsos survey in partnership with the World Economic Forum
reveals that on average 23% of working
adults in 29 countries report working from home more often than before the
Covid-19 pandemic. More than a third of respondents in Peru,
Singapore, India and Argentina say they work from home more often. The online survey conducted between May 21 and June 4 of nearly
12,500 working adults reveals that on average, in 29 countries, the
proportion of those who are still working, most often or sometimes away from
home today hui (39%) is 15 points above pre-pandemic levels
(24%). Three-quarters of those who work away from home at least once in
a while say they do so because of Covid-19.
These views are more prevalent among people with a higher level of
education and income, women, young adults and parents of children under the
age of 18. In contrast, nearly a third of those questioned believe that:
Parents of children under the age of 18 are also more likely to share
this opinion. 3 in 10 (30%) say they consider looking for
another job with equal responsibilities and pay if their employer asks
them to come back to the office full time. Parents
and under 35 are the most likely to share this opinion. Detailed results Working from home during the pandemic On average, 39% of people
worldwide say they work from home (25% always or most
of the time and 14% sometimes at home and sometimes outside the
home). At least 50% of all employed adults surveyed in South America
(Peru, Argentina, Chile, Colombia and Brazil) as well as Singapore, South
Africa and Malaysia agree, compared to 15 % in China and 21% in
Russia. By comparison, only 24% of them reported working from home
before the pandemic - 15 points lower than what they are reporting today. 23% on average of all employed adults
surveyed in the 29 countries now work from home more often than before the
pandemic. More than 3 in 10 people in Peru,
Singapore, India, Argentina, Chile and Colombia report working remotely more
frequently, compared to only around one in ten in Russia, Japan, Poland,
Hungary, China and South Korea. Among people who report working from home at least once in a while,
the majority in all countries, with an average of 76%, say they do so because
of Covid-19. The expectations of Covid tele-workers Depending on where they live, people who are currently working from
home due to the pandemic have very different expectations about when to
return to work from home. On average, globally, 27% of "Covid
tele-workers" expect to return to their pre-Covid work routine in less
than six months, 24% between six months and one year, 15% in more than six
months. 'one year, 18% do not believe in a return to normal, and 17% have no
idea.
Preferences in terms of work organization
after the Covid crisis On average around the world, 35%
of people surveyed say that once the pandemic is over, they would prefer to
telecommute completely or more often than before . Almost as many (33%) say the opposite :
they would rather work away from home completely or less often than before
the pandemic. One in ten people say
they would prefer to work from home as much as before (10%). Countries where the highest proportions of people saying they would
prefer to work from home completely or more often than before the pandemic
(all between 43% and 48%) include South Africa, Singapore, Great Britain,
United States, India and Australia. The preference to work completely
away from home or less often than before the pandemic is more prevalent in
Saudi Arabia, Mexico, Poland and Turkey (all between 45% and 53%). On average, 30% of people worldwide agree that they would consider
looking for another job with equal pay and responsibilities if their employer
asked them to work from home full time (12% strongly agree and 18 % somewhat
agree). The agreement is highest in India, Saudi Arabia, Peru and
Malaysia and, more generally, among those under 35. However, less than
10% of respondents in Japan, South Korea, Russia, France, Germany, Belgium,
Sweden, Singapore and China strongly agree. Employees want more flexibility Overall, workers tend to have a positive perception of working from
home and want more flexibility. Across all countries, the
majority of respondents agree that when the COVID-19
restrictions are no longer in effect, employers
should be more flexible in forcing employees to come to the office. (from
53% in Germany to 81% in India, with a world average of 66%). The disadvantages of teleworking Regarding the disadvantages of working from home, on average around
the world:
These views are more prevalent in Saudi Arabia, Turkey, India and
Malaysia and, more generally, among parents of children under 18. (Ipsos France) 30 August 2021 706-43-18/Polls Back To School 2021: 20% Of French People Would Be Against A New
Closure Of Schools
Decline in concentration and discipline at
school: the epidemic's most feared consequences The return of face-to-face classes has been confirmed by the
government for this 2021 school year, but at what cost? Many signs
suggest that the pandemic will have long-term harmful effects on young
people, affecting in particular their
mental health and well-being according to 38% of French people ,
added to a drop in the level of
qualification (33%). For this new school year, students could encounter difficulties
following two years of schooling troubled by the health crisis. On
average, 36% of French people surveyed fear that children under the age of 15
suffer more from attention and concentration disorders when they return to
class, a figure that reaches 38% for 16-18 year olds. Another
particularly strong concern in France: behavioral problems and discipline in
the classroom. They worry 38% of French people when it comes to 11-15
year olds (32% globally), and 34% for those under 11 (vs 27% globally). Compared to inhabitants of other countries, the French are also less worried about the anxieties linked to Covid
that the youngest may feel at school : only 14% of
French people say they are concerned about 12-15 year olds - a figure that
rises to 20% for those under 11 - against a global average of 21%, and 36% in
Brazil, where the pandemic is still struggling to be controlled. Closing schools, an acceptable sacrifice to
stem the pandemic At the end of August, the rules established by the government are
clear. From the first proven Covid case, the order will be given to
close classes and organize distance learning. Despite the feared
consequences of this type of measure, half
of the French seem to be in favor of a new closure of schools :
51% think that the closure of schools is an acceptable price to pay to reduce
the spread of the virus - against 20% who find it unacceptable. However,
this level of acceptance is well below
the world average, which stands at 62%. Health and education first! When asked to identify up to three areas that they consider a
priority for public spending in the aftermath of the pandemic, the French are
torn. When asked, nearly half confirm their commitment to investing in public health (46%),
followed by primary and secondary school for nearly a third of them (30%,
against 27% on average worldwide ), just ahead of security and social
assistance to the population (29%). This is followed by economic issues
- which seem to be less of a priority in the eyes of the French - such as
investment in companies (15%) or improving the employability of individuals
post-Covid (17%). “Among other things that Covid-19 has
revealed, the state of the education system has shown its strengths and limitations
in France. Parents have better understood the importance and complexity
of the teaching profession as social, economic and cultural disparities have
widened. The French have also understood the need to invest and give
real resources to National Education so that it fulfills its missions: today,
school must be a budgetary priority for 30% of them (vs. 27%
worldwide). It should be noted that, in a country that is often critical
of civil servants, this is the second most mentioned priority, after public
health (46%) and slightly ahead of social security and aid to the most
deprived (29% ). The great return of the sovereign state? " (Ipsos France) 31 August 2021 706-43-19/Polls More Than Two In Five (45%) Britons And Over Half (52%) Americans Say
They Will Miss Petrol And Diesel Cars If They Are Ever Fully Phased Out
There is a sense of inevitability around
electric vehicles. Governments around the world are
working to phase out vehicles that run on fossil fuels (petrol and
diesel)– in the UK, the plan is to stop selling new petrol and diesel cars by
2030; in the US, President Biden has set a goal for 50% of new US
vehicles to be electric in the same timeframe. But new YouGov Direct data suggests that neither Americans nor
Britons are yet ready to say goodbye to petrol and diesel cars. In
Britain, nearly half believe car manufacturers should not exclusively offer
electric cars (48%) – compared to two in five (41%) who believe they should.
In the US, the gap is even wider: while three in ten (29%) think automakers
should only sell electric vehicles, three in five (59%)
disagree. The public have, in the past, cited practical reasons to oppose an
all-electric automotive market: convenience, for example, is a key
issue, and one recently cited by the government’s climate
spokesperson. But our data also shows evidence of a sentimental
attachment to petrol and diesel cars in both markets. In Britain, for example, more than two in five (45%) say they will
miss petrol and diesel cars if they are ever fully phased out – with a
similar proportion saying the opposite (44%). American
consumers, however, are more emphatic: over half (52%) will miss cars
with fossil fuel engines once they’re gone, compared to fewer
than two in five (36%) who believe the reverse. This could present a key challenge for governments and car
manufacturers as they transition towards an electric future: whatever
the benefits of electric cars or the drawbacks of petrol and diesel cars, a
sizable portion of the public simply enjoys their gas-guzzlers. In any case,
if political enthusiasm for electric cars is high, popular enthusiasm is not
quite there yet. (YouGov UK) September 02, 2021 706-43-20/Polls Only 15 Percent Of Consumers Worldwide Say They Have Switched
Provider Or Product Due To Data Loss
According to a survey carried out by YouGov in 17 key markets, only
15 percent of consumers worldwide say they have switched provider or product
due to data loss. This reason for a change of provider or brand is at
the bottom of our list of reasons. Inadequate environmental protection
(21 percent), product defects and poor treatment of employees (23 percent
each), but above all lies about product performance (31 percent) are more
often given as reasons. A dominant market position of the provider
preventing competition as well as drastic undertakings to reduce tax payments
are mentioned even less often (14 percent each) than data loss. Most common brand changes due to data loss
in Asia Of course, consumer habits differ drastically from market to
market. Our data shows that consumers in Asia Pacific are generally more
willing to part ways with a brand when they experience data loss than in
other markets. Among people in Hong Kong this is 30 percent, in
Singapore 25 percent, in Indonesia 24 percent, in China 21 percent and in
India 20 percent. To prevent this, the Chinese government is currently working on a
data protection law that is supposed to be similar to the General Data
Protection Regulation of the European Union (GDPR). American consumers are also more likely than the global average (15
percent) to have changed brands when they lost their data (18
percent). This statement is made less often among Europeans: in the
United Kingdom and Spain, 12 percent each say this, in Italy and Poland 11
percent each, and in Germany and France 10 percent each. Scandinavians
are the least likely to say this: in Sweden it is 7 percent and in Denmark 5
percent. (YouGov Germany) September 3, 2021 Source: https://yougov.de/news/2021/09/03/wie-wirkt-sich-datenverlust-auf-die-kundentreue-au/ |