|
BUSINESS & POLITICS IN THE WORLD GLOBAL OPINION REPORT NO. 707 Week:
September 06 –September 12, 2021 Presentation:
September 17, 2021 707-43-22/Commentary:
Twenty Years On, 80% Of Britons Still Remember Where They Were On 9/11 Indian
Consumers, Reveals A Spending Propensity Of 90.71 Among Urban Indians This
Festive Season Three
In Ten Urban Indians Have Changed Their Primary Bank In The Past More
Than Three-Fourths (77%) Of Guineans Prefer Democracy To Any Other Form Of
Government A
Majority (58%) Of Tanzanians Say They Have Heard Of Social Media 7
In 10 Parents Worried About Their Children Catching Covid-19 When They Return
To School Just
One In Five Members Of The Public Have A Positive View Of The Foreign
Secretary More
Than Two In Five Think Christmas Will Be Free Of Pandemic Restrictions Twenty
Years On, 80% Of Britons Still Remember Where They Were On 9/11 55%
Of Arsenal Supporters Interviewed With Yougov Direct Said They Were Confident
In The Team Most
Britons 57% Want To Ban Cigarettes – And Half Want To Ban Vaping Products Ahead
Of The COVID-19 Recession The Unemployment Rate Was Below 4% 62%
Of Adults With A Disability Say They Own A Desktop Or Laptop Computer One
In Eight (13%) Canadians Is Completely Undecided On How To Vote The
Australian Economy Grew By A Stunning 9.6% Over The Year To June 2021 4
Out Of 10 Brazilians Want To Go Back To Working Outside The Home At The End
Of The Pandemic Most
Adults Vaccinated Against Covid-19 In All 13 Countries Surveyed Intend To Get
A Booster Shot INTRODUCTORY NOTE
707-43-22/Commentary:
Twenty
Years On, 80% Of Britons Still Remember Where They Were On 9/11
Two decades
have passed since terrorists brought down the Twin Towers in hijacked planes
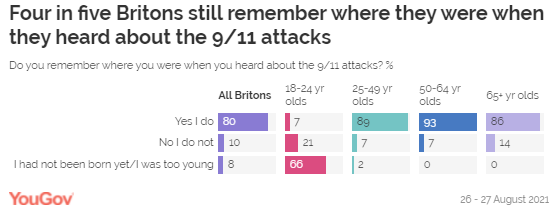
in an unprecedented attack on the US, killing nearly 3,000 people. A new
YouGov survey now shows that 80% of Britons can still remember where they
were when they heard the news of the incident. Only one in ten people (10%)
can’t remember their whereabouts when hearing the news, while another 8% were
too young or not yet born. Britons aged
50 to 64 are the most likely to remember the day, with 93% saying it’s still
fresh in their memory. Among 18-24-year-olds, 7% remember where they were
when they first heard about the attacks, despite the oldest people in this
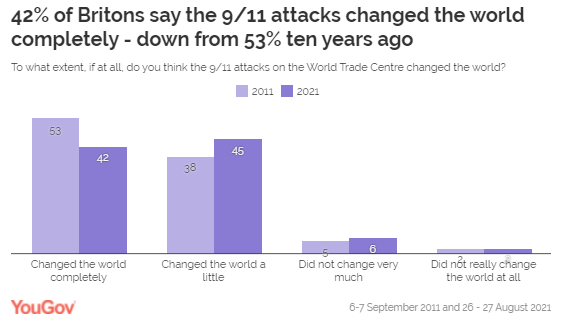
group having been only four years old at the time. Fewer Britons believe 9/11 changed the world completely than ten
years ago While a
large share of the public are convinced that the world was not the same after
9/11, this number of those believing it became radically different has fallen
over time. Two fifths of Britons (42%) say the terrorist incident “changed
the world completely” – down from 53% a decade ago. Another 45% believe it
changed it “a little”, which is slightly higher than in 2011, at 38%. Only one in
twelve people either say it did not change very much (6%) or not at all (2%),
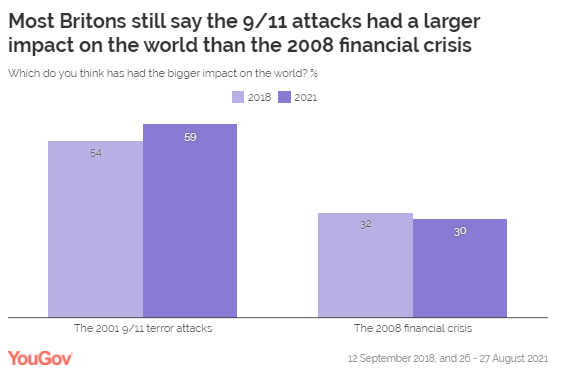
which is similar to previously (5% not very much, 2% not at all). Three in
five Britons (59%) likewise say that the 11 September attacks have had a
larger impact on the world than the 2007-08 global financial crisis, a
similar figure to the number who said so in 2018 (54%) on the 10th anniversary
of the crisis. Around three in ten people (30%) currently believe the
financial crisis – which until the coronavirus pandemic had been the worst
recession since the 1920s – had a greater impact (from 32% in 2018). Conservative
voters are slightly more likely than Labour members to say the 9/11 attacks
had a larger impact on the world at 65% vs 54%. But while
many people still vividly remember hearing about the attacks, and several
terror incidents having happened in the UK since, few Britons fear for their
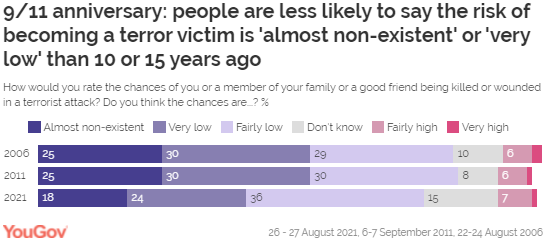
safety in this context. Some 8% of
the public believe there’s a ‘very’ (1%) or ‘fairly’ (7%) high chance they or
someone close to them would become injured or killed in a terrorist attack.
This is similar to both in 2011 (1% very high, 6% fairly high) and 2006 (2%
very high, 6% fairly high). While the
proportion of people who feel the odds are high remains the same, fewer
people now say the possibility is ‘almost non-existent’ or ‘very low’ than
previously.
In 2006 and
2011, one in four Britons (25%) believed there was virtually no chance they
or a loved one could become a victim of terrorism, while another 29-30% felt
the chance was very low. Today, only
a fifth (18%) regard the possibility as near non-existent, while a quarter
(24%) see it as very low. Instead the most common answer is ‘fairly low’ at
36% - 5-6 points higher than in 2011 and 2006. (YouGov UK) September
09, 2021 707-43-23/Country Profile:
SUMMARY
OF POLLS
ASIA (India) Indian Consumers, Reveals A Spending Propensity Of 90.71
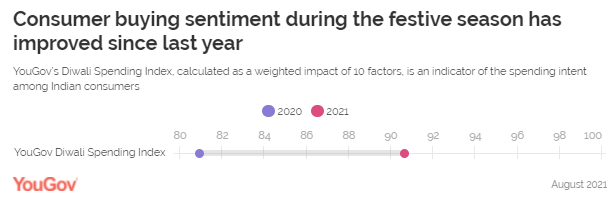
Among Urban Indians This Festive Season YouGov’s Diwali Spending Index, an
indicator of the spending intent among Indian consumers, reveals a spending
propensity of 90.71 among urban Indians this festive season. Even though it
is below average (of 100), the intent to spend is higher than last time
(80.96), indicating a recovering appetite to spend among urban Indians. (YouGov India) September 7, 2021 Three
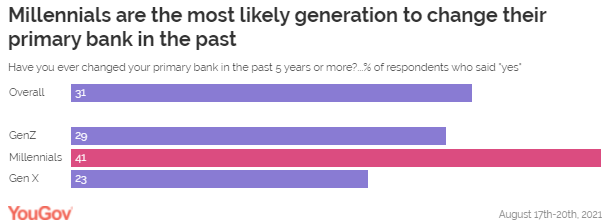
In Ten Urban Indians Have Changed Their Primary Bank In The Past YouGov’s latest survey reveals close to a
third (31%) of urban Indians claim to have changed their primary bank in the
past five years or more. Among different generations, millennials appear to
be the most visible switchers and are much more likely than Gen X to have
changed their primary bank in the past (41% vs 23%). Among the genders, men
as compared to women are more likely to switch in the future (58% vs 50%). (YouGov India) September 9, 2021 AFRICA (Guinea) More Than Three-Fourths (77%) Of Guineans Prefer Democracy
To Any Other Form Of Government Dissatisfaction with the country’s economic
conditions and citizens’ personal living conditions has increased, as have
negative ratings of the government’s economic performance and provision of
essential public services. Only three in 10 citizens are satisfied with the
way their democracy is working. But the study also shows that most Guineans
endorse elections as the best way to choose leaders and that citizens’
preference for democracy has remained consistently high over the years. (Afrobarometer) 6 September 2021 (Gambia) More Than One In Four Gambian Citizens (28%) Say They Or A
Member Of Their Family Suffered Human-Rights Abuses Under Jammeh’s Regime Almost three-fourths (73%) of Gambians say
perpetrators of crimes and human-rights abuses during Jammeh’s regime should
be tried in court, a 5-percentage-point increase compared to 2018. More than
one in four citizens (28%) say they or a member of their family suffered
human-rights abuses under Jammeh’s regime. Citizens expect the TRRC’s work to
lead to a variety of outcomes, including national peace, reconciliation,
forgiveness, and healing (34%). (Afrobarometer) 6 September 2021 (Tanzania) A
Majority (58%) Of Tanzanians Say They Have Heard Of Social Media One in five Tanzanians say they get news
from social media every day (13%) or “a few times a week) (7%). In total, 27%
of citizens say they use social media for news at least on occasion, a
9-percentage-point increase compared to 2017. A majority (58%) of Tanzanians
say they have heard of social media. Awareness of social media is higher
among men and urbanites than among women and rural residents, and increases
strongly with respondents’ education level, ranging from 20% of those with no
formal education to 96% of those with post-secondary qualifications. (Afrobarometer) 8 September 2021 (South
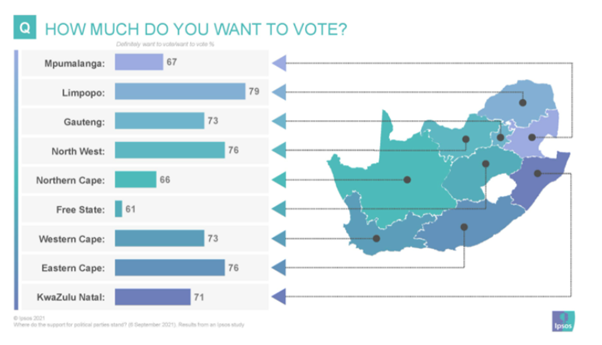
Africa) Seven In Every Ten (71%) South Africans Have Indicated That
They Would Vote In The Coming Local Government Elections Countrywide almost half (49.3%) will draw a
cross next to the name of the ANC, while the support for both the DA (17.9%)
and the EFF (14.5%) respectively, is also in double figures. South Africa has
a plethora of registered political parties, but very few of them currently
garner more than one percent of support. (Ipsos South
Africa) 7 September 2021 WEST
EUROPE (UK) 7
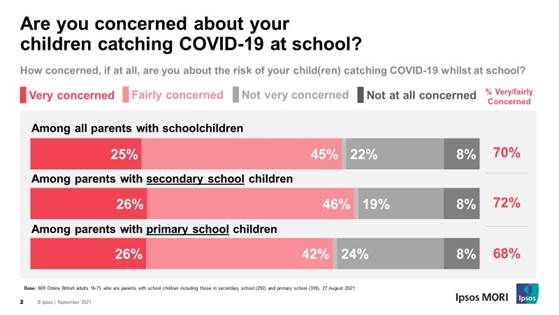
In 10 Parents Worried About Their Children Catching Covid-19 When They Return
To School With children starting to head back to the
classroom, polling by Ipsos MORI shows a large majority of British parents
with school-age children are concerned about the risk of their child(ren)
catching COVID-19 while at school. Seventy per cent are concerned about this
risk with only 3 in 10 untroubled. Worry increases slightly among
mothers with children at school, 74% of whom are worried compared to 64% of
fathers. (Ipsos MORI) 6 September 2021 Just
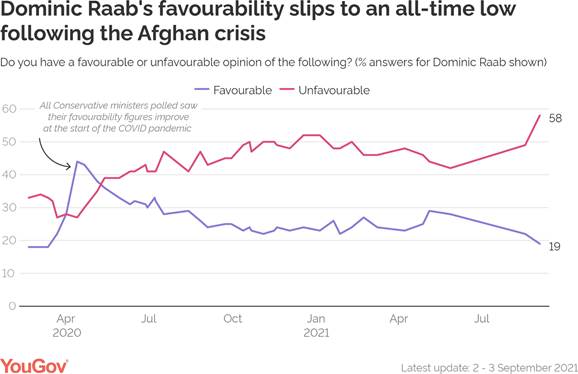
One In Five Members Of The Public Have A Positive View Of The Foreign
Secretary Only one in five people (19%) now hold a favourable
view of Raab, down 3pts since mid-August. A majority of people now hold an
unfavourable view of him (58%), an increase of 9pts versus August. This
represents the highest level of unfavourable opinion Raab has held since our
polling of him began in 2020. Overall, these latest favourability scores give
the foreign secretary a net score of -39 among the general public. (YouGov UK) September 06, 2021 41% Of Britons Said Brexit Is The Main
Reason For Reported Shortage Of Drivers And Supply Chain Issues In recent weeks there has been a growing
issue with a shortage of delivery drivers, with the media reporting widely on
supermarkets, fast food restaurants and pubs facing problems with their
supply chain. Many commentators have associated this problem with Brexit. Asked
what the main reason is for the reported shortage of drivers and supply chain
issues, 41% of people said Brexit, 25% the impact of the coronavirus, 11%
working conditions for drivers and 7% drivers' pay. (YouGov UK) September 07, 2021 More Than Two In Five Think Christmas Will
Be Free Of Pandemic Restrictions According to reports, the October lockdown
could be implemented if COVID-19 hospitalisations continue at their current
rate and overwhelm the NHS - something the government has since denied.
However, most people (57%) predict that October 2021 to January 2022 will see
fewer hospitalisations than the same period a year ago – a period that
encompassed the bulk of the UK’s second wave. Yet some 31% of people think that
this year could be on par (16%) or worse (15%) than the previous period in
terms of people admitted to hospital. (YouGov UK) September 08, 2021 Twenty Years On, 80% Of Britons Still
Remember Where They Were On 9/11 Two decades have passed since terrorists
brought down the Twin Towers in hijacked planes in an unprecedented attack on
the US, killing nearly 3,000 people. A new YouGov survey now shows that 80%
of Britons can still remember where they were when they heard the news of the
incident. Only one in ten people (10%) can’t remember their whereabouts when
hearing the news, while another 8% were too young or not yet born. (YouGov UK) September 09, 2021 55% Of Arsenal Supporters Interviewed With
Yougov Direct Said They Were Confident In The Team Arsenal have had a rough start to the
2021/22 season, with three back-to-back losses sending them to the bottom of
the table. As a result, confidence among Gunners fans has taken a significant
dive. Before the season kicked off, 55% of Arsenal supporters interviewed
with YouGov Direct said they were confident in the team. This figure has
since dropped 27pts to just over a quarter (28%). This trend is not limited
to Arsenal, with fans of several other teams having lost a lot of faith,
including Leeds United (79%, down 14 pts from pre-season) and Leicester City
(84%, down 13pts). (YouGov UK) September 09, 2021 4 In 10 Britons Think Country Heading In
Wrong Direction But Johnson Much More Popular Than Starmer Among Their Own
Voters Ahead of party conference season, a new
Ipsos MORI poll of Britons aged 18+ (taken before the recent NI announcement)
shows that 44% of Britons think things are heading in the wrong direction (no
change from July) and 29% think things are heading in the right direction (-1
point). The data shows a predictable party split on this measure with 48% of
2019 Conservative voters saying things are heading in the right direction
compared to 64% of Labour voters saying things are heading in the wrong
direction. (Ipsos MORI) 10 September 2021 Most Britons 57% Want To Ban Cigarettes –
And Half Want To Ban Vaping Products It’s a move that’s broadly in tune with
public sentiment: new polling from YouGov shows that close to three in five
Britons (57%) support an outright ban on the sale of cigarettes, compared to
a third (32%) who do not. And while one in five (19%) are in favour of a ban
from 2030 onwards, two in five (38%) want the government to move even faster
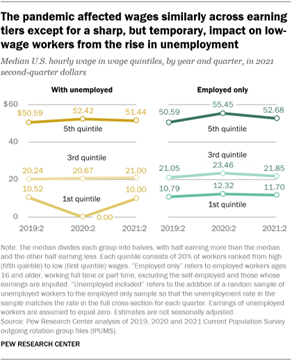
– outlawing these products either immediately or in the near future. (YouGov UK) September 10, 2021 NORTH AMERICA (USA) Ahead Of The COVID-19 Recession The Unemployment Rate Was
Below 4% The median wage of employed U.S. workers
had held steady at about $21 per hour for several calendar quarters before
the coronavirus outbreak. With the unemployment rate hovering below 4% ahead
of the COVID-19 recession, even if unemployed workers were included – at zero
earnings – there was little effect on the estimated median wage, nudging it
down to about $20 in 2019, but no more. (Wages are adjusted for inflation and
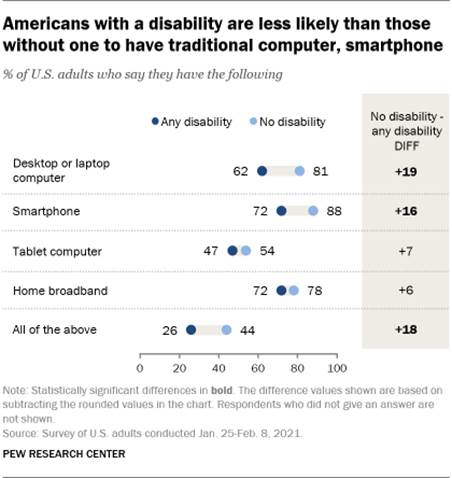
expressed in 2021 second-quarter dollars.) (PEW) SEPTEMBER 7, 2021 62% Of Adults With A Disability Say They Own A Desktop Or
Laptop Computer Some 62% of adults with a disability say
they own a desktop or laptop computer, compared with 81% of those without a
disability, according to a Pew Research Center survey of U.S. adults
conducted Jan. 25-Feb. 8, 2021. And when it comes to smartphone ownership,
there is a gap of 16 percentage points between those with a disability and
those without one (72% vs. 88%). (PEW) SEPTEMBER 10, 2021 (Canada) 46% Of Canadians Who Say They Are Going To Support A Party
On Election Day Are Absolutely Certain Of Their Vote Choice According to a new Ipsos poll conducted on
behalf of Global News, only 46% of Canadians who say they are going to
support a party on election day are absolutely certain of their vote choice,
leaving the remaining voters less sure (39% fairly certain; 11% not very
certain; 4% not at all certain). Conservative voters (49%, +3 since the start
of the campaign) and Liberal voters (49%, +1) are most likely to be
absolutely certain of their choice, with NDP (43%, +6), Bloc (43%, +13) and
Green Party (26%, +13) supporters less certain of their choice. (Ipsos Canada) 6 September 2021 One In Eight (13%) Canadians Is Completely Undecided On How
To Vote Over the course of the election campaign,
Ipsos polling has revealed that one in eight (13%) Canadians is completely
undecided on how they will vote in this federal election. A closer
examination of this key group of voters reveals who they are, how they feel
and what is important to them when considering how to cast their ballot. Two
in three (67%) are women; one in three (33%) are men. (Ipsos Canada) 9 September 2021 AUSTRALIA The Australian Economy Grew By A Stunning 9.6% Over The
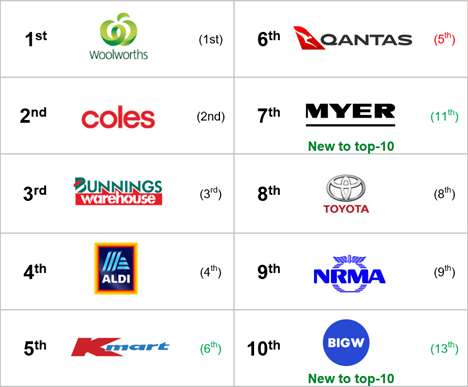
Year To June 2021 Retailers have been the big winners during
this period and the top four most
trusted brands again comprise some of Australia’s leading
retail brands led by Woolworths, Coles, Bunnings Warehouse and ALDI in fourth
place. Notably, there have been four big improvers in the June quarter 2021
with Department Stores Kmart, Myer, Big W and Target all improving their
standing as some of Australia’s most trusted brands. Kmart has entered the
top 5, both Myer and Big W are new entrants to the top 10 and Target jumped
seven spots in the quarter to be just outside the top 10. (Roy Morgan) September 07 2021 MULTICOUNTRY STUDIES 4 Out Of 10 Brazilians Want To Go Back To Working Outside
The Home At The End Of The Pandemic The Return to the Workplace 2021 Global
Survey, carried out by Ipsos in 29 nations – including Brazil – showed that
40% of respondents in the country want to work outside their homes in the
post-pandemic period. A slightly smaller percentage, 31%, prefer to work
more or completely at home-office. 9% prefer to work from home as much
as they used to do before the health crisis, 10% did not know how to answer
and 11% said that the nature of their work does not allow them to choose
where to work. On the global average, the percentage of people who want
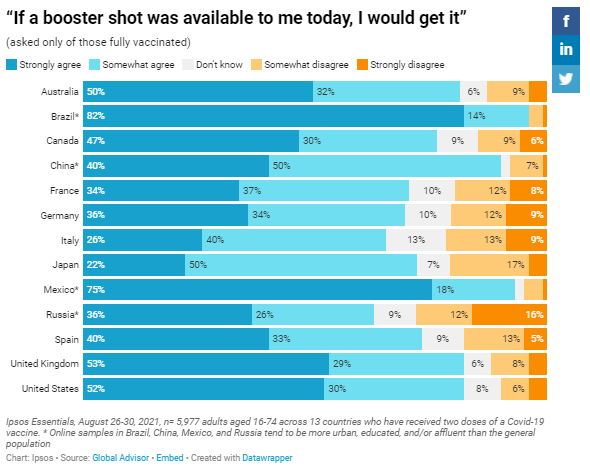
to work outside the home is 33%. (Ipsos Brazil) 8 September 2021 Most Adults Vaccinated Against Covid-19 In All 13 Countries
Surveyed Intend To Get A Booster Shot In each of the 13 countries surveyed, a
large majority of adults who have received two doses of a COVID-19 vaccine
strongly or somewhat agree they would get a booster shot if it were available
today, 90%+ in Brazil (96%), Mexico (93%), and China (90%); 80%+ in Australia
(82%), the United Kingdom (82%), and the United States (81%); 70%+ in Canada
(77%), Spain (73%), Japan (72%), France (70%), and Germany (70%); and 60%+ in
Italy (66%) and Russia (62%). (Ipsos Canada) 10 September 2021 Source: https://www.ipsos.com/en-ca/news-polls/global-attitudes-covid-19-vaccine-booster-shots ASIA
707-43-01/Polls Indian
Consumers, Reveals A Spending Propensity Of 90.71 Among Urban Indians This
Festive Season
The festive season has commenced in India
and now everyone is eagerly awaiting the festival of lights. Although brands
are betting big on Diwali to light up sales, are consumers ready to shop
again? YouGov’s Diwali Spending Index, an
indicator of the spending intent among Indian consumers, reveals a spending
propensity of 90.71 among urban Indians this festive season. Even though it
is below average (of 100), the intent to spend is higher than last time (80.96),
indicating a recovering appetite to spend among urban Indians.
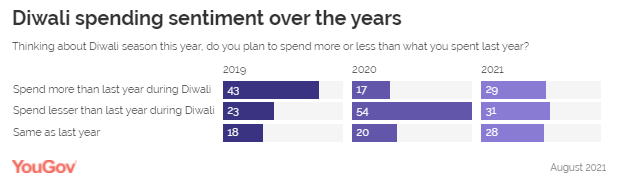
Among the 10 factors, the number one driver
for people to spend more this year is their anticipation for the festival.
Nearly a third (31%) agreed with the statement “I am looking forward to Diwali this year since the
rest of the year has been quite dull because of Covid-19”. With nearly two years having passed and
shoppers having no opportunity to spend, this is likely to be the factor that
has improved the overall sentiment to spend more this Diwali as compared to
last. Even though there is an improvement, the
biggest barrier to spending continues to be the same as last year. Close to
50% of respondents last year said they are more careful with their finances
today than they used to be in the past. And now a similar proportion (43.6%)
said the same thing, indicating the fear of the uncertain is still strong
among the public. Given 2021 witnessed a devastating wave of
covid, despite excitement among the public for Diwali this year, the consumer
sentiment is yet to match the pre-pandemic times.
In YouGov’s Diwali series, we will see the
impact of the pandemic on consumers’ buying sentiment across different
sectors to see if the upcoming festive season can be a game-changer for
businesses and brands. (YouGov India) September 7, 2021 Source: https://in.yougov.com/en-hi/news/2021/09/07/urban-indians-festive-spending-intent-has-improved/ 707-43-02/Polls Three In Ten
Urban Indians Have Changed Their Primary Bank In The Past
YouGov’s latest survey reveals close to a
third (31%) of urban Indians claim to have changed their primary bank in the
past five years or more. Among different generations, millennials appear to
be the most visible switchers and are much more likely than Gen X to have
changed their primary bank in the past (41% vs 23%).
While convenience was the main reason to
switch for all the surveyed respondents, nearly a quarter (23%) switched in
order to move to a bank that offers digital services or is a digital only
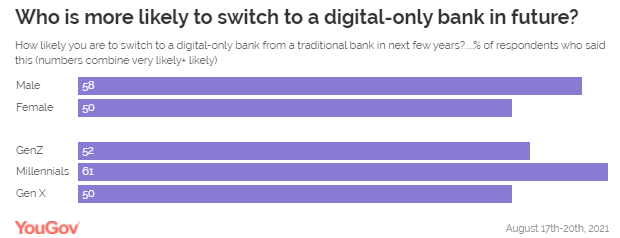
bank, highlighting the building appetite for online banking in the country. Looking into the future banking
preferences, we see more than half of urban Indians (54%) said they are likely
to switch from a traditional to a digital bank in the near future. Once again
we see millennials being most likely to say they will switch their bank in
the future (at 61%), perhaps because they are already used to shifting banks
and are more likely to be swayed by better services and benefits. Among the genders, men as compared to women
are more likely to switch in the future (58% vs 50%).
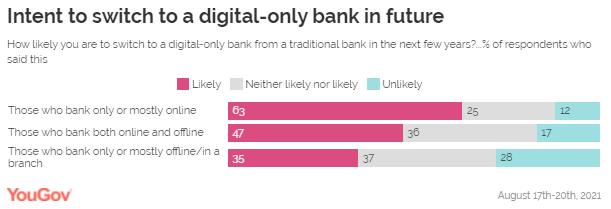
While the intent to switch to an
online-only bank in the future is higher among respondents who only or mostly
bank online (at 63%), those who bank both online and offline were also more
likely than unlikely (47% vs 17%) to say they will switch to a digital bank
in the future.
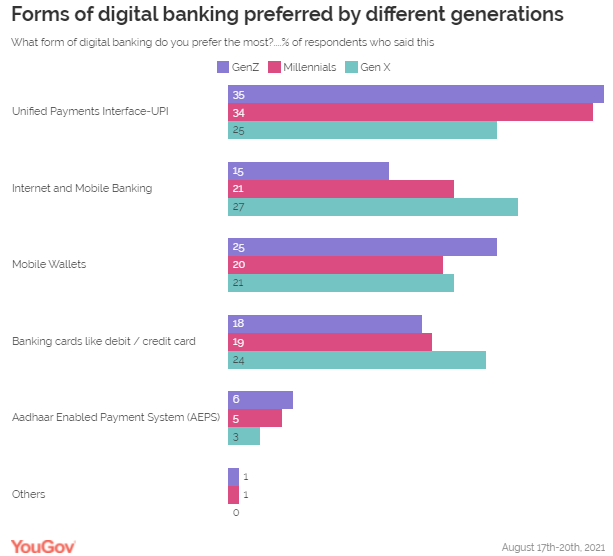
Cashbacks and rewards appeal more to the
millennials than the GenX, while the older cohort is more likely to find the
round-the-clock accessibility as well as ease and convenience of banking the
biggest advantage of digital banking. When asked about the various forms of
digital banking, Unified Payments Interface or UPI payments emerged as the
most preferred form of digital banking for nearly a third (31%) of
respondents. Other preferred forms include internet & mobile banking
(22%), mobile wallets, and banking cards (21% each) are other preferred forms
of digital banking.
Commenting on this, Deepa Bhatia, General
Manager, YouGov India said, “Banking has
been considered for long as a more traditional industry with high switching
costs but with the advent of digital banking services, we can see the
switching costs come down. Millennials, those aged between 30 and 40years
old, one of the most sought-after cohorts have been particularly open to
switching their primary bank accounts and are fairly open to digital banks.
Banking needs to learn about the changing motivations of their customers so
as to better serve them and retain them.” (YouGov India) September 9, 2021 Source: https://in.yougov.com/en-hi/news/2021/09/09/three-ten-urban-indians-have-changed-their-primary/ AFRICA
707-43-03/Polls More Than
Three-Fourths (77%) Of Guineans Prefer Democracy To Any Other Form Of
Government
Despite widespread dissatisfaction with the
government’s performance, Guineans strongly prefer democracy to any alternative form of
governance, the most recent Afrobarometer survey shows. Barely a year after claiming a third term
in office amidst widespread opposition, President Alpha Condé has been detained since a coup
d’état last Sunday. Coup leader Lt. Col. Mamady Doumbouya has cited pervasive
poverty and corruption as reasons for the takeover. Afrobarometer findings from late 2019 show
majorities of Guineans believe that the country is heading in the wrong direction, that the
level of corruption has increased, and that the government is doing a poor job of fighting
corruption. Dissatisfaction with the country’s economic conditions and citizens’ personal
living conditions has increased, as have negative ratings of the government’s economic
performance and provision of essential public services. Only three in 10 citizens are
satisfied with the way their democracy is working. But the study also shows that most Guineans
endorse elections as the best way to choose leaders and that citizens’ preference for
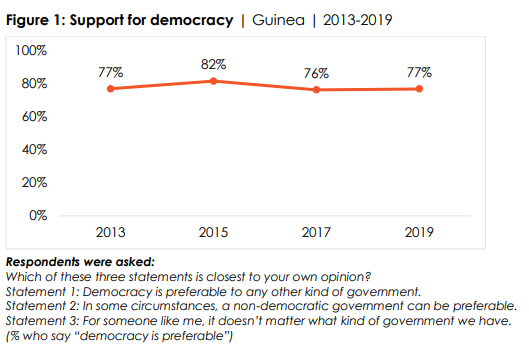
democracy has remained consistently high over the years. Key findings ▪ More than three-fourths (77%) of
Guineans prefer democracy to any other form of government. Support for democracy has
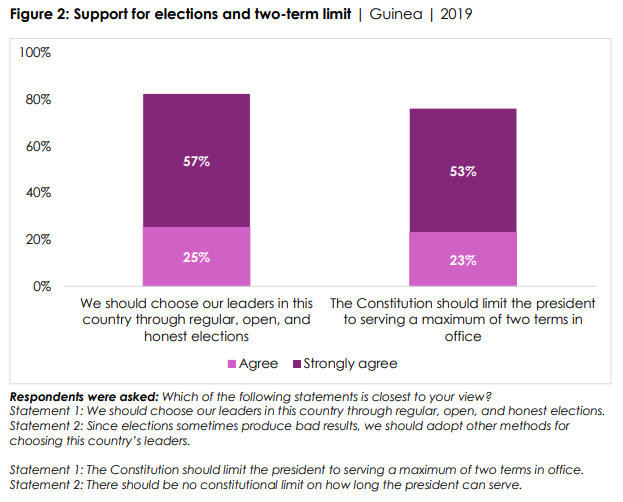
remained high since Afrobarometer began its surveys in Guinea in 2013 (Figure 1). ▪ Eight in 10 Guineans (82%) endorse
free, fair, and honest elections as the best way to choose leaders, including 57% who “strongly
agree” with this view (Figure 2). o A similar majority (76%) want the
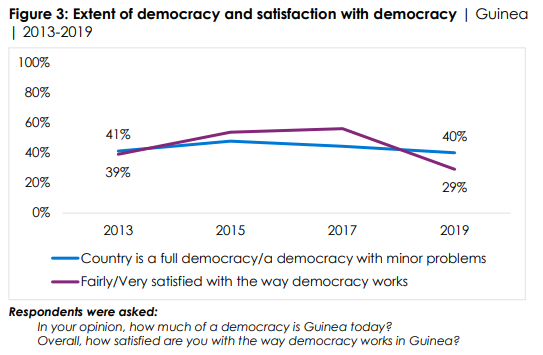
president to serve a maximum of two terms in office. ▪ Only four in 10 Guineans (40%)
describe the country as “a full democracy” or “a democracy with minor problems” (Figure 3). o Only three in 10 (29%) say they are
“fairly satisfied” or “very satisfied” with the way democracy works, a sharp decline from 2017
(56%) after consistent improvement from 2013 (39%). ▪ Almost two-thirds of Guineans (64%)
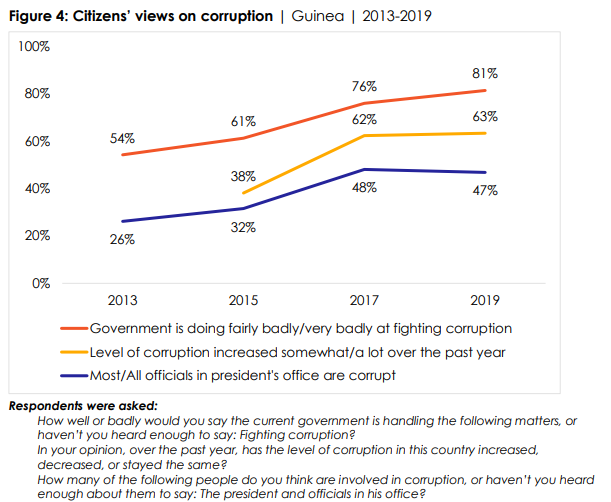
say the country is heading in “the wrong direction.” ▪ The perception that “most” or “all”
officials at the Presidency are corrupt has increased from 26% in 2013 to 47% (Figure
4). o Almost two-thirds (63%) of citizens say
the level of corruption in the country increased during the year preceding the
survey, a 25-percentage-point increase compared to 2015 (38%). o Eight in 10 citizens (81%) say the
government is performing “fairly badly” or “very badly” in fighting corruption, a
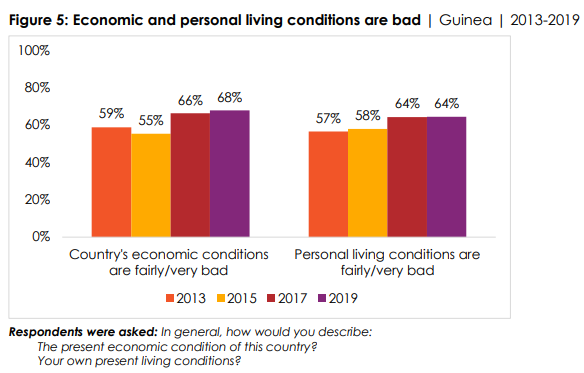
27-percentage-point increase compared to 2013 (54%). ▪ Almost seven in 10 citizens (68%)
describe the country’s economic conditions as “fairly bad” or “very bad,” a significant increase
compared to 2013 (59%) (Figure 5). o The proportion who say their personal
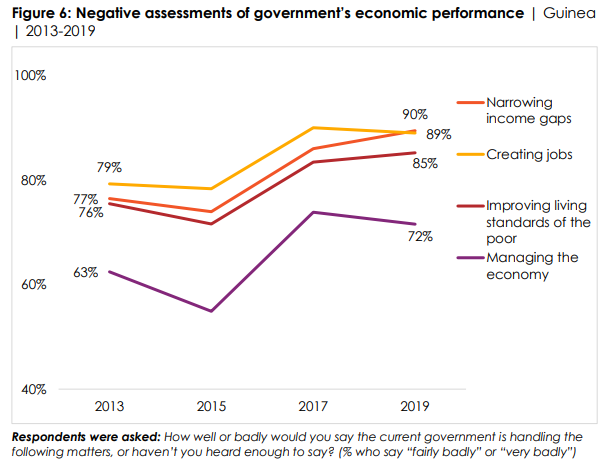
living conditions are “fairly bad” or “very bad” has also increased, to 64%. ▪ About nine in 10 Guineans say the
government is doing “fairly badly” or “very badly” at narrowing income gaps (90%), creating
jobs (89%), and improving living standards of the poor (85%) (Figure 6). o Seven in 10 (72%) rate the government
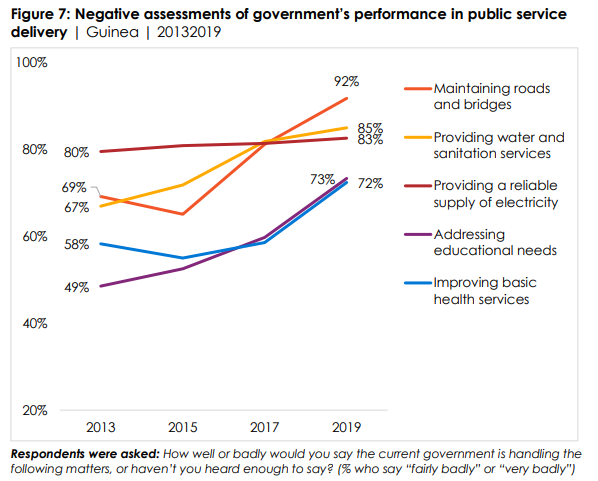
poorly on its performance in managing the economy. ▪ Overwhelming majorities also say
the government is doing a poor job of maintaining roads and bridges (92%), providing water
and sanitation services (85%), providing a reliable supply of electricity (83%),
addressing educational needs (73%), and improving basic health services (72%)
(Figure 7). (Afrobarometer) 6 September 2021 707-43-04/Polls More Than
One In Four Gambian Citizens (28%) Say They Or A Member Of Their Family
Suffered Human-Rights Abuses Under Jammeh’s Regime
A growing number of Gambians want
perpetrators of crimes and human-rights abuses during former President Yahya Jammeh’s
administration to be tried in court, the latest Afrobarometer study shows. Over the past three years, the proportion
of citizens in favour of seeking Jammeh’s extradition has also increased
significantly. However, opinions are divided on the government’s decision to sell Jammeh’s
properties and on whether he should be allowed to return to the country. The Gambia’s Truth, Reconciliation and
Reparations Commission (TRRC) was established by Parliament in December 2017 as part of a
broad transitional-justice mechanism to address human-rights abuses under Jammeh’s
regime and prevent their recurrence. After two years of televised public
hearings, the commission is expected to submit its final report to President Adama Barrow in
September 2021. Although widely credited with highlighting past human-rights abuses, the
commission has also been engulfed in controversies, including accusations of
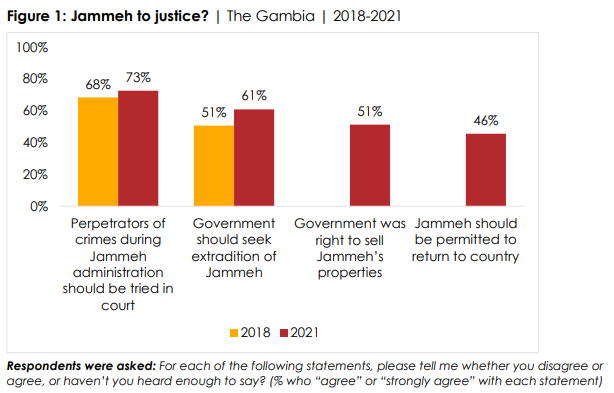
conducting a witch-hunt against Jammeh. Key findings ▪ Almost three-fourths (73%) of
Gambians say perpetrators of crimes and human-rights abuses during Jammeh’s regime should be
tried in court, a 5-percentage-point increase compared to 2018 (Figure 1). ▪ Six in 10 Gambians (61%) say the
government should seek the extradition of Jammeh, a 10-percentage point increase compared to
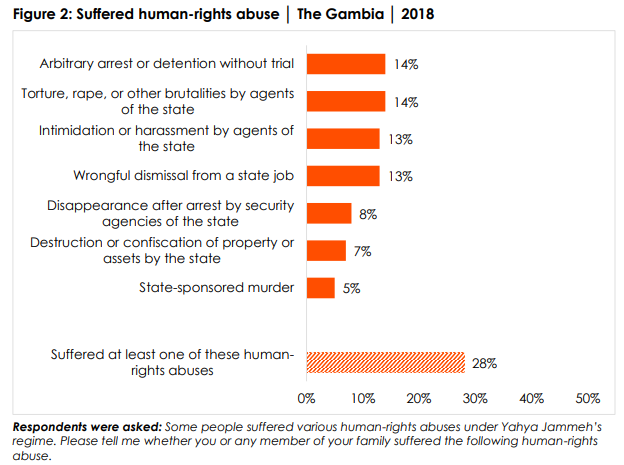
2018. ▪ More than one in four citizens
(28%) say they or a member of their family suffered human-rights abuses under Jammeh’s regime
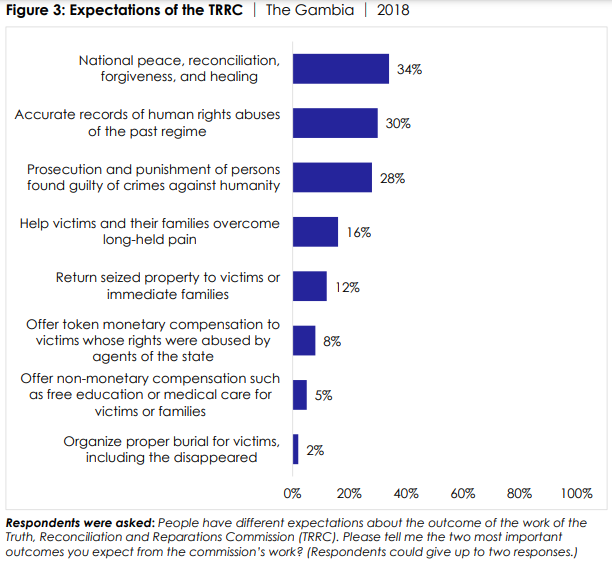
(Figure 2). ▪ Citizens expect the TRRC’s work to
lead to a variety of outcomes, including national peace, reconciliation, forgiveness, and
healing (34%); accurate records of humanrights abuses of the previous regime
(30%); prosecution of accused perpetrators (28%); and support for victims and their
families to overcome long-held pain (16%) (Figure 3). (Afrobarometer) 6 September 2021 707-43-05/Polls A Majority
(58%) Of Tanzanians Say They Have Heard Of Social Media
A majority of Tanzanians support unrestricted
access to social media, but most are also wary of its potential dangers, the latest
Afrobarometer survey shows. Among Tanzanians who have heard of social
media, large majorities believe that such platforms help make people more informed
and effective citizens. However, most also say that social media make people more likely
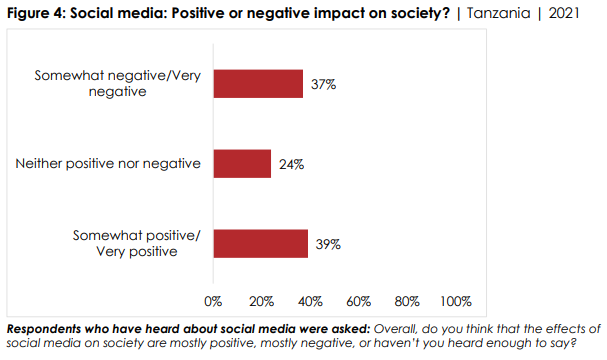
to believe false news and more intolerant of people with different opinions. Overall, Tanzanians are almost evenly
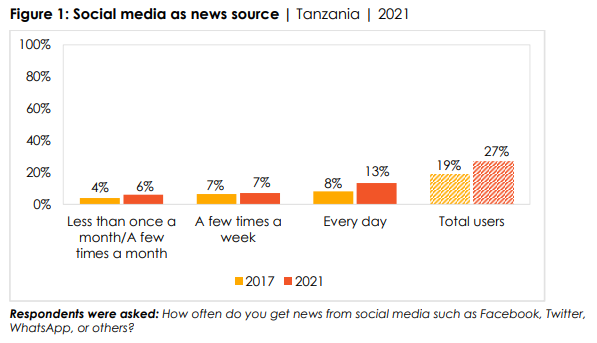
divided on whether the impact of social media on society is positive or negative. Key findings One in five Tanzanians say they get news
from social media every day (13%) or “a few times a week) (7%). In total, 27% of
citizens say they use social media for news at least on occasion, a 9-percentage-point
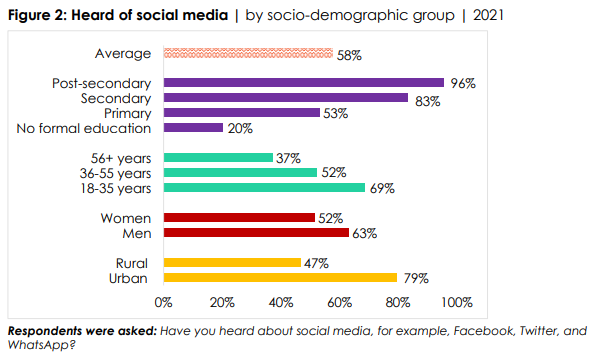
increase compared to 2017 (Figure 1). A majority (58%) of Tanzanians say they
have heard of social media (Figure 2). o Awareness of social media is higher among
men and urbanites than among women and rural residents, and increases
strongly with respondents’ education level, ranging from 20% of those with no
formal education to 96% of those with post-secondary qualifications. Youth (69%)
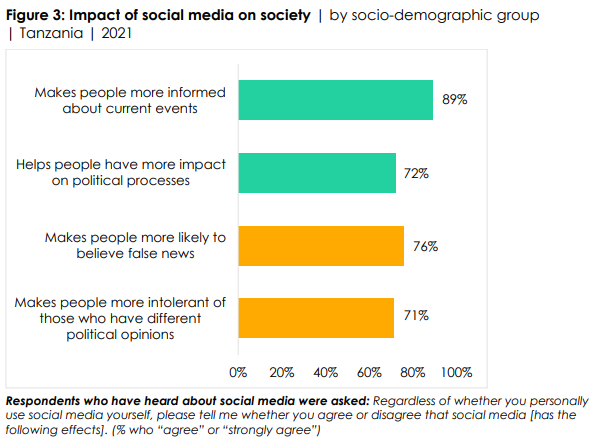
are almost twice as likely to be familiar with social media as older citizens (37%). Among those who have heard of social media: o Most believe that it makes people more
aware of current happenings (89%) and helps people impact political processes
(72%) (Figure 3). o But large majorities also say that it
makes people more likely to believe false news (76%) and more intolerant of others with
different political opinions (71%). o Overall, Tanzanians are almost evenly
split in their views on the effect of social media on society: 39% see its impact as
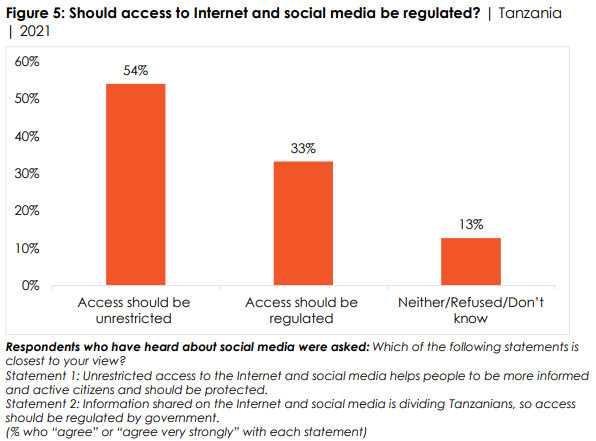
positive, while 37% say it is negative (Figure 4). More than half (54%) of Tanzanians say that
access to social media and the Internet should be unrestricted, while one-third
(33%) want access to be regulated by the government (Figure 5). o Educated citizens, youth, men, and urban
residents are less likely to support the regulation of social media. (Afrobarometer) 8 September 2021 707-43-06/Polls Seven In
Every Ten (71%) South Africans Have Indicated That They Would Vote In The
Coming Local Government Elections
The IEC, supported by some political parties,
brought this application before the apex court due to the complications in
organising local government elections in the middle of the Covid-19 pandemic.
The Constitutional Court ruled that the elections should be scheduled between
27 October and 1 November 2021. The court
ruled that the IEC must comply with the Constitutional prescription that
elections should be held within five years and ninety days of the date of the
previous local government elections. The IEC has also been ordered to
announce a date for a voter registration weekend within three days of the
court’s ruling. Although the
IEC could still approach the Parliament of the Republic of South Africa and seek a postponement of the
elections by amending the Constitution, this will require a two-thirds
majority in Parliament, and it is uncertain if there will be enough support
to delay the polls. Approaching
Parliament would probably limit the little time left to organise and
formulate the logistics of this rather complex process. As there are 278
municipalities1 in South Africa, this essentially means that
everything necessary to successfully organise and implement 278
mini-elections should be done in less than two months. The national
picture – uncertainty and a limited appetite for voting On the
ground very little campaigning has so far been done for these elections and
it is difficult for political
parties to
organise meetings, rallies and all the other usual opportunities to speak to
voters. The reasons are clear. Covid-19 restrictions limit the number of
people who can get together in the same place. But how do
South African voters feel about these elections? There are around 39 million
South Africans eligible to vote – i.e. 18 years or older, but not all of them
are registered. In fact, less than 20 million voted in the last national
election in 2019. Will South
Africans turn out to vote this time or will fear of Covid-19 keep them away?
Or will those who want to vote now visit vaccination centres in droves? In both
the 2016
local government elections and the 2019 national and provincial
elections, voter turnout was down from previous elections. So, is voter
apathy still an issue? Voters have
expressed their discontent with politics and political parties in various
ways over the last few years. Will this have an influence on voter turnout,
or perhaps on the political parties themselves? Traditionally
the voter turnout in local government elections is lower compared to national
and provincial elections – will this be the case again? Ipsos has undertaken a CATI (Computer
Assisted Telephone Interviewing) study from 16 to 20 August 2021,
interviewing 1,501 randomly selected adults in the country about some of
these issues2. The table
overleaf look at some comparisons over time:
Please note
that this table shows results for ALL SOUTH AFRICANS 18 YEARS AND OLDER – it
cannot in any way be construed as a possible prediction of
the outcome of the local government elections.
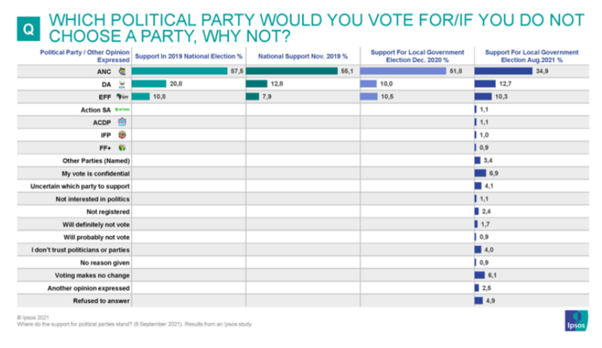
This table
shows a steady decline in support for the ANC in polls involving the total
population eligible to vote since after the previous National Election in May
2019. Over the time of the three Ipsos studies mentioned, the DA and the EFF support stayed relatively constant,
however, none of these two parties were threatening the position of the ANC
as the most popular party in the country. Some
interesting reasons mentioned for not considering voting were3:
A more
realistic view – what if 7 out of every 10 turn out to vote? It is
abundantly clear that not all eligible voters will vote in the local
government elections at the end of October, so, “if there were a local government election tomorrow, which political
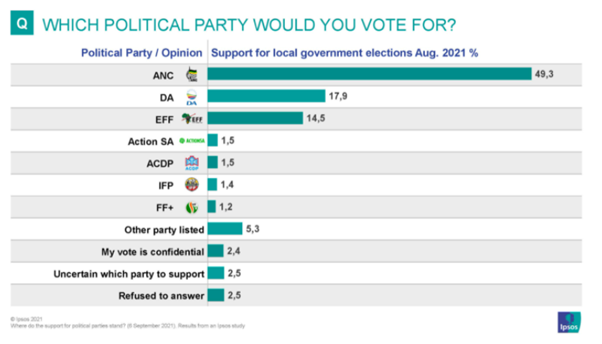
party or organisation will you vote for?” Seven in
every ten (71%) have indicated that they would vote in the coming local
government elections. The data suggest they would also support a wide variety
of parties, as reflected in the graph below. Countrywide almost half (49.3%) will draw a
cross next to the name of the ANC, while the support for both the DA (17.9%)
and the EFF (14.5%) respectively, is also in double figures. South Africa has
a plethora of registered political parties, but very few of them currently garner
more than one percent of support. Please note
that this is also not a prediction of the election, although
a large proportion of voters have made up their minds, 7.4% of those who
indicated that they will vote in the local government elections are not (yet)
allocated to a political party. Predictions, for what they are worth, should
only be made much closer to election day. Who wants to
vote? Looking at
those who indicated that they do want to vote in the local government
elections, it is interesting that the more rural provinces of Limpopo, North
West and the Eastern Cape top the list. And yet, metropolitan areas feature
much more frequently in the travel plans of political leaders. The Free
State has experienced a lot of political turmoil since the last national
election, very much like North West. It reacted totally differently with a
much smaller proportion of voters wanting to participate in the local
government elections. (Ipsos South
Africa) 7 September 2021 Source: https://www.ipsos.com/en-za/where-do-support-political-parties-stand WEST
EUROPE
707-43-07/Polls 7 In 10 Parents Worried About Their Children Catching Covid-19 When
They Return To School
With children starting to head back to the classroom, polling by
Ipsos MORI shows a large majority of British parents with school-age children
are concerned about the risk of their child(ren) catching COVID-19 while at
school. Seventy per cent are concerned about this risk with only 3 in 10
untroubled. Worry increases slightly among mothers with children at school, 74%
of whom are worried compared to 64% of fathers. Those with children at
secondary school are more likely to worry, 72% are concerned about the risk
of their children catching COVID-19 while 68% of primary school parents feel
the same.
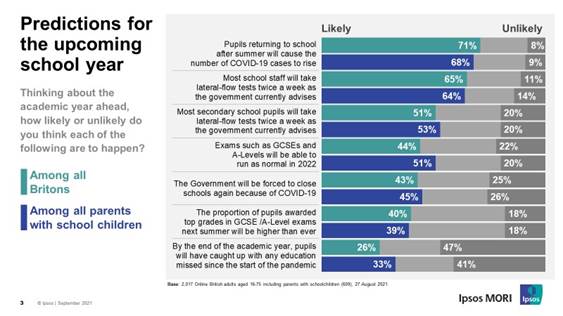
While almost two-thirds (65%) think most school staff will take
lateral-flow tests twice a week, as the government currently advises, only
half of secondary school pupils are likely to so the same (51%).
Less than half of Britons (44%) expect to see exams such as GCSEs and
A-Levels run as normal in 2022, 22% think this is unlikely. Parents are
slightly more hopeful, 51% say exams are likely to run as usual. Four in 10
(40%) say it is likely that the proportion of pupils awarded top grades in
their GCSE and A-Level exams will be higher than ever, 1 in 5 (18%)
disagree. More than 4 in 10 (43%) believe the Government will once again be
forced to close schools because of COVID-19, 1 in 4 disagree. Therefore, it
may be no surprise that almost half say it is unlikely that by the end of the
upcoming academic year, pupils will have caught up with any education missed
since the start of the pandemic (47%), only a quarter think this is likely to
happen (26%), increasing to a third of parents (33%). Kelly Beaver, Managing Director of Public
Affairs at Ipsos MORI, said: As pupils return to schools across the
country, it’s clear that there is a certain degree of concern and trepidation
about the impact of that on COVID cases, as well as concern among parents
about the more direct impacts on them and their children. There are also
broader educational concerns about the way that exams will be run next year
and about the degree to which pupils will have ‘caught up’ on time lost
academically from last year. These are important issues for parents, who’ll
be watching closely to see what the Government does around this crucial area. (Ipsos MORI) 6 September 2021 707-43-08/Polls Just One In Five Members Of The Public Have A Positive View Of The
Foreign Secretary
The foreign secretary Dominic Raab has been under intense scrutiny
following his handling of the crisis in Afghanistan - from being on holiday during
the start of the crisis, to delegating
important tasks to junior aides. The newest YouGov favourability
data shows that this approach has sent Raab’s standing with members of the
public to an all-time low. Only one in five people (19%) now hold a favourable view of Raab, down
3pts since mid-August. A majority of people now hold an unfavourable view of
him (58%), an increase of 9pts versus August. This represents the highest
level of unfavourable opinion Raab has held since our polling of him began in
2020. Overall, these latest favourability scores give the foreign secretary
a net score of -39 among the general public.
Along political lines, some 45% of 2019 Conservative voters have an
unfavourable view of Raab versus 37% who think the opposite – giving him a
net score of -8 among his party’s voters. Of Labour voters, only 8% think
favourable of Raab, while 79% have an unfavourable opinion – a net score of
-71. Elsewhere, the party leaders have seen their scores increase compared
to August, however they remain firmly in the negative. Boris Johnson’s net
score has increased from -25 to -19, with 36% of the public viewing him
favourably and 55% unfavourably. Keir Starmer has seen his net score rise
7pts from -30 to -23. Approaching three in ten (29%) now view the leader of the
opposition favourably, while half (52%) hold an unfavourable view. (YouGov UK) September 06, 2021 707-43-09/Polls 41% Of Britons Said Brexit Is The Main Reason For Reported Shortage
Of Drivers And Supply Chain Issues
In recent weeks there has been a growing issue with a shortage of
delivery drivers, with the media reporting widely on supermarkets, fast food
restaurants and pubs facing problems with their supply chain. Many
commentators have associated this problem with Brexit. Asked what the main reason is for the reported shortage of drivers
and supply chain issues, 41% of people said Brexit, 25% the impact of the
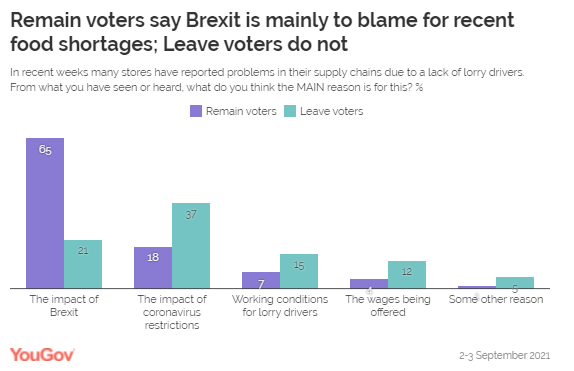
coronavirus, 11% working conditions for drivers and 7% drivers' pay. However, there's a big contrast between the views of Remainers and
Leavers. Among those respondents who voted Remain in 2016, 65% of people
blamed the supply chain problems mostly upon Brexit. Among those respondents
who voted to Leave in 2016, just 21% said the problems were due to Brexit.
Leave voters are most likely to say that coronavirus is the key to the recent
shortages (37%), and they are also more likely than Remain voters to think
that drivers’ pay or conditions are the biggest part of the problem.
In fact, even opinions on whether there are shortages appear influenced
by people's existing views on Brexit. Most people who voted Remain say they
have noticed shortages on the shelves to a large or significant extent (55%),
but only 40% of Leavers do. As with most other political events, our reactions to the drivers’ shortage
are largely driven by our existing views. If you are someone who thought
Brexit was a thoroughly bad thing, then you are more likely to blame it on
Brexit. If you are a supporter of Brexit, then you are more likely to find
another reason. So, whatever the long-term outcome of Brexit, don't necessarily
expect public opinion to rapidly change. Many perceived negative impacts of
Brexit will only be blamed upon Brexit by those already opposed; many
positive impacts will only be accepted by those who were already in favour. (YouGov UK) September 07, 2021 707-43-10/Polls More Than Two In Five Think Christmas Will Be Free Of Pandemic
Restrictions
News has broken that the government could be planning an October
lockdown – despite the promise that the lifting of pandemic
restrictions in July was “irreversible”. According to reports, the October lockdown could be implemented if
COVID-19 hospitalisations
continue at their current rate and overwhelm the NHS - something the
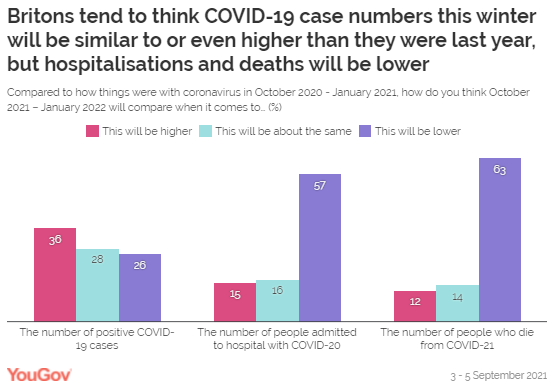
government has since denied. However,
most people (57%) predict that October 2021 to January 2022 will see fewer
hospitalisations than the same period a year ago – a period that encompassed
the bulk of the UK’s second wave. Yet some 31% of people think that this year
could be on par (16%) or worse (15%) than the previous period in terms of
people admitted to hospital. Approaching two thirds of the public (63%) think there will be fewer
deaths during this time than there were last winter, while 14% think the
death rate will be the same. One in eight (12%) think the coming winter could
bring a higher death toll. While people mostly think hospital admissions and deaths will
decrease, a third of Britons (36%) expect the number of COVID-19 cases to be
higher between October 2021 and January 2022 than the same time last year –
this includes one in eight (12%) who think cases will be “much higher”.
Another 28% of people think case numbers will be about the same. Only a
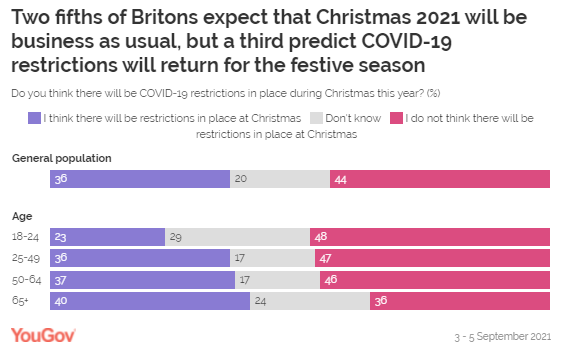
quarter of the public (26%) think that number of infections will be lower. Britons tend to think Christmas will be
free of lockdown restrictions It has been suggested that the so-called “firebreak lockdown” could
see the October
half-term extended, but makes no mention of what might happen later in
the year. Two fifths of Britons (44%), however, are expecting a Christmas
period free of pandemic restrictions. On the other hand, a third (36%) think
there will be some COVID-19 restrictions in place for the festive period once
again. Those aged 65 and above are the least likely to think Christmas will
be business as usual without restrictions (36%), but another 40% think there
will be some rules in place for the festive holiday. On the other hand, those
aged between 18 and 24 are the most hopeful of a restriction-free Christmas
(48%) with around a quarter (23%) thinking at least some form of rules will
be in place. (YouGov UK) September 08, 2021 707-43-11/Polls Twenty Years On, 80% Of Britons Still Remember Where They Were On
9/11
Two decades have passed since terrorists brought down the Twin Towers
in hijacked planes in an unprecedented attack on the US, killing nearly 3,000
people. A new YouGov survey now shows that 80% of Britons can still remember
where they were when they heard the news of the incident. Only one in ten
people (10%) can’t remember their whereabouts when hearing the news, while
another 8% were too young or not yet born. Britons aged 50 to 64 are the most likely to remember the day, with
93% saying it’s still fresh in their memory. Among 18-24-year-olds, 7%
remember where they were when they first heard about the attacks, despite the
oldest people in this group having been only four years old at the time. Fewer Britons believe 9/11 changed the
world completely than ten years ago While a large share of the public are convinced that the world was
not the same after 9/11, this number of those believing it became radically
different has fallen over time. Two fifths of Britons (42%) say the terrorist
incident “changed the world completely” – down from 53% a decade ago. Another
45% believe it changed it “a little”, which is slightly higher than in 2011,
at 38%. Only one in twelve people either say it did not change very much (6%)
or not at all (2%), which is similar to previously (5% not very much, 2% not
at all). Three in five Britons (59%) likewise say that the 11 September
attacks have had a larger impact on the world than the 2007-08 global
financial crisis, a similar figure to the number who said so in 2018 (54%) on
the 10th anniversary of the crisis. Around three in ten
people (30%) currently believe the financial crisis – which until the
coronavirus pandemic had been the worst recession since the 1920s – had a
greater impact (from 32% in 2018). Conservative voters are slightly more likely than Labour members to
say the 9/11 attacks had a larger impact on the world at 65% vs 54%. But while many people still vividly remember hearing about the
attacks, and several terror incidents having happened in the UK since, few
Britons fear for their safety in this context. Some 8% of the public believe there’s a ‘very’ (1%) or ‘fairly’ (7%)
high chance they or someone close to them would become injured or killed in a
terrorist attack. This is similar to both in 2011 (1% very high, 6% fairly
high) and 2006 (2% very high, 6% fairly high). While the proportion of people who feel the odds are high remains the
same, fewer people now say the possibility is ‘almost non-existent’ or ‘very
low’ than previously.
In 2006 and 2011, one in four Britons (25%) believed there was
virtually no chance they or a loved one could become a victim of terrorism,
while another 29-30% felt the chance was very low. Today, only a fifth (18%) regard the possibility as near
non-existent, while a quarter (24%) see it as very low. Instead the most
common answer is ‘fairly low’ at 36% - 5-6 points higher than in 2011 and
2006. (YouGov UK) September 09, 2021 707-43-12/Polls 55% Of Arsenal Supporters Interviewed With Yougov Direct Said They
Were Confident In The Team
A new YouGov Direct survey of Premier League fans reveals that the
opening weeks of the 2021/22 season have already prompted big swings in the
opinions of supporters. Using YouGov Direct, we
interviewed the same group of fans twice, once before the season in
mid-August, and again during the international break, to see how the start of
the season has affected attitudes. Are fans confident in their team and
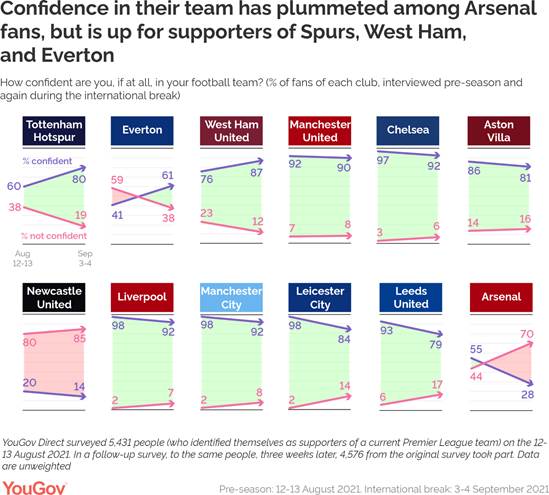
manager? Arsenal have had a rough start to the 2021/22 season, with three
back-to-back losses sending them to the bottom of the table. As a result,
confidence among Gunners fans has taken a significant dive. Before the season
kicked off, 55% of Arsenal supporters interviewed with YouGov Direct said
they were confident in the team. This figure has since dropped 27pts to just
over a quarter (28%). This trend is not limited to Arsenal, with fans of
several other teams having lost a lot of faith, including Leeds United (79%,
down 14 pts from pre-season) and Leicester City (84%, down 13pts).
For others, however, it is quite the opposite. Tottenham Hotspur have
seen three consecutive winners under new boss Nuno Espírito Santo. This
winning streak, as well as successfully retaining key striker Harry Kane for
the foreseeable future, could be behind the 20pt rise in confidence in the
team. Some 80% of Spurs fans interviewed are now confident in the team,
compared to 60% of the same group before the season began. Everton too has
seen a 20pt boost in confidence, rising from 41% to 61% off the back of two
wins and a draw in the first three games of the season. Of the other teams in the league, Liverpool, Chelsea, and Manchester
City all tie for the highest level of confidence, with 92% of fans for each
team being confident in their squads. They are closely followed by 90%
of Manchester United fans. Newcastle United fans are the least confident, at
just 14%. It is a similar story when fans were asked about their club’s
manager. Unsurprisingly, confidence in Nuno Espírito Santo among Tottenham
fans YouGov interviewed grew from 64% to 83% following his successful opening
campaign, including nearly a quarter who are now “very confident” in Nuno
(24%). The opposite is true for Arsenal his rival, Mikel Arteta. Following a
poor start to the season, confidence among Gunners fans interviewed is down
32pts compared to before the season, with just a third (35%) now holding
confidence in the manager. Some six in ten (61%) of the Arsenal fans YouGov
interviewed are not confident in Arteta’s leadership - including 26% who are
“not at all confident” in their manager. Only Newcastle United manager Steve Bruce receives less confidence.
Just 19% of Newcastle fans interviewed say they have confidence in him,
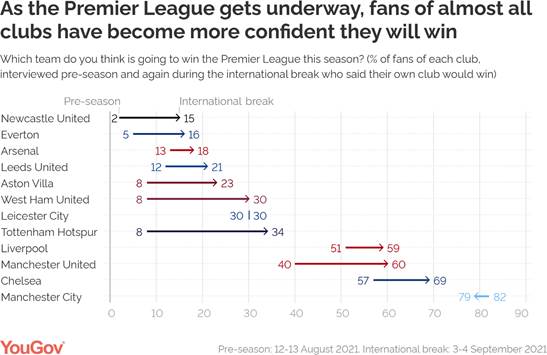
versus 71% who do not. Who will win the league this year? The big question, of course, is whether Manchester City will
make it another back-to-back Premier league win this year. They are the
bookies’ favourite to lift the trophy, but research with YouGov Direct shows
that the proportion of fans predicting another win for Pep Guardiola has
fallen since the start of the season. Overall, 32% of fans interviewed pick City as the winner, down 18pts
from 50% before the season began. Elsewhere, 19% say Chelsea are the likely
victors, up 7pts since the beginning of the season. Another 17% think that
Manchester United could secure their first Premier League win since Sir Alex
Ferguson left the club – also up 7pts since August. Following their strong start to the season, the proportion of Spurs
fans saying thinking Tottenham stand a chance of winning has risen an
additional 27pts on the pre-season survey – the biggest increase among the
teams surveyed. Tottenham fans are now split between 34% who think Spurs
could win, and 32% who think Manchester City will again. Elsewhere fans of teams also jostling for the top spot back
themselves, including 69% of Chelsea fans who think Chelsea will win – up
12pts from 57% in August. Six in ten (60%) Manchester United fans back
themselves, 20pts more than did so before the season began, and 59% of
Liverpool fans think Liverpool will win, increasing 8pts versus pre-season.
Some 15% of Newcastle fans think the Magpies could bring it back for
a win, up from 2% before the season. Hopes have risen among nearly all teams,
in fact, even among Arsenal fans. Some 18% now say that Arsenal will win the
Premier League this season, up 5pts from 13% in August. Manchester City supporters are the most confident they will win (79%)
– however they are the only team to see a decrease in confidence following
the start of the season. Before the season, 82% predicted a City win. Who is expecting a top four finish? Beyond the trophy, there are four Champion’s League spots up for
grabs for the top four teams, and while there are clear favourites among fans
YouGov interviewed, there is sure to be stiff competition. Some 96% of
Liverpool fans interviewed are confident in a top-four position, as are 93%
of United supporters, 92% of Manchester City fans, and 91% of Chelsea fans.
Elsewhere, some 65% of Leicester supporters think they could pinch a top-four
spot, although this is down 10pts since the beginning of the season. Emboldened by early victories, nearly two-thirds of Spurs fans
interviewed think Tottenham could see a return to the Champion’s League this
year. This represents an increase of 23pts from mid-August. At that time,
most fans (55%) had instead been predicting a mid-table finish. Just one in eight Arsenal fans (13%) are confident they will finish
among the top four, down from 33% in mid-August, with the majority (60%)
now expecting a mid-table finish. However, nearly a quarter (23%) expect to
be near the bottom of the table by the end of the season. Newcastle United fans do not hold out high hopes for the 2021/22
season either: 25% fear relegation is likely for the team this year, up from
5% before the season began. Some 60% expect to finish towards the bottom of
the table, a figure largely unchanged from pre-season, while the 30% who
initially thought a mid-table finish was possible has since dropped to
only 10%. (YouGov UK) September 09, 2021 707-43-13/Polls 4 In 10 Britons Think Country Heading In Wrong Direction But Johnson
Much More Popular Than Starmer Among Their Own Voters
Ahead of party conference season, a new Ipsos MORI poll of Britons
aged 18+ (taken before the recent NI announcement) shows that 44% of Britons
think things are heading in the wrong direction (no change from July) and 29%
think things are heading in the right direction (-1 point). The data shows a
predictable party split on this measure with 48% of 2019 Conservative voters
saying things are heading in the right direction compared to 64% of Labour
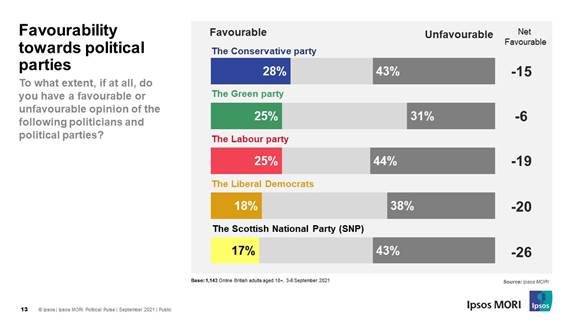
voters saying things are heading in the wrong direction. Favourability towards parties Roughly equal numbers of Britons are favourable towards the two main
political parties with more Britons being unfavourable than favourable for
both:
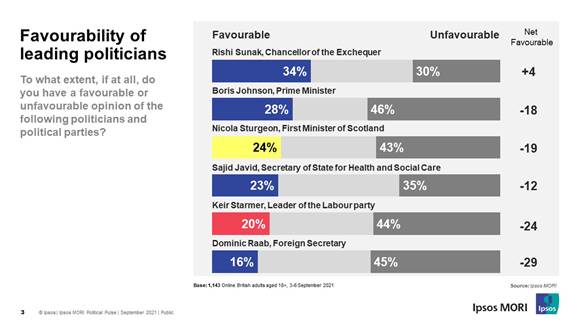
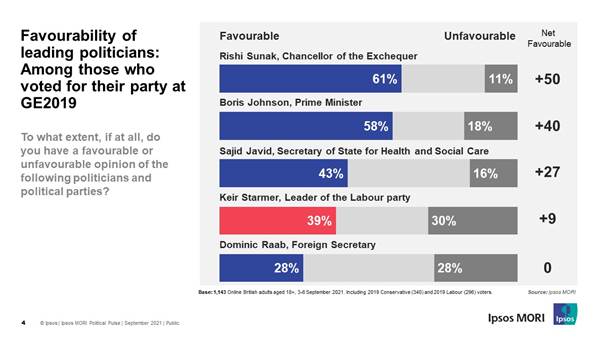
More Britons are unfavourable towards Prime Minister Boris Johnson
and Labour leader Keir Starmer than are favourable but Johnson enjoys higher
favourables than Starmer as Conservative voters feel warmer to him than
Labour voters do to Starmer.
Impact of Brexit
Commenting on the findings, Ipsos
MORI Research Director Keiran Pedley said As we approach party conference season
neither the Conservatives nor Labour enjoy a particular strong brand
position, with more Britons negative than positive about both. However,
Johnson goes into his conference in a stronger position than Starmer, with
Conservative voters more positive about the Prime Minister than Labour voters
are about their leader. Whether this remains to be the case as the row over
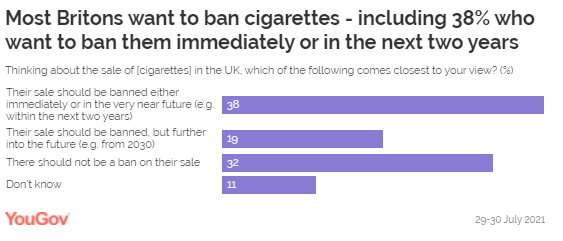
National Insurance and Social Care rumbles on is still to be determined. (Ipsos MORI) 10 September 2021 Source: https://www.ipsos.com/ipsos-mori/en-uk/4-in-10-britons-think-country-heading-wrong-direction 707-43-14/Polls Most Britons 57% Want To Ban Cigarettes – And Half Want To Ban Vaping
Products
The global tobacco firm Philip Morris International (PMI) recently
announced its support for a nationwide
ban on the sale of cigarettes within a decade. The Marlboro maker also
indicated that it would withdraw its own cigarette brands from UK shelves in
the same timeframe. It’s a move that’s broadly in tune with public sentiment: new polling
from YouGov shows that close to three in five Britons (57%) support an
outright ban on the sale of cigarettes, compared to a third (32%) who do not.
And while one in five (19%) are in favour of a ban from 2030 onwards, two in
five (38%) want the government to move even faster – outlawing these products
either immediately or in the near future.
PMI CEO Jacek Olczak says that government action would “end the
confusion” around “smoke-free alternatives” such as e-cigarettes, which the
Benson & Hedges manufacturer will emphasise as it attempts to evolve into
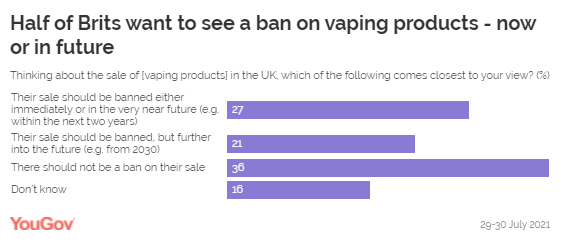
a “healthcare and wellness” company. But our research shows that Britons also tend to favour banning
vaping products: a quarter (27%) of the public would remove them from sale as
soon as possible, while a fifth (21%) would ban them from 2030 onwards.
Overall, half are in favour of a nationwide vape escape (48%) – now or later
– while just over a third are opposed (36%).
While an outright ban on smoking and vaping may not be on the cards
just yet, recent
reports suggest that the government is considering raising the legal age of
buying tobacco to 21 – and outlawing the sale of flavoured
e-cigarettes entirely. (YouGov UK) September 10, 2021 NORTH
AMERICA
707-43-15/Polls Ahead Of The COVID-19 Recession The Unemployment Rate Was Below 4%
Despite the severity of the shock
to the U.S. labor market from the coronavirus
pandemic, the earnings of employed workers overall were largely
unaffected by the pandemic. Inequality in earnings did rise during last
year’s recession, if the unemployed are assumed to
have had no compensation. Even so, the spike was relatively short-lived, in
keeping with the record
low duration of the recession, according to a new Pew Research
Center analysis of government data.
Earnings overall have held steady through the pandemic in part
because lower-wage workers experienced steeper job
losses. Thus, the typical employed worker in 2020 earned more than the
typical employed worker in 2019. A slowdown
in inflation in 2020 benefited all workers, boosting the purchasing
power of their earnings. While unemployed workers lost their earnings, at
least some relief came through unemployment
insurance, a federal package known as the CARES Act and a moratorium
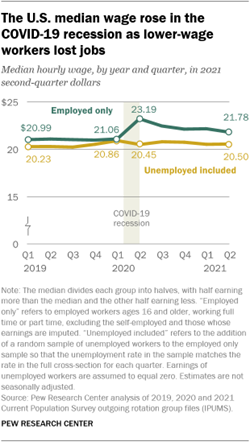
on residential evictions. The median wage of employed U.S. workers had held steady at about $21
per hour for several calendar quarters before the coronavirus outbreak. With
the unemployment rate hovering below 4% ahead of the COVID-19 recession, even
if unemployed workers were included – at zero earnings – there was little effect
on the estimated median wage, nudging it down to about $20 in 2019, but no
more. (Wages are adjusted for inflation and expressed in 2021 second-quarter
dollars.) As the pandemic struck, lower-wage workers proved most likely to
experience a job loss. The shift toward higher-wage workers among the
employed helped to raise the median hourly wage to $23 in the second quarter
of 2020. The median wage of all workers, including the unemployed, remained
unchanged at about $20 per hour, likely because many workers who lost their
job already earned less than the median. The median wage for employed and unemployed workers combined has
remained about the same since the end
of the recession in April 2020. But the median wage among employed
workers alone has drifted down since the second quarter of 2020 as the
unemployment rate dropped and lower-wage
jobs were partially restored. In the second quarter of 2021,
employed workers’ median wage stood at about $22 per hour. It is possible
that it may decrease further as employment in lower-wage jobs returns to
pre-pandemic levels.
Although the change in the composition of employed workers toward
higher-wage workers clouds the picture of how earnings have evolved during
the pandemic, it is possible to gain insight by focusing on the change in
earnings for the same workers
over time. Federal household survey data used
in this analysis records the earnings of many workers at two points in time a
year apart. The sample of employed workers matched over time is a subset of
the overall sample, which varies with the addition and departure of some
survey respondents. It offers another view of how earnings changed during the
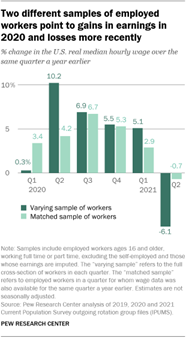
COVID-19 recession and afterward. The median wage of the varying sample
of employed workers – the full cross-section of workers by quarter – had
risen to $23.19 in the second quarter of 2020. This represented an increase of
10.2% over the median wage in the second quarter of 2019. The median wage for
the matched sample of
employed workers – the same workers over time – also increased over this
period, from $23.15 to $24.12, or by 4.2%. While both samples point to higher
earnings in 2020 despite the onset of the pandemic, the much greater increase
in the varying sample points to the sizable role played by the loss of
lower-wage jobs in driving up the increase in the median. Regardless of the sample, the earnings of employed workers in 2020
remained higher than in 2019, albeit less so with the passage of time. As the
unemployment rate fell, the initial rise in the median wage of the varying
sample of workers moderated through the course of 2020. By the fourth quarter
of 2020, the earnings of employed workers in either sample were about 5.5%
higher than in the fourth quarter of 2019. Nonetheless, despite the pandemic
and an economic slowdown, most workers saw higher earnings in 2020.
Those gains proved fleeting, however. In the first quarter of 2021,
the median wage of the matched sample of workers stood 2.9% higher than their
wage in the first quarter of 2020. But, by the second quarter of 2021, the
median wage of the matched sample was 0.7% less than it was a year earlier, and the median wage
of the varying sample had fallen by 6.1%. The larger decrease for the varying
sample is driven again by the changing composition of employed workers, this
time shifting toward lower-wage workers. The recent decline in wages, adjusted for inflation, is also partly
due to an acceleration in the growth in U.S. consumer prices in 2021.
Previously, consumer
prices increased 1.4% from 2019 to 2020, compared with 2.3% from
2018 to 2019. This helped sustain higher earnings for workers in 2020.
However, inflation
has ticked up recently, with consumer prices registering an increase of
4.8% in the second quarter of 2021 compared with the second quarter of 2020.
Thus, the earnings of workers have eroded in recent months, including for the
matched sample of workers. Earnings changed similarly for high- and
low-wage workers from 2019 to 2021, leaving inequality unaffected The earnings of low-wage workers – those in the first quintile of
earners – and high-wage workers – those in the fifth quintile of earners –
evolved similarly from 2019 to 2021. The sole exception is the drop in the
median wage of the first quintile of earners in 2020 when the unemployed are
retained in the sample. Among the employed, the median wage of low-, middle- and high-wage
workers all increased in the second quarter of 2020, followed by a gentle
decline. Over the two-year period from the second quarter of 2019 to the
second quarter of 2021, the median hourly wage of high-wage workers increased
from $50.59 to $52.68 and the median for low-wage workers increased from
$10.79 to $11.70. Overall, wages for the three earning tiers of employed
workers are slightly higher in 2021 than in 2019.
Including the unemployed in the sample has a dramatic effect on the
median earnings of low-wage workers, but relatively briefly. The median
hourly wage of these workers fell from $10.52 in the second quarter of 2019
to $0.00 in the second quarter of 2020, followed by a rebound to $10.00 in
the second quarter of 2021. As the U.S. unemployment rate reached near 13% in
the second quarter of 2020, the unemployed – with zero earnings – comprised a
majority of low-wage workers. Thus, the median wage of this group plunged to
zero amid the recession, but then increased with the restoration of jobs.
With the impact on the median earnings of low-wage workers being of limited
duration, the pandemic also does not seem to have left a lasting imprint on
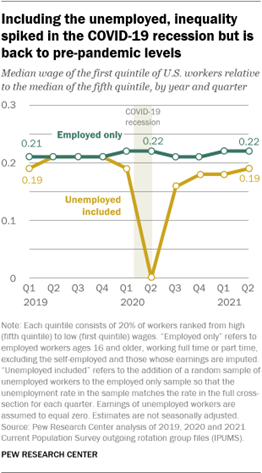
income inequality. In 2019, the median earnings of low-wage workers were
about 20% of the median earnings of high-wage workers. Among employed
workers, this ratio budged little through the recession and in the period
since, with low-wage workers earning 22% as much as high-wage workers in the
second quarter of 2021. Including the unemployed shows the potential for a widening of income
inequality at the start of the pandemic. In the second quarter of 2020,
low-wage workers earned nothing (0%) at the median compared with high-wage
workers – or any other group, for that matter. But the wage ratio increased
to 16% by the third quarter of 2020 and had ascended to 19% by the second
quarter of 2021, comparable to the levels in 2019. Overall, what happened to wage inequality during the COVID-19
recession depends to a large degree on what truly happened to the financial
resources of unemployed workers. If the loss in wages was
replaced by unemployment insurance, supplemental relief under the
CARES Act, or by other
means, there may have been no change in income inequality. But inequality
may yet widen in the near future. Some 39% of the unemployed had been without
work for six
months or longer in July 2021. Evidence shows that these workers are
likely to experience
a loss in earnings as they find new jobs. Meanwhile, there is no
guarantee of financial relief from the government beyond September. Inequality also manifests itself in the form of wage gaps between men
and women and across racial and ethnic groups. Although unemployment
initially increased more among women – to 14.1% in the second quarter of 2020
compared with 12.1% among men – it has fallen more quickly since, according
to government
estimates. The difference in the unemployment rate for women (5.7%) and
men (6.1%) in the second quarter of 2021 is relatively small, as was the case
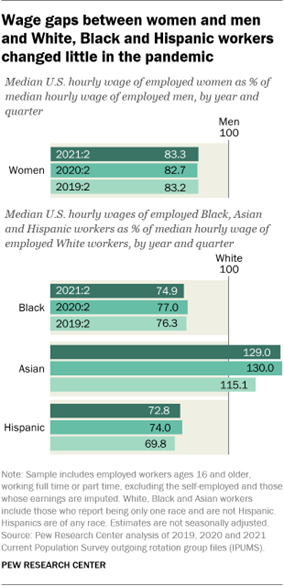
before the pandemic. Likewise, there was virtually no movement in the gender
wage gap, with employed women earning 83.3% as much as employed men at the
median in the second quarter of 2021, about the same as in 2019. Indeed,
the gender
wage gap has held steady at this level since about 2005.
The earnings of employed Black and Hispanic workers relative to the
earnings of employed White workers have also changed little during the
pandemic. In the second quarter of 2021, Black workers earned 74.9% as much
as White workers at the median, compared with 76.3% in the second quarter of
2019. For Hispanic workers, this ratio edged up from 69.8% to 72.8% over the
same period. The most notable change was among Asian American workers, who
have historically
earned more at the median than other racial and ethnic groups. In
the second quarter of 2019, employed Asian workers earned 115.1% as much as
employed White workers. This ratio jumped to 130.0% in the second quarter of
2020 and has since remained at about that level. But the changes in relative earnings, especially for Asian workers,
need to be viewed with caution. In the second quarter of 2021, the
unemployment rate among U.S. Asian workers was 5.6%, more than double its
level of 2.3% in the second quarter of 2019. The proportional increase in the
unemployment rate – or in the number unemployed – for other racial and ethnic
groups has been much less. This suggests that the composition of employed
Asian workers may still lean more towards higher-wage workers than the composition
of other employed workers. Moreover, the median wage of Asian workers may be affected more than
the median for other workers by the shift in who is employed. That is because
the income ladder among Asian Americans is the steepest, with wide gaps
in income among origin groups and more
income inequality than among other groups. Since job losses by
lower-wage workers essentially push the median wage up the earnings ladder,
the group with the steepest ladder – Asian workers – is likely to have seen
the biggest increase. If the unemployed are included in the analysis, the estimated
increase in the earnings of Asian workers relative to the earnings of White
workers from 2019 to 2021 is cut in half. Instead of increasing by 14
percentage points – from 115.1 in 2019 to 129.0 in 2021 – the increase with
unemployed workers included is 7 points. But including the unemployed has no
effect on the estimated change in the earnings of Black and Hispanic workers
relative to the earnings of White workers. (PEW) SEPTEMBER 7, 2021 707-43-16/Polls 62% Of Adults With A Disability Say They Own A Desktop Or Laptop
Computer
More than 40 million people in the United States have a disability,
according to the U.S.
Census Bureau. But even as majorities of these Americans report having
certain technologies, the digital divide between those who have a disability
and those who do not remains for some devices.
Some 62% of adults with a disability say they own a desktop or laptop
computer, compared with 81% of those without a disability, according to a Pew
Research Center survey of U.S. adults conducted Jan. 25-Feb. 8, 2021. And
when it comes to smartphone ownership, there is a gap of 16 percentage points
between those with a disability and those without one (72% vs. 88%). Despite these gaps, similar shares of Americans – regardless of
disability status – say they have broadband at home or a tablet computer. For
example, 72% of adults with a disability report having high-speed internet at
home, a figure that does not differ statistically from the 78% of adults
without a disability who say the same. And there is no statistically
significant difference in tablet ownership between adults who report having a
disability (47%) and those who do not have a disability (54%). There is, however, variation by disability status when considering
ownership of all these
devices that enable people to go online. Roughly a quarter of Americans with
disabilities (26%) say they have high-speed internet at home, a smartphone, a
desktop or laptop computer and a
tablet, compared with 44% of those who report not having a disability.
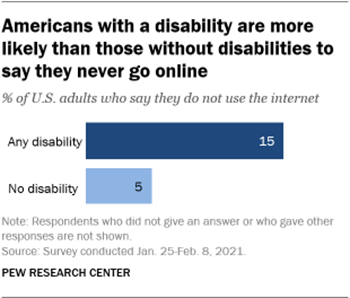
Whether or not someone goes online also varies by disability status.
Americans with disabilities are three times as likely as those without a
disability to say they never go online (15% vs. 5%). And while three-quarters
of Americans with disabilities report using the internet on a daily basis,
this share rises to 87% among those who do not have a disability. Overall, roughly one-in-five U.S. adults (18%) report that they have
a disability, according to this survey, which asked respondents if any
“disability, handicap, or chronic disease keeps you from participating fully
in work, school, housework, or other activities, or not.” (It is important to
note that there are various forms of disabilities, often differing in
severity, and a range of ways to measure disability in public opinion
surveys.) Older Americans are more likely than younger adults to report having
a disability. At the same time, these older age groups generally have lower
levels of digital adoption than the nation as a whole. There are tools on the market aimed at making the digital experience
more accessible to Americans with disabilities. For example, a new search
engine is in the works to help those with disabilities find websites
that are accessible to them. And social media companies have experimented
with artificial
intelligence to help the visually impaired use their platforms,
while other companies are expanding their screen-reading
software and mobile apps. At the same time, there have been many
lawsuits over the years claiming some websites are not accessible to
those with disabilities. (PEW) SEPTEMBER 10, 2021 707-43-17/Polls 46% Of Canadians Who Say They Are Going To Support A Party On
Election Day Are Absolutely Certain Of Their Vote Choice
According to a new Ipsos poll conducted on behalf of Global News,
only 46% of Canadians who say they are going to support a party on election
day are absolutely certain of their vote choice, leaving the remaining voters
less sure (39% fairly certain; 11% not very certain; 4% not at all certain).
Conservative voters (49%, +3 since the start of the campaign) and Liberal
voters (49%, +1) are most likely to be absolutely certain of their choice,
with NDP (43%, +6), Bloc (43%, +13) and Green Party (26%, +13) supporters
less certain of their choice. The NDP appears to have the most room to grow their vote between now
and September 20th. Among those voters who express a first-choice party, 22%
say they’d choose to vote for the NDP as their second choice. This contrasts
with the Liberals (15%), Conservatives (11%), Greens (11%), PPC (7%), Bloc
(3%) or some other party (3%) as preferred second choices. Three in ten (28%)
voters don’t know who they would choose second, led by Conservative voters,
37% of whom wouldn’t identify a preferred second choice. This suggests that
Conservative voters are least likely to be considering a second party. Two thirds (67%) of Canadians say they are completely certain they
will vote in this election. Looking at this intention by party support
reveals no clear turnout advantage for any party: NDP (69%), Conservative
(68%) and Liberal (67%) voters are equally likely to say that they are
certain to vote on or before E-Day. Bloc (63%) and Green (44%) voters are
less enthusiastic about voting. The campaign has clearly had an impact on who Canadians are
considering voting for. Reflecting their positive momentum in the horserace
figures since the start of the campaign, the Conservatives and NDP have
increased their appeal among a greater number of voters than the other
parties. Conversely, vote consideration for the Liberals, Bloc and Green
Party has been decidedly negative. The chart below shows the proportion of
Canadians who say they have become more or less likely to vote for each party
since the start of the campaign, with the change in consideration since last
week in brackets.
Canadians acknowledge the broader trend that Ipsos has been measuring
in its recent polls: one in three (34%) believe the Conservatives have been
gaining the most popularity and momentum over the coming weeks (up 10 points
since last week), while one in four (24%, +7) say it is the NDP who has been
gaining the most strength. Just 17% (-5) believe that it is the Liberals who
are on a roll. In fact, even Liberal voters believe they’re stalling, as just
39% believe they are the party with the most momentum, far behind the
proportion of Conservative (72%) and NDP (67%) voters who say their own party
is gaining the greatest traction in the campaign. Despite this momentum, Canadians still believe the Liberals are the
favorite to win the election, although those odds are less certain than
before. Four in ten (38%) Canadians believe the Liberals will win (down 6
points since the start of the campaign), while 22% believe the Tories will
win the election (up 7 points). Fewer believe that the NDP (7%, +1), Green
(2%, +1), Bloc (1%, -1) or others (1%, +1) are most likely to win. Three in
ten (30%, -1) Canadians say they don’t know who is going to win, rising to
76% among those who haven’t yet decided who they’re going to vote for. An Examination of Second Choices To foreshadow how the vote might evolve in the coming weeks of the
campaign, we examine where vote switchers say they might go and from which
party they are coming. Overall, the NDP (22%) is the preferred second choice of a plurality
of Canadians, followed by the Liberals (15%), Conservatives (11%), Greens
(11%), PPC (7%), Bloc (3%), and others (3%).
In summary, NDP support has the most room to grow (or shrink!), and
most of the potential movement appears to oscillate among the progressive
parties, meaning that the biggest potential for voters moving is Liberals
moving to the NDP or vice versa. While the Conservatives have the least
amount of room to grow, there is an important opportunity for them with soft
Bloc voters considering the Tories as their second choice. Conservative
growth in Quebec, at the expense of the Bloc, is a real possibility, upping
the stakes for O’Toole in the upcoming French-language debates. Moreover, if
the Tories lose votes, they don’t look to be concentrated with a single
opponent. (Ipsos Canada) 6 September 2021 Source: https://www.ipsos.com/en-ca/news-polls/canadians-remain-open-to-changing-their-vote-as-debates-loom 707-43-18/Polls One In Eight (13%) Canadians Is Completely Undecided On How To Vote
Toronto, ON, September 9, 2021 — Over
the course of the election campaign, Ipsos polling has revealed that one in
eight (13%) Canadians is completely undecided on how they will vote in this
federal election. A closer examination of this key group of voters reveals
who they are, how they feel and what is important to them when considering
how to cast their ballot. Who Are They? The following reflects the demographic composition of undecided
voters:
Undecided voters often end up being non-voters come election day. In
a low turnout election, these voters could be among the hardest to motivate.
Even in high-turnout elections, over 30% of eligible voters decided not to
vote. If the debates don’t help to convince these voters one way or the
other, it’s likely that many of them will simply not vote. How Do They Feel about Justin Trudeau? As a whole, this group is slightly less complimentary towards the
Prime Minister than the general population:
Despite being less than enthusiastic about the prime minister’s
performance, they do not see a strong alternative:
They are significantly less likely than the general population to
believe that Justin Trudeau is best described as the leader who will protect
the interests of cultural, religious and other minorities (17% v. 27%
national average), as someone who is best to manage during tough economic
times (21% v. 30% national average), as someone whose values best represent
their own (17% v. 25% national average as someone who has the best
temperament and maturity to be Prime Minister (22% v. 31% national
average),and as someone who gives them hope for the future (17% v. 25%
national average). What Issues are Most Important? While healthcare (34%) and the pandemic (33%) are the two
most-important issues for undecided voters in this election campaign, third
on their list is affordability and the cost of living (30%), significantly
higher than the 23% of the general population who cite this issue as being
among their top priorities. Rounding out the top-five issues are climate
change (21%) and affordability and availability of housing (21%), which once
again over-indexes among this group compared to the general population (14%). One of the main points of differentiation between the average
Canadian and undecided voters is that the vast majority (78%) of undecided
voters don’t know which party has the best plan or the country’s post-COVID
future, believing they’re all the same. By comparison, just three in ten
(30%) Canadians overall say they’re unsure of which party has the best plan
for a post-COVID future. How Do They Feel about This Election? Undecided voters are more likely to feel apathetic towards the
election than Canadians who have already made up their mind, suggesting that
they might be less engaged in the campaign and therefore less likely to vote
as a result.
These data suggest that undecided voters might be difficult to
motivate on election day to get out and cast their ballot (or in an advance
poll or mail-in ballot). If the leaders can woo these voters with their
campaign promises, getting them to actually show up and cast their ballot may
be a different challenge altogether. (Ipsos Canada) 9 September 2021 Source: https://www.ipsos.com/en-ca/news-polls/one-in-eight-canadians-is-completely-undecided-on-how-to-vote AUSTRALIA
707-43-19/Polls The Australian Economy Grew By A Stunning 9.6% Over The Year To June
2021
Retailers have been the big winners during this period and the top
four most trusted brands again
comprise some of Australia’s leading retail brands led by Woolworths, Coles,
Bunnings Warehouse and ALDI in fourth place. Notably, there have been four big improvers in the June quarter 2021
with Department Stores Kmart, Myer, Big W and Target all improving their
standing as some of Australia’s most trusted brands. Kmart has entered the
top 5, both Myer and Big W are new entrants to the top 10 and Target jumped
seven spots in the quarter to be just outside the top 10. Roy Morgan is presenting a special webinar
on the top 20 most trusted and distrusted brands on Tuesday September 14 at
11am. Register your interest in the upcoming webinar. Roy Morgan data scientists analysed nominations from more than 20,000
Australians to identify the nation’s 20 most trusted brands, and 20 most
distrusted brands. According to Roy Morgan CEO Michele Levine,
retailers have enjoyed an unexpected ‘banner year’ caused by Government
responses to the pandemic, however the latest lockdowns in Sydney and
Melbourne point to a challenging period ahead as Australia looks to ‘live
with COVID’ for the first time: “Australia’s big two supermarkets
Woolworths and Coles have held their spots as the most trusted brands in Australia in
the June quarter 2021 ahead of Bunnings Warehouse and fellow supermarket
ALDI. These businesses have been essential outlets for millions of
Australians over the last 18 months and the latest lockdowns in Sydney,
Melbourne and Canberra will again emphasise their importance to many. “The other big winners during the June
quarter 2021 were Department Stores including Kmart, Myer, Big W and Target.
All four lifted their rankings with Myer and Big W entering the top 10 most
trusted brands as many retailers enjoyed record sales as Australians
prevented from travelling and enjoying live entertainment such as sport,
music, theatre and the like redirected their spending into the retail industry. “The latest lockdowns in NSW, Victoria and
the ACT are set to end when vaccination rates in these states reach targets
of 70% and then 80% of the adult population fully vaccinated. This is a big
difference from prior lockdowns as Australians will be ‘living with COVID’
for the first time when these lockdowns end. “This new ‘COVID-normal’ will provide a
challenging environment for retailers that rely heavily on personal
interactions between staff and customers. The big question facing retailers
is how they manage the questions of ‘vaccination mandates’ for staff and
‘vaccination passports’ for customers without destroying the trust they’ve
built up over the past year. “These questions are front and centre for
many businesses approaching a post-pandemic ‘COVID-normal’ but retailers in
particular will face the ‘sharp edge’ of these issues with the high level of
interactions between staff and customers they deal with every day of the
week.” said Levine. Just outside the top 10 there are several other brands to improve
their rankings during the June quarter 2021 including Samsung (11th), IGA
(12th), Target (13th), Australia Post (15th), Bendigo Bank (17th) and JB
Hi-Fi (20th) which is a new entrant as one of Australia’s top 20 most trusted brands. The Roy Morgan analysis also reveals the top 20 list of
Australia’s most distrusted brands with
Harvey Norman entering the top 20 list for the first time while brands
including Amazon, Google, Twitter and Crown Resorts all experienced rising
distrust rankings during the June quarter 2021. Ms. Levine notes the big ‘loser’ in the latest Roy Morgan Risk Report
is Harvey Norman: “Furniture and
electrical retailer Harvey Norman’s entry into the list of Australia’s top 20
most distrusted brands illustrates again the brand damage than can accrue to
a business that is perceived to not be looking after the interests of its
customers and the wider community. “Harvey Norman has been widely criticised
this year for vowing to keep the $22 million in JobKeeper wage subsidies it
received as part of the Government’s economic support despite recording a
record profit before tax of $1.18 billion for the year ended June 30, 2021 –
an increase of $521 million from a year ago. “It appears the pressure on the company has
had an impact though with the company just this week deciding to repay $6
million of JobKeeper wage subsidies – but will this concession prove too
little too late for Harvey Norman to rebuild the trust they have lost during
this period?” The top 10 most trusted brands in Australia
– June 2021 (March 2021 in brackets)
Source: Roy Morgan Single Source (Australia). Risk
Monitor, July 2020 – June 2021. Key commercial brands with 20+
mentions. Base: Australians
14+; n=21,724. (Roy Morgan) September 07 2021 Source: https://www.roymorgan.com/findings/8784-risk-monitor-trust-distrust-september-2021-202109030606 MULTICOUNTRY
STUDIES
707-43-20/Polls 4 Out Of 10 Brazilians Want To Go Back To Working Outside The Home At
The End Of The Pandemic
The new coronavirus pandemic, which had as one of its main
consequences the need for social distance, caused new configurations to be
created in the work environment. Although the term home-office – which
refers to working at home – has been disseminated in the last 18 months, in
Brazil, the prevailing desire is to return to offices and other corporate
spaces that are disconnected from the domestic environment. The Return to the Workplace 2021 Global Survey, carried out by Ipsos
in 29 nations – including Brazil – showed that 40% of respondents in the
country want to work outside their homes in the post-pandemic period. A
slightly smaller percentage, 31%, prefer to work more or completely at
home-office. 9% prefer to work from home as much as they used to do
before the health crisis, 10% did not know how to answer and 11% said that
the nature of their work does not allow them to choose where to work. On
the global average, the percentage of people who want to work outside the
home is 33%. “The research shows that a review of the work model in Brazil is
absolutely imperative. We present similar numbers on both extremes of
preferences: there is a certain balance between people who want to stay at
home and those who want to go back to the office. Companies will have to
deal with a complex scenario and think of a model that respects the
individual peculiarities of each of their employees”, analyzes Marcos
Calliari, CEO of Ipsos in Brazil. In Brazil, 14% of respondents say they worked from their homes before
the Covid-19 crisis. In the pandemic, the number grew to 26%. In
the world, there were 13% working at home-office, and currently there are
25%. Among the factors that may explain the reasons why Brazilian
respondents want to return to face-to-face work, 58% say they miss their
co-workers – against 52% on the global average –, 41% do not feel engaged
when working from home – a number slightly higher than the global average of
37% – 38% claim that the home environment hinders productivity – exactly the
same portion as globally – and 35% feel more exhausted when working on a
home-office basis, in line with the global average of 33%. “In the case of Brazilians, the issue around socialization and
contact with people is a cultural aspect that plays a very important
role. This integration is also desired by employers, since engagement
with the company happens a lot based on engagement between
employees. Clearly there is a massive perception that there are losses
if the worker is not in person. That's why many companies that
prematurely declared that they would never return to the office are reviewing
their position”, says Calliari. For 27% of respondents by Ipsos in Brazil, it should still take from
6 months to a year to return to face-to-face work. Only 17% think it
will take less than 6 months, 15% believe it will take more than a year and
19% have no idea. Furthermore, 22% believe that, as far as the professional
aspect is concerned, things will never go back to the way they were before
the Covid-19 pandemic. In the possibility of a hybrid return, where employees work outside
their homes a few times a week, 7% think that the ideal would be to work from
home 4 days a week, 18% would like to stay at home 3 times a week, 15% would
work in home-office 2 days a week and 10% would like to work from their homes
only once a week. In addition, 30% said they preferred to work from
their homes 5 days a week and 20% would not like to work at home any day of
the week. The online survey was conducted with 12,445 respondents from 29
countries, 1000 of which were Brazilian, between May 21 and June 4, 2021. The
margin of error for Brazil is 3.5 percentage points. (Ipsos Brazil) 8 September 2021 707-43-21/Polls Most Adults Vaccinated Against Covid-19 In All 13 Countries Surveyed
Intend To Get A Booster Shot
A new 13-country Ipsos survey conducted in partnership with the World Economic Forum finds
large majorities of adults fully vaccinated against COVID-19 saying they
would get a booster shot if it were available to them. Booster uptake intent
ranges from 62% in Russia to 96% in Brazil. It is higher among those aged 55
and older in many countries. In all but one of the 13 countries, most citizens surveyed expect
vaccine booster shots to be required at least annually to maintain protection
against COVID-19. However, majorities of adults in every country agree that
the priority for vaccines should be first doses for those who want them
before making booster shots available. The survey was conducted August 26-30, 2021 on Ipsos’ Global Advisor
online platform among 9,521 adults under the age of 75, including
5,977 who have already received two doses of a COVID-19. Detailed Findings High levels of booster uptake intent levels
among fully vaccinated adults in all 13 countries In each of the 13 countries surveyed, a large majority of adults who
have received two doses of a COVID-19 vaccine strongly or somewhat agree they
would get a booster shot if it were available today:
While it varies widely across countries, COVID-19 booster uptake
intent among the fully vaccinated does not differ significantly within any of
the 13 countries along gender lines. However, it is notably higher among
those aged 55-74 than it is among younger adults in Canada, France, Germany,
and the U.K.
In several countries, younger people are significantly more likely
than their elders to agree that vaccine booster shots will not be needed when
the incidence of COVID-19 has receded, and life has returned to normal. This
pattern is very clear in Australia, Germany, Russia, the U.K., and the U.S.
Also, in Spain and the U.S., men are more likely to share this view than are
women. Widespread expectation that booster shots
will be needed at least annually Majorities of citizens surveyed in 12 of the 13 countries strongly or
somewhat agree that vaccine booster shots will be required at least every
year to maintain protection against COVID-19. The expectation that booster
shots will be needed annually or more often is highest in Mexico (85%),
Brazil (83%), and the U.K. (77%), and lowest in Russia (43%). Agreement that vaccine booster shots will be needed at least every
year increases with age. In France, Germany, Italy, Japan, Russia, and the
U.K., it is at least 10 percentage points higher among those aged 55-74 than
it is both among those under age 35 and those aged 35-54. While it is
significantly more prevalent among females than it is among males in Brazil,
Mexico, and the U.K., the opposite is true in Germany. Getting first doses remains a priority over
booster shots Despite high levels of booster shot uptake intent, majorities of
adults in all 13 countries (from 83% in China and Japan to 56% in France)
agree that the priority for vaccines should be to give first doses to those
who want them before making booster shots available. No more than one-quarter
in any of the 13 countries – and as few as only one in ten in some of them –
disagree. While agreement with making first doses of COVID-19 vaccines a
priority over making booster shots available varies in intensity from one
country to the other, it tends to be very consistent across age groups and
gender lines within each country. France and the U.S., where agreement is
higher among males than it is among females, are the only exceptions.
(Ipsos Canada) 10 September 2021 Source: https://www.ipsos.com/en-ca/news-polls/global-attitudes-covid-19-vaccine-booster-shots |