|
BUSINESS & POLITICS IN THE WORLD GLOBAL OPINION REPORT NO. 709 Week:
September 20 –September 26, 2021 Presentation:
October 01, 2021 Urban
Indians Look Forward To A Golden Diwali, With Nearly Three In Ten Planning To
Spend On Gold Hindus
Made Up 79.8% Of India’s 1.2 Billion (120 Crore) Total Inhabitants In The
Most Recent Census 72%
Of Afghans Reported Lacking Money For Food In 2019, An All-Time High More
Than Half (52%) Of The UK Public Know Someone Who Has Been Diagnosed With
Dementia Manchester
United Is The Best-Supported Premier League Club In The UK, But There’s Close
Competition One
In Eleven Say The Coronavirus Act Should Be Made Permanent 54%
Of French People Believe That The School System Works Poorly In
U S, An Estimated 18 Million Can't Pay For Needed Drugs Half
Of Americans Said Their Area Had Experienced Extreme Weather Over The Past
Year US
Hispanic Population Reached More Than 62 Million In 2020 Fewer
Than Half Of U S Adults (44%) Now Approve Of The Way Biden Is Handling His
Job As President Majority
Of Australians 76% Report Unwavering Support For Abortion Access A
Median Of 79% Across 16 Publics Have A Favorable Opinion Of Germany In
Six Of 13 Countries, Online Lottery Is The Most Popular Online Product INTRODUCTORY NOTE
709-43-23/Commentary:
Urban
Indians Look Forward To A Golden Diwali, With Nearly Three In Ten Planning To
Spend On Gold
With the
festive season around the corner, YouGov’s Diwali Spending Index, an
indicator of spending propensity, reveals a recovering appetite to spend
during festive season among urban Indians. At 90.71,
the spending intent is higher than last year (80.96), however, it is yet to match
the pre-pandemic times. When asked
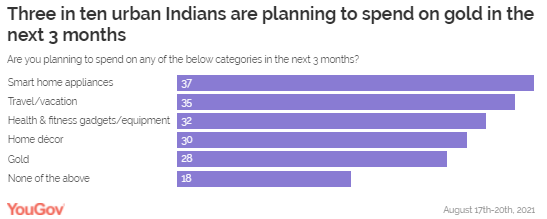
about where they are planning to spend in the next three months, nearly two
in five urban Indians claimed they are likely to spend on smart home
appliances (37%). Following this, roughly a third said they would be spending
on travel (35%) or health and fitness gadgets (32%). Almost three
in ten urban Indians (28%) are planning to spend on gold in the next 3
months. Millennials were most likely to say this as compared to the rest of
the generations, at 36%. Furthermore,
seven in ten (69%) of these prospective gold buyers agreed with the
statement, "Diwali and the
festive season is the best time to buy gold", highlighting
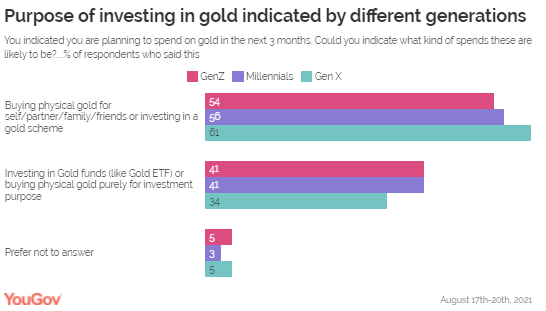
their inclination to spend during the festive season. Our data
suggests out of those looking to spend on gold in the near future, nearly
three in five respondents (58%) are planning to buy gold for personal/family
use either in physical gold form or through a gold scheme (like Tanishq Gold
Harvest Plan). The
remaining (38%) are likely to spend on the yellow metal for the purpose of
investment either through gold funds or in physical gold form. Among the
generations, the GenX are somewhat more likely than GenZ and millennials to
buy gold for personal use (61% GenX vs 56% millennials and 54% GenZ) while the
younger adults are more likely than their predecessors (41% millennials and
GenZ vs 34% GenX) to invest in gold this festive season. When we look
at this across regions, we see that respondents in South India are more
likely to buy gold for personal use while North Indians are keener to invest
in gold this festive season. Those buying
gold for personal use are most likely to buy it from branded jewellery stores
(56%), followed by local jewellers (36%). For investors, buying gold from
branded jewellery stores is the most likely option (23%), but it is closely
followed by investments through online trading apps or through banks (21%
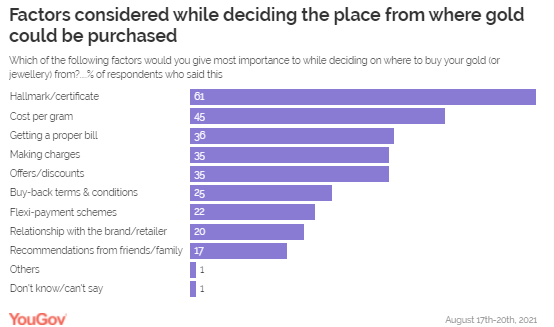
each). Hallmark or
certificate is the most important consideration factor when deciding where to
buy gold from (61%), followed by the cost per gram (45%) and a proper bill
for the purchase (36%). Flexi-payment schemes (22%), relationship with the
brand or retailer (20%) and recommendations from friends are family (17%) are
far less important to consumers. Hallmark/
certification and offers or discounts are notably more important in East
India (at 71% and 50% respectively) while making charges appeal more to South
Indians (at 46%) than the rest of the population. Similarly,
recommendations from friends and family are notably more important to men
than women (24% vs 10%) when deciding where to buy gold from. When asked
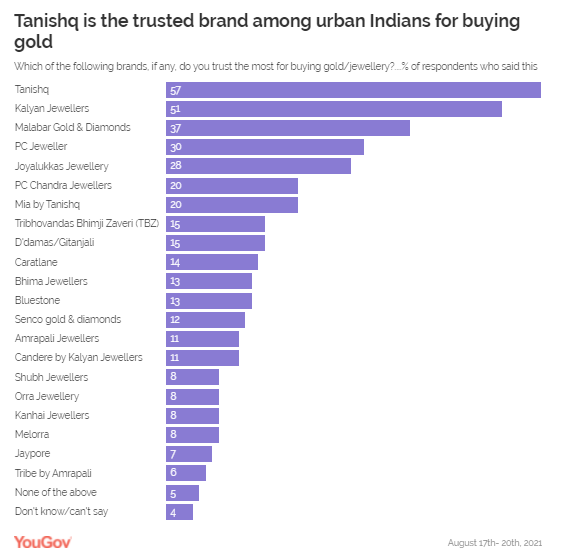
which brands do they trust the most for buying gold, a majority (57%) named
Tanishq as their most trusted brand. Kalyan Jewellers (51%), Malabar Gold
& Diamonds (37%) and PC Jewellers (30%) are other brands that are trusted
by people when it comes to buying gold. Interestingly,
all these brands appeal more strongly to the millennials than the rest of the
generations. (YouGov
India) September
22, 2021 Source: https://in.yougov.com/en-hi/news/2021/09/22/urban-indians-look-forward-golden-diwali-nearly-th/ 709-43-24/Country Profile:
SUMMARY
OF POLLS
ASIA (India) Urban
Indians Look Forward To A Golden Diwali, With Nearly Three In Ten Planning To
Spend On Gold When asked about where they are planning to
spend in the next three months, nearly two in five urban Indians claimed they
are likely to spend on smart home appliances (37%). Following this, roughly a
third said they would be spending on travel (35%) or health and fitness
gadgets (32%). Almost three in ten urban Indians (28%) are planning to spend
on gold in the next 3 months. Millennials were most likely to say this as
compared to the rest of the generations, at 36%. (YouGov India) September 22, 2021 Hindus Made Up 79.8% Of India’s 1.2 Billion
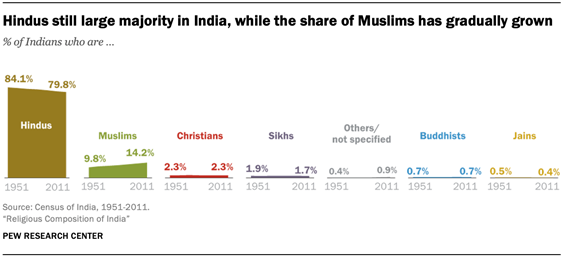
(120 Crore) Total Inhabitants In The Most Recent Census Hindus made up 79.8% of India’s 1.2 billion
(120 crore) total inhabitants in the most recent census, conducted in 2011.
That is 0.7 percentage points less than in the previous census in 2001, and
4.3 points below the 84.1% recorded in 1951. Meanwhile, the share of Muslims
grew from 13.4% in 2001 to 14.2% in 2011 – up by a total of 4.4 percentage
points since 1951, when the census found that Muslims comprised 9.8% of
India’s population. Christians, Sikhs, Buddhists and Jains, who together make
up nearly all of the remaining 6% of the population, were relatively stable
in their shares since the 1951 census. (PEW) SEPTEMBER 21, 2021 (Afghanistan) 72% Of Afghans Reported Lacking Money For Food In 2019, An
All-Time High Gallup World Poll data in recent years have
painted an increasingly difficult economic situation throughout the country
as Afghans have struggled to afford even the basics. In November/December
2019, just before the February 2020 signing of the U.S.-Taliban peace deal,
more than seven in 10 Afghans (72%) reported that there had been times in the
past 12 months when their household lacked enough money for food. This marked
a 15-percentage-point increase from 2018 and a new high since Gallup first
began measuring this item annually in Afghanistan in 2008. (Gallup) SEPTEMBER 23, 2021 WEST
EUROPE (UK) 86% Britons Support The Idea That Government Should Provide
More Information To The General Public About Levelling Up Ipsos MORI’s KnowledgePanel has found that
between March and July 2021, Britons’ awareness of the Government’s Levelling
Up strategy increased. Those knowing at least a little about it rose by
8 points from 48% to 56%, with an equivalent fall in those who know or heard
nothing about it These increases were seen across all regions except the West
Midlands, particularly the North East . (Ipsos MORI) 21 September 2021 More Than Half (52%) Of The UK Public Know Someone Who Has
Been Diagnosed With Dementia Wave 2 of the Monitor has revealed that
more than half (52%) of the UK public know someone who has been diagnosed
with the condition - a figure that remains unchanged since Wave 1. This is
most often a grandparent (17%) or parent (13%). The majority of people (68%)
correctly disagree with the statement ‘dementia is an inevitable part of
getting older’ - up from 60% in Wave 1. The proportion who are unsure whether
dementia is inevitable has fallen from 17% to 11%. (Ipsos MORI) 22 September 2021 Manchester United Is The Best-Supported
Premier League Club In The UK, But There’s Close Competition Starting off, Manchester United claim the
top spot with Liverpool hot on their heels. Almost a fifth of Premier League
fans in Britain support the Red Devils (19%), while Jurgen Klopp’s team
enjoys support from 17%. While the contest is close at the top of the table,
there is a significant gap between them and the rest. Arsenal come in at No.3
in the support stakes,with one in ten followers of the Premier League saying
they support the Gunners (10%). Chelsea and Tottenham Hotspur are next in
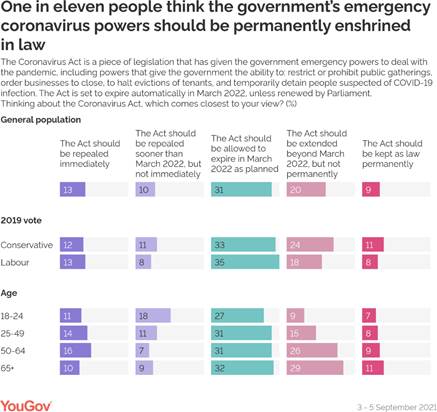
line with 8% of Premier League followers saying they support those clubs. (YouGov UK) September 24, 2021 One In Eleven Say The Coronavirus Act
Should Be Made Permanent New YouGov research shows that nearly three
in ten people think the act should be extended, however. This includes 20% of
people who think the Act should be extended temporarily and 9% who think it
should be permanently enshrined in law. Conservative voters are more likely
to think the Coronavirus Act should be extended or made permanent (35%) than
Labour voters (26%). However, Labour voters are not necessarily more in
favour of repealing the Act early, with a higher proportion unsure (18%) than
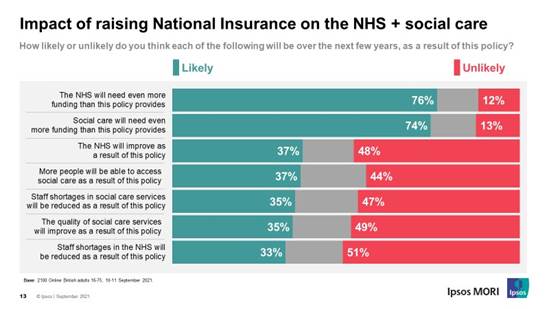
Tories (8%). (YouGov UK) September 24, 2021 Over A Third Say The Quality Of Social Care Is Likely To
Improve As A Result Of The Plan To Raise National Insurance To Help Fund
Health And Social Care Last week, the UK
Government announced a plan to raise National Insurance to help fund health
and social care. Now, new research by Ipsos MORI shows many Britons are split
in their support for the policy, the impact it will have on the NHS and
social care, and how fairly it treats different groups. Just over a
third say the quality of social care is likely to improve as a result of this
policy (35%) while 37% are hopeful for improvement in the NHS. However half
are more sceptical, thinking it is unlikely that the NHS or the quality of
social care will improve (48% and 49% respectively). (Ipsos MORI) 26 September 2021 (France) 54%
Of French People Believe That The School System Works Poorly At first glance, the school system is
primarily associated with the acquisition of skills (55% of French people
associate this notion with it). However, it is also linked to negative
notions such as obligation / constraint and the forbidding aspect
(respectively 42% and 39%). (Ipsos France) 22 September 2021 NORTH AMERICA (USA) In U S, An Estimated 18 Million Can't Pay For Needed Drugs Seven percent of U.S. adults --
representing an estimated 18 million persons -- reported in June that they
were unable to pay for at least one doctor-prescribed medication for their
household during the prior three months, according to the most recent West Health and Gallup survey. This percentage is
in line with the 6% reported in March. Among those in households earning less
than $24,000 per year, however, the percentage has jumped from 10% to 19%, a
statistically significant increase. (Gallup) SEPTEMBER 21, 2021 Roughly A Quarter Of American Adults (23%) Say They Haven’t
Read A Book In Whole Or In Part In The Past Year Adults whose annual household income is
less than $30,000 are more likely than those living in households earning
$75,000 or more a year to be non-book readers (31% vs. 15%). Hispanic adults
(38%) are more likely than Black (25%) or White adults (20%) to report not
having read a book in the past 12 months. (The survey included Asian
Americans but did not have sufficient sample size to do statistical analysis
of this group.) (PEW) SEPTEMBER 21, 2021 Half Of Americans Said Their Area Had Experienced Extreme
Weather Over The Past Year Nearly 5 million NFIP policies were in
force as of July 2021, the most recent month available. That figure hasn’t
varied much for the past few years, though it’s down from a peak of 5.7 million policies at the end of 2009. Flood insurance
is available in over 22,000 communities throughout the country, but it’s
particularly important in states that border the Gulf of Mexico: 60% of all
policies in force, accounting for a somewhat higher share of covered property
value, are in Florida, Texas and Louisiana. (PEW) SEPTEMBER 22, 2021 US Hispanic Population Reached More Than 62 Million In 2020 Of the 42.7 million adults with Hispanic
ancestry living in the U.S. in 2015, an estimated 5 million people, or 11%, said they do not
identify as Hispanic or Latino, according to a Pew Research Center survey
of U.S. adults. These people aren’t counted as Hispanic in Pew Research
Center surveys. The Census Bureau generally takes a similar approach in its
decennial census. Hispanic self-identification varies across immigrant
generations. Among the foreign born from Latin America, nearly all
self-identify as Hispanic. But by the fourth generation, only half of people
with Hispanic heritage in the U.S. self-identify as Hispanic. (PEW) SEPTEMBER 23, 2021 Roughly Six-In-Ten (59%) Of Those Who Relied Most On Trump
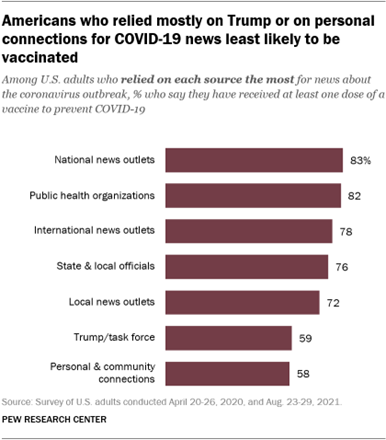
Say They Have Received At Least One Dose Of A Covid-19 Vaccine Those who cited Trump and his task force
and those who cited personal and community networks as their favored COVID-19
news sources are far less likely than those who relied on other source types
to have received at least one shot of the vaccine. Roughly six-in-ten (59%)
of those who relied most on Trump say they have received at least one dose of
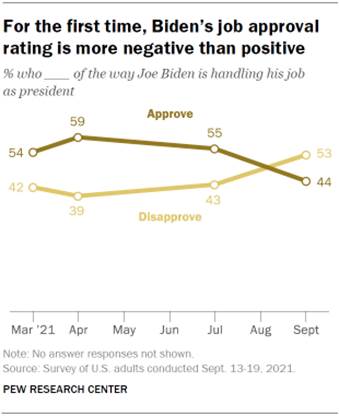
a COVID-19 vaccine, while 38% say they have not received a vaccine. (PEW) SEPTEMBER 23, 2021 Fewer Than Half Of U S Adults (44%) Now Approve Of The Way
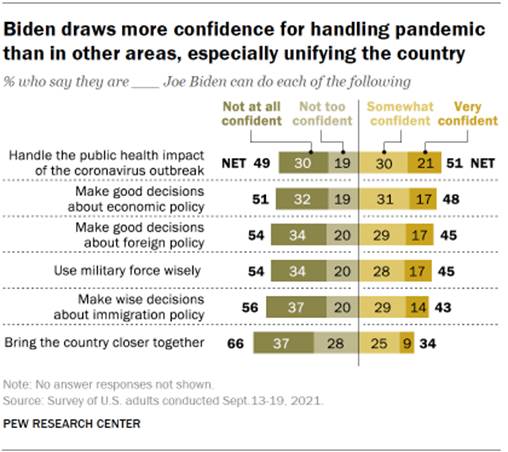
Biden Is Handling His Job As President Since spring, public confidence in Biden
has declined across several issues. In March, majorities expressed confidence in him
across six of seven dimensions, including his handling of the public health
impact of the coronavirus, and foreign and economic policies. Today,
about half still express confidence in his handling of the coronavirus and
the economy – but majorities have little or no confidence in him in four
other areas. (PEW) SEPTEMBER 23, 2021 (Canada) 4 Out Of 5 Canadians (83%) Agree That It Is A Priority To
Retain Canada’s Key Capacity To Train Military Pilots Under Canadian Control As the pandemic continues to exert
pressures, Canadians are looking inwards at how best to secure sovereignty
and domestic economic growth. According to a recent survey study conducted by
Ipsos, 4 out of 5 Canadians (83%) agree that it is a priority to retain
Canada’s key capacity to train military pilots under Canadian control.
Sovereignty remains at the forefront of Canadians’ minds, with a near
consensus (92%) agreeing that it is essential to national sovereignty and
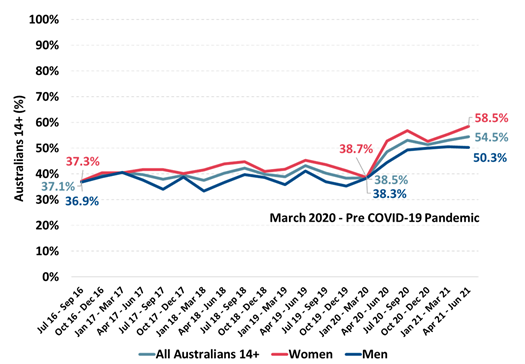
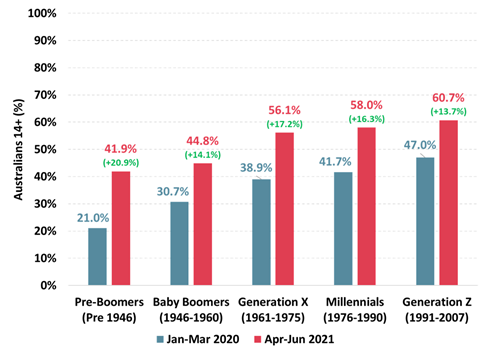
security that Canada retain the training of its military pilots. (Ipsos Canada) 20 September 2021 AUSTRALIA Covid-19 Pandemic Drives Australians To Increasingly ‘Shut
Themselves Off From The Rest Of The World’ When At Home Prior to the pandemic agreement with this
statement had barely changed over the preceding four years, increasing by
just over 1% point since the September quarter 2016. Women have driven a
larger share of this increase since the pandemic began than men. A clear
majority of 58.5% of women agree with the statement in the June quarter 2021,
an increase of 19.8% points from the March quarter 2020 and up over 21%
points from five years ago. (Roy Morgan) September 21 2021 MULTICOUNTRY STUDIES Majority Of Australians 76% Report Unwavering Support For
Abortion Access Seven in 10 Australian adults support
access to abortion, an online study by Ipsos has found. The study, conducted
across 27 countries, also found that global support for access to abortion
has been steadily increasing since 2014, with the largest increases seen in
South Korea and parts of Latin America. In Australia, support for abortion
has remained consistent over the past eight years: 76% supported abortion in
2021, compared to 74% in 2018, and 77% in 2014. (Ipsos Australia) 20 September 2021 Source: https://www.ipsos.com/en-au/majority-australians-report-unwavering-support-abortion-access A Median Of 79% Across 16 Publics Have A Favorable Opinion
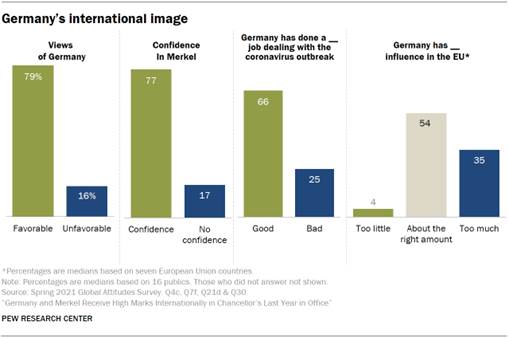
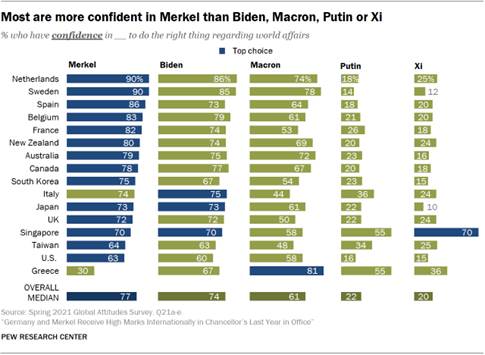
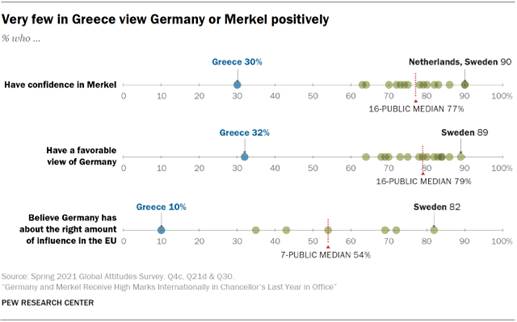
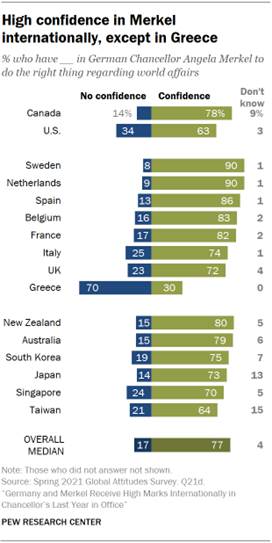
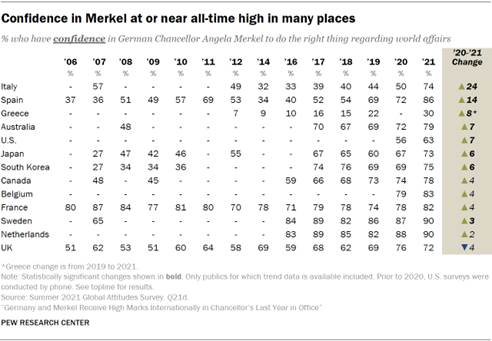
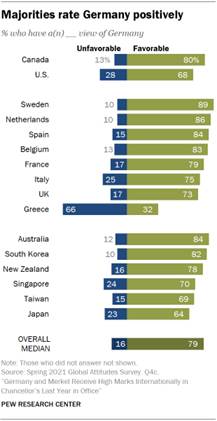
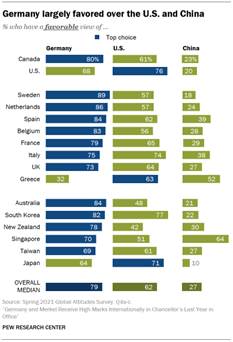
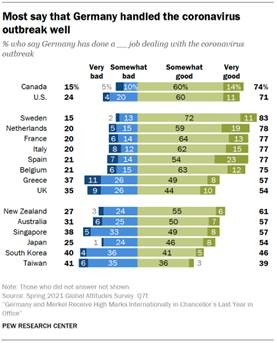
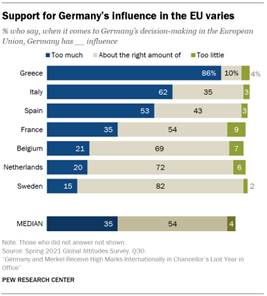
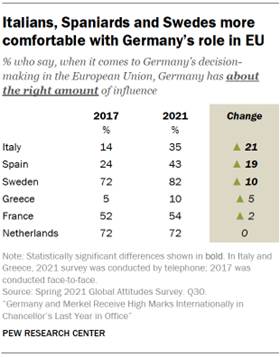
Of Germany Majorities in nearly every public surveyed
have confidence in Merkel to do the right thing in world affairs, including
nine-in-ten in the Netherlands and Sweden. Merkel has enjoyed generally high
ratings in a number of countries since she first took office, with confidence
growing as more people became familiar with her over time. In most places
surveyed, trust in the German chancellor has never been higher. (PEW) SEPTEMBER 22, 2021 Of 28 Countries, Brazil Is The One That Most Believes That
Women In Political Leadership Would Bring Peace To The World More than 7 out of 10 Brazilians believe
the world would be more peaceful and successful if we had more female
political leaders. This is what a survey on global leadership conducted
with respondents from 28 nations, including Brazil, points out. While
72% agree with the statement, 18% disagree and 10% did not know how to give
their opinion on the subject. Of the 28 countries evaluated, in 18 the
percentage that bets on female leaders to bring peace and success to the
world is greater than or equal to 50%. (Ipsos Brazil) 23 September 2021 Three In Ten Consumers Shopping For
Consoles In Both Britain (30%) And The United States (32%) Say They Are
Willing To Wait For Their First Choice To Become Available The PlayStation 5 and the Xbox Series X
have both been hard to come by. However in some markets, it has been
easier to get the less expensive (but less capable) Xbox series S, which may
give Microsoft’s entry-level offering a competitive advantage. The
latest consoles from Xbox and PlayStation have been elusive to consumers.
Substantial changes to worldwide demand for products during the pandemic
caused a semiconductor shortage. This shortage has been met with increased
demand for the new console offerings. (YouGov UK) September 25, 2021 In Six Of 13 Countries, Online Lottery Is
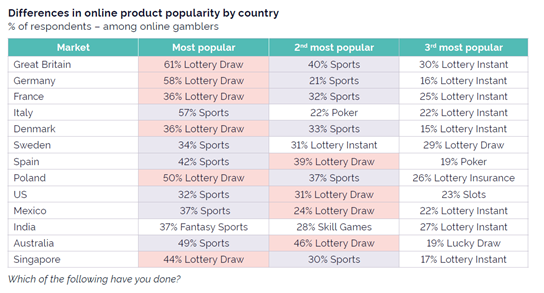
The Most Popular Online Product Sports betting in Great Britain remains the
second most popular form of online betting among online gamblers (40%),
behind lottery draws (61%). These new insights are part of a fresh
YouGov whitepaper that delves deep into attitudes and habits around online
gambling in several global markets, including Great Britain and
beyond. The global popularity of lottery products – prize draws or
instant tickets – and sports betting is clear. In six of 13 countries, online
lottery is the most popular online product, and a further four have it as the
second most popular product. (YouGov UK) September 25, 2021 ASIA
709-43-01/Polls Urban
Indians Look Forward To A Golden Diwali, With Nearly Three In Ten Planning To
Spend On Gold
With the festive season around the corner,
YouGov’s Diwali Spending Index, an indicator of spending propensity, reveals
a recovering appetite to spend during festive season among urban Indians. At 90.71, the spending intent is higher
than last year (80.96), however, it is yet to match the pre-pandemic times. When asked about where they are planning to
spend in the next three months, nearly two in five urban Indians claimed they
are likely to spend on smart home appliances (37%). Following this, roughly a
third said they would be spending on travel (35%) or health and fitness
gadgets (32%). Almost three in ten urban Indians (28%) are
planning to spend on gold in the next 3 months. Millennials were most likely
to say this as compared to the rest of the generations, at 36%. Furthermore, seven in ten (69%) of these
prospective gold buyers agreed with the statement, "Diwali and the festive season is the best
time to buy gold", highlighting their inclination to spend
during the festive season. Our data suggests out of those looking to
spend on gold in the near future, nearly three in five respondents (58%) are
planning to buy gold for personal/family use either in physical gold form or
through a gold scheme (like Tanishq Gold Harvest Plan). The remaining (38%) are likely to spend on
the yellow metal for the purpose of investment either through gold funds or
in physical gold form. Among the generations, the GenX are
somewhat more likely than GenZ and millennials to buy gold for personal use
(61% GenX vs 56% millennials and 54% GenZ) while the younger adults are more
likely than their predecessors (41% millennials and GenZ vs 34% GenX) to
invest in gold this festive season. When we look at this across regions, we see
that respondents in South India are more likely to buy gold for personal use
while North Indians are keener to invest in gold this festive season. Those buying gold for personal use are most
likely to buy it from branded jewellery stores (56%), followed by local
jewellers (36%). For investors, buying gold from branded jewellery stores is
the most likely option (23%), but it is closely followed by investments
through online trading apps or through banks (21% each). Hallmark or certificate is the most important
consideration factor when deciding where to buy gold from (61%), followed by
the cost per gram (45%) and a proper bill for the purchase (36%).
Flexi-payment schemes (22%), relationship with the brand or retailer (20%)
and recommendations from friends are family (17%) are far less important to
consumers. Hallmark/ certification and offers or
discounts are notably more important in East India (at 71% and 50%
respectively) while making charges appeal more to South Indians (at 46%) than
the rest of the population. Similarly, recommendations from friends and
family are notably more important to men than women (24% vs 10%) when
deciding where to buy gold from. When asked which brands do they trust the
most for buying gold, a majority (57%) named Tanishq as their most trusted
brand. Kalyan Jewellers (51%), Malabar Gold & Diamonds (37%) and PC
Jewellers (30%) are other brands that are trusted by people when it comes to
buying gold. Interestingly, all these brands appeal more
strongly to the millennials than the rest of the generations. (YouGov India) September 22, 2021 Source: https://in.yougov.com/en-hi/news/2021/09/22/urban-indians-look-forward-golden-diwali-nearly-th/ 709-43-02/Polls Hindus Made
Up 79.8% Of India’s 1.2 Billion (120 Crore) Total Inhabitants In The Most
Recent Census
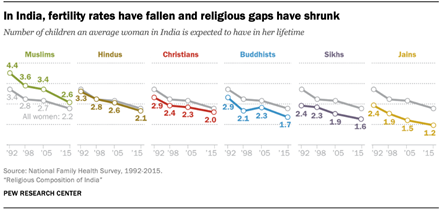
India’s fertility rate has been declining
rapidly in recent decades. Today, the average Indian woman is expected to
have 2.2 children in her lifetime, a fertility rate that is higher than rates
in many economically advanced countries like the United States (1.6) but much lower than India’s in
1992 (3.4) or 1950 (5.9).1 Every religious group in the country has
seen its fertility fall, including the majority Hindu population and Muslim,
Christian, Sikh, Buddhist and Jain minority groups. Among Indian Muslims, for
example, the total fertility rate has declined dramatically, from 4.4
children per woman in 1992 to 2.6 children in 2015, the most recent year for
which religion data is available from India’s National
Family Health Survey.
Muslims still have the highest fertility
rate among India’s major religious groups, followed by Hindus at 2.1. Jains
have the lowest fertility rate (1.2). The general pattern is largely the same
as it was in 1992, when Muslims had the highest fertility rate at 4.4,
followed by Hindus at 3.3. But the
gaps in childbearing between India’s religious groups are generally much
smaller than they used to be. For example, while Muslim women
were expected to have an average of 1.1 more children than Hindu women in
1992, the gap had shrunk to 0.5 by 2015. What do these trends mean for India’s
religious composition? India’s Muslim population has grown somewhat faster
than other religious groups because of fertility differences. But due in part
to declining and converging fertility patterns, there have been only modest changes in the overall
religious makeup of the population since 1951, when India
conducted its first census as an independent nation.
Hindus made up 79.8% of India’s 1.2 billion
(120 crore) total inhabitants in the most recent census, conducted in 2011.
That is 0.7 percentage points less than in the previous census in 2001, and
4.3 points below the 84.1% recorded in 1951. Meanwhile, the share of Muslims
grew from 13.4% in 2001 to 14.2% in 2011 – up by a total of 4.4 percentage
points since 1951, when the census found that Muslims comprised 9.8% of
India’s population. Christians, Sikhs, Buddhists and Jains, who together make
up nearly all of the remaining 6% of the population, were relatively stable
in their shares since the 1951 census.2 Over the decades, population growth rates
have slowed considerably – overall and among Muslims in particular. Before
its steep fertility declines, India was on a trajectory that would have
resulted in a much larger total population, as well as a greater change in
the distribution of religious populations. (See discussion of growth rates
in Chapter 1.) While changes at the national level have
been modest, they have not been distributed evenly across India. Some states
and union territories have experienced faster population growth or larger
changes in religious composition than other states or the country as a whole.
For example, the share of Hindus fell by nearly 6% in Arunachal Pradesh but
rose by about 2% in Punjab between 2001 and 2011. (See Chapter 3 for more information on the religious
demography of India’s states and territories.) India uses a number system that differs
from the international number system. This report presents numbers in the
international system and, in parentheses, the Indian system. The Indian
number system uses units such as lakhs and crores and places commas at
different intervals than the international system. Some examples of
equivalents: International number system vs. Indian
number system One hundred thousand (100,000) = 1 lakh
(1,00,000) These are among the key findings of a Pew
Research Center demographic analysis of data from India’s census and other
sources, designed to complement a major new public opinion survey, “Religion in India: Tolerance and
Segregation,”
published in June 2021. This analysis looks primarily at trends since India’s
independence, which was accompanied by major changes in the country’s
religious demographics. The Partition of 1947, at the end of Britain’s long
colonial rule, divided the Indian subcontinent along religious lines, causing
millions (tens of lakhs) of Muslims to move to the new nation of Pakistan.
Meanwhile, millions (tens of lakhs) of Hindus and members of other religious
groups migrated to the new India (see sidebar below). Migration is one of three main mechanisms,
along with fertility and conversion, that cause religious groups to shrink or
expand. But since the 1950s, migration has had only a modest impact on
India’s religious composition. More than 99% of people who live in India were
also born in India. Migrants leaving India outnumber immigrants three-to-one,
and religious minorities are more likely than
Hindus to leave.
Religious switching, or conversion – when an individual leaves one religion
for another or stops affiliating with any religion – also appears to have had
a relatively small impact on India’s overall composition, with 98% of Indian
adults still identifying with the religion in which they were raised. As a result, statistical analysis of census
and survey data shows that fertility
has been by far the biggest driver of the modest amount of religious change
in the decades since Partition (see Chapter 2 for details).3 Religion is only one of many factors tied
to fertility rates. While this report describes differences in the fertility
patterns of major religious groups in India, it cannot measure the full
impact of historical and cultural factors on these patterns, nor can it
quantify the direct role that religion plays when it comes to fertility and
family size. In India and elsewhere, education is a
primary factor in how many children women tend to have. Other prosperity
indicators – such as life expectancy and average levels of wealth – also
frequently correlate with fertility measures: Women who have better access to
schooling, jobs and health care tend to have fewer children. Population growth is driven not only by how
many children women have, but also by the concentration of women of
childbearing age. Younger populations have more women entering their prime
childbearing years and, as a result, tend to grow faster than older
populations. In addition, where people live within
India, as well as their history and cultural norms (which are harder to
measure), play a role in the choices they make about family matters. In short, people’s religion alone does not determine
how many children they will have. Religion is just part of a
complicated picture. (PEW) SEPTEMBER 21, 2021 Source: https://www.pewforum.org/2021/09/21/religious-composition-of-india/ 709-43-03/Polls 72% Of Afghans
Reported Lacking Money For Food In 2019, An All-Time High
WASHINGTON, D.C. -- Donor countries pledged
more than $1.2 billion last week to ward off an impending humanitarian crisis
in Afghanistan, as U.N. Secretary-General Antonio Guterres warned of
"the collapse of an entire country." There are concerns that rising
hunger and severe drought may compound an already perilous situation in
Afghanistan as the Taliban assert control over the national government for
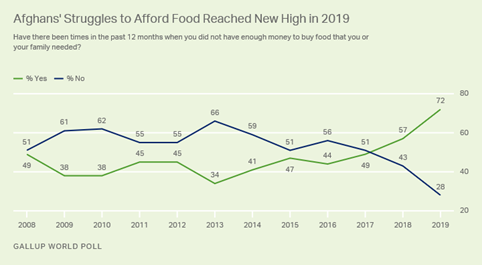
the first time since 2001. Gallup World Poll data in recent years have
painted an increasingly difficult economic situation throughout the country
as Afghans have struggled to afford even the basics. In November/December
2019, just before the February 2020 signing of the U.S.-Taliban peace deal,
more than seven in 10 Afghans (72%) reported that there had been times in the
past 12 months when their household lacked enough money for food. This marked
a 15-percentage-point increase from 2018 and a new high since Gallup first
began measuring this item annually in Afghanistan in 2008.
Line chart. Trend line showing the
percentage of Afghans who struggled to afford food. A record 72% in 2019
could not afford food at times for themselves or their families. After Kabul fell to the Taliban in August,
U.N. agencies have warned of disruptions in the distribution of emergency
aid, even calling for a "humanitarian airbridge" to be put in place
to ensure medicines and hospital supplies are delivered. But while the
collapse of the former Afghan government has exacerbated the country's
humanitarian crisis in recent weeks, the Food and Agriculture Organization of
the United Nations (FAO) has been sounding alarm bells for months, warning of
a potential 25% reduction in wheat yields in 2021, a crop that provides half
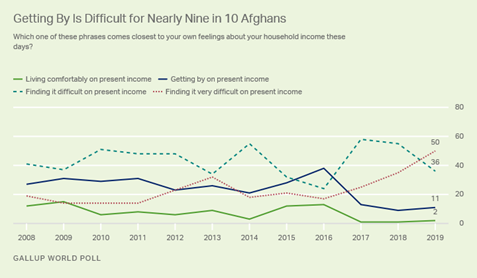
of all caloric intake in the country. Reflecting Afghans' increased inability to
afford food even before the Taliban's takeover, a record-high percentage of
Afghans in 2018 (90%) reported that they were finding it either
"difficult" or "very difficult" to get by on their
household income, a figure that remained at 86% in 2019. In 2019, however, a
record-high 50% of Afghans were in the "very difficult" category. More economic pain may be in store for
Afghanistan as a cash-strapped Taliban government asserts control of the
country. At least $10 billion of central bank funds remain outside the reach
of the country's new authorities, money badly needed to help pay salaries and
keep government ministries and programs running. Disruption within the financial
system has already reached ordinary Afghans as well, as local banks remain
closed -- creating a cash shortage for residents and businesses and a
resulting decrease in economic activity at a time of already heightened
economic uncertainty.
Line graph. Trend line showing how well
Afghans perceive they are getting by on their current household incomes. A
record 50% of Afghans found it very difficult to get by on their household
incomes in 2019. Eighty-six percent found it difficult or very difficult to
do so. Bottom Line After 20 years of insurgency, Afghanistan's
new Taliban government must now turn its attention to governing. Already
among the world's poorest countries, Afghans' economic outlook had taken a
turn for the worse in recent years, a situation now further compounded by
regional drought, isolation from the world financial system and political
uncertainty. Both Afghans and the world wait to see if
the Taliban's assurances of moderation on many issues will come to pass or if
the new regime will behave similarly to its last time in power from 1996 to
2001. Humanitarian pledges from the international community show a continued
commitment to the people of Afghanistan and a willingness to engage, even if
not recognize, Afghanistan's new rulers. Recent developments in Afghanistan have
increased the vulnerability of many Afghans who had already struggled for the
basics of survival. The likelihood of a reduced wheat harvest this year in
the face of severe drought threatens to push the country toward famine just
as the Taliban takes the helm of the country's ministries. The Taliban's
willingness to work alongside international aid agencies to address the
impending food crisis poses an early test of the new government's ability to
meet the needs of its population and gain a degree of acceptance among
nations. While the Taliban has proven its staying power as an insurgent
force, it may yet find that it was easier fighting people than feeding them. (Gallup) SEPTEMBER 23, 2021 Source: https://news.gallup.com/poll/354917/afghans-crisis-withdrawal.aspx WEST
EUROPE
709-43-04/Polls 86% Britons Support The Idea That Government Should Provide More
Information To The General Public About Levelling Up
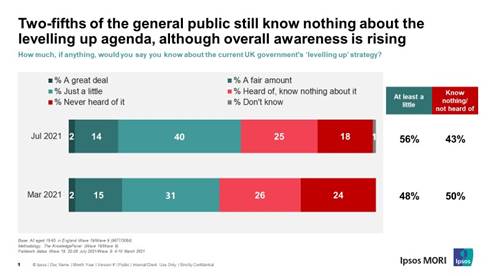
Ipsos MORI’s KnowledgePanel has found that between March and July
2021, Britons’ awareness of the Government’s Levelling Up strategy increased.
Those knowing at least a little about it rose by 8 points from 48% to
56%, with an equivalent fall in those who know or heard nothing about it
These increases were seen across all regions except the West Midlands,
particularly the North East .
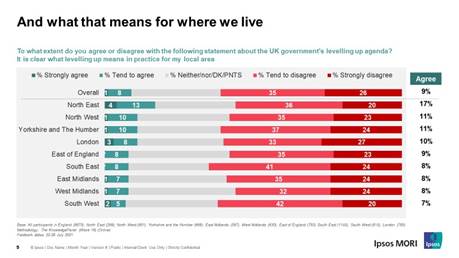
The increase in awareness, however, is among those who know just a
little rather than having a deeper understanding, and so this is still
complemented by a strong view that it should be a Government priority to
provide more information to the general public about levelling up, with 86%
supporting that idea, while only 9% of Britons believe it is clear what
levelling up means in practice for their local area. The region with the best
sense of understanding of what levelling up means for their area is the North
East, although still only 17%.
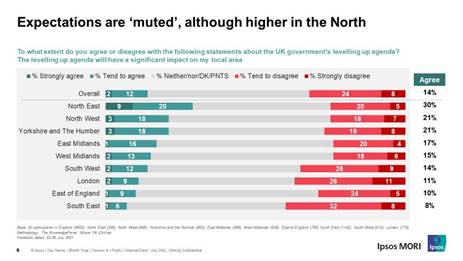
Britons in the North East are also most likely to expect the
levelling up agenda to have the biggest impact on their local area (30%),
with those in the South East most pessimistic (40% do not think it will have
much effect). Overall, expectations are muted: one in seven (14%) think
levelling-up will bring significant impacts, but twice as many (32%) disagree
– with even more (38%) sitting on the fence and still to be persuaded one way
or the other.
Kelly Beaver, Managing Director of Public
Affairs commented: It is clear that as Michael Gove comes into
a new expanded role looking at levelling up there is still work to do to help
the public feel informed about what it means both in general and for their
local area in practice. While awareness is increasing (including some signs
that the North East is particularly positive), there is still a way to go
before levelling up is fully understood by the public and, just as
importantly, that they are convinced it will deliver improvements for them. (Ipsos MORI) 21 September 2021 709-43-05/Polls More Than Half (52%) Of The UK Public Know Someone Who Has Been
Diagnosed With Dementia
Findings from the second wave of one of the most comprehensive
surveys of UK-wide public perceptions of dementia and research have been
revealed by Alzheimer’s Research UK, the UK’s leading dementia
research charity. Wave 2 of the Dementia Attitudes Monitor gives detailed
insight into the UK’s understanding of, and attitudes towards dementia,
building on findings from Wave 1 in 2018. More than half of us have been affected by
dementia Wave 2 of the Monitor has revealed that more than half (52%) of the
UK public know someone who has been diagnosed with the condition - a figure
that remains unchanged since Wave 1. This is most often a grandparent (17%)
or parent (13%). Wave 2 suggests a positive shift in understanding of the diseases
that cause the condition, though fear persists. The majority of people (68%) correctly disagree with the statement
‘dementia is an inevitable part of getting older’ - up from 60% in Wave 1.
The proportion who are unsure whether dementia is inevitable has fallen from
17% to 11%. In 2018, half (51%) of the public agreed with the statement ‘Dementia
is a cause of death’, despite it being the UK’s leading cause of death,
excluding COVID-19, since 2015. Three years on, 62% recognised the terminal
nature of the condition. Half (49%) of UK adults say that dementia is the health condition
they fear most about getting in the future, indicating an increase in concern
since Wave 1 of the Monitor (42%). Women (55% compared to 42% of men) and
older adults (60% of those aged 65 or over) are more likely to agree that
dementia is the health condition they fear most, reflecting findings from
2018. Awareness of risk and risk factors for
dementia remains low The latest evidence suggests that up to 40% of all cases of dementia
are linked to factors we may be able to influence ourselves, yet just a third
(33%) of UK adults think it’s possible for people to reduce their risk. Women
are less likely to think it’s possible to influence their dementia risk than
men (30% compared to 37%). When asked to consider what could increase a person’s risk, the most
common responses included ‘being less mentally active’ (mentioned by 22%) and
‘genetic factors’ (19%). Very few people named physical risk factors like
blood pressure and diabetes, despite evidence suggesting these are among the
factors most closely linked to dementia risk. Despite limited understanding of the ability to reduce dementia risk,
three quarters (75%) of people believe it’s possible for a person to
influence their brain health, suggesting that positively reframing dementia
risk reduction as ‘protecting brain health’ represents a major opportunity to
increase public engagement. The majority of people want to better understand their personal risk
and are open to using new technology to do so. Three quarters (74%) of UK adults say they would want to be told
about their personal risk of developing dementia later in life if their
doctor could provide this information (73% in Wave 1). There is widespread support for new techniques that could, in future,
be used to help measure dementia risk, with 75% of people willing to use
smartphone apps and wearable technology to do so. The Monitor shows that
reluctance to use technology in this way increases uniformly from the
youngest to oldest age groups. There is strong support for formal
diagnosis and early testing for dementia, even before symptoms show The vast majority of people (89%) would be likely to seek a formal
diagnosis if they were concerned they might be in the early stages of
Alzheimer’s disease or another form of dementia. The most common motivators
are to gain access to treatments that could help and to enable the person to
plan for the future (each mentioned by 32% of people who would seek a
diagnosis). Of the 9% who would be unlikely to seek a formal diagnosis, the main
reason given was that doing so would be too stressful. There is similarly strong support for very early detection and
diagnosis, with most people (87%) saying they would take a test, or set of
tests, that could tell whether they were in the very early stages of
Alzheimer’s or another form of dementia, even before any symptoms appeared
(85% in 2018). Finding a cure remains the UK’s top
research priority The Monitor once again identified strongest support for research into
ways to cure the diseases that cause dementia, cited as the most important
type of research by 28% of participants. Next, research into ways to prevent
dementia was chosen as most important by 22% of people. Positively, the majority (61%) of UK adults believe that one day the
diseases that cause dementia will be cured. 18% express uncertainty and just
16% disagree. Willingness to get involved in medical
research for dementia is at an all-time high Wave 2 of the Monitor found that the 69% of UK adults would now
consider getting involved in medical research for dementia - a marked
increase since Wave 1 (50%). Research being ‘the only answer to dementia’ is the main driver for
participation, mentioned by 46% of those expressing an interest in taking
part. As seen in Wave 1, uncertainty about what would be involved is the most
common reason for reluctance, mentioned by 23% of those who would not take
part. Nick Philp, Director in Ipsos Observer,
said: This second wave of the Dementia Attitudes
Monitor is tracking changing perceptions about dementia and research. We hope
it will shine a light on the opportunities to direct efforts towards a world
free from the fear, harm and heartbreak of dementia. (Ipsos MORI) 22 September 2021 Source: https://www.ipsos.com/ipsos-mori/en-uk/more-half-us-have-been-affected-dementia 709-43-06/Polls Manchester United Is The Best-Supported Premier League Club In The UK,
But There’s Close Competition
With the 2021-22 edition of the Premier League still in its early
stages, not much can be read into the table yet. So, we dive into our data to
put together a different kind of points table, looking at the best-supported
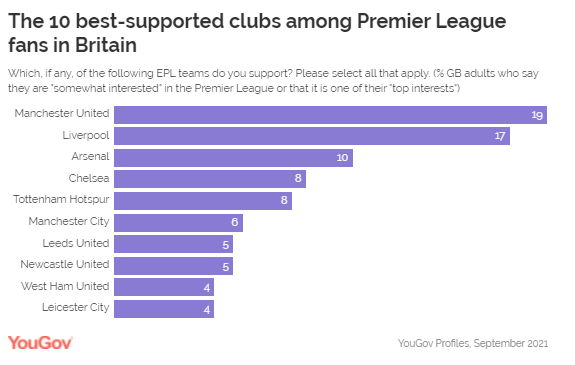
clubs in the UK. Starting off, Manchester United claim the top spot with Liverpool hot
on their heels. Almost a fifth of Premier League fans in Britain support the
Red Devils (19%), while Jurgen Klopp’s team enjoys support from 17%. Premier League fans in this piece are defined as those who are
“somewhat interested” in the Premier League or regard it as one of their “top
interests”. While the contest is close at the top of the table, there is a
significant gap between them and the rest. Arsenal come in at No.3 in the
support stakes,with one in ten followers of the Premier League saying they
support the Gunners (10%). Chelsea and Tottenham Hotspur are next in line
with 8% of Premier League followers saying they support those clubs. A good indication that a following for Premier League clubs is built
organically, and that on-field success takes a while to embed new supporters,
is the position of Manchester City in the table. Pep Guardiola’s team has
bagged the title three times in the last four seasons but enjoys the support
of just 6% of Premier League followers, one-third that of their intra-city
rivals Manchester United. Meanwhile, Leeds United and Newcastle United have the support of one
in 20 Premier League fans each (5%), while West Ham and Leicester City are
supported by 4%. (YouGov UK) September 24, 2021 709-43-07/Polls One In Eleven Say The Coronavirus Act Should Be Made Permanent
The government is expected to reveal next
week which parts of the Coronavirus Act will be repealed and which
will be kept. The Act is a piece of legislation that initially granted the
government emergency powers to deal with the pandemic. It includes the
ability to restrict public gatherings, order businesses to close and detain
people suspected of COVID-19 infection. Under current plans, the Act will
expire in March 2022. New YouGov research shows that nearly three in ten people think the
act should be extended, however. This includes 20% of people who think the
Act should be extended temporarily and 9% who think it should be permanently
enshrined in law.
The most commonly held view is that the Act should be kept for the
coming autumn and winter, and be allowed to expire as planned next March. One
in three Britons (31%) feel this way. Conservative voters are more likely to think the Coronavirus Act
should be extended or made permanent (35%) than Labour voters (26%). However,
Labour voters are not necessarily more in favour of repealing the Act early,
with a higher proportion unsure (18%) than Tories (8%). Britons aged between 18 and 24 are more likely to be in favour of
repealing the Act early (29%) than other age groups. This includes 11% who
think it should be repealed immediately and 18% who think it should be
scrapped before March 2022 but not immediately. Some 19% of Britons aged 65
and over are in favour of repealing the Act earlier than its intended date,
while 40% think it should be maintained beyond that – including 11% who think
it should be permanent law. (YouGov UK) September 24, 2021 709-43-08/Polls Over A Third Say The Quality Of Social Care Is Likely To Improve As A
Result Of The Plan To Raise National Insurance To Help Fund Health And Social
Care
Last week, the UK Government announced a plan to raise National
Insurance to help fund health and social care. Now, new research by Ipsos
MORI shows many Britons are split in their support for the policy, the impact
it will have on the NHS and social care, and how fairly it treats different
groups. Just over a third say the quality of social care is likely to
improve as a result of this policy (35%) while 37% are hopeful for
improvement in the NHS. However half are more sceptical, thinking it is
unlikely that the NHS or the quality of social care will improve (48% and 49%
respectively).
There is though a feeling that even this funding boost will not be
enough. Three-quarters say it is likely that the NHS and social care
services will need even more funding than this policy provides over the next
few years (76% and 74% respectively). Similarly, a plurality of Britons
believe the money promised over the next 3 years is too little for both the
NHS (42%) and social care services (42%). Around a quarter 10 say it is
about the right amount (28% and 26%) while just over 1 in 10 think it too
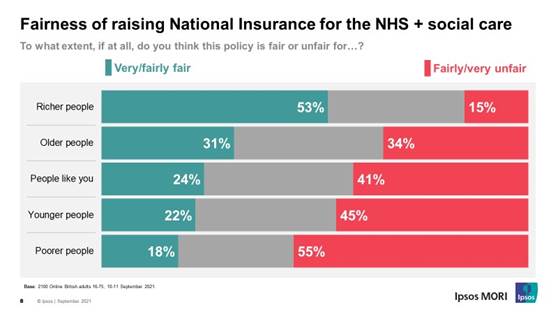
much (12% and 13%). Most Britons to view this policy as unfair for poorer people (55% - a
view held among those on high, medium and low incomes), while a similar
proportion (53%) say it is fair for richer people. People also believe
it is unfair to younger people by a margin of 2:1 (45% vs 22% - again, a view
shared amongst all age groups), while they are split on whether it is fair
for older people (31% fair vs 34% unfair). Only a quarter (24%) think it is
fair for “people like me” while 41% think it is unfair (although this falls
to 32% among 55-75 year olds).
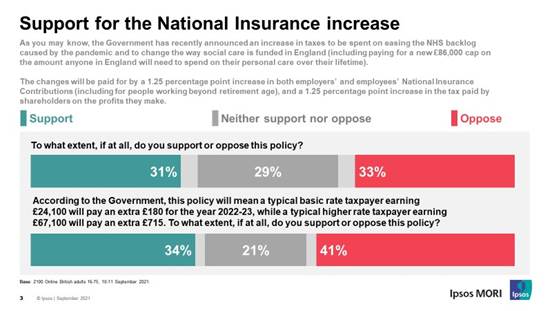
Support for the policy overall splits opinion - a third (31%) support
it, and the same proportion are against it (33%). When prompted with the
extra tax that would be paid for it, a third (34%) still support it, but 41%
oppose. Support is higher among older people and Conservative voters than
younger people and Labour voters. However, a majority of Britons knew little,
if anything, about the policy. Fifty-five per cent say they didn’t know very
much, had heard of the policy but knew nothing of it or knew nothing at all
before taking part in the survey.
Almost 6 in 10 (58%) expect the policy to make the Conservatives less
popular while only 12% expect their popularity to increase. Britons expect
the policy and Labour’s reaction to it to have less impact on Labour’s
reputation: 32% say it will make no difference while 26% expect it to harm
their popularity and 19% expect an improvement. Gideon Skinner, Head of Political Research
at Ipsos MORI, said: The public is split in its reaction to the
Government’s new levy or health and social care. Political partisanship
is playing a role, but there are other factors at play – on the one hand a
feeling that even more money may be needed to tackle the challenges faced by
the NHS and social care, to tackle staff shortages, improve the quality of
care and increase access, and on the other concerns about fairness towards
the young and poorer people (concerns that are shared by older people and
those on high incomes). And the reality of the extra tax that will need
to be paid is also having an effect. (Ipsos MORI) 26 September 2021 709-43-09/Polls 54% Of French People Believe That The School System Works Poorly
At first glance, the school system is primarily associated with the
acquisition of skills (55% of French people associate this notion with
it). However, it is also linked to negative notions such as obligation /
constraint and the forbidding aspect (respectively 42% and 39%). Despite a busy context, new generation
education must have a real place in the 2022 presidential campaign For 85% of French people, the debate on new generation education must
have an important or even essential place in the presidential campaign of
2022. Among them, 41% think that it is essential. At the same time, only
6% consider that this debate is irrelevant. These figures are striking
in several respects on the one hand, despite many strong concerns (Covid-19,
environment), education remains a major expectation there is no question of
putting it aside. Moreover, the French are convinced of their
opinion. It is not a question of a little marked wish but of a real will
on their part. Finally, the key to success lies
particularly in the involvement of students. More than three quarters of French people believe that the
modernization of school education in France must go through the
generalization of particularly "engaging" practices such as the
creation of a digital school space for each class (86% are in favor), the
fact ask students to be trainers themselves for a few sessions (81%) or to
impose interactivity in all lessons (77%). While digital technology is necessary (73% also consider that the
creation of digital diplomas and certifications is useful for this type of
knowledge to be recognized), it appears to the French more as a complementary
tool and not an end. in itself. Thus, although it is important or even
essential to train teachers in digital tools so that the divide in this area
is reduced (89%) or to educate students in digital technology to combine the
best of man and digital ( 79%), only a minority of French people are in favor
of replacing books with digital content (49%) or writing exclusively on
computers (18%). In short, digital must include more than exclude. The Covid 19 health crisis, a vector of
inequalities ... but also of opportunities! For nearly 8 in 10 French people, Covid-19 has had many negative
effects, including dropping out of school (87%), increasing inequalities
between pupils / students (83%) and not being ready to entering working life
for young graduates (79%). However, it is interesting to note two things
first, the youngest (although more concerned by these problems) are critical
but less than their elders. Secondly, the Covid-19 crisis has also enabled
many advances and in particular new ways of working. (Ipsos France) 22 September 2021 Source: https://www.ipsos.com/fr-fr/54-des-francais-estiment-que-le-systeme-scolaire-fonctionne-mal NORTH
AMERICA
709-43-10/Polls In U S, An Estimated 18 Million Can't Pay For Needed Drugs
WASHINGTON, D.C. -- Seven percent of U.S. adults -- representing an
estimated 18 million persons -- reported in June that they were unable to pay
for at least one doctor-prescribed medication for their household during the
prior three months, according to the most recent West
Health and Gallup survey. This percentage is in line with the 6%
reported in March. Among those in households earning less than $24,000 per
year, however, the percentage has jumped from 10% to 19%, a statistically
significant increase. U.S. Three-Month Medication Insecurity, Trended, by Household Income Has there been a time in the last three months when you or a member
of your household has been unable to pay for medicine or drugs that a doctor
had prescribed to you because you did not have enough money to pay for them?
(% Yes)
While affordability of prescription drugs is an issue for all age
groups, the inability to pay for a prescription runs twice as high for
households with an adult younger than 65, compared with households that have
at least one senior (8% to 4%, respectively). This is despite the fact that
prescription drug usage climbs significantly with age. Among seniors, for
example, 40% report currently having at least five prescription drugs,
compared with 23% among those aged 50-64 and less than 10% among those younger
than 50. These surveys were conducted by web from June 14-20, March 15-21 and
Jan. 25-31, 2021, with adults aged 18 and older, living in all 50 U.S. states
and the District of Columbia via the Gallup
Panel, a probability-based, non-opt-in panel of about 120,000 adults
nationwide. Medication Insecurity Climbs With Chronic
Conditions and Prescriptions Being unable to afford medication over the prior three months climbs
with medical need. Among respondents with three or more chronic conditions,
or eight or more prescriptions, reports of being unable to pay for a
prescribed drug in the household reach 11% and 18%, respectively. Among
respondents with no chronic conditions and no more than two prescribed drugs,
these household rates drop to 4% and 5%, respectively. U.S. Three-Month Medication Insecurity by Number of Prescription
Drugs and Number of Chronic Conditions Has there been a time in the last three months when you or a member
of your household has been unable to pay for medicine or drugs that a doctor
had prescribed to you because you did not have enough money to pay for them?
(% Yes)
Respondents with certain chronic conditions are significantly more
likely to suffer medication insecurity than are adults generally. These
include those who have been diagnosed with diabetes (12%), chronic
obstructive pulmonary disease or COPD (12%), depression (12%), and those who
are immune compromised (15%). One in 10 Skip Pills to Save Medicine,
Money While 7% of Americans report that they have or a family member has
gone without at least one prescribed medication because of costs, 10% report
skipping dosages in the prior 12 months as a way of saving medicine and,
therefore, money. This rate is considerably higher among lower-income
households. Among respondents in households earning less than $48,000
annually, for example, 18% report that they or someone in their household had
skipped a pill. Even among higher-income households earning $90,000-$180,000,
7% of respondents report having skipped a pill in the prior 12 months. Adults younger than 65 are also about twice as likely as seniors to
report skipped doses in their households as a way to preserve medicine and
save money, a pattern similar to what this research found with the inability
to pay for prescriptions in the prior three months. Skipping Prescribed Medication to Save Money, by Annual Household
Income and Age Thinking about the last 12 months, have you or a family member
skipped a pill to save medication in order to save money? (% Yes)
Implications The latest results from the West Health-Gallup research into U.S.
healthcare add to a growing body of data indicating how Americans cope with
the high cost of care. Chief among the prior insights are that an estimated
18% of adults, or about 46 million people, could
not afford needed care if they required it today and, separately,
that 16% of workers remain
in unwanted jobs so they can keep the health benefits the job
provides them. Beyond care itself, the second main aspect of healthcare costs in the
U.S. is the price consumers pay for prescription drugs. Before President Joe
Biden's inauguration, lowering drug costs was the
second-highest healthcare priority Americans had for him, after reducing
health insurance premiums. Two-thirds of U.S. adults said reducing drug costs
was a "high" or the "highest" priority, including 62% of
Republicans. The roughly 7% of Americans who have been unable to pay for
prescribed drugs in the prior three months and the 10% who are skipping doses
to save medication because of costs further expose this issue in stark terms.
These practical manifestations of how Americans manage their healthcare costs
underscore the urgency of the issue, particularly for those younger than 65,
nearly all of whom do not yet qualify for Medicare. The disproportionate manner in which prescription drug prices are
affecting sicker and lower-income Americans is also apparent. This reveals an
unfortunate scenario whereby those who are most in need of prescription drugs
are also the most likely to ration their use if they are able to afford them
at all. Substantial majorities of U.S. adults, in turn, support government
involvement in a number of aspects of cost control, including setting
limits on drug price increases and allowing government negotiation of prices
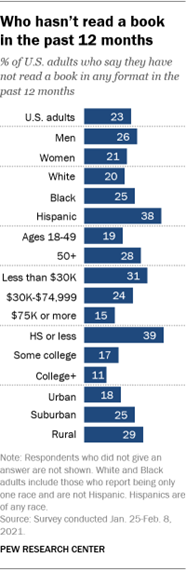
for high-cost drugs for which there are no competitors. (Gallup) SEPTEMBER 21, 2021 Source: https://news.gallup.com/poll/354833/estimated-million-pay-needed-drugs.aspx 709-43-11/Polls Roughly A Quarter Of American Adults (23%) Say They Haven’t Read A
Book In Whole Or In Part In The Past Year
Roughly a quarter of American adults (23%) say they haven’t read a
book in whole or in part in the past year, whether in print, electronic or
audio form, according to a Pew Research Center survey of U.S. adults
conducted Jan. 25-Feb. 8, 2021. Who are these non-book readers? Several demographic traits are linked with not reading books,
according to the survey. For instance, adults with a high school diploma or
less are far more likely than those with a bachelor’s or advanced degree to
report not reading books in any format in the past year (39% vs. 11%). Adults
with lower levels of educational attainment are also among the least likely to own
smartphones, an increasingly
common way for adults to read e-books. How we did this
In addition, adults whose annual household income is less than
$30,000 are more likely than those living in households earning $75,000 or
more a year to be non-book readers (31% vs. 15%). Hispanic adults (38%) are
more likely than Black (25%) or White adults (20%) to report not having read
a book in the past 12 months. (The survey included Asian Americans but did
not have sufficient sample size to do statistical analysis of this group.) Although the differences are less pronounced, non-book readers also
vary by age and community type. Americans ages 50 and older, for example, are
more likely than their younger counterparts to be non-book readers. There is
not a statistically significant difference by gender. The share of Americans who report not reading any books in the past
12 months has fluctuated over the years the Center has studied it. The 23% of
adults who currently say they have not read any books in the past year is
identical to the share who said this in 2014. The same demographic traits that characterize non-book readers also
often apply to those who have never been to a library. In a 2016
survey, the Center found that Hispanic adults, older adults, those living
in households earning less than $30,000 and those who have a high school diploma
or did not graduate from high school were among the most likely to report in
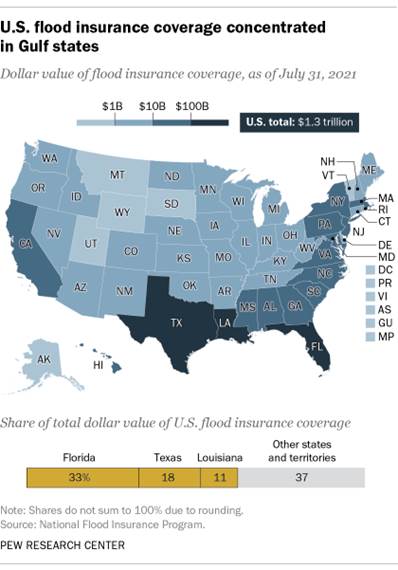
that survey they had never been to a public library. (PEW) SEPTEMBER 21, 2021 Source: https://www.pewresearch.org/fact-tank/2021/09/21/who-doesnt-read-books-in-america/ 709-43-12/Polls Half Of Americans Said Their Area Had Experienced Extreme Weather
Over The Past Year
According to a recent Washington
Post analysis, nearly a third of Americans live in a county that was
struck by a weather disaster this past summer, and around two-thirds live in
places that experienced a multiday heat wave. In an April
Pew Research Center survey, half of Americans said their area had
experienced extreme weather over the past year. Human-caused climate change will make extreme weather events more
frequent and more damaging in the coming decades, according to the latest
report from the United Nations Intergovernmental Panel on Climate
Change. While the nations of the world struggle to agree on how to address
the root causes of climate change, there are various ways people can prepare
to deal with the immediate effects on a household level. This analysis examines the prevalence of four specific tools to endure
extreme weather in the United States: flood insurance, air conditioning,
portable generators and home insulation. (As we’ll see, some of these tools
may have their own climate impacts.) Flood insurance Standard homeowner or renter insurance seldom, if ever, protects
against flood damage. While some private
companies sell their own flood insurance, the primary provider of
such coverage in the United States is the National Flood Insurance Program (NFIP),
managed by the Federal Emergency Management Agency.
Nearly 5 million NFIP policies were in force as of July 2021, the
most recent month available. That figure hasn’t varied much for the past few
years, though it’s down from a peak of 5.7
million policies at the end of 2009. Flood insurance is available in
over 22,000 communities throughout the country, but it’s particularly
important in states that border the Gulf of Mexico: 60% of all policies in
force, accounting for a somewhat higher share of covered property value, are
in Florida, Texas and Louisiana. More than a quarter of U.S. homeowners (27%) said in a 2020
survey by the Insurance Information Institute, or Triple-I, that
they had flood insurance – more than twice the share who said they had it in 2018
(13%). However, the Triple-I itself has expressed some doubt about whether
flood coverage is that high. Noting that the NFIP data implies a lower
coverage rate, the institute said, “It is possible that [people] with
homeowners insurance believe they have flood coverage when they actually do
not … homeowners may not fundamentally understand what flood coverage is and
how it works. Or they may think flood coverage encompasses water damage from
a burst pipe instead of a weather-related event like a hurricane or from a
river flooding.” Next month, NFIP will change the way it
sets its insurance rates to better reflect each individual property’s actual
flood risk. The current system, which has been in place since the 1970s,
relies mainly on a property’s elevation and location within a floodplain.
Critics have long argued that the program’s flood maps aren’t updated
frequently enough and understate
true flood risks, and that the guaranteed availability of flood insurance
can encourage flooded-out owners to rebuild
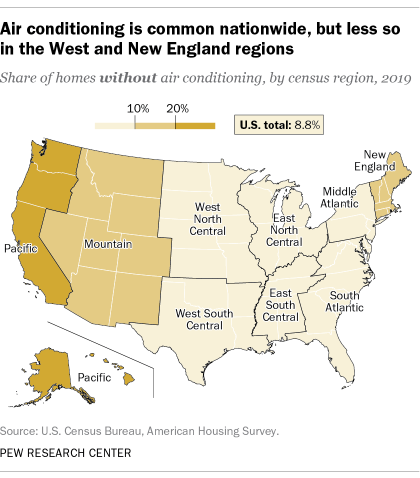
structures rather than move them to safer ground. Air conditioning
Air conditioning, either central or room-based, has become the
default in American homes – a boon during oppressive summer
heat waves. Nationwide, only 8.8% of housing units lacked some form of
air conditioning in 2019, according to the Census Bureau’s American Housing
Survey for that year. But that ubiquity obscures some important geographic
and demographic variations. In Northern California and the Pacific Northwest, for instance,
residents long were accustomed to cool, rainy winters and mild, low-humidity
summers. The consequence: 55.7% of housing units in Seattle have no air
conditioning of any sort, nor do 52.7% in San Francisco and 21.4% in
Portland, Oregon. But long stretches of days with temperatures of 100 degrees
and higher reportedly have sent at least some Northwesterners fleeing to home
improvement stores and HVAC contractors in search
of relief. Americans with higher incomes are moderately more likely to have
access to air conditioning, according to the Census Bureau data, though the
differences are smaller than you might expect: 92.2% of households with
incomes of $100,000 or more have some form of air conditioning, compared with
88.9% of households with incomes of less than $30,000. The type of AC, however, does vary more substantially by income.
Among below-$30,000 households with air conditioning, 70.1% have central air
and 29.9% have window units, which generally can only effectively cool a
single room. Among households earning $100,000 or more, the split is 85.6%
central, 14.2% window. Either way, air conditioning uses prodigious amounts of electricity,
and depending on how that electricity is generated, AC can exacerbate the
very problem it’s trying to alleviate. AC units can also emit waste
heat and greenhouse gases of their own into the atmosphere. As The
Guardian put it a few years back, “The warmer it gets, the more we
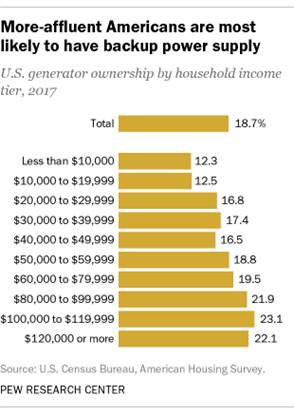
use air conditioning. The more we use air conditioning, the warmer it gets.” Generators Of course, air conditioners won’t work without electricity. Nor will
refrigerators, washers, computers or any number of other critical appliances
– not to mention lights. People who live in storm-prone areas, such as the
Gulf Coast or North Carolina’s Outer Banks, often have portable generators in
case the local electricity grid fails (as it did this year in New
Orleans after Hurricane Ida).
The American Housing Survey’s latest data on generator ownership is
from 2017. That year, only about 19% of U.S. households reported owning the
devices. (The question was only asked of people living in single-family homes
and small apartment buildings.) The income difference on generator ownership
was much more pronounced than with air conditioning: 22.4% of households
earning $100,000 or more reported having a generator, versus 14.1% of
households making less than $30,000. The regional differences are noteworthy too. Nearly a quarter (24.2%)
of New England housing units surveyed had a generator, versus just 14.2% in
the Mountain states. Among metro areas, Richmond, Virginia, and Miami-Fort
Lauderdale stood out, with 28.8% and 26.6%, respectively, of housing units
having generators. California’s Bay Area was a notable laggard, with just
6.3% of units in San Francisco and 7.5% in San Jose having generators. Most home generators, however, burn fossil fuels such as gasoline,
diesel or propane to generate electricity, which means they’re also
generating greenhouse gases that are major drivers of climate change. Clean
energy groups advocate for different
approaches: combining storage batteries with solar panels mounted on
homes, businesses and other structures, for instance, or installing
neighborhood-scale “microgrids” that
can operate on their own if the wider transmission grid goes down. Insulation Climate change doesn’t just mean warmer temperatures. As extreme
weather of all types, such as the wave of winter
storms and bone-chilling cold that nearly paralyzed much of Texas
last winter, becomes more common, millions can be left without heat, water
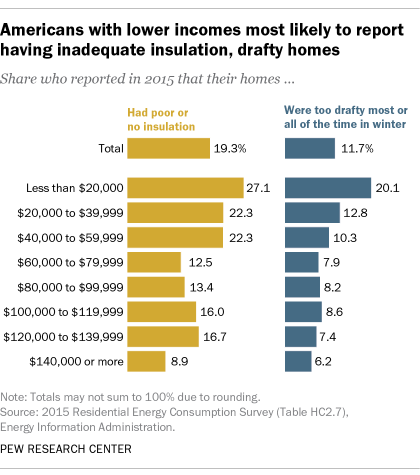
and power for days on end. That’s where insulation – a relatively low-tech solution that can
increase a home’s energy efficiency so that it stays warmer in the winter and
retains cool air-conditioned temperatures in the summer – can make a big
difference. Many homes in Texas, it turned out, had inadequate
or nonexistent insulation, which led to cracked pipes and frigid indoor
temperatures. The best data on home insulation comes from the 2015 Residential
Energy Consumption Survey (RECS), a project of the federal Energy
Information Administration. In addition to asking people how adequately they
thought their home was insulated, the RECS researchers asked how often their
home felt drafty in the winter (because previous surveys had found few people
knew details about the amount or quality of their home’s insulation).
Overall, 19.3% of households said they had poor or no insulation, a
slight improvement from the 21% who said that in the 2009 RECS. And 11.7%
said their homes were drafty most or all of the time in winter, down from
15.4% in 2009. A quarter (25.1%) of respondents in the Pacific region said they had
poor or no insulation, though only 12.3% said their homes were drafty most or
all of the time in the winter. Only 14.3% of householders in the Mountain
North subregion (Colorado, Idaho, Montana, Utah and Wyoming) characterized
their insulation as poor or nonexistent, and just 9.5% said their homes were
drafty most or all of the time. In the Mountain South states of Arizona, New
Mexico and Nevada, where 16.3% said their homes had poor or no insulation,
just 7% said their homes were that drafty. In general, the lower one’s household income, the worse one’s home
was insulated and the draftier it was. More than a quarter (27.1%) of people
whose household income was less than $20,000 said they had poor or no
insulation, and a fifth (20.1%) said their homes were drafty most or all of
the time in winter. For people with household incomes of $140,000 or more,
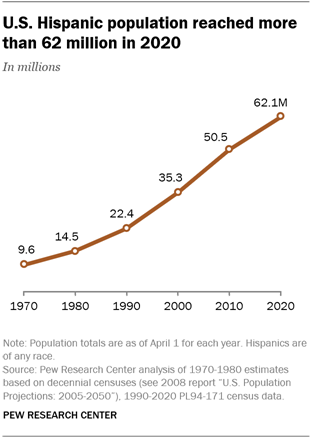
those figures were 8.9% and 6.2%, respectively. (PEW) SEPTEMBER 22, 2021 709-43-13/Polls US Hispanic Population Reached More Than 62 Million In 2020
Debates over who
is Hispanic and who is not have often fueled conversations about
identity among
Americans who trace their heritage to Latin America or Spain. Most
recently, the 2020 census has drawn attention to some of the many layers of
Hispanic identity, providing fresh details about how Hispanics view their
racial identity. So, who is considered
Hispanic in the United States? And how are they counted in public opinion
surveys, voter exit polls and government surveys such as the 2020 census? The most common approach to answering these questions is
straightforward: Who is Hispanic? Anyone who says they are. And nobody who
says they aren’t.
Pew Research Center uses this approach and the U.S. Census Bureau
largely does so too, as do most other research organizations that conduct
public opinion surveys. By this way of counting, the Census Bureau estimates
there were roughly 62.1
million Hispanics in the United States as of 2020, making up 19% of
the nation’s population. Behind the official Census Bureau number lies a long history of
changing labels, shifting
categories and revised question
wording on census
forms – all of which reflect evolving cultural norms about what it
means to be Hispanic or Latino in the U.S. today. Here’s a quick primer on the Census Bureau’s approach of using
self-identification to decide who is Hispanic. I immigrated to Phoenix from Mexico. Am I
Hispanic? You are if you say so. My parents moved to New York from Puerto
Rico. Am I Hispanic? You are if you say so. My grandparents were born in Spain but I
grew up in California. Am I Hispanic? You are if you say so. I was born in Maryland and married an
immigrant from El Salvador. Am I Hispanic? You are if you say so. One of my great grandparents came to the
U.S. from Argentina and settled in Texas. That’s where I grew up, but I don’t
consider myself Hispanic. Does the Census Bureau count me as Hispanic?
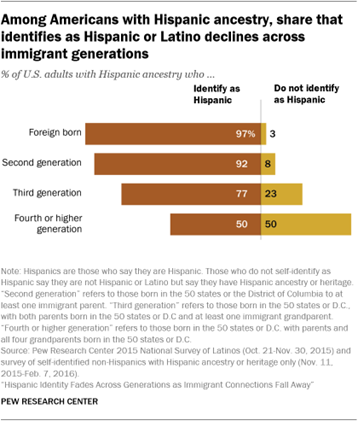
Not if you say you aren’t. Of the 42.7 million adults with Hispanic
ancestry living in the U.S. in 2015, an estimated 5
million people, or 11%, said they do not identify as Hispanic or Latino,
according to a Pew Research Center survey of U.S. adults. These people aren’t
counted as Hispanic in Pew Research Center surveys. The Census Bureau
generally takes a similar approach in its decennial census. Hispanic
self-identification varies across immigrant generations. Among the foreign
born from Latin America, nearly all self-identify as Hispanic. But by the
fourth generation, only half of people with Hispanic heritage in the U.S.
self-identify as Hispanic. But isn’t there an official definition of
what it means to be Hispanic or Latino? In 1976, the U.S. Congress passed what
was the only law in this country’s history that mandated
the collection and analysis of data for a specific ethnic group:
“Americans of Spanish origin or descent.” The language of that legislation
described this group as “Americans who identify themselves as being of
Spanish-speaking background and trace their origin or descent from Mexico,
Puerto Rico, Cuba, Central and South America, and other Spanish-speaking
countries.” This includes 20 Spanish-speaking nations from Latin America and
Spain itself, but not Portugal or Portuguese-speaking Brazil. Standards for
collecting data on Hispanics were developed by the Office of Management
and Budget in
1977 and revised in
1997. Using these standards, schools, public health facilities and other
government entities and agencies keep track of how many Hispanics they serve
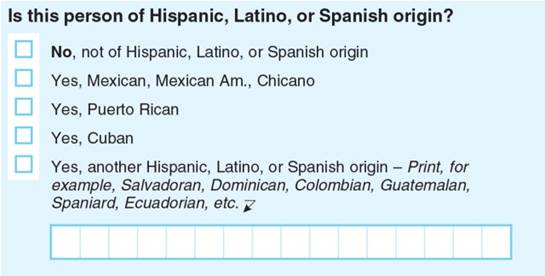
– the primary goal of the 1976 law. However, the Census Bureau does not apply this definition when
counting Hispanics. Rather, it relies entirely on self-reporting and lets
each person identify as Hispanic or not. The 2020 decennial census form asked
the question this way:
What’s the difference between Hispanic and
Latino? The terms “Hispanic” and “Latino” are pan-ethnic terms meant to
describe – and summarize – the population of people living in the U.S. of
that ethnic background. In practice, the Census Bureau most often uses the
term “Hispanic,” while Pew Research Center uses the terms “Hispanic” and
“Latino” interchangeably when describing this population. Some have drawn sharp distinctions between these
two terms, saying for example that Hispanics are people
from Spain or from Spanish-speaking countries in Latin America (this
excludes Brazil, where Portuguese is the official language), while Latinos
are people from Latin America regardless of language (this includes Brazil
but excludes Spain and Portugal). Despite this debate, the “Hispanic” and
“Latino” labels are not universally embraced by the population that has been
labeled, even as they are widely used.
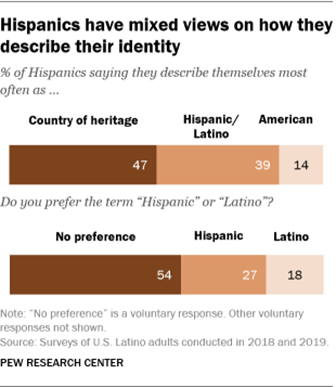
Instead, Pew Research Center surveys show a preference for other
terms to describe identity. A 2019
survey found that 47% of Hispanics most often describe themselves by
their family’s country of origin; 39% use the terms Latino or Hispanic, and
14% most often describe themselves as American. As for a preference between
the terms Hispanic or Latino to describe themselves, a 2018
survey found that 27% prefer “Hispanic,” 18% prefer the term
“Latino” and the rest (54%) have no preference. These findings have changed
little in nearly
two decades of Pew Research Center surveys of Hispanic adults, which
are conducted in English and Spanish. What about “Latinx”? Another pan-ethnic identity label is “Latinx,” which has emerged as
an alternative to Hispanic and Latino in recent years. It is used by
some news and entertainment outlets,
corporations, local governments and universities to describe the
nation’s Hispanic population. Yet the use of Latinx is not common practice,
and the term’s emergence has generated debate about its appropriateness in a
gendered language like Spanish. Some
critics say it ignores the Spanish language and its gendered form,
while others see Latinx as a gender-
and LGBTQ-inclusive term.
The term is not well known among the population it is meant to
describe. Only 23% of U.S. adults who self-identify as Hispanic or Latino
have heard of the term Latinx, and just 3% say they use it to describe
themselves, according to a
2019 survey. Awareness and use vary across subgroups, with young
Hispanics ages 18 to 29 among the most likely to have heard of the term – 42%
say they have heard of it, compared with 7% of those 65 and older. Use is
among the highest for Hispanic women ages 18 to 29 – 14% say they use it,
compared with 1% of Hispanic men in the same age group who say they use it. The emergence of Latinx coincides with a global movement to introduce
gender-neutral nouns and pronouns into
many languages whose grammar has traditionally used male or female
constructions. In the U.S., the first uses of Latinx appeared more than a
decade ago. It was added
to a widely used English dictionary in 2018, reflecting its greater
use. How do factors like language, a person’s
last name and the background of their parents play into whether someone is
considered Hispanic? Whether someone chooses to identify as Hispanic is entirely up to the
individual. Our surveys of U.S. Hispanics have found many have an inclusive
view of what it means to be Hispanic. A 2015
survey found 71% of Hispanic adults said speaking Spanish is not
required to be considered Hispanic, and 84% said having a Spanish last name
is not required to be considered Hispanic. Meanwhile, 32% of Hispanic adults
said having both parents of Hispanic heritage or descent is an essential part
of what being Hispanic means to them, according to a 2019
survey.
Views of Hispanic identity may change in coming decades as broad
societal changes, such as rising intermarriage rates, produce an increasingly
diverse and multiracial U.S. population. In 2019, 30% of Hispanic
newlyweds married someone who is not Hispanic, a similar share to Asian
newlyweds (29%) and a higher share than among Black (20%) and White (12%)
newlyweds. Among Hispanic newlyweds, 39% of those born in the U.S. married
someone who is not Hispanic compared with 17% of immigrants, according to an
analysis of American Community Survey data. Among all married Hispanics, 20%
had a spouse who is not Hispanic as of 2019. The Center’s 2015 survey of U.S. Hispanic adults found that 15% had
at least one parent who is not Hispanic. This share rises to 29% among the
U.S. born, and 48% among the third or higher generation – those born in the
U.S. with both parents who were also U.S. born. The Census Bureau also asks people about
their race. How do these responses come into play when determining if someone
is Hispanic?
They generally don’t. In the eyes of the Census Bureau, Hispanics can
be of any race, because “Hispanic” is an ethnicity and not a race – though
this distinction can
be subject to debate. A 2015
survey found 17% of Hispanic adults said being Hispanic is mainly a
matter of race, while 29% said it is mainly a matter of ancestry and 42% said
it is mainly a matter of culture. For many Hispanics, the current census
categories may not fully capture how they view their racial identity. For
example, 26.2 million single-race Hispanics said they were “some other race,”
which refers to those who wrote in an answer that did not fit in the race
categories listed on the census. The next largest single-race group was White
(12.6 million), followed by American Indian (1.5 million), Black (1.2
million) and Asian (300,000). At the same time, more than 20 million Latinos identified with more
than one race on the 2020 census, up from just 3 million in 2010. The
increase in multiracial Latinos could be due to a number of factors,
including changes
to the census form that make it easier for people to identify with
multiple races and growing racial diversity among Latinos. Growth in multiracial
Latinos comes primarily from those who identify as White and “some other
race” (i.e., those who write in a response to the race question) – a
population that grew from 1.6 million to 17.0 million over the past decade.
At the same time, the number of Latinos who identify as White and no other
race declined from 26.7 million to 12.6 million. Can a person’s country of origin or
ancestry affect whether or not they are Hispanic? Similar to race, Hispanics can be of any country of origin or
ancestry. This results in varying patterns that relate to where people come
from and how they choose to identify themselves on census surveys. For
example, in a Pew Research Center analysis of the Census Bureau’s 2019
American Community Survey, nearly all immigrants from several Latin American
and Caribbean countries called themselves Hispanic, including those from
Mexico, Cuba and El Salvador (99% each). By comparison, 93% of immigrants
from Argentina and Paraguay said so, as did 91% of immigrants from Spain and
86% from Panama. What about Brazilians, Portuguese and
Filipinos? Are they considered Hispanic? People with ancestries in Brazil, Portugal and the Philippines do not
fit the federal government’s official
definition of “Hispanic” because the countries are not
Spanish-speaking. For the most part, people who trace their ancestry to these
countries are not counted as Hispanic by the Census Bureau, usually because
most do not identify as Hispanic when they fill out their census forms. Only
about 2% of immigrants from Brazil do so, as do 1% of immigrants from Portugal
and 1% from the Philippines, according to the 2019 American Community Survey. These patterns likely reflect a growing recognition and acceptance of
the official definition of Hispanics. In the 1980 census, 18% of Brazilian
immigrants and 12% of both Portuguese and Filipino immigrants identified as
Hispanic. But by 2000, the shares identifying as Hispanic dropped to levels
closer to those seen today. What people report on census forms is not subject to any independent
checks, corroborations or corrections. This means that, in theory, someone
who has no Hispanic ancestors could identify as Hispanic and that’s how they
would be counted. Has the Census Bureau changed the way it
counts Hispanics? The first year the Census Bureau asked everybody in the country about
Hispanic ethnicity was in 1980. Some efforts
were made before then to count people who today would be considered
Hispanic. In the 1930 census, for example, an attempt to count Hispanics
appeared as part of the race question, which had a category for “Mexican.” The first major attempt to estimate the size of the nation’s Hispanic
population came
in 1970 and produced widespread
concerns among Hispanic organizations about an undercount. A portion
of the U.S. population (5%) was asked if their origin or descent was from the
following categories: “Mexican, Puerto Rican, Cuban, Central or South
American, Other Spanish,” and “No, none of these.” This approach had
problems, among them an undercount of about 1 million Hispanics. One reason
for this is that many second-generation Hispanics did not select one of the
Hispanic groups because the question did not include terms like “Mexican
American.” The question wording also resulted in hundreds of thousands of
people living in the Southern or Central regions of the U.S. being mistakenly
included in the “Central or South American” category. By 1980, the current approach – in which someone is asked if they are
Hispanic – had taken hold, with some tweaks made to the question and response
categories since then. In 2000, for example, the term “Latino” was added to
make the question read, “Is this person Spanish/Hispanic/Latino?” In recent
years, the Census Bureau has studied an
alternative approach to counting Hispanics that combines the
questions that ask about Hispanic origin and race. However, this change did
not appear in the 2020 census. (PEW) SEPTEMBER 23, 2021 Source:
https://www.pewresearch.org/fact-tank/2021/09/23/who-is-hispanic/ 709-43-14/Polls Roughly Six-In-Ten (59%) Of Those Who Relied Most On Trump Say They
Have Received At Least One Dose Of A Covid-19 Vaccine
Americans who relied most on former President Donald Trump and the
White House coronavirus task force for COVID-19 news in the early days of the
pandemic are now among those least likely to have been vaccinated against the
virus, according to a new Pew Research Center survey. In late April 2020, as part of the Center’s American
News Pathways Project, respondents were asked to name the source they
relied on most for pandemic news. At that point, it had been more than a
month since the World Health Organization had declared the coronavirus
outbreak to be a pandemic, businesses and schools in the United States were
closing their doors, and the nation was approaching the 1 million mark in
number of confirmed cases as the sweeping
impact of the pandemic was becoming clearer. Over a year later, at the end of August 2021, the Center asked U.S.
adults about their vaccination
status. Of the 10,348 respondents who took the August survey, 6,686 had
also taken the April 2020 survey. Looking at the group who took both surveys
reveals distinct differences in vaccination rates based on where people
turned most for COVID-19 news.
Those who cited Trump and his task force and those who cited personal
and community networks as their favored COVID-19 news sources are far less
likely than those who relied on other source types to have received at least
one shot of the vaccine. Roughly six-in-ten (59%) of those who relied most on
Trump say they have received at least one dose of a COVID-19 vaccine, while
38% say they have not received a vaccine. Those who said they rely most on personal and community networks such
as family and friends, local newsletters or Listservs, or online forums for
pandemic news have virtually the same vaccination rate as the Trump group:
58% say they have taken at least one shot and 38% have not had any vaccine
doses. The most highly vaccinated groups are comprised of adults who in
April 2020 said they relied most on national news outlets and public health
organizations and officials for COVID-19 news; 83% and 82%, respectively, say
they have gotten at least one shot. And about three-quarters of those who
relied most on international news outlets (78%), state and local elected
officials (76%) and local news outlets (72%) also have received at least one
dose of a COVID-19 vaccine. Which Americans relied most on Trump for
pandemic news? Those who relied most on Trump and his task force for COVID-19 news
stood out in several ways demographically from those who relied most on other
sources. About seven-in-ten (72%) are at least 50 years old, including nearly
four-in-ten (39%) who are at least age 65. The next oldest group trailed the Trump
group by a large margin, with 51% of those who relied on national news
outlets being at least 50 years old.
One interesting contrast is that, overall, those ages 65 and older
are the
most likely of any age group to have gotten at least one dose of the
vaccine. Those who relied most on Trump are most likely to be White and least
likely to be Black or Hispanic. Just 3% of this group are Black and 8% are
Hispanic Americans, while 83% are White. No other group is more than 72%
White. One other distinction that may be predictable but is profound and
starkly partisan is that 92% of Americans who relied most on Trump for
COVID-19 news are Republicans or independents who lean toward the Republican
Party. Conversely, only 7% are Democrats or Democratic leaners. In every other COVID-19 news source category, Democrats comprised no
less than 49% and Republicans comprised no more than 44%. (PEW) SEPTEMBER 23, 2021 709-43-15/Polls Fewer Than Half Of U S Adults (44%) Now Approve Of The Way Biden Is
Handling His Job As President
With his administration facing multiple challenges at home and
abroad, President Joe Biden’s job approval rating has fallen sharply in the
past two months. Fewer than half of U.S. adults (44%) now approve of the way
Biden is handling his job as president, while 53% disapprove. This marks a
reversal in Biden’s job ratings since July, when a 55% majority approved of
his job performance and 43% disapproved.
Since spring, public confidence in Biden has declined across several
issues. In
March, majorities expressed confidence in him across six of seven
dimensions, including his handling of the public health impact of the
coronavirus, and foreign and economic policies. Today, about half still
express confidence in his handling of the coronavirus and the economy – but
majorities have little or no confidence in him in four other areas. Positive evaluations of several of Biden’s personal traits and
characteristics have shown similar decreases. Compared with March, fewer
adults say Biden cares about people like them, and fewer describe him as
standing up for his beliefs, honest, a good role model and mentally sharp. While opinions about Biden remain sharply divided along partisan
lines, the decline in his public standing has come among members of both
parties. On his job rating, for example, there has been a 13 percentage point
decline in the share of Democrats and Democratic-leaning independents who
approve of Biden’s performance (from 88% in July to 75% today); only 9% of
Republicans and GOP leaners approve, down from 17% two months ago. The new survey by Pew Research Center, conducted Sept. 13-19 among
10,371 adults on the Center’s nationally representative American Trends
Panel, finds that Biden is not the only political leader in Washington whose
job ratings have fallen. Just 27% of Americans approve of GOP congressional
leaders, down 5 percentage points since April. The decline in approval
ratings for Democratic leaders in Congress has been even larger, from 50% to
39%.
There also are signs that the public is generally becoming more
pessimistic: Just 26% say they are satisfied with the way things are going in
the country, down from 33% six months ago. And while views of current
economic conditions remain lackluster – 26% rate them as excellent or good –
expectations for the economy over the next year have become more negative
than they were in the spring. Currently, 37% of Americans say economic conditions will be worse a
year from now, while 29% say things will be better; 34% expect little change.
In March, more said economic conditions would improve (44%) than get worse
(31%) over the next year, while 24% said conditions would be about the same
as they are now. As has been the case since he took office, Biden draws more public
confidence for his handling of the public health impact of the coronavirus
than other issues.
About half (51%) are very or somewhat confident in his handling of
the coronavirus outbreak, but that is down from 65% in March. The shares
expressing confidence in Biden’s handling of economic policy, foreign policy
and immigration policy also have declined. Biden continues to draw less confidence for unifying the country than
on dealing with specific issues; only about a third (34%) are confident he
can bring the country closer together, a 14 percentage point decline since
March.
Assessments of Biden’s personal traits also have become less
positive. While majorities say he stands up for what he believes in (60%) and
cares about the needs of ordinary people (54%), larger shares described Biden
in these terms six months ago (66% and 62%, respectively). Biden receives his least positive assessments for being mentally
sharp. Currently, 43% say this describes Biden very or fairly well, an
11-point decline since March. Other important findings from the survey: Majority favors admitting Afghan refugees
into the U.S. A 56% majority favors admitting
thousands of Afghan refugees into the U.S. while 42% are opposed. There are
sizable partisan differences in these attitudes: More than twice as many
Democrats (75%) as Republicans (35%) favor admitting refugees who fled
Afghanistan. The Biden administration continues to receive negative ratings
for its handling of the situation in Afghanistan. Only about a quarter of
adults (24%) say the administration has done an excellent or good job in
handling the situation with the country; 26% say it has done only fair, while
nearly half (48%) rate its performance as poor.
About half favor each of the congressional
infrastructure proposals. As congress prepares
to take up a pair of infrastructure proposals, more Americans view each one
positively than negatively. However, a quarter or more say they are not sure
about the proposals (respondents are given the option of saying they are not
sure). About half of adults (51%) say they favor the bill passed by the Senate
last month that would provide $1.2 trillion in funding over the next 10 years
for infrastructure improvements, including roads, bridges and internet
upgrades. Just 20% oppose the bill, while 29% say they are not sure. A comparable share (49%) favors a proposed $3.5 trillion, 10-year
package that includes funding for universal pre-K education, expanding
Medicare, reducing carbon emissions and other projects. A quarter oppose the
spending package, while a quarter are unsure. Broad support for raising taxes on large
businesses, high-income households. About
two-thirds of Americans (66%) favor raising taxes on large businesses and
corporations, including 37% who say taxes should be raised “a lot.” A
somewhat smaller majority (61%) says tax rates should be raised on household
income over $400,000; 26% say these tax rates should be raised a lot, while
35% favor raising them a little. Rising prices a leading economic concern. A
majority of adults (63%) say they are very concerned about rising prices for
food and consumer goods. That is larger than the shares citing other economic
issues – employers being unable to hire workers (42% very concerned), people
facing eviction or foreclosure (35%) or people who want to work being unable
to find jobs (29%). Republicans are more likely than Democrats to cite rising
prices and a shortage of workers as top concerns; Democrats are more likely
to be very concerned over evictions and foreclosures and people who want to
work struggling to find jobs. (PEW) SEPTEMBER 23, 2021 709-43-16/Polls 4 Out Of 5 Canadians (83%) Agree That It Is A Priority To Retain
Canada’s Key Capacity To Train Military Pilots Under Canadian Control
Toronto, ON, September 20, 2021 — As
the pandemic continues to exert pressures, Canadians are looking inwards at
how best to secure sovereignty and domestic economic growth. According to a
recent survey study conducted by Ipsos, 4 out of 5 Canadians (83%) agree that
it is a priority to retain Canada’s key capacity to train military pilots
under Canadian control. Sovereignty remains at the forefront of Canadians’
minds, with a near consensus (92%) agreeing that it is essential to national
sovereignty and security that Canada retain the training of its military
pilots. Canadians want to see domestic reinvestment
and sovereign stability in defence and security acquisitions Canadians continue to strongly support reinvestment into the Canadian
economy: 9 in 10 Canadians (91%) agree that when the Canadian government
makes major defence and security acquisitions, it should focus primarily on
buying services and equipment from domestic companies. Buying Canadian is a strong consideration for military pilot training
too with 3 in 5 (58%) Canadians feeling it even trumps cost. That said, with
budgets tightening, 2 in 5 Canadians (42%) indicate that what matters most to
them is that Canada should seek out the lowest cost solution for military
pilot training, regardless of whether the provider is Canadian or foreign
owned. Canadians are divided on Canada’s military
pilot training leadership status Canadians are divided on Canada’s status as a leader in training
military pilots. 1 in 10 Canadians (10%) believe that Canada is ahead of
other countries in its achievements, a third of Canadians (31%) believe it’s
on par, and 1 in 5 (22%) believe Canada is falling behind. However, a
significant proportion of nearly 2 in 5 Canadians simply don’t know (37%)
about Canada’s place amongst leading countries in military pilot training. Fully 4 out of 5 (80%) Canadians admit that they didn’t know of
Canada’s leadership in military pilot training since the Second World War. (Ipsos Canada) 20 September 2021 AUSTRALIA
709-43-17/Polls Covid-19 Pandemic Drives Australians To Increasingly ‘Shut Themselves
Off From The Rest Of The World’ When At Home
The latest figures from the June quarter 2021 show 54.5% of
Australians 14+ now agree that ‘When I’m
at home, I like to shut myself off from the rest of the world’ – a
massive increase of 16% points compared to the March quarter 2020 just prior
to the onset of the COVID-19 pandemic. Prior to the pandemic agreement with this statement had barely
changed over the preceding four years, increasing by just over 1% point since
the September quarter 2016. Women have driven a larger share of this increase since the pandemic
began than men. A clear majority of 58.5% of women agree with the statement
in the June quarter 2021, an increase of 19.8% points from the March quarter
2020 and up over 21% points from five years ago. In contrast only a narrow majority of 50.3% of men now agree with the
statement, an increase of 12% points from the March quarter 2020 and up just
over 13% points from five years ago. The data comes from Roy Morgan Single Source, the nation’s largest
and longest-running program of research into consumer behaviour and
attitudes, continuously conducted year-round. % of Australians agree:
Generation Z are the most likely to agree
they like to shut themselves off from the world at home The onset of the COVID-19 pandemic during 2020 has had a huge, and
enduring, impact on how Australians of different ages respond to this
statement. There have been sharp rises across all generations of people who
agree that ‘when I’m at home, I like to
shut myself off from the rest of the world’. Over three-fifths of young people in Generation Z (60.7%) agree that
‘when I’m at home, I like to shut myself
off from the rest of the world’ – an increase of 13.7% points from
the March quarter 2020. It turns out agreement with this statement is heavily co-related to
age and decreases the older one gets – although the impact of COVID-19 on
views on this statement also increases with age. In the June quarter 2021 well over half of Millennials (58%, up 16.3%
points from the March quarter 2020) and Generation X (56%, up 17.2% points)
agree that ‘when I’m at home, I like to
shut myself off from the rest of the world’. These two generations
cover Australians born between 1961-1990 and aged in their 30s, 40s and 50s. In contrast, older Australians aged 60 years and older are the least
likely to agree with the statement – although since the COVID-19 pandemic
began it is Australians aged 75+ who have changed their views the most. Now
44.8% of Baby Boomers (up 14.1% points from March quarter 2020) and 41.9% of
Pre-Boomers (up 20.9% points) agree that ‘when
I’m at home, I like to shut myself off from the rest of the world’. % of Australians agree: ‘When I'm at home,
I like to shut myself off from the rest of the world’ by Generation in March
Quarter 2020 (pre COVID-19) cf. June Quarter 2021
“’My home is my castle’ is a well-worn
phrase coined over 400 years ago that has never felt truer to millions of
Australians over the last 18 months as we have been confined to our homes,
and restricted from travelling, since the COVID-19 pandemic hit our shores in
full force in March 2020. “We all know of the larger impacts of
COVID-19 on society with borders closed, international travel banned and
lockdowns forcing many Australians out of work for extended periods, but
there are more subtle impacts on our way of thinking that haven’t been
explored fully. “One clear example is the way we think of
our homes and we have seen a soaring number of Australians saying that ‘when
I’m at home, I like to shut myself off from the rest of the world’ – now at
54.5% in the June quarter 2021 compared to only 38.5% in the March quarter
2020. “This increase has been broad-based across
both genders and people of all ages but even within this larger movement
there are key differences. For instance, before COVID-19 arrived on our
shores there was barely any gender gap on this question – but this is no longer
the case. “Over the past 18 months a significant
gender gap has opened up with 58.5% of women (up 19.8% points) now agreeing
they are ‘shutting off from the rest of the world when at home’ compared to a
bare majority of 50.3% of men (up 12% points). “There is also a clear age-based factor to
this question with clear majorities of people in Generation Z (60.7%),
Millennials (58%) and Generation X (56.1%) ‘shutting off from the rest of the
world when at home’ compared to only 44.8% of Baby Boomers and 41.9% of
Pre-Boomers. “The age split is effectively for those
aged over 60 years of age compared to those aged under 60 years of age. One
factor that appears to be driving this split is participation in the
workforce which comprises the vast majority of those aged under 60 whereas
older Australians are more likely to be retired. “The increasing vaccination rate means we
are approaching a new stage in the pandemic known by some as ‘living with the
virus’ and by others as ‘COVID-normal’. The transition to a re-opened society
with a continuing level of infections is something Australians haven’t
experienced before. “It is hard to predict how Australians will
react to ‘living with COVID’ and at Roy Morgan we will be keenly watching to
see whether the attitudes that drive the behaviour of consumers that have
changed significantly during the pandemic are sustained or return to
pre-COVID levels in the months and years ahead.” (Roy Morgan) September 21 2021 Source: https://www.roymorgan.com/findings/8798-home-time-june-2021-202109140626 MULTICOUNTRY
STUDIES
709-43-18/Polls Majority Of Australians 76% Report Unwavering Support For Abortion
Access
Seven in 10 Australian adults support access to abortion, an online
study by Ipsos has found. The study, conducted across 27 countries, also
found that global support for access to abortion has been steadily increasing
since 2014, with the largest increases seen in South Korea and parts of Latin
America. In Australia, support for abortion has remained consistent over the
past eight years: 76% supported abortion in 2021, compared to 74% in 2018,
and 77% in 2014. Key Australian findings
Ipsos Australia Director, Julia Knapp,
said: “While the majority of Australians support access to abortion in 2021,
this level of support hasn’t changed significantly in seven years of polling.
This is in contrast to many countries in Europe where support is has been declining,
and much of Latin America, where support has grown substantially.” Global Findings Support for abortion averages 71% across 27 countries in 2021,
compared to 72% across 22 countries seven years ago. Views on abortion
continue to vary widely across countries and regions. However, this year’s
survey highlights significant gains in some countries, in the level of
support for abortion access, balanced by a softening in other countries. In
particular, support for abortion has decreased in many European countries,
and increased across much of Latin America. When looking at gender globally, 73% of females and 69% of males were
in favour of access to abortion. Globally, 50% of females and 43% of males
indicated that women should be able to access abortion whenever she decides
she wants one. The gender gap is highest in Turkey (26 points), Russia (16),
Argentina (15), Canada (13), South Korea (13), and Poland (12). When comparing age groups globally, support was highest in those aged
50-74, at 74% in favour of abortion access. Those with higher levels of
education were more likely to be in support of abortion access at 75%. The US reported 66% favourability in 2021, an increase of 2% since
2014. This data was collected before the political climate changed in the US,
following the controversial stance taken by the US Supreme Court regarding
restrictive abortion laws in Texas and Mississippi. This study did not have any external sponsors or partners. It was
initiated and run by Ipsos, because we are curious about the world we live in
and how citizens around the globe think and feel about their world. These are the results of a 27-country survey conducted by Ipsos on
its Global Advisor online platform between June 25 and July 9, 2021. Ipsos
interviewed a total of 20,003 adults aged 18-74 in the United States, Canada,
Malaysia, South Africa, and Turkey, and 16-74 in 22 other markets between
June 25 and July 9, 2021. The sample consists of approximately 1,000 individuals in each of
Australia, Belgium, Brazil, Canada, France, Germany, Great Britain, Italy,
Japan, Spain, and the U.S., and 500 individuals in each of Argentina, Chile,
Colombia, Hungary, India, Malaysia, Mexico, the Netherlands, Peru, Poland,
Romania, Russia, South Africa, South Korea, Sweden, and Turkey. The samples in Argentina, Australia, Belgium, Canada, France,
Germany, Great Britain, Hungary, Italy, Japan, the Netherlands, Poland, South
Korea, Spain, Sweden, and the U.S. can be taken as representative of these
countries’ general adult population under the age of 75. The samples in Brazil, Chile, Colombia, Malaysia, Mexico, Peru,
Romania, Russia, South Africa, and Turkey are more urban, more educated,
and/or more affluent than the general population. The survey results for
these countries should be viewed as reflecting the views of the more
“connected” segment of their population. The data is weighted so that each country’s sample composition best
reflects the demographic profile of the adult population according to the
most recent census data. Where results do not sum to 100 or the ‘difference’ appears to be
+/-1 more/less than the actual, this may be due to rounding, multiple
responses, or the exclusion of don't know or not stated responses. The precision of Ipsos online polls is calculated using a credibility
interval with a poll of 1,000 accurate to +/- 3.5 percentage points and of
500 accurate to +/- 5.0 percentage points. As a foundation member of the Australian Polling Council Ipsos
complies with the Council’s Code of Conduct. The purpose of the Code is
to provide journalists and the public with greater confidence and trust in
publicly released polling and survey data. We strongly encourage the
inclusion of methodological details in any reference to published Ipsos
results. (Ipsos Australia) 20 September 2021 Source: https://www.ipsos.com/en-au/majority-australians-report-unwavering-support-abortion-access 709-43-19/Polls A Median Of 79% Across 16 Publics Have A Favorable Opinion Of Germany
Confidence in German Chancellor Angela Merkel among people around the
world has remained relatively
high throughout her nearly 16-year tenure. In her last year in
office, as Germans prepare
to vote for her replacement, a new Pew Research Center survey finds
all-time high ratings of the German leader in most of the 16 advanced
economies surveyed in North America, Europe and the Asia-Pacific region.
Public opinion of Germany is also positive; most hold a favorable view of the
country and say that it has done a good job dealing with the coronavirus
outbreak. And among the European Union member states surveyed, many think
Germany has about the right amount of influence in the EU.
Majorities in nearly every public surveyed have confidence in Merkel
to do the right thing in world affairs, including nine-in-ten in the
Netherlands and Sweden. Merkel has enjoyed generally high ratings in a number
of countries since she first took office, with confidence growing as more people
became familiar with her over time. In most places surveyed, trust in the
German chancellor has never been higher. Merkel currently enjoys the highest confidence ratings of the five
world leaders asked about in the survey. She receives considerably higher
marks than Russian President Vladimir Putin or Chinese President Xi Jinping,
and Merkel also fares well compared with French President Emmanuel Macron
and, in many places, U.S. President Joe Biden.
At the same time, people in Europe, North America and the
Asia-Pacific region have very positive views of the country she leads. A
median of 79% across 16 publics have a favorable opinion of Germany, while
only 16% have an unfavorable one. Germany is also viewed more positively than
the United States and China in most places surveyed. In several of the European countries surveyed, views of Germany have
not changed much over the past two decades, before Merkel took office.
Roughly seven-in-ten or more have expressed a positive opinion of Germany in
Sweden, the Netherlands, Spain, France and the United Kingdom in each year
this question has been asked. Favorable views of Germany and Merkel are influenced, in part, by
perceptions of how Germany handled the coronavirus
outbreak. A median of 66% say Germany did a good job dealing with the
outbreak, and again, Germany fares well in comparison with other countries
and institutions. Germany’s coronavirus response is generally viewed more
positively than
the responses of the World Health Organization, China, the EU or the
U.S. And people who think Germany has handled the outbreak well are much more
likely to have a favorable view of Germany and confidence in Merkel in every
public surveyed. Positive views of Germany and its leader extend to perceptions of its
role in the EU, as well. A median of 54% across the seven EU member states
surveyed think Germany has about the right amount of influence in the EU. A
median of about a third say Germany has too much influence in the EU.
However, perceptions of Germany’s international role vary considerably across
the seven EU countries polled; while 82% of Swedes say Germany has about the
right amount of influence, only 10% of Greeks agree.
On nearly every assessment, Greece stands out for its particularly
negative views of both Germany and Merkel. Only around a third of Greeks have
confidence in the German chancellor or a favorable view of Germany, though a
majority give it good marks for its handling of the coronavirus outbreak
(about the same share who say their
own country handled the outbreak well). And compared with others in
Europe, more people in Greece say Germany has too much influence in the EU
(86%). Views of Germany have been negative in Greece since Pew Research
Center started surveying there in 2012, just after Greece received a second
bailout in response to the European debt crisis, while tensions
between the two countries were high. These are among the major findings from a Pew Research Center survey
conducted among 17,823 respondents in 16 advanced economies – not including
Germany – from Feb. 1 to May 26, 2021. Most in Europe and the Asia-Pacific region
are confident in Merkel
Across the 16 publics surveyed, a median of 77% have confidence in
Merkel to do the right thing regarding world affairs. Majorities in every
advanced economy surveyed except Greece hold this positive opinion of the
German chancellor. Merkel obtains both her highest and lowest ratings in Europe.
Nine-in-ten in Sweden and the Netherlands have confidence in her to handle
world affairs, including 48% and 60%, respectively, who have a lot of confidence. Confidence in
the German chancellor is only slightly lower in Spain, Belgium and France. On the other end of the spectrum, relatively few Greeks – only 30% –
trust Merkel to do what is right. And Greeks are a clear outlier; the next
smallest share is more than twice as high, with 63% in the U.S. having
confidence in Merkel. Greeks view Merkel so negatively that just under half
(45%) say they have no confidence in her at all when it comes to foreign
affairs. Fewer people in the Asia-Pacific region express an opinion about the
German leader. At least 5% in each public provide a “don’t know” response,
including 13% in Japan and 15% in Taiwan. But among those who do express an
opinion, many say they have confidence in Merkel to do the right thing in
world affairs. Positive assessments are particularly high in New Zealand and
Australia, and at least seven-in-ten also have faith in Merkel in Singapore,
Japan and South Korea.
Overall, confidence in Merkel has grown over the course of her nearly
16 years in office. Merkel’s confidence ratings are now at or near an
all-time high in nearly every country where trends are available. And in
roughly half of these countries, Merkel has seen at least a slight increase
in trust since the previous year. In Spain, for example, 86% now have confidence in Merkel when it
comes to her handling of world affairs. This is a 14 percentage point
increase from 2020 and a 49-point increase from 2006, her full first year in
office. In part, this is due to a relatively large share of Spaniards who did
not express an opinion in the first several years of her tenure, including
roughly a quarter in 2006 and 2007. Similar patterns can be seen in Italy,
Australia, Japan, South Korea, Canada, Sweden and the UK, where the share
saying “don’t know” decreased and confidence increased as Merkel spent more
time in office. In the Netherlands, where opinions about Merkel have only been
examined in more recent years, the share who have confidence in Merkel has
never fallen below 82%. And in France, which the Center has surveyed annually
since her first year in office, at least 70% have had trust in Merkel each
year. Although people in Greece have extremely low trust in Merkel compared
with other surveyed publics, significantly higher shares say they trust the
German leader now, compared with 2019 and earlier. In addition to enjoying widespread confidence, and an increase in
confidence from previous years, Merkel also fares well in comparison with
other major world leaders. Compared with French President Emmanuel Macron,
Russian President Vladimir Putin and Chinese President Xi Jinping, people are
more likely to have confidence in Merkel in nearly every public surveyed. Faith
in Merkel is also generally higher than trust in U.S. President Joe Biden,
though views of the two leaders are similar in a number of places, including
Canada, Italy, Japan, the UK, Singapore and Taiwan. Again, Greece is a stark
exception, where Merkel is the least trusted of the five world leaders asked
about. In most publics, people with more education are more likely than
their counterparts to have confidence in Merkel to do the right thing in
world affairs. And in the U.S., Italy, the UK, Canada and Australia, people
who place themselves on the left of the ideological spectrum have more faith
in the German chancellor. For example, 79% of liberals in the U.S. trust
Merkel compared with 48% of conservatives, a 31-point difference. Views of Germany largely favorable
Across the 16 publics, a median of 79% say they have a favorable view
of Germany. Except in Greece, where only about a third see Germany
positively, this view is held by about two-thirds or more across every public
surveyed. Views are especially positive in Sweden and in the Netherlands, and
more lukewarm in the U.S., where 28% express an unfavorable view –the highest
of any public surveyed except Greece. Across the 16 publics surveyed, a
median of only 16% have an unfavorable view of Germany. Opinions of Germany have generally been positive and stable over the
past two decades but have improved significantly among Italians (by 22
points) and Spaniards (8 points) since the question was last asked in 2019,
prior to the outbreak of the coronavirus.
In most publics surveyed, those with more education, those with
higher incomes and those on the political left are more likely to view
Germany positively. And people who have unfavorable views of right-wing
populist parties in Italy, the Netherlands and the UK are also more likely to
have a favorable view of Germany. Compared with the U.S. and China, Germany is held in high regard.
Across all 16 publics surveyed, a median of 79% express a favorable view of
Germany, while about six-in-ten rate the U.S. positively (62%). Only 27% view
China favorably. Of the three countries, Germany is viewed the most favorably in all
but three of the publics polled. Only Americans, Greeks and Japanese rate the
U.S. more positively than they do Germany. Most rate Germany’s handling of the
pandemic positively
Favorable opinions of Germany extend to views of its handling of the
pandemic. A median of 66% say Germany has done a good job dealing with the
coronavirus outbreak. Again, overall assessments are most positive in Sweden and the
Netherlands, though at least seven-in-ten in most of Europe, the U.S. and
Canada agree. Despite generally negative opinions of Germany and its leader,
a majority of Greeks think Germany has dealt with the outbreak well. Views are somewhat less positive across the Asia-Pacific region,
though people there are more likely than others to not provide an opinion on
the topic. Still, more than half in New Zealand, Australia, Singapore and
Japan say Germany has done a good job dealing with the outbreak. Moreover, people in most places surveyed rate Germany’s handling
of the pandemic more positively than that of the EU and WHO. And
Germany’s response to the outbreak is rated much more highly than the
responses from the U.S. and China. Greece and Singapore are the exceptions;
in both countries, roughly three-quarters approve of China’s handling of the
coronavirus, compared with 57% who rate Germany’s response positively. In Europe, views of Germany’s coronavirus response are even more
positive than people’s assessments of how their own
country handled the outbreak. For example, while 77% of Spaniards say
Germany dealt with the outbreak well, only 44% say the same about Spain. In each of the 16 publics surveyed, those who say Germany handled the
coronavirus outbreak well are more likely to have a favorable opinion of
Germany and to have confidence in Merkel when it comes to world affairs. In
the U.S., for example, 80% of people who think Germany has handled the
outbreak well have a favorable view of Germany overall, compared with only
40% of those who do not think Germany has done a good job dealing with the
coronavirus. There is a similarly large gap in confidence in Merkel between
Americans who rate Germany’s response to the outbreak positively and those
who rate it negatively (74% and 34%, respectively, have confidence in
Merkel). Many in EU say Germany has about the right
amount of influence, though opinions vary
Across seven other EU member states surveyed, opinions about whether
Germany has too much, too little or about the right amount of influence in
decision-making in the EU vary. A median of 54% say Germany has about the
right amount of influence, but roughly a third (35%) say the country has too
much influence. Very few Europeans say that Germany has too little influence;
the highest share of people saying this is among the French (9%). More than half in France, Belgium, the Netherlands and Sweden say
Germany has about the right level of influence in the EU. Greece stands out again on this question with over eight-in-ten
saying Germany has too much influence – the largest share among the EU member
states surveyed. A majority of Italians also share this view, as do more than
half of Spaniards.
While many in Italy and Spain say that Germany has too much
influence, the percentage in these countries who say Germany has about the
right amount has increased by about 20 points since the question was last
asked. Compared with 2017, more Swedes now also say Germany has about the
right level of influence. In most of the seven EU countries surveyed, there are no significant
differences on Germany’s perceived influence when it comes to education and
gender. In Greece, those ages 65 and older are more likely to say Germany has
too much influence (89%) than those 18 to 29 (72%). Greater shares of older
Italians, Belgians and the French are also more likely than their younger
counterparts to say this. (PEW) SEPTEMBER 22, 2021 709-43-20/Polls Of 28 Countries, Brazil Is The One That Most Believes That Women In
Political Leadership Would Bring Peace To The World
More than 7 out of 10 Brazilians believe the world would be more
peaceful and successful if we had more female political leaders. This is
what a survey on global leadership conducted with respondents from 28
nations, including Brazil, points out. While 72% agree with the
statement, 18% disagree and 10% did not know how to give their opinion on the
subject. Of the 28 countries evaluated, in 18 the percentage that bets on
female leaders to bring peace and success to the world is greater than or
equal to 50%. Brazil, with 72%, is in first place in the ranking,
followed by Latin Americans Peru and Colombia (both with 70%) and, in third
place, by Turkey (67%). The global average, considering the total number
of respondents, is 54%. In all nations, female respondents have higher
agreement rates than males – the average difference is 12 percentage points
(10 in Brazil). “It is possible that the first position occupied by Brazil in this
ranking is a response to the truculent way in which so many female leaders
have been treated by politicians in power. Although the participation of
women in elected positions has increased slightly in the last elections – but
there is still a glaring under-representation – there is a setback in terms
of opportunities for more active participation, recurrently blocked by voices
that reflect a still patriarchal and sexist”, analyzes Helio Gastaldi,
Director of Public Affairs at Ipsos in Brazil. Still regarding the desired characteristics for political
representatives in power, 83% of Brazilian respondents agree that, in order
to solve global challenges, the world needs strong leaders. The average
is 80%. Furthermore, 81% of respondents in Brazil believe that political
leaders should be replaced regularly so that they do not become too
powerful. On the global average, 3 out of 4 people (75%) agree. (Ipsos Brazil) 23 September 2021 709-43-21/Polls Three In Ten Consumers Shopping For Consoles In Both Britain (30%)
And The United States (32%) Say They Are Willing To Wait For Their First
Choice To Become Available
The worldwide semiconductor shortage continues to wreak havoc on
supply chains across many sectors, particularly gaming consoles. As we gear
up for the all-important holiday season, a new YouGov Direct survey reveals
what consumers may do if they can’t get their hands on a next-generation
console. In the United States, roughly half of consumers who indicated it
has been harder for them to purchase their first choice of gaming console say
they will seek out an alternative product (52%). In Great Britain, that
number is higher at 63%. The PlayStation 5 and the Xbox Series X have both been hard to
come by. However in some markets, it has been easier to get the less
expensive (but less capable) Xbox series S, which may give Microsoft’s
entry-level offering a competitive advantage. The latest consoles from Xbox and PlayStation have been elusive to
consumers. Substantial changes to worldwide demand for products during the
pandemic caused a semiconductor shortage. This shortage has been met with
increased demand for the new console offerings.
Three in ten consumers shopping for consoles in both Britain (30%)
and the United States (32%) say they are willing to wait for their first
choice to become available. For those holdouts, industry
observers say it will be well into 2022 before the supply chain for
consoles is ironed out. Data shows consumers in the US are more likely than Brits to give up
on their search. A marginal proportion of Brits who have had a hard time
buying a console say they’re likely to stop searching, while one in ten (10%)
Americans will stop hunting. (YouGov UK) September 25, 2021 709-43-22/Polls In Six Of 13 Countries, Online Lottery Is The Most Popular Online
Product
Fueled by innovation, de-regulation in key markets, and the pandemic,
it’s clear that the popularity of online gambling globally has achieved new
heights. This growth has been driven largely by lottery and sports
betting. Sports betting in Great Britain remains the second most popular form
of online betting among online gamblers (40%), behind lottery draws
(61%). These new insights are part of a fresh YouGov whitepaper that delves
deep into attitudes and habits around online gambling in several global
markets, including Great Britain and beyond. The global popularity of lottery products – prize draws or instant
tickets – and sports betting is clear. In six of 13 countries, online lottery
is the most popular online product, and a further four have it as the second
most popular product.
Sports betting is also the most popular online product in six
countries while it is the second most popular in a further six. Lottery
instants are the third most popular online product in eight of the 13. In the United States, sports betting comes out on top (32%), though
it’s a photo-finish with lottery draw (31%) with slots in third (23%).
And online sports betting in the US is only going to grow as states
de-regulate. Yet the piecemeal progress of state-by-state legislation in the US
with fewer than 20 states so far online with either sports betting or online
gaming means incidence of online gambling in the US is fully ten percentage
points lower than the global average (7% versus 17%). But if or when laws
change in the most populous states of New York, Florida, Texas, and
California, online betting will grow in general - as will sports
betting. The only standout from this lottery/sports hegemony is India where
fantasy games are the most popular online product, followed by skill games.
Again, this is likely down to the nature of the regulatory picture in India
where gambling products are strictly limited to skill games including fantasy
sports, while lotteries are run by the individual states. (YouGov UK) September 25, 2021 |
||||||||||||||||||||||||||||||||||||||||||||||||||||||||||||||||||||||||||||||||||||||||||||||||||||||||||||||||||