|
BUSINESS & POLITICS IN THE WORLD GLOBAL OPINION REPORT NO. 715-716 Week:
November 01 –November 14, 2021 Presentation:
November 19, 2021 State
Bank Of India Leads The Purchase Funnel Rankings In The Banking List With A
Score Of 46.2 4
Out Of 10 People Say They Will Get The Turkovac Vaccine When Ready To Use 62%
Of The Society Feels Like They Have Lost Their Social Circle 8
In 10 Adult Nigerians Have No Health Insurance Cover 51%
Of Malawians Say There Are More Factors That Divide Them Than Unite Them As A
People Women
Feel Less Safe Walking Home Alone At Night Than In 2018 Around
Half Of Britons (50%) Say Migrant Numbers Over The Last 10 Years Have
Been Too High Only
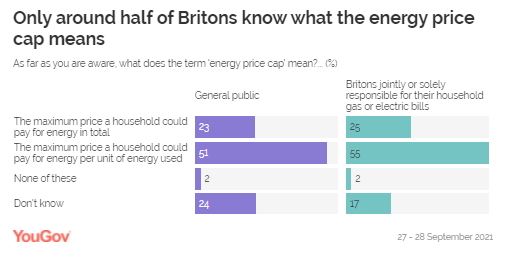
Half (51%) Of People Who Pay Their Household’s Energy Bills Know What The
Energy Price Cap Is 76%
Of People In England Say They Would Support A Policy Enforcing Masks Being
Worn In Shops Two
Fifths Of The Public (40%) Think Second Jobs Should Not Be Allowed At All 48%
Of 10-15 Year Olds Put Climate Change At The Top Of Their Fears For The
Future 7
Out Of 10 French People Consider Themselves To Be Good Cooks (70%) Amid
The Pandemic, A Rising Share Of Older U S Adults Are Now Retired 16%
Of Americans Say They Have Ever Invested In, Traded Or Used Cryptocurrency A
Survey Of 17 Advanced Economies Highlights The Complexity Of America’s
International Image 90%
Of Brazilians Say That Many People Cannot Afford To Pay For Good Quality
Healthcare Buying
Sustainable Fashion Is Important For 2 Out Of 5 Europeans in 10 Countries Global:
Fan Interest In The T20 World Cup In Five Key Markets Would
You Be Willing To Eat Insects As Part Of Your Regular Diet; Survey
Conducted In 17 Countries INTRODUCTORY NOTE
715-716-43-41/Commentary:
No
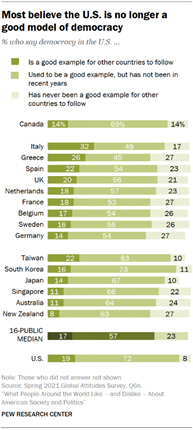
More Than Three-In-Ten Adults See The U S Military As The Best In The World:
Survey Findings From 17 Advanced Economies
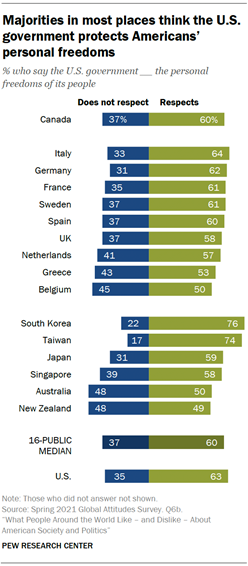
Americans don’t always see eye to eye with
people in other societies over various dimensions of U.S. “hard” and “soft”
power, according to a February Pew Research Center survey of the United
States and 16 other advanced economies. While Americans see some aspects of U.S.
power more positively than people elsewhere, they offer more negative views
in other areas.
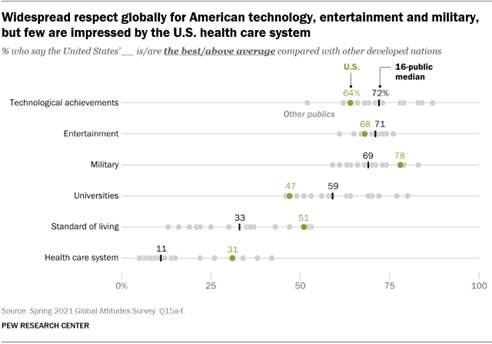
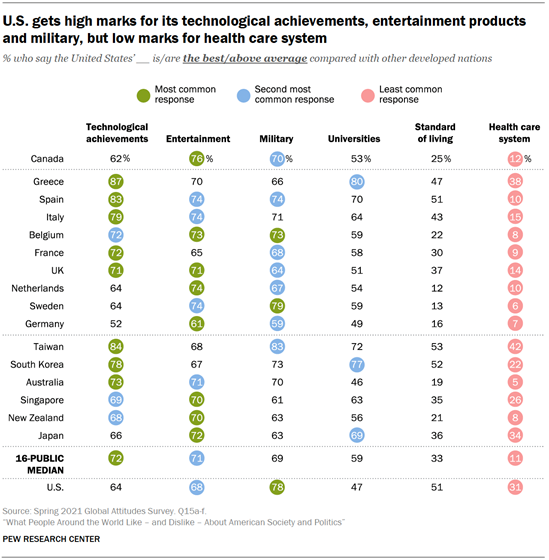
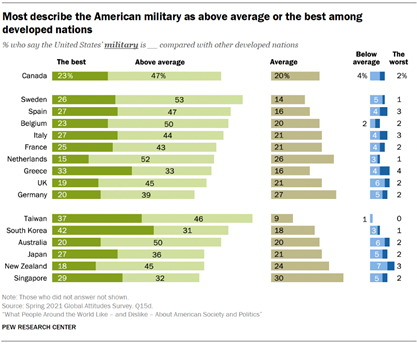
When it comes to the U.S. military, for
example, 44% of U.S. adults say it’s the best in the world and another 34%
describe it as above average. These self-evaluations are slightly rosier than
those offered by publics in the other advanced economies surveyed, where,
outside of South Korea (42%) and Taiwan (37%), no more than around
three-in-ten adults see the U.S. military as the best in the world. Still, large
majorities in the U.S. and every other place surveyed describe the American
military as at least above average. How we did this
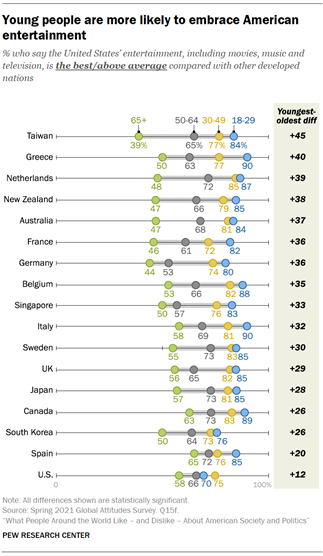
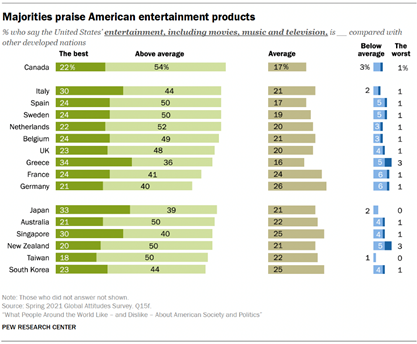
Around three-in-ten Americans (29%)
describe their country’s entertainment products – including movies, music and
television – as the best in the world, while another 39% call them above
average. Large majorities in every other place surveyed agree that U.S.
cultural exports are at least better than average, but only in Greece, Japan,
Singapore and Italy are people as likely as Americans to declare the U.S. the
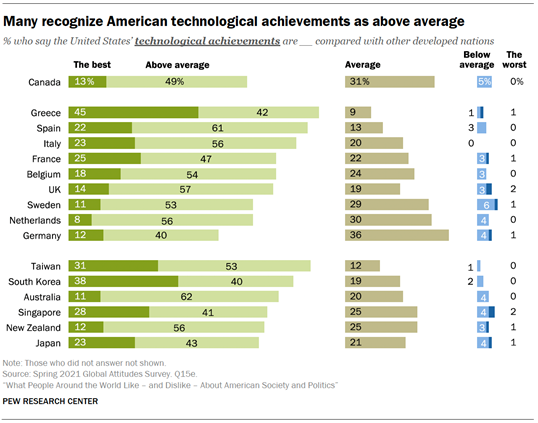
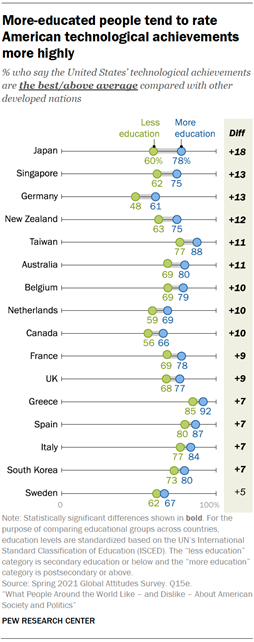
global leader. Americans are notably less positive when it comes to
their nation’s technological achievements. Only 16% think U.S. achievements
in this area are the best in the world. On this question, people in other
countries are slightly more likely
to see the U.S. positively. A median of 20% of adults across the 16 other
advanced economies say U.S. technology is the best in the world, including
45% in Greece, 38% in South Korea and 31% in Taiwan. While relatively few
Americans see their own country’s technological achievements as the world’s
best, 64% of U.S. adults see them as at least better than average – a view
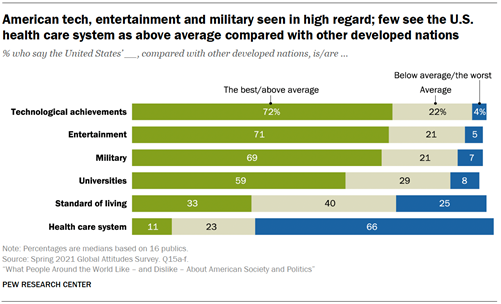
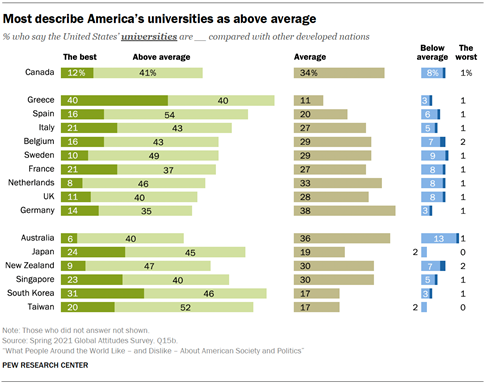
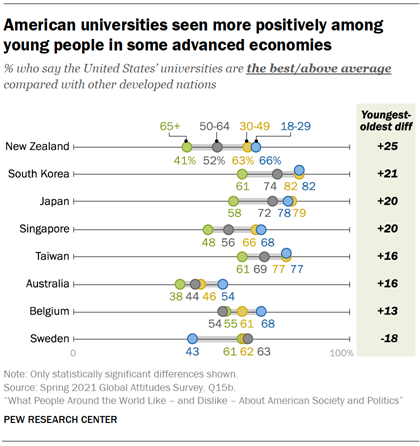
that is broadly shared across the other surveyed publics (median of 72%). Americans do not offer especially glowing
evaluations of their universities, either. Only 14% call them the best in the
world, though another 33% describe them as better than average. Across the
other publics surveyed, a median of 59% describe U.S. universities as at
least better than average. And in Greece (40%), South Korea (31%), Japan
(24%) and Singapore (23%), around a quarter or more describe them as the best
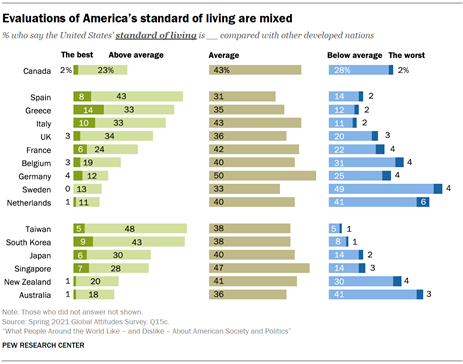
in the world. When it comes to the U.S. standard of
living, around half of Americans (51%) describe it as above average or
better, including 12% who call it the best in the world. Yet outside of
Taiwan (53%), South Korea (52%), Spain (51%) and Greece (47%), people in
other advanced economies offer less positive assessments. Across the other 16
places surveyed, a median of only 33% describe the U.S. standard of living as
above average or better. In fact, in most places, a plurality describes the
American standard of living as solidly “average” – including half who give it
this rating in Germany. Around half of the Dutch (47%) and Swedes (53%) call
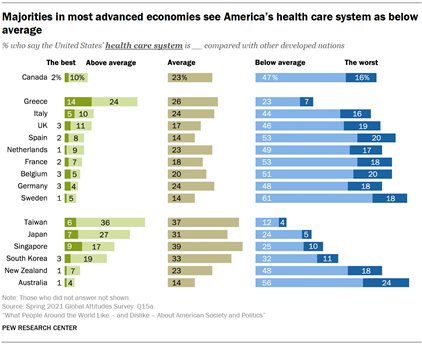
the American standard of living below average or worse. Few people in any of the advanced economies
surveyed – the U.S. included – describe the American health care system as
the best in the world. Americans themselves are relatively divided over
whether it is better than average (31%), average (30%) or worse than average
(39%). Elsewhere, majorities say the American health care system is below
average or worse, including one-in-five or more in Australia (24%), Spain
(20%) and Belgium (20%) who say the American health care system is the worst
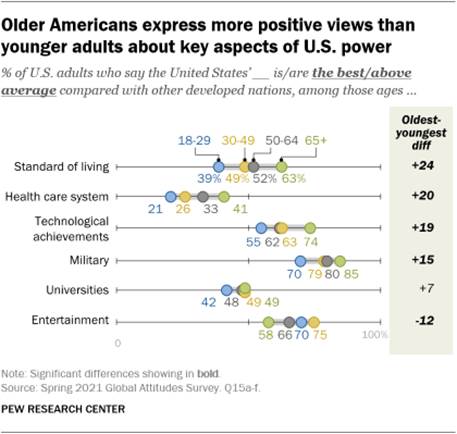
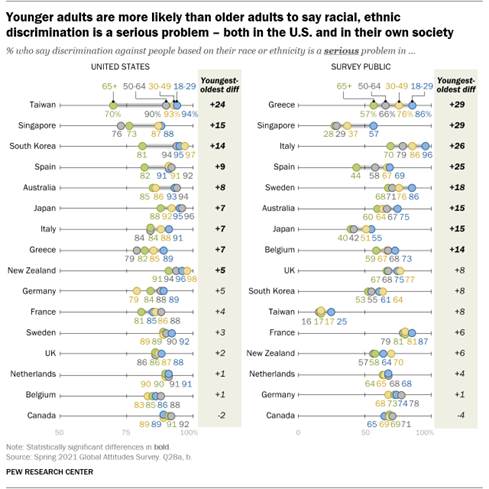
in the world. Views differ by age, income, party
affiliation
Younger people tend to evaluate America
more positively than older people in some of the advanced economies surveyed.
In the U.S., however, the opposite is often true: Older Americans, for
example, are more likely than younger adults to describe their nation’s
standard of living, health care system, military, technological achievements
and universities as above average. Younger Americans, however, are more
likely than older adults to see their country’s entertainment products
positively. Across many advanced economies surveyed,
people with higher incomes are more likely than those with lower incomes to
describe the U.S. as above average across nearly all dimensions asked about –
with the notable exceptions of the health care system and the overall
standard of living. In the U.S., however, higher-income people are more
likely than lower-income people to compliment America’s standard of living.
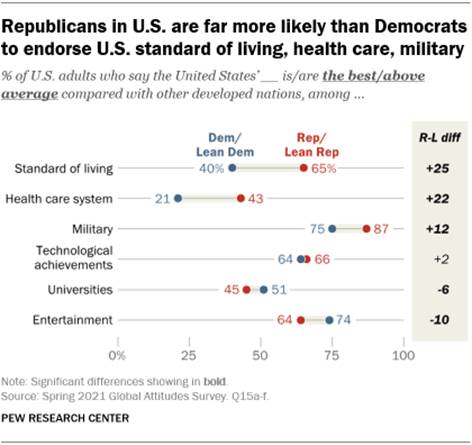
In the U.S., there are also stark partisan
and ideological differences in views about American power. Republicans and
independents who lean toward the Republican Party are more likely than
Democrats and Democratic leaners to describe America’s health care system,
standard of living and military as above average or better. The opposite is
true when it comes to universities and entertainment. (PEW) NOVEMBER 1, 2021 SUMMARY
OF POLLS
ASIA (India) State Bank Of India Leads The Purchase Funnel Rankings In
The Banking List With A Score Of 46.2 In India, State Bank of India leads the
purchase funnel rankings in the banking list with a score of 46.2. The second
and the third spots are taken by HDFC Bank and ICICI Bank with scores of 34.7
and 29.6 respectively. Similarly, Life insurance corporation of India, SBI
life insurance and ICICI Prudential life insurance take the first three spots
in the Life insurance list. In the general insurance list, SBI general
insurance, HDFC ERGO general insurance and ICICI Lombard take the first three
spots. (YouGov India) (Turkey) 4 Out Of 10 People Say They Will Get The Turkovac Vaccine
When Ready To Use 4 out of 10 people say they will get the
Turkovac vaccine when it is ready for use. While 37% of the society states
that they will have the Turkovac vaccine, whose 3rd phase studies are
ongoing, when it is ready for use, only 1 out of every 5 people states that
they will not have it for the time being. The rate of those who are undecided
about whether to have the Turkovac vaccine is 42%. As expected, those who do
not have the Covid-19 vaccine are also negative about getting the Turkovac
vaccine. (Ipsos Turkey) 1 November 2021 62% Of The Society Feels Like They Have Lost Their Social
Circle Individuals who find themselves in a
changing social life with the epidemic seem to be adversely affected in this
respect. 6 out of 10 people state that they feel like they have lost their
social circle due to the coronavirus epidemic, and 7 out of 10 people state
that their life has become monotonous due to this epidemic. (Ipsos Turkey) 8 November 2021 (Pakistan) Population Density Increases By A Sweeping 57% Between 1998
And 2017, From 166 Persons Per Sq. Km In 1998 To 261 Persons In 2017 Overall Population Density (by
administrative units) of Pakistan in 2017 revealed to be around 261 persons
per square kilometer. Population density is typically defined as the number
of persons per square kilometer. In the year 2017, when the census was
conducted, the population density of Pakistan was around 261 persons per
square kilometer. Comparison with 1998 Census shows that Pakistan’s population
density in 2017 has increased by around 57% since 1998. (Gallup Pakistan) November 1, 2021 The Overall Electricity Availability To The
Housing Units All Over The Country Has Increased By 17.41% Over The Last Two
Decades Overall Electricity Availability: The
overall electricity availability to the housing units all over the country
has increased by 17.41% over the last two decades (electricity was available
to 70.46% of the housing units in 1998 and 87.87% of the housing units in
2017). Electricity is one of the major sources of lighting or energy across
Pakistan. According to the 2017 Census, electricity was available to 87.87%
of the housing units all over the country as compared to 70.46% of the
housing units in 1998 Census, indicating an increase of 17.41%. Figure 1 –
Overall Electricity Availability in 1998 and 2017 (per housing units) (Gallup Pakistan) November 11, 2021 AFRICA (Nigeria) 53 Percent Nigerians Were Certain They Would Come Out And
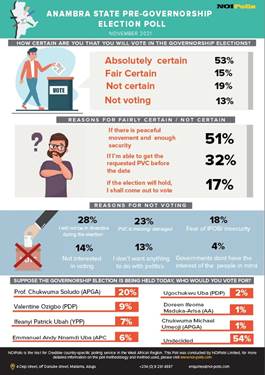
Vote For The Gubernatorial Candidate Of Their Choice The poll was conducted between 7th and 12th
October 2021, and it sought to assess the preparedness of voters towards the
forthcoming Governorship election in Anambra state. From the results of 500
randomly selected legible voters across all the LGA in Anambra state and
interviewed via telephone: Professor Chukwuma Soludo polled 20 percent;
Valentine Ozigbo polled 9 percent; Ifeanyi Patrick Ubah of YPP (7 percent);
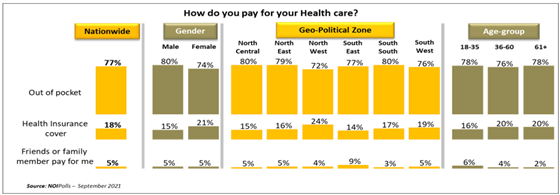
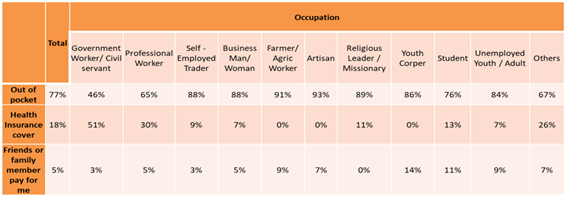
and Andy Nnamdi Uba of APC (6 percent) amongst other candidates. (NOI Polls) November 2, 2021 8 In 10 Adult Nigerians Have No Health Insurance Cover A new public opinion poll conducted by
NOIPolls has revealed that almost 8 in 10 Nigerians (77 percent) do not have
health insurance cover. Further analysis by occupation revealed that artisans
(93 percent), farmers and agricultural workers (91 percent), religious
leaders (89 percent), self-employed traders (88 percent), businessmen and
women (88 percent), Youth corps members (86 percent) and unemployed (84
percent) are among households and individuals that are paying out-of-pocket
and incurring catastrophic health expenditure to access healthcare services
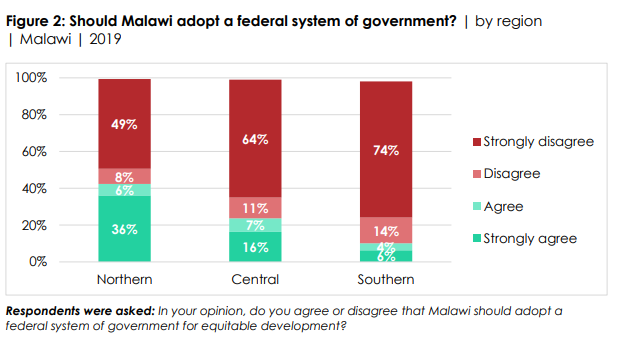
in the country. (NOI Polls) November 9, 2021 (Malawi) 51% Of Malawians Say There Are More Factors That Divide
Them Than Unite Them As A People Malawians widely (78%) reject a proposed
change to adopt a federal system of government as a way to guarantee
equitable distribution of development resources. Although there are
significant differences across regions (Figure 2) and party affiliations,
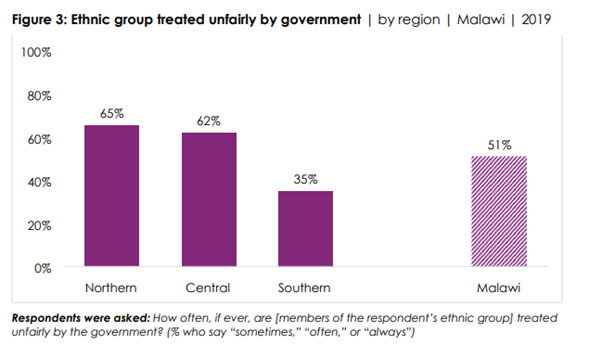
majority opposition to the proposal cuts across these divides. Half (51%) of
Malawians say their ethnic groups are “sometimes,” “often,” or “always”
treated unfairly by the government – a perception that is considerably more
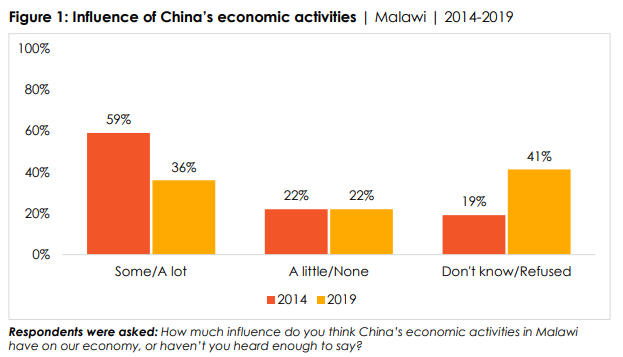
common in the North (65%) and Centre (62%) than in the South (35%). (Afrobarometer) 04 November 2021 Only About One In Three Malawians (36%)
Think That China’s Economic Activities Have “Some” Or “A Lot Of” Influence On
Malawi’s Economy Only about one in three Malawians (36%)
think that China’s economic activities have “some” or “a lot of” influence on
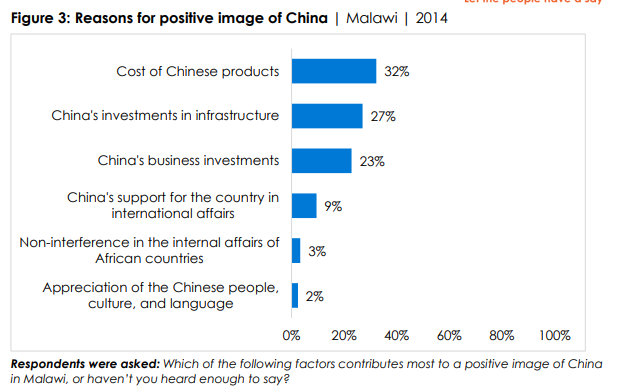
Malawi’s economy, a decline from 59% in 2014. According to Afrobarometer’s
2014 survey, China’s low-cost products and its infrastructure and business
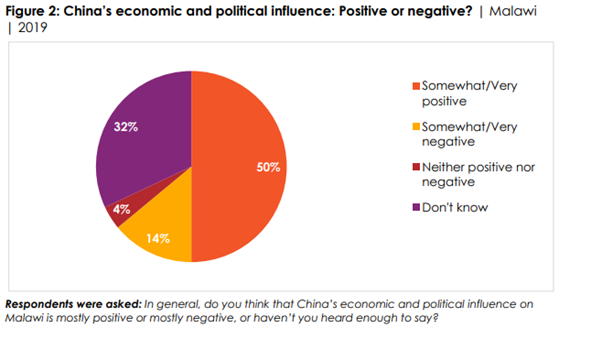
investments are the main drivers of positive perceptions. Half (50%) of
Malawians see China’s economic and political influence in their country as
positive; one in seven (14%) think it is negative. (Afrobarometer) 04 November 2021 (South
Africa) Less Than A Fifth (18%) Of Adult South Africans Indicated
That They Think The Country Is Going In The Right Direction The local government election, which took
place during a pandemic, was different from previous elections in many ways,
however, it is interesting that the issues of voters are very similar to
issues they brought to the fore on earlier occasions. Without a doubt the
non-delivery on these issues contributed to the low election turnout
(probably the lowest ever) and the relatively muted performance of the three
biggest political parties in the country. For the first time since
1994, ANC support on a countrywide basis will
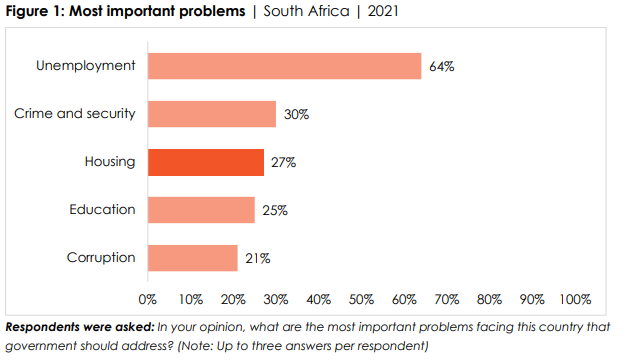
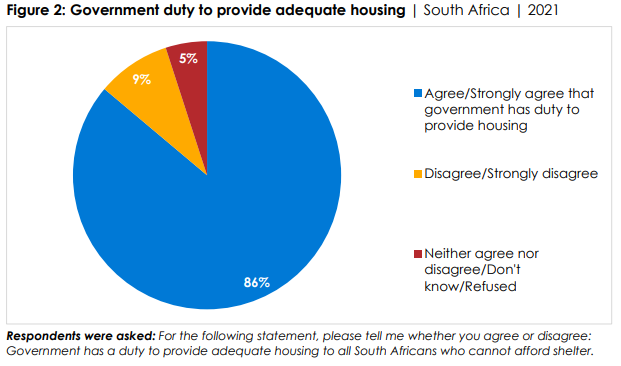
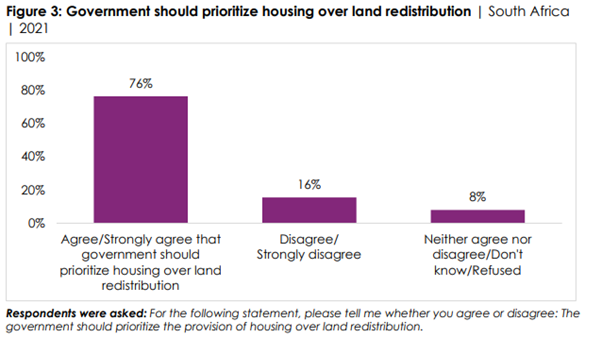
fall under 50% - as predicted early on in the eNCA/Ipsos pre-election study. (Ipsos South Africa) 4 November 2021 Three-Fourths (76%) Of South Africans Say The Government
Should Prioritize The Provision Of Adequate Housing Over Land Redistribution An overwhelming majority (86%) of citizens
say the government has a duty to provide adequate housing for South Africans
who cannot afford shelter (Figure 2). More than half (55%) of respondents
feel “strongly” about this issue. Three-fourths (76%) of South Africans say
the government should prioritize the provision of adequate housing over land
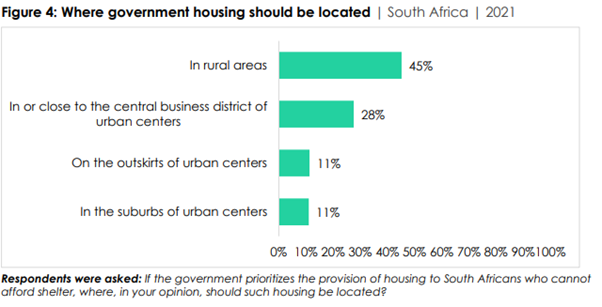
redistribution. If the government provides housing for citizens who cannot
afford shelter, almost half (45%) of respondents say such housing should be
built in rural areas. But even more would place such housing in or near
central business districts (28%), on the outskirts of urban centers (11%), or
in the suburbs (11%). (Afrobarometer) 9 November 2021 WEST
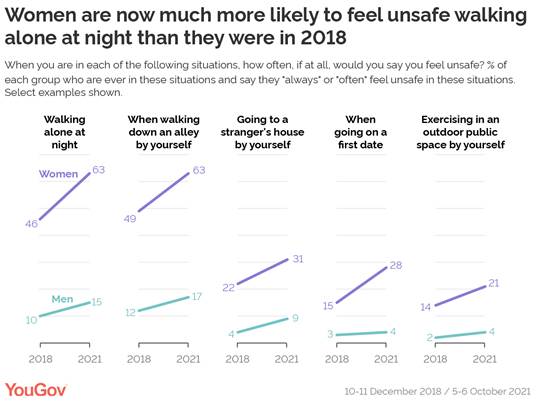
EUROPE (UK) Women Feel Less Safe Walking Home Alone At Night Than In
2018 YouGov asked Britons how often they felt
unsafe in a variety of situations. A repeat of that survey now shows that
women are more likely to feel unsafe than they were in 2018, particularly
when it comes to walking alone at night. Approaching two thirds of women who
ever walk alone outdoors at night say they “always” or “often” feel unsafe
when doing so. This is an increase of 17pts from 46% who said the same three
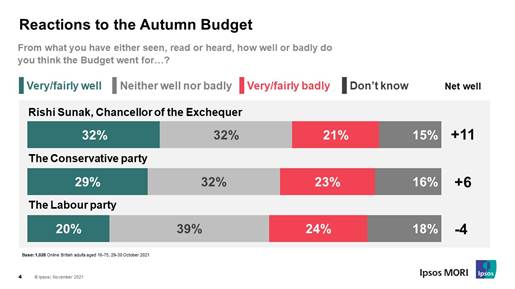
years ago. (YouGov UK) November 01, 2021 Polling About Rishi Sunak’s Recent Budget Shows Two In Five
Think It Will Be A Good Thing For People On High Incomes (38%) Ipsos MORI’s latest online polling about
Rishi Sunak’s recent Budget shows two in five think it will be a good thing
for people on high incomes (38%), and a third that it will help big
businesses (35%). On the other hand, a third or more believe it will have a
negative impact on pensioners (34%) and people on middle (34%) or low incomes
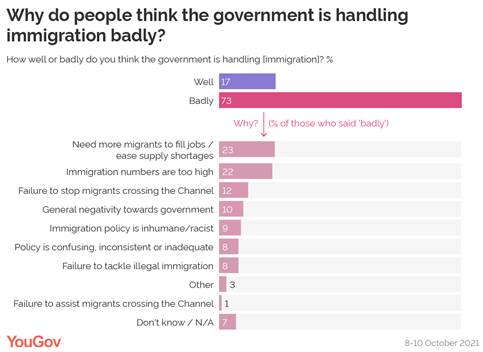
(39% - although 28% also believe it will be good for the least well-off). (Ipsos MENA) 3 November 2021 Around Half Of Britons (50%) Say Migrant Numbers Over The Last 10 Years Have Been Too High According to YouGov’s ‘most important
issues’ tracker, immigration is once again among the top priority issues for
the British public. Currently, 23% of Brits have ‘immigration and asylum’
in their top three most important issues facing the country today. This
reached as high as 35% in August (overtaking the environment in the process),
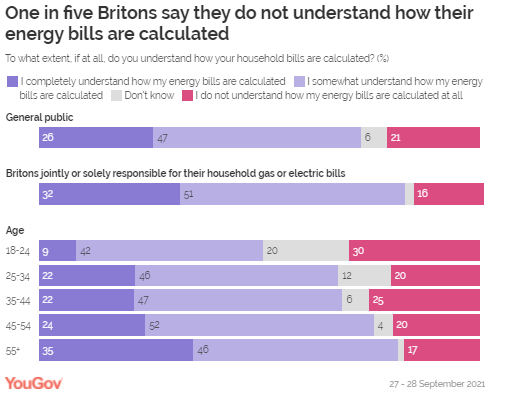
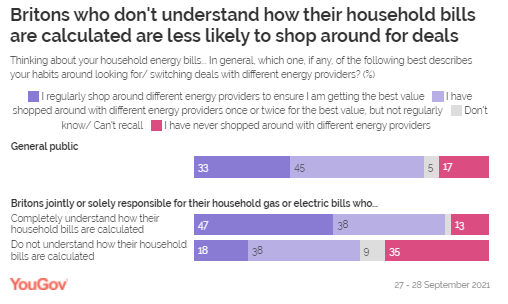
while in February this year the figure was as low as 15%. (YouGov UK) November 03, 2021 Only Half (51%) Of People Who Pay Their Household’s Energy
Bills Know What The Energy Price Cap Is Between gas and electric, tariffs and meter
types, energy bills can be confusing. So confusing that only one-quarter of
Britons (26%) say they “completely understand” how they are calculated,
although 47% say they have some understanding. A fifth (21%), however, say
they do not understand how the bills are calculated at all. However, among
Britons who are responsible for their bills and regularly shop around for deals on their energy,
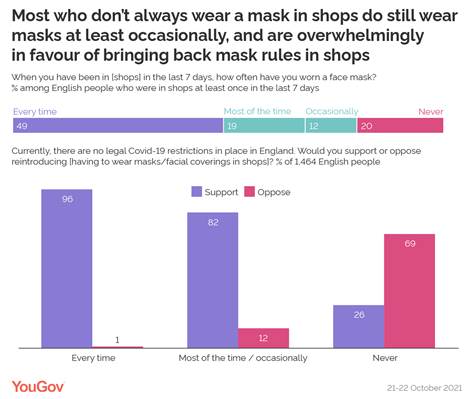
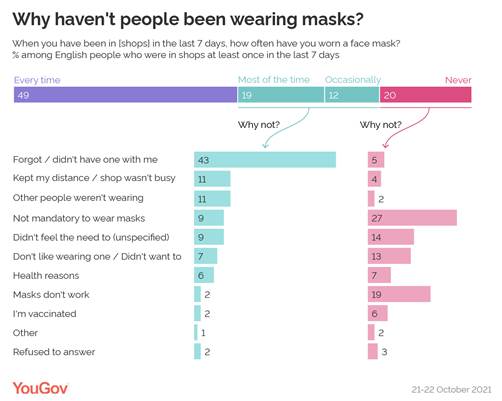
45% say they fully understand how the bills are calculated. (YouGov UK) November 03, 2021 76% Of People In England Say They Would Support A Policy
Enforcing Masks Being Worn In Shops YouGov polling last week found that the
public would be receptive to such a change, with 76% of people in England
saying they would support a policy enforcing masks being worn in shops. Yet
when we ask about actual mask wearing, we find that, for instance, only half
(49%) of English people who went to a shop in the preceding week say they
wore a mask on every occasion. The first place to look is at the frequency of
mask wearing. While 51% of the public did not wear a mask every time they visited a shop,
just 20% never did
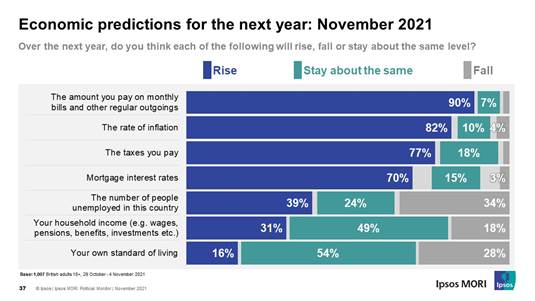
so. (YouGov UK) November 09, 2021 Just Over Half Of Britons (54%) Believe That Their
Standard Of Living Will Remain The Same Over The Next Year Ipsos MORI’s latest Political Monitor shows
there are clear concerns for the public when it comes to the cost of living,
with 9 in 10 expecting their monthly bills and other regular outgoings to
rise next year (and over half thinking they will rise a lot), around 8
in 10 believing inflation will rise and similar for the taxes they pay, and 7
in 10 saying mortgage interest rates will rise. Overall, just over half of
Britons (54%) believe that their standard of living will remain the same over
the next year, while 16% think it will rise and 28% expect it to fall. This
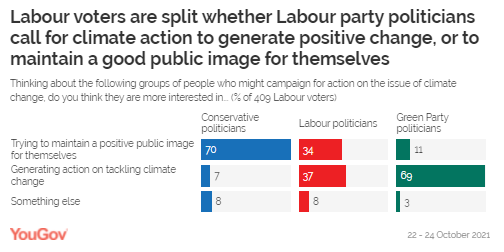
is a similar picture to 2012, but more pessimistic than 2013-2015. (Ipsos MORI) 10 November 2021 Public Thinks That Tory Politicians Are More Interested In
Maintaining A Good Image For Themselves (56%) Rather Than Generating Action
On Climate Change A YouGov survey last month found that the general public was
highly sceptical of politicians - only 13% thought those who call for action
on the climate crisis are doing so out of a desire to see progress, while 68%
thought they were doing it for a PR boost. A new survey asked Britons the
same question, but specifically for Conservative, Labour, and Green Party
politicians. Overall, the public thinks that Tory politicians are more
interested in maintaining a good image for themselves (56%) rather than
generating action on climate change. Another 45% think the same of Labour
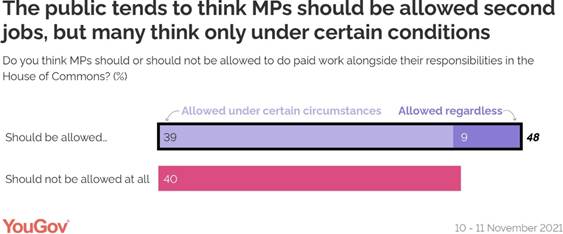
politicians. (YouGov UK) November 10, 2021 Two Fifths Of The Public (40%) Think Second Jobs Should Not
Be Allowed At All Boris
Johnson was probably expecting to spend the last few days
reaping the political rewards of the COP-26 climate
conference. Instead, his government is embroiled in
scandal, including a controversial vote on rules around MPs’ conduct, undeclared second jobs, and a Conservative MP working thousands of
miles away from their constituency. Despite this fallout, the public is
still generally in favour of allowing MPs to hold second
jobs (48%). However, this is mostly formed of people
who think such jobs should be allowed only under certain circumstances
(39%), with just 9% who think they should allowed without
restriction. (YouGov UK) November 12, 2021 (France) 48% Of 10-15 Year Olds Put Climate Change At The Top Of
Their Fears For The Future For the majority of them, childhood and
entering adolescence is not a source of carelessness and hope. More than 1 in
2 young people say that the world of tomorrow will be worse off than it is
today. Young girls are more pessimistic (59% against 54% for young boys).
Even more worrying, those under 10-12 are almost as pessimistic as the older
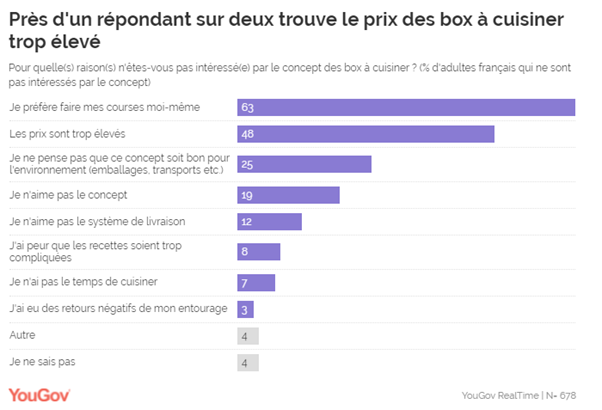
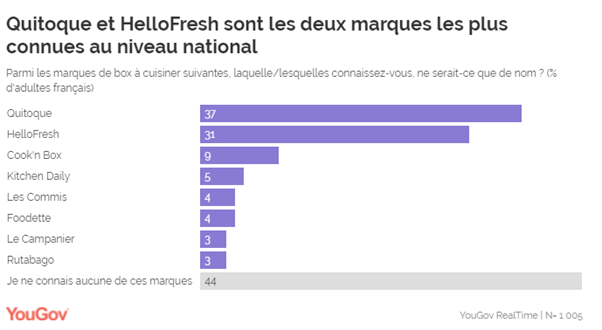
ones (54% against 58% of 13-15 year olds). (Ipsos France) 8 November 2021 7 Out Of 10 French People Consider Themselves To Be Good
Cooks (70%) 7 out of 10 French people consider
themselves to be good cooks (70%). Conversely, 25% consider themselves to be
bad, a figure drawn on the rise by men (33%).In addition, while 70% of the
French population say they like to cook (74% of women vs. 64% of men), 1 in 3
people say they rarely have the time to do so (33%). Note: young people are
those who lack the most time (50% of 18-34 year olds). In addition, more than
half of respondents say that they often lack inspiration when preparing the
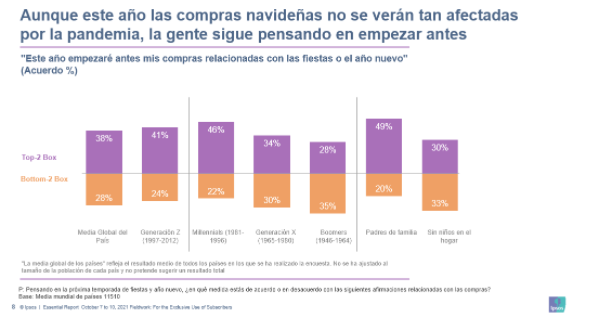
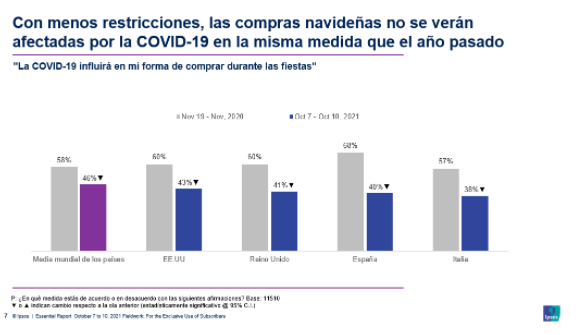
meal (54%), a figure once again pulled up by 18-34 year olds (66%). (YouGov France) (Spain) Despite An Increasingly Obvious Return To Normalcy, 40% Of
Spanish Citizens Still Say That The Pandemic Will Impact The Way They Buy
These Holidays Globally, on average, 61% of respondents
say they have faced a challenge in the purchases they have made recently,
placing the price first, 23% say they have perceived an increase in prices in
recent weeks. Second, we find the lack of stock of some products, mentioned
by 20%, followed by issues such as queues too long to pay in physical stores
(16%) and even something more typical of the pandemic such as feeling
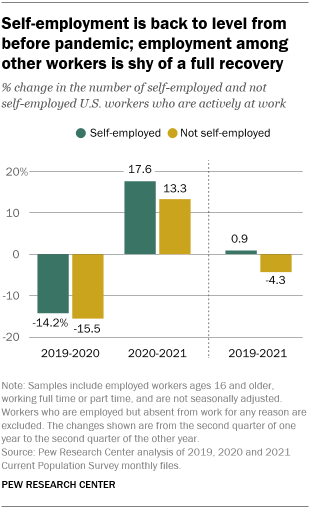
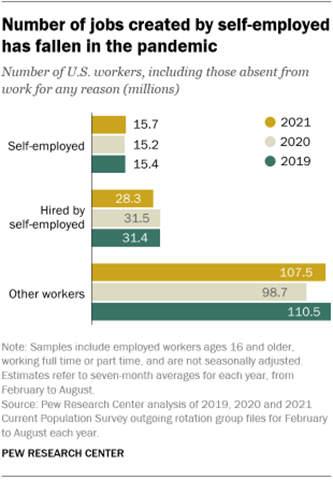
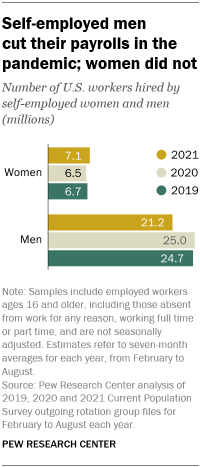
insecure in stores due to lack of social distance (12%). (Ipsos Spain) 2 November 2021 NORTH AMERICA (USA) The Self-Employed Are Back At Work In Pre-Covid-19 Numbers,
But Their Businesses Have Smaller Payrolls The more than 150 million workers in the
United States include about 16 million workers who identify as self-employed.
They work for profit or fees in their own enterprises and are a representation of America’s small business owners.
Many also create jobs for other workers, on the order of about 30 million in
recent years. A new Pew Research Center analysis of government data finds that
the COVID-19 recession, which curtailed business operations for
public health reasons, had a similar impact on employment levels among both
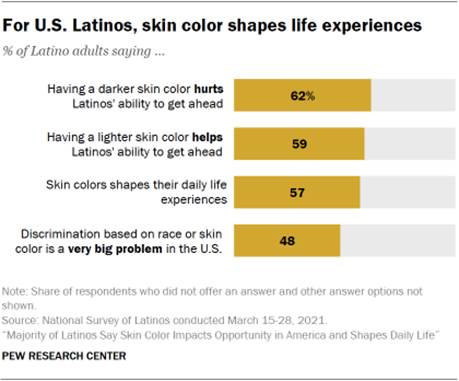
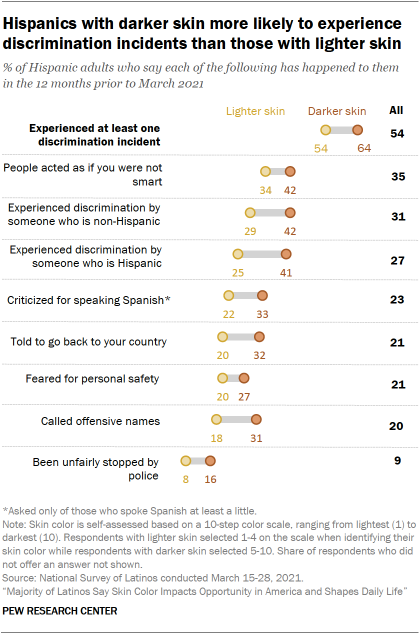
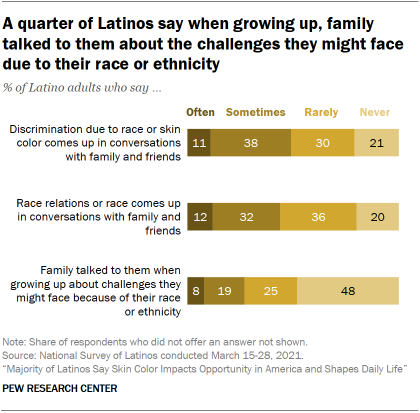
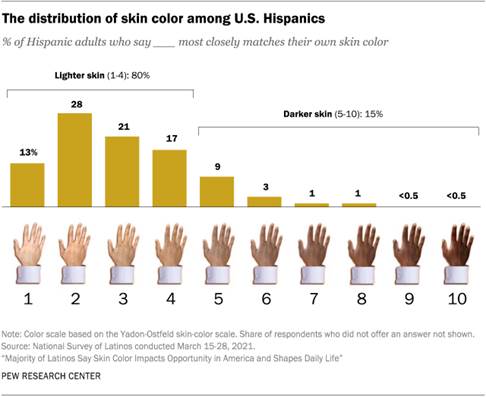
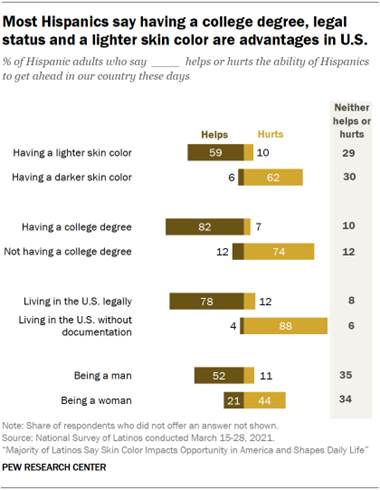
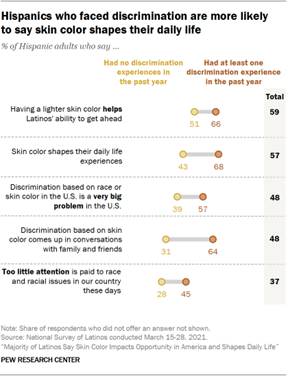
those who are and are not self-employed. (PEW) NOVEMBER 3, 2021 A Majority (62%) Of Hispanic Adults Say Having A Darker
Skin Color Hurts Hispanics’ Ability To Get Ahead In The United States Today
At Least A Little A majority (62%) of Hispanic adults say
having a darker skin color hurts Hispanics’ ability to get ahead in the
United States today at least a little. A similar share (59%) say having a
lighter skin color helps Hispanics get ahead. And 57% say skin color shapes
their daily life experiences a lot or some, with about half saying
discrimination based on race or skin color is a “very big problem” in the
U.S. today, according to Pew Research Center’s National Survey of Latinos, a
bilingual, national survey of 3,375 Hispanic U.S. adults conducted in March
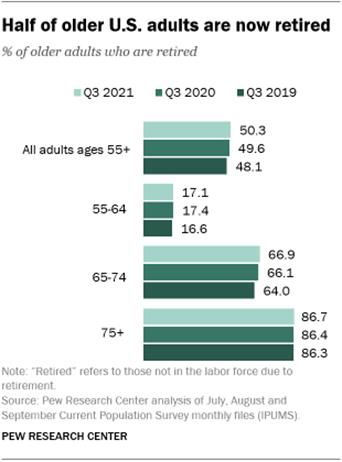
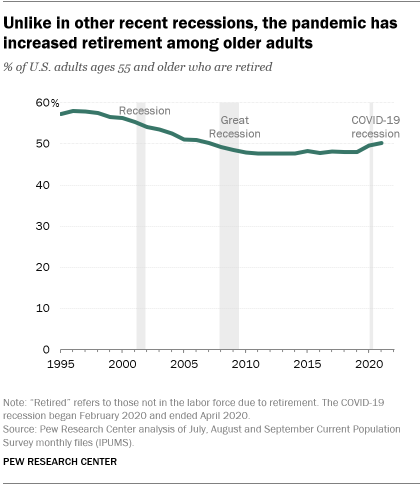
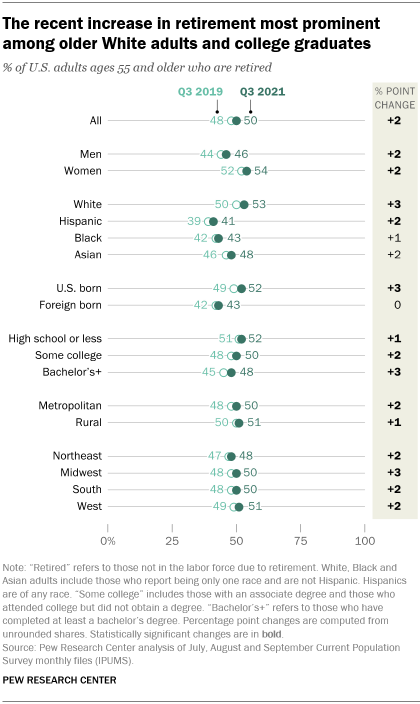
2021. (PEW) NOVEMBER 4, 2021 Amid The Pandemic, A Rising Share Of Older U S Adults Are
Now Retired As of the third quarter of 2021, 50.3% of
U.S. adults 55 and older said they were out of the labor force due to
retirement, according to a Pew Research Center analysis of the most recent
official labor force data. In the third quarter of 2019, before the onset of the
pandemic, 48.1% of those adults were retired. In regard to specific age
groups, in the third quarter of 2021 66.9% of 65- to 74-year-olds were
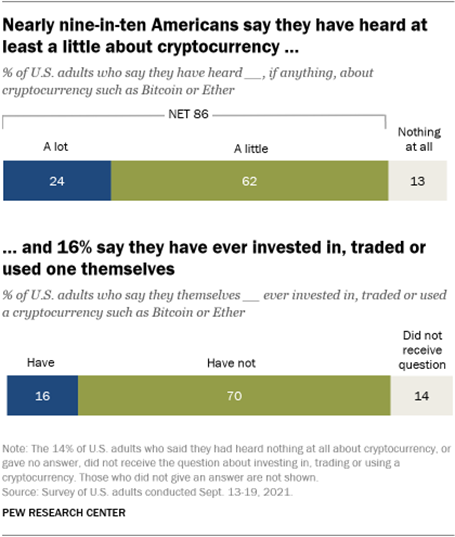
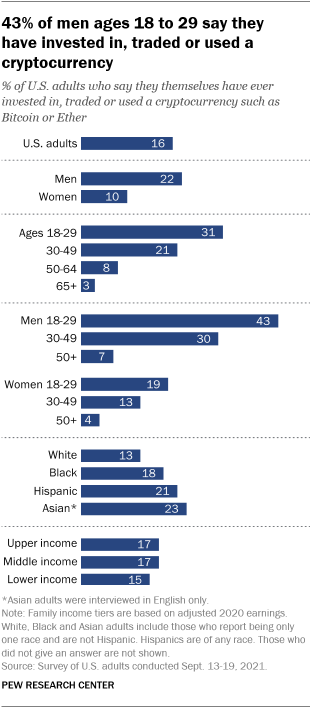
retired, compared with 64.0% in the same quarter of 2019. (PEW) NOVEMBER 4, 2021 16% Of Americans Say They Have Ever Invested In, Traded Or
Used Cryptocurrency The vast majority of U.S. adults have heard
at least a little about cryptocurrencies like Bitcoin or Ether, and 16% say
they personally have invested in, traded or otherwise used one, according to
a new Pew Research Center survey. Men ages 18 to 29 are particularly likely
to say they have used cryptocurrencies. Overall, 86% of Americans say they
have heard at least a little about cryptocurrencies, including 24% who say
they have heard a lot about them, according to the survey of U.S. adults,
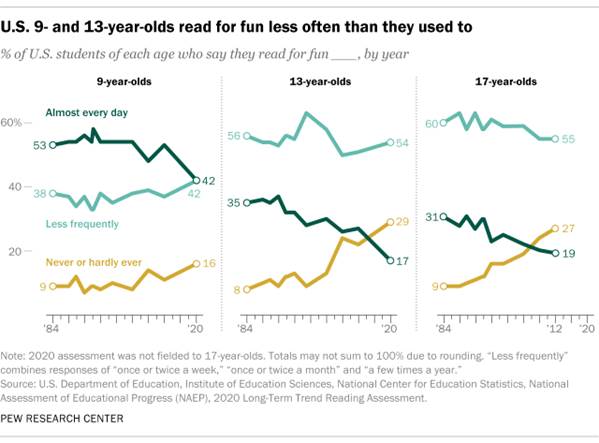
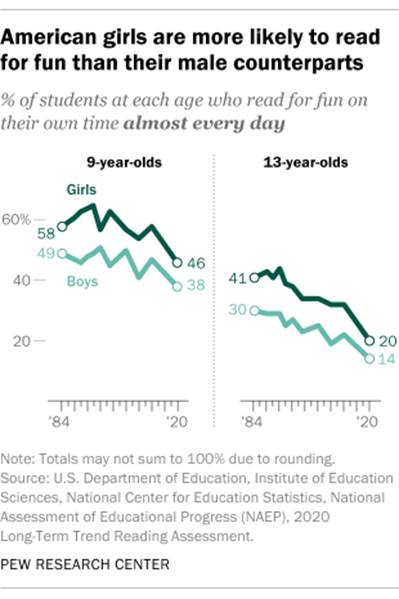
conducted Sept. 13-19, 2021. Some 13% say they have heard nothing at all. (PEW) NOVEMBER 11, 2021 Among 9-Year-Old Students, Around Four-In-Ten (42%) Said In
2020 That They Read For Fun Almost Every Day, Down From 53% In Both 2012 And
1984 Among both age groups, the percentages who
said in the 2019-20 school year that they “read for fun on [their] own time
almost every day” were at their lowest points since the question was first
asked in 1984, according to the survey, which was fielded among U.S. public and private
school students before
the COVID-19 outbreak. It is unclear whether the pandemic may
have changed these patterns. Among 9-year-old students, around four-in-ten
(42%) said in 2020 that they read for fun almost every day, down from 53% in
both 2012 and 1984. (PEW) NOVEMBER 12, 2021 (Canada) About Three-Quarters (74%) Of Canadians Visited A Social
Networking Site In 2021, Up From 69% In 2020 Social media and influencer marketing are
expected to play larger roles in marketing plans as part of a
pandemic-accelerated shift to digital, with a net 70% of marketers estimating
increased spend on social in 2022, according to the 15th annual Digital
Marketing Pulse Survey released today by Ipsos Canada, the Canadian Marketing
Association and strategy.
More than nine in 10 (93%) marketers and agencies say they use social tactics
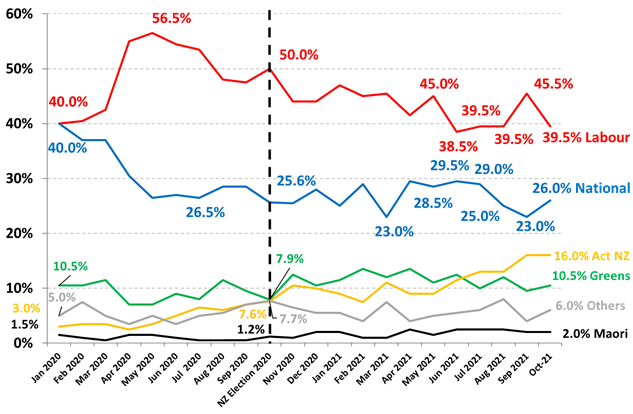
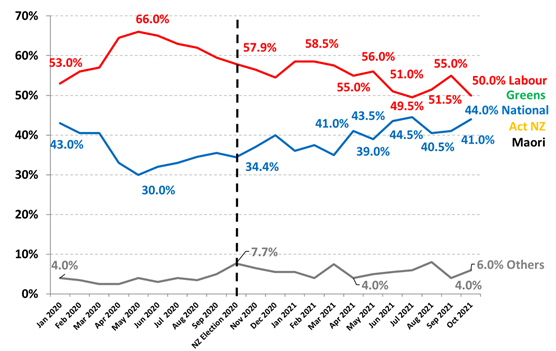
always or often, even as people resume pre-pandemic behaviors. (Ipsos Canada) 2 November 2021 AUSTRALIA (New Zealand) Support For New Zealand’s Labour/Greens Government Was Down
5% Points To 50% In October As Support For The Labour Party Dropped 6% Points
To 39.5% The governing parties are now only 6%
points ahead of the Parliamentary opposition National/Act NZ/ Maori Party on
44%, up 3% points since September. The increase was driven by a rise in
support for National, up by 3% points to 26%. Act NZ was unchanged at a
record high of 16% and support for the Maori Party was unchanged at 2%.A
small minority of 6% of electors support other minor parties outside
Parliament with support for New Zealand First up 1% point to 2.5%, The
Opportunities Party down 0.5% points to 1% and support for the New
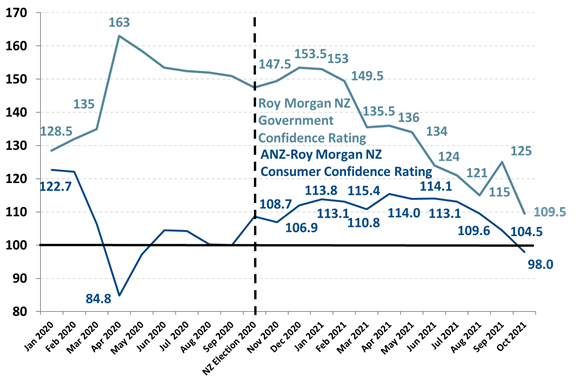
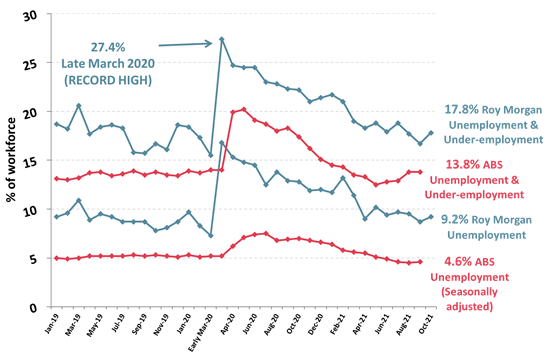
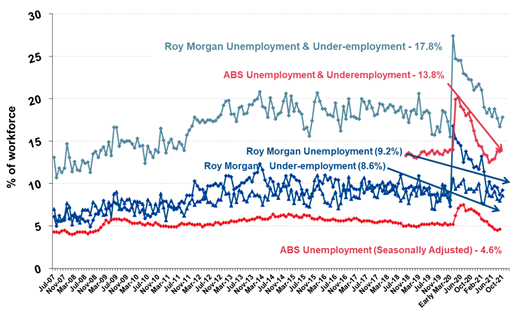
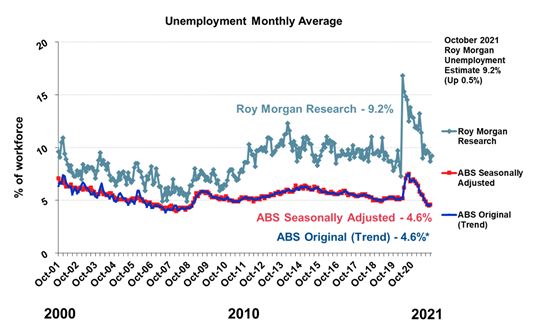
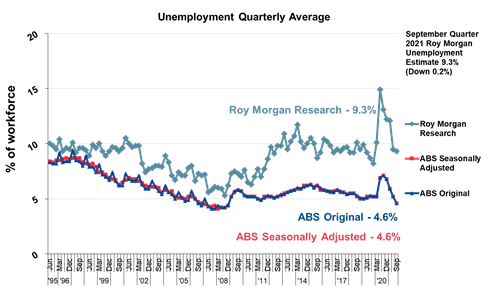
Conservative Party is at 1.5% in October. (Roy Morgan) November 01 2021 (Australia) Australian Unemployment Increases To 9.2% In October – As
Over 12 Million Australians Are Released From Long Lockdowns The workforce in October was 14,339,000
(down 234,000) – comprised of 13,019,000 employed Australians (a decrease of
289,000) and 1,320,000 unemployed Australians looking for work (up 55,000).
Australian employment dropped 289,000 to 13,019,000 in October driven by the
decrease in part-time employment, down 379,000 to 4,281,000, the lowest for
over a year since August 2020. In contrast, full-time employment increased by
90,000 in October to 8,738,000. (Roy Morgan) November 08 2021 MULTICOUNTRY STUDIES Nearly Three Quarters (72%) Of The Scottish Public Believe
That The Uk Is Already Feeling The Effects Of Climate Change, Compared With
67% Of The Uk Public New analysis from two surveys by Ipsos MORI
and the Climate Engagement Partnership, a collaboration between Ipsos MORI
and the Centre for Climate Change and Social Transformations (CAST), shows
that Scots are even more supportive of climate justice than our neighbours
south of the border are. Seven in 10 Scots (70%) say it is right that
developed countries who have contributed most to the climate emergency by
producing the most carbon emissions should pay more to solve the problem, and
only 13% disagree. Support for this is even higher in Scotland than it is in
the UK overall, where 63% agree. (Ipsos MORI) 1 November 2021 No More Than Three-In-Ten
Adults See The U S Military As The Best In The World: Survey Findings From 17
Advanced Economies Americans
don’t always see eye to eye with people in other societies over various
dimensions of U.S. “hard” and “soft” power, according to a February Pew
Research Center survey of the United States and 16 other advanced economies.
While Americans see some aspects of U.S. power more positively than people
elsewhere, they offer more negative views in other areas. (PEW) NOVEMBER 1,
2021 A Survey Of 17 Advanced Economies Highlights The Complexity
Of America’s International Image When asked to compare American
technological innovations with those of other developed nations, respondents
give the home of Silicon Valley favorable reviews. Across the 16 publics
polled outside of the U.S., a median of 72% say U.S. technology is the best
or above average. The U.S. is, of course, also home to Hollywood, and most of
those surveyed give the U.S. high marks for its entertainment, such as
movies, music and television. A median of 71% think American entertainment is
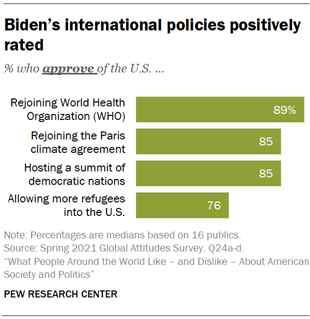
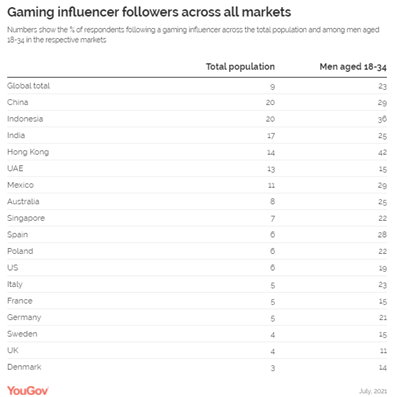
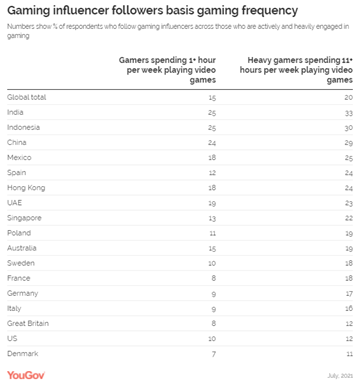
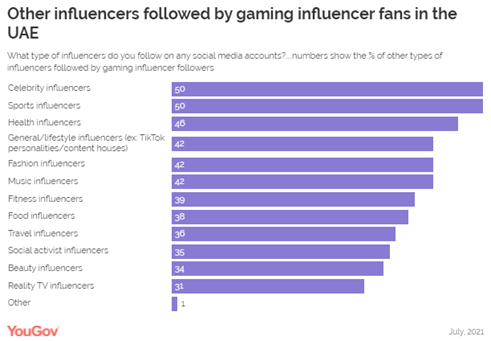
the best or above average. (PEW) NOVEMBER 1, 2021 Almost Half (43%) Of The Global Population Across 17
International Markets Surveyed Follow A Social Media Influencer Of Any
Type YouGov’s International
Gaming Report 2021 is a three-part series on the global
gaming influencer landscape. Part 1 sizes the gaming influencer
global fanbase across 17 international markets and reveals where
these influencer followers sit within the global influencer sector as a
whole. Data from the report shows that almost half (43%) of the global
population across 17 international markets surveyed follow a social media
influencer of any type, with UAE leading this space amongst all the
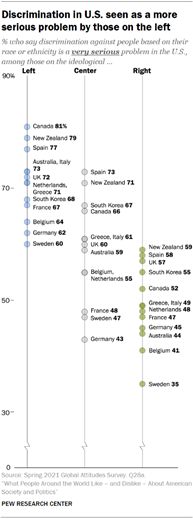
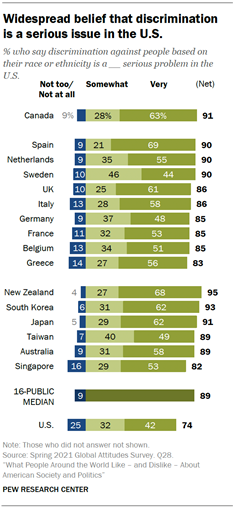
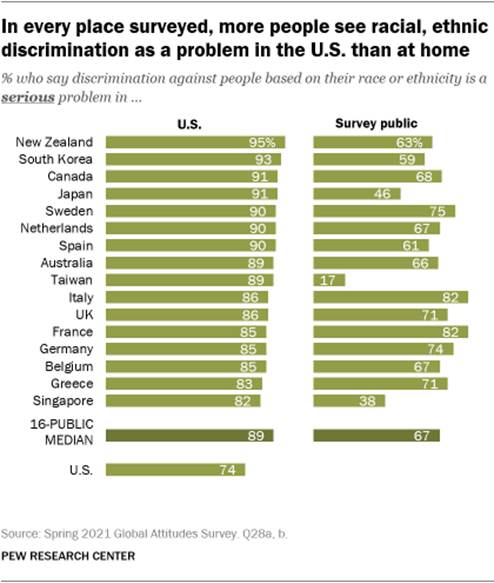
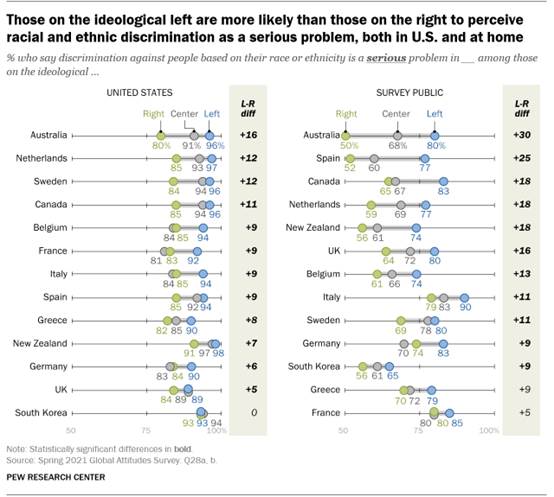
surveyed markets (at 75%). (YouGov MENA) Source: https://mena.yougov.com/en/news/2021/11/01/young-males-uae-are-most-likely-follow-gaming-infl/ A Median Of 89% Across The 16 Non U S Publics Surveyed
Describe Racial And Ethnic Discrimination In The U S As A Somewhat Or Very
Serious Problem Concerns about racial and ethnic
discrimination are widespread in most of the 17 advanced economies surveyed
by Pew Research Center this spring. Majorities of adults in 14 of these
places say discrimination on the basis of race or ethnicity is a somewhat or
very serious problem in their own society – including around three-quarters
or more in Italy, France, Sweden, Germany and the United States. Only in
Japan, Singapore and Taiwan do fewer than half say such discrimination is a
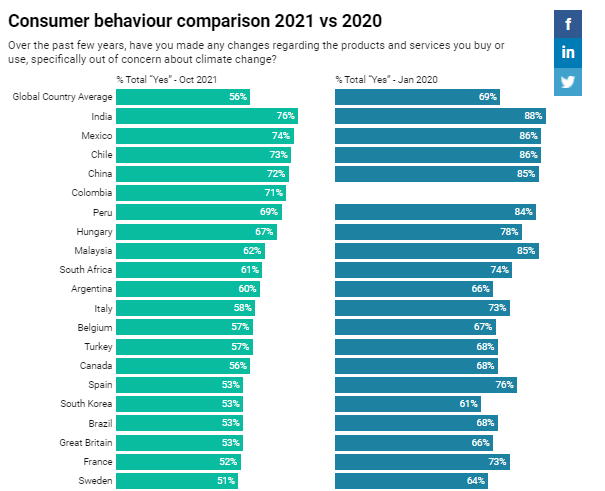
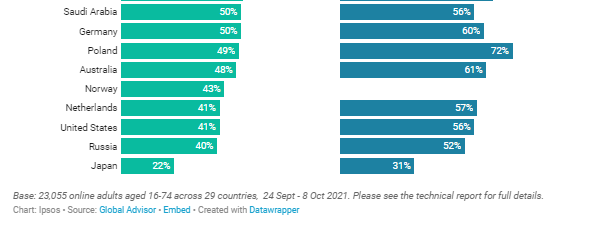
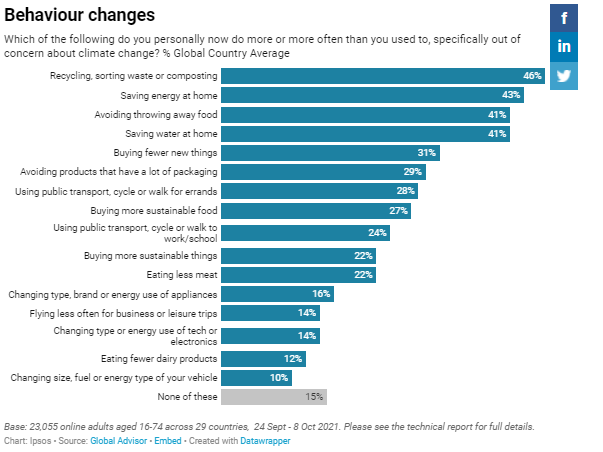
serious problem. (PEW) On Average, Across 29 Countries Over Half (56%) Say They
Have Modified Their Consumer Behaviour Out Of Concern About Climate Change On average, across 29 countries surveyed by
Ipsos in September and October 2021, over half (56%) say they have modified
their consumer behaviour out of concern about climate change over the past
few years. This is down from an average of 69% in January 2020, when an
identical question was asked in all but two of the 29 countries. On average
globally, fewer than one in five (17%) now say they have made a lot of
changes, two in five (39%) a few changes, and three in ten (31%) no changes
at all. (Ipsos Australia) 3 November 2021 Source: https://www.ipsos.com/en-au/climate-change-consumer-behaviour-2021 90% Of Brazilians Say That Many People Cannot Afford To Pay
For Good Quality Healthcare Global Health Service Monitor 2021 survey,
carried out by Ipsos with 30 nations, points out. Respondents from Brazil
showed widespread discontent with various aspects of access to the health
system, such as its economic implications. 90% of local respondents say that
many Brazilians cannot afford to pay for good quality healthcare. It is the
highest percentage among all the countries analyzed. The global average is
58%. In addition, 7 out of 10 Brazilians (71%) believe that the country's
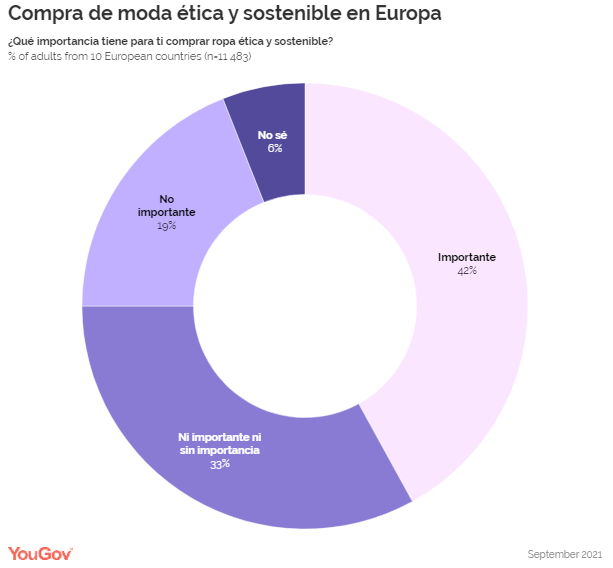
health system is overloaded. (Ipsos Brazil) 4 November 2021 Buying Sustainable Fashion Is Important For
2 Out Of 5 Europeans in 10 Countries According to the new European Fashion
Report 2021, the fashion industry ranks eighth among the sectors in which
sustainability is most important to consumers. 42% of consumers in 10
European countries say it is important for them to buy ethical and ecological
clothing. Italians (60%) and Spaniards (56%) are the ones who most agree with
this statement, while Danes and Norwegians are the ones who least agree (24%)
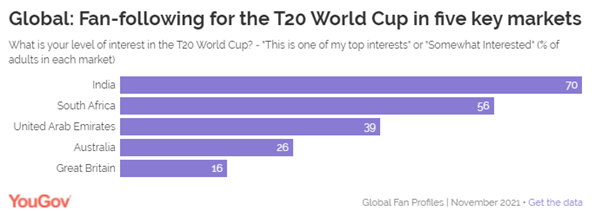
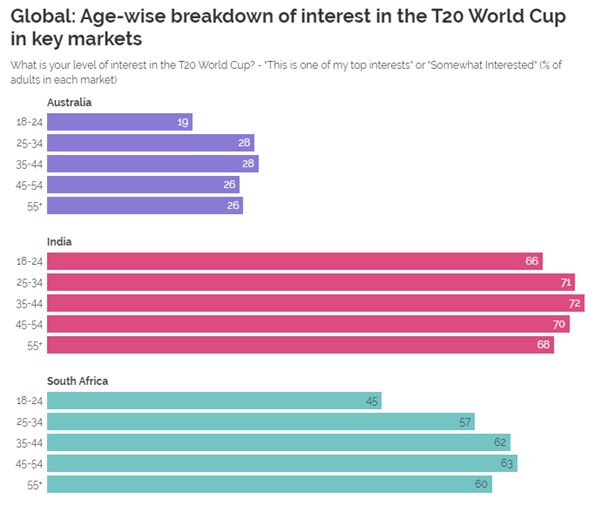
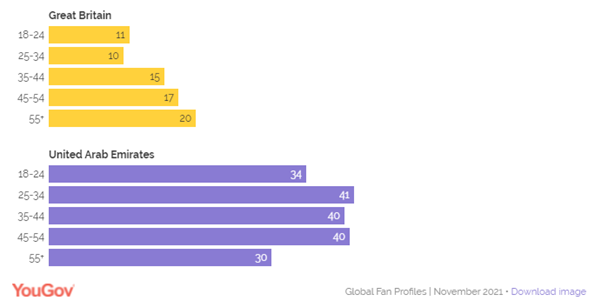
with this statement. (YouGov Spain) Source: https://es.yougov.com/news/2021/11/09/comprar-moda-sostenible-es-importante-para-cada-2-/ Global: Fan Interest In The T20 World Cup
In Five Key Markets Over half of South Africans also express
the same level of interest in the event (56%). UAE comes in third with two in
five consumers in the region (39%) stating their interest in the world event.
UAE surpassing more established cricket markets like Australia and Britain
could be partially explained by the huge population of South Asian expats in
the region – as well as its host status. It should come as no surprise that
India – one of the most cricket-crazy markets – leads the way. Seven in ten
consumers in urban India (70%) say that the T20 World Cup is one of their top
interests or that they are somewhat interested in the event. (YouGov Australia) November 10, 2021 Source: https://au.yougov.com/news/2021/11/10/global-fan-interest-t20-world-cup-five-key-markets/ Would You Be Willing To Eat Insects As Part
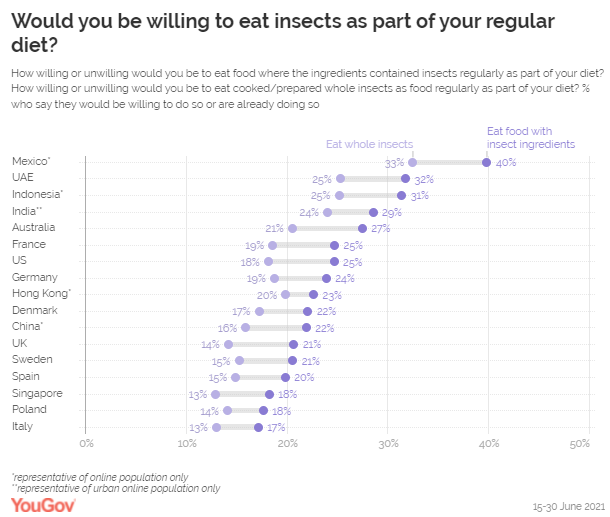
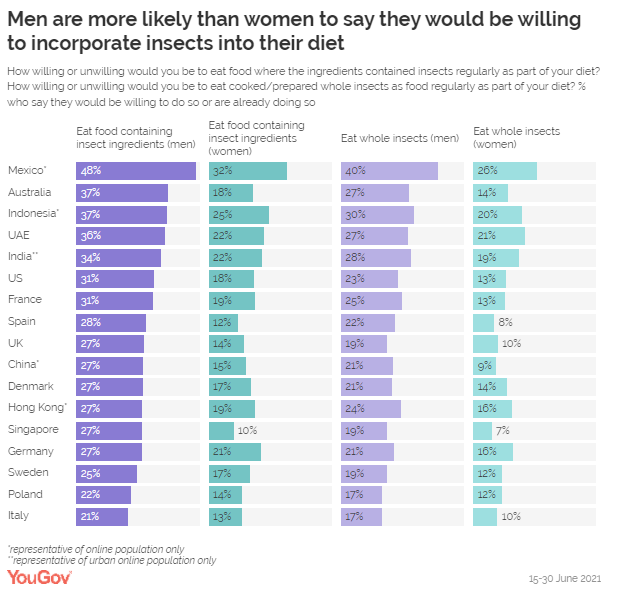
Of Your Regular Diet; Survey Conducted In 17 Countries YouGov survey conducted in 17 countries and
regions shows how many people might be willing to make the shift. Topping the
list are online Mexicans. Fully four in ten (40%) say they would be willing
to eat food with insect ingredients as part of their regular diet, or are
already doing so. Indeed, one in three (33%) say the same about eating whole
insects. There is a long history of insect-eating in Mexico, which is home
to more edible insect species than any other
country in the world. (YouGov Australia) Source: https://au.yougov.com/news/2021/11/05/one-five-australians-say-theyre-willing-eat-insect/ ASIA
715-716-43-01/Polls State Bank
Of India Leads The Purchase Funnel Rankings In The Banking List With A Score
Of 46.2
YouGov’s Finance Purchase Funnel Rankings
2021 reveal the financial services brands that are best at converting
consumers through the purchase funnel. The Rankings are based on the
Consideration score from YouGov BrandIndex among consumers who are Aware of
each brand, over a period of 12 months. This allows us to show which brands
are most successful at converting Aware consumers into ones that would consider
the brand when next in-market. In India, State Bank of India leads the
purchase funnel rankings in the banking list with a score of 46.2. The second
and the third spots are taken by HDFC Bank and ICICI Bank with scores of 34.7
and 29.6 respectively. Similarly, Life insurance corporation of India, SBI
life insurance and ICICI Prudential life insurance take the first three spots
in the Life insurance list. In the general insurance list, SBI general
insurance, HDFC ERGO general insurance and ICICI Lombard take the first three
spots. YouGov Finance Purchase Funnel
Rankings 2021 in India: Banks
YouGov Finance Purchase Funnel
Rankings 2021 in India: Life Insurance
YouGov Finance Purchase Funnel
Rankings 2021 in India: General Insurance
The chart shows the brands with the highest
Consideration score among the Aware audience between
September 1st, 2020 to August 31st, 2021. The rankings data is drawn from our daily
brand tracking tool BrandIndex, which continuously measures the public’s perception
of brands within the financial services sector around the globe. Want to know
more? To see your brand’s ranking please click here and one of our experts will be in
touch. (YouGov India) Source: https://in.yougov.com/en-hi/news/2021/11/08/yougov-finance-purchase-funnel-rankings-2021-india/ 715-716-43-02/Polls 4 Out Of 10
People Say They Will Get The Turkovac Vaccine When Ready To Use
4 out of 10 people say they will get the
Turkovac vaccine when it is ready for use While 37% of the society states that they
will have the Turkovac vaccine, whose 3rd phase studies are ongoing, when it
is ready for use, only 1 out of every 5 people states that they will not have
it for the time being. The rate of those who are undecided about whether to
have the Turkovac vaccine is 42%. As expected, those who do not have the
Covid-19 vaccine are also negative about getting the Turkovac vaccine.
In case of need to be vaccinated again, 52%
of the society say that they will prefer the Biontech vaccine. This rate is
57% among individuals with the Covid 19 vaccine. The rate of preference of
Turkovac vaccine among vaccinated people is 26%, as in total. 27% of
individuals who have not been vaccinated so far state that they would prefer
Turkovac if they need to be vaccinated. The preference rate of Biontech among
this audience is only 17%. According to the research carried out by
the Ipsos research company; 38% of the people who stated that they will not
have the flu vaccine this winter say that they are adequately protected due
to the epidemic, and 18% say that they do not leave their homes due to the
epidemic, so they think that the flu will not happen. The rate of those who
do not plan to have the flu vaccine is 36% because they are worried that
there will be a different interaction between the flu vaccine and this
vaccine because it is a Covid 19 vaccine.
34% of People Considering Getting Flu
Vaccine With the arrival of the winter months, only
34% of individuals are considering getting the flu vaccine. 44% do not
consider getting the flu vaccine. In unvaccinated people, this rate rises to
63%. The rate of those who have had at least one
flu vaccine in previous years is only 8% higher than the rate of those who
are considering getting a flu shot this year. Among individuals who have not
been vaccinated against Covid 19, the rate of those who have previously been
vaccinated against influenza is still very low (17%). Our country took its place in vaccine
development studies with the Turkovac vaccine. We investigated the public's
perspective on Turkovac, which is still in the testing phase. Approximately
four out of ten people said that they can have Turkovac if it is ready for
use. Those who clearly state that they will not have the Turkovac vaccine are
21%. In order for the vaccines to maintain their
protective properties, additional dose recommendations are made within the
framework of various rules. Additional doses are intended to compensate for the
decrease in antibody levels over time. When we questioned the additional dose
preferences in comparison with Biontech, the striking finding we encountered
was that Turkovac was preferred more than Biontech among the unvaccinated
population. Those who have been vaccinated stated that
they would prefer Biontech for possible additional doses. The confusion of
the population who has not yet been vaccinated and their attitude of staying
away from the vaccine continues. A quarter of this population states that
they will not be vaccinated from now on. As winter begins to show its effect and we
are all socializing more than last year, possible flu outbreaks are also on
the agenda. We cannot say that the advice of experts for the flu vaccine has
found a wide response in the society. Only one in three people considers
getting the flu shot. In the population that has not been vaccinated against
Covid-19, this rate drops to almost one in seven. A significant part of those
who do not want to be vaccinated against the flu find it unnecessary because
they think that the effort to protect against Covid-19 will also protect them
from the flu. Another large group is concerned that the flu vaccine might
have a different effect because they have the Covid-19 vaccine. Influenza
vaccine is a method of protection that the majority of the society did not
apply in the past. Especially among those who have not been vaccinated
against Covid-19, the rate of those who have had the flu vaccine at least
once in the past is only 17%. Another indication that this segment prefers to
stay away from vaccines. Whatever it is, those who are fundamentally opposed
to the vaccine are only 6%. It is hopeful information for us to reach the
level of herd immunity. (Ipsos Turkey) 1 November 2021 715-716-43-03/Polls 62% Of The
Society Feels Like They Have Lost Their Social Circle
Social Lives of People Have Also Been
Negatively Affected During the Pandemic Period Individuals who find themselves in a
changing social life with the epidemic seem to be adversely affected in this
respect. 6 out of 10 people state that they feel like they have lost their
social circle due to the coronavirus epidemic, and 7 out of 10 people state
that their life has become monotonous due to this epidemic. Although the level of concern
has increased due to the number of cases, it is thought that the social
distance rule is no longer followed, although it is not thought very
positively about the course of the struggle. Half of the individuals say that
other people do not follow social distance at all, and 26% say that they
rarely do. Although it is seen that they are a little more cautious about
wearing masks, it is still thought that 46% of the society wear masks either
at all or rarely. Ipsos Research Company; The fact
that the number of cases and deaths in our country has not decreased for a
long time in the coronavirus epidemic negatively affects the level of anxiety
of the society. While only 8% of individuals state that the number of cases
does not affect their level of anxiety, 46% say that their anxiety has
increased. On the other hand, 34% say that they are always worried. While 33% of the society thinks
that the course of the fight against the coronavirus is going well, the rate
of those who think that the fight is going bad is 48%. 74% of individuals think that
the epidemic will continue in 2022, and 66% believe that they will encounter
other epidemics from now on. One out of every two people
thinks that the fight against the epidemic is going badly. The rate of those
who are worried exceeds 90%. An indication of the depressive feeling created
by this situation is that two-thirds of the citizens think that their lives
have become monotonous and that they have lost their social circle. The fact that three out of every
four people stated that the epidemic will continue in 2022 made me think that
we have started to move to the “Acceptance” phase. In fact, two out of every
three people expect to encounter other epidemics for the rest of their lives.
As the time to defeat Covid-19 gets longer, epidemics are beginning to be
accepted as a fact of our lives. In the interview I mentioned,
David Kessler states that he received approval from Kübler-Ross's family to
add a new one to these five stages; "Meaning". "Those dark
hours must have meant something," Kessler said. predicts that they will
come to the point. Last week, 2 drugs were approved, and another giant step
was taken to defeat the epidemic. This nightmare will be over! And I hope we
can derive a "meaning" from all these experiences that we can pass
on to future generations. (Ipsos Turkey) 8 November 2021 Source: https://www.ipsos.com/tr-tr/toplumun-62si-sosyal-cevresini-kaybetmis-gibi-hissediyor 715-716-43-04/Polls Population
Density Increases By A Sweeping 57% Between 1998 And 2017, From 166 Persons
Per Sq. Km In 1998 To 261 Persons In 2017
1) Overall Population Density (by administrative
units) of Pakistan in 2017 revealed to be around 261 persons per square
kilometer. Population density is typically defined as
the number of persons per square kilometer. In the year 2017, when the census
was conducted, the population density of Pakistan was around 261 persons per
square kilometer. 2) Comparison with 1998 Census shows that
Pakistan’s population density in 2017 has increased by around 57% since 1998 Comparison with the 1998 Census shows that
Pakistan’s population density has seen an increase (around 57%) from 166
persons per square kilometer in 1998 to 261 persons in 2017. Figure 1 – Population Density by
Administrative Units: 2017 vs 1998 Census
1998 and 27.2% in 2017) As seen in Figure 2, in 1998, Pakistan’s
rural population was recorded as 67.5% of Pakistan’s total population.
However, this has seen a decline to around 63.6% in the 2017 census. On the
other hand, when comparing Pakistan’s urban population, we can see that there
has actually been an increase since 1998. Pakistan’s urban population was
32.5% of Pakistan’s total population in 1998 and in 2017, this increased to
36.4% of Pakistan’s total population. Figure 2 - Rural-urban breakdown of
Pakistan’s population density in 2017 vs 1998
Data from the 2017 census shows that
Islamabad has the highest population by a large margin, coming up to be
around 2211 persons per square km. Amongst the provinces, Punjab has the highest
population density of about 536 persons per square km, followed by Khyber
Pakhtunkhwa at 409 persons, Sindh at 340 persons and Balochistan comes in
last place with 36 persons per square km. FATA is recorded to have a
population density of around 183 persons per square km. Figure 3 – Province-wise Population Density
Census 2017
When comparing province-wise population
density between the census years, 1998 and 2017, a change can definitely be
observed. In 1998, the population density of Khyber Pakhtunkhwa was around
238 persons per square kilometer and this increased to 409 persons by 2017
(an increase of 171 persons). The largest number of increase in persons per
square km is seen to be in Islamabad, going from 889 persons in 1998 to 2211
in 2017, amounting to an increase of 1322 persons. Punjab went from 358
persons per sq.km in 1998 to 536 persons in 2017, an increase of 178 between
the two years. In 1998, Sindh’s population density was around 216 persons per
sq.km and increased by 124 to around 340 persons in 2017. Balochistan’s
population density went from 19 persons per sq.km in 1998 to 36 persons in
2017 (increase of 17 persons). FATA saw an increase of 66 persons per sq. km
from 117 persons in 1998 to 183 persons in 2017. Figure 4 – Province-wise population density
1998 vs 2017
(Gallup Pakistan) November 1, 2021 715-716-43-05/Polls The Overall
Electricity Availability To The Housing Units All Over The Country Has
Increased By 17.41% Over The Last Two Decades
1) Overall Electricity Availability: The
overall electricity availability to the housing units all over the country
has increased by 17.41% over the last two decades (electricity was available
to 70.46% of the housing units in 1998 and 87.87% of the housing units in
2017) Electricity is one of the major sources of
lighting or energy across Pakistan. According to the 2017 Census, electricity
was available to 87.87% of the housing units all over the country as compared
to 70.46% of the housing units in 1998 Census, indicating an increase of
17.41%. Figure 1 – Overall Electricity Availability in 1998 and 2017 (per
housing units)
As per the 1998 census and 2017 census, the
provision of electricity in both rural and urban areas have witnessed an
improvement. Electricity availability increased from 60.07% of the housing
unitsin 1998 to 82.25% of the housing units in 2017 in rural areas.
Similarly, electricity availability increased from 93.14% of the housing
units in 1998 to 97.09% of the housing units in 2017 in 70.46% 87.87% 1998
2017 Overall Electricity Availability in 1998 and 2017 3 urban areas. This
amounts to an increase in availability of electricity by 22.18% and 3.95% for
rural and urban areas respectively. Figure 2 - Rural-Urban Breakdown 2017 vs 1998
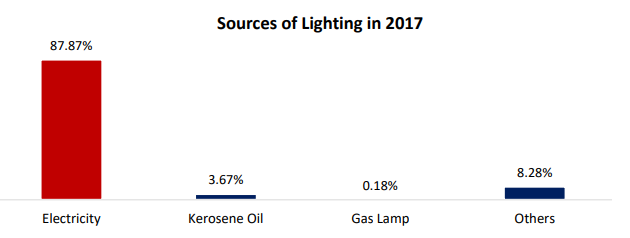
Census: Electricity Availability (per housing units) According to the 2017 Census
results, there are four main sources of lighting or energy identified:
electricity, kerosene oil, gas lamps and others. Of these, electricity
appears to be available for 87.87% of the housing units across the country.
The 2017 Census reveals that kerosene oil is used by 3.67% of the housing
units while gas lamps are utilized by 0.18% of the housing units; 8.28% of
housing units all over the country used other sources of lighting. 60.07%
82.25% 93.14% 97.09% 1998 2017 Rural-Urban Breakdown Rural Urban 4 Figure 3 - Sources of Lighting
in 2017 (per housing units)
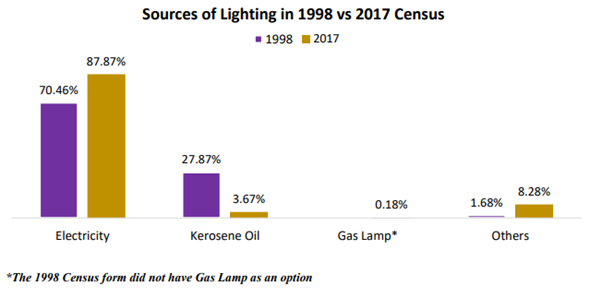
When comparing the usage of different
sources of lighting in both the 1998 census and 2017 census, it can be
observed that there has been an improvement in the use of electricity and
other sources of lighting while the use of kerosene oil has decreased
significantly. Moreover, the use of electricity had increased from 70.46% of
the housing units in 1998 to 87.87% of the housing units in 2017. Similarly,
the use of other sources of lighting increased from 1.68% in 1998 to 8.28% in
2017. Furthermore, kerosene oil saw a decline in usage from 27.87% of the
housing units in 1998 to 3.67% in 2017. Gas lamps were used by 0.18% housing
units in 2017 but similar data for 1998 is unavailable. Figure 4 - Sources of Lighting in 1998 vs
2017 Census (per housing units)
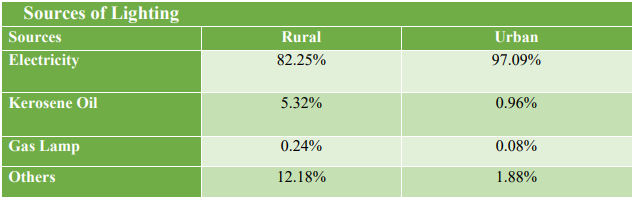
Electricity as a source of lighting had
14.84% higher usage in the household units in the urban areas as compared to
rural settings. The usage of other sources of lighting like kerosene oil, gas
lamps and others were higher in the rural areas in comparison to the urban
areas. For kerosene oil, 5.32% housing units in rural areas and 0.96% housing
units in urban areas used it as an important source of lighting. Similarly,
0.24% housing units in rural areas and 0.08% housing units in urban areas
used gas lamps to meet their energy needs. Other sources of lighting were
utilized by 12.18% housing units in rural areas and 1.88% housing units in
urban areas. 70.46% 27.87% 1.68% 87.87% 3.67% 0.18% 8.28% Electricity
Kerosene Oil Gas Lamp* Others Sources of Lighting in 1998 vs 2017 Census 1998
2017 6 Table 1: Rural-Urban Breakdown: Sources of
Lighting in 2017.
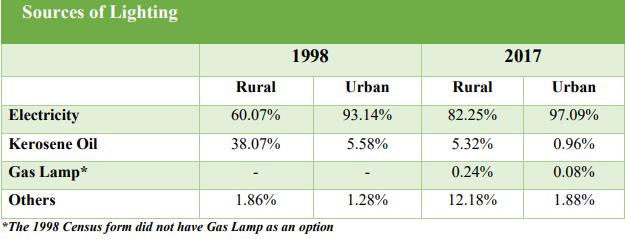
In 1998 and 2017, electricity continued to
be the primary source of lighting in both rural and urban areas. The
statistics show that the percentage usage per housing units in rural settings
was 60.07% in 1998 and 82.25% in 2017. These results are lower compared to
the statistics from urban areas where there was 93.14% usage in 1998 and
97.09% usage in 2017. Moreover, dependency on kerosene oil decreased
drastically over the years in urban and rural areas; it moved from 38.07% in
1998 to 5.32% in 2017 for rural areas and from 5.58% in 1998 to 0.96% in 2017
in urban areas. In addition, for other sources of lighting, the usage
increased over two decades – from 1.86% to 12.18% in rural areas and from
1.28% to 1.88% in urban areas. Lastly, the use of gas lamps also decreased. 7
Table 2: Rural-Urban Breakdown: Sources of
Lighting in 1998 vs 2017 Census.
(Gallup Pakistan) November 11, 2021 AFRICA
715-716-43-06/Polls 53 Percent Nigerians
Were Certain They Would Come Out And Vote For The Gubernatorial Candidate Of
Their Choice
The poll was conducted between 7th and 12th
October 2021, and it sought to assess the preparedness of voters towards the
forthcoming Governorship election in Anambra state. From the results of 500
randomly selected legible voters across all the LGA in Anambra state and
interviewed via telephone: Professor Chukwuma Soludo polled 20 percent;
Valentine Ozigbo polled 9 percent; Ifeanyi Patrick Ubah of YPP (7 percent);
and Andy Nnamdi Uba of APC (6 percent) amongst other candidates.
Interestingly, the poll also revealed that
while 91 percent of respondents claimed to have obtained their Permanent
Voters Card (PVC), 53 percent were certain they would come out and vote for
the gubernatorial candidate of their choice on 6th November 2021. However,
despite this level of optimism and preparedness, a significant proportion (54
percent) of legible voters remain either undecided or simply refused to
divulge their choice of candidate. In addition, the poll revealed that a
significant proportion of legible voters (34 percent) are skeptical about
coming out to vote in the forthcoming election mainly due to
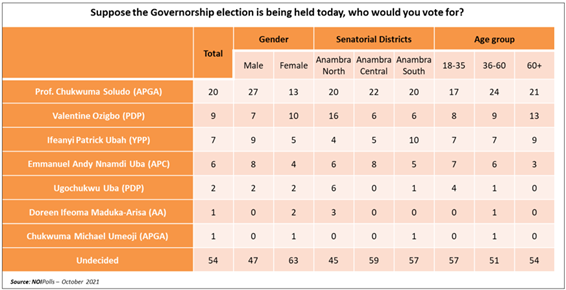
insecurities. Further findings indicated that while
Professor Soludo appeared to enjoy significant support across the three
senatorial districts of the state, Anambra North (20 percent), Anambra
Central (22 percent) and Anambra South (20 percent); Ozigbo’s support base
was observed mainly in Anambra North (16 percent) senatorial districts.
Similarly, the poll highlighted Soludo’s support across all age categories
ranging the working-class of ages 36 to 60 years (24 percent), the senior
citizens aged 61 and above (21 percent) and the youths aged between 18 and 35
years (17 percent); compared to Ozigbo’s whose support averaged 10 percent
across all age categories. In conclusion, this poll has Soludo in an
early lead for the November 6th governorship election in Anambra state with a
significant 11-piont lead over the next candidate, Ozigbo. However, the
forthcoming election remains a strongly contested race considering the
significant proportion of voters (54 percent) who remain either undecided or
seek confidentiality as to their choice of candidate meaning the results can
still swing. (NOI Polls) November 2, 2021 715-716-43-07/Polls 8 In 10 Adult
Nigerians Have No Health Insurance Cover
A new public opinion poll conducted by
NOIPolls has revealed that almost 8 in 10 Nigerians (77 percent) do not have
health insurance cover. In addition, 5 percent revealed that their healthcare
services are paid for by family and friends. Further analysis by occupation
revealed that artisans (93 percent), farmers and agricultural workers (91
percent), religious leaders (89 percent), self-employed traders (88 percent),
businessmen and women (88 percent), Youth corps members (86 percent) and
unemployed (84 percent) are among households and individuals that are paying
out-of-pocket and incurring catastrophic health expenditure to access
healthcare services in the country. This simply suggests that coverage of health
insurance has remained abysmal despite the National Health Insurance Scheme
(NHIS) which was established in 2006 to achieve Universal Health Coverage
(UHC) in Nigeria with financial risk protection mechanisms. Analysis by
geographical location shows that health insurance coverage rates are highest
in the North-West zone (24 percent) whereas it is lowest in the South-East
zone (14 percent). More findings revealed that 57 percent of
adult Nigerians who pay out-of-pocket to access healthcare are willing to pay
money monthly or yearly to get enrolled into the health insurance scheme.
This further provides evidence that access is a major issue concerning health
insurance across the country. Therefore, there is a need for a determined
and deliberate approach towards mass enrolment of Nigerians by relevant
stakeholders as well as intensive sensitization as 47 percent disclosed that
they are not aware of the National Health Insurance Scheme. This will go a
long way in reducing the incidence of out-of-pocket payments and incurring
catastrophic healthcare expenditures. These are some of the key findings from
the poll conducted in the week commencing August 30th, 2021. Survey Background Universal health coverage is a global drive
aimed towards ensuring that all people in the world have access to quality
healthcare delivery they need, when and where they need them without
undergoing financial hardship. However, it is saddening to note that a large
percentage of the world population do not have access to affordable care due
to a lack of health insurance coverage. According to the World Health Organization,
about 100 million people are pushed into extreme poverty each year because of
out-of-pocket spending on health. The WHO data further states that 930
million people spend at least 10 percent of their household income on health
care and to further buttress the lack of access to health care around the
world, the statistics show that half of the world’s population do not have
access to the healthcare they need.[1] There is indeed a crisis of
healthcare deliverable at an affordable cost to a larger percentage of the world
populace. In a bid to tackle access to healthcare in
Nigeria at an affordable rate through health insurance, the Federal
Government established the National Health Insurance Scheme (NHIS) under Act
35 of the 1999 constitution as amended to provide quality health care to all
Nigerians at an inexpensive cost. They are to organise a payment structure
where all contributors contribute to a common pool and all health expenses
are paid from it thereof. By its statutory functions, it is expected to
regulate the activities of the private arm of the health insurance policy of
the government.[2] How has the National Health Insurance
scheme fared since its establishment to date? How has it bridged the gap of
the absence of viable health insurance among the Nigerians? It remains to be
seen if the average Nigerian has benefited in the area of quality healthcare
insurance in the country since the establishment of the scheme. Also, what
does the future hold for the health insurance policy in the country vis-à-vis
the tackling of the growing gulf in the provision of affordable health care
policy in the country? Against the background, NOIPolls conducted a public
opinion poll to feel the pulse of Nigerians regarding health insurance in the
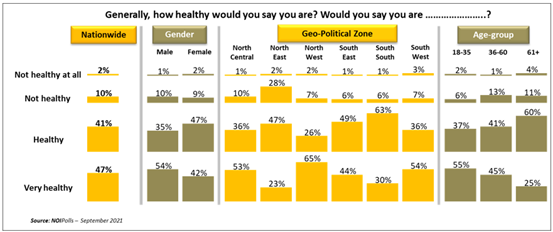
country. Survey Findings The first question sought to find out the
self-assessment of the health status of adult Nigerians and the findings show
that 88 percent rated themselves healthy whereas 12 percent rated themselves
as not healthy. Analysis by geographical locations indicates that the
South-East and South-South zones (93 percent each) rated themselves better
than other zones with regards to the self-assessment of their health status.
In addition, more analysis by age group shows that young Nigerians (18 – 35)
rated their health status better than the middle-aged (36 – 60) and the
elderly (61+).
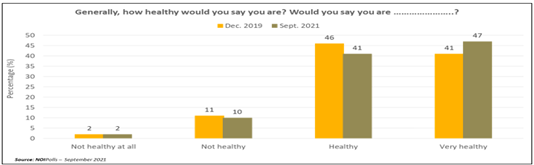
Trend analysis shows that the
self-assessment of the health status of adult Nigerians is generally better
in 2021 than in 2019 as indicated by a 1 percent increase in the chart below.
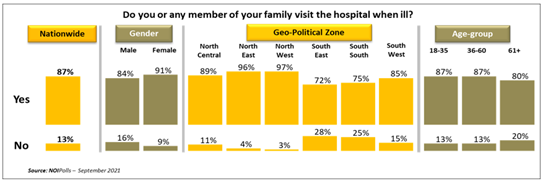
The second question sought to know what
Nigerians do when they fall ill. The result revealed that the majority of
adult Nigerians (87 percent) disclosed that they visit the hospital when ill
and Nigerians residing in the North-West (97 percent) and North-East (96
percent) zones accounted for the larger proportion of Nigerians in this
category. On the contrary, 13 percent claimed that
they do not visit the hospital when ill and respondents from the South-East
(28 percent) and South-South (25 percent) zones had more people who made this
assertion.
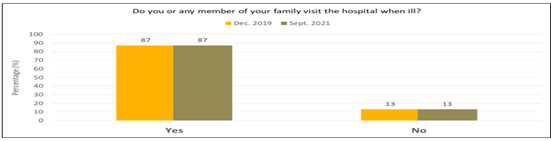
Trend analysis shows that there is no
increase in the percentage of respondents who go to hospital between 2019 and
2021.
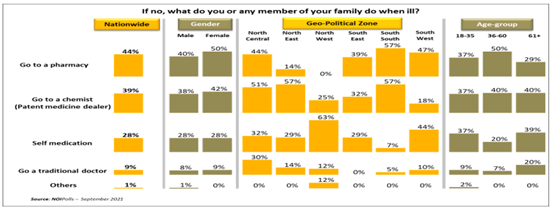
The respondents who claimed that they do
not go to hospital were further probed and findings revealed that 44 percent
visit a pharmacy when ill and this is predominant with Nigerians residing in
the South-South zone (57 percent). Also, 39 stated that they visit a chemist
when they are ill and Nigerians living in the North-East and South-South
zones (57 percent each) had more respondents who made this assertion.
Interestingly, 28 percent said that they self-medicate, while 9 percent
mentioned that go to a traditional doctor when ill and this is mainly
associated with respondents residing in the North-West (63 percent) and
North-Central zones respectively.
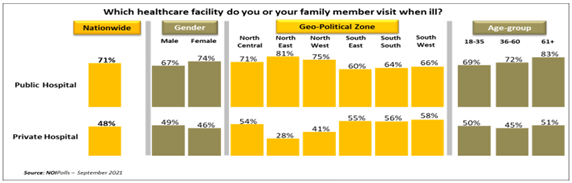
Furthermore, respondents who stated that
they go to the hospital when ill were further probed and the poll result
revealed a high utilization of public hospitals across the country as 71
percent of disclose that they visit the public hospital when ill. Analysis by
gender revealed that there are more females (74 percent) than males (67
percent) who visit public facilities when ill. In addition, respondents aged
61 and above (83 percent) visit public facilities more than any other
age-group as indicated in the chart below.
Significant findings from the poll show
that a very high proportion of adult Nigerians (77 percent) pay out-of-pocket
for healthcare services. A further 5 percent revealed that their healthcare
services are paid for by family and friends. On the other hand, only 18 percent of Adult
Nigerians indicated that they have health insurance cover. This implies that
health insurance has remained very low despite the National Health Insurance
Scheme (NHIS) which was established in 2006 to achieve Universal Health Coverage
(UHC) in Nigeria with financial risk protection mechanisms. Analysis by geographical location shows
that health insurance coverage rates are highest in the North-West zone (24
percent) whereas it is lowest in the South-East zone(14 percent).
Further analysis by occupation revealed
that artisans (93 percent), farmers and agricultural workers (91 percent),
religious leaders (89 percent), self-employed traders (88 percent),
businessmen and women (88 percent), Youth corps members (86 percent) and unemployed
(84 percent) are among households and individuals that are paying
out-of-pocket and incurring catastrophic health expenditure to access
healthcare services in the country. Further analysis shows that government
workers/ civil servants (51 percent), and professionals, mainly workers in
private organizations, (30 percent) top the list of individuals who access
health insurance in the country.
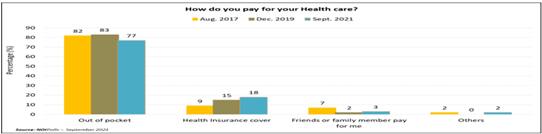
Trend analysis shows a 3 percent increase
in the proportion of people with health insurance cover when the current
result is compared to the result obtained in 2019 as indicated in the chart
below.
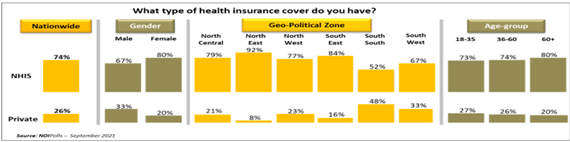
Respondents who stated that they access
health insurance were further probed and findings revealed that the majority
of the respondents (74 percent) access healthcare services through the NHIS.
This assertion is prevalent with respondents who reside in the North-East
zone (92 percent). Also, disaggregation by age group, shows that those aged
61+ and above (80 percent) use NHIS more than any other age group in the
country. With regards to private health insurance,
26 percent disclosed that they access care through private health insurance
organizations and respondents residing in the South-South zone had more
Nigerians (48 percent) who stated this.
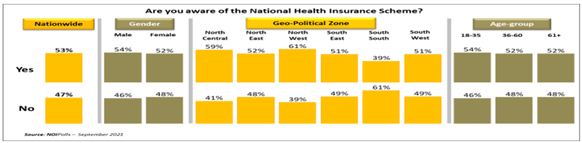
Consequently, all respondents, asides those
who indicated that they use NHIS, were asked if they are aware of the
National Health insurance scheme (NHIS) and slightly above average (53
percent) of respondents acknowledged that they are aware of the scheme
whereas 47 percent disclosed that they are not aware of NHIS. While
respondents residing in the North-West zone (61 percent) showed more
awareness, those in the South-South zone claimed not to be aware of the
scheme.
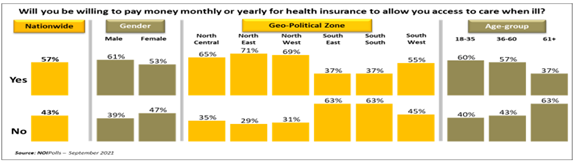
Additionally, the poll ascertained the
willingness of Nigerians who currently pay out-of-pocket to pay money monthly
or yearly to access healthcare services whenever they need it. In response to
this, 57 percent of the respondents disclosed that they are willing to pay
money monthly or yearly to get enrolled into the health insurance scheme.
With regards to age-group, a majority of respondents aged 18 – 35 years
indicated that they are willing. On the other hand, 43 percent of the
respondents stated otherwise and respondents residing in the south-East and
South-South zones (63 percent each) had more respondents who made this
assertion.
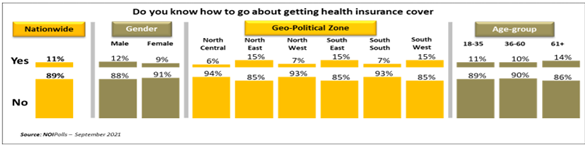
Respondents who expressed willingness to
enroll for the scheme were further asked if they know how to go about getting
enrolled in the health insurance scheme. The result revealed that 11
percent stated that they know how to go about getting a health insurance
cover whereas 89 percent claimed that they do not know how to go about it.
Conclusion The poll found that 77 percent of
respondents make out-of-pocket for healthcare. Too many Nigerians suffer
financial hardships when they make catastrophic health expenditures. Evidence
shows that some healthcare expenditures can push people further into poverty.
A way to reverse this high out-of-pocket payment is for the government at all
levels in Nigeria to accelerate the push for Universal Health Coverage. A
quick way of achieving this is to increase health insurance coverage. It is
gratifying that at least 7 Nigerian States have signed health insurance laws
to help in achieving equitable and sustainable health financing mechanisms.[3] Functional State health insurance schemes
will help increase the pool of individuals with health insurance thereby
driving down premiums. Finally, the poll shows an urgent need for
interventions in the Nigerian health system to reduce the incidence of
out-of-pocket health expenditure. The proportion of the population covered by
financial risk protection in healthcare utilization is too low at 18 percent,
compared to a benchmark of 90 percent for an efficient health system, and
this reflects how far the country lags in the race toward universal health
care coverage. High out-of-pocket rates are associated with low uptake of
preventive health services, weak management of health care and raise the
possibility that patients are too sick before they seek healthcare. The poor
segment of the population would likely not seek healthcare because of the
inability to pay, and this weakens the performance of the health system in
terms of its ability to protect the weak. (NOI Polls) November 9, 2021 715-716-43-08/Polls 51% Of
Malawians Say There Are More Factors That Divide Them Than Unite Them As A
People
Malawians overwhelmingly reject a proposal
to adopt a federal system of government as a way of ensuring equitable distribution of
development resources, an Afrobarometer analysis shows. At the same time, a majority of citizens
say that their ethnic groups are treated unfairly by the government and that communities that don’t
vote for the ruling party suffer negative consequences in terms of public services
and development projects. Based on findings from Afrobarometer’s most
recent survey in Malawi, conducted in late 2019, fully half of citizens say there are
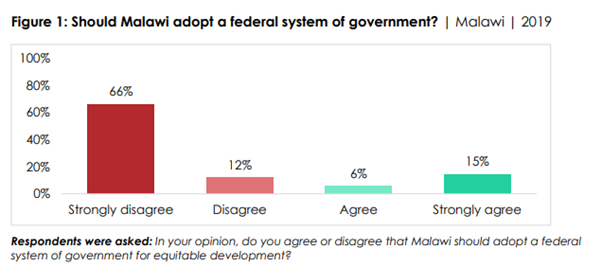
more factors that divide them than unite them as a people. Key findings ▪ Malawians widely (78%) reject a
proposed change to adopt a federal system of government as a way to guarantee equitable
distribution of development resources (Figure 1). o Although there are significant
differences across regions (Figure 2) and party affiliations, majority opposition to the
proposal cuts across these divides. ▪ Half (51%) of Malawians say their
ethnic groups are “sometimes,” “often,” or “always” treated unfairly by the government – a
perception that is considerably more common in the North (65%) and Centre (62%)
than in the South (35%) (Figure 3).
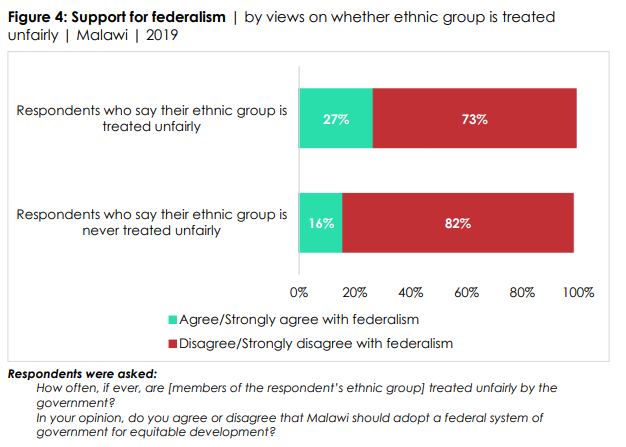
their ethnic group suffers unfair treatment
(Figure 4).
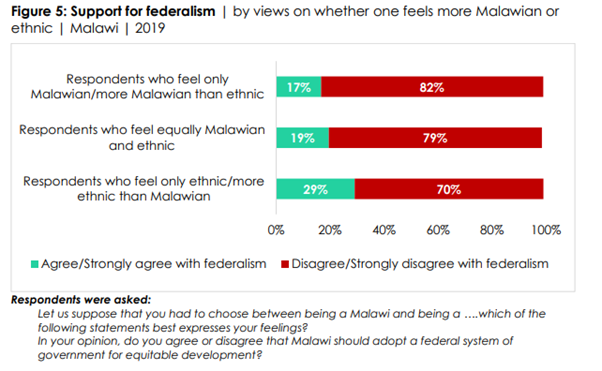
them as a people. When it comes to ethnic
vs. national identity, the largest number (50%) identify equally with both, while
smaller proportions identify predominantly or only with their ethnic group (17%) or with
their nation (33%). o Federalism is more popular among
Malawians who identify predominantly or only with their ethnic group (29%) than among
those who identify predominantly or exclusively as Malawians (17%) (Figure 5).
the ruling party “sometimes,” “often,” or
“always” suffer negative consequences, such as lack of government support for
local services or development projects. This view is more widely shared in the Northern
(76%) and Central (64%) regions than in the Southern region (47%). o Support for federalism is about twice as
high among citizens who say that such communities are “often” or “always”
sanctioned (30%) than among those who say this “never” happens (16%). (Afrobarometer) 04 November 2021 715-716-43-09/Polls Only About
One In Three Malawians (36%) Think That China’s Economic Activities Have
“Some” Or “A Lot Of” Influence On Malawi’s Economy
China is seen as an important economic
player in Malawi, although its perceived influence has declined considerably since 2014,
according to Afrobarometer’s most recent survey (in late 2019) in Malawi. Citizens who consider China’s economic and
political influence in their country positive outnumber those who see it as negative.
China’s low-cost products and infrastructure and business investments are the main drivers
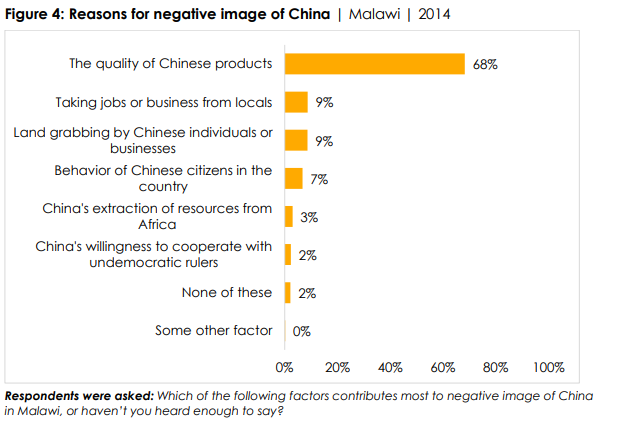
of positive perceptions, while the poor quality of its products is the main reason for negative
views. Among Malawians who are aware that their
country receives loans or development assistance from China, a majority think
Malawi has borrowed too much from China. Key findings ▪ Only about one in three Malawians
(36%) think that China’s economic activities have “some” or “a lot of” influence on Malawi’s
economy, a decline from 59% in 2014 (Figure 1). ▪ Half (50%) of Malawians see China’s
economic and political influence in their country as positive; one in seven (14%) think it is
negative (Figure 2). poor-quality products are the main reason
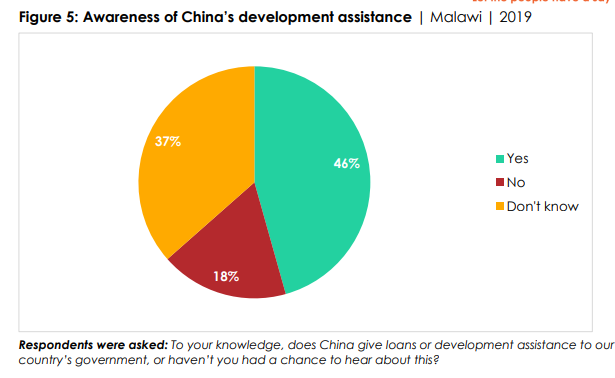
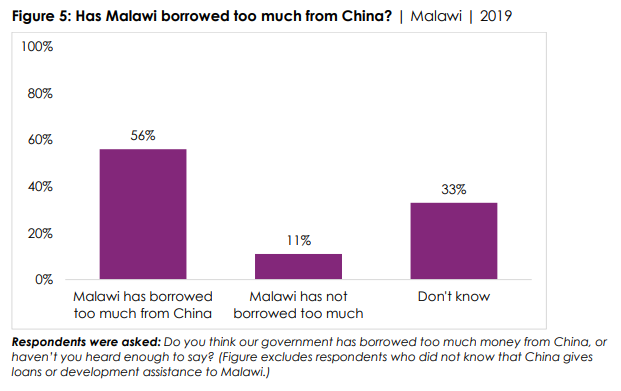
for the negative assessments (Figure 4). ▪ Fewer than half (46%) of Malawians
are aware that their country receives loans or development assistance from China. Among
those who are aware of Chinese loans/assistance, a majority (56%) think
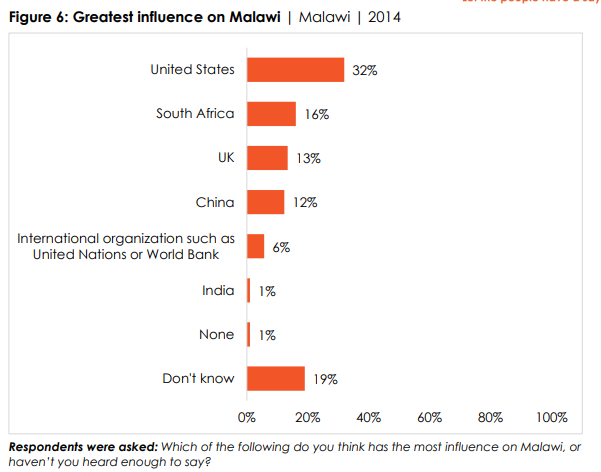
Malawi has borrowed too much from China (Figure 5). ▪ In a comparison with other
countries and organizations, China ranks fourth in perceived influence in Malawi, behind the
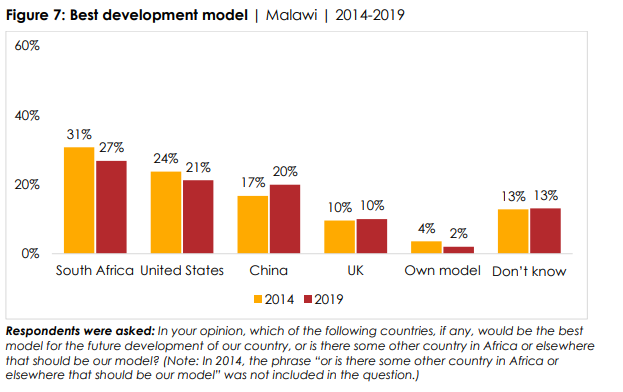
United States, South Africa, and the United Kingdom (Figure 6). ▪ China ties with the United States
as a development model preferred by Malawians, trailing only South Africa (Figure 7). (Afrobarometer) 04 November 2021 715-716-43-10/Polls Less Than A
Fifth (18%) Of Adult South Africans Indicated That They Think The Country Is
Going In The Right Direction
A similar rather modest proportion indicated
that their views of their personal safety are improving. These findings
resonate with findings of pre-election studies done by Ipsos, on behalf
of eNCA:
The local government election, which took
place during a pandemic, was different from previous elections in many ways,
however, it is interesting that the issues of voters are very similar to
issues they brought to the fore on earlier occasions. Without a doubt the
non-delivery on these issues contributed to the low election turnout
(probably the lowest ever) and the relatively muted performance of the three
biggest political parties in the country. For the first time since
1994, ANC support on a countrywide basis will
fall under 50% - as predicted early on in the eNCA/Ipsos pre-election study. Now that the election is (almost) done and
dusted we need to draw a line in the sand to look at the ideas and priorities
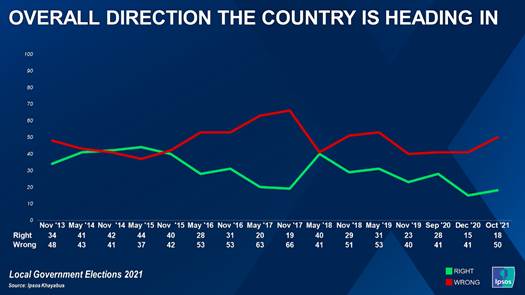
of voters going forward. National issues and critical local issues The graph overleaf illustrates the
sensitivity of measuring public opinion on the Ipsos Khayabus – a large-scale
study conducted twice a year. Clearly, political events in the country
influence how citizens see the direction in which the country is heading. In
November 2017, at the end of the second presidential term of Jacob Zuma, only 19% of adult South Africans felt
that South Africa was going in the right direction. With the election of Cyril Ramaphosa as president of the ANC and the
country, the mood visibly lifted and in May 2018 four in every ten (40%) were
more optimistic about the country’s direction. As was clear from different news sources,
the appeal of the so-called “new dawn” dwindled since then (as shown in the
results) and during the election campaign (October 2021) only 18% was
optimistic, while half of adult South Africans (50%) said that the country
was going in the wrong direction.
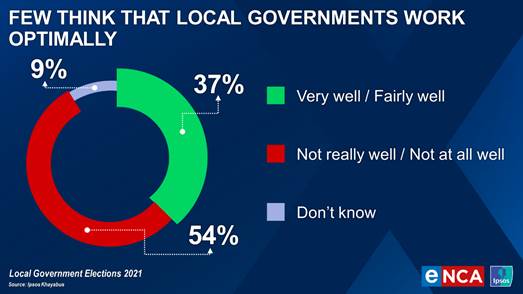
Against this background, it should come as
no big surprise that more than half (54%) of adults is of the opinion that
local governments do not do their job well (Ipsos Khayabus study).
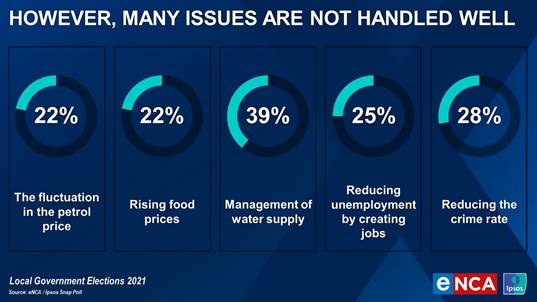
The same study looks at 35 policy areas and
test the public’s views of the government’s performance on these issues.
Traditionally, the government’s performance is not remarkable, with most of
the evaluations falling under 50% - i.e. less than half of adults (who are
eligible to vote) think well of the government’s efforts on these terrains.
The five issues highlighted below are not handled well, although they are
important issues when it comes to “delivery”.
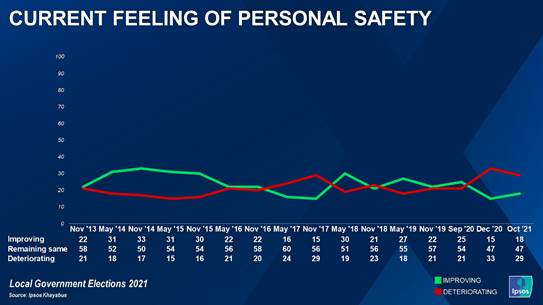
A focus on safety and security While less than 3 in every ten adults (28%)
think that the government is handling the maintaining of safety and security
well in more general terms, they are also saying that their own personal
safety can be in jeopardy, with only about a fifth (18%) seeing an
improvement.
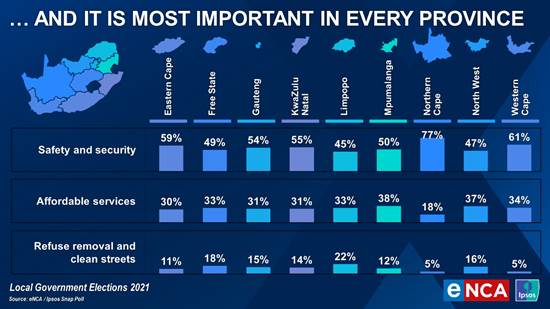
In the eNCA/Ipsos pre-election surveys,
registered voters were probed to choose the issue they wanted local
governments to focus on first, from a list of three issues, namely:
The opinions of registered voters in all
provinces are summarised overleaf – in every province safety and security
were chosen as the most important – although “affordable services” were also
chosen by many. This does not mean that “refuse removal and clean streets”
are not important, it only shows that other issues are more important, and
needs to be attended to first.
Views on the government’s handling of the
pandemic The 1 November local government election
was the first election to happen during a pandemic, and many people were
worried that the moving of the country to Alert Level 1 might have a negative
influence and increase the opportunities for the spreading of the virus at
party events, or in the queues at the voting stations. The full effect of this
will only be known in a week or two. The Department of Health placed more than 1,000 vaccination
clinics at voting stations and, according to anecdotal evidence, these have
been attended well on Monday. But what are the current opinions of South
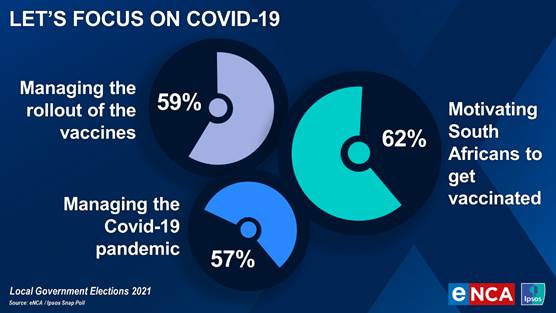
Africans about the handling of the pandemic by the government? Three related issues were probed:
When this performance is compared to that
of the government on other areas of interest, it is going relatively well,
although the performance on none of the three Covid-19 issues can be
described as superb. After the elections, the focus should move
again to curbing the effects and the spread of the virus and actively work on
a programme and campaign to convince more citizens to get vaccinated, perhaps
by focusing stronger on the benefits of vaccination. Specific expectations from local councils According to Ipsos Khayabus results, only a
quarter (26%) of adult South Africans are currently satisfied on how
government is performing. Moving the focus to the ruling party, who
needs to be at the front of addressing issues mentioned by voters, just more
than a third (35%) indicated that they trust government to deliver effective
basic services to the public. It might be a long uphill battle for many local
councils to achieve this goal, if reports by the Auditor General about the
efficiency of local government are taken into account.
One can well ask where this huge task of
delivery should start... Based on the findings of the eNCA/Ipsos
pre-election studies, a list focusing on “Service Delivery” issues and on
“Fair and Equal Treatment” as the two main categories, have been put together.
The six issues listed below are a synthesis of what became clear from the
pre-election surveys which focused on registered voters.
(Ipsos South Africa) 4 November 2021 Source: https://www.ipsos.com/en-za/party-over-urgent-delivery-key 715-716-43-11/Polls Three-Fourths
(76%) Of South Africans Say The Government Should Prioritize The Provision Of
Adequate Housing Over Land Redistribution
Most South Africans say the government has
a duty to provide adequate housing for people who cannot afford shelter, the
latest Afrobarometer survey shows. Housing should take priority over land
redistribution as a government priority, according to a large majority of
citizens, Housing ranks third among the most
important problems that citizens want the government to address. Frustrations over a lack of housing have
found expression in recent protests in many communities across the country. Key findings ▪ Housing ranks third among the most
important national problems that South Africans want their government to address, trailing only
unemployment and crime/security (Figure 1). ▪ An overwhelming majority (86%) of
citizens say the government has a duty to provide adequate housing for South Africans who
cannot afford shelter (Figure 2). More than half (55%) of respondents feel “strongly” about
this issue. ▪ Three-fourths (76%) of South
Africans say the government should prioritize the provision of adequate
housing over land redistribution (Figure 3). ▪ If the government provides housing
for citizens who cannot afford shelter, almost half (45%) of respondents say
such housing should be built in rural areas. But even more would place such
housing in or near central business districts (28%), on the outskirts of
urban centers (11%), or in the suburbs (11%) (Figure 4). (Afrobarometer) 9 November 2021 WEST
EUROPE
715-716-43-12/Polls Women Feel Less Safe Walking Home Alone At Night Than In 2018
Recent high profile murders of young women, particularly that of Sarah
Everard, have shocked the nation, and eroded
public confidence in the police. Now a new YouGov survey shows that they have
likely contributed to greater fears among women for their own safety. Almost three years ago, in
December 2018, YouGov asked Britons how often they felt unsafe in a
variety of situations. A repeat of that survey now shows that women are more
likely to feel unsafe than they were in 2018, particularly when it comes to
walking alone at night. Approaching two thirds of women who ever walk alone outdoors at night
say they “always” or “often” feel unsafe when doing so. This is an increase
of 17pts from 46% who said the same three years ago.
This figure also excludes the fact that one in five women (19%) don’t
ever walk alone at night in the first place – a number twice as high as men
(9%). There is, however, no real increase in the number of women not
venturing outdoors at night since the previous poll (18%). The number of women who report taking regular steps to protect
themselves from sexual assault has also risen. In 2018 a third of women (32%)
said they take precautions; this figure now stands at 41%. More women expressed more frequent fear about other common
activities, including walking down an alley alone (up from 49% to 63% among
those who ever do so) and going on a first date (up from 15% to 28%). In all cases, women are substantially more likely than men to say
that they find themselves afraid in what should be innocuous everyday
situations.
(YouGov UK) November 01, 2021 715-716-43-13/Polls Polling About Rishi Sunak’s Recent Budget Shows Two In Five Think It
Will Be A Good Thing For People On High Incomes (38%)
Ipsos MORI’s latest online polling about Rishi Sunak’s recent Budget
shows two in five think it will be a good thing for people on high incomes
(38%), and a third that it will help big businesses (35%). On the other hand,
a third or more believe it will have a negative impact on pensioners (34%)
and people on middle (34%) or low incomes (39% - although 28% also believe it
will be good for the least well-off). Only one in eight (13%) report following news about the Budget “very
closely”, although another two in five say “fairly closely” (41%). This
leaves another two in five who followed it not very closely (30%) or not
closely at all (13%). When we ask those who followed the Budget to tell us in their own
words what announcement most caught their attention the most common policies
mentioned are the increase in minimum wage (12% of those who followed the
Budget), cuts in alcohol and tobacco duty (9%) and changes to Universal
Credit (8%). However, even these are only mentioned by a minority, with two
in five (39%) saying they don’t know or nothing.
Overall, public opinion is divided on how the Budget went for Rishi
Sunak with one in three (32%) thinking it went well for the Chancellor,
whilst a fifth (21%) say badly and a third neutral (32%). The Conservatives fare similarly with three in ten (29%) saying it
went well for the party, and nearly one in four thinking poorly (23%).
Whereas the Labour party performs less well with a fifth saying it went well
(20%), compared to nearer a quarter (24%) believing it went badly. However, a
larger proportion say it went neither well nor badly (39%) for Keir Starmer’s
party.
Elsewhere the public are also divided on the impact Budget
announcements will have on regions in North England (24% say it will be a
good thing vs. 25% a bad thing), young people (24% vs. 30%), small business
owners (25% vs. 27%) and regions in South England (25% vs. 16%). Looking forward, one in four (24%) believe Rishi Sunak will change
Britain’s economy for the better (24%), whilst three in ten say he will make
it worse (30%) and a similar proportion think he will make no difference
(29%). Only a fifth (21%) think he has bettered country’s economy already
(21%), whilst around three in ten say he has made it worse (31%) or no
difference (33%). Reflecting this, a third (32%) believe Britain’s economy will recover
more slowly than those of most other countries as Coronavirus restrictions
have been eased (up three percentage points since May 2020), and a similar
proportion say it will recover at the same rate (-9pts). Only one in five
(20%) say it will recover more quickly than most other economies, however,
this is up from 13% in May 2020. Gideon Skinner, Head of Political Research
at Ipsos MORI, said: Of course the implications of the Budget go
beyond the immediate reaction from public opinion, but nevertheless it is
instructive to see what sticks in the public mind. Only half say they
followed news about it fairly closely (although this is better than the
attention paid to the recent party conferences), and even among those who
claim they did many are unable to name a policy that stuck in their mind.
However, the Chancellor may be pleased that the ones that did were about the
minimum wage, alcohol and tobacco duty, and Universal Credit – but he has
more of a task to convince the majority that he will be able deliver an
economic recovery that benefits all sections of society. (Ipsos MENA) 3 November 2021 Source: https://www.ipsos.com/ipsos-mori/en-uk/autumn-budget-what-policies-did-britons-notice 715-716-43-14/Polls Around Half Of
Britons (50%) Say Migrant Numbers Over The Last 10
Years Have Been Too High
According to YouGov’s ‘most important issues’ tracker, immigration is
once again among the top priority issues for the British public.
Currently, 23%
of Brits have ‘immigration and asylum’ in their top three most important
issues facing the country today. This reached as high as 35% in
August (overtaking the environment in the process), while in February this
year the figure was as low as 15%. Meanwhile, views on the government’s handling of immigration as a
policy issue have also been on the move, with the public increasingly
unimpressed at Boris Johnson’s handling of this controversial subject.
Dissatisfaction with the government is very high, with 71% of Brits in our
latest poll indicating they believe
Johnson’s government are handling immigration badly. That figure has now
been at 70% or above since late July. But what is it precisely that
Britons are concerned about regarding immigration? Does an increase in issue
importance and increasingly negative view of the government’s track record
mean that Brits want to see reductions in immigration and asylum? Or have
recent stories of shortages in goods, labour, and fuel caused a rise in
concern that the government’s immigration policy is too restrictive? Despite some very high profile events in recent years, public
attitudes toward immigration numbers have
remained fairly steady. Currently, around half of Britons (50%) say migrant
numbers over the last 10 years have been too high. One in ten (10%) say
numbers are too low, which is a small but notable increase on attitudes for
most of the last two years. One in four (25%) consider immigration levels
over the past decade to have been “about right”. So it is clear that Brits do not want to see more immigration in general, but there is no evidence
that rising dissatisfaction with government handling of immigration and rising
concern with immigration and asylum as a policy is being caused by an
increasing desire to see the number of foreigners entering Britain reduced.
If anything, the opposite mood is growing. What do Brits think about specific cases or types of immigration and
asylum – are there any clues in the details about what is driving concern and
dissatisfaction? With well documented problems surrounding supply of food, petrol and
diesel, seasonal labour issues being linked to Brexit and the Covid-19
pandemic, and the recent crisis in Afghanistan hitting headlines across the
world, YouGov has asked the public a range of questions over recent weeks
about their specific concerns about immigration and asylum. On the topic of asylum, our data shows that half of Britons (51%)
support the resettlement of at least ‘a few thousand’ Afghan refugees in
Britain, including one in three (32%) who believe at least ‘a few tens of
thousands’ should be allowed to come and 9% who support the resettlement of
‘a few hundreds of thousands’. Just 13% believe no Afghan refugees should be
welcomed into the UK. We also asked the British public if they would support a government
programme aimed to filling UK job shortages with immigrant workers. A
majority (51%) suggested they would indeed support such a policy, with one in
four (24%) opposed. Furthermore, we also found that the public tends to have positive
views of migrants coming to the UK to work (by a margin of 41% positive to
27% negative), reunite with their families (40% positive versus 22%
negative), or to set up businesses (51% positive versus 13% negative). On the other hand, the British public do not have a favourable view
of those crossing the English Channel to get to the UK. By a margin of 56% to
19%, Britons take a negative view of those arriving in this way,
demonstrating a clear distinction in the public eye regarding the
circumstances by which migrants arrive in the UK.* Finally, earlier this month we asked respondents who told us they
thought the government was handling immigration badly why – in their own words – they
thought this was the case. Of those who think that Boris Johnson’s government are doing badly on
immigration, about one in four (23%) told us that they thought that because
of ongoing problems with supply chains, food shortages, and the fuel crisis.
A further 8% suggested that the government’s immigration policy was
incompetent (simply not working), without mentioning the above issues. Around one in five (22%) suggested that the government should be
doing more to reduce immigration. One in eight (12%) mentioned the ongoing
English Channel refugee crisis in negative terms, while a similar proportion
(9%) suggested that the government’s currently policy on immigration was
inhumane, discriminatory, or unfair.
Elsewhere, 10% framed their response in terms of general negativity
toward the government and their policymaking. Another 8% suggested their problems
were with illegal immigration. The data suggests that while issues surrounding immigration and
asylum, and the government’s handling of them, have taken on a greater
importance to the public recently, it is not necessarily the case that this
is driven by a desire to see less immigration
or to prevent more people arriving on Britain’s shores. It rather suggests that topical news items around asylum and the
impact of lack of migrant labour on the British economy is causing concern
among the public that the government is not striking the balance – or gauging
the public mood on allowing foreign citizens to come and live and work in the
UK – correctly. *Note that responses do not change if we
ask the public about refugees or migrants crossing the channel. When we
repeated the same question but switched the wording to ask “For each of the
following groups of people, please indicate if, generally speaking, you have
a positive or negative view: Refugees crossing the English channel to get to
the UK”, we found 59% ‘negative’ and 17% ‘positive’. (YouGov UK) November 03, 2021 715-716-43-15/Polls Only Half (51%) Of People Who Pay Their Household’s Energy Bills Know
What The Energy Price Cap Is
Rishi Sunak has announced a £500m
fund to help families struggling this winter, as a surge in gas
prices drives up
household energy bills. The price rises have spurred many to shop for a
better deal on their bills if there is one to be had at all, but how well do
Britons actually understand their energy bills? A fifth of Britons don’t understand how
energy bills are calculated Between gas and electric, tariffs and meter types, energy bills can
be confusing. So confusing that only one-quarter of Britons (26%) say they
“completely understand” how they are calculated, although 47% say they have
some understanding. A fifth (21%), however, say they do not understand how
the bills are calculated at all. Even among those who are jointly or solely responsible for their
household bills, only three in ten say they fully understand how the payments
are determined. However, among Britons who are responsible for their
bills and regularly
shop around for deals on their energy, 45% say they fully understand how the
bills are calculated.
Around half of those with responsibility for their household gas and
or electric bills (51%) say they have some understanding of how the bills are
calculated. One in six (16%) Britons with responsibility for both the energy
bills have no idea how they are determined at all. Confusion over bills is highest among those aged 18-24, with only 51%
claiming some knowledge of how their household bills are calculated –
including only 9% saying they completely understand them, However, this group
is also much less likely to be responsible for these bills compared to other
age groups (34%, versus 89% of those 55 and over). Are Britons missing out on deals on their
energy? This lack of understanding may ultimately be costing Britons money.
While a third (33%) of the general public regularly shops around for deals on
their energy this rises to nearly half among those who say they completely understand
how their household bills are calculated (47%). However, of those who don’t
understand their bills, less than one in five (18%) regularly look for the
best value deals. A third of Britons who say they don’t understand how their household
bills are worked out have never shopped around for a better deal (35%)
compared to only 13% of those who claim a good understanding.
What does the energy price cap mean? One term used frequently in news reports about the rising cost of
utilities is the “energy
price cap” and with a significant proportion of Brits unsure how their
bills work, do they know what this term means? Around half (51%) of people correctly identified that the energy
price cap is the maximum price companies can charge consumers per unit of
energy used. Some 49% of Brits didn’t know or were wrong: 23% incorrectly
think the term means the total bill a household could receive, 2% think it
means something else entirely, and 24% don’t know either way.
Even among those jointly or solely responsible for their household
bills, only 55% among those paying electricity and or gas bills knew the
correct meaning of the term. (YouGov UK) November 03, 2021 715-716-43-16/Polls 76% Of People In England Say They Would Support A Policy Enforcing
Masks Being Worn In Shops
While the government remain
reluctant to introduce ‘Plan B’ measures in England this winter, we
may see the return of compulsory masks in shops and public transport. YouGov
polling last week found that the public would be receptive to such a change,
with 76% of people in England saying they would support a policy enforcing
masks being worn in shops. Yet when we ask about actual mask wearing, we find that, for
instance, only half (49%) of English people who went to a shop in the
preceding week say they wore a mask on every occasion. There is clearly a
gulf between desire for policy change and personal action. So why is there such a difference? And is it likely that people can
be encouraged to put their masks back on? The first place to look is at the frequency of mask wearing. While
51% of the public did not wear a mask every time
they visited a shop, just 20% never did
so. Most of this group is in fact made up of shoppers who wore a mask
either most of the times they went out (19%) or occasionally (12%). Therefore
the majority of those who are seen not wearing masks while shopping haven’t
abandoned the concept completely, as they do at least sometimes wear one. This group are also much closer in their views on mandatory mask
wearing to those who wore one every time they went shopping than those who
never did. Almost everyone who wore a mask without fail when they went shopping
(96%) supports bringing back the requirement to wear masks in shops, as do
82% of those who wore a mask on some shopping visits. By contrast, just 26% of
those who didn’t wear a mask at all in the week prior support reintroducing
the rule, with 69% opposed.
Why aren’t Britons wearing face masks? Asking those who didn’t always wear a mask on every shop visit to
tell us – in their own words, why they didn’t reveals key differences in
attitude depending on whether the person supports or opposes the
re-introduction of masks. Amongst those who support bringing back masks, the main reason given
for not wearing one is that they had forgotten it or didn’t have one with
them at the time (43%). Other top reasons provided by this group were because
others weren’t wearing one (11%), or they felt they were able to keep their
distance from others instead (11%). None of these three reasons indicate that this group would refuse to
wear masks on every shop visit were it to become compulsory again. In fact,
it largely suggests that people have just become more relaxed about their
mask wearing. "The harder group to convince are those who did not wear a
mask at all in the last seven days and oppose the policy. The most common
answer for not wearing a mask amongst these people is because it is no longer
mandatory (27%), suggesting that were there a rule change they may start
wearing again (albeit begrudgingly). The next most common reasons imply
stronger anti-mask sentiment, however, including because masks don’t work
(19%), they don’t like wearing them (13%) or general comments suggesting that
they do not feel the need to (14%).
All of this suggests that a great deal of people would return to
always wearing masks should the government tell them they have to once again. Historical precedent suggests the same. Back in July 2020, prior to
masks becoming compulsory, YouGov saw a similar gap between support and
personal action. Just before the rule change only 38% were wearing masks,
despite 80% supporting a policy to make it compulsory in shops. By the second
week of August (just a few weeks after the rule change) mask wearing had
risen to 75%. A YouGov
survey conducted just prior to the rules change had, as with this
month’s study, suggested that the reasons for not wearing masks were soft,
rather than a hard opposition to them in principle. The government still says it “expects and recommends” people continue
wearing face masks indoors. Many social problems are complex, expensive and
difficult to solve. For the most part, mask compliance is none of these. The
evidence strongly suggests that, if it wants more people to wear masks, the
best thing the government can do is simply tell them to. (YouGov UK) November 09, 2021 715-716-43-17/Polls Just Over Half Of Britons (54%) Believe That Their
Standard Of Living Will Remain The Same Over The Next Year
Ipsos MORI’s latest Political Monitor shows there are clear concerns
for the public when it comes to the cost of living, with 9 in 10 expecting
their monthly bills and other regular outgoings to rise next year (and over
half thinking they will rise a lot), around 8 in 10 believing inflation
will rise and similar for the taxes they pay, and 7 in 10 saying mortgage
interest rates will rise. Overall, just over half of Britons (54%) believe that their standard
of living will remain the same over the next year, while 16% think it will
rise and 28% expect it to fall. This is a similar picture to 2012, but more
pessimistic than 2013-2015. Women are more likely than men to say that their
standard of living will fall (25% vs. 31%) as are older people – 33% of those
aged 55+ said it would fall compared with 19% of 18–34 year-olds. New findings from the poll also include:
Meanwhile, there remains low levels of optimism for economic recovery
in the next year with the survey showing more than half (54%) thinking the
British economy will get worse over the next 12 months, 28% saying it will
improve, and 17% saying it will stay the same, giving a net Economic Optimism
Index of -26. Gideon Skinner, Head of Politics at Ipsos
MORI, says of the findings: While much of the focus has been on
standards in public life, these figures are a reminder that for the public
worries about the economy and cost of living are likely to be just as if not
more important. Nearly all are expecting monthly bills to rise, and a
majority think they will rise a lot – especially women and older people.
Meanwhile, concerns about rising inflation and interest rates are even higher
than on average during the 2012-2015 period (although there is a bit more
optimism about unemployment), as are worries about standards of living –
although most think this is likely to stay the same. This is all against a
backdrop of more general economic pessimism since the summer, suggesting this
will be a priority for the Government looking ahead. (Ipsos MORI) 10 November 2021 715-716-43-18/Polls Public Thinks That Tory Politicians Are More Interested In
Maintaining A Good Image For Themselves (56%) Rather Than Generating Action
On Climate Change
Demands for action on the climate crisis have continued to mount
since the beginning of COP-26 last week. Former Labour leader Ed Miliband has
called on the summit to ensure large companies are not let
off the hook by a focus on “long-term goals”. Elsewhere, prime
minister Boris Johnson has said that countries must meet promises
made on fighting climate change. However, a YouGov survey last
month found that the general public was highly sceptical of
politicians - only 13% thought those who call for action on the climate
crisis are doing so out of a desire to see progress, while 68% thought they
were doing it for a PR boost. A new survey asked Britons the same question, but specifically for
Conservative, Labour, and Green Party politicians. Overall, the public thinks
that Tory politicians are more interested in maintaining a good image for
themselves (56%) rather than generating action on climate change. Another 45%
think the same of Labour politicians. The public tends to see Green Party politicians as being genuine,
however. Half (48%) think their calls for climate action come from wanting to
see change, while 22% of people think they too are more interested in their
image. Conservative voters are more sceptical of
Conservative politicians than Labour voters are of Labour politicians Among those who voted Conservative in the 2019 general election, some
47% think their party’s representatives who call for climate measures are
only doing so to maintain their personal public image. Only a quarter of
Conservative-voting Britons think that Tory politicians who do so want to
generate positive action on the climate crisis. Labour voters, on the other hand, are split when it comes to their
own side. A third (34%) think Labour politicians calling for climate measures
are doing so to bolster their own reputation and image. Another 37% think
Labour politicians who do so are actually trying to generate action on the
issue. (YouGov UK) November 10, 2021 715-716-43-19/Polls Two Fifths Of The Public (40%) Think Second Jobs Should Not Be
Allowed At All
Boris
Johnson was probably expecting to spend the last few days
reaping the political rewards of the COP-26 climate
conference. Instead, his government is embroiled in
scandal, including a controversial vote on rules around MPs’ conduct, undeclared second
jobs,
and a Conservative MP working thousands of miles away from
their constituency. Despite this fallout, the
public is still generally in favour of allowing MPs to
hold second jobs (48%). However, this is
mostly formed of people who think such jobs should be
allowed only under certain circumstances
(39%), with just 9% who think they
should allowed without restriction.
Two fifths of the public (40%)
think second jobs should not be allowed at all.
While opposition is higher among Labour supporters (42%)
than Conservatives (31%), at least half of each
voting group (52% of Labour voters and 63% of Conservatives)
say second jobs should be allowed to some extent. It has also been
suggested that MPs should be banned from
second jobs,
with the caveat that their basic salary would be upped to make
up the difference. Some six in ten Britons (62%)
would oppose such a move, however, including over half of Conservative
voters (55%) and nearly seven in ten Labour (69%) voters. A quarter
of Conservative voters (27%) would be in favour, as would 18%
of Labour supporters. A separate YouGov
survey earlier this week also found 63% of Britons opposed to MPs taking on
work outside of parliamentary duties regardless of pay
changes. Nor do Britons seem to
see a need to increase MPs’ pay whether or not second jobs are
involved. Half of Britons (50%) think
the standard MP salary of £81,932 is already
too high, while around a third (34%) think it is about right. Only 7% of the
public think it is too low. Conservative voters are
divided on the issue: 39% say the current MP salary is too
high while 40% think it is right. Among Labour voters, 49% think MPs are paid
too much, compared to 41% who think the current pay packet is about
right. Is the
current government really any more corrupt than those that came
before? Boris Johnson has fought back
against the cries of sleaze and corruption by claiming the UK
is "not remotely a corrupt country". According to a separate
YouGov survey from earlier this week, four in five Britons
(80%), including 74% of Conservative voters, disagree, saying
that there is a “a lot” or “a fair amount” of corruption
in British politics. When it comes to Johnson
himself, nearly two fifths (39%) think he is more corrupt than
his predecessors – including one in ten Conservative voters (10%). Another 44% of the
public, and 71% of his own voters, say that Johnson is not better nor
worse than earlier prime ministers. Only 6% of the public and
12% of Conservative voters see Johnson as being less corrupt than those who
came before him.
Britons feel
similarly about corruption within the government more generally: 39% of
people see it as more
corrupt than previous governments, 46% say it's no
better or worse than those before it, and just 4% think it is less
corrupt. Again, Conservative voters see the current government as
no better nor worse (78%) than those earlier, with only 11%
thinking it to be more honest. When it comes to all
Conservative MPs - rather than just those in
government - some 35% of the public say they are more corrupt
than politicians from other parties, while 48% say they are no
different from the rest. Six in ten
Britons say the Conservative party gives off a sleazy impression While the public tends to
think Tory MPs are no more or less corrupt than
other politicians, they do consider them sleazier. Six in ten
people (60%) think that the Conservatives give the impression of being sleazy
and disreputable – including one in three (33%) of their own
voters.
When asked the same
of the Labour party, the public are split 33% to
36%. Unlike Conservative voters,
only one in ten Labour voters say their party is sleazy, with three-quarters
disagreeing that Labour gives off
a disreputable impression. Following their difficult week
dealing with their U-turn on standards and dealing with the fallout from
Paterson’s resignation, Rishi Sunak
says the
government will need to “do better” on standards. The public certainly agrees,
with few Britons (8%) thinking Boris Johnson has handled
the allegations well, regardless of their political allegiances. Two-thirds
of the public (66%) think he has handled them badly – including
39% saying he has performed “very badly”. Even among his party's voters,
54% think the prime minister has handled the issue badly, compared to 23% who
think he has handled it well. (YouGov UK) November 12, 2021 715-716-43-20/Polls 48% Of 10-15 Year Olds Put Climate Change At The Top Of Their Fears
For The Future
For the majority of them, childhood and entering adolescence is not a
source of carelessness and hope. More than 1 in 2 young people say that the
world of tomorrow will be worse off than it is today. Young girls are more
pessimistic (59% against 54% for young boys). Even more worrying, those under
10-12 are almost as pessimistic as the older ones (54% against 58% of 13-15
year olds). Climate change is their main concern, which probably explains in part
their fears about the future (cited first by 48% of them). Just behind, they
cite poverty (42%), at a very high level, which confirms a phenomenon already
observed: the fear of poverty is becoming very important among young people.
This figure also partly explains their uninhibited relationship with money,
it is not viewed negatively as it was for many generations of young people
before them. The health crisis (28%) scares them less than terrorism (31%),
with which they grew up and of which they may have felt the target (for
example during the Bataclan or Nice attacks). Racism and delinquency are two
concerns which are also very strong and which are practically equal in their
minds (25% and 24% respectively). To change society, young people first make the choice to align their
lives with their values, far ahead of collective action or political
commitment. To change society, young people advocate less political commitment to
overturn the table than to live "as it should". Admittedly, they
cite the fact of taking care of others and their loved ones (49%) first, the
family remains a strong value. But the most surprising thing is that they
just as much choose to consume better (48%) but also to have a job that
allows them to defend their ideas (40%), far ahead of voting (31%). A sign of
the times, to change society, they advocate speaking out on social networks
(13%) as well as getting involved in an association (13%) or demonstrating
(13%). Finally, getting involved in politics is now the last option they
consider (7%). Their pessimism about the future, their fears of poverty but also the
lack of confidence in politics to change things also probably explain for
many the weak questioning of current lifestyles. The vast majority of them
want to work later (91%), live as a couple (86%), have children (77%), live
in France (77%) or even study (75%). The health crisis has also probably partly changed their state of
mind about where to live. The city attracts only a part of them (only 49%),
many want to go to the countryside (49%), a little more 10-12 years (54%) but
also many 13-15 years (48%). Money is seen as very important for 10-15 year olds to be successful
in being happy in their life Money is not a taboo or a subject of rejection for the majority of
them, probably because of the very fears they express about the future (especially
poverty): 74% would like to earn a lot of money. money to be able to buy
whatever they want (versus 26% who would just like to earn what it takes to
live well). This attachment to money does not decrease with age, but it is a
little stronger among boys (77% versus 71% for girls). Again, this attachment
is probably a reflection of their fears about the future. A condition for being happy in life. The finding is unanimous, 92% of
young people questioned said it was. More than 1 in 3 young people even
believe that it is an essential condition for being happy in their life
(compared to 58% who say it is important but not essential). Money to help, save and plan, not to burn. Here again, young people
aged 10-15 amaze and clash. For the most part, it's not about having money to
spend all the time (only 20% of young people would 'slap' their money).
Almost 1 in 3 young people say that they would first choose to
"invest" it in a house, apartment or shares in a business (31%),
and nearly 1 in 5 would choose to put it aside in the bank (19%). If it was a
question of giving it, it would first be to family and loved ones (26%), more
than to an association (only 13%). Very young but already often managing their pocket money in a bank
account. Almost 8 in 10 young people say they receive pocket money (79%),
most often in cash (68%). But the majority of those who receive it have a
bank account (51%, 46% of 10-12 year olds and 55% of 13-15 year olds). 78% of
them already have or would like to have a bank account (compared to 22% who
do not). They may be young, but managing their money themselves is now a
problem. (Ipsos France) 8 November 2021 715-716-43-21/Polls 7 Out Of 10 French People Consider Themselves To Be Good Cooks (70%)
7 out of 10 French people consider themselves to be good cooks (70%).
Conversely, 25% consider themselves to be bad, a figure drawn on the rise by
men (33%). In addition, while 70% of the French population say they like to cook
(74% of women vs. 64% of men), 1 in 3 people say they rarely have the time to
do so (33%). Note: young people are those who lack the most time (50% of
18-34 year olds). In addition, more than half of respondents say that they often lack
inspiration when preparing the meal (54%), a figure once again pulled up by
18-34 year olds (66%). The French have been cooking more since the start of the health
crisis With the successive confinements and the various restrictions linked
to the Covid-19 pandemic, many French people have chosen to spend more time
behind the stoves. 35% of respondents say they have cooked more since the
start of the health crisis (45% of 35-44 year olds). The rise of cooking boxes Cooking boxes are home delivered baskets that contain the essentials
for a successful specific recipe: ingredients, spices, herbs, and the recipe. More than 6 in 10 people have heard of this concept (61%). We note
that its notoriety is stronger among the French who like to cook (66%) and
those who cook more since the start of the pandemic (67%). According to the results of our study, 26% of French people are
interested in the concept of cooking boxes, a figure that is rising by people
who lack time to prepare their meals (32%). By comparing the results by age
group, we also observe that 25-34 year olds are the most interested, at 41%. Conversely, 67% of French people are not attracted to the concept.
For what reasons ? 63% of them prefer to do their shopping themselves. Among the other
arguments raised, we find in particular the price, perceived as too high by
48% of the respondents, and environmental considerations (25%). What are the most popular cooking box brands in France There are significant generational differences: while HelloFresh,
which communicates a lot via social networks, is particularly popular among
18-34 year olds (51%), Quitoque is more famous among 35-44 year olds (50%). . Note: 44% of French people do not know any of the brands offered.
This figure rises to 58% among 55+. (YouGov France) Source: https://fr.yougov.com/news/2021/11/09/les-box-cuisiner-concept-qui-seduit-les-francais/ 715-716-43-22/Polls Despite An Increasingly Obvious Return To Normalcy, 40% Of Spanish
Citizens Still Say That The Pandemic Will Impact The Way They Buy These
Holidays
It seems, at this point in 2021, that the pandemic has entered a
recessionary phase, and with mass vaccination and the drastic reduction of
infections, the world's population is regaining confidence and gradually
returning to normal life. previous daily. This can be seen in the activity
that takes place in the streets, but also in the commercial premises, which
are once again filled with customers who come to see the latest in fashion,
technology or other products. Given this scenario and with Christmas just
around the corner, one of the periods of most consumption but the most, Ipsos
has wanted to analyze in the latest wave of his study Essentials, how
consumers approach Christmas shopping and what are the biggest challenges
facing brands and outlets. The first conclusion revealed by the study is that the return to
normalcy has brought with it the reactivation of consumption, which causes,
as we are seeing in many categories and as a consequence of the pandemic, a
mismatch between supply and demand. What are the biggest challenges facing consumers in their purchases
today? Globally, on average, 61% of respondents say they have faced a
challenge in the purchases they have made recently, placing the price first,
23% say they have perceived an increase in prices in recent weeks. Second, we
find the lack of stock of some products, mentioned by 20%, followed by issues
such as queues too long to pay in physical stores (16%) and even something
more typical of the pandemic such as feeling insecure in stores due to lack
of social distance (12%). For its part, in Spain 57% of citizens say they have had a challenge
to address in their purchases, in this case in the first position the lack of
stock (16%) at the same level as the perception of increases of price,
something that indisputably goes of the hand, to lower supply and greater
demand the prices increase. For their part, the people of Spain highlight the
overcrowding of stores (13%) followed by queues to pay too long (10%) as the
other two challenges they have experienced when they have gone shopping in
recent weeks. The unavailability of products at the time of purchase is an issue
that we have detected increasingly present in the latest waves of this study
and is a trend present both globally and in the 16 countries analyzed in this
study. In fact, a global average of 56% say they will advance their Christmas
shopping to prevent products from running out, being more common among
parents (67%) than among people who do not have children (50%). How will we buy this Christmas? According to the study, once most of the restrictions and perimeter
closures have been lifted, the number of people who believe the Covid-19 will
affect its way of shopping for this season's festivities is greatly reduced.
On average, 46% of the world's population still thinks that the virus will
affect the way they purchase products and services, 12 points lower than last
year, when it stood at 58%. In Spain, this perception also decreases, from 68% to 40%, one of the
largest declines in the countries analyzed, but which still places the Spanish
population among the Europeans who most declare that Covid will affect in its
form to buy these holidays. 30% say they will buy more online than in 2020, although the same
percentage of people say they will spend more time shopping at physical stores.
28% say they will buy more typical Christmas products to increase their
Christmas spirit and 27% say they will invest more in experiences than in
physical gifts. The categories where spending will increase the most in the coming
weeks will be food (17%), fashion and accessories (15%), telecommunications,
holidays and travel and restaurants and takeaway with 14% in all three cases
and 13% buy more on personal care and beauty products. (Ipsos Spain) 2 November 2021 NORTH
AMERICA
715-716-43-23/Polls The Self-Employed Are Back At Work In Pre-Covid-19 Numbers, But Their
Businesses Have Smaller Payrolls
The more than 150 million workers in the United States include about
16 million workers who identify as self-employed. They work for profit or
fees in their own enterprises and are
a representation of America’s small business owners. Many also
create jobs for other workers, on the order of about 30 million in recent
years.
A new Pew Research Center analysis of government data finds that
the COVID-19
recession, which curtailed business operations for public health reasons,
had a similar impact on employment levels among both those who are and are
not self-employed. However, the recovery has been stronger for self-employed
workers. At the same time, hiring by the self-employed has fallen since 2019,
with the cutbacks emanating mainly from businesses run by men. Self-employment can be a gateway
into the business world for the nation’s entrepreneurs. It can also
be a desirable
option for those wanting to be their own boss or in search of more
flexible work hours. Some workers who lose their jobs in business downturns
turn to self-employment, which has risen
during recessions. In the coronavirus
pandemic, it also may have been a useful option
for some parents juggling child care and work. How we did this The number of self-employed workers actively at work – not absent for
any reason – fell from 14.8 million in the second quarter of 2019 to 12.7
million in the second quarter of 2020, a decrease of 14.2%. Over the same
period, the number not self-employed who were actively at work fell from
137.3 million to 115.9 million, a loss of 15.5%. Thus, the immediate impact
of the recession, which lasted through March and April of 2020, was felt
similarly by the self-employed and the rest of workers. The number of self-employed workers actively at work rebounded
strongly in the economic recovery, increasing by 17.6% from the second
quarter of 2020 to the second quarter of 2021. This was sufficient to raise
the number of self-employed to 14.9 million, restoring it to 2019 levels.
However, employment among the remaining workers actively at work has not yet
recovered to its pre-recession level, standing at 131.4 million in the second
quarter of 2021 – still 5.9 million (4.3%) short of its level in 2019.
Changes in self-employment played out similarly among women and men,
both of whom experienced sharp losses in employment in 2020 and notable gains
in 2021. Some 5.2 million women were self-employed and actively at work in
the second quarter of 2019, but the number fell to 4.4 million in the second
quarter of 2020, a loss of 15.0%. Among men, self-employment dropped from 9.6
million in 2019 to 8.2 million in 2020, a loss of 13.7%. By the second
quarter of 2021, the number of self-employed women and men had risen to 5.4
million and 9.5 million, respectively, about the same as in 2019 and marking
a full recovery. Among workers who are not self-employed but are actively at work,
neither women nor men have returned to their pre-recession level of
employment. Among women, the number stood at 62.8 million in the second
quarter of 2021, down 2.7 million (4.1%) from the second quarter of 2019.
Over the same period, men who are not self-employed have experienced a 4.5%
drop in employment, from 71.8 million to 68.6 million. Hiring of other workers by the
self-employed Self-employed workers and the businesses they run are a significant
source of job creation. In 2019, the self-employed had 31.4 million employees
on their payrolls. Altogether, the self-employed and their employees
accounted for nearly 30% of total employment in the U.S. in 2019. That was
about the same as their share
of total employment in 2014, when the data first became available. But,
after holding steady in 2020, the number hired by the self-employed fell in
2021 and currently stands below its level in 2019.
In 2020, self-employed workers reported having 31.5 million workers
on their payrolls, about the same as in 2019. Meanwhile, the number of other
workers in the economy – neither self-employed nor working for the
self-employed – fell from 110.5 million to 98.7 million. It is not entirely clear why employment in businesses run by the
self-employed did not decrease during the recession. One reason might be that
the Current Population Survey – the government survey that is the source of
the estimate – asks about the “usual” number of employees on a self-employed
worker’s payroll. Pending more permanent downsizing of their businesses,
self-employed workers may not have reported a different level of hiring in
2020 than in 2019. A delay in reporting downsizing might also be the reason why the
payrolls of self-employed workers are estimated to have shrunk during the
economic recovery, from 31.5 million in 2020 to 28.3 million in 2021, even as
the employment of other workers increased from 98.7 million to 107.5 million.
It is also possible that the recent
increase in quit rates by workers has affected self-employed
business owners more. Nonetheless, the self-employed and their employees
still accounted for about 29% of total employment in 2021.
Self-employed men, who outnumber self-employed women, are also more
likely to have employees. Factors that appear to
drive this gender gap are differences in family obligations and the
distributions of men and women across industries. In 2019, about 26% of
self-employed men and 16% of self-employed women had payrolls. Moreover,
among the self-employed with employees, men hired 9.4 workers on average in
2019, compared with 7.6 workers on average among women. Thus, men account for
most of the hiring by the self-employed. In 2019, self-employed men had a total payroll of 24.7 million
employees and self-employed women had a payroll of 6.7 million. But the
number of workers employed by self-employed men fell to 21.2 million by 2021,
as these businesses cut hiring by about one worker each, on average. The
number of workers hired by self-employed women remained steady and, if
anything, appears to have risen during the pandemic, edging up to 7.1 million
in 2021. The reasons why self-employed men reduced hiring during the pandemic,
but women did not, are not readily apparent. Self-employed men are more
concentrated in construction, and self-employed women are more
present in service-sector industries, such as personal care and laundry
services. But overall employment trends in these two sectors have been
similar during the course of the pandemic, with job losses in construction no
more severe than the losses in service-providing industries.
Unfortunately, sample size limitations in the source data do not permit a
more detailed accounting of the gender differences in hiring trends among the
self-employed. (PEW) NOVEMBER 3, 2021 715-716-43-24/Polls A Majority (62%) Of Hispanic Adults Say Having A Darker Skin Color
Hurts Hispanics’ Ability To Get Ahead In The United States Today At Least A
Little
The perceived impact of skin color in the lives of U.S. Latinos is
broad. From impacting their ability to get ahead in the country to shaping
their daily life experiences to dealing with discrimination, skin color is
seen by Latinos as an important factor affecting their lives and life
chances.
A majority (62%) of Hispanic adults say having a darker skin color
hurts Hispanics’ ability to get ahead in the United States today at least a
little. A similar share (59%) say having a lighter skin color helps Hispanics
get ahead. And 57% say skin color shapes their daily life experiences a lot
or some, with about half saying discrimination based on race or skin color is
a “very big problem” in the U.S. today, according to Pew Research Center’s
National Survey of Latinos, a bilingual, national survey of 3,375 Hispanic
U.S. adults conducted in March 2021. Colorism is a form of discrimination based on skin color, usually,
though not always, favoring lighter skin color over darker skin color within
a racial or ethnic group. While it can be tied to racism, it is not
necessarily the same. (Racism is prejudice directed at members of a racial or
ethnic group because of their origin.) For example, Hispanics in the U.S. may
face discrimination because they are Hispanic (a form of racism), but the
degree of discrimination may vary based on skin color, with those of darker
shades experiencing more incidents (a form of colorism). And because of
colorism’s deep roots in the histories of
Latin America and the United States, discrimination based on skin color can
occur among Hispanics
just as much as it can be directed at Hispanics by non-Hispanics. To measure this dimension of Latino identity in the United States,
the survey asked respondents to identify the skin color that best resembled
their own using a version of the Yadon-Ostfeld skin-color
scale. Respondents were shown ten skin colors that ranged from fair to dark
(see text box below for the images and scale used). Fully 80% of Latino
adults selected a color between one and four, or lighter skin colors, while
15% selected a color between five and ten on the scale, or darker skin
colors.1 Discrimination and skin color Colorism in the Americas Discrimination based on skin color has deep historical roots in Latin
America and the Caribbean. Centuries ago, a hierarchical or caste
system was established in the Americas, tying privilege, individual
worth and access to opportunities to one’s skin color, race and birthplace.
This was further shaped by the arrival of slaves from Africa across the
region and the mixing of Indigenous, European and African populations. Today, skin color remains an important determinant of outcomes across
the region. Individuals with darker skin achieve lower levels of educational
attainment or have less access to health
care, for example. And those of lighter skin color experience less
discrimination than those of darker skin color. Colorism is present in the U.S. as
well and has similarly impacted the lives of Hispanics, Black Americans and
Asian Americans, existing alongside racial discrimination. And it is
similarly linked to
a number of outcomes.
For example, racism may impact both Hispanics of lighter skin and darker skin
color, but Hispanics
with darker skin may experience more discrimination. Overall, about half (54%) of Hispanic adults experienced at least one
of the eight discrimination incidents asked about in the survey,
reflecting broader and ongoing experiences
with discrimination among
U.S. Hispanics no matter their skin color. However, the new survey finds
Hispanics with darker skin color are more likely to have experienced at least
one discrimination incident than Hispanics with lighter skin color. Nearly
two-thirds (64%) of Hispanics with darker skin say they personally
experienced at least one of the eight discrimination incidents during the
year previous to the survey, while 54% of Hispanics with lighter skin color
say the same. Among the discrimination experiences included in the survey, being
treated as if they were not smart is the most reported. Some 42% of Latinos
with darker skin say this happened to them, as do 34% of Latinos with lighter
skin. The next most common discrimination experiences were those directed
at Hispanics by non-Hispanics and Hispanics alike, with the chances of these
incidents happening linked to skin color. Some 42% of Hispanics with darker
skin personally experienced discrimination or were treated unfairly by
someone who is not Hispanic,
while 29% of those with lighter skin say the same happened to them. And 41%
of Hispanics with darker skin say they personally experienced discrimination
or were treated unfairly by someone who is
Hispanic, while 25% of those who have a lighter skin color say
they too experienced discrimination by someone who is Hispanic.
Still, no matter their skin color and despite the notable gap,
Latinos are experiencing discrimination. About one-third (32%) of Latinos
with darker skin say someone told them to go back to their country, for
example, as did 20% 0f those with lighter skin. Some 33% of Latinos with
darker skin say someone criticized them for speaking Spanish in public, as
did 22% of those with lighter skin. And 27% of Latinos with darker skin say
they feared for their personal safety while 20% of those with lighter skin
say the same. While Latinos’ skin color is linked to discrimination experiences,
those with darker skin and lighter skin alike say skin color affects
opportunity and life experiences in America. For example, majorities of both
groups say skin color shapes their daily life experiences – 62% among Latinos
with darker skin and 57% among Latinos with lighter skin. And both groups are
just as likely to say darker skin color “hurts” Latinos’ ability to get ahead
in the U.S. (63% and 64% respectively). About half (49%) of Latinos with
lighter skin say discrimination based on race or skin color is a very big
problem, as do 41% of those with darker skin. Impact of race, skin color is a topic of
conversation with relatives and friends for Hispanics
Race, skin color and the state of race relations sometimes come up in
conversations Latinos have with family and friends. Roughly half (48%) say
discrimination based on race or skin color is a topic in conversations at
least sometimes with friends and relatives. But these conversations are not
happening frequently among all Latinos. About half (51%) say these conversations
with relatives and friends happen rarely (30%) or never (21%). Conversations about racial or skin color discrimination are happening
more often among Hispanics with darker skin than those with lighter skin.
Six-in-ten Hispanics with darker skin color (60%) say they often or sometimes
talk with family and friends about discrimination based on race or skin
color, a share that falls to 46% among Hispanics with lighter skin. And 44% say the topic of U.S. race relations often or sometimes comes
up when talking with family and friends. About half (52%) of Hispanics with
darker skin say this, as do 43% of Hispanics with lighter skin. Racial identity and experiences with racism have been a part of some
Latinos’ experiences growing up as well. About one-in-four Latinos (27%) say
their family talked to them at least sometimes about the challenges they
might face due to their race or ethnicity when they were growing up. This is
more common among Latinos who indicate they have darker skin (41%) than among
those who indicate they have lighter skin (25%). Capturing skin color among U.S. Hispanics A self-assessed measure of skin color was included in the survey as
one of four measures of racial identity. The survey used a version of the
Yadon-Ostfeld 10-point skin color scale, where one represents the lightest
skin color and 10 the darkest. (The scale used in the survey is reproduced
below.) Survey respondents were asked to select the color that most closely
matches their own, even if none of them were exactly right. Responses were distributed mostly toward lighter skin colors.
Eight-in-ten Hispanics selected one of the four lightest skin colors, with
the second-lightest ranking on top (28%), followed by the third (21%) and
fourth lightest colors (17%). By contrast, 15% of Latino respondents selected
one of the six darker skin colors, with only 3% in total selecting one of the
four darkest skin colors (7-10). For this report, those who indicated their
skin color is between one and four are identified as of a lighter skin color,
while those who indicated their skin color is between five and 10 are
identified as of a darker skin color.
Half of Latinos say there is too little
national attention on racial issues concerning Latino people After nearly a year of national engagement over issues of race
following the killing of George Floyd in May of 2020 and subsequent
nationwide racial justice protests, Latinos are split over whether there is
too much or too little attention paid to race and racial issues in the
country today. Overall, 37% say that too little attention is paid to these
issues, while 36% say there is too much attention and 25% say the amount of
attention given to race and racial issues is about the right amount.
The views of Latinos on this have shifted as the share saying too
little attention is paid to race relations has dipped compared with 2019
and 2020, when 50% and 46% of Latinos respectively said the same. At the
same time, a growing share say there is too much attention paid to race and
racial issues nationally. Some 36% say this today, up from 27% who said the
same in 2019. Even before recent events, Latinos were downbeat about race relations
in the U.S. In another 2019 Pew Research Center survey, six-in-ten Latinos
(60%) said race relations in the country then were generally bad and getting
worse. In the same survey, more Latinos said people not seeing racism where it
really does exist was
a bigger problem in the country than people seeing racial discrimination
where it really does not exist. Yet, when it comes to how much attention is paid to race and racial
issues concerning Hispanic people, about half of all Hispanics (51%) say too
little attention is paid to them today. Among Hispanics with darker skin, 57%
say too little attention is paid to racial issues concerning Hispanic people,
a higher share than the 50% of those with lighter skin color who say the
same. About as many Hispanics hold this view about the level of national
attention paid to race and racial issues concerning Asian people. Over half
(55%) of Hispanics say too little attention is paid to race issues concerning
Asian people in the country today. Meanwhile, 29% of Hispanics say the amount
of national attention paid to race issues concerning Asian people is about
right and 14% say too much attention is paid to these issues. (The survey was
fielded just as the number of hate and violence incidents
focused on Asian
Americans drew wide national attention.) At the same time, 30% of Hispanics say too little attention is paid
to race and racial issues related to Black people today, while 45% say too
much attention is paid to them and 23% say the right amount of attention is
paid to these issues. Hispanics often hear other Hispanics make
racially insensitive comments and jokes about Hispanics and non-Hispanics
alike
Hispanics are hearing racially insensitive comments and jokes coming
from other Hispanics, according to the survey. Nearly half (48%) of Hispanic
adults say they have often or sometimes heard a Hispanic friend or family
member make comments or jokes about other
Hispanics that might be considered racist or racially
insensitive. Similar shares of Hispanics who identify with a lighter skin
color (48%) or darker skin color (52%) say they have heard these types of
comments or jokes from friends or family at least sometimes. And 45% of Hispanic adults say the same about hearing a Hispanic
friend or family member make racist or racially insensitive comments or jokes
about others who are not Hispanic often
or at least sometimes. Among Hispanics with darker skin color, 53% say this,
a higher share than among Hispanics with lighter skin color (44%). This is little changed from 2019,
when a similar share of Hispanics (47%) said they heard a Hispanic friend or
family member make what might be considered a racist comment about people who
are not Hispanic. In
the same 2019 survey, half of those who heard these comments or jokes from
people close to them said they confronted a friend or family member about it. While Hispanics say skin color affects
their ability to get ahead in America, other factors are seen as important as
well
While a majority of Latinos say skin color impacts Latinos’
opportunity in the U.S. today, education and immigration status are viewed by
more as having an impact on the ability to get ahead. About eight-in-ten Hispanics (82%) say having a college degree helps
the ability of Hispanics to get ahead in the U.S. these days. And 78% say the
same about living in the U.S. legally. Both are higher than the 59% saying a
lighter skin color helps Hispanics get ahead in America and the 62% saying a
darker skin color hurts Hispanics. When asked if gender affects Hispanics’ ability to get ahead in the
U.S. today, about half (52%) of Hispanics say being a man helps, while 21%
say the same about being a woman. Roughly one-in-three say that being a
Hispanic man or woman is neither an advantage nor disadvantage in America
today. For Latinos, discrimination experiences and
views about skin color and race are linked
Latinos’ views on topics related to race or skin color differ by
their own experiences with discrimination. Those who reported experiencing at
least one of eight specific forms of discrimination asked about in the survey
were more likely than those who did not report one to say having a lighter
skin color helps at least a little in the ability of Hispanics to get ahead –
66% vs. 51% respectively.2 About two-thirds (68%) of Latinos who had a discrimination experience
in the past year say skin color shapes their daily life experiences a lot or
some, compared with 43% of those who had no discrimination experiences that
say the same. In addition, those who had at least one discrimination experience in
the past year were more likely than those who did not have such experiences
to say discrimination based on race or skin color is a “very big problem” in
the U.S., that discrimination based on skin color comes up often or sometimes
in conversations with family and friends and that too little attention is
paid to race and racial issues in the U.S. these days. (PEW) NOVEMBER 4, 2021 715-716-43-25/Polls Amid The Pandemic, A Rising Share Of Older U S Adults Are Now Retired
As employers contend with growing numbers of younger employees
quitting in the
great resignation, the COVID-19 recession and gradual labor market
recovery has also been accompanied by an increase in retirement among adults
ages 55 and older.
As of the third quarter of 2021, 50.3% of U.S. adults 55 and older
said they were out of the labor force due to retirement, according to a Pew
Research Center analysis of the most recent official labor force data. In the
third quarter of 2019, before the onset of the pandemic, 48.1% of those
adults were retired. In regard to specific age groups, in the third quarter
of 2021 66.9% of 65- to 74-year-olds were retired, compared with 64.0% in the
same quarter of 2019. The leading edge of the Baby Boomer generation reached age 62 (the
age at which workers can claim Social Security) in 2008. Between 2008 and
2019, the retired population ages 55 and older grew by about 1 million
retirees per year. In the past two years, the ranks of retirees 55 and older
have grown by 3.5 million. How we did this The large impact of the COVID-19 recession – February 2020 to April
2020 – on retirement differs from recent recessions and marks a significant
change in a long-standing historical trend toward declining or steady
retirement rates among older adults. During the Great Recession and its aftermath, retirement
rates declined. By the third quarter of 2010, 48% of adults ages 55 and
older were retired, down from 50% in the same quarter of 2007. The prior
recessions did not disrupt the longer-running trend of rising labor force
participation and declining retirement among older Americans that began
around 1997. Gradually declining retirement reflected in part rising
education levels among older Americans as well as gains in their health. In
addition, there were policy
changes in Social Security that may have impacted retirement
decisions. (For example, in 2000 the earnings test on benefit claimants was
no longer applied to those who had reached full retirement age.)
The financial context in which older adults are making retirement
decisions during the pandemic is markedly different from the Great Recession.
During that period – December 2007 to June 2009 – there was a steep
decline in the value of financial assets as well as home prices. The
resulting loss of wealth induced some older workers to remain in the labor
force and postpone
retirement. In contrast, household wealth has been rising since the onset
of the pandemic. House prices have been rising in most markets. The stock
market did have a sharp sell-off in March 2020 but reached new record highs
by August 2020. The retirement uptick among older Americans is important because,
until the pandemic arrived, adults ages 55 and older were the only working
age population since 2000 to increase their labor force participation. Labor
force participation for the entire working age population declined from an
annual average of 67% in 2000 to 63% in 2019. This partly reflects a steep
drop in participation among 16- to 24-year-olds (66% to 56%) as young people
increasingly pursued schooling rather than employment. Participation has also
been declining this century among the “prime working age” population, those
ages 25 to 54. The overall decline in labor force participation would have
been larger if adults 55 and older had not increased their labor force
participation (from 32% in 2000 to 40% in 2019). It is unclear whether the pandemic-induced increase in retirement
among older adults will be temporary or longer lasting. Newly published labor
force projections from the Bureau of Labor Statistics suggest it
will be temporary. BLS projects large increases in labor force participation
among older adults from 2020 to 2030, with nearly 40% of 65- to 69-year-olds
being in the labor force by 2030, up from 33% in 2020.
The recent retirement spike has not been uniform across demographic
groups. The share of older White adults who are retired increased 3
percentage points from Q3 of 2019 to Q3 of 2021. The retirement rate of older
Black adults did not significantly increase. The retirement rate of U.S.-born
adults ages 55 and older rose 3 points from 2019 to 2021, while the rate for their
foreign-born peers was unchanged. Retirement among those 55 and older who have completed at least a
bachelor’s degree rose 3 percentage points over this period. Among older
adults who have a high school diploma or less the rate increased 1 point. The
retirement rate increased for older adults living in metropolitan areas (2
points) and also increased for older adults in rural areas (1 point). (PEW) NOVEMBER 4, 2021 715-716-43-26/Polls 16% Of Americans Say They Have Ever Invested In, Traded Or Used
Cryptocurrency
The vast majority of U.S. adults have heard at least a little about
cryptocurrencies like Bitcoin or Ether, and 16% say they personally have
invested in, traded or otherwise used one, according to a new Pew Research
Center survey. Men ages 18 to 29 are particularly likely to say they have
used cryptocurrencies.
Overall, 86% of Americans say they have heard at least a little about
cryptocurrencies, including 24% who say they have heard a lot about them,
according to the survey of U.S. adults, conducted Sept. 13-19, 2021. Some 13%
say they have heard nothing at all. In 2015, the Center asked Americans different
questions that were focused exclusively on Bitcoin. At the time, 48%
of adults said they had heard of Bitcoin (to any degree), and just 1% said
they had ever collected, traded or used it. How we did this In the new survey, certain demographic groups are particularly likely
to say they have used cryptocurrencies, with some of the largest differences
by age and gender.
Roughly three-in-ten Americans ages 18 to 29 (31%) say they have ever
invested in, traded or used a cryptocurrency such as Bitcoin or Ether,
compared with smaller shares of adults in older age groups. Men are about
twice as likely as women to say they ever used a cryptocurrency (22% vs.
10%). These differences are especially pronounced when looking at age and
gender together. About four-in-ten men ages 18 to 29 (43%), for example, say
they have ever invested in, traded or used a cryptocurrency, compared with
19% of women in the same age range. Among both men and women, the likelihood
of having invested in, traded or used cryptocurrency decreases with age. Asian, Black and Hispanic adults are more likely than White adults to
say they have ever invested in, traded or used a cryptocurrency. There are no
statistically significant differences by household income. While majorities across demographic groups say they have heard at
least a little about cryptocurrency, smaller shares say they have heard a
lot. For example, adults under 50 (31%) and men (35%) are more likely than
older Americans (16%) and women (15%), respectively, to say they have heard a
lot. The share of adults who have heard a lot about cryptocurrency also
varies by race, ethnicity and household income. For example, 43% of Asian
Americans say they have heard a lot about cryptocurrency, compared with 29%
of Hispanic adults and about a quarter of Black or White adults. Americans
with higher incomes (31%) are more likely than those with middle (25%) and
lower incomes (21%) to have heard a lot about cryptocurrency. These findings emerge as government leaders and others debate
the regulation of cryptocurrency – which has
been defined as a medium of exchange that is digital, encrypted and
decentralized, with no central authority that manages and maintains its
value. Financial regulators have worried about policing
cryptocurrencies and have raised concerns about the long-term
viability of such currencies, such as Bitcoin. China recently banned
transactions using cryptocurrencies. U.S. Federal Reserve Board Chairman
Jerome Powell said this summer that these currencies need
more regulation, and the Biden administration is trying to combat
ransomware by cracking down on cryptocurrency payments. At the same
time, El Salvador in September became the first country to declare Bitcoin as
legal tender. (PEW) NOVEMBER 11, 2021 715-716-43-27/Polls Among 9-Year-Old Students, Around Four-In-Ten (42%) Said In 2020 That
They Read For Fun Almost Every Day, Down From 53% In Both 2012 And 1984
The shares of American 9- and 13-year-olds who say they read for fun
on an almost daily basis have dropped from nearly a decade ago and are at the
lowest levels since at least the mid-1980s, according to a survey conducted
in late 2019 and early 2020 by the National Assessment of Educational
Progress (NAEP). Among both age groups, the percentages who said in the 2019-20 school
year that they “read for fun on [their] own time almost every day” were at
their lowest points since the question was first asked in 1984, according to
the survey, which was fielded
among U.S. public and private school students before the COVID-19
outbreak. It is unclear whether the pandemic may have changed these
patterns.
How we did this Among 9-year-old students, around four-in-ten (42%) said in 2020 that
they read for fun almost every day, down from 53% in both 2012 and 1984. The share of 9-year-olds who said they never or hardly ever read for
fun on their own time was at its highest point since the question was first
fielded: 16% said this in 2020, compared with 11% in 2012 and 9% in 1984. In 2020, a quarter of 9-year-olds said they read for fun once or
twice a week, 9% said they do this once or twice a month, and 8% said they do
this a few times a year. Among 13-year-olds surveyed in the 2019-20 school year, 17% said they
read for fun almost every day, a smaller percentage than the 27% who said
this in 2012 and roughly half the share (35%) who said this in 1984. About
three-in-ten students in this age group (29%) said they never or hardly ever
read for fun, up 21 percentage points from the 8% who said the same in 1984. Around a quarter of 13-year-olds (23%) said in the most recent survey
they read for fun once or twice a week, while fewer than two-in-ten said they
read for fun either once or twice a month or a few times a year (16% and 15%,
respectively). The NAEP’s questionnaire has historically asked 17-year-old students
how often they read for fun, but that portion of the 2020 survey – scheduled
to begin last March – was canceled when many schools moved
instruction online at the beginning of the COVID-19 outbreak. When the
question was last asked in 2012, just 19% of 17-year-olds said they read for
fun almost every day. Around a quarter (27%) said they never or hardly ever
read for fun.
In the 2020 survey of younger children, female students were more
likely than male students to say they read for fun. Nearly half of female
9-year-old students (46%) said they read for fun almost every day, compared
with 38% of male students of the same age. And two-in-ten 13-year-old female
students reported reading for fun almost every day, while 14% of their male
counterparts said they did so. The share of both male and female students who say they read for fun
almost daily has declined across both age groups since 1984. There was a
21-point decrease among 13-year-old girls and a 12-point drop among
9-year-old girls. There were 11- and 16-point decreases for 9- and
13-year-old boys, respectively.
When it comes to race and ethnicity, 9-year-old students who are
Asian American, White or Hispanic were more likely to say they read for fun
almost every day than were their Black peers in 2020. Around four-in-ten or
more Asian (50%), White (44%) and Hispanic (41%) students said this, compared
with 35% of Black students. Among 13-year-olds, 28% of Asian students said
they read for fun almost every day, along with two-in-ten White students who
said they do this almost every day. These shares are larger than the shares
of Black (15%) and Hispanic (10%) students who said the same. Students who performed better on the reading section of standardized
tests in 2020 reported reading for fun more frequently. For example, half of
9-year-old students who scored at or above the 75th percentile on the 2020
reading component of the NAEP reported reading for fun on their own time
almost every day, compared with 39% of 9-year-old students who scored below
the 25th percentile. (PEW) NOVEMBER 12, 2021 715-716-43-28/Polls About Three-Quarters (74%) Of Canadians Visited A Social Networking
Site In 2021, Up From 69% In 2020
Social media and influencer marketing are expected to play larger
roles in marketing plans as part of a pandemic-accelerated shift to digital,
with a net 70% of marketers estimating increased spend on social in 2022,
according to the 15th annual Digital Marketing Pulse Survey released today by
Ipsos Canada, the Canadian Marketing Association and strategy. More than nine in 10 (93%)
marketers and agencies say they use social tactics always or often, even as
people resume pre-pandemic behaviors. “Marketers’ growing reliance on social is due to the effectiveness
attributed to this tactic, the ease with which consumers are reachable, and
the need of many public companies for short-term results,” says Steve Levy at
Ipsos in Canada. “We expect to see more resources devoted to paid ads on
social, social media content creation, community building and influencer
marketing.” The success of the social marketing reflects consumers’ activities on
the channel, which returned to, and in some cases surpassed, 2019 levels.
About three-quarters (74%) of Canadians visited a social networking site in
2021, up from 69% in 2020, and 60% are willing to receive information from a
social network, a three-year high. “Little deters Canadians in their use of social media,” says Levy.
“The public may express some concerns over privacy and safety, but they do
little to change their social media behaviour.” Influencer marketing is also gaining importance, with nearly four in
10 marketers (39%) using influencer marketing always or often, a historic
high. Email marketing continues to be strong and, as shoppers return to
retail, marketers are again turning to on-premise digital signage. “The research shows marketers’ resilience and adaptability, even in
unprecedented times, to reach their customers” says John Wiltshire, president
and CEO of the Canadian Marketing Association. “Most consumers today have
high expectations that brands will provide them with relevant, personalized
offerings, and marketers are diligent in meeting their expectations.” While the squeeze on Canadian ad agencies persists in 2021, there is
a continued appetite to retain some core tactics, largely email marketing,
websites, and SEO in house citing accelerated turnaround time and a reduction
in costs. “As marketing leaders face change on so many fronts, relaying how
their counterparts are approaching new market realities is a valuable
framework for planning. This year’s Pulse check helps us understand how
brands are responding to their common challenges – context that marketers are
asking us for," says Lisa Faktor, associate publisher of strategy. The Digital Marketing Pulse Survey measures familiarity and usage of
15 digital marketing tactics among client-side marketers and agencies. The
study also includes a consumer poll on their perceptions and behaviors. (Ipsos Canada) 2 November 2021 AUSTRALIA
715-716-43-29/Polls Support For New Zealand’s Labour/Greens Government Was Down 5% Points
To 50% In October As Support For The Labour Party Dropped 6% Points To 39.5%
The governing parties are now only 6% points ahead of the
Parliamentary opposition National/Act NZ/ Maori Party on 44%, up 3% points
since September. The increase was driven by a rise in support for National,
up by 3% points to 26%. Act NZ was unchanged at a record high of 16% and
support for the Maori Party was unchanged at 2%. A small minority of 6% of electors support other minor parties outside
Parliament with support for New Zealand First up 1% point to 2.5%, The
Opportunities Party down 0.5% points to 1% and support for the New
Conservative Party is at 1.5% in October. This latest New Zealand Roy Morgan Poll on voting intention was
conducted by telephone – both landline and mobile – with a New Zealand-wide
cross-section of 929 electors during October. Electors were asked: “If a New Zealand Election were held today which
party would receive your party vote?” Of all electors surveyed
there are 4%, down 1% point, that didn’t name a party. New Zealand Government Confidence Rating
drop 15.5pts to 109.5 in October – the lowest since Jacinda Ardern became
Prime Minister four years ago in late 2017 The Roy Morgan Government Confidence Rating dropped by 15.5pts in
October to 109.5 to be at its lowest since Prime Minister Jacinda Ardern came
to office four years ago in October 2017. The drop in Government Confidence
came after the Auckland lockdown was extended throughout October. In October only 48% (down 9% points) of New Zealand electors said New
Zealand was ‘heading in the right direction’ compared to 38.5% (up 6.5%
points) who said New Zealand was ‘heading in the wrong direction’. The latest ANZ-Roy
Morgan Consumer Confidence Rating was down by 6.5pts to 98 in
October and is now below the latest Consumer
Confidence figure in Australia of 106.8 on October 23/24, 2021 after
the Australian cities of Sydney, Melbourne and Canberra all emerged from
lockdown earlier in October. Women continue to favour Labour-Greens
while men favour National-Act NZ Prime Minister Jacinda Ardern’s strength lies with the massive edge
in support that the Labour Party receives from women. Nearly three-fifths of
women (57.5%) support either Labour (49%) or the Greens (8.5%) compared to
only 42% of men supporting either Labour (28.5%) or the Greens (13.5%) – a
massive ‘gender gap’ of 20.5% points in favour of Ardern’s Labour Party among
women. Men are more likely to support the Parliamentary opposition with
48.5% supporting either National (28.5%), Act NZ (17.5%) or the Maori Party
(2.5%) compared to 40% of Women supporting either National (24%), Act NZ
(14.5%) or the Maori Party (1.5%). Roy Morgan Government Confidence Rating is
116 for Women compared to 102.5 for men The trends are confirmed by the latest Roy Morgan Government
Confidence figures which show 49.5% of women say New Zealand is ‘heading in
the right direction’ compared to 46% of men but only 33.5% of women say New
Zealand is ‘heading in the wrong direction’ compared to 43.5% of men. Overall, this produces a Roy Morgan Government Confidence Rating of
116 for women compared to only 102.5 for men – a gap of 13.5 points. Party vote analysis by Gender
*The Roy Morgan Government Confidence
Rating is 100 plus the difference between the percentage of Kiwis who say the
country is “heading in the right direction” and the percentage who say the
country is “seriously heading in the wrong direction”. “Today’s Roy Morgan New Zealand Poll shows
New Zealanders appear to finally be growing weary of using lockdowns to stop
the spread of COVID-19 with the country now achieving high rates of
vaccination. As of this week 87% of the eligible population has had at least
one vaccine dose and 72% of the eligible population is now fully vaccinated. “The full vaccination rate in New Zealand
(72%) is just behind the figure in neighbouring Australia (76%) in which
extended lockdowns in Greater Sydney, Greater Melbourne and Canberra have all
ended in the last few weeks as full vaccination rates exceeded 70%. “Support for the Labour-led Government dropped
to 50% in October, down 5% points from September. Support for Labour was at
39.5% (down 6% points) while support for the Greens was up 1% point to 10.5%. “In contrast, support for the Parliamentary
Opposition was up 3% points to 44% in October with an increase in support for
National, up 3% points to 26%, driving the increase. Support for the ACT NZ
was steady at the record high of 16% and support for the Maori Party was
unchanged at 2%. “Confirming the drop in support for the
Labour-led Government were the falls in October in the key Roy Morgan
Confidence indicators. The Roy Morgan Government Confidence Rating dropped to
109.5, down 15.5pts from September. This is the lowest Government Confidence
Rating since Prime Minister Jacinda Ardern came to power four years ago in
October 2017. Amongst men, Government Confidence is just barely in positive
territory at 102.5. “Along with the fall in Government
Confidence there has also been a fourth straight monthly fall in the ANZ-Roy Morgan Consumer Confidence Rating, down
6.5pts to 98. This is the
lowest Consumer Confidence Rating since May 2020 (97.3) in the early stages
of the pandemic. “Prime Minister Jacinda Ardern has flagged
a significant decrease in restrictions will take place when 90% of the
eligible population aged 12+ is fully vaccinated which is likely to occur in
early December. “This strict benchmark could well see
support continue to drift away from the governing Labour party over the next
two months as countries such as neighbouring Australia open up more fully to
domestic and international travel in November.” New Zealand Party Vote: 2020-21
New Zealand Party Vote: NZ Govt. v
Parliamentary Opposition
Roy Morgan NZ Government Confidence Rating
vs. ANZ-Roy Morgan NZ Consumer Confidence
Voting Intention Summary The following table compares the latest New Zealand Roy Morgan Polls
on Voting Intention with the result from the October 17, 2020 General
Election:
*The 1996 Election was the first New
Zealand Election contested via MMP (Mixed Member Proportional). At the 1996
Election the Greens Party contested as part of the “Alliance” political
grouping with four other political parties. Two-Party Preferred: Labour Party-led
Government vs. Parliamentary Opposition Parties *At the 2020 NZ Election the Labour party
secured 50.01% of the vote which was enough to govern in their own right but
Labour opted to sign a ‘Cooperation Agreement’ with the Greens, who won 7.86%
of the vote. There were three Parties elected to Parliament not in Government
led by National (25.58%), Act NZ (7.59%) and the Maori Party (1.17%).
(Roy Morgan) November 01 2021 Source: https://www.roymorgan.com/findings/8849-nz-national-voting-intention-october-2021-202111010502 715-716-43-30/Polls Australian Unemployment Increases To 9.2% In October – As Over 12
Million Australians Are Released From Long Lockdowns
The workforce in October was 14,339,000 (down 234,000) – comprised of
13,019,000 employed Australians (a decrease of 289,000) and 1,320,000
unemployed Australians looking for work (up 55,000).
Australian employment dropped 289,000 to 13,019,000 in October driven
by the decrease in part-time employment, down 379,000 to 4,281,000, the
lowest for over a year since August 2020. In contrast, full-time employment
increased by 90,000 in October to 8,738,000.
1,320,000 Australians were unemployed (9.2% of the workforce), up 55,000 from September. Driving
the increase was more people looking for part-time work (up 114,000 to
849,000) while there was a decrease in people looking for full-time work
(down 59,000 to 471,000). Roy Morgan Unemployment &
Under-employment (2019-2021)
Roy Morgan’s unemployment figure of 9.2%
for October is over 4% points higher than the current ABS estimate for September 2021 of 4.6%.
However, the ABS figure for September counts as employed an additional
184,800 Australians who were working zero hours for ‘economic reasons’ and
263,400 Australians who were working zero hours for ‘other reasons’ – such as
being forced out of work by mandatory lockdowns. If these 448,200 non-workers are added back the ABS unemployment
estimate for September increases to 1.07 million (7.9%). The ABS also claims
there are nearly 1.25 million Australians (9.2%) under-employed for a total
of over 2.32 million unemployed or under-employed (17.1% of the workforce) – a
similar estimate to the latest Roy Morgan unemployment and under-employment
estimate of 17.8%.
In addition to those who were unemployed, 1.23 million Australians
(8.6% of the workforce) were under-employed – working part-time but looking
for more work, an increase of 64,000 (up 0.6% points) on September. In total
2.55 million Australians (17.8% of the workforce) were either unemployed or
under-employed in October, an increase of 119,000 on September. Compared to early March 2020, before the
nation-wide lockdown was implemented, in October 2021 there were almost
400,000 more Australians either unemployed or under-employed (+2.2% points)
even though overall employment (13,019,000) is higher than it was
pre-COVID-19 (12,872,000). Michele Levine, CEO Roy Morgan, says
Australia has finally emerged from a winter of long lockdowns of NSW,
Victoria and the ACT and with the easing of restrictions hopes are high we
are set to experience a period of strong growth in the months ahead: “The latest Roy Morgan employment estimates
for October show unemployment increasing 0.5% points to 9.2% and
under-employment increasing 0.6% points to 8.6%. This means total
unemployment and under-employment of 17.8%, very similar to that of August
(17.7%) and July (17.9%) during the initial stages of the recent lockdowns in
Sydney, Melbourne and Canberra. “The increasing unemployment and
under-employment nationally was driven by NSW and Victoria, both of which
started the month in lockdown. Other States, including Queensland and South
Australia, had increasing full-time employment in October with both State
Premiers outlining plans to re-open their respective State borders in the
lead-up to Christmas. “Looking at an industry-specific level
shows the industries to shed jobs during October were led by retail,
recreation and personal services and community services – all industries that
are disproportionately impacted by extended lockdowns and store closures. “October was the month Australia finally
started to emerge from months of lockdowns with Greater Sydney emerging from
a 107-day lockdown on Monday October 11, Canberra’s two-month lockdown ending
on Friday October 15, Melbourne’s sixth lockdown ended a week later on Friday
October 22 and earlier that week Hobart’s second lockdown ended on Monday
October 18. October was (hopefully) the last month we see widespread
lockdowns around Australia although there is always the chance a COVID-19
variant arises in the future that could cause renewed lockdowns. “The end of the lockdowns has allowed the
re-opening of many businesses that have been forced to close because of heavy
restrictions. Industries including hospitality, retail stores, arts and
recreation and personal services such as hairdressers and personal training
have been the hardest hit by COVID-19 restrictions and their re-opening is
set to drive a surge in employment during the next few months. “This prediction is based upon the
experience of Australia’s employment markets when Victoria exited its long
second lockdown in October 2020. From November 2020 to July 2021 full-time
employment in Australia increased for a record eight months in a row by
866,000 to a record high of 8,826,000. “Although the increases in employment are
unlikely to match the resurgence from a year ago there is likely to be a
strong rebound in the industries most heavily impacted by the COVID-19
lockdowns as more than 12 million Australians who’ve been forced to remain at
home for months are allowed to return to their normal lifestyles and spend
some of the savings built up over the last few months. “Roy Morgan’s data scientists working in conjunction
with the Australian Retailers’ Association (ARA) have forecast pre-Christmas
retail sales of $58.8 billion over the next two months – matching last year’s record and up over 11%
on the pre-Christmas sales in 2019. The strong forecast signals a strong
resurgence for the retail industry in the months ahead. “Another strong signal about the expected
resurgence of the Australian economy over the next few months is the
exceptionally strong Roy Morgan Business Confidence Rating for October
of 115.3, up 10.7pts (+10.2%) from September. “Businesses became increasingly confident
about the period ahead during October as State Governments provided more
certainty about their re-opening roadmaps and Business Confidence was above
the long-run average of 113.8 for the first time in three months since July
2021. “Looking forward we expect to see the
strength in Business Confidence and spending expectations to translate into
employment growth in the run-up to Christmas and into the early months of
2022. There are risks to this forecast though and these include the threats
of rising inflation next year and future lockdowns caused by potential
COVID-19 variants evading vaccines.” These threats, and several others, are explored fully in the Special
Roy Morgan Micro Webinar on the Future of Retail in the run-up to Christmas
and into 2022. View
this informative webinar with Roy Morgan CEO Michele Levine and social
scientist Ross Honeywill (15 mins). Roy Morgan Unemployed and ‘Under-employed’*
Estimates
*Workforce
includes those employed and those looking for work – the unemployed. This Roy Morgan survey on Australia’s unemployment and ‘under-employed’* is based on weekly
interviews of 791,560 Australians aged 14 and over between January 2007 and
October 2021 and includes 7,407 telephone and online interviews in October 2021. *The ‘under-employed’ are those people who are in
part-time work or freelancers who are looking for more work. Contact Roy Morgan to learn more about
Australia’s unemployed and under-employed; who and where they are, and the challenges they
face as they search for employment opportunities. Visit the Roy Morgan Online Store to
purchase employment profiles, including for Australians who are employed, unemployed, under-employed, employed part-time, employed full-time, retired, studying and many more. Roy Morgan Research cf. ABS Unemployment
Estimates
Source: Roy Morgan Single Source October 2006 –
October 2021. Average monthly interviews 4,000. Roy Morgan Research cf. ABS Unemployment
Estimates
Source: Roy Morgan Single Source January 2000 – October
2021. Average monthly interviews 4,000.
Source: Roy Morgan Single Source April 1995 – October 2021.
Average monthly interviews 4,000. (Roy Morgan) November 08 2021 Source: https://www.roymorgan.com/findings/8834-australian-unemployment-estimates-october-2021-202111050814 MULTICOUNTRY
STUDIES
715-716-43-31/Polls Nearly Three Quarters (72%) Of The Scottish Public Believe That The
Uk Is Already Feeling The Effects Of Climate Change, Compared With 67% Of The
Uk Public
New analysis from two surveys by Ipsos MORI and the Climate
Engagement Partnership, a collaboration between Ipsos MORI and the Centre for
Climate Change and Social Transformations (CAST), shows that Scots are even
more supportive of climate justice than our neighbours south of the border
are. An Ipsos MORI KnowledgePanel survey of 9,999 UK adults, including
1,911 in Scotland, conducted in late September and early October shows that:
Belief that the UK is already feeling the effects of climate change
and the desire for the UK to reach net zero sooner than 2050 are both higher
in Scotland than in the UK overall. A second Ipsos MORI KnowledgePanel survey
of over 5,600 UK adults, including 1,051 in Scotland, conducted in late
August shows that:
Public awareness of government net zero emissions targets in both
Scotland and the UK is relatively high. Three in five (60%) of Scots say they
have heard of the Scottish Government’s target of achieving net zero in
Scotland by 2045, while two in five (39%) say they have not heard of it.
Awareness of the UK Government target of net zero by 2050 is even higher: 79%
of both the Scottish public and the UK public say they have heard of this
target.
Emily Gray, Managing Director of Ipsos MORI
Scotland, commented: With the eyes of the world on Glasgow ahead
of the COP26 summit, these findings show strong support among Scots for
policies supporting developing countries in the fight against climate change.
While most of us are worried about climate change, we don’t feel we know much
about what action is needed to reduce our carbon emissions. Public engagement
will be critical in addressing that gap and supporting people through the
transition to net zero. Professor Lorraine Whitmarsh, Professor of
Environmental Psychology and Director of CAST, said: These findings show the Scottish public has
a strong sense of climate justice, recognising that richer countries are more
responsible for climate change and should do more to tackle it. At the same
time, Scots see climate change as a risk for their own country right now –
and many want governments to speed up the timeframe for acting. This strong
public mandate for rapid and fair climate action should spur UK leaders at
COP26 to show leadership in the global fight against climate change. (Ipsos MORI) 1 November 2021 715-716-43-32/Polls No More Than Three-In-Ten Adults See The U S Military As The Best In
The World: Survey Findings From 17 Advanced Economies
Americans don’t always see eye to eye with
people in other societies over various dimensions of U.S. “hard” and “soft”
power, according to a February Pew Research Center survey of the United
States and 16 other advanced economies. While Americans see some aspects of
U.S. power more positively than people elsewhere, they offer more negative
views in other areas.
When it comes to the U.S. military, for
example, 44% of U.S. adults say it’s the best in the world and another 34%
describe it as above average. These self-evaluations are slightly rosier than
those offered by publics in the other advanced economies surveyed, where,
outside of South Korea (42%) and Taiwan (37%), no more than around
three-in-ten adults see the U.S. military as the best in the world. Still,
large majorities in the U.S. and every other place surveyed describe the
American military as at least above average. How we did this
Around three-in-ten Americans (29%)
describe their country’s entertainment products – including movies, music and
television – as the best in the world, while another 39% call them above
average. Large majorities in every other place surveyed agree that U.S.
cultural exports are at least better than average, but only in Greece, Japan,
Singapore and Italy are people as likely as Americans to declare the U.S. the
global leader. Americans are notably less positive when it comes to
their nation’s technological achievements. Only 16% think U.S. achievements
in this area are the best in the world. On this question, people in other
countries are slightly more likely
to see the U.S. positively. A median of 20% of adults across the 16 other
advanced economies say U.S. technology is the best in the world, including
45% in Greece, 38% in South Korea and 31% in Taiwan. While relatively few
Americans see their own country’s technological achievements as the world’s
best, 64% of U.S. adults see them as at least better than average – a view
that is broadly shared across the other surveyed publics (median of 72%). Americans do not offer especially glowing
evaluations of their universities, either. Only 14% call them the best in the
world, though another 33% describe them as better than average. Across the
other publics surveyed, a median of 59% describe U.S. universities as at
least better than average. And in Greece (40%), South Korea (31%), Japan
(24%) and Singapore (23%), around a quarter or more describe them as the best
in the world. When it comes to the U.S. standard of
living, around half of Americans (51%) describe it as above average or
better, including 12% who call it the best in the world. Yet outside of
Taiwan (53%), South Korea (52%), Spain (51%) and Greece (47%), people in
other advanced economies offer less positive assessments. Across the other 16
places surveyed, a median of only 33% describe the U.S. standard of living as
above average or better. In fact, in most places, a plurality describes the
American standard of living as solidly “average” – including half who give it
this rating in Germany. Around half of the Dutch (47%) and Swedes (53%) call
the American standard of living below average or worse. Few people in any of the advanced economies
surveyed – the U.S. included – describe the American health care system as
the best in the world. Americans themselves are relatively divided over
whether it is better than average (31%), average (30%) or worse than average
(39%). Elsewhere, majorities say the American health care system is below
average or worse, including one-in-five or more in Australia (24%), Spain
(20%) and Belgium (20%) who say the American health care system is the worst
in the world. Views differ by age, income, party
affiliation
Younger people tend to evaluate America
more positively than older people in some of the advanced economies surveyed.
In the U.S., however, the opposite is often true: Older Americans, for
example, are more likely than younger adults to describe their nation’s
standard of living, health care system, military, technological achievements
and universities as above average. Younger Americans, however, are more
likely than older adults to see their country’s entertainment products
positively. Across many advanced economies surveyed,
people with higher incomes are more likely than those with lower incomes to describe
the U.S. as above average across nearly all dimensions asked about – with the
notable exceptions of the health care system and the overall standard of
living. In the U.S., however, higher-income people are more likely than
lower-income people to compliment America’s standard of living.
In the U.S., there are also stark partisan
and ideological differences in views about American power. Republicans and
independents who lean toward the Republican Party are more likely than
Democrats and Democratic leaners to describe America’s health care system,
standard of living and military as above average or better. The opposite is
true when it comes to universities and entertainment. (PEW) NOVEMBER 1, 2021 715-716-43-33/Polls A Survey Of 17 Advanced Economies Highlights The Complexity Of
America’s International Image
As Pew Research Center surveys have documented, the United
States’ global
reputation has shifted dramatically over the past two decades, often
improving or declining depending on who is in the White House and the foreign
policies they pursue. At the same time, many other factors have continued to
shape how people see the U.S., including its vast cultural reach, its
economic model and its divisive politics. A survey of 17 advanced economies
highlights the complexity of America’s international image. People in other publics
find much to admire about the U.S., but they see many problems as well.
Americans, for their part, also see both strengths and weaknesses in their
society.
The most positive elements of America’s image are tied to some of its
most famous exports, with the U.S. receiving considerable praise for its
technology and popular culture. When asked to compare American technological
innovations with those of other developed nations, respondents give the home
of Silicon Valley favorable reviews. Across the 16 publics polled outside of
the U.S., a median of 72% say U.S. technology is the best or above average.
The U.S. is, of course, also home to Hollywood, and most of those surveyed
give the U.S. high marks for its entertainment, such as movies, music and
television. A median of 71% think American entertainment is the best or above
average.
The U.S. is also widely recognized for its military strength, with a
median of 45% across 16 publics describing the U.S. military as above average
and a median of 26% saying it is the best. In addition, American universities
are largely praised (43% above average, 16% the best). However, views about American living standards are mixed. In most
countries, pluralities say that, compared with other developed nations, the
U.S. standard of living is average, although in Greece, Spain, South Korea
and Taiwan, about half say it is above average or the best. In Sweden, the
Netherlands and Australia, more than four-in-ten think it is below average or
the worst. The U.S. health care system gets poor reviews: A median of 48% say it
is below average and 18% consider it the worst among developed nations. Over
the past two years, Pew Research Center polls have found that foreign publics
are widely
critical of how the U.S. has handled the COVID-19
pandemic, and those who believe the U.S. has done a bad job of dealing
with the crisis are especially likely to give the U.S. health care system low
ratings. Attitudes toward these elements of America’s image vary across the
publics surveyed, with Greece, Taiwan, South Korea, Spain, Italy and Japan
giving the U.S. some of its most positive reviews, while Germany, the
Netherlands, Australia, New Zealand and Sweden give the U.S. some of its
lowest assessments. The survey, which was conducted less than a year after international
protests erupted following the murder of George Floyd by a Minneapolis police
officer, finds widespread criticisms about the current state of civil rights
in America. Large majorities say discrimination against people based on their
race or ethnicity is a serious problem in the U.S., and in most countries,
majorities say it is a very serious problem. And while many say
discrimination is also a serious problem in their own countries, they
consistently say discrimination is worse in the U.S. than in their country.
Respondents who place themselves on the left of the ideological
spectrum are especially likely to say discrimination in the U.S. is a very
serious problem. For example, 81% of Canadians on the left believe it is a
very serious problem, compared with 66% of those in the center and 52% of
Canadians on the political right. As previously reported,
America’s overall image improved significantly following the election of
President Joe Biden, but many nonetheless express significant doubts about
the health of American democracy. Few believe U.S. democracy, at least in its
current state, serves as a good model for other nations. A median of just 17%
say democracy in the U.S. is a good example for others to follow, while 57%
think it used to be a good example but has not been in recent years. Another
23% do not believe it has ever been a good example. Americans largely share
the view that their democracy is no longer a model: 72% say U.S. democracy
used to be a good example for others to follow but has not been recently.
Democrats and independents who lean toward the Democratic Party are twice as
likely as Republicans and independents who lean Republican to say the U.S.
has never been a good
model.
Americans are also critical of other aspects of their society.
Roughly four-in-ten (42%) think discrimination based on race or ethnicity is
a very serious problem, and 32% say it is a somewhat serious problem. Black
(93%) and Hispanic (82%) adults are significantly more likely than White
adults (68%) to describe discrimination as at least a somewhat serious
problem. Democrats (94%) are also nearly twice as likely as Republicans (49%)
to say racial and ethnic discrimination is a serious issue in the U.S. And while they are more positive than foreign publics about the U.S.
health care system, roughly four-in-ten Americans say it is either below
average (32%) compared with other developed nations or it is the worst (7%).
Americans actually give U.S. universities lower ratings than foreign publics
do – just 47% in the U.S. say their universities are above average or the
best, compared with a median of 59% across those polled outside the U.S. Like
the other publics surveyed, Americans are largely positive about their
technological achievements, entertainment and military. Republicans are
generally more positive about these various aspects of American society,
although Democrats offer more favorable reviews of the country’s movies,
music and television. For more on how U.S. views of American society compare
with international views, see “Americans
differ from people in other countries over some aspects of U.S. ‘hard’ and
‘soft’ power.”
Young Americans are often less positive about the aspects of their society
included on the survey. Those ages 18 to 29 are less likely than those ages
65 and older to say the United States’ standard of living, health care
system, military and technological achievements are above average or the
best. In contrast, young people in many places outside the U.S. tend to be
more likely to see some of these aspects of America’s image in a positive
light. However, young people both in and outside the U.S. are particularly
fond of American popular culture. In every public surveyed – including the
U.S. – people ages 18 to 29 are more likely than those ages 65 and older to
rate U.S. entertainment as above average or the best. For example, 84% of
those ages 18 to 29 in Taiwan hold this view, compared with just 39% of those
ages 65 and older. These are among the key findings of a Pew Research Center survey,
conducted from Feb. 1 to May 26, 2021, among 18,850 adults in 17 advanced
economies. The survey also finds that about six-in-ten across the publics
surveyed say the U.S. government respects the personal freedoms of its
people. In countries where trends are available, people generally give the
U.S. higher marks for respecting individual liberties than they did in 2018,
during Donald Trump’s presidency. However, in several nations, the U.S. still
gets more negative ratings on this question today than it did during former
President Barack Obama’s time in office.
Most praise American technology,
entertainment, military and universities Roughly half or more in every non-U.S. society surveyed describe
American technological achievements as above average or the best, compared
with other developed nations. Outside of Germany, where only 52% say this, in
all of the advanced economies polled, about two-thirds or more hold this
view. In Greece, 45% specifically describe American technological
achievements as the best, as do 38% in South Korea and 31% in Taiwan. Few or
none describe American technological achievements as below average in any
place surveyed.
American entertainment, including movies, music and television, is
also well-regarded: Around two-thirds or more in most publics surveyed
describe it as at least above average. Around a third in Greece, Japan and
Singapore even describe American cultural exports as the best, while around a
quarter or more say the same in Spain, Belgium, South Korea and Canada. In no
place surveyed do roughly one-in-ten or more say American entertainment is
below average.
Around six-in-ten or more in every advanced economy in the survey describe
America’s military as at least above average. U.S. allies in the Asia-Pacific
region are somewhat more likely to praise the American military: for example,
42% of South Koreans describe it as the best, and 37% in Taiwan, 29% in
Singapore and 27% in Japan echo these views. Among Europeans, a quarter or
more in Greece, Spain, Italy and Sweden also label the U.S. military as the
top in the world.
Roughly half or more in 15 of 16 non-U.S. publics surveyed describe
American universities as at least above average. Greeks, South Koreans,
Japanese and Singaporeans are particularly effusive, with around a quarter or
more calling U.S. universities the best relative to other developed nations.
Germans and Australians, on the other hand, offer more mixed evaluations,
standing apart as the only two places where fewer than half describe U.S.
institutions of higher learning as above average. Still, no more than 14%
think American universities are below average in any of the publics surveyed.
Evaluations of American standard of living
are mixed, and few praise the health care system No more than 15% in any of the publics surveyed describe America’s
standard of living as the best among developed nations. And only in Taiwan,
South Korea and Spain do more than half describe it as at least above
average. Rather, in about half of the places surveyed, a plurality labels the
American standard of living as solidly “average” – including around half who
give it this rating in Germany and Singapore. Around half of Swedes and Dutch
even call U.S. living standards “below average” or “the worst” relative to
other developed nations, while more than a quarter in Australia, Belgium, New
Zealand, Canada, Germany and France say the same.
When it comes to the American health care system, evaluations are
even poorer. In most places, a majority says the American health care system
is at least below average, including around two-in-ten in Australia, Belgium,
Spain, the United Kingdom, France, Germany, New Zealand and Sweden who say it
is the worst among developed nations. Only in Taiwan, Greece, Japan and
Singapore do at least a quarter describe it as above average or the best.
When it comes to evaluations of the U.S. across these dimensions, a
few patterns stand out. First, younger people tend to be more complimentary
than older people. For example, younger people are more likely to describe
American entertainment products as above average than older people. Age
differences can be substantial: In Taiwan, for example, 84% of adults under
age 30 describe American entertainment products as above average, compared
with only 39% of those ages 65 and older who say the same. Younger people in some places are also somewhat more likely to praise
the American military, universities and technological achievements. For
example, two-thirds of New Zealanders under 30 say American universities are
the best or above average, while only around four-in-ten of those 65 and
older say the same.
Those with higher levels of education also tend to see America in a
more positive light. This is particularly the case regarding American
technological achievements and entertainment but also true in some publics –
and especially those in the Asia-Pacific region – when it comes to evaluating
American universities or its military. Wealthier people, too, tend to
evaluate all of these same dimensions more positively than those who are less
well off financially. Men are also somewhat more likely to describe many things about
America as above average than are women. (Women are also somewhat less likely
to provide an answer to some of these questions.) Those who think the U.S. has a serious problem with discrimination
are also more likely to evaluate America’s health care system and standard of
living negatively. In America’s neighbor to the north, Canada, 74% of those
who think the U.S. has a very serious problem with discrimination against
people based on their race or ethnicity say American health care is below
average, while only 48% of those who think it is a less serious problem
agree. Canadians who see racial and ethnic discrimination in the U.S. as a
very serious issue are also more than three times as likely to say America’s
standard of living is below average as those who say it is less of a problem
(40% and 12%, respectively). Views of the U.S. political system
Ratings of the political system in the U.S. are generally lukewarm
across the 16 advanced economies surveyed. People are split on how the U.S.
political system is functioning, with a median of 50% saying it works
well and 48% who disagree. Assessments vary widely, ranging from 80% in South
Korea who rate the U.S. political system positively to only 30% in New
Zealand. And very few in any public surveyed think American democracy is a
good example for other countries to follow. A median of just 17% hold this
view. Most people say democracy in the U.S. used to be a good example but has
not been in recent years (a median of 57%). A median of about a quarter (23%)
say American democracy has never been a good example for other countries to
follow. (For more on views of the U.S. political system and its democracy,
see “America’s
Image Abroad Rebounds With Transition From Trump to Biden.”) Still, on balance, publics say the U.S. government respects the
personal freedoms of its people. About half or more across each public
surveyed agree that Americans’ personal freedoms are protected by their
government. But a substantial minority – a 16-public median of roughly
four-in-ten – believe the U.S. does not respect personal freedoms, including
almost half in Australia and New Zealand. These numbers represent an upward trend. Between 2013 and 2018, there
was a steady decline in the share who said the U.S. respects the personal
freedoms of its people in many places surveyed, reaching its low point at the
end of that period. But in Canada and across Europe, the share who say the
U.S. government respects personal liberties has significantly increased since
the last time the question was asked. This rebound was particularly large in
Spain, where the shares who say the government respects Americans’ freedoms
roughly doubled between 2018 and 2021. A majority of Americans (63%) believe their government respects personal
freedoms, although a sizable minority (35%) says it does not. Democrats and
those who lean toward the Democratic Party (71%) are more likely than
Republicans and independents who lean Republican (56%) to say the U.S.
government respects the rights of its citizens. Those with at least a
bachelor’s degree or more are more likely than those with less schooling to
say that the U.S. respects personal freedoms (72% vs. 57%).
Yet, despite relatively positive views when it comes to American
personal liberties, publics express a great deal of concern about
discrimination against people based on their race and ethnicity in the U.S.
The survey was fielded nearly a year after anti-racism
protests broke out across the globe, sparked by the killing of
George Floyd and other Black Americans by police. Between 82% and 95% in every public outside of the U.S. believe this
kind of discrimination is at least a somewhat serious problem, and more than
four-in-ten call it very serious.
A median of only 9% say discrimination in the U.S. is not too serious or not
a problem at all. The level of discrimination against people based on their race or
ethnicity reflects poorly on the political system in the U.S. People who
think discrimination is a very serious problem are less likely to think the
U.S. government respects the personal freedoms of its people. And in every
public surveyed, people who think discrimination is a very serious problem in
the U.S. are less likely than others to say the political system works well
and to think democracy in the U.S. is a good example for other countries to
follow. In many places, adults under 30 and women are more likely to say
discrimination based on race or ethnicity is a very serious problem in the
U.S. than older people and men, as are people who place themselves on the
left of the political spectrum. A median of 71% of those on the left say
discrimination is a very serious issue in the U.S. By comparison, a median of
49% of those on the right hold this view. For example, in Sweden, 60% who
place themselves on the ideological left say discrimination in the U.S. is a
very serious problem, compared with only 35% on the right who say the same. Overall ratings for the U.S. improved
following Biden’s election Beyond attitudes toward American society and politics, opinions about
U.S. presidents and their foreign policies can also affect how people see the
U.S. As a previous report illustrated,
America’s overall international image has improved significantly since the
election of President Biden. Across 12 nations surveyed in both 2020 and 2021, a median of 75%
said this spring that they had confidence in Biden to do the right thing in
world affairs, while a median of just 17% said this about Trump in 2020.
Overall ratings for the U.S. improved substantially as well – a median of 62%
across the 12 countries said they have a favorable opinion of the U.S., up
from 34% in 2020.
Comparing Biden to Trump, people see the current president’s
leadership traits in a much more favorable light. They are much more likely
to consider Biden well-qualified and to see him as a strong leader and are
much less likely to describe him as arrogant or dangerous.
Most support key elements of Biden’s initial foreign policy agenda.
When asked about four of Biden’s specific foreign policy goals, majorities in
all publics surveyed express
approval for each. Support for the U.S. rejoining the World Health
Organization is highest, with a median of 89% saying they approve of this
policy, followed by support for the U.S. rejoining the Paris climate
agreement and hosting a democracy summit. Biden’s policy of allowing more
refugees into the U.S. also elicits approval from a median of 76%. (The
survey was conducted before Biden’s decision to withdraw troops from
Afghanistan by Aug. 31, 2021. For more on American reactions to that policy,
see “Biden
Loses Ground With the Public on Issues, Personal Traits and Job Approval.”) Despite the widespread support for the U.S. rejoining the Paris
Agreement, adults in most publics surveyed are more likely to say the U.S.
is doing a bad job handling climate change than they are to say the
U.S. is doing a good job, and at least a fifth in 12 countries say the U.S.
is doing a very bad
job. Swedes and Germans are especially critical, with three-quarters in both
countries disapproving of the United States’ climate change response. Only in
Singapore and the U.S. itself do about half say the U.S. is doing a good job. (PEW) NOVEMBER 1, 2021 715-716-43-34/Polls Almost Half (43%) Of The Global Population Across 17 International
Markets Surveyed Follow A Social Media Influencer Of Any Type
New data from YouGov shows young UAE males between 18-34 years form
the largest cohort of gaming influencer followers in the country as compared
to the other demographic groups. YouGov’s International Gaming Report 2021 is
a three-part series on the global gaming influencer landscape. Part 1 sizes
the gaming influencer global fanbase across 17 international
markets and reveals where these influencer followers sit within the global
influencer sector as a whole. Data from the report shows that almost half (43%) of the global
population across 17 international markets surveyed follow a social media
influencer of any type, with UAE leading this space amongst all the
surveyed markets (at 75%). When we delve into the types of influencers
followed, YouGov data reveals that food, health, and celebrity
influencers have the highest following globally (12% or more), and just under
one in ten consumers worldwide follow gaming influencers (9%). However,
this changes significantly when we look at different demographic groups. Globally, gaming influencers are the most popular type of influencers
followed by males aged 18-34, with almost a quarter (23%) of all adults in
this demographic segment following gaming personalities. In the UAE, almost one in seven (15%) 18-34 year old males follow
gaming influencers, similar to proportions in France, Sweden and Denmark.
However, the highest numbers within this cohort are reported by Asian
countries like Hong Kong, Indonesia and China. When it comes to gaming frequency, the global proportion of those
following gaming influencers increases from 9% overall to 15% among active
gamers (playing video games 1+ hours per week), and 20% among heavy gamers
(playing video games 11+ hours per week). In the UAE, the number of those following gaming influencers
increases from 13% (overall population) to 19% among active gamers and 23%
among heavy gamers. This offers a unique value proposition for brands looking
to reach an exclusive audience of influencer followers. Apart from gaming, the fans of gaming influencers have a wide variety
of other entertainment interests. In UAE, the top ‘other influencer’
categories followed by gaming influencer fans include sports (50%), celebrities
(50%), health (46%), fashion (42%) and music (42%), thus increasing the scope
for brands and advertisers who are interested in extending their influencer
campaigns beyond gaming.
(YouGov MENA) Source: https://mena.yougov.com/en/news/2021/11/01/young-males-uae-are-most-likely-follow-gaming-infl/ 715-716-43-35/Polls A Median Of 89% Across The 16 Non U S Publics Surveyed Describe
Racial And Ethnic Discrimination In The U S As A Somewhat Or Very Serious
Problem
Concerns about racial and ethnic discrimination are widespread in
most of the 17 advanced economies surveyed by Pew Research Center this
spring. Majorities of adults in 14 of these places say discrimination on the
basis of race or ethnicity is a somewhat or very serious problem in their own
society – including around three-quarters or more in Italy, France, Sweden,
Germany and the United States. Only in Japan, Singapore and Taiwan do fewer
than half say such discrimination is a serious problem But even as sizable majorities in these places see racial and ethnic
discrimination as a serious problem, even
bigger majorities see it as an issue in the U.S. A median of 89%
across the 16 non-U.S. publics surveyed describe racial and ethnic
discrimination in the U.S. as a somewhat or very serious problem. That
includes at least nine-in-ten who take this position in New Zealand, South
Korea, Canada, Japan, the Netherlands, Spain and Sweden. Across most of the places surveyed, younger adults tend to be more
likely than older people to see discrimination as a problem, whether in their
own society or in the U.S. For example, among Spaniards, 69% of those under
age 30 think racial and ethnic discrimination in their own society is a
serious problem, compared with 44% of those ages 65 and older. Younger
Spaniards are also more likely than older Spaniards to see discrimination in
the U.S. as a serious problem – though age-related differences in opinion
about American discrimination are less pronounced, both in Spain and
elsewhere.
Women in most of the advanced economies surveyed tend to see
discrimination at higher rates than men. In the U.S., for example, 80% of
women say discrimination against people based on their race or ethnicity is a
somewhat or very serious problem, compared with 68% of men. Gender
differences of around 10 percentage points are also evident in Canada,
Germany, Greece, the Netherlands, Spain, Sweden, New Zealand and South Korea,
both when it comes to discrimination locally and in the U.S. (though
differences for the U.S. are again less pronounced). In many places surveyed, those on the ideological left are more
likely than those on the right to see racial and ethnic discrimination as a
serious problem, both in their own society and in the U.S. The ideological
gap on this question is widest in the U.S. itself: 92% of those on the left
(liberals, in common U.S. parlance) say racial and ethnic discrimination is a
serious problem, compared with 47% of those on the right (conservatives), a
difference of 45 points. The next-largest ideological gap is in Australia,
where 80% of those on the left and 50% of those on the right hold the view
that discrimination is a serious problem in Australia. In general, people on
the ideological left are also more likely than those on the right to say
discrimination in the U.S. is a serious problem.
Attitudes sometimes also differ by educational level, especially when
it comes to discrimination in the U.S. In Taiwan, for example, 95% of those
with at least a postsecondary degree describe discrimination as a serious
problem in the U.S., compared with 77% of those with less than a
postsecondary degree. On the other hand, when it comes to perceptions of
domestic discrimination, education only plays a role in Singapore, Japan and
South Korea, with more educated people more likely to cite discrimination as
a serious problem. (PEW) 715-716-43-36/Polls On Average, Across 29 Countries Over Half (56%) Say They Have
Modified Their Consumer Behaviour Out Of Concern About Climate Change
On average, across 29 countries surveyed by Ipsos in September and
October 2021, over half (56%) say they have modified their consumer behaviour
out of concern about climate change over the past few years. This is down
from an average of 69% in January 2020, when an identical question was asked
in all but two of the 29 countries. The proportion of those saying that, over the past few years, they
have made changes regarding the products and services they buy or use,
specifically out of concern about climate change, has fallen in every country
included in both studies. This suggests that, as consumers across the world
had to change their daily habits to protect themselves and others from the
coronavirus, they became less concerned about the environmental impact of
their behaviour. On average globally, fewer than one in five (17%) now say
they have made a lot of changes, two in five (39%) a few changes, and three
in ten (31%) no changes at all. The most recent survey was conducted in late September and early
October 2021 among more than 23,000 adults on Ipsos’ Global Advisor
online platform. The countries where consumers are most likely to report having
adapted their behaviour to counteract climate change remain unchanged from
last year. However, even in these nations, the proportion has fallen
significantly. They include India (76%, down 12 percentage points), Mexico
(74%, -12pts), Chile (73%, -13pts) and China (72%, -13pts). The countries where consumers are least likely to say they have
modified their behaviour due to climate concerns include Japan (22%, -9pts),
Russia (40%, -12pts), the United States (41%, -15pts) and the Netherlands
(41%, -16pts). Countries experiencing the biggest decline since last year in their
share of environmentally conscientious consumers include Malaysia (62%,
-23pts), Spain (53%, -23pts), Poland (49%, -23pts) and France (52%, -21pts). Globally, the individual actions most commonly taken to counteract
climate change are recycling or composting (cited by an average of 46% among
all adults across the 29 countries surveyed), generally saving energy at home
(43%), avoiding throwing away food (41%) and saving water at home (41%). Women are generally more likely than men to report changing their
behaviour because of climate concerns, especially in terms of avoiding
throwing food (46% vs. 36%, respectively on average across all countries),
saving water at home (46% vs. 36%), buying fewer new things (36% vs. 26%) and
avoiding products that have a lot of packaging (33% vs. 25%). Countries where consumers are most likely to report recycling or
composting more often than they used to, specifically out of concern about
climate change, include Belgium (65%), Canada (64%), Sweden (60%), Colombia
(60%) and Hungary (60%). Inversely, those where consumers are most likely to
report having made no changes in how much they recycle or compost include
Japan (33%), the United States (32%) and Germany (24%). To find out whether consumers feel they are more or less engaged in
fighting climate change than other people in their community, survey
respondents were also asked about changes their neighbours may have made out
of concern about climate change. On average globally, three in ten (30%) say
their neighbours have made at least some changes, a third (34%) say their
neighbours have not made any changes, and nearer two in five (37%) state they
are not sure. The results suggest Latin American consumers tend to think others are
less engaged in fighting climate change than they are. The percentage of
consumers saying their neighbours haven’t made any changes is higher than the
percentage saying they personally haven’t by more than 15 percentage points
in Mexico (42% vs. 18%), Chile (41% vs. 19%), Colombia (40% vs. 19%),
Argentina (462% vs. 25%) and Peru (37% vs. 21%). This is also the case in
Hungary (43% vs. 27%). In other parts of the world, those who say they haven’t made any
changes outnumber those who say their neighbors haven’t – most of all in
Norway (50% vs. 31%), Australia (36% vs. 24%), Saudi Arabia (29% vs. 19%,
Spain (31% vs. 24%) and the United States (36% vs. 43%). However, in each of
these countries, large proportions of people say they are not sure if their
neighbours changed their behavior out of concern about climate change. (Ipsos Australia) 3 November 2021 Source: https://www.ipsos.com/en-au/climate-change-consumer-behaviour-2021 715-716-43-37/Polls 90% Of Brazilians Say That Many People Cannot Afford To Pay For Good
Quality Healthcare
The Brazilian health system has faced a series of problems that
affect the population's well-being. This is what the Global Health Service
Monitor 2021 survey, carried out by Ipsos with 30 nations, points out.
Respondents from Brazil showed widespread discontent with various aspects of
access to the health system, such as its economic implications. 90% of local
respondents say that many Brazilians cannot afford to pay for good quality
healthcare. It is the highest percentage among all the countries analyzed.
The global average is 58%. In addition, 7 out of 10 Brazilians (71%) believe that the country's
health system is overloaded. Considering all respondents, the average is 56%.
This saturation may be one of the reasons that justify the dissatisfaction of
respondents in Brazil with the procedures for scheduling medical
appointments. 84% think that the waiting time to get an appointment is too
long and 47% find it difficult to get medical appointments close to where
they live. If we take into account the responses of all survey participants,
these percentages are, respectively, 60% and 28%. The biggest challenges The survey asked respondents to select from a list what the biggest
problems their country's health systems are currently facing. In Brazil, the
most cited issue was the lack of investment, with 51%. In second place was
the lack of investment in preventive health, with 50%. Difficulties in
accessing treatment and long waiting periods were in third position and were
mentioned by 45%. The top 5 in Brazil are bureaucracy (31%) and low-quality
treatments (26%). On the average of all countries evaluated, the main mention was
difficulties in accessing treatment and long waiting periods (41%). In second
place was the lack of employees (39%). The cost of treatment appeared in
third place (31%), followed by bureaucracy (26%) and lack of investment in
preventive health (23%). Despite these challenges, Brazil is among the most optimistic
countries about the future. 66% of local respondents believe that the quality
of the healthcare system they have access to will improve in the coming
years. It is the second highest percentage of 30 nations. In first place is
Saudi Arabia (77%). Colombia (66%) is tied with Brazil in second place and
China in third (61%). The global average betting on an improvement in the
health system is 34%. Coronavirus remains the major concern The Covid-19 pandemic has remained the major health problem that
people face in Brazil and worldwide. Among Brazilians, 84% mentioned the
disease. Considering all respondents, the disease was mentioned by 70%, a
difference of two percentages compared to last year, when 72% of global
respondents opined that the new coronavirus was the biggest cause for
concern. In addition to the coronavirus, the other diseases most cited by
Brazilians were: cancer (31%), mental illnesses (40%), stress (22%) and drug
abuse (22%). Worldwide, the ranking is practically the same, with the
exception of one item. Cancer (34%), mental illness (31%), stress (22%) and
obesity (19%) were the diseases with the highest percentage of mentions. The health crisis that set in across the planet with the advance of
Covid-19 brought about a discussion about mandatory vaccination. Among the 30
countries, Brazil is the one that most believes, tied with Malaysia, that
vaccinations against serious infectious diseases should be mandatory. Out of
10 local respondents, 8 agree with the premise (81%). The global average is
61%. (Ipsos Brazil) 4 November 2021 715-716-43-38/Polls Buying Sustainable Fashion Is Important For 2 Out Of 5 Europeans in
10 Countries
In its new report "European Fashion Report 2021", YouGov
investigates the opinions of more than 11,000 people from 10 different
countries on sustainable fashion. The concept of sustainability has prevailed in the vast majority of
sectors. However, according to European consumers, it is more important in
the food and beverage, energy, transport and automotive sectors. According to the new European Fashion Report 2021, the fashion
industry ranks eighth among the sectors in which sustainability is most
important to consumers. 42% of consumers in 10 European countries say it is
important for them to buy ethical and ecological clothing. Italians (60%) and
Spaniards (56%) are the ones who most agree with this statement, while Danes
and Norwegians are the ones who least agree (24%) with this statement. At European level, price is the most important criterion for
consumers when buying clothes (68%). The next most important criterion for
consumers is quality (61%), while adjustment ranks third (56%). Sustainability is at the bottom of the list. 30% prioritize the
longevity of the product, and 24%, slightly less, the fabric (recycled,
organic, synthetic ...), while 15% prioritize the environmental impact of the
product. However, the report shows that there are many reasons why Europeans
do not buy more ethical and environmentally friendly clothing. The price is decisive. 34% think that buying ethical and ecological
clothes is too expensive. In addition, 30% think that it is not clear which
ecological aspects are met, and 28% say that it is difficult to discern which
brands are ecological. (YouGov Spain) Source: https://es.yougov.com/news/2021/11/09/comprar-moda-sostenible-es-importante-para-cada-2-/ 715-716-43-39/Polls Global: Fan Interest In The T20 World Cup In Five Key Markets
As the 2021 T20 World Cup approaches the business end, we look at
data in YouGov Global Fan Profiles to explore the fan following for the event
in five key markets. These include four major cricket markets and T20 World Cup
participants – Australia, India, South Africa, Britain (England and Scotland
are both playing in the tournament) – in addition to the United Arab
Emirates, which is hosting the ongoing event. It should come as no surprise that India – one of the most
cricket-crazy markets – leads the way. Seven in ten consumers in urban India
(70%) say that the T20 World Cup is one of their top interests or that they
are somewhat interested in the event. Over half of South Africans also express the same level of interest
in the event (56%). UAE comes in third with two in five consumers in the
region (39%) stating their interest in the world event. UAE surpassing more
established cricket markets like Australia and Britain could be partially
explained by the huge population of South Asian expats in the region – as
well as its host status. A quarter of Australians (26%) say they are interested in the T20
World Cup, and the figure drops to 16% among Brits. The demographic filters in YouGov Global Fan Profiles allow us
additional insight into patterns of the level of interest across different
age groups. Across markets, interest is lowest among those aged between 18 and
24. In most markets, with the exception of Britain, interest level also is on
the lower side among those aged over 55. Interest is pretty level across the
age groups in Australia whereas in Great Britain, interest is almost twice as
high in the oldest age group compared to the youngest. (YouGov Australia) November 10, 2021 Source: https://au.yougov.com/news/2021/11/10/global-fan-interest-t20-world-cup-five-key-markets/ 715-716-43-40/Polls Would You Be Willing To Eat Insects As Part Of Your Regular Diet; Survey
Conducted In 17 Countries
With COP-26 in full swing looking for a solution to the world’s
emissions problems, one big cause of climate change that has become
increasingly apparent is the meat and dairy industry. According to the UN,
the meat and dairy industry accounts for 14.5% of global
greenhouse gas emissions. While obviously it is possible to solve this problem by simply
switching to a vegetarian or vegan diet, some have proposed a different
solution: bugs. Insect farming reportedly produces
one hundredth of the emissions that equivalent cattle or pig output is
responsible for. Now a new international YouGov survey conducted in 17 countries and
regions shows how many people might be willing to make the shift. Topping the list are online Mexicans. Fully four in ten (40%) say
they would be willing to eat food with insect ingredients as part of their
regular diet, or are already doing so. Indeed, one in three (33%) say the
same about eating whole insects. There is a long history of insect-eating in
Mexico, which is home to more edible insect species
than any other country in the world. Some way behind, in second and third place, are Emiratis and online
Indonesians. About one in three of both groups (31-32%) would consider or are
already consuming food with insect ingredients as a frequent activity, and
25% of each are either eating or willing to eat whole insects. Here in Australia, a quarter (27%) would take up eating tucker from
termites, and 21% would be ok eating bugs whole - a fitting revenge for all
the trauma caused by toilet-hiding spiders and other insect annoyances. In the UK, one in five Britons (21%) say they would be willing to eat
insect-infused food, if they aren’t already, and one in seven (14%) say they
could consider chomping on a cricket. Americans are somewhat more
adventurous, with a quarter (25%) willing to ingest insect ingredients, and
18% would be willing to eat whole bugs. A YouGov US study earlier in the year
showed a similar number (26%) willing
to try cicada-based dishes. Italians are the least likely to say they would be willing to chow
down on bug matter – perhaps unsurprising given they’ve got the
world’s favourite cuisine on hand. Just 17% of Italians would be
willing to eat food made of insects, and only 13% would be ok with biting
into a whole bug. Men are more willing to consume creepy
crawlies Across every country and region polled, men prove more willing to
gobble a grasshopper than women (or at least, to talk big about doing so!) When it comes to foods with insect ingredients, the gender gap is
biggest in Australia, where 37% of men and 18% of women say they would be
willing to incorporate such sustenance into their diet. On eating bugs wholesale, the gap is largest among online Mexicans,
among whom 40% of men and 26% of women could consider it. (YouGov Australia) Source: https://au.yougov.com/news/2021/11/05/one-five-australians-say-theyre-willing-eat-insect/
|
||||||||||||||||||||||||||||||||||||||||||||||||||||||||||||||||||||||||||||||||||||||||||||||||||||||||||||||||||||||||||||||||||||||||||||||||||||||||||||||||||||||||||||||||||||||||||||||||||||||||||||||||||||||||||||||||||||||||||||||||||||||||||||||||||||||||||||||||||||||||||||||||||||||||||||||||||||||||||||||||||||||||||||||||||||||||||||||||||||||||||||||||||||||||||||||||||||||||||||||||||||||||||||||||||||||||||||||||||||||||||||||||||||||||||||||||||||||||||||||||||||||||||||||||||||||||||||||||||||||||||||||||||||||||||||||||||||||||||||||||||||||||||||||||||||||||||||||||||||||||||||||||||||||
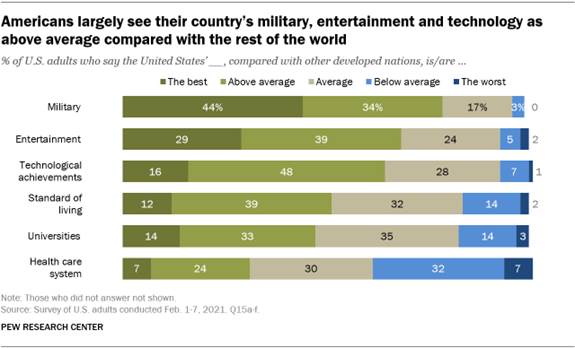


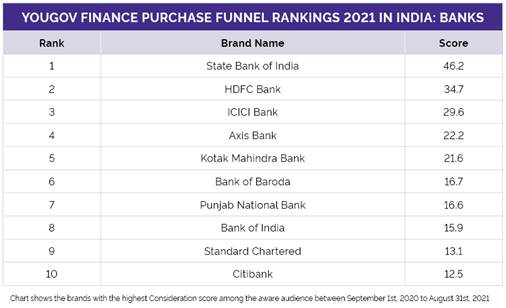
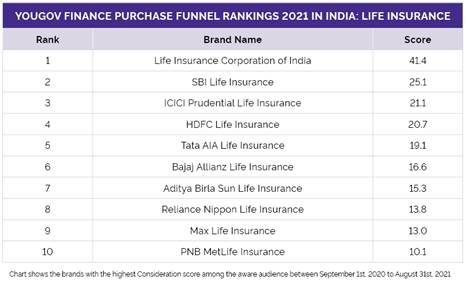
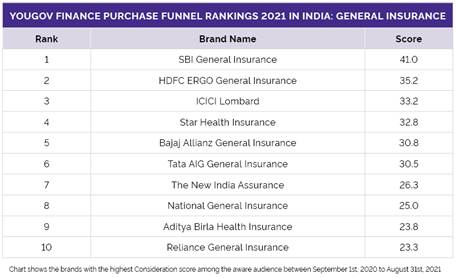
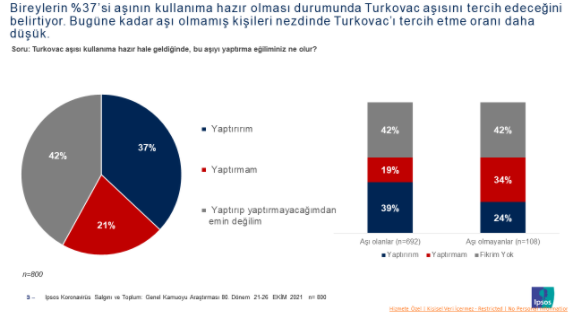
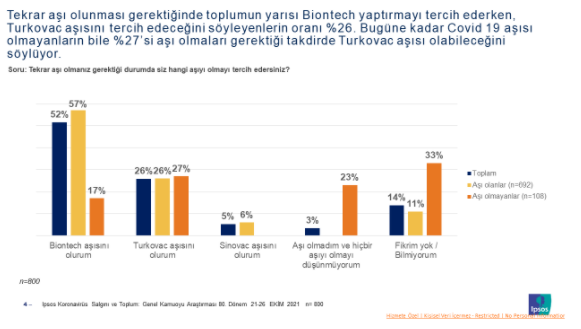
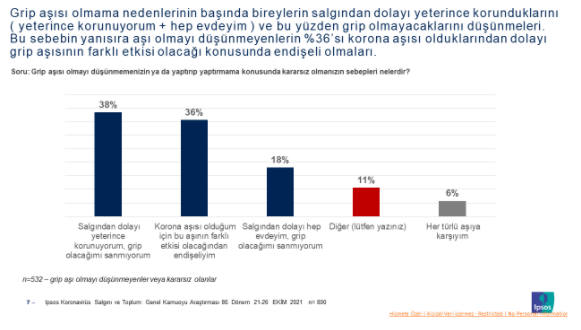
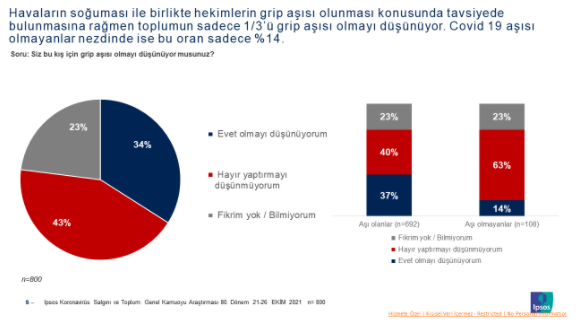
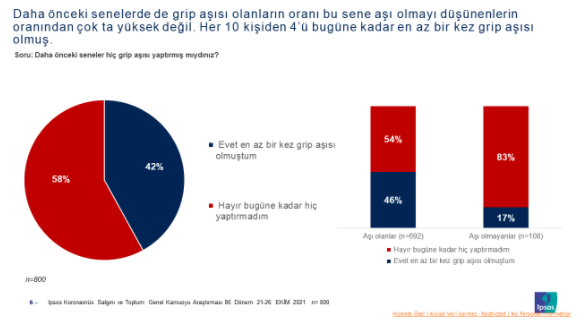
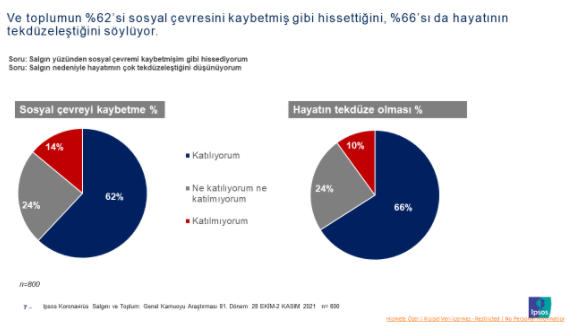 Society
Doesn't Pay Much Attention to Mask Distance Rules Anymore
Society
Doesn't Pay Much Attention to Mask Distance Rules Anymore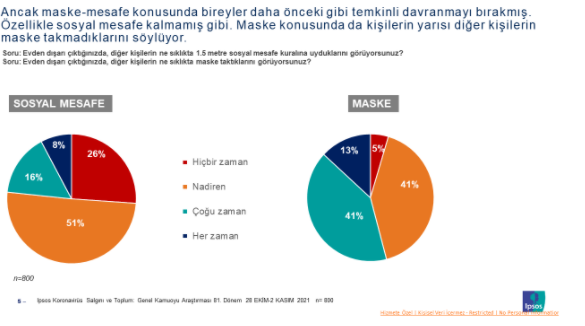 Anxiety
Level of 46% of Individuals Increases
Anxiety
Level of 46% of Individuals Increases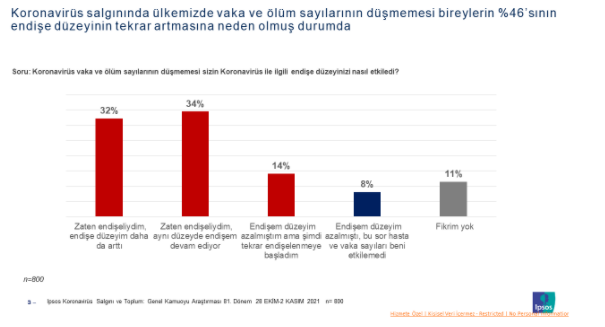 Half
of the Society Thinks The Fight Against Coronavirus Is Going Bad In Our
Country
Half
of the Society Thinks The Fight Against Coronavirus Is Going Bad In Our
Country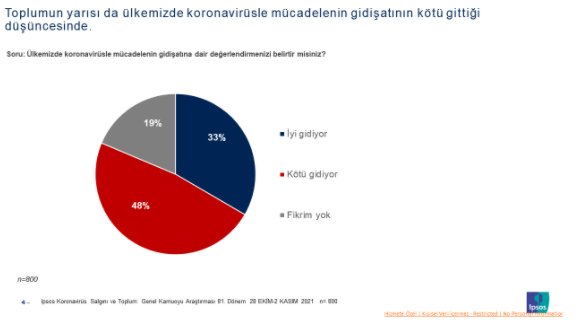 Society
Is Not Very Hopeful About Its Future
Society
Is Not Very Hopeful About Its Future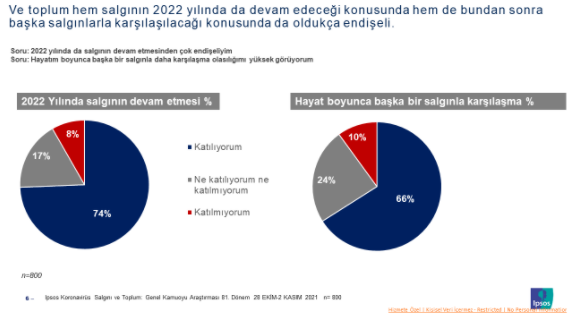 Sidar
Gedik, CEO of Ipsos Turkey: made the following evaluations about the data;
Swiss psychiatrist Elisabeth Kübler-Ross, in her book “On Death & Dying”
published in 1969, determined that people who encounter a terminal illness go
through 5 emotional stages; denial, anger, bargaining, depression, and
acceptance. David Kessler, who co-wrote the book "On Grief &
Grieving: Finding the Meaning of Grief through the Five Stages of Loss"
published in 2005 with Kübler-Ross, stated that these stages can also be
adapted to the Covid-19 epidemic. Kessler made an analogy in an interview for
the Harvard Business Review: “…there is denial: “The virus will not affect
us. ” There is anger: “You keep me staying at home and you are taking away my
activities.” There's a bargain: "Okay, if I social distancing for two
weeks everything will be better, right?" There is depression: “I don't
know when this will end.” And finally there is acceptance: “This is
happening, I have to discover how to proceed.” The results of the 81st week
of our Coronavirus Outbreak and Society survey reminded me of this
classification. As we have been doing research for 81 weeks, it means that
the epidemic has been affecting our country for 83-84 weeks. The results of
the last week show that we, as a society, are between "depression"
and "acceptance". The mask-distance measures, which were applied at
a very high rate in the "Negotiation" stage, started to loosen as
the cases and losses continued and as they passed to the
"Depression" stage. While compliance with these measures was over
90% once, it has now decreased to 54% for masks and 24% for distance.
Sidar
Gedik, CEO of Ipsos Turkey: made the following evaluations about the data;
Swiss psychiatrist Elisabeth Kübler-Ross, in her book “On Death & Dying”
published in 1969, determined that people who encounter a terminal illness go
through 5 emotional stages; denial, anger, bargaining, depression, and
acceptance. David Kessler, who co-wrote the book "On Grief &
Grieving: Finding the Meaning of Grief through the Five Stages of Loss"
published in 2005 with Kübler-Ross, stated that these stages can also be
adapted to the Covid-19 epidemic. Kessler made an analogy in an interview for
the Harvard Business Review: “…there is denial: “The virus will not affect
us. ” There is anger: “You keep me staying at home and you are taking away my
activities.” There's a bargain: "Okay, if I social distancing for two
weeks everything will be better, right?" There is depression: “I don't
know when this will end.” And finally there is acceptance: “This is
happening, I have to discover how to proceed.” The results of the 81st week
of our Coronavirus Outbreak and Society survey reminded me of this
classification. As we have been doing research for 81 weeks, it means that
the epidemic has been affecting our country for 83-84 weeks. The results of
the last week show that we, as a society, are between "depression"
and "acceptance". The mask-distance measures, which were applied at
a very high rate in the "Negotiation" stage, started to loosen as
the cases and losses continued and as they passed to the
"Depression" stage. While compliance with these measures was over
90% once, it has now decreased to 54% for masks and 24% for distance.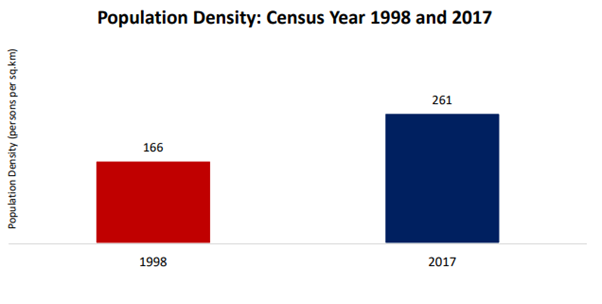
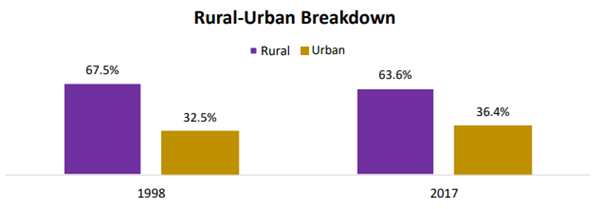
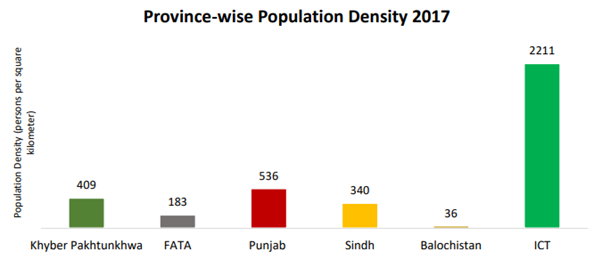
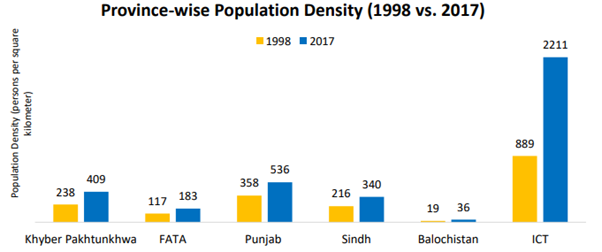
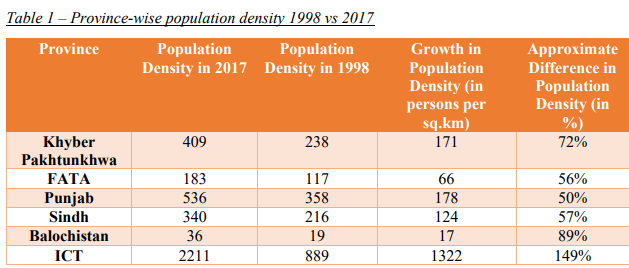
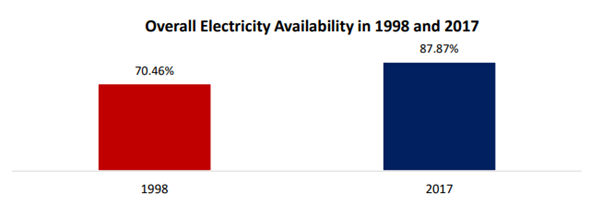
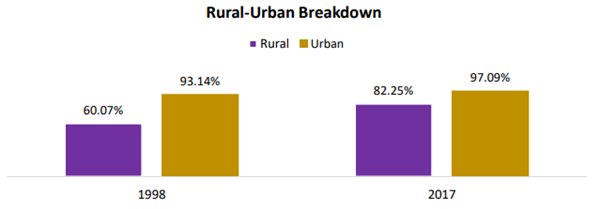 3)
Sources of Lighting in 2017: Electricity appears to be the major source of
lighting in 2017 with availability to 87.87% of the housing units across the
country (other sources include kerosene oil, gas lamp and others)
3)
Sources of Lighting in 2017: Electricity appears to be the major source of
lighting in 2017 with availability to 87.87% of the housing units across the
country (other sources include kerosene oil, gas lamp and others)