|
BUSINESS & POLITICS IN THE WORLD GLOBAL OPINION REPORT NO. 724 Week:
January 03 –January 09, 2022 Presentation:
January 14, 2021 More
Than A Third Of Urban Indians Oppose The Upcoming Cryptocurrency Bill 1
Out Of 2 People Agree That More Difficult Days Await In The Epidemic The
Majority (68%) Of Pakistanis Blame The Government For Inflation UK
- Understanding Coffee Drinking Among Gen Z For
33% Of French People, The Practice Of A Physical Activity Is The Number 1
Resolution 48%
Of French People Recognize That Their Daily Mode Of Travel Is Not Ecological Presidential
2022 | Emmanuel Macron Is In The Lead Over
Past Five Years An Average Of Forty-One Percent Of U S Adults Think Of
Themselves As Overweight Americans
At The Ends Of The Ideological Spectrum Are The Most Active In National
Politics 38%
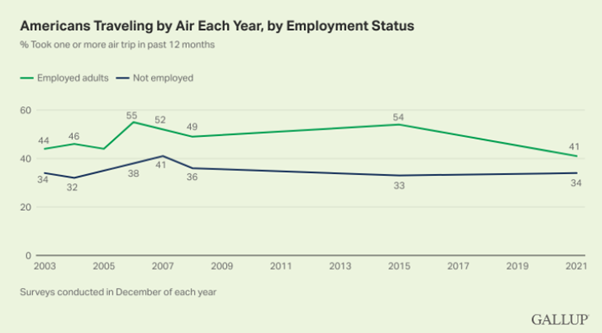
Of Adults Traveled By Air In 2021 In U S Versus 44% In 2015 Three-In-Ten
Americans Now Read E-Books Controversy
Over The Term 'Latinx': Public Opinion Context Younger
Gens In Britain, U S Likelier To Believe That Meatless Diets Are Healthier Consumer
Perceptions On Product Durability Across Different Industries, A Study In 17
Economies INTRODUCTORY NOTE
724-43-22/Commentary:
Over
Past Five Years An Average Of Forty-One Percent Of U S Adults Think Of
Themselves As Overweight
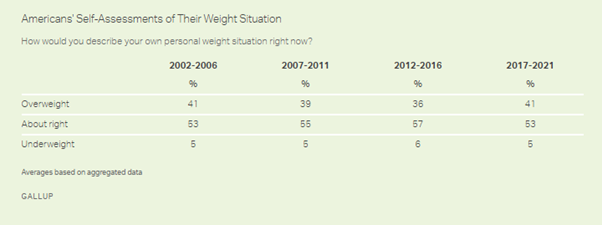
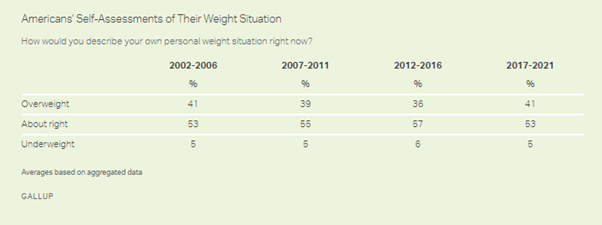
Forty-one
percent of U.S. adults, on average over the past five years, from 2017 to
2021, have characterized themselves as overweight, while the slight majority
(53%) have said their weight is about right and 5% reported they are
underweight. The
percentage overweight is up from 36% in the prior five-year period, from
2012-2016, but similar to the rates between 2002 and 2011.
The findings
contrast with federal health statistics that are based on physical
measurements, which show that nearly three-quarters of Americans are either
overweight or obese. However, the 41% describing themselves as overweight in
Gallup surveys is consistent with the latest federal obesity rate of 42%, suggesting
that obese people as the government defines them are the ones most likely to
self-report being overweight. In addition
to asking respondents if they are overweight, Gallup's annual healthcare poll
tracks U.S. adults' self-reported current weight, their desire to lose
weight, whether they are currently trying to lose weight and what they
consider to be their ideal weight. Americans
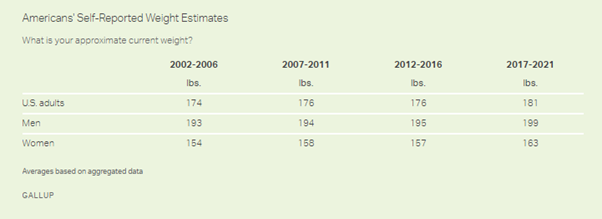
Have Gotten Heavier After being
fairly stable in each five-year period from 2002 through 2016, Americans'
average self-reported weight for 2017 through 2021 increased by five pounds
to 181 pounds. Both men and
women have weighed more, on average, over the past five years than they
weighed during any previous period. Men's weight is up four pounds since
2012-2016 to an average 199 pounds in 2017-2021, while women's is up six
pounds to 163 pounds over the same period.
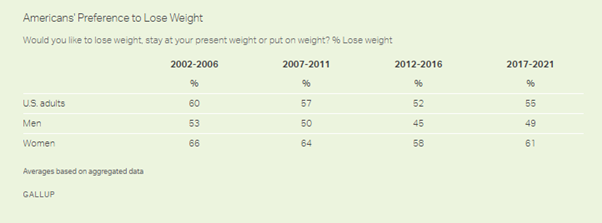
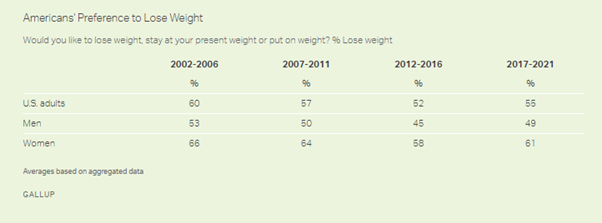
The
percentage of Americans who want to lose weight has been more variable over
the past two decades. The average 55% of U.S. adults who have expressed a
desire to lose weight between 2017 and 2021 is up slightly from the previous
five-year period (52%), in line with the 2007 through 2011 reading (57%) and
slightly lower than the 2002-2006 figure (60%). Women are
much more likely than men to say they want to lose weight. While about three
in five women in the latest five-year period would like to trim their
waistlines, just under half of men express the same desire. This pattern has
been consistent since 2002-2006.
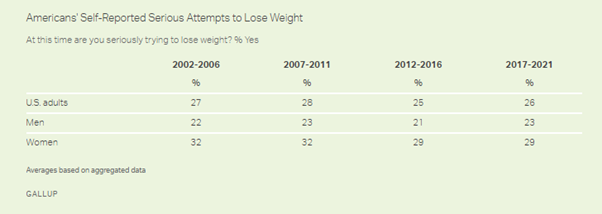
Although
more than half of Americans would like to lose weight, an average 26% have
said they were seriously trying to do so from 2017 through 2021. This is not
significantly different from the previous three five-year periods. Women (29%)
are more likely than men (23%) to report that they are actively attempting to
slim down, which has also been a consistent pattern.
(Gallup) JANUARY 3,
2022 Source: https://news.gallup.com/poll/388460/percentage-americans-consider-themselves-overweight.aspx 724-43-23/Country Profile:
SUMMARY
OF POLLS
ASIA (India) More
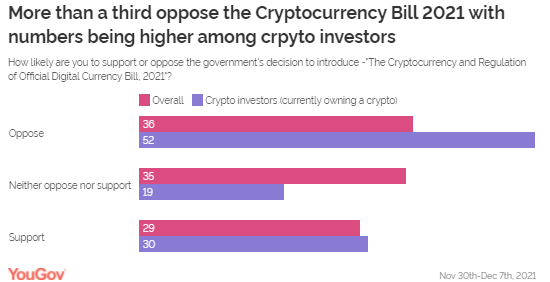
Than A Third Of Urban Indians Oppose The Upcoming Cryptocurrency Bill As the government readies a bill on
cryptocurrencies, YouGov’s latest data shows more than a third of urban
Indians (36%) are not in favour of this move. Just as many (35%) are unsure
while three in ten (29%) support this decision. The bill that is yet to
receive the cabinet’s nod, has already swept India’s digital currency market
by a wave of nervousness and confusion. Currently, only a third of urban
Indians claim to own a cryptocurrency (33%) while the majority (67%) do not. (YouGov India) January 5, 2022 (Turkey) 1 Out Of 2 People Agree That More Difficult Days Await In
The Epidemic The rate of those who think that the
epidemic still poses a threat to Turkey and the Turkish economy is over 70%.
Although this rate drops when it comes to themselves and their families, half
of the society continues to see the epidemic as a threat to themselves and
their families. With the increase in the number of cases and the effect of
the fast contagious feature of the Omicron variant, 47% of individuals think
that even more difficult days will come. (Ipsos Turkey) 4 January 2022 (Pakistan) The Majority (68%) Of Pakistanis Blame The Government For
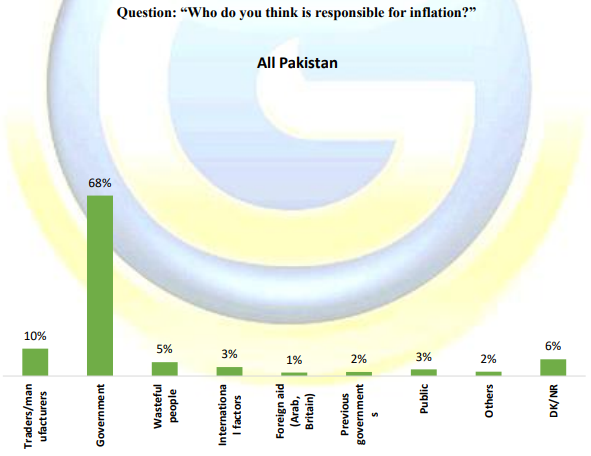
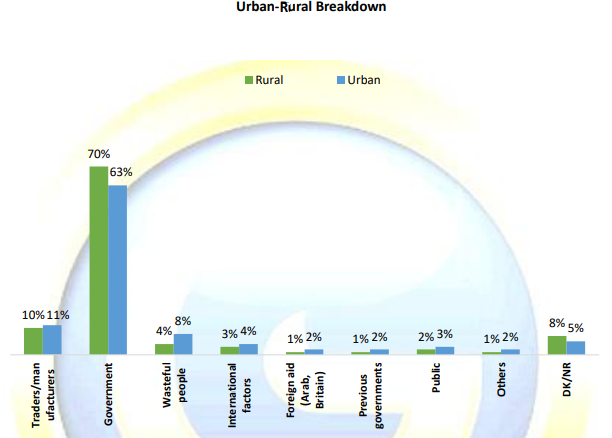
Inflation A nationally representative sample of adult
men and women from across the four provinces was asked the following
question, “Who do you think is responsible for inflation?” In response to
this question, 10% said traders/manufacturers, 68% said government, 5% said
wasteful people, 3% said international factors, 1% said foreign aid (Arab,
Britain), 2% said previous governments, 3% said public, and 2% said others.
6% did not know or provided no response. (Gallup Pakistan) January 07, 2022 WEST
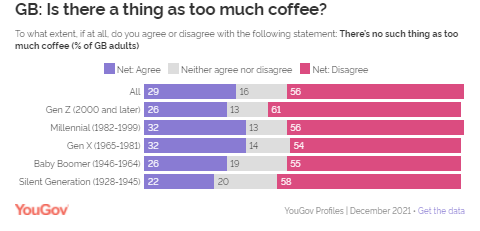
EUROPE (UK) UK - Understanding Coffee Drinking Among Gen Z When asked whether there’s no such thing as
too much coffee, three in ten Brits agreed, while 16% are undecided. But
what’s the picture like between the generations? Gen Z has the highest share
of consumers who disagree with the statement (61%) with only 26% in agreement
and 13% of consumers on the fence. Millennials and Gen X-ers, on the other
hand, seem to have the highest share of coffee enthusiasts as 32% of them
don’t think there’s such a thing as too much joe. While the Silent Generation
has the lowest share of consumers in agreement (22%), the proportion of those
who neither agree nor disagree is the highest among this generation (20%). (YouGov UK) January 05, 2022 (France) For 33% Of French People, The Practice Of A Physical
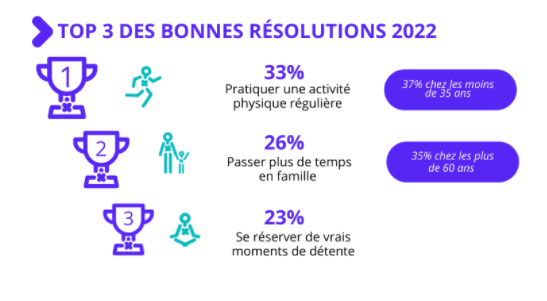
Activity Is The Number 1 Resolution If playing sports and spending more time
with friends and family are once again at the top of French resolutions,
allowing yourself real moments of relaxation for yourself this year precedes
the idea of eating more balanced. Practice regular physical
activity for 33% of French people (-4% vs 2020) and more particularly among
those under 35 (37%). Spending more time with family for 26% (-3% vs 2020)
especially among those over 60 (35%). Reserve real moments of relaxation for
23% (+ 2% vs 2020). (Ipsos France) January 3, 2022 48% Of French People Recognize That Their
Daily Mode Of Travel Is Not Ecological For everyday travel, the French still
mostly use the car (75%). This is particularly the case outside the
Ile-de-France region (79%), in rural (86%) and peri-urban (87%) areas. But
the car remains in the majority, including in urban centers (61%). Its use is
certainly less strong in Ile-de-France (55%) and in particular in the
Parisian agglomeration (52%), but remains the majority. Public transport is
used on a daily basis by a minority of French people (29%), but a majority of
Ile-de-France residents (53% - part of which therefore combines the use of
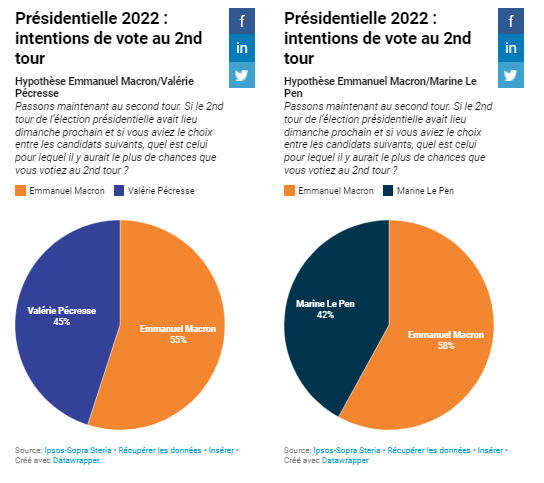
public transport and the car). (Ipsos France) 6 January 2022 Presidential 2022 | Emmanuel Macron Is In
The Lead Three months before the election, Emmanuel
Macron would emerge in the lead on the evening of the first round. He is now
credited with 26% of voting intentions - two points more than his first round
score in 2017 (24%) - and enjoys a solid electoral base: 68% of his 2017
voters plan to vote again for him, joined by more than 30% of those who had
voted for François Fillon at the time. The second qualifying place for the
second round is however for the moment very uncertain. Marine Le Pen, who
retains 62% of her 2017 electoral base, has 17% of voting intentions, neck
and neck with Valérie Pécresse (16%). (Ipsos France) January 7, 2022
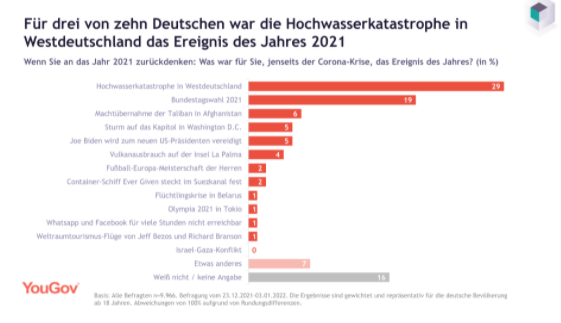
Most Germans (29 Percent) Think The Flood Disaster In
Western Germany In July 2021 Was Event Of The Year Other Than Corona A few days ago the old year 2021 came to an
end. It was the second year in which the corona pandemic kept Germany and the
whole world in suspense. In addition, refugee crises and climate catastrophes
dominated the news. When asked what was the event of the year for the
respondents outside of the corona crisis, most Germans (29 percent) answered
the flood disaster in western Germany in July 2021, women more often than men
(33 percent vs. 25 percent of men). The federal election came in second place
among all respondents with 19 percent. It was more eventful for men than for
women (23 percent vs. 15 percent of women). (YouGov Germany) January 6, 2022
(USA) Over Past Five Years An Average Of Forty-One Percent Of U S
Adults Think Of Themselves As Overweight Forty-one percent of U.S. adults, on
average over the past five years, from 2017 to 2021, have characterized
themselves as overweight, while the slight majority (53%) have said their
weight is about right and 5% reported they are underweight. The percentage
overweight is up from 36% in the prior five-year period, from 2012-2016, but
similar to the rates between 2002 and 2011. 41% describing themselves as
overweight in Gallup surveys is consistent with the latest federal obesity
rate of 42%, suggesting that obese people as the government defines them are
the ones most likely to self-report being overweight. (Gallup) JANUARY 3, 2022 Americans At The Ends Of The Ideological
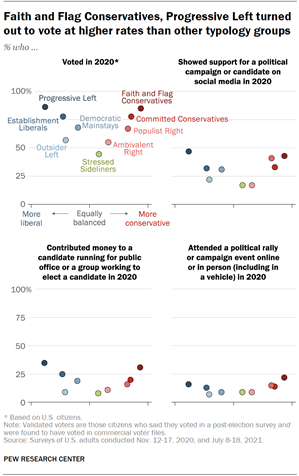
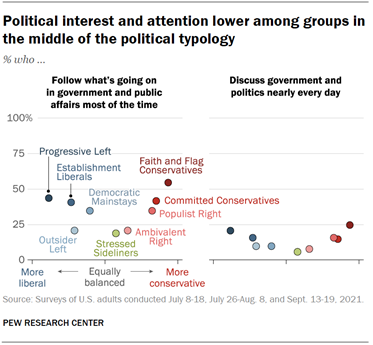
Spectrum Are The Most Active In National Politics In a major 2021 study, the Center sorted
Americans into nine political typology groups, based on an analysis of their political
attitudes and values. About 85% of adults in the two groups at the ends of
the political spectrum voted in 2020 (85% of Faith and Flag Conservatives and
86% of Progressive Left). Moving from either end of the typology toward more
ideologically mixed groups shows a gradual decrease in turnout. Faith and
Flag Conservatives and those categorized as Progressive Left were also the
most likely to report having contributed money to candidates and political
organizations in 2020, to have posted support for a candidate or campaign on
social media, and to have attended political rallies in person or virtually. (PEW) JANUARY 5, 2022 38% Of Adults Traveled By Air In 2021 In U S Versus 44% In
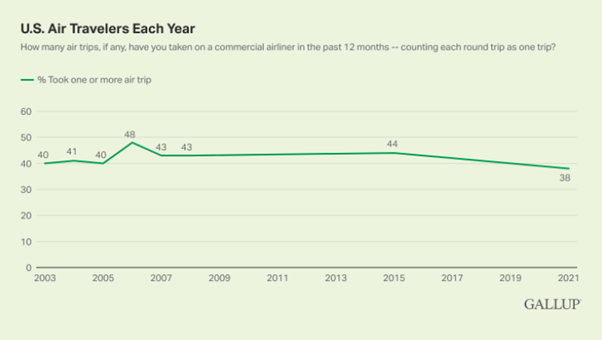
2015 Thirty-eight percent of U.S. adults polled
in a Dec. 1-16 Gallup survey reported they had taken at least one trip on a
commercial airliner in the past 12 months. That's modestly lower than the
percentages Gallup found in December measurements from 2006 to 2015, when
between 43% and 48% reported traveling by air in the past year. Before that, from
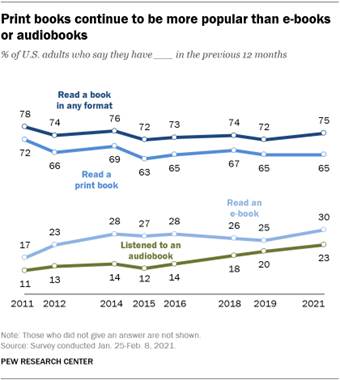
2003 to 2005, the figure was closer to today's level, at 40% to 41%. (Gallup) JANUARY 6, 2022 Three-In-Ten Americans Now Read E-Books Americans are spreading their book
consumption across several formats. The share of adults who have read print books
in the past 12 months still outpaces the share using other forms, but 30% now
say they have read an e-book in that time frame. Overall, 75% of U.S. adults
say they have read a book in the past 12 months in any format, whether
completely or part way through, a figure that has remained largely unchanged
since 2011, according to a Pew Research Center survey conducted from Jan. 25
to Feb. 8, 2021. (PEW) JANUARY 6, 2022 Controversy Over The Term 'Latinx': Public Opinion Context Only 4% of Hispanic Americans surveyed by
Gallup preferred "Latinx" as the label of choice to describe their
ethnic group. The majority (57%) said that a choice among the labels
"Hispanic," "Latino," "Latinx" or another term
didn't matter to them, while another 23% preferred "Hispanic" and
15% preferred "Latino." These results were very similar to those
from a Gallup survey conducted in 2013. (Gallup) JANUARY 7, 2022 MULTICOUNTRY STUDIES 77% Of The World's Population, On Average, Consider That
2021 Has Been A Bad Year For Their Country; A Survey In 33 Countries A few days after saying goodbye to 2021, a
year marked, once again, by the fight against Covid-19, the balance of
citizens over the last 12 months is negative in most countries. This is
confirmed by the data from the latest survey conducted from the Ipsos Global Advisor online platform . On
average, three-quarters of the world's population (77%) say that 2021 has
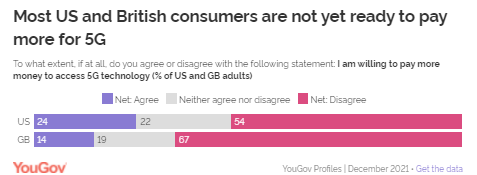
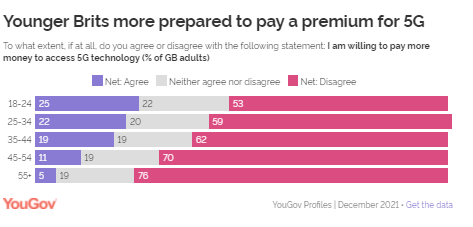
been a bad year for their country. (Ipsos Spain) 3 January 2022 A Majority Of Consumers In The United States (54%) And
Great Britain (67%) Are Not Yet Willing To Pay More To Access 5G Technology A new analysis from
YouGov reveals that a majority of consumers in the United
States and Great Britain are not yet willing to pay
more to access 5G technology (54% and 67% respectively). The
data shows that while a higher share of American
consumers indicate that they are prepared to
pay more for 5G (24%), only 14% of Brits say the same. Notably,
a sizable proportion of consumers from both markets haven’t made up their
mind, with 19% in Britain and 22% in the US still on the fence about paying
more for 5G. Almost seven in ten Brits – and half of Americans
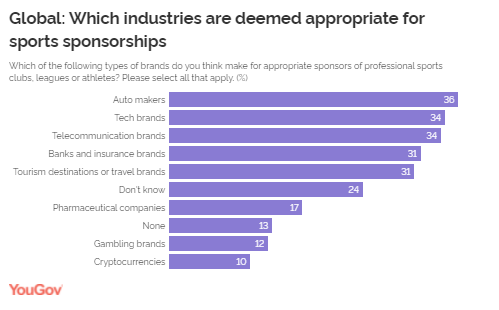
– are not willing to pay more. (YouGov UK) January 05, 2022 Globally, Automobile Manufacturers Are The Most Likely To
Be Considered A Good Fit For Sports Sponsorships, YouGov Study Conducted
Across 17 Markets Globally, automobile manufacturers are the
most likely to be considered a good fit for sports sponsorships. Over a third
of consumers (36%) think automakers are appropriate sponsors of professional
sports clubs, leagues or athletes. Tech (34%) and telecommunication (34%)
brands follow closely behind. Three in five consumers also consider banks and
insurance brands (31%) and tourism (31%) companies as appropriate sponsors
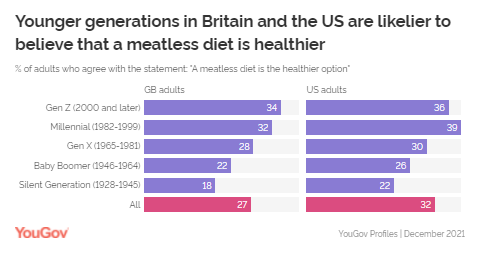
for sports properties. (YouGov UK) January 05, 2022 Younger Gens In Britain, U S Likelier To Believe That
Meatless Diets Are Healthier According to a YouGov Profiles survey, a
third of Americans (32%) and just over a quarter of Brits (27%) believe that
‘a meatless diet is the healthier option’. This sentiment is the most
prominent among the younger generations in both markets. In Britain, a third of the members of Gen Z
(34%) and Millennials (32%) believe that meatless diets are better for
health. The level of agreement declines with each passing generation, with
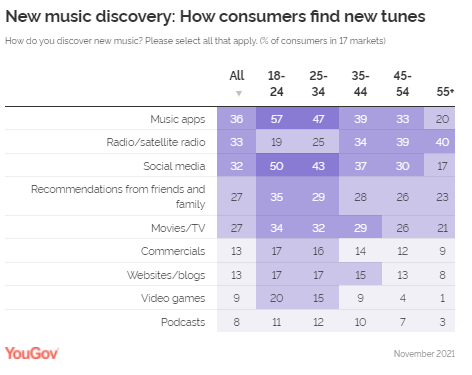
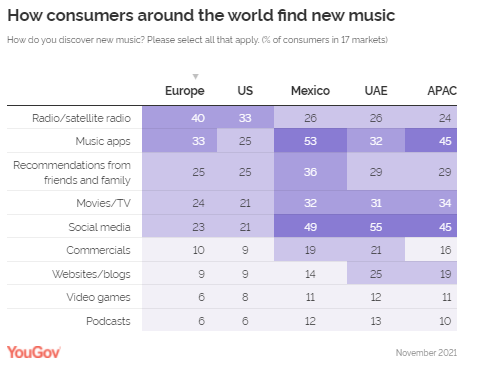
only a fifth of Baby Boomers (22%) saying meatless diets are healthier. (YouGov UK) January 05, 2022 Overall, Among Consumers In 17 Markets Music Apps Such As
Spotify Are The Most Popular Way To Discover New Tunes (36%) Overall, among consumers in 17 markets in
which YouGov conducted research, music apps such as Spotify are the
most popular way to discover new tunes (36%) as more consumers migrate
to streaming apps. Our data also shows that radio isn’t dead.
A third of global consumers still find recent music on terrestrial or satellite
radio (33%); however this group is more likely to be over 35 years
old. Social media is also a powerful platform for artists, as 32% of
consumers say that is where they find new music. (YouGov UK) January 05, 2022 Six Out Of 10 Adults From 28 Countries Expect That Products
And Services Using Artificial Intelligence Will Profoundly Change Their Daily
Life In The Next Three To Five Years A new Ipsos survey for the World Economic Forum finds that, on average, six out of 10
adults from 28 countries expect that products and services using artificial
intelligence will profoundly change their daily life in the next three to
five years. Half of them feel it has already been the case in the past few
years. Six in ten also agree that products and services using AI make their
life easier, but only half say they have more benefits than drawbacks and
four in ten adults admit that AI-powered products and services make them
nervous. Just half say they trust companies that use AI as much as they trust
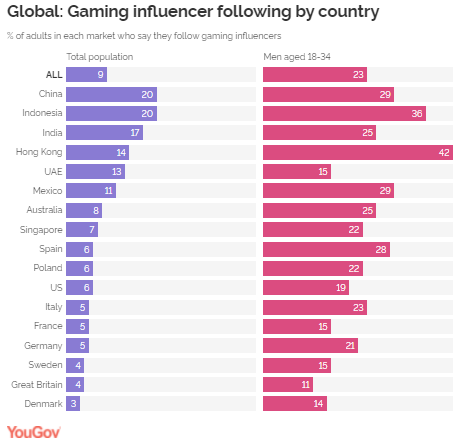
other companies. (Ipsos Canada) 5 January 2022 Source: https://www.ipsos.com/en-ca/news-polls/global-opinions-about-ai-january-2022 A YouGov Survey Across 17 Markets Reveals That Gaming
Influencers Are The Most Popular Influencer Category Among Men Aged 18-34 A YouGov survey across 17 markets, which
forms the basis of a three-part gaming whitepaper, reveals that gaming
influencers are the most popular influencer category among men aged 18-34. Overall,
gaming influencers are followed by just one in 11 consumers globally (9%),
making it only the 11th most popular category of influencers followed. The
list is led by categories such as food (16%), health (12%) and celebrity
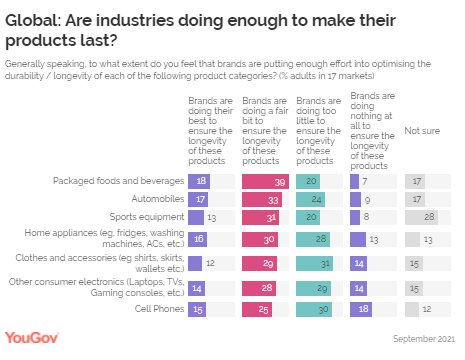
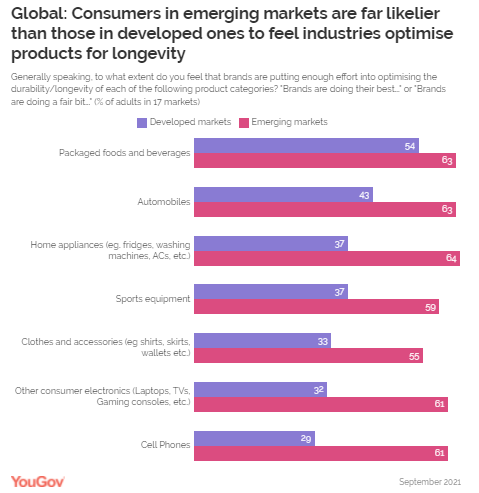
(12%). (YouGov UK) January 06, 2022 Source: https://yougov.co.uk/topics/technology/articles-reports/2022/01/06/reach-gaming-influencers-globally Consumer Perceptions On Product Durability Across Different
Industries, A Study In 17 Economies Overall, packaged foods and beverages wins
the biggest vote of confidence, with almost three in five consumers (57%)
saying brands within that industry are doing a fair bit or their best to
ensure their products last. Half of the consumers globally also say that
automobile manufacturers are putting enough effort to ensure their products
are long-lasting (50%). Home appliances (46%) and sports equipment (44%)
follow closely behind. (YouGov UK) January 06, 2022 ASIA
724-43-01/Polls More Than A
Third Of Urban Indians Oppose The Upcoming Cryptocurrency Bill
As the government readies a bill on
cryptocurrencies, YouGov’s latest data shows more than a third of urban
Indians (36%) are not in favour of this move. Just as many (35%) are unsure
while three in ten (29%) support this decision.
The bill that is yet to receive the
cabinet’s nod, has already swept India’s digital currency market by a wave of
nervousness and confusion. Currently, only a third of urban Indians claim to
own a cryptocurrency (33%) while the majority (67%) do not. Data shows that
opposition towards the “Cryptocurrency and Regulation of Official Digital
Currency Bill 2021” is higher among those who own crypto compared to those
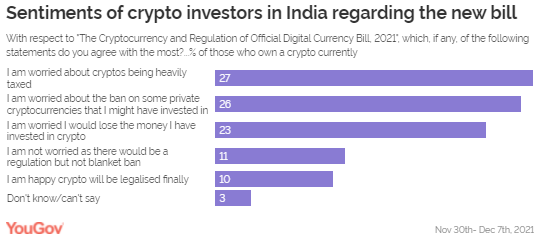
who do not (52% vs 28%). Among crypto investors, the biggest concern
around the bill is about cryptos being heavily taxed (27%) as well as a ban
on private currencies they have invested in (26%). Some (23%) fear losing
their invested money and just one in ten (10%) are happy about the crypto
market being finally legalised.
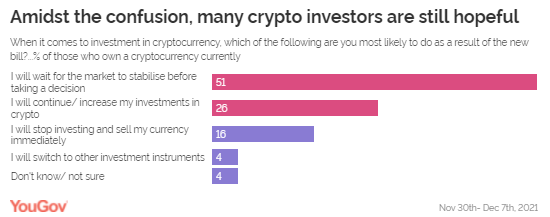
Thinking about their future investments,
more than half (51%) of current crypto owners said they will wait for the
market to stabilize before taking a decision. Half of this proportion (26%)
will continue or increase their investments in crypto. One in six (16%) said
they will stop investing and sell their digital money, while a few plan to
switch to other investment tools (4%).
Among those optimistic about cryptocurrencies,
three in five (60%) think digital currency has a bright future and early
adoption of cryptocurrency will help them gain an advantage. Many think it is
a good long-term investment (45%) while others just want to diversify their
portfolio (35%). Along with seeking to regulate the crypto
market in India, the bill also aims to create an official digital currency to
be issued by the RBI. This news is welcomed by urban Indians and a majority
(61%) said they are likely to invest in digital currency if it is launched by
RBI, showing that people are not averse to the idea of investing in digital
currency as long as it is legitimate. Only 11% said they are unlikely to
invest in RBI-issued digital coins, while 27% still have not made up their
mind. (YouGov India) January 5, 2022 Source: https://in.yougov.com/en-hi/news/2022/01/05/more-third-urban-indians-oppose-upcoming-cryptocur/ 724-43-02/Polls 1 Out Of 2
People Agree That More Difficult Days Await In The Epidemic
7 out of 10 people think that the epidemic
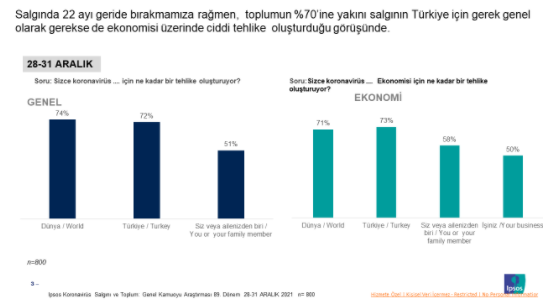
still poses a threat to Turkey The rate of those who think that the
epidemic still poses a threat to Turkey and the Turkish economy is over 70%.
Although this rate drops when it comes to themselves and their families, half
of the society continues to see the epidemic as a threat to themselves and
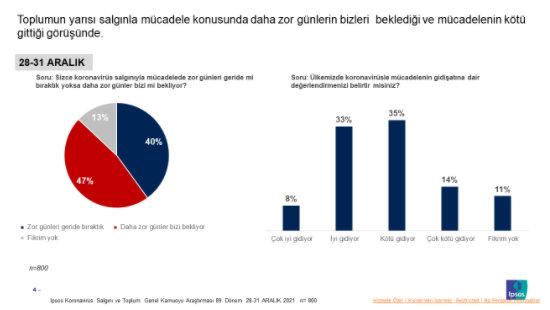
their families. And 1 out of 2 people agree that more
difficult days await. With the increase in the number of cases
and the effect of the fast contagious feature of the Omicron variant, 47% of
individuals think that even more difficult days will come. And again, one out
of every 2 people thinks that the fight against the epidemic is not going well.
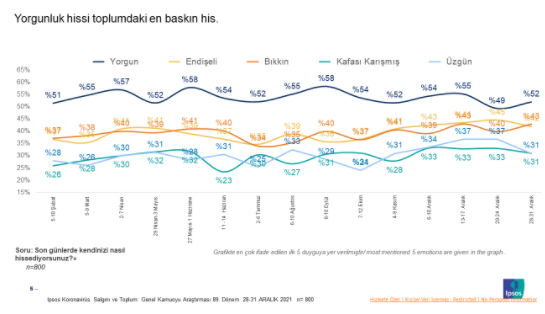
Emotions that individuals feel during the
epidemic do not change much. Most Dominant Emotion Fatigue The first 5 emotions that people felt
during the epidemic did not change. Fatigue is the most cited emotion; 52% of
individuals state that they feel tired. The other two emotions that follow
fatigue are anxiety and boredom. In the last week of 2021, 4 out of 10 people
are bored and anxious.
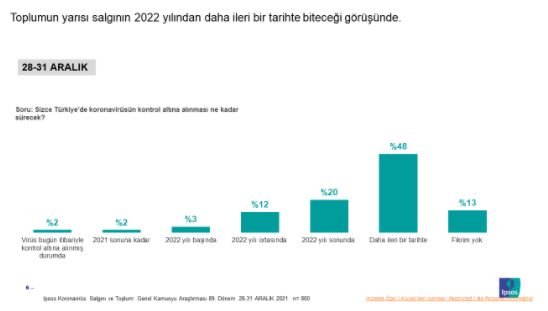
Regarding the duration of the epidemic, the
opinion is that it will end at the end of 2022 or at a later date. When asked when the epidemic will end, 48%
of the society thinks that the epidemic will end even later than 2022. The
rate of those who indicate the end of 2022 is 20%. In other words, 7 out of
10 people think that the epidemic will continue for at least one more year.
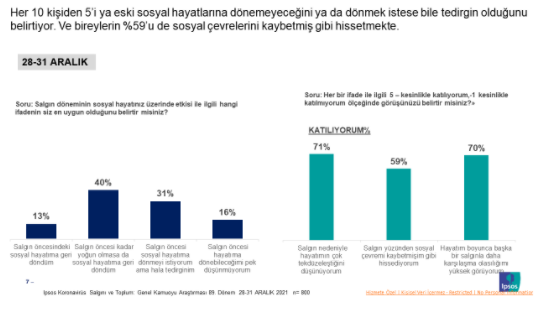
And Half Of The Society Thinks The Pandemic
Has A Negative Effect On Their Social Life Half of the individuals are worried that
they can return to their social life before the epidemic. 3 out of 10 people
think that they cannot return to their old social life. However, 59% of the
society feels as if they have lost their social circle in this period. As a
result of all these, 7 out of 10 people state that their life has become
monotonous.
Sidar Gedik, CEO of Ipsos Turkey, made the
following evaluations about the data; The epidemic continues to threaten our
lives with the new variant. There is a remarkable increase in the number of
daily cases. We do not yet know whether the Omicron variant, which has a much
higher contagious rate, is that "faster but less damaging" variant
that could bring an end to the epidemic. More than 70% of people say that the
virus still poses a great danger. Half of the respondents think that we have
an even more difficult period ahead of us. The rate of those who think that
the struggle is going bad is 49%. The rate of those who point to a date later
than 2022 as the date when the epidemic will end is also about 50%. We can see the reflection of this picture
when one of the two people expresses that the most dominant emotions or
states are fatigue, anxiety, and boredom. To sum up, half of the society is
of the opinion that the course of the epidemic is not good, that is why we
will continue to live with the epidemic for a while in 2022 and after, and
even more difficult days are waiting for us than what we have experienced so
far. (Ipsos Turkey) 4 January 2022 724-43-03/Polls The Majority
(68%) Of Pakistanis Blame The Government For Inflation
According to a survey conducted by Gallup
& Gilani Pakistan, the majority (68%) of Pakistanis blame the government
for inflation. A nationally representative sample of adult men and women from
across the four provinces was asked the following question, “Who do you think
is responsible for inflation?” In response to this question, 10% said
traders/manufacturers, 68% said government, 5% said wasteful people, 3% said
international factors, 1% said foreign aid (Arab, Britain), 2% said previous
governments, 3% said public, and 2% said others. 6% did not know or provided
no response.
Urban-Rural Breakdown As compared to urban
residents (63%), rural residents (70%) are more likely to hold the government
responsible for inflation.
(Gallup Pakistan) January 07, 2022 Source: https://gallup.com.pk/wp/wp-content/uploads/2022/01/7-Jan-2022-English.pdf WEST
EUROPE
724-43-04/Polls UK - Understanding Coffee Drinking Among Gen Z
Millennials have defined trends within the coffee sector for several
years but the influence of Gen Z on coffee culture is trending, particularly
in the UK. When asked whether there’s no such thing as too much coffee, three in
ten Brits agreed, while 16% are undecided. But what’s the picture like
between the generations? Gen Z has the highest share of consumers who disagree with the
statement (61%) with only 26% in agreement and 13% of consumers on the fence.
Millennials and Gen X-ers, on the other hand, seem to have the highest share
of coffee enthusiasts as 32% of them don’t think there’s such a thing as too
much joe. While the Silent Generation has the lowest share of consumers in
agreement (22%), the proportion of those who neither agree nor disagree is
the highest among this generation (20%). Gen Zs are amongst the least likely
to agree that there is no such thing as too much coffee – and the least
likely among the youngest three generations. Does that mean the coffee
love-in is dying?
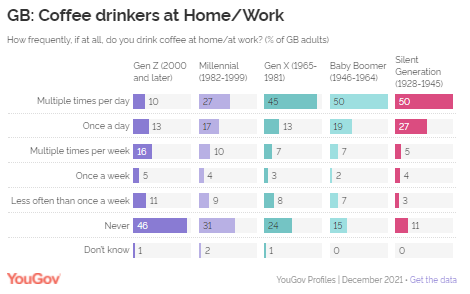
Where do coffee drinkers get their fix? Further analysis shows that Brits do most of their drinking at home
or work, with a majority drinking coffee there at least once a day. But slightly less than half (46%) of Gen Z say they never drink
coffee at work or home, with only a minority (10%) drinking multiple times a
day – the lowest of all our groups. The share of those who never drink at
work/home steadily reduces as we move towards the older generations. Gen Zs
are the most likely to tell us that they drink coffee at home or at work less
than once a week. Although the Silent Generation had the lowest share of consumers who
agreed with the previous statement, the share of those who drink coffee
multiple times a day shows that they are far from sworn off the caffeine (50%
do so, equal to Baby Boomers).
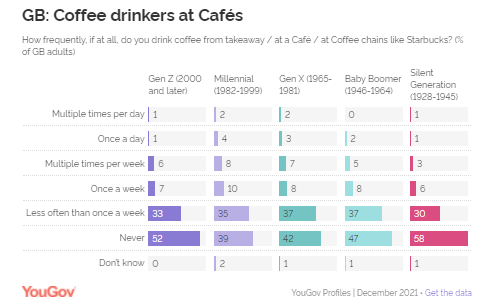
When you look at the number of times Brits drink at cafes, the data
reveals that it is a much less common habit – and something which consumers
tend to treat themselves to much less often. Around half of Brits never do
it, while the most common answer is less often than once a week. Again, Gen Zs are less likely to drink coffee this way. The total
proportion of Gen Zs that either drink coffee less often than once a week or
never drink (11% and 46% at home, 33% and 52% at cafés, respectively) outweighs
the proportion that do drink more than once a week. That’s consistent with
our data that Gen Z members are doing without coffee in their daily routine.
What motivates consumers to drink coffee? Among those who drink coffee, taste, strength, type of coffee and
price seem to be the top four factors for the older generations when buying
coffee. However, while taste and price are also at the top of Gen Z’s
motivation, the next most important factor is convenience (20%). This could
probably be the reason why a higher share of Gen Z bought ready to drink
coffee (16%) in the last three months. How to connect with Gen Z In order to reach and engage with Gen Z, YouGov data unsurprisingly
reveals that social media is one of the best mediums advertisers should focus
on. Almost two in five Gen Z-ers say they don’t trust adverts on TV, while
51% say they are more likely to engage with advertisements on social media
than on regular websites. Gen Z is also more likely to be influenced by ads they see - 46% agree
that advertising helps them choose what they buy, compared to 19% of Baby
Boomers and 17% of the Silent Generation. They are also more likely to engage
with adverts that are tailored to them (42%). (YouGov UK) January 05, 2022 724-43-05/Polls For 33% Of French People, The Practice Of A Physical Activity Is The
Number 1 Resolution
Ranking of resolutions for the year 2022 If playing sports and spending more time with friends and family are
once again at the top of French resolutions, allowing yourself real moments
of relaxation for yourself this year precedes the idea of
eating more balanced. On the 2022 Good Resolutions podium: Practice regular physical activity for 33% of French people (-4% vs
2020) and more particularly among those under 35 (37%) Spending more time with family for 26% (-3% vs 2020) especially among
those over 60 (35%) Reserve real moments of relaxation for 23% (+ 2% vs 2020) Asked about the keeping of their 2021 resolutions, more than 1 in 2
French people (55%) say they have held at least one of them: a proportion
down slightly compared to last year (-2%) . Notably, the figure rises to 62% for those over 60!
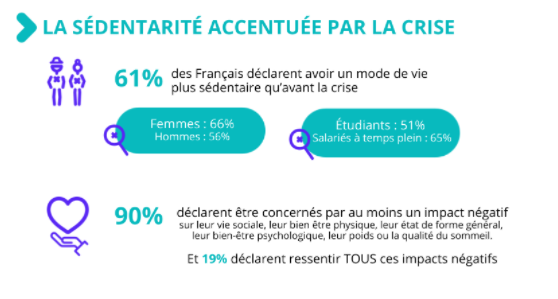
Sedentary lifestyle accentuated by the crisis Last year, 67% of French people said that the health crisis had made
it more difficult to be able to practice a physical or sporting activity . Thus, this year, 6 in 10 French people say they
have a more sedentary lifestyle than before the crisis. Alarming figures in themselves and which are even more worrying for: Women: 66% (vs men 56%) Full-time employees: 65% (vs. students 51%) This sedentary lifestyle impacts all dimensions of life, but mainly: Social life for 63% Physical well-being for 61% The general state of form for 60% Psychological well-being for 58% The weight (53%) and the quality of sleep (48%) seem to be a little
less affected. These changes are strongly felt: 90% say they are affected by at least one of these negative impacts 19% say they feel ALL these negative impacts
The return to normal life disrupts the sports practice of the French The impact of the health crisis, the successive confinements and the
rules of social distancing had made the French aware of the importance of the
practice of a physical activity on their physical and mental well-being. Between 2019 and 2021, habits have been turned upside down ... and
unfortunately everything suggests that the return to almost normal life has
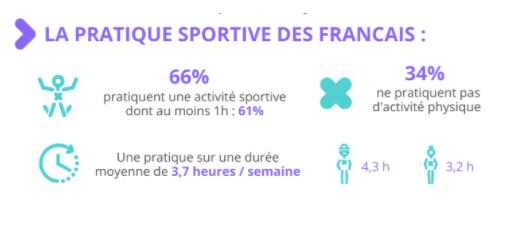
been done to the detriment of sports: 66% of French people say they practice
a physical activity, i.e. almost equality. perfect with the pre-health crisis
(64% in 2019) and a drop compared to 2020 (81%). While fewer of them take part in a sport, the most active do so for
longer. 34% of French people say they practice 3 hours of sport or more per
week, thus bringing the average duration of sport practice to 3.7 hours per
week (vs. 2.9 hours in December 2020). This is the longest time ever recorded since the creation of the
Sport-Health Barometer in 2011.
(Ipsos France) January 3, 2022 724-43-06/Polls 48% Of French People Recognize That Their Daily Mode Of Travel Is Not
Ecological
The car remains the preferred mode of transport for the French,
mainly in peri-urban and rural areas. For everyday travel, the French still mostly use the car (75%). This
is particularly the case outside the Ile-de-France region (79%), in rural
(86%) and peri-urban (87%) areas. But the car remains in the majority,
including in urban centers (61%). Its use is certainly less strong in
Ile-de-France (55%) and in particular in the Parisian agglomeration (52%),
but remains the majority. Public transport is used on a daily basis by a minority of French
people (29%), but a majority of Ile-de-France residents (53% - part of which
therefore combines the use of public transport and the car). As for active mobility (walking, cycling, scootering, etc.), 44% of
French people use it for their daily commute, particularly in the Parisian
metropolitan area (60%) and in other large agglomerations (53% in the
metropolitan areas of 100 000 inhabitants and more). The economic as well as the ecological cost of travel rises the
further away from the centers. 39% of French people consider that the way they get around on a daily
basis is not cheap. While residents of urban centers have access to more
economical modes of travel (public transport, cycling, walking), residents of
suburbs and especially peri-urban areas have fewer options to lower the bill.
Thus, 47% of peri-urban dwellers consider that the conditions in which they
move are not cheap, against 30% of inhabitants of urban centers. 48% of French people recognize at the same time that the way they get
around on a daily basis is not ecological (60% in peri-urban areas against
37% in urban centers). Reducing the ecological impact of daily travel: a priority now
asserted but difficulties in taking action 91% of French people say they would like to be able to reduce the
ecological impact of their daily journeys. 51% of French people give
themselves less than 5 years to successfully use less polluting means of
transport. The solutions considered by the French: Move more on foot or by bike (37%), Buy an electric or hybrid vehicle (36%), for which the French ask for
more parking spaces, Use more public transport (21%) with the feeling that it is not
always easy to use it, although public transport is the first sector to
invest according to respondents (46%). However, 73% of those questioned consider it difficult or even
impossible to use mobility solutions that pollute less than the use of a
private car. 51% of French people think, for example, that it is difficult to take
public transport where they live; this is the case for 76% of the inhabitants
of agglomerations of less than 20,000 inhabitants. Very often, the solutions that make it possible to avoid the private
car (and 76% of French people who use their car for their daily commute would
like to be able to do without it) are too far from home to be used on a daily
basis, in particular when traveling. away from the urban center. This is the
case with car-sharing stations (52% deem them too far away), carpooling areas
(48%), tram or metro stops (55%), train stations (47%) or even stops by bus
(31%; 48% in peri-urban areas and 61% in rural areas). For the French who are furthest from urban centers, other solutions
exist and arouse great interest: a motorway or expressway coach service
leaving from a car park located near their home and serving a connection
point with other means of transport (59% would be likely to use them for
their daily trips; 63% of inhabitants of peri-urban areas and 69% in rural
areas), reserved lanes on highways or expressways at certain times of the day
for carpooling , taxis or coaches, for example (53% interested). (Ipsos France) 6 January 2022 724-43-07/Polls Presidential 2022 | Emmanuel Macron Is In The Lead
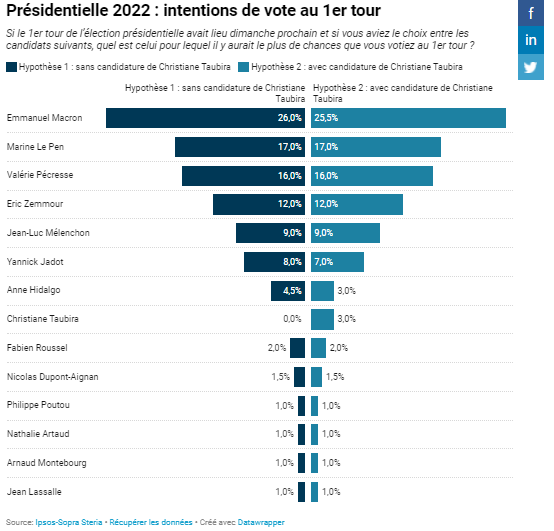
Emmanuel Macron leading the voting intentions in the first round ... Three months before the election, Emmanuel Macron would emerge in the
lead on the evening of the first round. He is now credited with 26% of voting
intentions - two points more than his first round score in 2017 (24%) - and
enjoys a solid electoral base: 68% of his 2017 voters plan to vote again for
him, joined by more than 30% of those who had voted for François Fillon at
the time. The second qualifying place for the second round is however for the moment
very uncertain. Marine Le Pen, who retains 62% of her 2017 electoral base,
has 17% of voting intentions, neck and neck with Valérie Pécresse (16%). The
campaign dynamic is currently less favorable to Eric Zemmour, who has fallen
to 12%, mainly recruited from the 2017 electorate of Marine Le Pen (29%) and
François Fillon (12%). Jean-Luc Mélenchon keeps the leadership on the left with a short
head, but with 9% of voting intentions, he is 10 points behind his score in
2017 (19.6%). Yannick Jadot is at 8%, Anne Hidalgo at 4.5%, Fabien Roussel at
2%, Arnaud Montebourg at 1%, for a historically low left total, at 24.5%. At
this stage, it is not obvious that the arrival of Christiane Taubira in the
political offer of the first round does not change the situation. Tested in a
second hypothesis, it would obtain 3% of voting intentions, schematically
"taken" from Anne Hidalgo (1.5 points), Yannick Jadot (1 point) and
Emmanuel Macron (0.5 points).
... as in the second Even if they are not very significant far from the ballot and
especially before the 1 st round has
really taken place, it will be noted all the same that Emmanuel Macron is at
the head of the voting intentions in the second round regardless of the
opponent. The balance of power is now measured at 55% / 45% against Valérie
Pécresse and 58% / 42% against Marine Le Pen. Whether or not they are certain to vote, nearly four out of ten
voters predict the re-election of the outgoing President.
(Ipsos France) January 7, 2022 Source: https://www.ipsos.com/fr-fr/presidentielle-2022-emmanuel-macron-fait-la-course-en-tete 724-43-08/Polls Most Germans (29 Percent) Think The Flood Disaster In Western Germany
In July 2021 Was Event Of The Year Other Than Corona
A few days ago the old year 2021 came to an end. It was the second
year in which the corona pandemic kept Germany and the whole world in
suspense. In addition, refugee crises and climate catastrophes dominated the
news. When asked what was the event of the year for the respondents outside
of the corona crisis, most Germans (29 percent) answered the flood disaster
in western Germany in July 2021, women more often than men (33 percent vs. 25
percent of men). The federal election came in second place among all
respondents with 19 percent. It was more eventful for men than for women (23
percent vs. 15 percent of women). Flood disaster in West Germany Event of the year
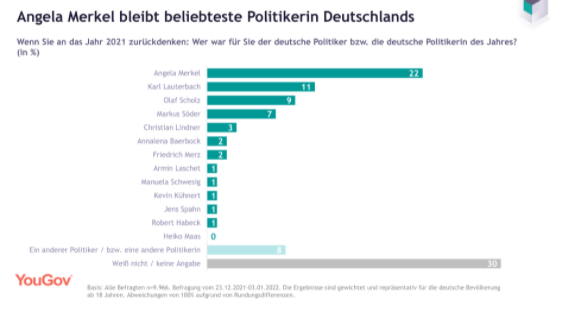
In the year she passed - Angela Merkel is considered the most popular
German politician For 22 percent of Germans, Angela Merkel is the German politician of
the year 2021, for East Germans a little more often than for West Germans (24
percent vs. 21 percent of West Germans). The new Health Minister Karl
Lauterbach is elected by 11 percent of Germans as last year's politician.
West Germans make this statement more often than East Germans (12 percent vs.
8 percent of men). The newly elected Chancellor Olaf Scholz was named by 9
percent of Germans when asked who was the most popular politician, while
Bavarian Prime Minister Markus Söder was named by 7 percent.
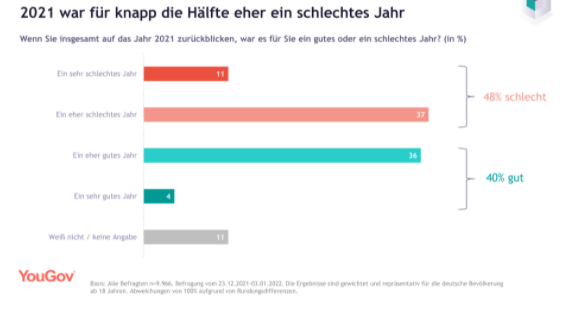
Almost half with a personally negative summary After 2021, almost half of Germans draw a negative conclusion: 48
percent of those surveyed say that they perceived 2021 as a rather or very
bad year. For two out of five Germans, on the other hand, it was a good or
very good year (40 percent).
(YouGov Germany) January 6, 2022 Source: https://yougov.de/news/2022/01/06/yougov-jahresruckblick-2021-hochwasserkatastrophe-/ NORTH
AMERICA
724-43-09/Polls Over Past Five Years An Average Of Forty-One Percent Of U S Adults
Think Of Themselves As Overweight
Forty-one percent of U.S. adults, on average over the past five
years, from 2017 to 2021, have characterized themselves as overweight, while
the slight majority (53%) have said their weight is about right and 5% reported
they are underweight. The percentage overweight is up from 36% in the prior five-year
period, from 2012-2016, but similar to the rates between 2002 and 2011.
The findings contrast with federal health statistics that are based
on physical measurements, which show that nearly three-quarters of Americans
are either overweight or obese. However, the 41% describing themselves as
overweight in Gallup surveys is consistent with the latest federal obesity
rate of 42%, suggesting that obese people as the government defines them are
the ones most likely to self-report being overweight. In addition to asking respondents if they are overweight, Gallup's
annual healthcare poll tracks U.S. adults' self-reported current weight,
their desire to lose weight, whether they are currently trying to lose weight
and what they consider to be their ideal weight. Americans Have Gotten Heavier After being fairly stable in each five-year period from 2002 through
2016, Americans' average self-reported weight for 2017 through 2021 increased
by five pounds to 181 pounds. Both men and women have weighed more, on average, over the past five
years than they weighed during any previous period. Men's weight is up four
pounds since 2012-2016 to an average 199 pounds in 2017-2021, while women's
is up six pounds to 163 pounds over the same period.
The percentage of Americans who want to lose weight has been more
variable over the past two decades. The average 55% of U.S. adults who have
expressed a desire to lose weight between 2017 and 2021 is up slightly from
the previous five-year period (52%), in line with the 2007 through 2011
reading (57%) and slightly lower than the 2002-2006 figure (60%). Women are much more likely than men to say they want to lose weight.
While about three in five women in the latest five-year period would like to
trim their waistlines, just under half of men express the same desire. This
pattern has been consistent since 2002-2006.
Although more than half of Americans would like to lose weight, an
average 26% have said they were seriously trying to do so from 2017 through
2021. This is not significantly different from the previous three five-year
periods. Women (29%) are more likely than men (23%) to report that they are
actively attempting to slim down, which has also been a consistent pattern.
(Gallup) JANUARY 3, 2022 Source: https://news.gallup.com/poll/388460/percentage-americans-consider-themselves-overweight.aspx 724-43-10/Polls Americans At The Ends Of The Ideological Spectrum Are The Most Active
In National Politics
U.S. adults who fall on either end of the ideological spectrum are
more active than other Americans across several measures of political
engagement, from voting to posting about politics on social media to donating
to campaigns. Americans who hold less consistently liberal or conservative
views, by contrast, tend to be less engaged on these topics, as Pew Research
Center studies have long found. Here are some recent findings that illustrate
this dynamic.
(PEW) JANUARY 5, 2022 724-43-11/Polls 38% Of Adults Traveled By Air In 2021 In U
S Versus 44% In 2015
Fewer Americans traveled by air in 2021 than in any year in Gallup
records between 2003 and 2015, largely because of reduced travel by employed
adults. At the same time, those who did fly continued to make multiple
airplane trips within the year, albeit a bit fewer than in prior years. Fewer Than Four in 10 Adults Flew in 2021 Thirty-eight percent of U.S. adults polled in a Dec. 1-16 Gallup
survey reported they had taken at least one trip on a commercial airliner in
the past 12 months. That's modestly lower than the percentages Gallup found
in December measurements from 2006 to 2015, when between 43% and 48% reported
traveling by air in the past year. Before that, from 2003 to 2005, the figure
was closer to today's level, at 40% to 41%. Line graph. Trend from 2003 to 2021 in the percentage of U.S. adults
who took at least one trip on a commercial airliner in the past year. The
rate was 38% in 2021, down from 40% or more in all prior measurements,
including 44% in 2015.
Air Travel Down Sharply Among Employed Adults The percentage of Americans traveling by air in 2021 was depressed
among employed adults, at 41%, down from 54% in 2015. The current figure is
the lowest for employed adults in Gallup's trend. By contrast, the percentage of nonworking adults who report traveling
was steady at close to a third -- 34% in 2021 versus 33% in 2015. This is
comparable to the rate for nonworking adults in most years since 2003. Line graph. Trends from 2003 to 2021 in the percentages of employed
and not employed adults who took one or more air trips in the past year. The
41% among employed adults in 2021 is easily the lowest in Gallup records,
with a range of 44% to 54% between 2003 and 2015. The 34% among nonemployed
adults is similar to the 33% in 2015 as well as the historical range of 32%
to 41%.
Gallup did not ask this question in 2020, thus missing what certainly
would have been a record low in self-reported air travel amid the business
shutdowns and extreme social distancing that occurred at the start of the
pandemic. According to the U.S. Transportation Security Administration (TSA),
the number of passengers traveling through airport security plunged at the
start of the pandemic, from over 2 million daily to below 100,000. Consistent
with Gallup's trend, TSA data show that travel increased markedly in 2021,
although it has not been fully restored to its pre-pandemic level. Historically, Gallup measured the percentage of Americans traveling
by air as part of surveys focused on public satisfaction with air travel or
perceptions of air safety. However, with reduced air travel emerging as an
important economic issue during the pandemic, Gallup asked the question again
in December, in order to have a pandemic reading on the rate of U.S.
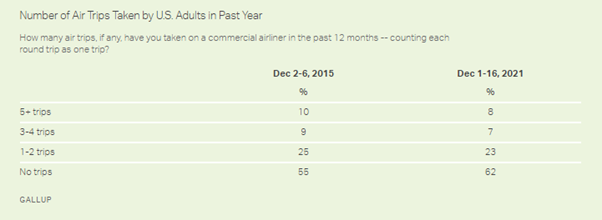
commercial air travel that can be compared with pre-pandemic trends. The question asks respondents to estimate the number of trips they
took on a commercial airliner in the past 12 months, counting each round trip
as one trip. The 38% reporting in December that they flew in the past year
includes 23% who took one or two trips, 7% who took three or four, and 8% who
took five or more. All of these percentages are down slightly from the prior
measurement in 2015. Number of Air Trips Taken by U.S. Adults in Past Year How many air trips, if any, have you taken on a commercial airliner
in the past 12 months -- counting each round trip as one trip?
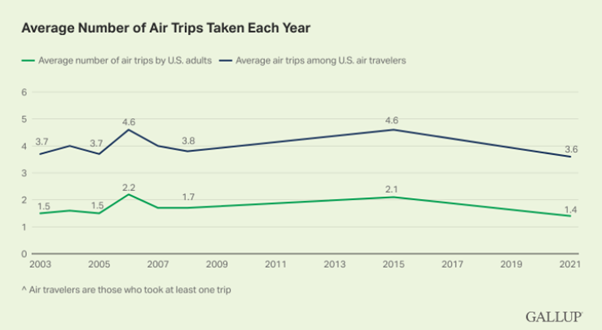
2021 Air Travelers Still Took Multiple Trips, on Average Americans as a whole took an average 1.4 air trips in the past 12
months, which is down from 2.1 in 2015. This decline partly reflects the
increase in people making no trips, from 55% to 62%. However, it also reflects
air travelers flying less, with the average number of flights they report
taking each year declining from 4.6 in 2015 to 3.6 in 2021. Longer term, the average 1.4 trips made by U.S. adults and the 3.6
made by air travelers are below average and the lowest Gallup has measured,
but still roughly tied with the prior lowest readings in Gallup's trend since
2003, recorded more than a decade ago. Line graph. Trends from 2003 to 2021 in average number of flights
taken per year by all U.S. adults as well as by air travelers (defined as
those who took at least one flight). In 2021, these figures were 1.4 among
all adults and 3.6 among air travelers. Both figures are down from 2015 but
similar to the low points in the historical trends.
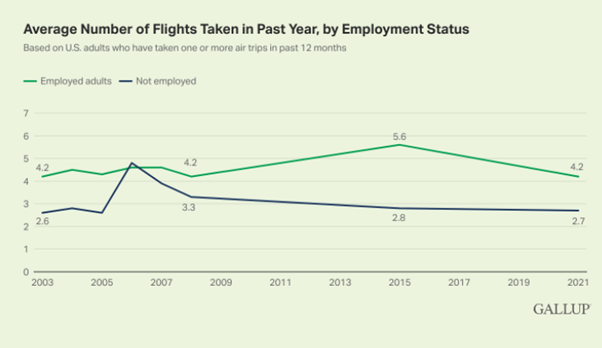
Among 2021 air travelers, the average number of trips that employed
and nonworking adults have taken in the past 12 months is within the normal
historical range for both groups. Employed Americans reported taking an unusually high number of
flights in 2015, averaging 5.6, but the latest average of 4.2 is similar to
the rate from 2003 through 2008. The average 2.7 flights taken by nonemployed adults who flew last
year is similar to the average since 2003 and to most individual readings
during that period, with the exception of higher numbers in 2006 and 2007. Line graph. Trends from 2003 to 2021 in average number of flights
taken per year by employed air travelers and nonemployed air travelers (with
air travelers defined as those who took at least one flight in the past
year). In 2021, these figures were 4.2 among employed adults and 2.7 among
nonemployed adults. Both figures are down from 2015 but similar to the low
points in the historical trends. Bottom Line Commercial air travel remains subdued during the pandemic, a fact
already clear from TSA and other airline industry reports. The Gallup data
reinforce that a reduction in business travel is likely most responsible for
the decline; personal travel, although less common, appears to be holding up
better. And in a promising sign for the airline industry, those who are
traveling are taking multiple trips. While not quite as frequent as in 2015,
the number of flights consumers report taking in 2021 was at the low end of
the normal range recorded in the 2000s. In other words, rather than returning
to air travel warily, once people decide it's safe to get back on a plane,
they are likely to resume something close to their normal travel pace. (Gallup) JANUARY 6, 2022 Source: https://news.gallup.com/poll/388484/air-travel-remains-down-employed-adults-fly-less.aspx 724-43-12/Polls Three-In-Ten Americans Now Read E-Books
Americans are spreading their book consumption across several
formats. The share of adults who have read print books in the past 12 months
still outpaces the share using other forms, but 30% now say they have read an
e-book in that time frame.
Overall, 75% of U.S. adults say they have read a book in the past 12
months in any format, whether completely or part way through, a figure that
has remained largely unchanged since 2011, according to a Pew Research Center
survey conducted from Jan. 25 to Feb. 8, 2021. Print books remain the most
popular format for reading, with 65% of adults saying that they have read a
print book in the past year. While shares of print book readers and audiobook listeners remain
mostly unchanged from a Center survey conducted in 2019, there has been an
uptick in the share of Americans who report reading e-books, from 25% to 30%. Americans read an average (mean) of roughly 14 books during the
previous 12 months and the typical (median) American read five books in that
period, according to the survey. These figures are
identical to 2011, when the Center first began conducting surveys of
Americans’ book reading habits.
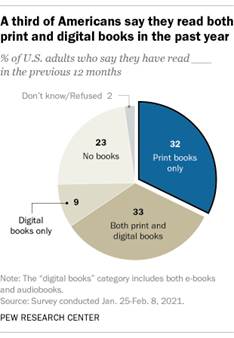
Despite growth in certain digital formats, it remains the case that
relatively few Americans only consume
digital books (which include audiobooks and e-books) to the exclusion of
print. Some 33% of Americans read in these digital formats and also read print books, while
32% say they read only print books. Just 9% of Americans say they only read
books in digital formats and have not read any print books in the past 12
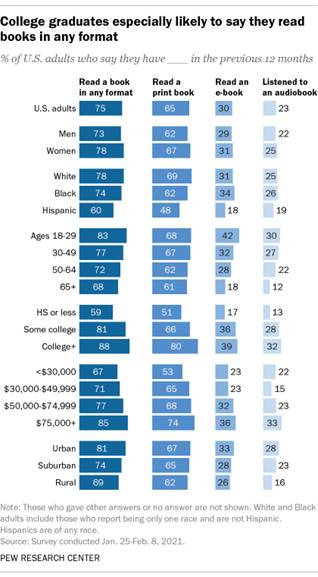
months. Demographic differences in book reading in 2021 are similar to the
patterns seen in past Center
surveys. For example, adults who have a bachelor’s or advanced degree are
more likely to be book readers than those who have only attended some college
and those with a high school education or less, and adults ages 18 to 29 are
more likely to read books than those 65 and older. At the same time, patterns
of book consumption among a few groups changed since 2019. Some examples: Adults with lower incomes –
The share of adults with an annual household income of less than $30,000 who
have listened to an audiobook has increased 8 percentage points since 2019
(22% vs. 14%). Urban adults –
The share of American adults living in urban communities who say they have
read a book in any format in the previous 12 months grew from 75% in 2019 to
81% now – an increase of 6 percentage points. The table below covers how different groups reported their reading
habits in the survey.
(PEW) JANUARY 6, 2022 Source: https://www.pewresearch.org/fact-tank/2022/01/06/three-in-ten-americans-now-read-e-books/ 724-43-13/Polls Controversy Over The Term 'Latinx': Public Opinion Context
Labels matter, and nowhere have we seen this exemplified more throughout
the centuries than in controversies over names used to describe racial and
ethnic groups. One recent example was provided by an article on the Axios
news site earlier this week. The review summarized disputations
surrounding the use of the label "Latinx" to describe people of
Hispanic, Latino and Spanish origin. The article, entitled "Latino
Groups Want to Do Away With 'Latinx,'" reviewed pushback on the use of
the term in a number of different quarters. Axios noted the announcement by U.S. Rep. Ruben Gallego of Arizona,
first vice chair of the Congressional Hispanic Caucus, stating that his
office "is not allowed to use 'Latinx' in official communications."
Gallego noted, "When Latino politicos use the term, it is largely to
appease White rich progressives who think that is the term we use. It is a
vicious circle of confirmation bias." League of United Latin American
Citizens (LULAC) President Domingo Garcia announced in December that his
organization will cease using "Latinx," saying, "The reality
is there is very little to no support for its use and it's sort of seen as
something used inside the Beltway or in Ivy League tower settings." And,
exemplifying the controversy, Hispanic columnist Angel Eduardo called the use
of the term "lexical imperialism," adding that it is "almost
exclusively a way to indicate a particular ideological leaning." Opinions of the People Actually Involved One of the central threads in critiques of the use of
"Latinx" is evidence measuring the opinions of rank-and-file
Hispanic Americans themselves. These data show that relatively few Hispanic
adults have even heard of the term, and very few indicate an interest in
using it to describe their ethnicity. My colleagues Justin
McCarthy and Whitney Dupree reviewed Gallup's research this past
summer. Only 4% of Hispanic Americans surveyed by Gallup preferred
"Latinx" as the label of choice to describe their ethnic group. The
majority (57%) said that a choice among the labels "Hispanic,"
"Latino," "Latinx" or another term didn't matter to them,
while another 23% preferred "Hispanic" and 15% preferred
"Latino." These results were very similar to those from a Gallup
survey conducted in 2013. Hispanic Americans' Preferred Term for Their Ethnic Subgroup The terms "Hispanic," "Latino" and
"Latinx" are used to refer to this ethnic subgroup of Americans.
Which term do you think should generally be used -- Hispanic, Latino, Latinx,
another term, or does it not matter to you either way?
A follow-up question asked the 57% of Hispanic Americans who
initially said it didn't matter to them which term was used if they leaned
toward the use of any of the labels. Only 5% of this residual group
(equivalent to 3% of all Hispanics) leaned toward the label
"Latinx"; most tilted toward the use of "Hispanic" or
"Latino." Overall, then, Gallup data show that at most 7% of Hispanic
adults have an interest in the use of the term "Latinx." These results have been replicated in other surveys. Pew
Research in 2020 reported that 76% of Hispanic Americans had not
heard of the term "Latinx," while only 3% reported they actually
used it and 4% said they prefer it be used to describe the Hispanic or Latino
population. Origins of the Controversy An important aspect of these data is the apparent lack of interest
among Hispanic Americans in the labels used to describe them, despite the
intense reactions of others. As noted, the majority of Hispanic adults in
Gallup's research say they don't care what label (among the three tested) is
used. By extrapolation, the majority presumably don't care if
"Latinx" is or is not used. There is a preference for
"Hispanic" or "Latino" over "Latinx," but this doesn't
tell us if Hispanic Americans actively dislike the term or if it is simply
not preferred. Research conducted by Bendixen & Amandi International in
November did find that 31% of Hispanic voters say the use of the term
"Latinx" bothers or offends them either a lot or somewhat, but that
leaves the majority in the indifferent category. Overall, to the extent there is a controversy, it is apparently not
so much generated from the bottom up -- that is, discontent in the ranks of
Hispanic Americans over the labels used to describe them -- but rather a
controversy developed by thought leaders and activists from the top down. Context for the Creation of the Term
'Latinx' The origins of the term are somewhat hazy, but it was apparently
developed as a replacement for the gender-specific aspects embodied in the
words "Latino" and "Latina." As Professor David Bowles at
the University of Texas Rio Grande Valley noted, the word "Latinx"
is a "non-gendered, nonbinary, inclusive way of pushing back against the
default masculine in Spanish." There is little evidence speaking to the issue of the actual use of
the term "Latinx" in ordinary discourse in the U.S. Its use is
obviously frequent enough to have generated controversy, although this must
be considered in light of the Pew data showing that three-quarters of
Hispanic adults have never heard of the term. Pew in its 2020 report also conducted an analysis of Google Trends
data and found an increase in searches for the term "Latinx" in
recent years, particularly after the deadly shootings in June 2016 during
Latin Night at the Pulse nightclub in Orlando. But the absolute numbers
searching for the term are still very low, particularly when compared with
searches for the terms "Latina," "Latino" and
"Hispanic." And, of course, while Google searches are indicative of
interest in the term, they do not tell us how often it is used in daily life. There is also no research I am aware of measuring non-Hispanic
adults' awareness and use of the term "Latinx," nor measuring
non-Hispanic adults' attitudes toward the term or their thoughts on its use
by others. 'Latinx' Controversy Part of Larger
Cultural Trends The development and use of the term "Latinx" reflect larger
social trends, including an increased focus on the power of words and an
increased emphasis on identity groups. College campuses today are embroiled in discussions of what does and
does not constitute free speech, and some campuses have famously instituted
trigger warnings to alert students to their forthcoming exposure to words and
content they might find disturbing. Advocacy organizations now publish guidelines for the use of
appropriate words in the context of their populations of interest. GLAAD (Gay
& Lesbian Alliance Against Defamation) provides a media reference guide
that lists terms to avoid and terms that are preferred when writing about
lesbian, gay and bisexual issues. The American Medical Association has
published "Advancing Health Equity: A Guide to Language, Narrative and
Concepts," which was "created to give a fresh perspective about the
language we commonly use, and to recognize the harmful effects of dominant
narratives in medicine." Several groups interested in equity and
diversity have published a Racial Equity Tools Glossary addressing label controversies,
noting that "whether to use the terms African American or Black,
Hispanic American, Latinx or Latino, Native American or American Indian, and
Pacific Islander or Asian American depends on a variety of conditions,
including your intended audiences' geographic location, age, generation and,
sometimes, political orientation." Labels gain particular significance in a time of the elevated
importance of group identity in social and political spheres -- with each
group seeking to emphasize its own collective identity and to express its
special grievances. The focus on the words currently used to describe racial
and ethnic groups is also reflective of efforts to correct the long
historical record of the use of demeaning racial and ethnic labels. Could Become Political Football As is true with many issues today, the "Latinx" controversy
has potential political implications. The use of the term could become a
factor in coming elections if Republicans attempting to increase their
showing among Hispanic voters try to make the label a symbolic indicator of
liberal, progressive overreach. Along these lines, the Bendixen & Amandi
poll found that 30% of Hispanic voters would be less likely to support a
politician or political organization that used the term "Latinx,"
while 15% said they would be more likely; about half said it would make no
difference. The Pew data showed
that Democratic Hispanic Americans are somewhat more familiar than
Republican Hispanic Americans with the term "Latinx" and are
slightly more likely to use it, although use among both groups is very low. Final Note There is a certain irony in the fact that pollsters must use a group
label to define groups in their surveys in order to ask that group about the
term they want to be used to define themselves. Gallup, like other pollsters,
closely follows the wording used by the U.S. Census and asks respondents,
"Are you of Hispanic, Latino or Spanish origin -- such as Mexican,
Puerto Rican, Cuban or other Spanish origin?" The Census Bureau's race and ethnicity labels adhere to those
developed by the U.S. Office of Management and Budget (OMB). These in
turn "generally reflect a social definition of race and ethnicity
recognized in this country, and they do not conform to any biological,
anthropological or genetic criteria." The Census Bureau in conjunction
with the OMB reports that
"since the 1970s, the Census Bureau has conducted content tests to
research and improve the design and function of different questions,
including questions on race and ethnicity." Thus, it is possible that
the OMB and the Census Bureau might change their questions asking about
Hispanic identity in the future, and that presumably includes the possibility
of adding a new term such as "Latinx." At this time, however, there appears to be little indication -- from
the people's perspective -- that "Latinx" is a term in wide use or
one with wide understanding, and thus its use as an additional label for
Hispanic or Spanish ethnicity doesn't appear to have much empirical
underpinning. (Gallup) JANUARY 7, 2022 MULTICOUNTRY
STUDIES
724-43-14/Polls 77% Of The World's Population, On Average, Consider That 2021 Has
Been A Bad Year For Their Country; A Survey In 33 Countries
A few days after saying goodbye to 2021, a year marked, once again,
by the fight against Covid-19, the balance of citizens over the last 12
months is negative in most countries. This is confirmed by the data from
the latest survey conducted from the Ipsos Global Advisor online
platform . On average,
three-quarters of the world's population (77%) say that 2021 has been a bad
year for their country. In Spain, the feeling that 2021 has been bad is shared by 89% of the
population, and it is, together with Romania, the most pessimistic European
country, followed by Belgium (85%) and the United Kingdom (84%). The
numbers improve when you wonder what 2021 was like for yourself and your
family, but they remain dramatic. Six out of ten people in Spain declare
that 2021 has been a bad year on a personal and family level, a percentage
only surpassed on the European continent by Romania, with 68%, and Hungary,
with 64%. Figures that exceed the world average, which stands at 58% of
people surveyed, who say that the year that is ending has been bad for
themselves and their families. Despite everything, global
citizens are optimistic about the arrival of the new year and hope that 2022
will be better. This is stated by 77% of the world
population, on average, and 72% of the Spanish population. Covid-19 and inflation, big concerns for
next year Given the appearance of new variants of the coronavirus that have
triggered the world alert on several occasions throughout this 2021, the last
one, just a few weeks ago; Health authorities insist on the need to
guarantee a better distribution of vaccines against Covid-19 to avoid
dangerous mutations. From an economic point of view, the world population expects that the
upward trend in prices in recent months will also continue in 2022. On
average, three quarters of the world population
(75%) think that prices will increase in their country at faster than revenue
next year. For its part, 77% of the Spanish population shares
this feeling. Likewise, globally, the expectations of stability of the
stock markets in 2022 are higher than in 2021, with 35%, on average, compared
to 40% that saw the main stock markets in the world likely to collapse in
2021. In Spain , the percentage is three points above the global average,
with 38%. Climate change and natural disasters are
two global threats that we will have to face in 2022 Climate change has been another of the issues that has generated the
most agitation in 2021, especially in the framework of the COP26 conference,
in which world leaders debated this issue. The survey reveals that, on average, 60% of the world's population see more extreme
weather events likely to occur in their country in 2022 than in 2021. In
Spain, a country that started the year with a historic snowfall in its
capital, the percentage stands at 61%. In its neighboring countries, the
figures rise to 72% in the Netherlands, 69% in Great Britain and 66% in
Belgium. (Ipsos Spain) 3 January 2022 724-43-15/Polls A Majority Of Consumers In The United States (54%) And Great Britain (67%)
Are Not Yet Willing To Pay More To Access 5G Technology
5G technology offers multiple benefits for users but how
many consumers are ready to bear the added costs for high-speed internet
and better connectivity? A new analysis from YouGov reveals that a majority of
consumers in the United States and Great Britain are
not yet willing to pay more to access 5G technology (54%
and 67% respectively). The data shows that while a higher share
of American consumers indicate that they are prepared to
pay more for 5G (24%), only 14% of Brits say the same.
Notably, a sizable proportion of consumers from both markets haven’t
made up their mind, with 19% in Britain and 22% in the US still on the fence
about paying more for 5G. Almost seven in ten Brits – and half of Americans – are not
willing to pay more. This is seen among GB consumers across all age
groups, and the share of those 55+ who are not willing to pay more is
slightly more than three-quarters (76%), making this group a hard nut to
crack for 5G marketers. Perhaps unsurprisingly, younger GB consumers are more likely
to be prepared to pay more for 5G while the share of older
Brits who say the same is significantly lower. There’s almost a 20-point
difference between 18-24-year-olds (25%) and those aged 55 and
above (5%).
The data also reveals that British men
are significantly more likely to be ready to pay more than women
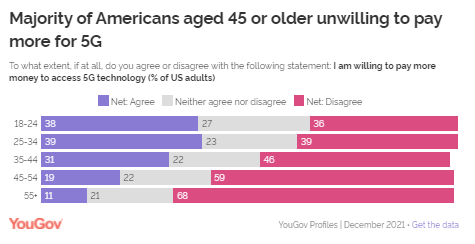
(17% vs. 10%). While we see a similar age skew in the US, with younger consumers
more likely to be ready to pay more compared to the older
generation, the share of Americans who agree is higher than the Brits across
all age groups. However, there is still a considerable difference
between those aged between 18-24 and 55+ (38% vs. 11%).
One of the reasons why a large share of consumers in
both markets are not willing to pay more for 5G could perhaps be
because almost half of the British population (49%) say
that they don’t understand what the big deal about 5G
is. This share is only slightly lower among American
consumers (41%). A significant proportion of consumers in both the
US and GB are still undecided as a little over a third of the
consumers say they neither agree nor disagree with the statement (34% and 33%
respectively). This opinion is seemingly driven by confusion and apathy, as almost
half of the population in both the US and GB agree that 5G
advertising is not very informative and the other half is on the
fence. This perhaps indicates that network/carriers and OEMs
need to do a better job educating the public on 5G consumer benefits. (YouGov UK) January 05, 2022 724-43-16/Polls Globally, Automobile Manufacturers Are The Most Likely To Be
Considered A Good Fit For Sports Sponsorships, YouGov Study Conducted Across
17 Markets
In an age of increased digitisation, sports sponsorship is one of the
few offline mediums that offer brands an opportunity to reach out to
consumers en masse. It explains why brands are willing to pay millions of
dollars per year in a bid to establish a relationship with the fan bases of
sports clubs, events, and organisations. But brands from certain industries might be better placed than others
to capitalise on the platform of sports sponsorships, according to a new
YouGov study conducted across 17 markets worldwide. Globally, automobile manufacturers are the most likely to be
considered a good fit for sports sponsorships. Over a third of consumers
(36%) think automakers are appropriate sponsors of professional sports clubs,
leagues or athletes. Tech (34%) and telecommunication (34%) brands follow
closely behind. Three in five consumers also consider banks and insurance
brands (31%) and tourism (31%) companies as appropriate sponsors for sports
properties.
Pharma brands don’t score too well in comparison, with only one in
six (17%) consumers globally saying they make for appropriate sports
sponsors. Remarkably, despite the gambling industry’s close and long-standing
links with sports business, only 12% of consumers say they are “appropriate
sponsors of professional sports clubs, leagues or athletes”. Cryptocurrencies
have signed a number of noteworthy sports sponsorships lately, but only one
in ten consumers think they make for appropriate partners (10%). We have
previously looked at whether
sports sponsorships help cryptocurrencies acquire legitimacy. Sentiments around how appropriate it is for certain industries to
engage in sports sponsorships can be quite diverse across various markets.
For instance, only 28% of consumers in Singapore think automakers make for
appropriate sports sponsors. That number shoots up to 48% of Indonesians
(online representative sample). Brits and Germans are among the least likely to feel cryptocurrencies
are appropriate as sports sponsors (6%), whereas Americans (11%) are far more
accepting. Urban Indians top the list, however, with more than one in five of
them (22%) saying cryptocurrencies “make for appropriate sponsors of
professional sports clubs, leagues or athletes”. A fifth of consumers in France (20%) and urban Mexico (20%) think it
appropriate for gambling brands to engage in sports sponsorships. Consumers
in Britain (7%), Italy (7%) and Singapore (7%) sit at the other end of the
spectrum. The ability of brands to cash in on sports sponsorships is determined
by myriad factors. And a brand from an industry with a low level of approval
for sports sponsorships might still be able to launch effective partnerships
in the sports industry. But these consumer views are a factor that marketers
can keep in mind when developing their plans to engage with sport – or with
sponsors. (YouGov UK) January 05, 2022 724-43-17/Polls Younger Gens In Britain, U S Likelier To Believe That Meatless Diets
Are Healthier
According to a YouGov Profiles survey, a third of Americans (32%) and
just over a quarter of Brits (27%) believe that ‘a meatless diet is the
healthier option’. This sentiment is the most prominent among the younger
generations in both markets. In Britain, a third of the members of Gen Z (34%) and Millennials
(32%) believe that meatless diets are better for health. The level of
agreement declines with each passing generation, with only a fifth of Baby
Boomers (22%) saying meatless diets are healthier. The scale follows a similar trajectory in the US, but with the
exception that millennials, as opposed to members of Gen Z, are the likeliest
to hold meatless diets as being a healthier option. Two in five of those born
between 1982 and 1999 say meatless diets are healthier (39%). Overall,
members in each generational bracket in the US are likelier than their
British counterparts to believe that meatless diets are healthier. How has this belief changed eating habits? In markets, those who say meatless diets are healthier are
significantly likelier than the general population to be vegetarian or vegan.
In Britain, the group of people who hold meatless diets as being healthier
are thrice as likely as the average population to be vegetarian (15% vs 5%),
although they are only about as likely to be vegan (7% vs 6%). In the US, those who feel meatless diets are healthier are
significantly likelier to be vegan than the general American (6% vs 2%).
Almost a tenth of them (9%) describe themselves as vegetarian compared to
only one in 25 of all Americans (4%). In both markets, the more popular choice among the group of people
who believe meatless diets are healthier is to be flexitarian. Flexitarians
are those who eat a mostly vegetarian diet with meat included occasionally.
In Britain, one-fifth of those who feel meatless diets are healthier consider
themselves flexitarian compared to just one-tenth of the overall population
(20% vs 10%). This gap is less pronounced in the US (21% vs 14% of the
overall population). (YouGov UK) January 05, 2022 724-43-18/Polls Overall, Among Consumers In 17 Markets Music Apps Such As Spotify Are
The Most Popular Way To Discover New Tunes (36%)
Traditional ways of discovering the latest music – hearing
something on the radio, getting a recommendation from a friend or catching an
earworm from a movie – remain important. But video games, commercials, and
social media are crucial in capturing the attention of the world’s young
consumers. Overall, among consumers in 17 markets in which YouGov conducted
research, music apps such as Spotify are the most popular way to
discover new tunes (36%) as more consumers migrate to streaming
apps. Our data also shows that radio isn’t dead. A third of global
consumers still find recent music on terrestrial or satellite radio (33%);
however this group is more likely to be over 35 years old. Social media is also a powerful platform for artists, as 32% of
consumers say that is where they find new music. Consumers 18-24 (50%) and
25-34 (43%) are especially likely to find artists they like on platforms such
as TikTok, Instagram and Facebook. Friends and family play an important role in new music discovery
among consumers around the world (27%) and among all age groups,
though particularly among the younger 18-24 demographic (35%). Movie and television soundtracks are also crucial for new music
releases. Much like personal recommendations, roughly a quarter of consumers
say they’ve added to their music catalogue thanks for films or shows, and
again young adults 18-24 are overrepresented (34%). While commercials (13%), websites (13%) and video games (9%)
appear lower on our list, it’s important to note that consumers between the
ages of 18 and 34 are significantly more likely to find new music through
these channels. One in five consumers worldwide between 18-24 has found music
via a video game, which is a testament to the importance of soundtracks and
scores in video games. As noted by YouGov in 2021, roughly a quarter of gamers in the United States
discover new music through video games (24%). Looking at YouGov research across regions, interesting findings
emerge. In the US, radio remains king (33%), ahead of music apps (25%) and
personal recommendations from friends or family (25%). Similar results come
out of Europe, where radio reigns supreme (40%), ahead of apps (33%) and
recommendations (25%). In Asia, however, social media (45%) and music apps (45%) are the
most popular avenues for finding fresh tunes. In Mexico, social media
platforms and music apps also play an outsized role in new music discovery,
just as they do in the United Arab Emirates. (YouGov UK) January 05, 2022 724-43-19/Polls Six Out Of 10 Adults From 28 Countries Expect That Products And
Services Using Artificial Intelligence Will Profoundly Change Their Daily
Life In The Next Three To Five Years
A new Ipsos survey for the World Economic Forum finds that, on average, six out
of 10 adults from 28 countries expect that products and services using
artificial intelligence will profoundly change their daily life in the next
three to five years. Half of them feel it has already been the case in the
past few years. Six in ten also agree that products and services using AI make their
life easier, but only half say they have more benefits than drawbacks and
four in ten adults admit that AI-powered products and services make them
nervous. Just half say they trust companies that use AI as much as they trust
other companies. At a global level, majorities of people expect AI will make things
better for them and their family with education and learning, entertainment,
transportation, their home, shopping, safety, the environment, and food and
nutrition. However, people across the world are evenly divided on the
benefits of AI when it comes to their income, personal and family
relationships, and employment (47%). Those who expect AI will improve their
situation when it comes to the cost of living and to freedom and legal rights
are a minority in most countries. The survey highlights a clear divide between high-income and emerging
countries in attitudes toward AI. Citizens from emerging countries are
significantly more likely than those from more economically developed
countries to report being knowledgeable about AI, to trust companies that use
AI, and to have a positive outlook on the impact of AI-powered products and
services in their life. These are some of the findings of a survey of 19,504 adults under the
age of 75 conducted on Ipsos’ Global Advisor
online platform between November 19 and December 3, 2021. Detailed findings Familiarity with AI On average for all 28 countries surveyed, almost two-thirds (64%)
claim they have a good understanding of what AI is, but only half (50%) know
which types of products and services use AI
Trust in companies using AI Only half (50%) trust companies that use AI as much as they trust
other companies. Trust in companies that use AI is highly correlated with
familiarity.
How much impact on daily life? Six in ten (60%) expect that products and services using AI will
profoundly change their daily life in the next 3-5 years and half (49%) say
it has already been the case in the past 3-5 years. Areas people expect AI
will change most for them and their family in the coming years are, in order:
education and learning (cited by 35%), safety (33%), employment (32%),
shopping (31%), and transportation (30%). Demographic and geographic
differences on how much products and services using AI are perceived to
change daily life mirror those for familiarity with AI and trust in companies
that use AI.
Does AI improve daily life? Six in ten (60%) say products and services using AI make their life
easier, but only half (52%) say they have more benefits than drawbacks and
four in ten (39%) say these products and services make them nervous. Again,
demographic and geographic differences on appreciation of products and
services using AI match those about familiarity, trust, and perceptions of
AI’s impact on daily life:
Areas where people most expect AI to make things better for them and
their family consist of: education and learning (AI expected to make it
better by 77%), entertainment (77%), transportation (74%), the home (73%),
shopping (70%), and safety (69%). Six in ten also expect AI to make things
better for the environment (62%) and for food and nutrition (61%). However,
the global public is evenly divided on the benefits of AI on income (better
for 53%), personal and family relationships (50%), and employment (47%). Only
four in ten expect AI will improve their situation when it comes to the cost
of living (42%) and freedom and legal rights (37%).
(Ipsos Canada) 5 January 2022 Source: https://www.ipsos.com/en-ca/news-polls/global-opinions-about-ai-january-2022 724-43-20/Polls A YouGov Survey Across 17 Markets Reveals That Gaming Influencers Are
The Most Popular Influencer Category Among Men Aged 18-34
A YouGov survey across 17 markets, which forms the basis of a
three-part gaming whitepaper, reveals that gaming influencers are the most
popular influencer category among men aged 18-34. Overall, gaming influencers are followed by just one in 11 consumers
globally (9%), making it only the 11th most popular category of influencers
followed. The list is led by categories such as food (16%), health (12%) and
celebrity (12%). But gaming influencers rise to the top spot among men, with around
one in eight males saying they follow this kind of social star. That compares
to just one in five women, for whom gaming is the least popular category when
it comes to social followings. It is among men aged 18-34, specifically, where gaming influencers
really sparkle - they are followed by a quarter of all members of that
demographic (23%) to surpass categories like sports (20%) and music (20%). The tendency to draw a significantly higher level of following
persists across each of the 17 markets, as you can see in the chart below. In
fact, in certain markets like Italy, Denmark, Germany and Spain, men aged
18-34 are four times as likely to follow gaming influencers than the overall
population. Overall, though, it is in Asian markets that gaming influencers have
a stronghold. A fifth of all consumers in both China (20%) and Indonesia
(20%) follow gaming influencers. India (17%), Hong Kong (14%) and UAE (13%)
are next on the list. Hong Kong (42%) takes the top spot when it comes to the
highest levels of gaming influencer penetration among men aged 18-34.
On which platforms do gaming influencers
reach their followers? Seven out of nine gaming influencer fans (77%) follow influencers on
YouTube, which takes the first spot by a comfortable lead. Instagram is the
second-most popular channel, with three in five gaming influencer followers
(60%) using the smartphone-centric platform to keep abreast of influencers.
Facebook claims third place (51%). Amazon-owned Twitch, which is a platform devoted to video game live
streaming, is almost three times more likely to be used by gaming influencer
followers (23%), compared to followers of influencers in general. And not
surprisingly, gaming influencer fans are twice as likely to use Discord
(13%), the group-chat app built for gamers.
The whitepaper explores the profile of followers and the
marketability of gaming influencers in more elaborate detail. (YouGov UK) January 06, 2022 Source: https://yougov.co.uk/topics/technology/articles-reports/2022/01/06/reach-gaming-influencers-globally 724-43-21/Polls Consumer Perceptions On Product Durability Across Different
Industries, A Study In 17 Economies
A new YouGov study conducted across 17 markets – ranging from the US
to the UK to China – explores whether consumers feel brands within specific
industries are doing enough to ensure the longevity of their products. Overall, packaged foods and beverages wins the biggest vote of
confidence, with almost three in five consumers (57%) saying brands within
that industry are doing a fair bit or their best to ensure their products
last. Half of the consumers globally also say that automobile manufacturers
are putting enough effort to ensure their products are long-lasting (50%).
Home appliances (46%) and sports equipment (44%) follow closely behind. The industries with the most negative sentiment when it comes to
durability are cell phones (40%), clothes and accessories (40%), and other
consumer electronics (41%). These results are significant against the backdrop of wider issues
and movements related to the durability of these product categories. When it
comes to electronics, there are growing concerns around planned obsolesce and
movements such as ‘right to repair’ are gaining steam in response. There has
also been increased awareness around the perils of fast fashion in recent
years, while the recent COP 26 conference has shed more light on the
environmental impact of consumption. There is a stark difference in how consumers from developed markets
and emerging markets feel about brand efforts, with the former group far less
likely to think that industries are doing enough to support the durability of
their products.
For instance, only 29% of consumers in developed markets think that
brands are ‘doing a fair bit’ or ‘doing their best’ to ensure cell phones are
durable. That figure rockets up to 61% among consumers in emerging markets. That is the case across sectors, which could indicate that industries
in emerging markets are, indeed, producing products to last with respect to
their value. However, it could also be a case of how consumers in each type
of market view the subject. Either way, it’s an insight that marketers might
find particularly useful. (YouGov UK) January 06, 2022 |
||||||||||||||||||