|
BUSINESS & POLITICS IN THE WORLD GLOBAL OPINION REPORT NO. 730 Week:
February 14 –February 20, 2022 Presentation:
February 25, 2022 Young
Consumers Are Likely To Drive Streaming Growth In India In
India, Head Coverings Are Worn By Most Women, Including Roughly Six-In-Ten
Hindus Nearly
Half Of Singaporeans (48.3%) Say They Will Reduce Their Spending Following
The GST Hike Half
(48%) Of The Individuals Think That The Omicron Variant Is As Dangerous As
The Other Variants Young
Adults Likely To Drive Paid Subscriptions For Audio & Video Services In
The UAE Three
In Four Have A Negative View Of Politics In Britain Today Three
In 10 (31%) Britons Support The Increase In National Insurance While 28%
Oppose It 43%
Of Britons Believe That Nuclear War Is One Of The Most Likely Causes Of Human
Extinction Half
Of Britons Say Boris Johnson Has Done A Bad Job As Prime Minister – Up 13
Points From Last Year Almost
Three Out Of Four Germans Fear The Effects Of A Russian Attack On Germany Americans’
Trust In Scientists, Other Groups Declines Nearly
A Quarter Of Americans Get News From Podcasts COVID-19
Pandemic Continues To Reshape Work In America INTRODUCTORY NOTE
730-43-23/Commentary:
In
India, Head Coverings Are Worn By Most Women, Including Roughly Six-In-Ten
Hindus
In recent
weeks, protests in India over Muslim
headscarves in schools have gained international attention.
The controversy began when a high school in the Southern state of Karnataka
banned hijabs in classrooms, and demonstrations have since spread to other
states. The Karnataka High Court has been deliberating
the legality of the school ban and is due to
issue a verdict soon.
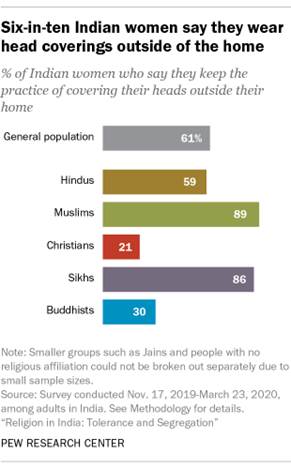
Head
coverings are relatively common among Indian women. About six-in-ten women in
India (61%) say they keep the practice of covering their heads outside of
their homes, according to a Pew
Research Center survey conducted in 2019-2020. That
includes a majority of Hindu women
(59%), and roughly equal shares of Muslim (89%) and Sikh women (86%) –
although the exact type
of head covering can vary significantly among and
within religious groups. India’s
adult population is 81% Hindu and 13% Muslim, according to the latest census
conducted in 2011. Christians, Sikhs, Buddhists and Jains account for most of
the remaining 6%. The Center’s survey only included adults ages 18 and older
and does not show what share of school-aged
girls wear head coverings. There are
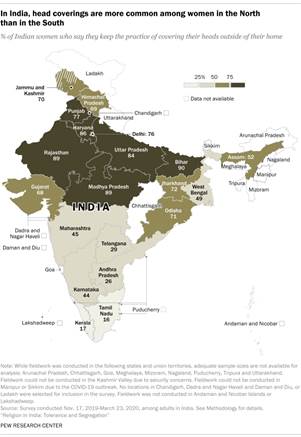
regional differences among Indian women when it comes to head coverings. The
practice is especially common in the largely Hindi-speaking regions in the
Northern, Central and Eastern parts of the country. In the states of Bihar,
Madhya Pradesh and Rajasthan, roughly nine-in-ten women say they wear head
coverings in public. In stark contrast, fewer women in the South say they
cover their heads in public, including just 16% in the state of Tamil Nadu.
These
regional differences are largely driven by Hindu women, as Muslim women tend
to keep the practice of covering their heads in public regardless of what
region they live in. This leads to large differences between Muslims and
Hindus in the South in particular. In the
South, 83% of Muslim women say they cover their heads, compared with 22% of
Hindu women. In the Northern region, meanwhile, roughly equal shares of
Muslim (85%) and Hindu (82%) women say they cover their heads in public. Within the
South, the state of Karnataka stands out for its relatively high share of
women who wear head coverings. More than four-in-ten women in Karnataka (44%)
say they wear one, compared with 26% in neighboring Andhra Pradesh, 29% in
Telangana and even fewer in the states of Kerala (17%) and Tamil Nadu (16%). A majority
of Muslim women in Karnataka say they cover their heads (71%), compared with
42% of Hindu women who say this.
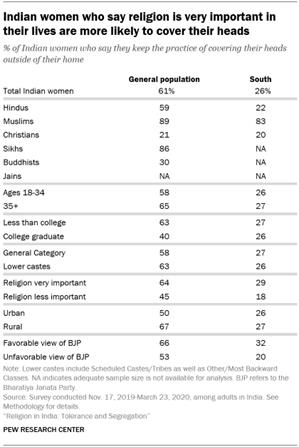
Nationally,
head coverings tend to be more common among women who are older, married,
more religious and who have less formal educational attainment. The practice
is also more prevalent in rural areas. But in the
South, age, education and other demographic differences are less of a factor
in whether or not women cover their heads. Religion, however, does make a
difference: Muslim women and women who are more devout are likelier to cover
their heads in public. Among women in the South who say religion is very
important in their lives, 29% say they cover their heads in public, compared
with 18% who say religion is less important in their lives. Headscarf
wearing also varies by political affiliation. Even though some proponents of
the hijab ban have been described as supporters
of the ruling Bharatiya Janata Party (BJP),
women with favorable attitudes toward India’s ruling party are actually more inclined to wear head
coverings in public than women who do not favor the governing party. This is
true nationally, and in the South. Among Indians overall, 66% of women who
have a positive view of the ruling BJP party say they cover their heads
outside their home, compared with 53% among those who view the party
unfavorably. This correlation may – at least in part – be tied to the fact
that BJP supporters tend to be more religious. (PEW) FEBRUARY 17,
2022 730-43-24/Country Profile:
SUMMARY
OF POLLS
ASIA (India) Young Consumers Are Likely To Drive Streaming Growth In
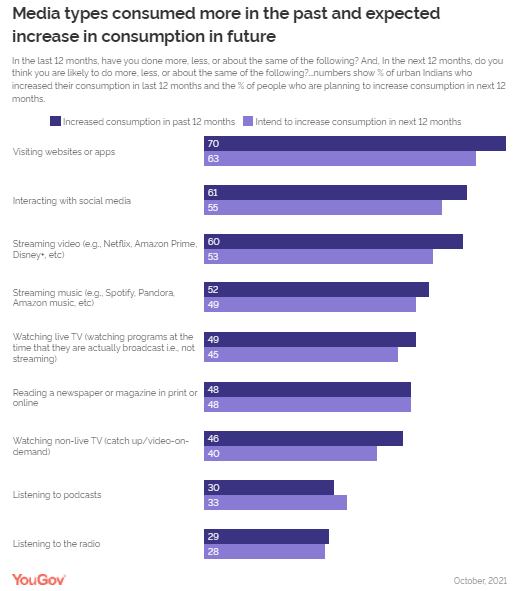
India Data from the whitepaper shows that digital
mediums have been the dominant media choices of urban Indians in the past 12
months, and they are likely to dominate their choices in the future as
well. Among projected increases in digital media sources are websites
& apps (63% are likely to increase their consumption), social media
(55%), streaming video (53%) and streaming music (49%). (YouGov India) February 15, 2022 In India, Head Coverings Are Worn By Most Women, Including
Roughly Six-In-Ten Hindus India’s adult population is 81% Hindu and
13% Muslim, according to the latest census conducted in 2011. Christians,
Sikhs, Buddhists and Jains account for most of the remaining 6%. The Center’s
survey only included adults ages 18 and older and does not show what share
of school-aged girls wear
head coverings. (PEW) FEBRUARY 17, 2022 (Singapore) Nearly Half Of Singaporeans (48.3%) Say They Will Reduce
Their Spending Following The GST Hike Latest research from YouGov RealTime Omnibus shows that, as of February 2022,
nearly half of Singaporeans (48.3%) say they will reduce their spending
following the GST hike. By contrast, a third of the public say they will
maintain their current spending (32.5%), while just one in twenty say they
will increase it (5.3%). Additionally, one in seven Singaporeans (14.1%) are
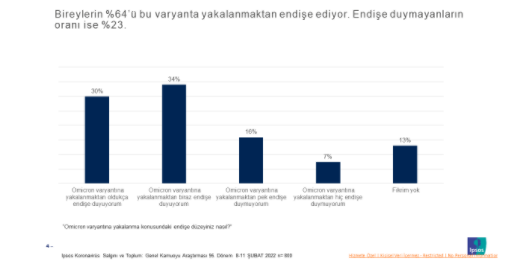
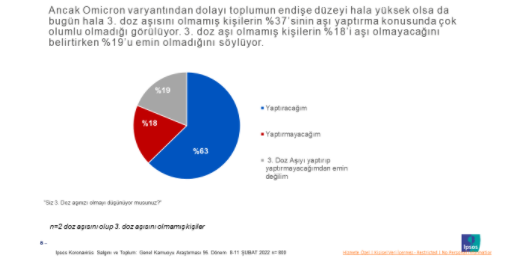
undecided on whether they will be making changes to their spending. (YouGov Singapore) February 16, 2022 (Turkey) Half (48%) Of The Individuals Think That The Omicron
Variant Is As Dangerous As The Other Variants Half of the individuals think that the
Omicron variant is as dangerous as the other variants. However, the
percentage of those who think that this variant is not as dangerous as other
variants despite the fact that it is transmitted very quickly. 36% of the
population thinks this variant is not dangerous. 64% of the population is
worried about contracting this variant. The rate of those who stated that
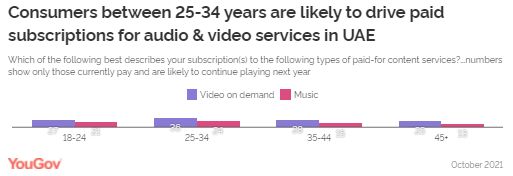
they are not worried about getting this variant is 23%. (Ipsos Turkey) 14 February 2022 MENA (UAE) Young Adults Likely To Drive Paid Subscriptions For Audio
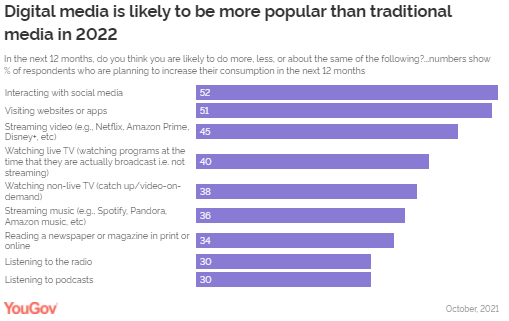
& Video Services In The UAE Data from YouGov’s “Global
Media Outlook Report 2022” shows
that digital media is likely to pervade in 2022 in the UAE, but young
consumers will drive subscription growth. Among projected increases within
digital media are social media (52% to increase their consumption), websites
& apps (51%), and streaming video (45%). Although video streaming beats
traditional media like Live (40%) and non-live TV (38%), music streaming
(36%) and podcasts (30%) have not quite reached the same penetration levels
and stay below these media types. (YouGov MENA) WEST
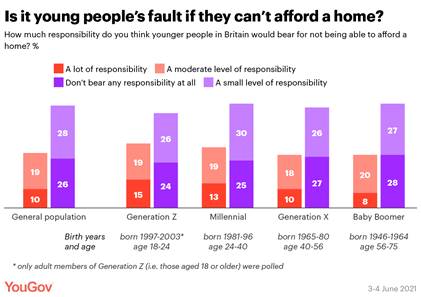
EUROPE (UK) Few Britons (10%) Consider Younger People To Bear A Lot Of
Responsibility For Not Being Able To Afford A Home A YouGov study conducted in the summer last
year looked at attitudes towards several intergenerational issues, including
whether young or old are to blame for high house prices and low home
ownership. Few Britons (10%) consider younger people to bear a lot of
responsibility for not being able to afford a home. One in five (19%)
consider younger generations to bear a moderate level of responsibility, but
most say they bear little (28%) to no responsibility (26%) if they find
themselves unable to buy a house. (YouGov UK) February 14, 2022 Three In Four Have A Negative View Of Politics In Britain
Today The public has painted a bleak view of
their attitudes towards politics. In the days following further revelations
about Number 10’s alleged social activities during a period of legal
lockdowns, three in four (73%) say they have a negative view of politics in
Britain today. While majorities of both major voting blocs see politics in a
poor light, those who voted Labour (83%) are more likely to have this opinion
than their Tory peers (61%). (YouGov UK) February 15, 2022 Three In 10 (31%) Britons Support The Increase In National
Insurance While 28% Oppose It New research by Ipsos in the UK shows
Britons are still divided in terms of their support for the increase in
National Insurance payments planned by the Government. Most Britons say they
knew at least something about the intended National Insurance rise, although
only 4 in 10 rated their knowledge as at least fair. One in 10 (10%) say they
knew a great deal while 3 in 10 either knew a fair amount (31%) or not very
much (also 31%) and a further 12% had heard of it but knew nothing about
it. (Ipsos MORI) 16 February 2022 In Her Platinum Jubilee Year, Queen Elizabeth Reigns
Supreme As Britain’s Favourite Royal Followed By The Duke And Duchess Of
Cambridge New research by Ipsos shows, in her
Platinum Jubilee year, Queen Elizabeth II is the nation’s favourite member of
the Royal family. Just under half (45%) of Britons say the Queen is one of
their most liked Royals, followed by 34% who choose Catherine, the Duchess of
Cambridge (an increase of 7 percentage points since March 2021), and 31% who
name her husband, Prince William, the Duke of Cambridge. The research
was carried out last week, before the most recent announcements. (Ipsos MORI) 16 February 2022 43% Of Britons Believe That Nuclear War Is One Of The Most
Likely Causes Of Human Extinction Britons are less sure than they were that
humanity is here to stay. The number of those who believe human beings will
never die out has dropped by seven points since 2016 to 23%. Part of this
shift reflects greater uncertainty (up six points since 2016, now at 27%),
but Britons are also slightly more likely to give a shorter time span for
human extinction than they were in 2016. The number of those who believe
it’ll happen in the next 500 years has risen by five points to 15%. (YouGov UK) February 16, 2022 Half Of Britons Say Boris Johnson Has Done A Bad Job As
Prime Minister – Up 13 Points From Last Year New polling from Ipsos UK, conducted online
between 9-10 February 2022, shows that half (54%) of Britons think Boris
Johnson has done a bad job as Prime Minister to date, whilst just three in
ten (29%) say he has done a good job. Mr Johnson’s ratings have fallen from
when the public were more divided in February 2021 (when 37% said good job
vs. 41% bad job). (Ipsos MORI) 17 February 2022 (Germany) Almost Three Out Of Four Germans Fear The Effects Of A
Russian Attack On Germany The majority of German voters are convinced
that a Russian military attack on Ukraine would also affect other countries:
77 percent believe that a Russian attack would affect the European
Union. 74 percent also fear the effects of an attack on
Germany. Only around every tenth respondent does not expect any effects
on the EU (10 percent) or on Germany (13 percent). On the other hand,
one in three still fears personal repercussions: 34 percent of those surveyed
believe that a Russian attack on Ukraine would affect them personally. (YouGov Germany) February 18, 2022 NORTH AMERICA (USA) A Majority Of Black Adults In The U S (53%) Say It Is Very
Difficult (18%) Or Somewhat Difficult (35%) To Find A Doctor Who Shares Their
Racial Or Ethnic Background Unlike their White and Hispanic
counterparts, a majority of Black adults in the U.S. (53%) say it is very
difficult (18%) or somewhat difficult (35%) to find a doctor who shares their
racial or ethnic background in the area where they live. In contrast,
majorities of White and Hispanic adults say it is easy to find a medical
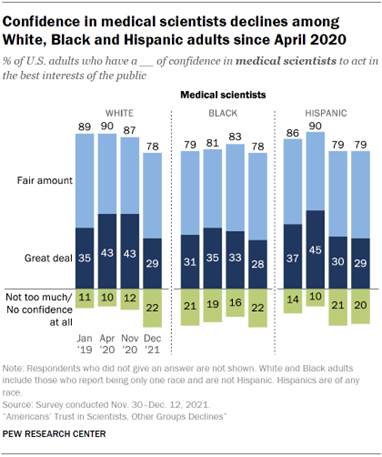
provider who shares their background. (Gallup) FEBRUARY 14, 2022 Americans’ Trust In Scientists, Other Groups Declines Overall, 29% of U.S. adults say they have a
great deal of confidence in medical scientists to act in the best interests
of the public, down from 40% who said this in November 2020. Similarly, the
share with a great deal of confidence in scientists to act in the public’s
best interests is down by 10 percentage points (from 39% to 29%), according
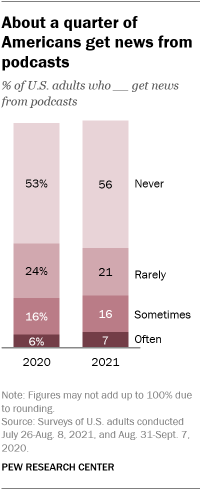
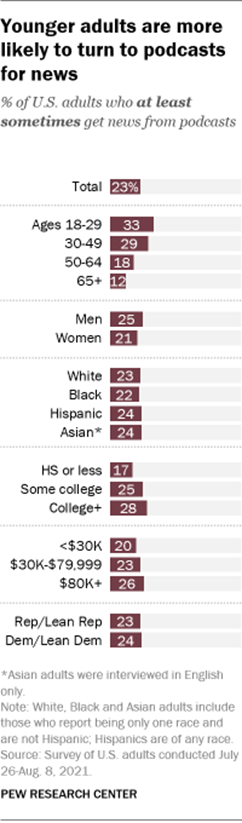
to a new Pew Research Center survey. (PEW) Nearly A Quarter Of Americans Get News From Podcasts The controversy around Spotify and its podcaster Joe Rogan has drawn new attention to the medium
at a time when podcasting has grown to become yet another platform that
Americans turn to for news. About a quarter of U.S. adults (23%) say they get
news at least sometimes from podcasts, according to a Pew Research Center
survey conducted in July 2021. The share of Americans who say they often get news from a podcast is
quite small – at just 7% – compared with about twice as many adults (16%) who
say they sometimes get
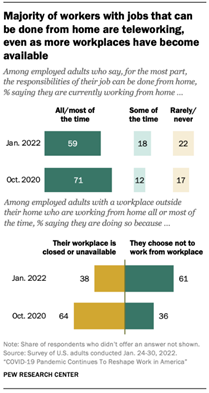
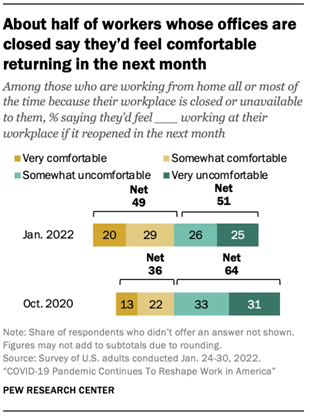
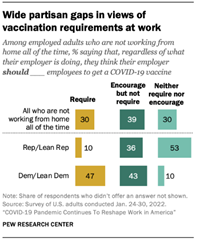
news from podcasts. (PEW) FEBRUARY 15, 2022 COVID-19 Pandemic Continues To Reshape Work In America Nearly two years into the COVID-19 pandemic, roughly six-in-ten U.S. workers who say
their jobs can mainly be done from home (59%) are working from home all or
most of the time. The vast majority of these workers (83%) say they were
working from home even before the omicron variant started to spread in the United
States, according to a new Pew Research Center survey. This marks a decline
from October 2020, when 71% of those with jobs that could be
done from home were working from home all or most of the time, but it’s still
much higher than the 23% who say they teleworked frequently before the
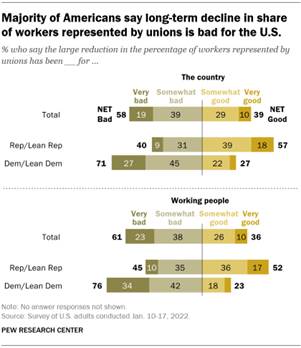
coronavirus outbreak. (PEW) FEBRUARY 16, 2022 58% Of U S Adults Say The Large Reduction Over The Past
Several Decades In The Percentage Of Workers Who Are Represented By Unions
Has Been Bad For The Country In the survey, 58% of U.S. adults say the
large reduction over the past several decades in the percentage of workers
who are represented by unions has been somewhat or very bad for the country,
while 61% say this has been bad for working people. The share of U.S. workers
who belong to a union has fallen since 1983, when 20% of American workers were union members. In 2021 10.3% of U.S. workers were in a union. (PEW) FEBRUARY 18, 2022 Nearly Seven In 10 Black Adults (69%) And Hispanic Adults
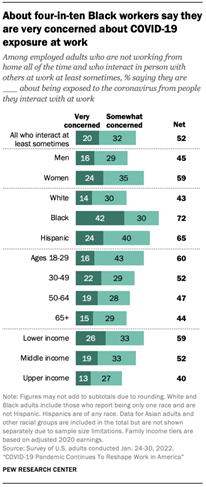
(68%) Are Very Or Somewhat Stressed About Contracting COVID-19 As the world faces the third year of the
coronavirus pandemic, Black and Hispanic Americans are significantly more
worried than White Americans about getting infected with COVID-19. Nearly
seven in 10 Black adults (69%) and Hispanic adults (68%) are very or somewhat
stressed about contracting COVID-19, compared with 57% of White adults,
according to a survey by West Health and Gallup. (Gallup) FEBRUARY 18, 2022 AUSTRALIA ABS Unemployment Figure Of 4.2% Hides Real Toll Of The
‘Omicron Strain’ On Australia’s Employment Markets The ABS estimate for January counts as
employed an additional 214,400 Australians who were working zero
hours for ‘economic reasons’ or ‘other reasons’ – such as being forced into isolation
for being a close contact of a confirmed case. In addition, the ABS notes 449,900 workers worked zero hours
due to illness, injury or sick leave in January. This figure is nearly five times higher
than the average for January from 2016-2021 of 92,880 – a difference of
357,020. (Roy Morgan) February 17 2022 MULTICOUNTRY STUDIES 50% People Across 26 Countries Support The Introduction Of
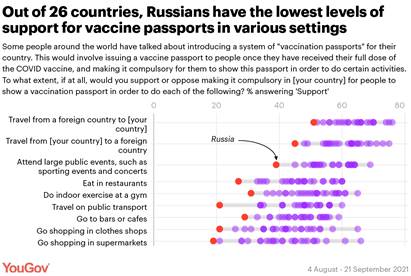
Vaccine Passports For Doing Indoor Exercise At A Gym Out of 26 countries surveyed for the
project, Australia had the highest average support for vaccine passports
across nine scenarios where vaccine passports might be required. Australian
support for making it compulsory to show a vaccination certificate ranged
from half (50%) who would support vaccine passports for clothes shops to 75%
who support vaccine passports for travelling to or from Australia. Australia
is only just about to open up its borders to fully vaccinated travellers after
implementing strict travel restrictions for two years of Covid-19, including
at the time of this survey. (YouGov UK) February 17, 2022 Ipsos’ Global Consumer Confidence Index This Month Reads At
48.7, Unchanged From Last Month; Survey Conducted In 24 Countries Ipsos’ Global Consumer Confidence Index
this month reads at 48.7, unchanged from last month and exactly as it read in
January 2020 before the Covid-19 pandemic. Only two of the countries show any
significant month-over-month change in their National Index score (at least
+/- 1.5 points): Russia (+1.5 since January) and Japan (-2.6). Globally, the
Jobs, Investment, and Expectations sub-indices trend similarly. All three are
showing little change from last month and remain at levels on par with their
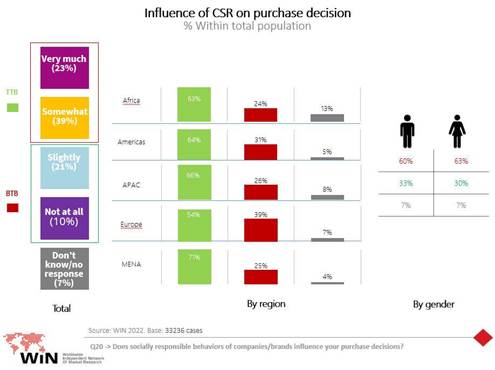
January 2020 readings. (Ipsos Australia) 18 February 2022 Source: https://www.ipsos.com/en-au/global-consumer-confidence-index-february-2022 Corporate Social Responsibility And The
Influence On Purchase Decisions; Views And Beliefs Of Citizens From 39
Countries Across The Globe WIN International, the world’s leading
association in market research and polling has published the Annual Win World
Survey (WWS – 2021) exploring the views and beliefs of 33236 individuals
among citizens from 39 countries across the globe about Corporate Social Responsibility, what do
people know about this concept, its importance and influence on their daily
purchases. The awareness about Corporative Social Responsibility among
interviewed people was equally distributed between positive and negative
answers: while 48% already heard about
the concept, 42% of the group did not; 10% didn’t answer the
question or didn’t know. (WIN) Source: https://winmr.com/corporate-social-responsibility-and-the-influence-on-purchase-decisions%ef%bf%bc/ ASIA
730-43-01/Polls Young Consumers
Are Likely To Drive Streaming Growth In India
Data from YouGov’s “Global Media Outlook Report 2022” shows urban Indian consumers expect
to spend more time with digital media in the future than any type of
traditional media. YouGov’s new report explores how
consumption of media has changed globally in the past 12 months and
identifies which media behaviours consumers are planning to stick with in the
future. Data from
the whitepaper shows that digital mediums have been the dominant media
choices of urban Indians in the past 12 months, and they are likely to
dominate their choices in the future as well. Among projected increases in digital media sources are
websites & apps (63% are likely to increase their consumption), social
media (55%), streaming video (53%) and streaming music (49%).
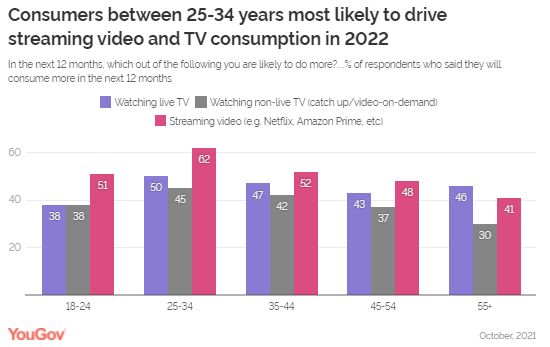
Consumption of streaming
video is likely to increase across age groups in India in the next 12 months,
with young consumers between 25- 34 years expecting a higher increase in
consumption (62%) as compared to those aged 35-44 (52%) or 55+ (41%). In comparison to this, intent
to increase consumption of both live and non-live TV is lower among this group-
at 50% and 45%, respectively, yet higher than the other age groups. This
shows that along with driving the demand for streaming services, younger
audiences in India will also dominate the demand for TV content in the
future.
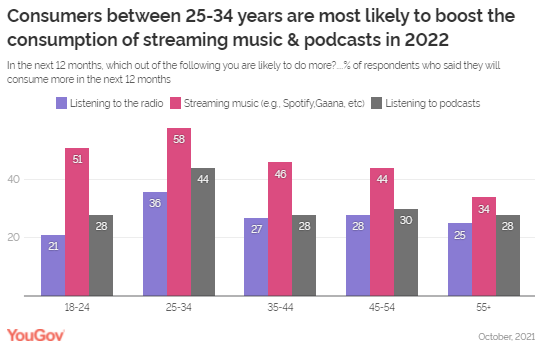
Similarly, within the audio industry,
younger generations are set to boost the consumption of streaming music, as
well as podcasts. About six in ten (58%) adults
between 25-34 years plan to stream more music in the next 12 months, which is
higher than the expectations of other age groups. Even though
future consumption of podcasts is projected lower than other mediums, its
consumption is likely to soar among young consumers (25-34 years) in the
country.
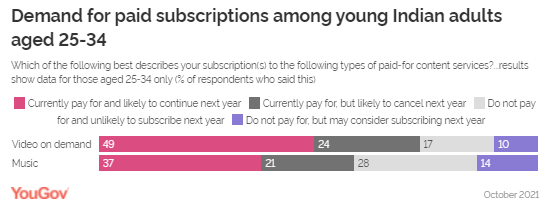
When it
comes to subscriptions, once
again we see the young population taking the lead. Across all age groups, demand
for VOD is the highest among consumers between 25-34 years, with almost half (49%) currently paying for, and likely
to continue with their subscriptions next year. In addition
to this, one in ten (10%)
respondents who do not currently pay, said
they might consider paying next year, representing a clear opportunity for
growth within this cohort. Having said
that, a
considerable proportion are either ‘Cancelers’ (24%)- who currently pay but
are likely to cancel next year, or ‘Rejectors’ (17%) - who do not currently
pay and are unlikely to subscribe next year. Making investment in
better content, more regional content options and as well as subscription
price adaptations might help the streaming platforms retain and grow
audiences. Similarly, in case of music
subscriptions, compared to all other age groups, a higher proportion of young
adults (between 25-34) currently pay for music subscriptions and are likely
to continue paying next year as well. There
is further room for growth as 14% who currently
do not have a paid subscription may consider signing up next year.
Jules Newby, Sector Head of Media at YouGov said, “Our report takes deep dives into the Watch,
Listen, Read and Social channels of media consumption. As consumer media
consumption patterns continue to evolve and adapt to the pandemic-caused
disruption across different regions, our data sheds light on growth
opportunities for media planners and brand marketers alike, whilst also
revealing which digital trends are likely to stick around in the future, and
which global markets and demographics are encouraging this stickiness. “When it comes to the ‘stickiness’ of
consumers’ media consumption behavior, our data suggests that a high
proportion of consumers are unlikely to change their media behavior
dramatically in the next 12 months. Looking at the growth drivers of media
consumption in the next 12 months, all are digital. Video streaming services
have further tightened their grip on viewers in the wake of the pandemic and
are likely to register the biggest growth in consumption in the coming year.” (YouGov India) February 15, 2022 Source: https://in.yougov.com/en-hi/news/2022/02/15/young-consumers-are-likely-drive-streaming-growth-/ 730-43-02/Polls In India,
Head Coverings Are Worn By Most Women, Including Roughly Six-In-Ten Hindus
In recent weeks, protests in India
over Muslim headscarves in schools have gained international attention.
The controversy began when a high school in the Southern state of Karnataka
banned hijabs in classrooms, and demonstrations have since spread to other
states. The Karnataka High Court has been deliberating the legality of the school ban and is due to issue
a verdict soon.
Head coverings are relatively common among
Indian women. About six-in-ten women in India (61%) say they keep the
practice of covering their heads outside of their homes, according to a Pew Research Center survey conducted in 2019-2020. That includes
a majority of Hindu women (59%), and roughly equal shares
of Muslim (89%) and Sikh women (86%) – although the exact type of head covering can vary significantly among and
within religious groups. India’s adult population is 81% Hindu and
13% Muslim, according to the latest census conducted in 2011. Christians,
Sikhs, Buddhists and Jains account for most of the remaining 6%. The Center’s
survey only included adults ages 18 and older and does not show what share
of school-aged girls wear
head coverings. There are regional differences among Indian
women when it comes to head coverings. The practice is especially common in
the largely Hindi-speaking regions in the Northern, Central and Eastern parts
of the country. In the states of Bihar, Madhya Pradesh and Rajasthan, roughly
nine-in-ten women say they wear head coverings in public. In stark contrast,
fewer women in the South say they cover their heads in public, including just
16% in the state of Tamil Nadu.
These regional differences are largely
driven by Hindu women, as Muslim women tend to keep the practice of covering
their heads in public regardless of what region they live in. This leads to
large differences between Muslims and Hindus in the South in particular. In the South, 83% of Muslim women say they
cover their heads, compared with 22% of Hindu women. In the Northern region,
meanwhile, roughly equal shares of Muslim (85%) and Hindu (82%) women say
they cover their heads in public. Within the South, the state of Karnataka
stands out for its relatively high share of women who wear head coverings.
More than four-in-ten women in Karnataka (44%) say they wear one, compared
with 26% in neighboring Andhra Pradesh, 29% in Telangana and even fewer in
the states of Kerala (17%) and Tamil Nadu (16%). A majority of Muslim women in Karnataka say
they cover their heads (71%), compared with 42% of Hindu women who say this.
Nationally, head coverings tend to be more
common among women who are older, married, more religious and who have less
formal educational attainment. The practice is also more prevalent in rural
areas. But in the South, age, education and other
demographic differences are less of a factor in whether or not women cover
their heads. Religion, however, does make a difference: Muslim women and
women who are more devout are likelier to cover their heads in public. Among
women in the South who say religion is very important in their lives, 29% say
they cover their heads in public, compared with 18% who say religion is less
important in their lives. Headscarf wearing also varies by political
affiliation. Even though some proponents of the hijab ban have been described
as supporters of the ruling Bharatiya Janata
Party (BJP),
women with favorable attitudes toward India’s ruling party are actually more inclined to wear head
coverings in public than women who do not favor the governing party. This is
true nationally, and in the South. Among Indians overall, 66% of women who
have a positive view of the ruling BJP party say they cover their heads
outside their home, compared with 53% among those who view the party
unfavorably. This correlation may – at least in part – be tied to the fact
that BJP supporters tend to be more religious. (PEW) FEBRUARY 17, 2022 730-43-03/Polls Nearly Half
Of Singaporeans (48.3%) Say They Will Reduce Their Spending Following The GST
Hike
With the Singapore government widely
expected to announce an increase in the country’s Goods and
Services Tax (GST) in its Budget 2022, we’ve asked consumers how they would
respond to a heavier tax burden? Do they plan to spend less – and if so, on
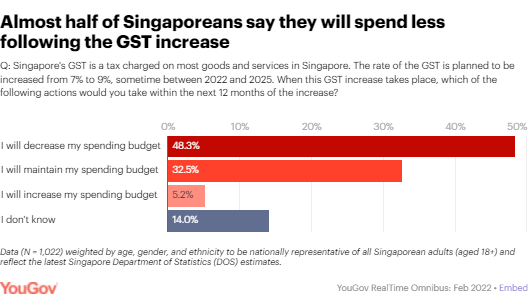
what? Latest research from YouGov RealTime Omnibus shows that, as of February 2022,
nearly half of Singaporeans (48.3%) say they will reduce their spending
following the GST hike. By contrast, a third of the public say they will
maintain their current spending (32.5%), while just one in twenty say they
will increase it (5.3%). Additionally, one in seven Singaporeans (14.1%) are
undecided on whether they will be making changes to their spending.
Where will Singaporeans most likely cut
back spending after the GST hike? Given that Singaporeans who plan to
maintain or decrease their spending budget after the GST increase will need
to make fewer or cheaper purchases in the future, we asked them about the
areas of spending they are likely to cut back on in the next 12 months of the
GST increase. Notably, almost half say that they would
spend less on dining and takeaway purchases from food and beverage outlets
(50.1%), clothing and apparel stores (48.7%) and food delivery orders
(48.3%). Over a third say they would cut back on
ride-hailing expenses (44.5%), purchases of IT gadgets (36.6%), and grooming
and wellness services – such as hairdressing, massages and spas (33.5%).
Around a quarter say they would reduce spending on home furniture (28.7%),
personal care products (28.4%), household electronics (27.6%), video game
titles and consoles (25.4%), and house renovation services (24.9%). Meanwhile, just under a quarter say they
would spend less on gym subscriptions and exercise equipment (24.1%),
automotive purchases and upgrades (24%), cable TV, internet video or audio
streaming services (23%), and sports gear and facility booking expenses
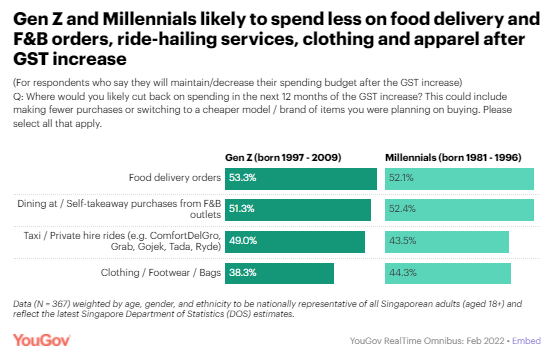
(22.9%). What purchases will most Gen Z and millennials
likely reduce after the GST hike? When sorted by generation, we found that
the top three areas of spending that Gen
Z (born 1997 – 2009) would cut back on are: food delivery
orders (53.3%), followed by dining and takeaway purchases at food and beverage
outlets (51.3%), and ride-hailing services – including taxis and private-hire
vehicles (49%). For Millennials
(born 1981 – 1996), the areas they are most likely to spend less
on are: dining and takeaway purchases at food and beverage outlets (52.4%),
food delivery orders (52.1%), and clothing and apparel (44.3%).
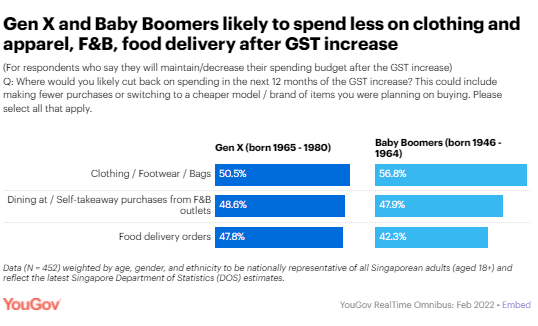
What purchases will most Gen X and Baby
Boomers likely reduce after the GST hike? In the case of Gen X (born 1965 – 1980) and Baby Boomers (born 1946 – 1964), we found
that the top three areas of spending both generations would cut back on are
the same: clothing and apparel (Gen X – 50.5%, BB – 56.8%), followed by
dining and takeaway purchases at food and beverage outlets (Gen X – 48.6%, BB
– 47.9%), and food delivery orders (Gen X – 47.8%, BB – 42.3%).
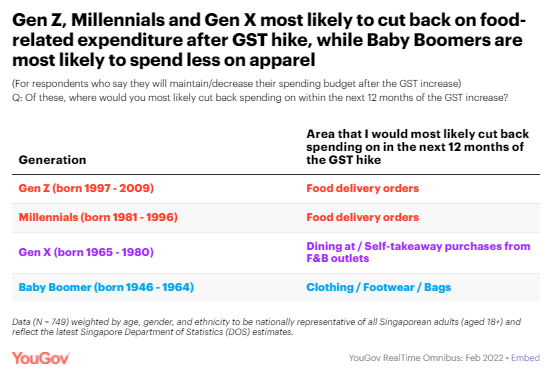
What one area would each generation most
likely spend less on after the GST hike? Finally, we asked each generation to pick
out – from among the areas of spending they would likely cut back on – the
one they were most likely to reduce within the next 12 months of the GST
increase. For both Gen Z and Millennials,
food delivery orders are the one area they would be most likely to spend less
on. Not too dissimilarly, for Gen X,
dining and takeaway purchases at food and beverage outlets is the top area
they would reduce purchases on. But for Baby Boomers, spending on clothing, footwear, bags and other
apparel are where they are most likely to cut back on.
(YouGov Singapore) February 16, 2022 Source: https://sg.yougov.com/en-sg/news/2022/02/16/GST-increase-consumer-spending-impact-survey-poll/ 730-43-04/Polls Half (48%)
Of The Individuals Think That The Omicron Variant Is As Dangerous As The
Other Variants
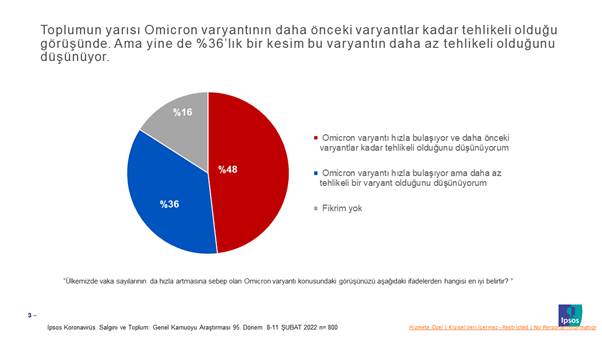
Proportion of Those Who Think Omicron
Variant Is As Dangerous As Other Variants 48% Half of the individuals think that the
Omicron variant is as dangerous as the other variants. However, the
percentage of those who think that this variant is not as dangerous as other
variants despite the fact that it is transmitted very quickly. 36% of the
population thinks this variant is not dangerous.
But Still, 6 out of 10 People Are Worried
About Getting This Variant 64% of the population is worried about
contracting this variant. The rate of those who stated that they are not
worried about getting this variant is 23%.
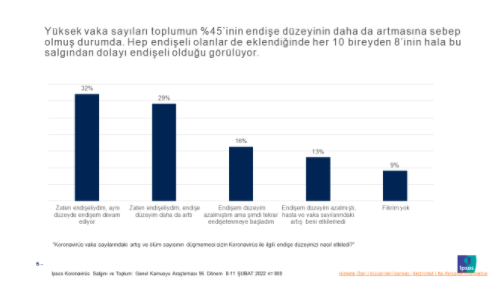
High Number of Coronavirus Cases Makes
Society Even More Worried The increase in the number of cases due to
the transmission rate of the Omicron variant causes an increase in the
anxiety levels of individuals. While 1/3 of the society says that they are
always worried about this epidemic, 45% of them say that the level of anxiety
has increased even more. In total, 8 out of 10 people seem to be worried
about this epidemic.
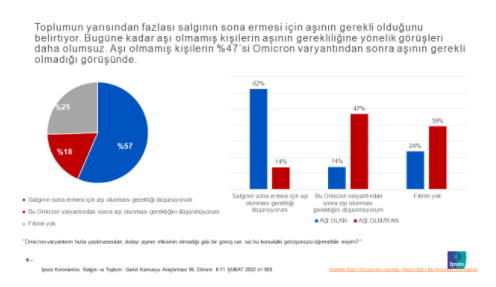
The Ratio of Those Who Think that
Vaccination is Necessary for the End of the Epidemic 57% Even though it is said that the effect of
the Omicron variant has decreased and the vaccine is not very effective due
to the rapid contagion effect, 57% of the society thinks that vaccination is
necessary to end the epidemic. Only 18% think that they do not need to be
vaccinated. However, the opinions of people who have not been vaccinated
about the necessity of being vaccinated are more negative as expected. While
62% of vaccinated people state that the vaccine is necessary, this rate is
only 14% among unvaccinated people.
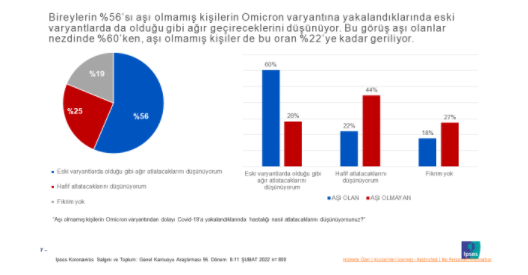
The Opinion that Unvaccinated Persons Will
Have the Disease Severely If They Are Caught Omicron Variant Is More Dominant 56% of individuals think that unvaccinated
people will have a hard time when they get the Omicron variant, as they do
with the old variants. While this opinion is 60% for those who are
vaccinated, this rate drops to 22% for those who have not been vaccinated.
But Still, 37% of 2 Vaccinated People Are
Cautious About Getting 3rd Vaccination Even if there is concern about contracting
the Omicron variant, 18% of people who have received 2 vaccines so far state
that they will not get the 3rd vaccine, and 19% say they are undecided about
whether or not to get vaccinated.
Sidar Gedik, CEO of Ipsos Turkey, made the
following evaluations about the data; The findings in the last period of our
Coronavirus Outbreak and Society research indicate that we have entered a new
phase. The epidemic is no longer in our focus as it used to be, the rate of
those who have no idea about the Omicron variant, the third dose of vaccine
is increasing. Among those with ideas, the level of concern about Omicron
lags behind the general fear of the epidemic. The rate of those who do not
have an opinion on the question of whether they are worried about catching
the virus is below 5% and the rate of those who are worried does not fall
below 80%. However, when we ask the question specifically for Omicron, the
rate of those who have no idea triples, and the rate of those who are worried
about being caught with the variant drops to 64%. In summary, when it comes
to Omicron, our focus has weakened and we have begun to worry less. Already
one in three people state that it is a less dangerous variant. There is a weakening and polarization in
the belief in a vaccine to end the epidemic. Even in the vaccinated
population, there is confusion about the necessity of still being vaccinated
after the Omicron variant. Four out of ten vaccinated people either have no
idea about the necessity of getting vaccinated after Omicron, or they think
that the vaccine is no longer needed. Half of those who have not been vaccinated
until now state that they no longer need the vaccine after Omicron. The
distribution of those who think that they will survive Omicron more easily or
severely is very similar to the rate of view of the vaccine. The rate of those who think that Omicron
will be as heavy as the old variants is only 60%. As a result of all this
"relaxation", the stability for the third dose has weakened in the
population who had been vaccinated for 2 doses. In this population, four out
of ten people state that they will have the third dose, while the rest will
either not or are not sure yet. (Ipsos Turkey) 14 February 2022 Source: https://www.ipsos.com/tr-tr/vaka-sayilarinin-yuksekligi-toplumu-daha-endiseli-yapiyor MENA
730-43-05/Polls Young Adults
Likely To Drive Paid Subscriptions For Audio & Video Services In The UAE
Data from YouGov’s “Global
Media Outlook Report 2022” shows
that digital media is likely to pervade in 2022 in the UAE, but young
consumers will drive subscription growth. The new report explores how consumption of
media has changed globally in the past 12 months and identifies which media
behaviors consumers are planning to stick with in the future. Among projected increases within digital
media are social media (52% to increase their consumption), websites &
apps (51%), and streaming video (45%). Although video streaming beats
traditional media like Live (40%) and non-live TV (38%), music streaming
(36%) and podcasts (30%) have not quite reached the same penetration levels
and stay below these media types.
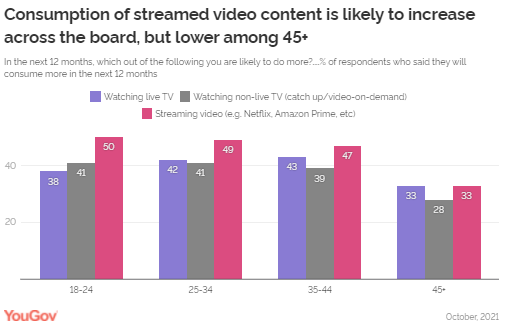
In the UAE, an increase in video streaming
consumption in the next 12 months is expected to persist at a steady level
across age groups, except for those aged 45+, where only a third (33%)
anticipate an increase in consumption. For live and non-live TV as well,
barring the older generation (aged 45+), the projected increase in
consumption is comparable across age groups.
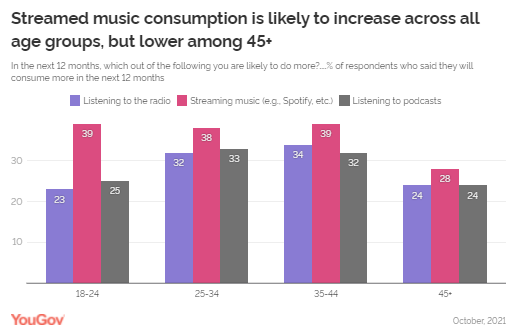
We see a similar trend within the audio
industry. Intent to increase consumption of music streaming in the next 12
months is similar across age groups, except 45+ year olds, where it is much
lower. However, when it comes to podcasts, the
anticipated increase is expected to be higher among consumers between ages 25
and 44, as compared to others. The same is true about radio consumption,
where comparatively a higher consumption is expected within this cohort.
Although streaming consumption is
comparable across most age groups, subscription is likely to be driven by
young consumers. Demand for VOD is the highest among consumers between 25-34
as compared to the other age groups, with over a third (36%) in this group
currently paying for, and likely to continue their subscriptions next year. Additionally, one in five (20%) who do not
currently pay, said they might consider paying next year, representing a
clear opportunity for growth within this cohort.
Similarly, music streaming is also more
dominant within this group as compared to others, with nearly a quarter
currently paying for music subscriptions and likely to continue next year
(24%). With just as many (22%) saying they currently do not pay but might
consider signing up next year, the potential for growth within is cohort is
considerable. Jules Newby, Sector Head of Media at YouGov
said, “Our report
takes deep dives into the Watch, Listen, Read and Social channels of media
consumption. As consumer media consumption patterns continue to evolve and
adapt to the pandemic-caused disruption across different regions, our data
sheds light on growth opportunities for media planners and brand marketers
alike, whilst also revealing which digital trends are likely to stick around
in the future, and which global markets and demographics are encouraging this
stickiness. When it comes to the ‘stickiness’ of
consumers’ media consumption behavior, our data suggests that a high
proportion of consumers are unlikely to change their media behavior
dramatically in the next 12 months. Looking at the growth drivers of media
consumption in the next 12 months, all are digital. Video streaming services
have further tightened their grip on viewers in the wake of the pandemic and
are likely to register the biggest growth in consumption in the coming year.” (YouGov MENA) Source: https://mena.yougov.com/en/news/2022/02/15/young-adults-likely-drive-paid-subscriptions-audio/ WEST
EUROPE
730-43-06/Polls Few Britons (10%) Consider Younger People To Bear A Lot Of
Responsibility For Not Being Able To Afford A Home
TV presenter Kirstie Allsopp managed to offend much of Britain’s
youth this week when giving her view on the struggles facing young people
getting on the housing ladder. Allsopp seemed
to suggest that young people should expect to have to stay with
their parents for years saving every penny, forgoing life comforts like
coffee and Netflix, and then move
across the country in order to afford a home. The comments were particularly galling for many in light of Allsopp’s
own housing history: her aristocratic parents financially assisted in the
purchase of her own first at age 21, at a time when housing was much more
affordable. Coverage of the article has rekindled the debate on whether older
people in Britain understand the struggles the young face, and to what extent
they are responsible for those struggles themselves. A YouGov study conducted in the summer last year looked at attitudes
towards several intergenerational issues, including whether young or old are
to blame for high house prices and low home ownership. Few Britons (10%) consider younger people to bear a lot of
responsibility for not being able to afford a home. One in five (19%)
consider younger generations to bear a moderate level of responsibility, but
most say they bear little (28%) to no responsibility (26%) if they find
themselves unable to buy a house. There is cross-generational consensus on this issue, with people from
all generations tending to say that young people bear little to no
responsibility.
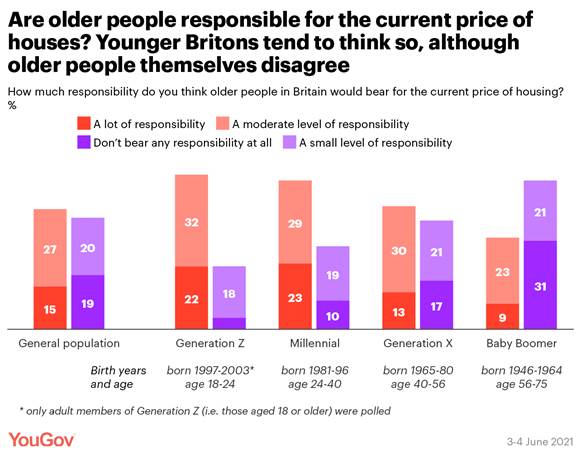
If young people aren’t to blame for house prices, are their elders
responsible? Here the generations are bitterly divided. A mere 4% of adult members of Generation Z (the generation born
1997-2012, with respondents being aged 18-24 at the time of the survey) say
that older Britons have no responsibility at all for rising house prices,
while 18% say they have only a small amount of responsibility. By contrast, half of Baby Boomers (those born 1946-1964, aged 56-75
at the time of the survey) say they have little or nothing to do with it,
including three in ten (31%) who absolve their generation of any
responsibility whatsoever.
On other issues facing young or old people, there is less
intergenerational conflict – although society itself is divided. For
instance, on the subject of whether young people are to blame for not being
able to get a secure job, 39% of Britons think they bear a lot or moderate
level of responsibility, while 45% think they bear a small amount or none at
all, with these figures generally consistent regardless of what age someone
is. Britons say older people are to blame if they’ve not saved up much of
a pension (58% vs 27%) or weren’t able to go to university when they were
young (60% vs 21%). By contrast, Britons think it is not older people’s failings that mean they can’t
afford social care. Most (55%) say they bear little to no responsibility,
compared to 24% who think they have a lot or moderate share of the
responsibility. Again, there is little difference on these opinions by age, with the
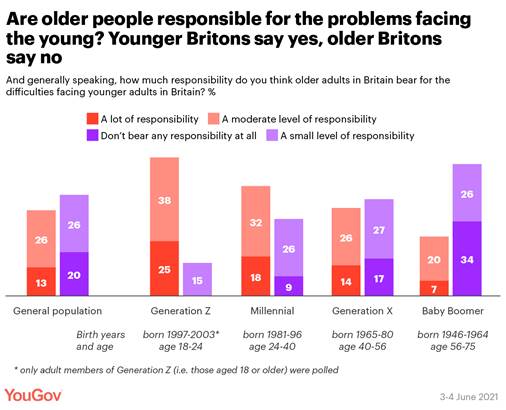
main variation being Gen Z having a much higher “don’t know” response rate. Are the old to blame for the challenges
facing the young in Britain? Taking a step back from specific issues to look at wider attitudes
shows that the generations are divided on whether or not the old are
responsible for the challenges the young face today. As with the housing
situation, younger generations tend to say the old are to blame, Gen Z saying
older people bear a lot/moderate amount of responsibility by 61% to 17% and
Millennials (those born 1981-1996, aged 24-40 at the time of the research) by
51% to 34%. Baby Boomers, by contrast, disagree, with only 27% giving the same
level of accountability as their younger peers. Some 60% say they bear little
to no responsibility for the travails of younger generations.
Younger Britons are not, however, generally seen as accountable for
the difficulties facing the elderly. Attitudes are basically the same across
all generations, with 22% of the general public saying that the young bear a
lot/moderate level of responsibility for the problems old people are
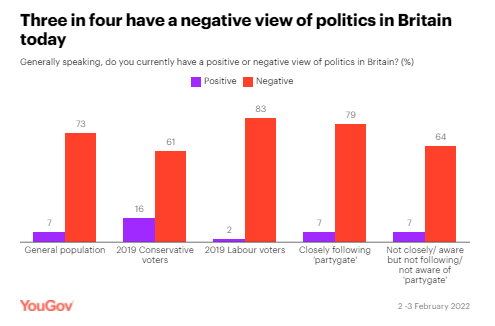
encountering, while 61% say they bear little to none. (YouGov UK) February 14, 2022 730-43-07/Polls Three In Four Have A Negative View Of Politics In Britain Today
The public has painted a bleak view of their attitudes towards
politics. In the days following further revelations about Number 10’s alleged
social activities during a period of legal lockdowns, three in four (73%) say
they have a negative view of politics in Britain today.
While majorities of both major voting blocs see politics in a poor
light, those who voted Labour (83%) are more likely to have this opinion than
their Tory peers (61%). Even a majority of those who aren’t necessarily
following ‘partygate’ feel negative about the state of politics (64%,
compared to 79% who are negative and following the story). A mere 7% say they currently hold a positive view of politics in
Britain. Approaching nine in ten lay responsibility for how politics operates
in Britain squarely with the prime minister (87%) or the government of the
day (89%) – a view that cuts across party lines. Slightly fewer think all
politicians should be held accountable (83%).
The civil service is not exonerated either, with two in three (65%)
thinking they have a “great deal” or “fair amount” of responsibility for the
political system too, with a majority of both Conservative (73%) and Labour
(60%) 2019 voters sharing this view. Overall, a fifth say they don’t have
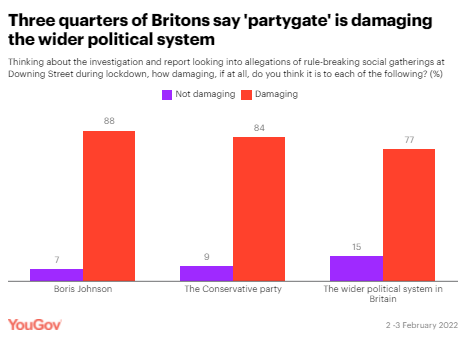
much or any responsibility (22%). ‘Partygate’ is damaging politics at all
levels This poor view of British politics seems unlikely to be a fleeting
annoyance, as by 77% to 15% the population say partygate is damaging to the
wider political system in Britain. Almost nine in ten think it is damaging to Boris Johnson directly
(88%), while 84% think it has harmed his party. Fewer than one in ten think
it has had little to no damage on the prime minister (7%) or the
Conservatives (9%). Three in five (60%) say they have been following the stories about
Downing Street gatherings, with those following most closely the more likely
to think it has been damaging to the wider political system (86%). However,
the perceived impact of the alleged gatherings continues to cut through even
amongst those who haven’t been following this story as closely – albeit to a
lesser extent (65%).
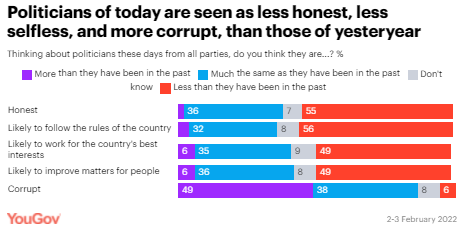
Today’s politicians are seen as worse than
their predecessors YouGov also asked the public how politicians from all parties fare
considering the basic obligations of being an elected representative when
compared to their predecessors. Overall, the population does not paint their current cohort of
electees in a positive light. Compared to those who have come before them, around half of Britons
think today’s politicians are less likely to work for the country’s best
interests (49%) and less likely to improve matters for people (49%). Crucially, given the recent scandals and ensuing fallout, half also
think politicians are less honest (49%) and are less likely follow to the
rules of the country (56%) now than they have been in the past. Across the measures we asked about, around a third of Britons think
current and former politicians are much the same as they have been in the
past (32-38%). Only a small number (2-6%) consider the current crop to be
better than those who came before them.
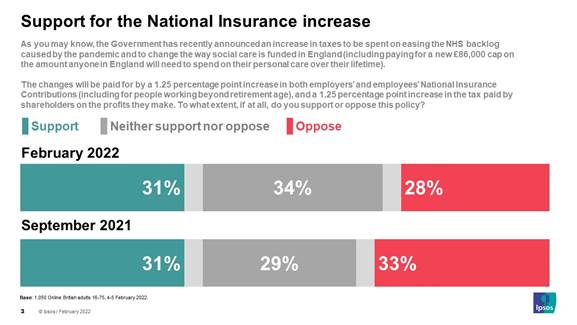
(YouGov UK) February 15, 2022 730-43-08/Polls Three In 10 (31%) Britons Support The Increase In National Insurance
While 28% Oppose It
New research by Ipsos in the UK shows Britons are still divided in
terms of their support for the increase in National Insurance payments
planned by the Government. This increase of 1.25 percentage points to both
employees’ and employers’ NI contributions would go towards easing the NHS
backlog and change the way social care is funded. Three in 10 (31%) Britons support the increase in National Insurance
while 28% oppose it. A similar proportion (31%) neither support nor oppose.
The group who are most opposed are 35-54 year olds, by 34% to 26%.
Conservative 2019 voters are slightly in favour, by 34% to 27%, while
Labour 2019 voters are marginally against by 34% to 30%.
There has been no change in support since September 2021 when 31%
also supported the tax rise, although there has been a small five-point fall
in those opposed (and a corresponding increase in those with a neutral
opinion). Most Britons say they knew at least something about the intended
National Insurance rise, although only 4 in 10 rated their knowledge as at
least fair. One in 10 (10%) say they knew a great deal while 3 in 10 either
knew a fair amount (31%) or not very much (also 31%) and a further 12% had
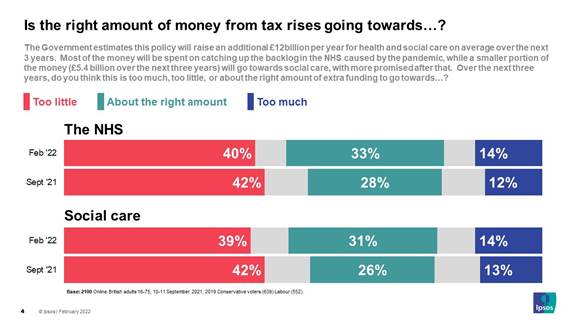
heard of it but knew nothing about it. Over the next 3 years, the Government expects the increase in taxes
to raise an additional £12bn per year for the NHS and social care.
However, around 4 in 10 think even this will be too little extra funding
for either the NHS (40%) or social care (39%), again little change from the
end of last year. Around a third expect it to be about the right amount (33%
and 31% respectively) while only 14% think it will be too much for either.
Half of 2019 Labour voters think it will not be enough for the NHS, compared
with 34% of Conservative voters, among whom more say it will be the right
amount (39%).
Trinh Tu, Managing Director of Public
Affairs at Ipsos in the UK, said: With the National Insurance rise due to
take effect in April, Britons are still split over whether it is the right or
the wrong decision. However, while we know there is much concern about
the cost of living, many people also feel that even this extra increase won’t
provide all the funding the NHS and our social care system needs. (Ipsos MORI) 16 February 2022 Source: https://www.ipsos.com/en-uk/british-opinion-still-split-support-national-insurance-rise 730-43-09/Polls In Her Platinum Jubilee Year, Queen Elizabeth Reigns Supreme As
Britain’s Favourite Royal Followed By The Duke And Duchess Of Cambridge
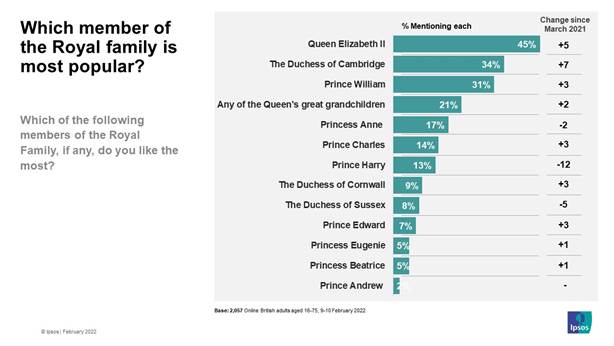
New research by Ipsos shows, in her Platinum Jubilee year, Queen
Elizabeth II is the nation’s favourite member of the Royal family. Just under
half (45%) of Britons say the Queen is one of their most liked Royals,
followed by 34% who choose Catherine, the Duchess of Cambridge (an increase
of 7 percentage points since March 2021), and 31% who name her husband,
Prince William, the Duke of Cambridge. The research was carried out
last week, before the most recent announcements.
The Duke’s father and brother score similarly, Prince Charles is
named a favourite by 14% of Britons while 13% name Prince Harry, who has seen
the largest fall in popularity, down 12 percentage points since last March.
Around 1 in 10 name the Duchess of Cornwall (9%) or the Duchess of Sussex
(8%) as one of their favourites. Around 1 in 5 name the Cambridge and Sussex
children as their favourites (21%). Two per cent choose Prince Andrew as
their favourite Royal, showing little change in recent years. Following the recent announcement, four in 10 Britons (38%) are in
favour of the Duchess of Cornwall becoming the Queen Consort if her husband,
Prince Charles, becomes King. This outweighs the 28% who say they are opposed
to this while a further 29% are neutral. Over half (54%) of those who are in favour of the Duchess becoming
Queen Consort say this comes as a result of her support of Prince Charles,
while a similar proportion put it down to the fact she would be married to
the King (48%). Just under half say they support Camilla becoming the Queen
Consort due to the support she has offered the Queen over the years (47%) or
because it is the Queen’s wish (45%). Four in 10 say they are in favour due
to her royal service (40%) or her charity work (39%). A quarter (26%) cite
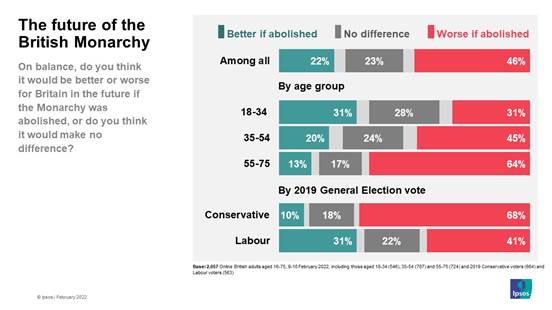
her personality and character. Almost half of Britons say abolishing the monarchy would be worse for
Britain in the future (46%) while only 22% say it would be an improvement.
Around a quarter (23%) say it would make no difference. The balance of
opinion shows little change from last year, though there are fewer with a
neutral opinion. Older Britons and those who voted for the Conservative
Party in 2019 are most likely to say abolishing the monarchy would be worse
for the country, 64% of 55-75-year olds and 68% of Conservative voters believe
this.
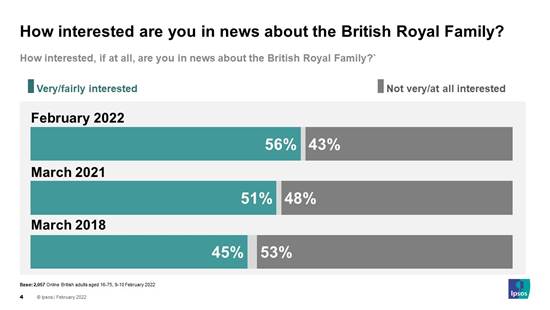
It may come as little surprise that people continue to be interested
in the British Royal Family. Almost 6 in 10 (56%) say they are interested in
hearing news about the Queen and her family while 4 in 10 (43%) say they are
not. Interest has increased slightly over the past few years. In March 2021
51% said they were interested, before that in 2018 45% said the same.
Gideon Skinner, Head of Political Research
at Ipsos in the UK, said: There is no denying that the Royal Family
has had a turbulent few years, but public opinion still contains more
supporters than critics of the institution. In the run up to the
Platinum Jubilee celebrations, Queen Elizabeth II remains the most popular
member of the Royal Family, with the Duke and Duchess of Cambridge also
cementing their position. (Ipsos MORI) 16 February 2022 730-43-10/Polls 43% Of Britons Believe That Nuclear War Is One Of The Most Likely
Causes Of Human Extinction
With the mortality rate of the pandemic, the
year of wildfires, accelerating
artificial intelligence technology (and fears), and Russia poised to invade
Ukraine, there is no shortage of threats to the world. However,
catastrophes are nothing new. Whether it’s economic, social, natural, or
cultural, there is always a conflict for humanity to struggle against:
Wikipedia’s List
of Disasters is a good summary. However, have recent events permanently changed British adults’ view
of the future of humanity? Are we predicting an earlier extinction as a
result? What do we think those likely reasons for extinctions are, and have
they changed after the pandemic? And what do we think our government should
be doing about them? New YouGov data explores the changes to our views on
human extinction since 2016. When will human beings go extinct? Perhaps
sooner than we first predicted Britons are less sure than they were that humanity is here to stay.
The number of those who believe human beings will never die out has dropped
by seven points since 2016 to 23%. Part of this shift reflects greater uncertainty (up six points since
2016, now at 27%), but Britons are also slightly more likely to give a
shorter time span for human extinction than they were in 2016. The number of
those who believe it’ll happen in the next 500 years has risen by five points
to 15%. There are significant political divides, with Conservative voters
much more likely than Labour voters to believe human beings will never die
out, by 31% to just 17%. On the other side, 20% of Labour voters believe
human extinction will happen in the next 500 years (as opposed to 10% of
Conservative voters). Ultimately, despite the recent pandemic, British adults still tend to
believe human extinction won’t happen for the next 1,000 years, if they think
it will happen at all (47%). If human beings become extinct, what do
Britons think would be the cause? When asked about where the potential extinction cause could come
from, British adults are still firmly afraid of the natural world and space:
51% say that the most likely cause of human extinction would be an
environmental cause, such as climate change or an asteroid. Political divides are also present in this question: only 44% of
Conservative voters think it would be more likely to be an environmental
cause, versus 63% of Labour voters. Three in ten Conservative voters (31%)
went the other way with a technological cause – like artificial intelligence
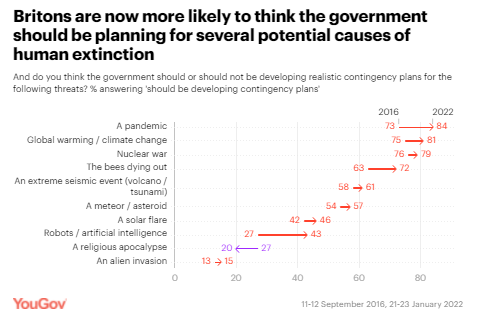
or nuclear weaponry – as opposed to only 22% of Labour voters. Despite the pandemic, nuclear war and
climate change are still seen as the most likely cause of future human
extinction When asked about the most likely specific cause of human extinction
in the future, nuclear war continues to hold the top spot (43%), closely
followed by global warming and climate change (42%). However, there has been significant movement on both of these
anticipated apocalypses since 2016: the percentage of people who picked
climate change has risen 11pts, while expectations of nuclear Armageddon also
increased by 5pts. Expectations that a pandemic will prove humanity’s eventual downfall
have moved much less, despite the coronavirus outbreak. Only slightly more
people chose this option in 2022 (30%) than in 2016 (27%) – a difference that
is within the margin of error. Most Britons think the government should be
developing contingency plans for at least six potential causes of human
extinction While Britons are divided on which the most likely doomsday scenarios
are, there is a much clearer picture of what people think is plausible based
on their support for contingency plans.
Topping the list is preparing contingency plans for a pandemic, at
84%. The impact of the coronavirus epidemic is much more noticeable in this
question, with an 11pt increase in support since 2016. In second place is a desire for contingency plans on climate change
and global warming, which has leapfrogged nuclear war with a six-point
increase to 81%. Although only 43% of Britons believe that nuclear war is one of the
most likely causes of human extinction, 79% say the government should be developing contingency
plans for such a conflict (a three-point increase). Over seven in ten British adults (72%) also believe that we should be
preparing for the bees dying out, despite only 16% believing that it is one
of the most likely causes of our hypothetical extinction. Majorities also
want to see contingency plans for extreme seismic events (61%) and asteroid
strikes (57%). The biggest single change since 2016 has been over threats emanating
from robots or artificial intelligence. While only a quarter of Britons (27%)
thought the government should be preparing for such dangers five and a half
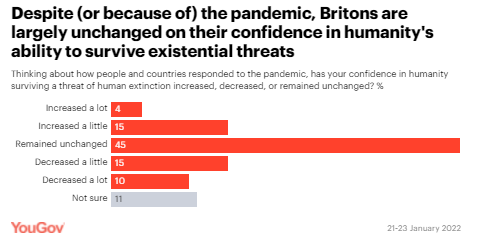
years ago, that has since jumped 16pts to 43% today. Has the pandemic improved or worsened our
view of humanity surviving existential threats? Despite – or perhaps, because of – the pandemic, almost half of
British adults say that their confidence in humanity surviving is
‘unchanged’.
However, one in five (19%) say that their confidence has increased,
potentially after watching the speed of the vaccination response or the quick
instating of measures in some countries. Slightly more (25%) have seen those
same events and come away gloomy, however, saying their confidence in
humanity’s odds have shortened. Ultimately, it may take much more than a
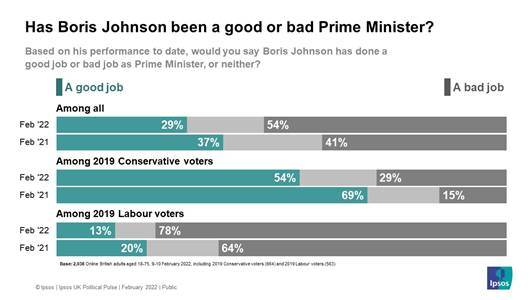
pandemic to help boost our confidence in humanity. (YouGov UK) February 16, 2022 730-43-11/Polls Half Of Britons Say Boris Johnson Has Done A Bad Job As Prime
Minister – Up 13 Points From Last Year
New polling from Ipsos UK, conducted online between 9-10 February
2022, shows that half (54%) of Britons think Boris Johnson has done a bad job
as Prime Minister to date, whilst just three in ten (29%) say he has done a
good job. Mr Johnson’s ratings have fallen from when the public were more
divided in February 2021 (when 37% said good job vs. 41% bad job). This decline in his ratings is also observed among 2019 Conservative
voters. Half (54%) still believe he has performed well as Prime Minister, but
this is down from seven in ten (69%) last February. Meanwhile, the proportion
saying he has done a bad job has nearly doubled (going from 15% to 29%).
More than half (56%) of the public support Conservative MPs
triggering a vote of no confidence in Boris Johnson’s leadership by
submitting letters to their party’s 1922 Committee. Only one in four (24%)
oppose this. These numbers are practically unchanged from earlier this month
(57% support, 22% oppose). Conservative voters from 2019 also remain split
with two in five (43%) opposing a vote of no confidence, against another
two-fifths (39%) supporting one. However, Britons are uncertain whether Conservative MPs will actually
trigger a vote of no confidence. Two in five (41%) think it is likely (+5
since the start of February), whilst a third (34%) think it is unlikely (-5). Keiran Pedley, Director of Politics at
Ipsos UK, says of the findings: The data continues to show Boris Johnson’s
personal poll ratings weakening, with a majority of Britons now saying he has
done a bad job as Prime Minister and a majority supporting the concept of Conservative
MPs triggering a vote of no-confidence in his leadership. What happens next
will likely be decided by events, as police investigations draw to a close
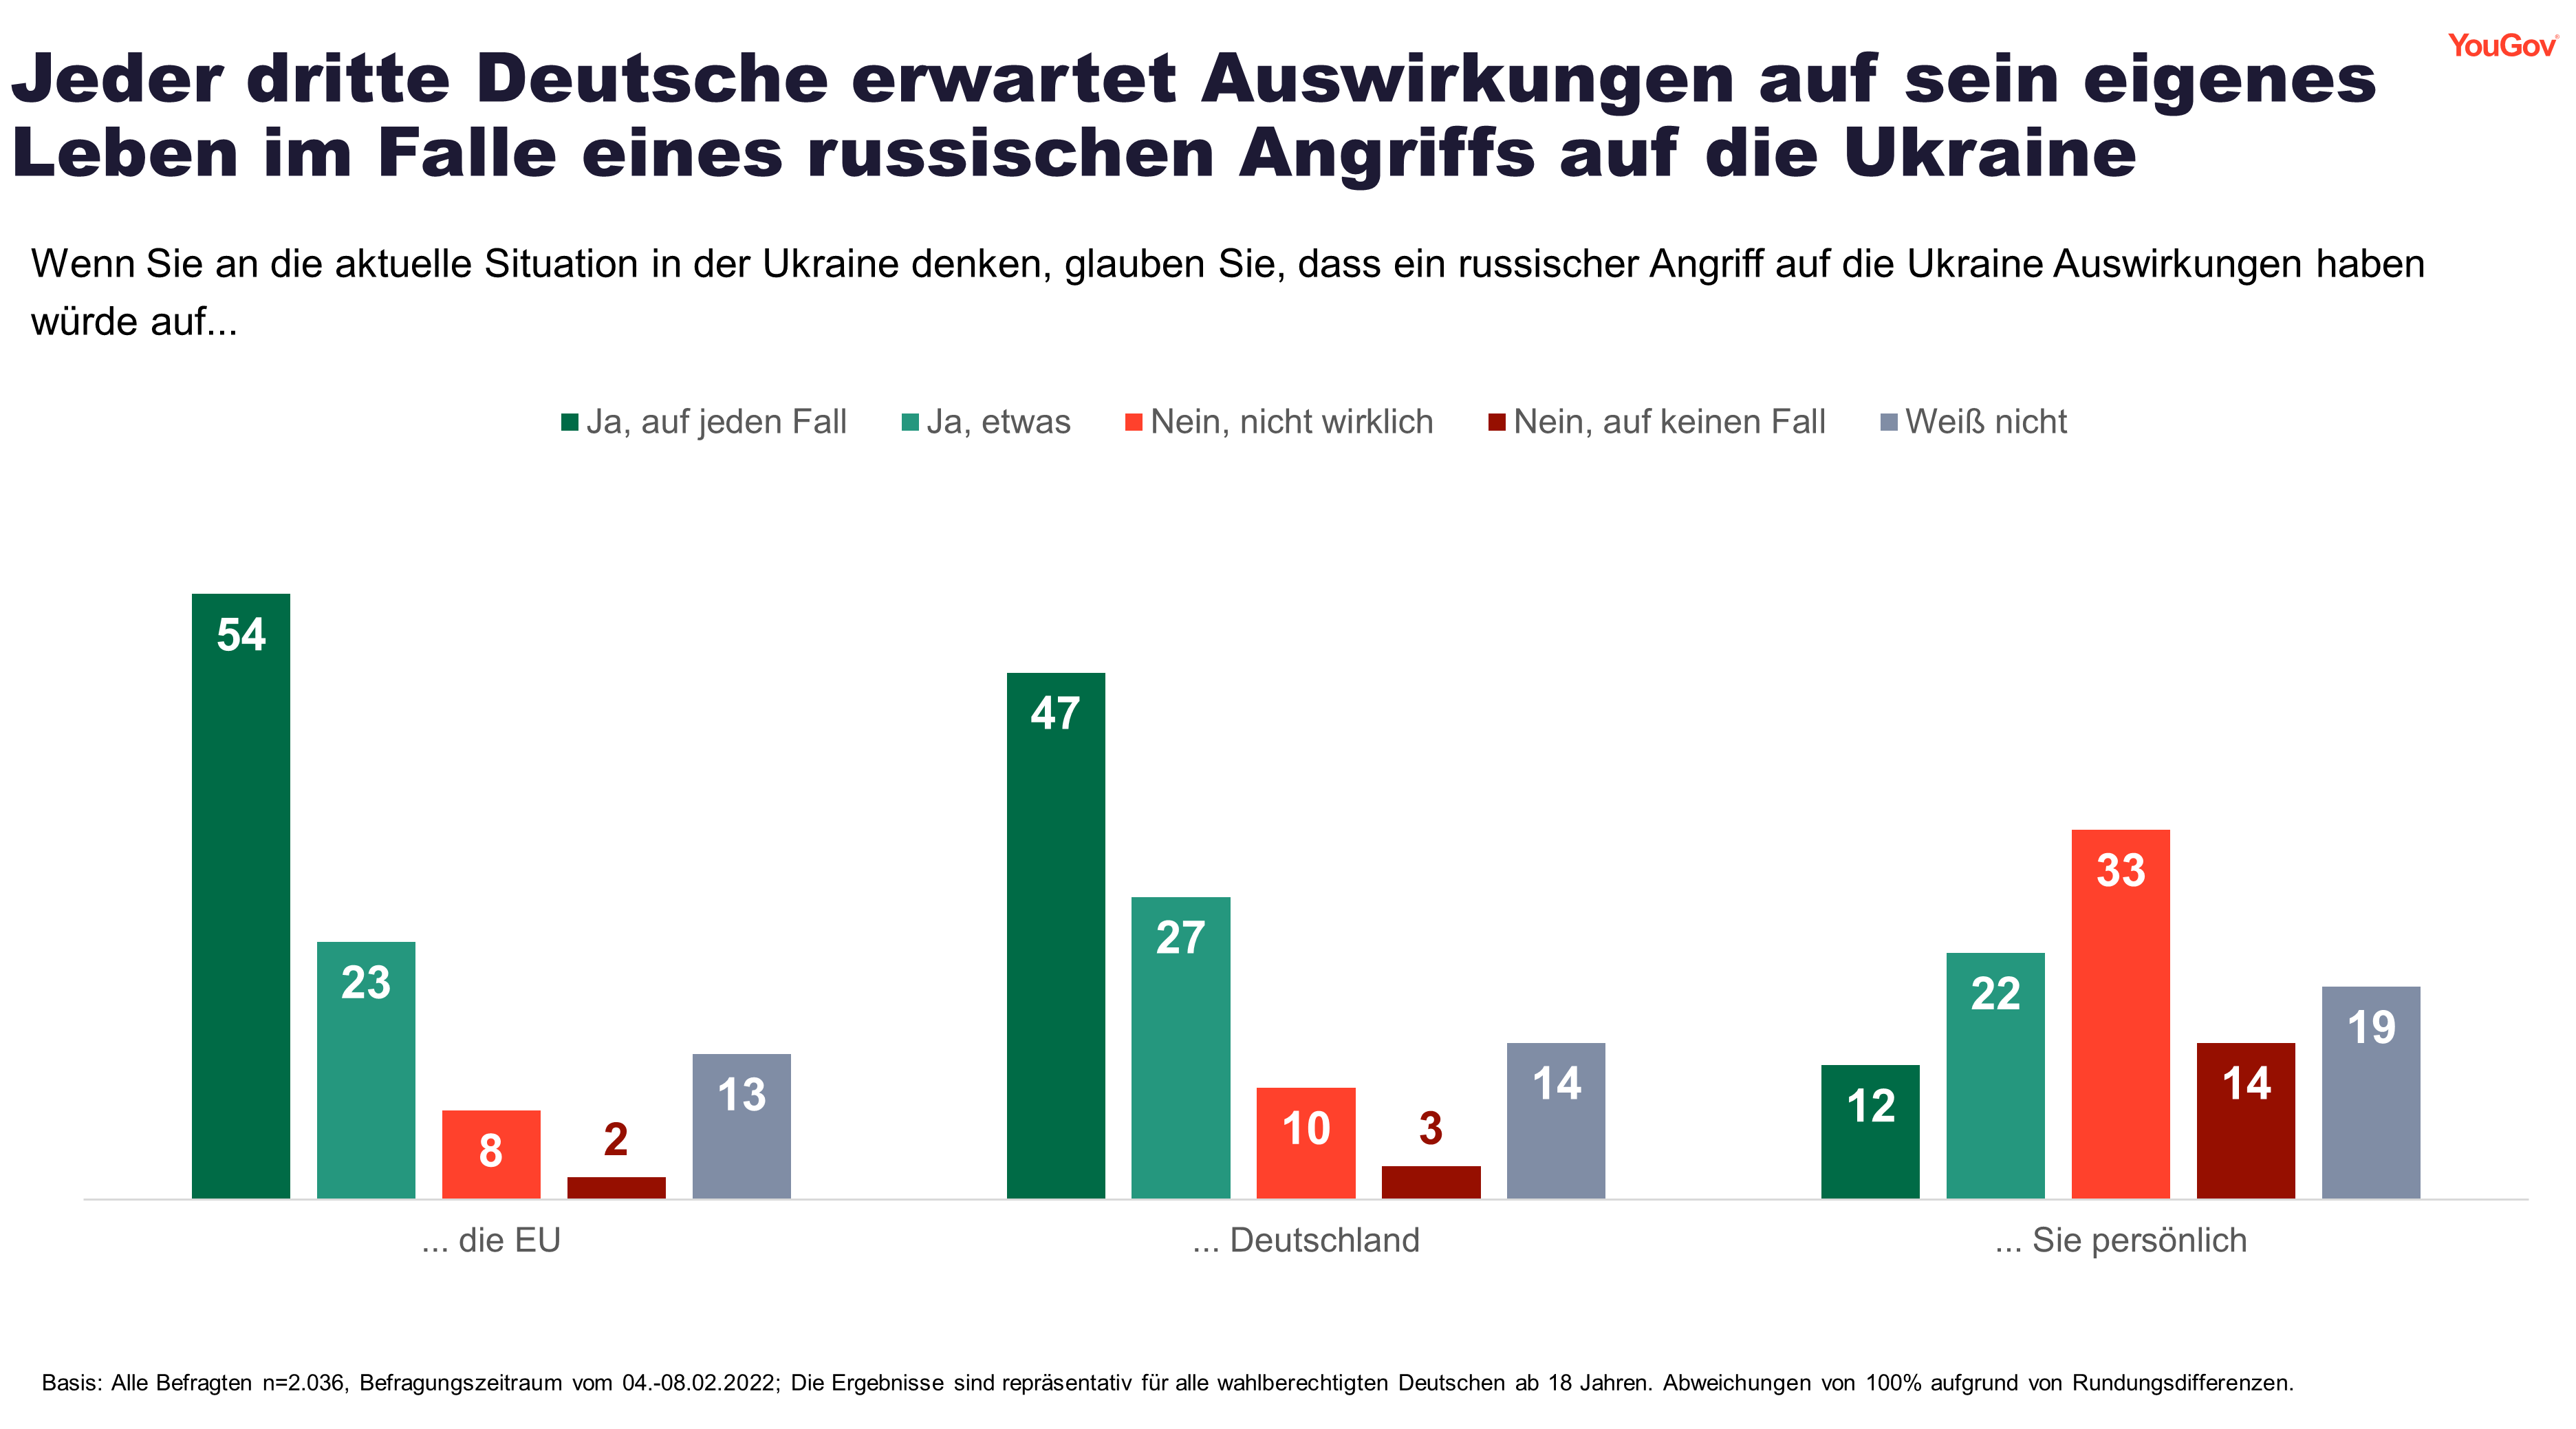
and other items move up the news agenda. (Ipsos MORI) 17 February 2022 730-43-12/Polls Almost Three Out Of Four Germans Fear The Effects Of A Russian Attack
On Germany
While the tension between Ukraine and Russia remains tense, reactions
and reassurances from other countries and possible effects of the crisis on
Europe are also being debated. In the light of these developments, it is
appropriate to take a closer look at German opinion on this crisis issue. The majority of German voters are convinced that a Russian military
attack on Ukraine would also affect other countries: 77 percent believe that
a Russian attack would affect the European Union. 74 percent also fear
the effects of an attack on Germany. Only around every tenth respondent
does not expect any effects on the EU (10 percent) or on Germany (13
percent). On the other hand, one in three still fears personal
repercussions: 34 percent of those surveyed believe that a Russian attack on
Ukraine would affect them personally.
Two out of three Germans are calling for
the federal government to do more to de-escalate the situation Consistent with concerns about the potential impact on Germany, the
majority of Germans want the federal government to become more involved in
this conflict. Almost two out of three respondents (64 percent) are in
favor of (slightly) stronger efforts by the federal government to de-escalate
the situation in Ukraine. This contrasts with 10 percent of respondents
who would like the federal government to make fewer efforts and 11 percent
who do not want German participation in de-escalation at all. The desire for greater efforts by the Federal Government to
de-escalate the situation in Ukraine is somewhat more pronounced among the
oldest respondents. While just under six in ten respondents under the
age of 60 would support greater efforts, more than seven in ten respondents
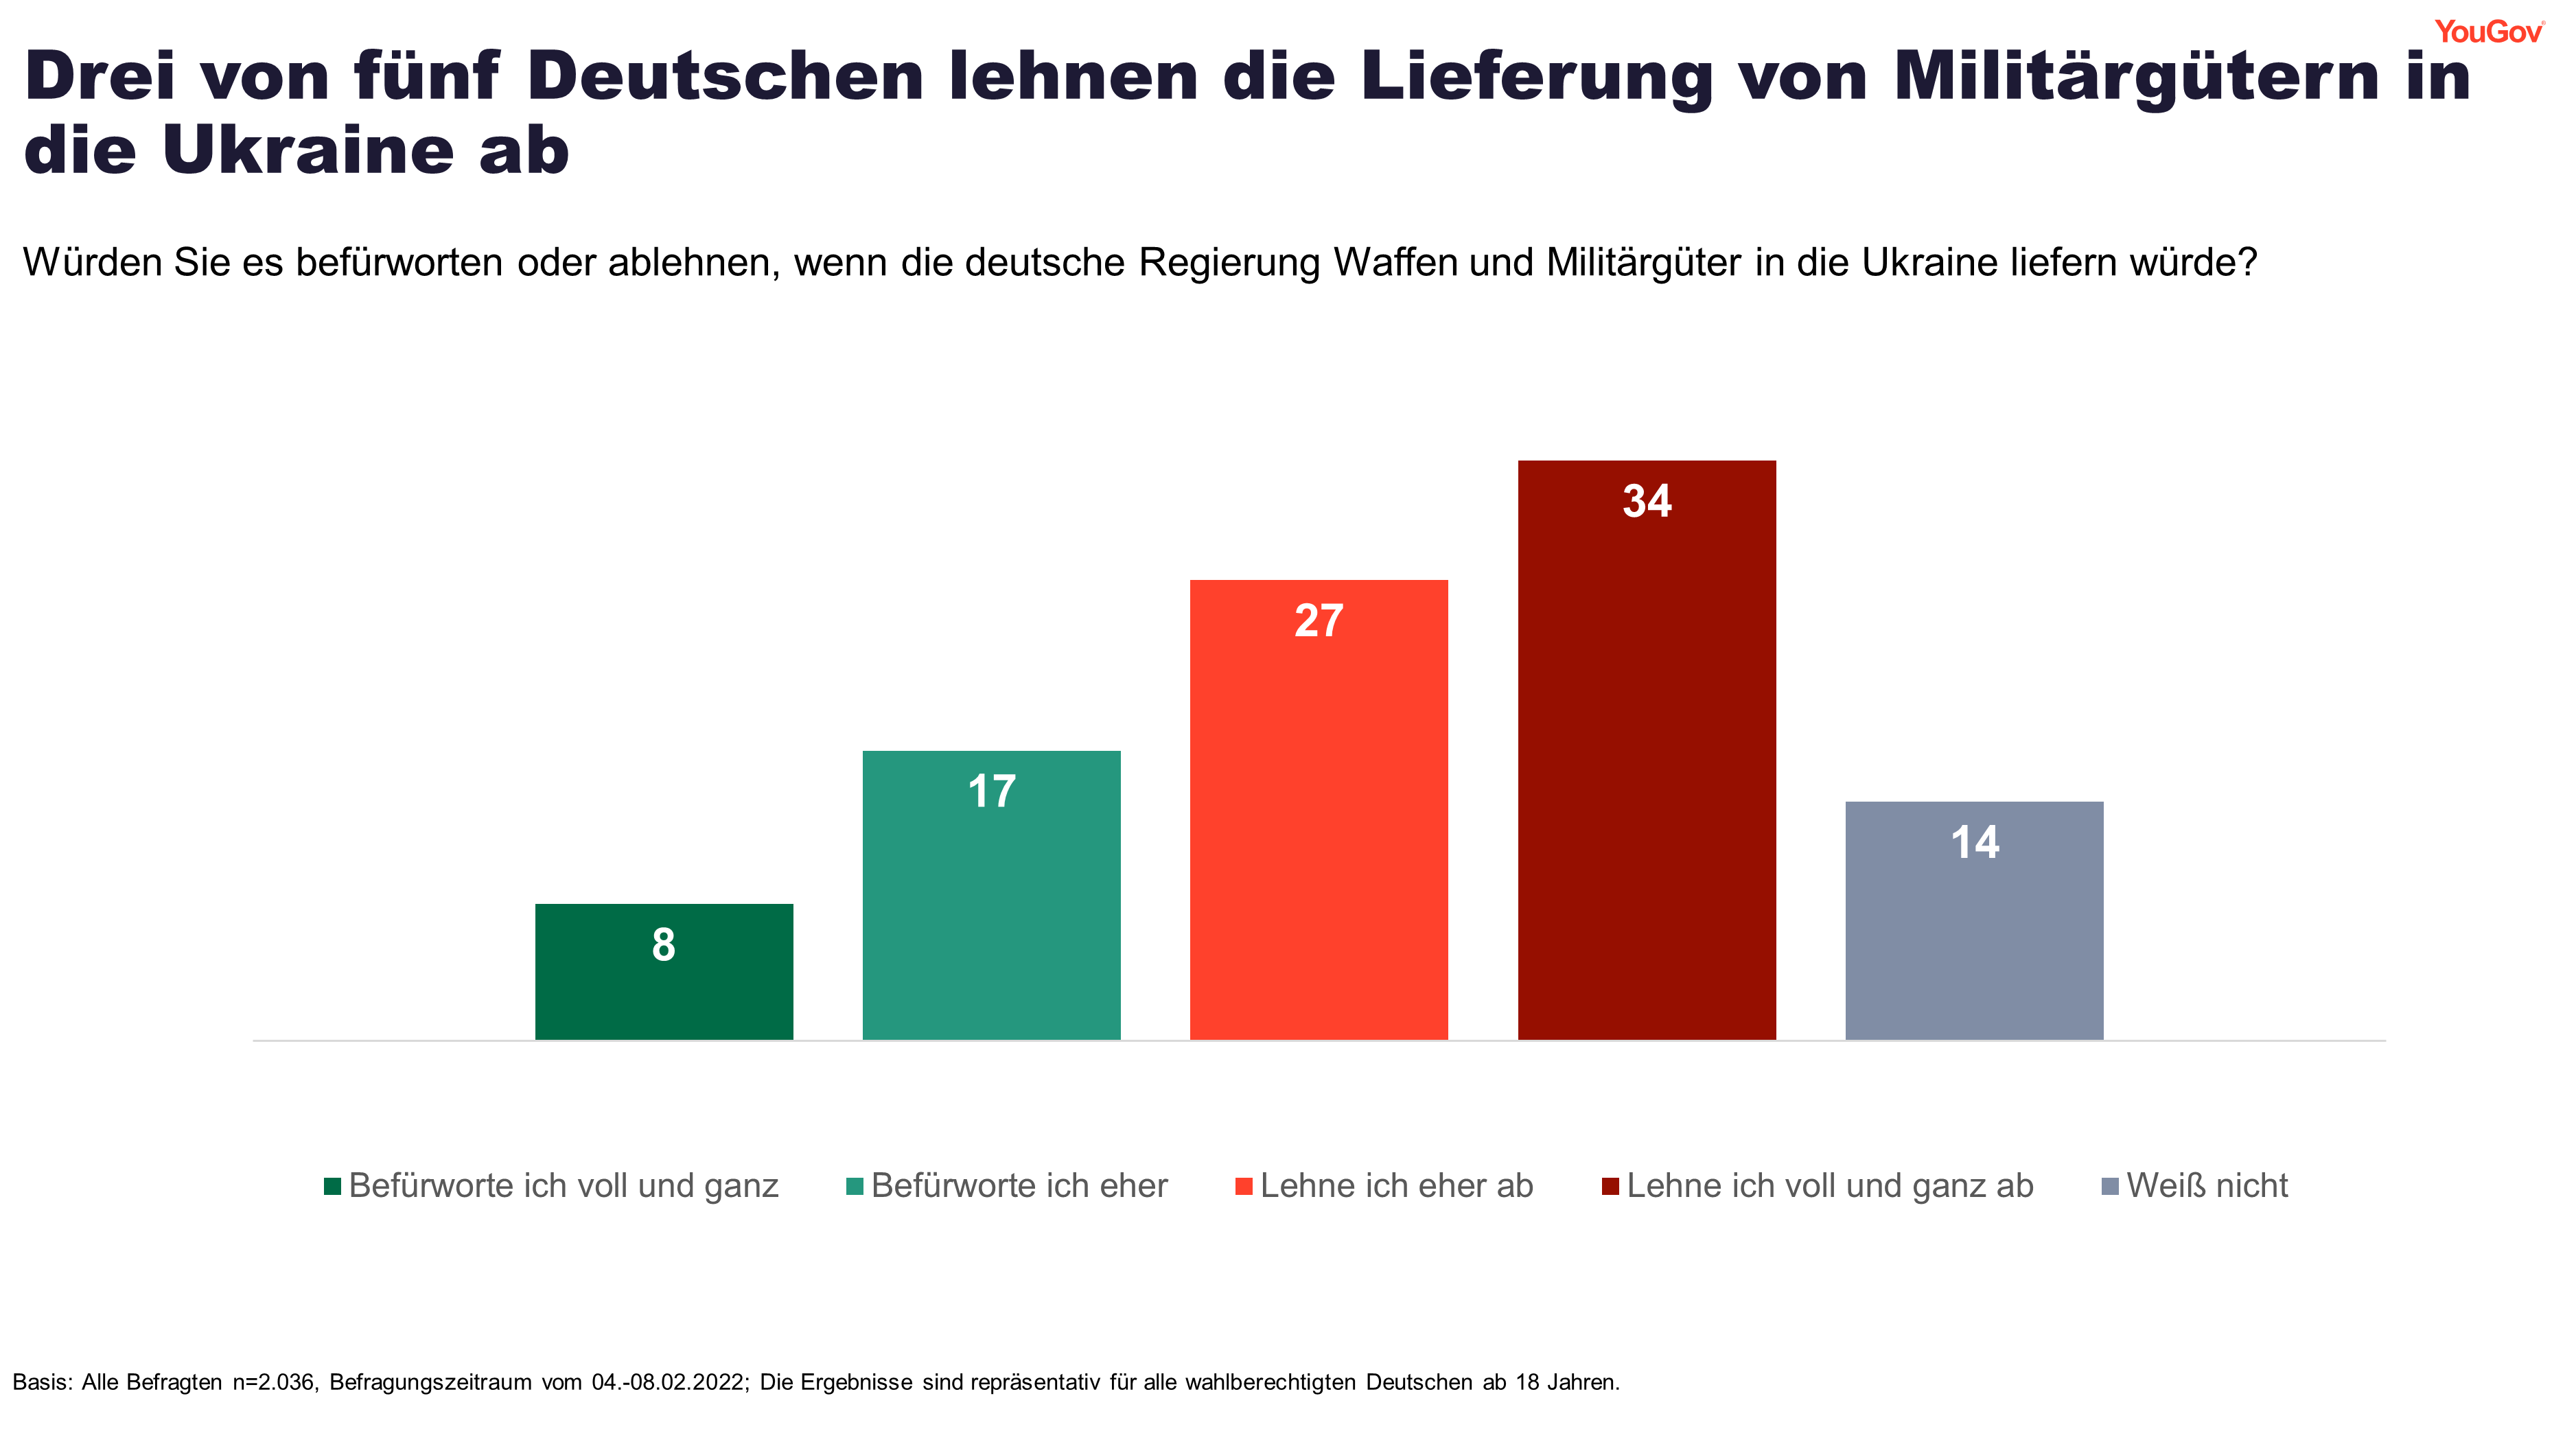
of those aged 60 and over share this opinion. Majority rejects arms deliveries to Ukraine One way that has been discussed to support Ukraine in the crisis
would be the delivery of arms and military equipment from Germany to Ukraine,
as demanded by Ukraine. Three out of five respondents in Germany (61
percent) reject such deliveries from the German government. On the other
hand, one in four (25 percent) would support the delivery of arms and
military equipment to Ukraine.
This view also corresponds to the opinion of the Germans regarding
the deployment of troops to Eastern Europe: The announcement of the USA to
deploy further US military troops is supported by 38 percent of German
voters, while 43 percent reject it. Moving German troops to Eastern Europe
would be seen as even less popular: Only one in four (24 percent) would
support sending German troops to Eastern Europe, while 63 percent would
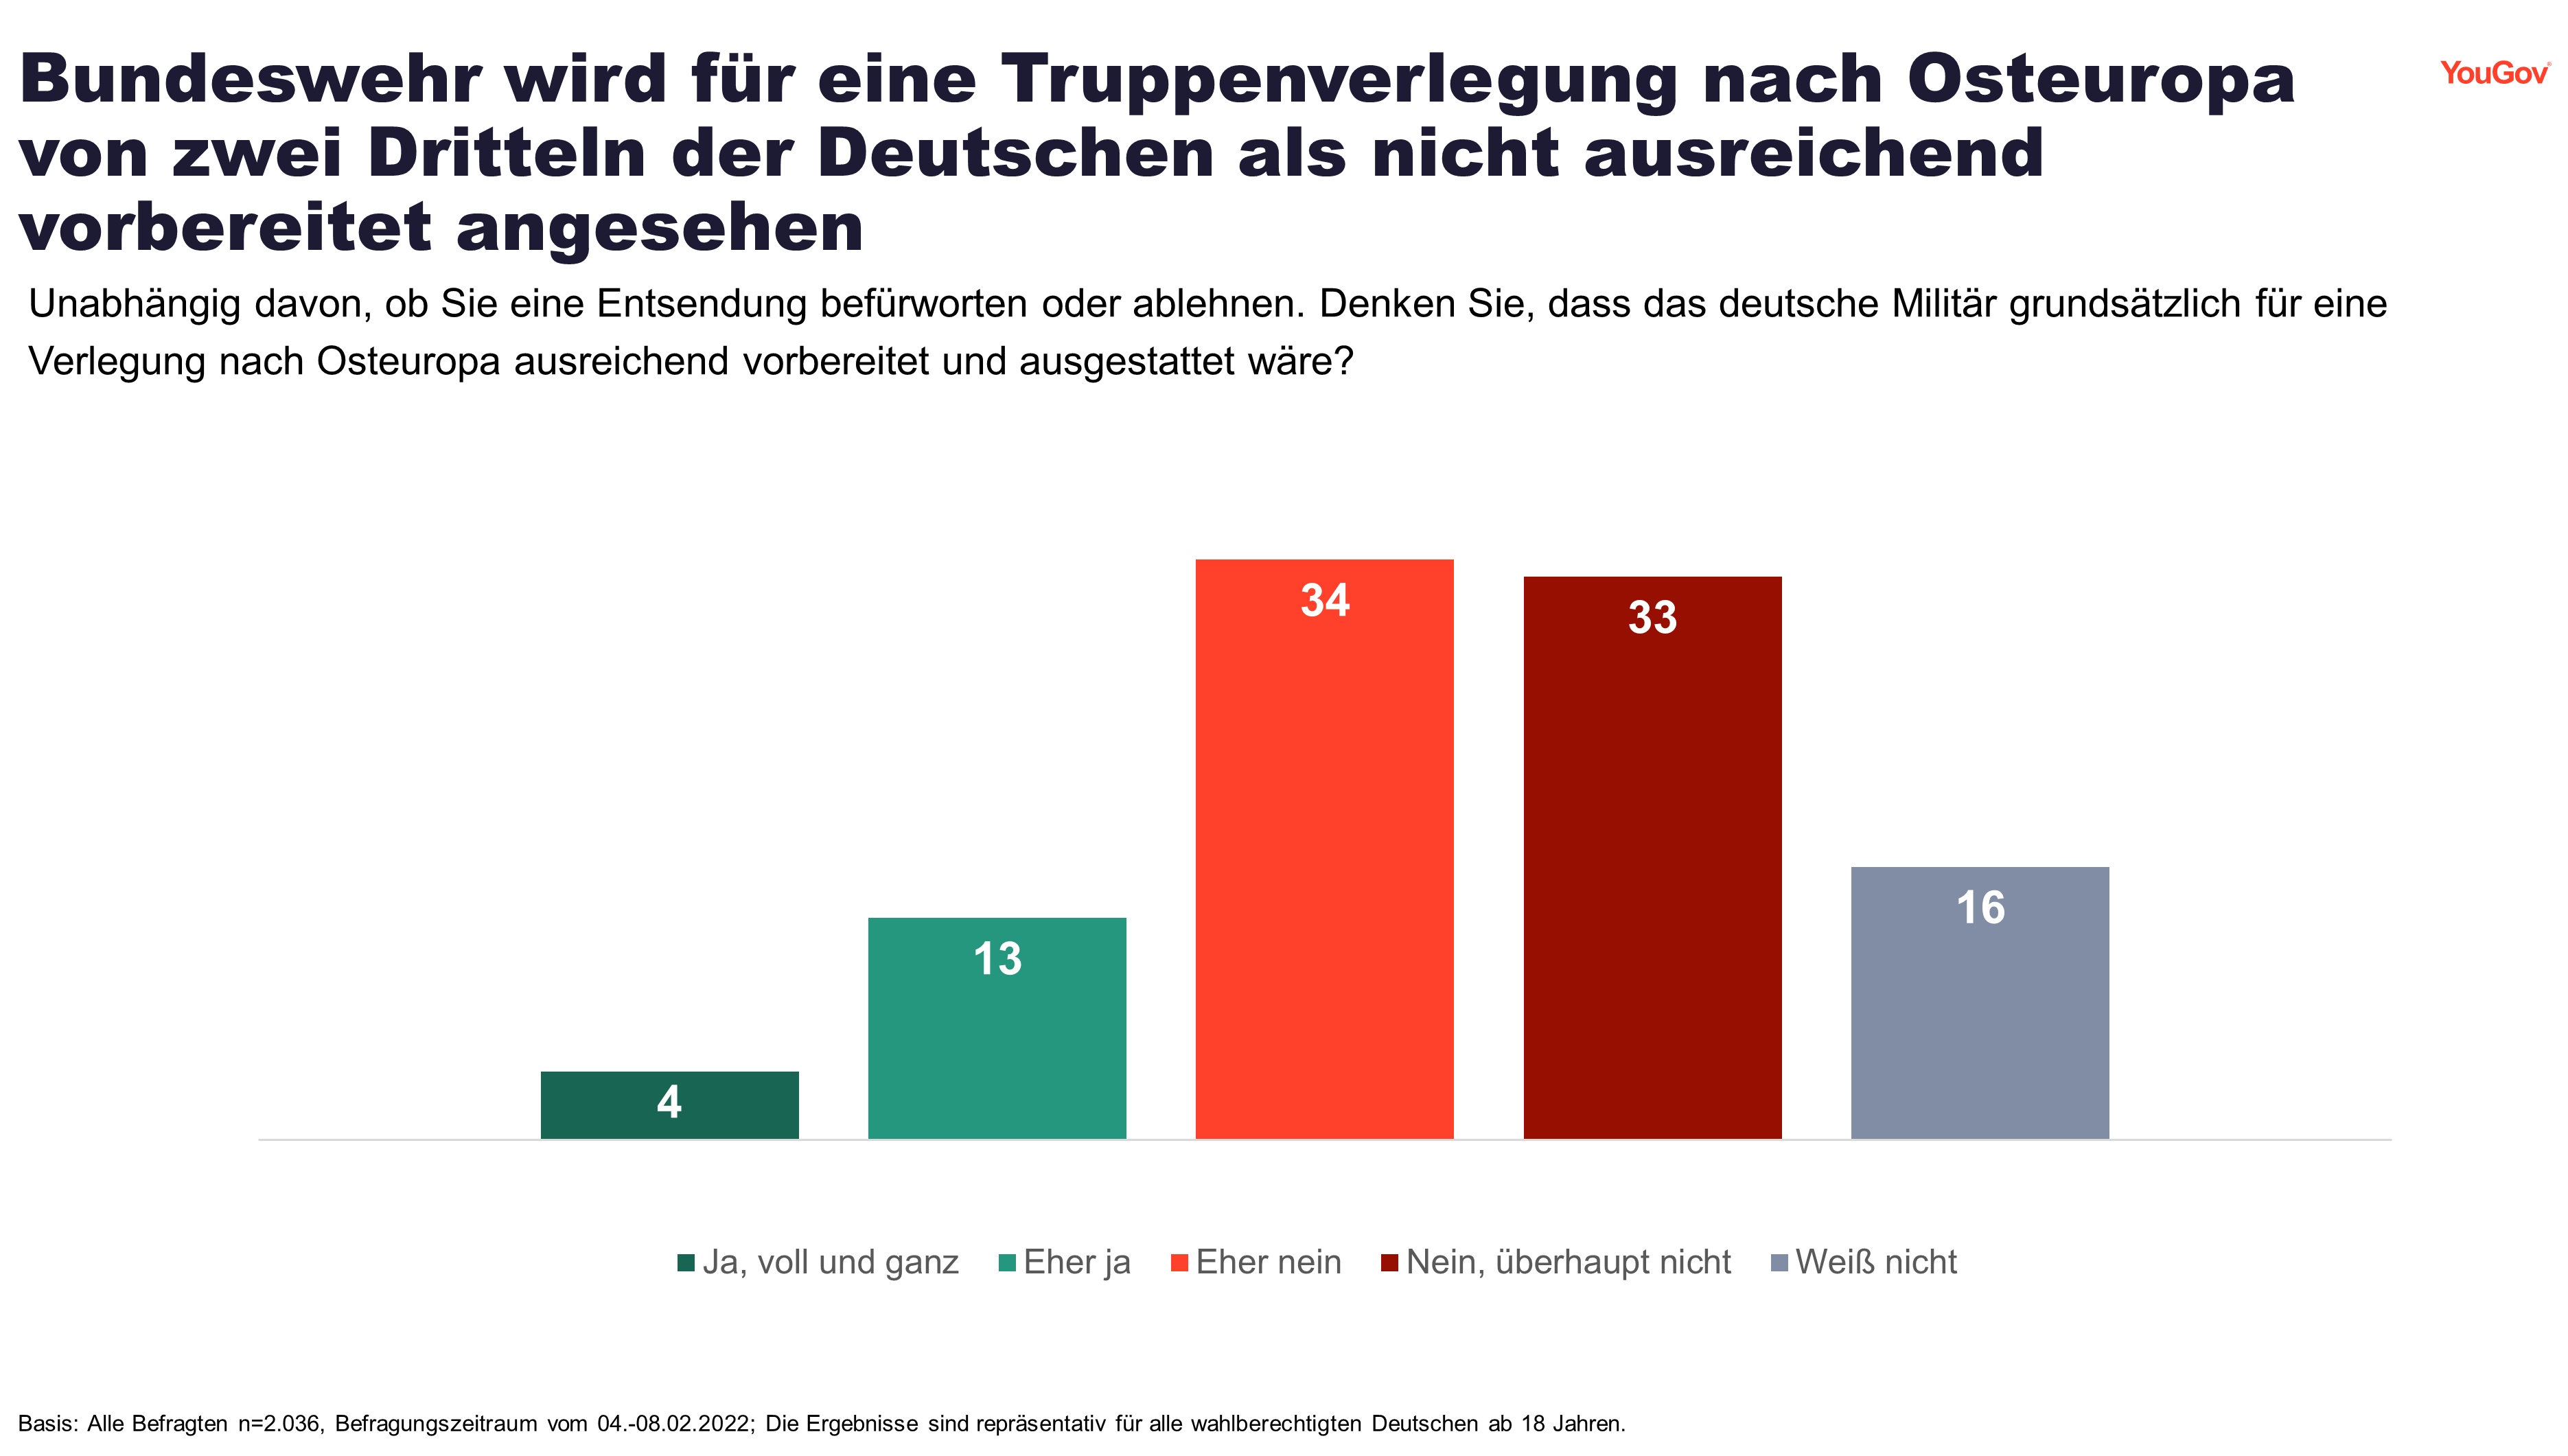
(rather) reject it. Two-thirds of Germans consider the
Bundeswehr to be insufficiently prepared for a troop transfer Regardless of whether they would support or oppose sending German
troops to Eastern Europe, around two in three Germans (67 percent) believe
that the German armed forces are not adequately prepared and equipped for
this purpose. Only around 17 percent think that the German military
would be well prepared for deployment to Eastern Europe. On this question, however, the population is divided in terms of
generations. For example, younger respondents up to the age of 39 rate
the capabilities of the German military much more positively than older
respondents: in the 18 to 29 age group, 37 percent think that the military
would be well equipped for a mission in Eastern Europe, under 30 to
39-year-olds are still 23 percent. Only around one in ten (11 percent) of
respondents aged 40 and over shares this opinion.
These are the results of a current survey by the international data
& analytics group YouGov, for which 2,036 voters in Germany were surveyed
between February 4th, 2022 and February 8th, 2022 using standardized online
interviews. The results are weighted and representative of the German
population aged 18 and over. (YouGov Germany) February 18, 2022 Source: https://yougov.de/news/2022/02/18/knapp-drei-von-vier-deutschen-befurchten-auswirkun/ NORTH
AMERICA
730-43-13/Polls A Majority Of Black Adults In The U S (53%) Say It Is Very Difficult
(18%) Or Somewhat Difficult (35%) To Find A Doctor Who Shares Their Racial Or
Ethnic Background
Unlike their White and Hispanic counterparts, a majority of Black
adults in the U.S. (53%) say it is very difficult (18%) or somewhat difficult
(35%) to find a doctor who shares their racial or ethnic background in the
area where they live. In contrast, majorities of White and Hispanic adults
say it is easy to find a medical provider who shares their background. Americans' Ease in Finding a Doctor Who Shares Their Race/Ethnicity Thinking about the area you live in, in general, is it difficult or
easy to find a doctor who shares the same racial or ethnic background and
experience as you?
Some research has identified disparities in the care that Black
patients receive from White providers versus the care they get from Black
providers, while other findings suggest that greater representation in
healthcare could lead to better outcomes in preventive care by creating
greater trust and better communication between doctor and patient. Additionally,
a meta-analysis of previous research studies has shown that Black patients
tend to receive lower-quality communication from doctors than people of other
races. The research found that Black patients have generally been more
satisfied with the communication they receive from same-race doctors. The findings from the Gallup
Center on Black Voices survey, conducted June 17-July 9, 2021,
highlight the potential scope of the problem of achieving equitable
healthcare outcomes. According to 2019 figures from the Association of American Medical
Colleges, 5% of U.S. doctors are Black -- less than half the percentage of
Black Americans who live in the country. Black adults who find it easy to find a Black doctor are much more
likely to report having positive interactions with their healthcare provider
than those who find it hard to locate a Black physician. These findings
underscore the healthcare disparities that can arise from racial discordance
between patient and doctor. Among those who say it is easy to find a local Black doctor, roughly
two in three give positive ratings on most key healthcare experience
measures, whereas smaller majorities among those who find it hard give similarly positive
ratings on most measures. Both groups give their lowest ratings on
communication about side effects of medicines or treatments -- and among
those who find it hard to find a Black doctor, less than half rate positively
on this measure. Black Americans' Ratings of Healthcare Experiences, by Ease in
Finding a Doctor Who Shares Their Race/Ethnicity % Strongly agree/Agree
Double-digit margins exist between Black adults who say it is easy to find a local Black doctor
and those who say it is hard on
the following measures:
There are smaller differences between the "easy" and
"difficult" groups with respect to healthcare providers describing
possible side effects of medicines or treatments, trusting healthcare
providers to make good decisions about their health, and providers telling
them what medicines or treatments are for before prescribing them. While the study did not measure the actual race of respondents'
doctors, a higher proportion of those who say finding a Black doctor is easy
will likely have at least one Black doctor they can visit compared with those
who say finding them is hard. At a minimum, the measure indicates whether
respondents believe they have that choice, should the race of their doctor be
important to them. Like Black adults, White and Hispanic adults are more positive in
their patient experience ratings when they also report that it is easy to
find a local doctor of their race/ethnicity. However, majorities of White and
Hispanic adults report some degree of ease in locating a doctor of their
race, whereas a majority of Black adults report some degree of difficulty. Bottom Line While Black Americans who find it difficult to find Black doctors to
care for them still report generally positive health outcomes, those who can
more easily access Black doctors are even more positive. When looking at the impact of representation in totality, there are
clearly positive outcomes that can be gained from local representation in the
field -- that is, merely having the ability to find a doctor of one's own
race. While most Americans can find a doctor in their area who shares their
racial or ethnic background with relative ease, this isn't the case for over
half of Black Americans -- and the benefits for those who find it easy are
clear. Much like in the
workplace, increased representation in healthcare settings could lead to
more positive outcomes for Black patients. (Gallup) FEBRUARY 14, 2022 Source: https://news.gallup.com/poll/389609/black-adults-harder-time-finding-doctor-race.aspx 730-43-14/Polls Americans’ Trust In Scientists, Other Groups Declines
Americans’ confidence in groups and institutions has turned downward
compared with just a year ago. Trust in scientists and medical scientists,
once seemingly buoyed by their central role in addressing the coronavirus
outbreak, is now below pre-pandemic levels.
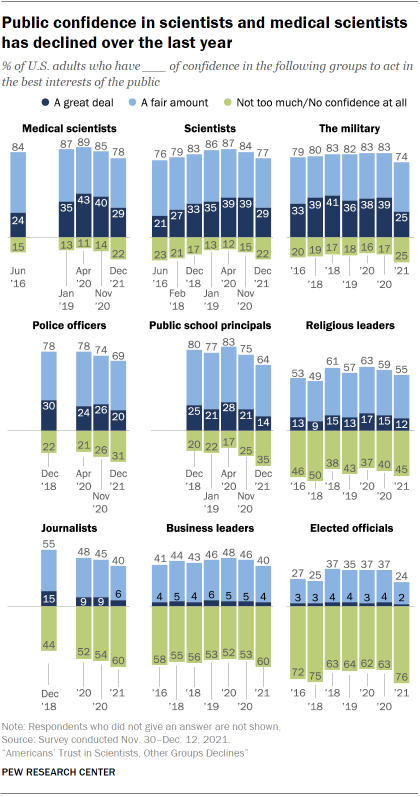
Overall, 29% of U.S. adults say they have a great deal of confidence
in medical scientists to act in the best interests of the public, down from
40% who said this in November 2020. Similarly, the share with a great deal of
confidence in scientists to act in the public’s best interests is down by 10
percentage points (from 39% to 29%), according to a new Pew Research Center
survey. The new findings represent a shift in the recent trajectory of
attitudes toward medical scientists and scientists. Public confidence in both
groups had increased shortly after the start of the coronavirus outbreak,
according to an April
2020 survey. Current ratings of medical scientists and scientists have
now fallen below where they were in January 2019, before the emergence of the
coronavirus. Scientists and medical scientists are not the only groups and institutions
to see their confidence ratings decline in the last year. The share of
Americans who say they have a great deal of confidence in the military to act
in the public’s best interests has fallen 14 points, from 39% in November
2020 to 25% in the current survey. And the shares of Americans with a great
deal of confidence in K-12 public school principals and police officers have
also decreased (by 7 and 6 points, respectively). Large majorities of Americans continue to have at least a fair amount
of confidence in medical scientists (78%) and scientists (77%) to act in the
public’s best interests. These ratings place them at the top of the list of
nine groups and institutions included in the survey. A large majority of
Americans (74%) also express at least a fair amount of confidence in the
military to act in the public’s best interests. Roughly two-thirds say this
about police officers (69%) and K-12 public school principals (64%), while
55% have at least a fair amount of confidence in religious leaders. The public continues to express lower levels of confidence in
journalists, business leaders and elected officials, though even for these
groups, public confidence is tilting more negative. Four-in-ten say they have
a great deal or a fair amount of confidence in journalists and business
leaders to act in the public’s best interests; six-in-ten now say they have
not too much or no confidence at all in these groups. Ratings for elected
officials are especially negative: 24% say they have a great deal or fair
amount of confidence in elected officials, compared with 76% who say they
have not too much or no confidence in them. The survey was fielded Nov. 30 through Dec. 12, 2021, among 14,497
U.S. adults, as the omicron variant of the coronavirus was
first detected in the United States – nearly two years since the
coronavirus outbreak took hold. Recent
surveys this year have found declining ratings for how President Joe
Biden has handled the coronavirus outbreak as well as lower ratings for his
job performance – and that of Congress – generally. Partisan differences over trust in medical
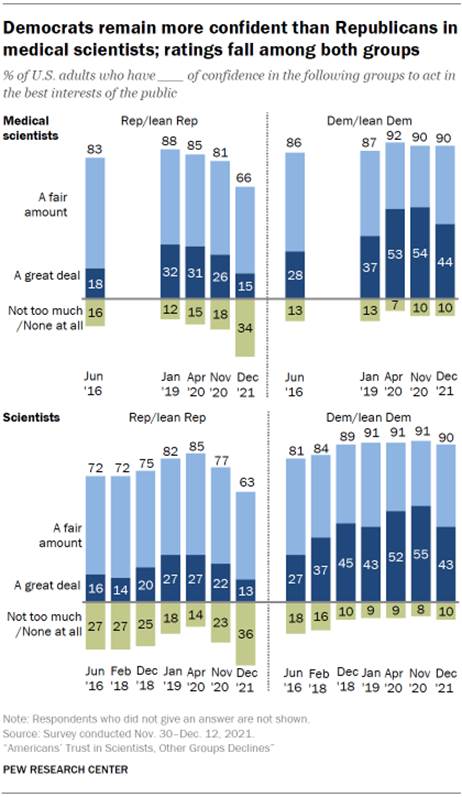
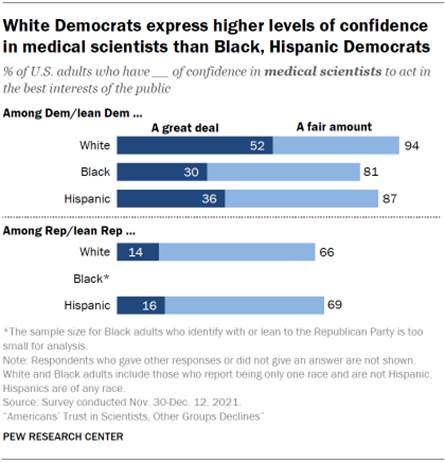
scientists, scientists continue to widen since the coronavirus outbreak Democrats remain more likely than Republicans to express confidence
in medical scientists and scientists to act in the public’s best interests.
However, there has been a significant decline in public confidence in
medical scientists and scientists among both partisan groups. Among Democrats and Democratic-leaning independents, nine-in-ten
express either a great deal (44%) or a fair amount (46%) of confidence in
medical scientists to act in the public’s best interests. However, the share
expressing strong confidence in medical scientists has fallen 10 points since
November 2020. There has been a similar decline in the share of Democrats holding
the strongest level of confidence in scientists since November 2020. (Half of
the survey respondents were asked about their confidence in “medical
scientists,” while the other half were asked about “scientists.”) Still, ratings for medical scientists, along with those for
scientists, remain more positive than those for other groups in the eyes of
Democrats and independents who lean to the Democratic Party. None of the
other groups rated on the survey garner as much confidence; the closest contenders
are public school principals and the military. About three-quarters (76%) of
Democrats and Democratic leaners have at least a fair amount of confidence in
public school principals; 68% say the same about the military. There has been a steady decline in confidence in medical scientists
among Republicans and Republican leaners since April 2020. In the latest
survey, just 15% have a great deal of confidence in medical scientists, down
from 31% who said this in April 2020 and 26% who said this in November 2020.
There has been a parallel increase in the share of Republicans holding
negative views of medical scientists, with 34% now saying they have not too
much or no confidence at all in medical scientists to act in the public’s
best interests – nearly three times higher than in January 2019, before the
coronavirus outbreak. Republicans’ views of scientists have followed a similar trajectory.
Just 13% have a great deal of confidence in scientists, down from a high of
27% in January 2019 and April 2020. The share with negative views has doubled
over this time period; 36% say they have not too much or no confidence at all
in scientists in the latest survey. Republicans’ confidence in other groups and institutions has also
declined since the pandemic took hold. The share of Republicans with at least
a fair amount of confidence in public school principals is down 27 points
since April 2020. Views of elected officials, already at low levels, declined
further; 15% of Republicans have at least a fair amount of confidence in
elected officials to act in the public’s best interests, down from 37% in
April 2020. Race and ethnicity, education, partisan
affiliation each shape confidence in medical scientists People’s assessments of scientists and medical scientists are tied to
several factors, including race and ethnicity as well as levels of education
and partisan affiliation.
Looking across racial and ethnic groups, confidence in medical
scientists declined at least modestly among White and Black adults over the
past year. The decline was especially pronounced among White adults. There is now little difference between how White, Black and Hispanic
adults see medical scientists. This marks a shift from previous Pew Research
Center surveys, where White adults were more likely than Black adults to
express high levels of confidence in medical scientists. Among White adults, the share with a great deal of confidence in
medical scientists to act in the best interests of the public has declined
from 43% to 29% over the past year. Ratings are now lower than they were in
January 2019, before the coronavirus outbreak in the U.S. Among Black adults, 28% say they have a great deal of confidence in
medical scientists to act in the public’s best interests, down slightly from
November 2020 (33%). The share of Hispanic adults with a strong level of trust in medical
scientists is similar to the share who expressed the same level of trust in
November 2020, although the current share is 16 points lower than it was in
April 2020 (29% vs 45%), shortly after measures to address the coronavirus
outbreak began. Ratings of medical scientists among Hispanic adults continue
to be lower than they were before the coronavirus outbreak. In January 2019,
37% of Hispanic adults said they had a great deal of confidence in medical
scientists. While the shares of White, Black and Hispanic adults who express a
great deal of confidence in medical scientists have declined since the early
stages of the coronavirus outbreak in the U.S., majorities of these groups
continue to express at least a fair amount of confidence in medical
scientists, and the ratings for medical scientists compare favorably with
those of other groups and institutions rated in the survey.
Confidence in scientists tends to track closely with confidence in
medical scientists. Majorities of White, Black and Hispanic adults have at
least a fair amount of confidence in scientists. And the shares with this
view continue to rank at or above those for other groups and institutions.
For more on confidence in scientists over time among White, Black and
Hispanic adults, see
the Appendix. Confidence in medical scientists and scientists across racial and
ethnic groups plays out differently for Democrats and Republicans. White Democrats (52%) are more likely than Hispanic (36%) and Black
(30%) Democrats to say they have a great deal of confidence in medical
scientists to act in the public’s best interests. However, large majorities
of all three groups say they have at least a fair amount of confidence in
medical scientists. Among Republicans and Republican leaners, 14% of White adults say
they have a great deal of confidence in medical scientists, while 52% say
they have a fair amount of confidence. Views among Hispanic Republicans are
very similar to those of White Republicans, in contrast to differences seen
among Democrats. There are similar patterns in confidence in scientists. (However, the
sample size for Black Republicans in the survey is too small to analyze on
these measures.) See
the Appendix for more. Americans with higher levels of education express more positive views
of scientists and medical scientists than those with lower levels of
education, as has also been the case in past Center surveys. But education
matters more in assessments by Democrats than Republicans.
Democrats and Democratic leaners with at least a college degree
express a high level of confidence in medical scientists: 54% have a great
deal of confidence and 95% have at least a fair amount of confidence in
medical scientists to act in the public’s interests. By comparison, a smaller
share of Democrats who have not graduated from college have confidence in
medical scientists. Among Republicans and Republican leaners, college graduates are 9
points more likely than those with some college experience or less education
to express a great deal of confidence in medical scientists (21% vs. 12%). There is a similar difference between those with higher and lower
education levels among Democrats when it comes to confidence in scientists.
Among Republicans, differences by education are less pronounced; there is no
significant difference by education level in the shares holding the strongest
level of confidence in scientists to act in the public’s interests. (PEW) Source: https://www.pewresearch.org/science/2022/02/15/americans-trust-in-scientists-other-groups-declines/ 730-43-15/Polls Nearly A Quarter Of Americans Get News From Podcasts
The controversy around Spotify
and its podcaster Joe Rogan has drawn new attention to the medium at
a time when podcasting has grown to become yet another platform that
Americans turn to for news. About a quarter of U.S. adults (23%) say they get
news at least sometimes from podcasts, according to a Pew Research Center
survey conducted in July 2021. The share of Americans who say they often get news from a podcast is quite small – at
just 7% – compared with about twice as many adults (16%) who say they sometimes get news from podcasts.
At the same time, more than half of Americans (56%) say they never get news from podcasts,
suggesting there is still quite a lot of growth potential for this nascent
industry. These numbers are relatively stable compared with those reported in
2020.
Some groups are more likely than others to get news from podcasts.
Younger adults, in particular, are more likely than older adults to at least
sometimes get news from podcasts. One-in-three adults ages 18 to 29 say they
at least sometimes get news from podcasts, compared with 12% of adults 65 and
older. About three-in-ten adults ages 30 to 49 (29%) get news from podcasts
at least sometimes; nearly one-in-five adults ages 50 to 64 (18%) say they do
the same. Men and women get news from podcasts at similar rates (25% and 21%,
respectively). Those with more formal education and higher incomes are more likely
to get news at least sometimes from podcasts. U.S. adults with at least a
college degree, for instance, are more likely to get news at least sometimes
from podcasts than those with a high school education or less (28% vs. 17%,
respectively). Few differences exist across racial and ethnic groups. That is also
true when it comes to political affiliation. Roughly a quarter of both
Republicans and independents who lean toward the Republican Party, as well as
Democrats and Democratic leaners, get news from podcasts (23% and 24%,
respectively). (PEW) FEBRUARY 15, 2022 730-43-16/Polls COVID-19 Pandemic Continues To Reshape Work In America
Nearly two years into the COVID-19
pandemic, roughly six-in-ten U.S. workers who say their jobs can mainly
be done from home (59%) are working from home all or most of the time. The
vast majority of these workers (83%) say they were working from home even
before the omicron
variant started to spread in the United States, according to a new
Pew Research Center survey. This marks a decline from October
2020, when 71% of those with jobs that could be done from home were
working from home all or most of the time, but it’s still much higher than
the 23% who say they teleworked frequently before the coronavirus
outbreak. The impetus for working from home has shifted considerably since
2020. Today, more workers say they are doing this by choice rather than
necessity. Among those who have a workplace outside of their home, 61% now
say they are choosing not to go into their workplace, while 38% say they’re
working from home because their workplace is closed or unavailable to them.
Earlier in the pandemic, just the opposite was true: 64% said they were
working from home because their office was closed, and 36% said they were
choosing to work from home. For those who do have access to their workplaces but are opting to
work mainly from home, their reasons for doing so have changed since fall
2020. Fewer cite concerns about being exposed to the coronavirus – 42% now
vs. 57% in 2020 say this is a major reason they are currently working from
home all or most of the time. And more say a preference for working from home
is a major reason they’re doing so (76% now vs. 60% in 2020). There’s also
been a significant increase since 2020 (from 9% to 17%) in the share saying
the fact that they’ve relocated away from the area where they work is a major
reason why they’re currently teleworking.
Working from home is a relatively new experience for a majority of
workers with jobs that can be done remotely – 57% say they rarely or never
worked from home prior to the coronavirus outbreak. For those who have made
the switch to telework, their work lives have changed in some significant
ways. On the plus side, most (64%) of those who are now working from home at
least some of the time but rarely or never did before the pandemic say it’s
easier now for them to balance work with their personal life. And many (44%)
say working from home has made it easier for them to get their work done and
meet deadlines, while very few (10%) say it’s been harder to do this. At the
same time, 60% say they feel less connected to their co-workers now. Most
(72%) say working from home hasn’t affected their ability to advance in their
job. Looking to the future, 60% of workers with jobs that can be done from
home say when the coronavirus outbreak is over, if they have the choice,
they’d like to work from home all or most of the time. This is up from 54%
who said the same in 2020. Among those who are currently working from home
all or most of the time, 78% say they’d like to continue to do so after the
pandemic, up from 64% in 2020. Most U.S. workers (60%) don’t have
jobs that can be done from home, and others who do have these types of jobs
are going into their workplace at least sometimes. For a large majority of
these workers, their jobs continue to involve at least some in-person
interaction with others at their workplace. About half of those who ever
interact with other people at their workplace say they’re very (19%) or
somewhat (32%) concerned about being exposed to the coronavirus. This is
virtually unchanged from October 2020. Roughly one-in-four (26%) say they are
more concerned about this now than they were before the omicron variant
started to spread, and the same share say they are less concerned now. A
plurality (47%) say they are about as concerned now as they were before
omicron. The nationally representative survey of 10,237 U.S. adults (including
5,889 employed adults who have only one job or who have multiple jobs but
consider one to be their primary) was conducted Jan. 24-30, 2022, using the
Center’s American
Trends Panel.1 Among
the other key findings: Workers with jobs that can be done from
home who are choosing to go into their workplace cite preference and
productivity as major reasons why they rarely or never work from home. Six-in-ten
of these workers say a major reason they rarely or never work from home is
that they prefer working at their workplace, and a similar share (61%) cite
feeling more productive at their workplace as a major reason. Relatively few
say major reasons for working in-person are that they don’t have the proper
space or resources at home (21%), that there are more opportunities for
advancement if they’re at their workplace (14%) or that they feel pressure
from their supervisor or co-workers to be there (9%). About half of workers who are working from
home all or most of the time and whose offices are closed say they would be
comfortable going into their workplace if it were to reopen in the next
month. One-in-five say they’d be very
comfortable returning to their workplace, and 29% say they’d be somewhat
comfortable doing this. In October 2020, a smaller share of workers (36%)
said they would feel comfortable returning to their workplace in the next
month. Most workers who are not working
exclusively from home (77%) say they are at least somewhat satisfied with the
measures their employer has put in place to protect them from coronavirus
exposure, but only 36% say they are very satisfied. As
was the case earlier in the pandemic, White workers are more likely than
Black or Hispanic workers to say they are very satisfied with the safety
measures that have been put in place. And upper-income workers are more
likely to be very satisfied than middle- and lower-income workers.2 Roughly one-in-five workers who are not
working exclusively at home (22%) say their employer has required employees
to get a COVID-19 vaccine. About three-quarters
(77%) say their employer has not required vaccination (47% say their employer
has encouraged it and 30% say they have not). Regardless of what their
employer requires, 30% of these workers think their employer should require
vaccines, while most say their employer should not (39% say their employer
should encourage but not require vaccines and 30% say their employer
shouldn’t do either). These views are sharply divided along partisan lines:
47% of Democrats and those who lean to the Democratic Party who are not
working exclusively from home think their employer should require employees
to get a vaccine, compared with just 10% of Republicans and Republican
leaners. Frequency of telework differs by education,
income
There are key
demographic differences between workers whose jobs can and cannot be
done from home. Among those who say the responsibilities of their job can
mainly be done from home, some groups are teleworking more frequently than
others. College graduates with jobs that can be done from home (65%) are more
likely than those without a four-year college degree (53%) to say they are
working from home all or most of the time. And higher shares of upper-income
workers (67%) are working from home compared with middle- (56%) and
lower-income (53%) workers. A plurality (44%) of all employed adults who are currently working
from home all or most of the time say this is because they are choosing not
to go into their workplace. About three-in-ten (28%) say their workplace is currently
closed or unavailable to them, and a similar share (27%) say they don’t have
a workplace outside of their home. The share saying they don’t have a
workplace outside of their home is up significantly from 2020, when 18% said
this. Adults without a four-year college degree are much more likely to fall
into this category than those with a bachelor’s degree or more education (40%
vs. 19%, respectively).
Workers who are currently teleworking all or most of the time because
their workplace is closed or unavailable to them are divided over whether
they’d be comfortable returning there in the near future. One-in-five say, if
their workplace reopened in the next month, they’d be very comfortable
working there; 29% say they would be somewhat comfortable. About half say
they’d be either somewhat (26%) or very (25%) uncomfortable returning to
their workplace in that timeframe. In October 2020, workers had more trepidation about returning to
their workplaces. At that time, only 36% of workers who were working from
home because their office was closed said, if it were to reopen in the next
month, they’d be comfortable returning (13% said they’d feel very comfortable
working in their workplace, 22% said they’d feel somewhat comfortable).
Roughly two-thirds said they’d be somewhat (33%) or very (31%) uncomfortable
doing this. Those who are teleworking by choice are
less likely to be doing so because of health concerns, more likely to say
they prefer it, compared with 2020
The reasons workers give for working from home when they could
otherwise go into their workplace have changed considerably from October
2020. Today, a preference for working from home is driving these decisions
rather than concerns about the coronavirus. Fully 76% of workers who indicate
that their workplace is available to them say a major reason why they are
currently teleworking all or most of the time is that they prefer working
from home. An additional 17% say this is a minor reason why they are working
from home, and 7% say this is not a reason. The share citing this as a major
reason is up significantly from 60% in 2020. At the same time, the share pointing to concerns about being exposed
to the coronavirus as a major reason for working from home has fallen from
57% in 2020 to 42% today. About one-in-four teleworkers (27%) say this is a
minor reason they are working from home, and 30% say it’s not a reason. Women
(48%) are more likely than men (37%) to say this is a major reason they are
working from home. There’s also a partisan gap: Half of Democrats and
Democratic leaners cite concerns about exposure to the coronavirus as a major
reason why they’re currently working from home all or most of the time,
compared with 25% of Republicans and Republican leaners. A smaller but growing share of workers (17%) say relocation to an
area away from their workplace, either permanently or temporarily, is a major
reason why they are working from home. An additional 8% say this is a minor
reason they are working from home, and 75% say this is not a reason. Among teleworking parents whose workplaces are open and who have at
least one child younger than 18, 32% say child care is a major reason why
they are working from home all or most of the time, down from 45% in October
2020. Some (15%) say a major reason why they are currently working from home
is that there are restrictions on when they can have access to their
workplace, similar to the share who said this in 2020 (14%). Most workers who could work from home but
are opting not to say a major reason is that they feel more productive at
their workplace About one-in-five workers (22%) who say the responsibilities of their
job can mostly be done from home also say they rarely or never telework. For
most (64%), this is because their employer doesn’t allow them to work from
home more often. But for some (36%), there are other reasons why they’re
opting to go into their workplace rather than working from home.
Again, personal preference is a driving force behind these choices.
Six-in-ten of these workers say a major reason why they rarely or never work
from home is that they prefer working at their workplace. An additional 19%
say this is a minor reason why they don’t work from home more often, and 21%
say this is not a reason. A similar share (61%) say a major reason why they
rarely or never work from home is that they feel more productive at their
workplace. Some 16% say this is a minor reason and 23% say it’s not a
reason. Relatively few (21%) say not having the space or resources at home to
work effectively is a major reason why they rarely or never work from home;
23% say this is a minor reason and 55% say it’s not a reason. When it comes to having more opportunities to advance at work if they
are there in person or feeling pressure from supervisors or co-workers to be
in the office, large majorities say these are not reasons why they rarely or
never work from home. Only 14% point to opportunities for advancement as a
major reason and 9% cite pressure from their colleagues. A majority of new teleworkers say their
current arrangement makes it easier to balance work and personal life For those new to working from home, the pandemic-related shift to
telework has changed some things while leaving others relatively the same.
For example, among employed adults whose job can be done from home and who
are currently working from home at least some of the time but rarely or never
did before the pandemic, 64% say working from home has made it easier to
balance work and their personal life. Two-in-ten of these adults say
balancing work and their personal life is about the same, and 16% say it is
harder.
Some 44% of those who shifted to telework at least some of the time
during the pandemic say their new work arrangement makes it easier for them
to get their work done and meet deadlines; a similar share (46%) say it’s
about the same, while one-in-ten say it is now harder to get their work done
and meet deadlines. Some aspects of telework have been less positive, according to those
who are now working from home at least some of the time but rarely or never
did so before the pandemic. Six-in-ten of these workers say they now feel
less connected to their co-workers. Some 36% say it’s about the same, and 4%
say they are more connected to their co-workers. Most workers new to telework (72%) say their ability to advance at
work while working from home is about the same as it was before. Fewer than
one-in-five say working from home has made it easier or harder to advance. Assessments of how working from home has changed some elements of
work life vary by gender. Women are about twice as likely as men to say
working from home has made it easier to advance in their job (19% vs. 9%).
And while about half of women who are new to telework (51%) say working from
home has made it easier to get their work done and meet deadlines, 37% of men
say the same. Men and women are about equally likely to say working from home
has made it easier for them to balance work and their personal life. For those who have at least some in-person
interactions at work, concerns about COVID-19 exposure vary across
demographic groups Fully 86% of workers who are not working exclusively from home –
either by choice or because they can’t work remotely – say they have at least
some in-person interactions with other people at their workplace. Among these
workers, 52% say they are at least somewhat concerned about being exposed to
the coronavirus from the people they interact with at work, including 20% who
are very concerned. A
similar share (48%) say they are either not too or not at all concerned. This
is virtually unchanged from October
2020.
Black and Hispanic workers are more likely than White workers to
express at least some concern about being exposed to the coronavirus at work
(72% and 65% vs. 43%, respectively). But Black workers are particularly
concerned: 42% say they are very concerned about COVID-19 exposure at work,
compared with 24% of Hispanic workers and an even smaller share of White
workers (14%). Concerns about COVID-19 exposure at work also vary by gender, age and
income. Women (59%) are more likely than men (45%) to say they are concerned
about being exposed to the coronavirus from people they interact with at
work. A majority of workers younger than 30 (60%) express at least some
concern, compared with 52% of those ages 30 to 49, 47% of those ages 50 to 64
and 44% of those ages 65 or older. And workers with lower incomes (59%) are
more likely than those with middle (52%) and upper (40%) incomes to say they
are concerned about being exposed to COVID-19 from the people they interact
with in person at work. Workers who are fully vaccinated against COVID-19 and have received a
booster shot are the most likely to express concerns about being exposed to
the coronavirus from those they interact with in person at work: 66% of these
workers say they are at least somewhat concerned, compared with 52% of those
who are fully vaccinated but have not gotten a booster shot and just 25% of
those who have not gotten any COVID-19 shots. About half say they are as concerned about
being exposed to the coronavirus at work as they were before the omicron
surge
About a quarter of workers who are not working exclusively from home
and who have at least some in-person interactions at work (26%) say they are
more concerned about being exposed to the coronavirus at work than they were
before the omicron variant started to spread in the U.S. in December 2021.
The same share (26%) say they are now less concerned
than they were before the new variant started to spread. About half (48%) say
they are about as concerned as they were before. Black (40%) and Hispanic (32%) workers are more likely than White
workers (21%) to say they are more concerned about being exposed to the
coronavirus from people they interact with at work than they were before the
omicron surge. About three-in-ten employed women (28%) say they are more
concerned now than before the new variant started to spread, compared with
23% of employed men. A third of those who are fully vaccinated against COVID-19 and have
received a booster shot say they are more concerned about being exposed to
the coronavirus at work than they were before omicron started to spread. A
quarter of those who are vaccinated but have not gotten a booster and just
10% of those who haven’t gotten any COVID-19 shots say the same. Fewer than half of workers are very
satisfied with the steps that have been taken in their workplace to keep them
safe from COVID-19 Most workers who are not exclusively working from home (77%) say they
are at least somewhat satisfied with the measures their workplace has put in
place to protect them from coronavirus exposure, but just 36% say they
are very satisfied.
These assessments vary considerably by race and ethnicity, income and
age.
As was the case earlier in the pandemic, White workers who are
spending time in their workplace (42%) are far more likely than Black (27%)
and Hispanic (26%) workers to say they are very satisfied with the measures
that have been put in place to protect them from being exposed to COVID-19 at
work. And while 44% of upper-income workers say they are very satisfied,
smaller shares of those with middle (36%) and lower (32%) incomes say the
same. Across age groups, those younger than 30 are the least likely to say
they are very satisfied with COVID-19 safety measures at their workplace,
while those ages 65 and older are the most likely to say this. A quarter of
workers ages 18 to 29 say they are very satisfied, compared with 35% of those
ages 30 to 49, 44% of those ages 50 to 64, and 53% of workers 65 and
older. Vaccination requirements don’t seem to be related to these views.
Some 39% of those whose employers have required employees to get a COVID-19
vaccine, and 35% of those in workplaces without a vaccination requirement say
they are very satisfied with the measures that have been put in place to
protect them from being exposed to the coronavirus. Most workers say their employer doesn’t
require COVID-19 vaccination
About one-in-five workers who are not working exclusively from home
(22%) say their employer has required employees to get a COVID-19 vaccine.
About three-quarters (77%) say their employer has not required vaccination
(47% say their employer has encouraged it and 30% say they have not). Workers with upper incomes (31%) are more likely than those with
middle (19%) and lower (23%) incomes to say their employer has required
employees to get a COVID-19 vaccine. Among workers with a postgraduate degree,
36% say their employer has a vaccination requirement, compared with 27% of
those with a bachelor’s degree, 22% of those with some college and an even
smaller share of those with a high school diploma or less education
(13%). Vaccination requirements are also more common in urban and suburban
areas than in rural communities. About a quarter of workers in cities (26%)
and suburbs (23%) say their employer requires employees to get the COVID-19
vaccine, compared with 16% in rural areas. Democrats and those who lean Democratic (27%) are more likely than
Republicans and Republican leaners (17%) to say their employer has required
COVID-19 vaccination. These differences remain even after accounting for
differences in education and income levels among these groups. About nine-in-ten workers who say their employer has required
employees to get a COVID-19 vaccine (92%) say they are fully vaccinated,
including 58% who say they have received a booster shot. A smaller share of
those who don’t have a vaccination requirement at work (65%) say they are
fully vaccinated, with 38% saying they have received a COVID-19 vaccine
booster. Most workers don’t think their employer
should require COVID-19 vaccination The survey also asked employed adults who are not working exclusively
from home what they think their employer should do when it comes to COVID-19 vaccinations,
regardless of what their employer is doing.
Three-in-ten say their employer should require the vaccine, while most (69%)
say their employer should not (including 39% who say their employer should
encourage but not require it and 30% who don’t think their employer should do
either). Somewhat similar shares of White, Black and Hispanic workers think
their employers should require employees to get a COVID-19 vaccine, but Black
workers are more likely than those who are Hispanic or White to say their
employer should encourage employees to get vaccinated (55% vs. 43% and 37%,
respectively).
Views on COVID-19 vaccination requirements vary widely along party lines.
Some 47% of Democrats and Democratic leaners who are not exclusively working
from home think their employer should require employees to get a vaccine,
compared with just 10% of Republican and Republican-leaning workers. In turn,
53% of Republicans say their employer should neither require nor encourage
employees to get vaccinated; only 10% of Democrats say the same. Among those who say they think their employer should require
employees to get the COVID-19 vaccine, 43% say their employer has, in fact, required
it; 41% say their employer has encouraged it but not required it, and 15% say
their employer has neither required nor encouraged vaccination. By contrast,
a majority of those who think their employer should encourage but not require
vaccination (64%) and those who say their employer should neither require nor
encourage it (61%) say what their employer is doing is in line with what they
personally think should be done. (PEW) FEBRUARY 16, 2022 730-43-17/Polls 58% Of U S Adults Say The Large Reduction Over The Past Several
Decades In The Percentage Of Workers Who Are Represented By Unions Has Been
Bad For The Country
Majorities of Americans continue to see the long-term decline in the
share of workers represented by unions as a bad thing for both the country
and working people in the United States, according to a Pew Research Center
survey conducted Jan. 10-17. How we did this
In the survey, 58% of U.S. adults say the large reduction over the
past several decades in the percentage of workers who are represented by
unions has been somewhat or very bad for the country, while 61% say this has
been bad for working people. The share of U.S. workers who belong to a union has fallen since
1983, when 20%
of American workers were union members. In 2021 10.3%
of U.S. workers were in a union. Views of the impact of the decline in union membership on the country
and working people have changed very little since last year. While there are modest demographic differences in these attitudes,
partisan differences are much more pronounced. Around seven-in-ten Democrats and Democratic-leaning independents say
the decline in the percentage of workers represented by unions in recent
decades has been very or somewhat bad for the country (71%), and a similar
share say it has been bad for working people (76%). Among Republicans and GOP
leaners, 40% say the decline of organized labor has been bad for the country
and 45% say it has been bad for working people. Among Republicans, there are sizable age, educational and income
divides in views about the impact of the decline of union membership. The
differences among Democrats are more modest.
Older Republicans are more likely than younger Republicans to view
the decline in union membership as good for
working people. Around six-in-ten Republicans ages 65 and older (62%) say the
decline of unions has been either very good or somewhat good for working
people. About four-in-ten Republicans under age 40 (41%) say the same. Upper-income Republicans (66%) are more likely than those in the
middle- (54%) and lower-income (44%) tiers to view the decline in union
membership as very or somewhat good for working people. Among Democrats, those without a college degree are 10 percentage
points more likely than those with a college degree to say that these changes
have been at least somewhat good for working people (27% vs. 17%). There are
only modest differences among Democrats by age and income. About half of White Republicans (52%) say the decline of union
membership has been at least somewhat good for working people. The sample
size for Black and Hispanic Republicans is too small to analyze. White Democrats (19%) are slightly less likely than Black (27%) or
Hispanic Democrats (29%) to say the decline in unionization has been good for
working people. While Republicans and Democrats overall differ greatly on whether
these shifts have been good for working people, ideological divides are
evident within both parties. A majority of conservative Republicans (59%) say the decline in
organized labor membership has been good for working people, including 20%
who say this has been very good.
In contrast, 39% of moderate and liberal Republicans say this has been at
least somewhat good for working people.
While large majorities of all Democrats say the decline in the
percentage of workers represented by unions has been bad for working people, liberal
Democrats (84%) are more likely to say this than conservative and moderate
Democrats (69%). Liberal Democrats are also much more likely to say the decline in
organized labor has been very bad
for working people: 49% say this, compared with 22% of conservative and
moderate Democrats. (PEW) FEBRUARY 18, 2022 730-43-18/Polls Nearly Seven In 10 Black Adults (69%) And Hispanic Adults (68%) Are
Very Or Somewhat Stressed About Contracting COVID-19
As the world faces the third year of the coronavirus pandemic, Black
and Hispanic Americans are significantly more worried than White Americans
about getting infected with COVID-19. Nearly seven in 10 Black adults (69%)
and Hispanic adults (68%) are very or somewhat stressed about contracting
COVID-19, compared with 57% of White adults, according to a survey by West
Health and Gallup. Americans' Levels of Stress About Getting Infected With COVID-19, by
Race/Ethnicity Over the past year, how stressed have you been about each of the
following? Getting infected with COVID-19
The survey was conducted by web Sept. 27-30 and Oct. 18-21 via the
nationally representative Gallup Panel. The survey was fielded during the
delta variant wave in the U.S. but prior to the omicron variant. During the
survey field periods, new case counts averaged about 110,000 per day in
September and 80,000 per day in October, compared with over 140,000 today.
The full study results can be found in the West Health-Gallup 2021 Healthcare in America
Report. Agreement Across Groups About Some Elements
of Healthcare, but Not All The West Health-Gallup study highlights continued disparities in access
to healthcare and in health outcomes in the U.S. Black Americans (8%) are
twice as likely as White Americans (4%) to say they know someone who has died
in the past year due to an inability to pay for treatment. At the same time, Americans across racial and ethnic groups agree
that healthcare is too expensive and that costs do not match the quality of
care. More than 90% of adults among each group say the general cost of care
is too high and that they pay too much for the quality of care they receive, and
about 70% indicate that healthcare costs are a financial burden for them.
Additionally, 51% of U.S. adults overall -- including 51% of White, 47% of
Black and 56% of Hispanic adults -- say the cost of healthcare causes them
daily stress. Americans' Perspectives on the Burden of Healthcare Costs, by
Race/Ethnicity
Importance of Cost When Deciding Whether to
Follow a Doctor's Recommendation Yet, differences between groups emerge on some key questions related
to healthcare quality and costs. Hispanic Americans (72%) and Black Americans
(70%) are more likely than White Americans (62%) to say that cost is an
important determinant in whether they follow their doctor's recommendation. Americans' Perceptions of the Importance of Cost When Deciding
Whether to Follow a Doctor's Recommendation, by Race/Ethnicity When considering a recommended procedure or medicine from your
doctor, how important is the cost in determining if you follow the recommendation?
A separate Gallup
Center on Black Voices survey shows that 32% of Hispanic Americans
and 30% of Black Americans say they faced a time in the past 12 months when they
could not pay for healthcare, compared with 23% of White Americans. In
addition, Black and Hispanic Americans (at 34% each) are more likely than
White Americans (28%) to say they could not afford quality healthcare today
if they needed it. The stress and uncertainty of the past two years have made Black and
Hispanic Americans especially worried about the consequences of a strained
healthcare system. Seventy-four percent of Black Americans and 68% of
Hispanic Americans say that because of the pandemic, they are now more
concerned about some Americans' unequal access to quality healthcare
services, while fewer White Americans agree (56%). Larger majorities of Black
Americans (77%) and Hispanic Americans (73%) express concern about fellow
Americans' wellbeing with respect to the COVID-19 pandemic, compared with 66%
of White Americans. Bottom Line According to the Centers for Disease Control and Prevention, Black
Americans are 2.5 times more likely than White Americans to be hospitalized
from COVID-19 and 1.7 times more likely to die from the disease. Similarly,
Hispanic Americans are 2.4 times more likely than White Americans to be
hospitalized from COVID-19 and 1.9 times more likely to die from it. Reports
from the U.S. Department of Health and Human Services also show that Hispanic
Americans and Black Americans are more likely than White Americans to be
uninsured, to receive lower-quality healthcare, and to have chronic health
problems such as diabetes and obesity. Although racial and ethnic health disparities are a long-standing
policy problem that existed before the COVID-19 pandemic, the West
Health-Gallup survey results suggest that the pandemic is underscoring such
disparities. (Gallup) FEBRUARY 18, 2022 Source: https://news.gallup.com/poll/389954/racial-ethnic-divide-views-pandemic-healthcare.aspx AUSTRALIA
730-43-19/Polls Abs Unemployment Figure Of 4.2% Hides Real Toll Of The ‘Omicron
Strain’ On Australia’s Employment Markets
The ABS this week announced Australia’s unemployment was unchanged
at 4.2%
for the month of January 2022. However, this figure hides the over
570,000 Australians who didn’t work in January who normally would. The ABS estimate for January counts as employed an additional 214,400
Australians who were working zero hours for ‘economic reasons’ or ‘other
reasons’ – such as being forced into isolation for being a close
contact of a confirmed case. In addition, the ABS
notes 449,900 workers worked zero hours due to illness, injury or sick leave
in January. This figure is nearly five times higher than the average for
January from 2016-2021 of 92,880 – a difference of 357,020. If these 571,400 non-workers (214,400 off work for economic and
social reasons and 357,020 higher than usual not working due to illness) are
added back the ABS unemployment estimate for December increases to 1,152,000
(8.3% of the workforce) – in line with Roy
Morgan’s unemployment estimate of 8.2%. The ABS also claims there are an additional 933,000 Australians (6.7%
of the workforce) under-employed for a total of 2.1 million unemployed or
under-employed (15.1% of the workforce). This figure is far closer to Roy
Morgan’s estimate of total unemployment and under-employment in Australia of
2.43 million Australians (16.6% of the workforce). The ABS
estimate of total hours worked in January 2022 also underscores the
full impact of the ‘Omicron strain’ on Australia’s employment market with
total hours worked in the month at 1,659.4 million hours – a drop of 159.4
million hours (-8.8%) on December 2021. Although the total hours worked
generally drops in January as Australians head on holiday, this was the
lowest total hours worked in the economy since April-May 2020 during the
initial nation-wide lockdown of over 25 million Australians. (Roy Morgan) February 17 2022 MULTICOUNTRY
STUDIES
730-43-20/Polls 50% People Across 26 Countries Support The Introduction Of Vaccine
Passports For Doing Indoor Exercise At A Gym
For the last two years, countries across the world have been under
scrutiny for their Covid-19 response. At the start of the pandemic, emphasis
was placed on locking down, restricting travel and isolating infected people
– but now, with a widely-available vaccine, many
countries are now adopting vaccine passports, issued to citizens who
are fully vaccinated and then required for people to do certain activities,
as a way to open up and ‘live with the virus’. Research by the
YouGov-Cambridge Globalism Project, carried out last summer (4 August –
21 September 2021) and covering more than 28,000 people across 26 countries,
reveals the varied levels of support for vaccine passports in various
settings across the world. Which countries have the highest levels of
support for vaccine passports? Out of 26 countries surveyed for the project, Australia had the
highest average support for vaccine passports across nine scenarios where
vaccine passports might be required. Australian support for making it
compulsory to show a vaccination certificate ranged from half (50%) who would
support vaccine passports for clothes shops to 75% who support vaccine
passports for travelling to or from Australia. Australia is only just about to
open up its borders to fully vaccinated travellers after
implementing strict travel restrictions for two years of Covid-19, including
at the time of this survey. Saudi Arabia, Turkey, Mexico and Brazil all also had high average
support for vaccine passports across the nine settings. At the other end of the scale, Poland, Hungary and Russia all had
less than 40% average support for vaccine passports in the nine settings we
asked about. Which settings should require a compulsory
vaccine passport? In almost all countries, travel (both to and from the country
surveyed) was the area which attracted the greatest amount of support for
introducing a compulsory vaccine passport, with an average of 63% (into the
country) and 61% (out of the country) across the 26 countries in our survey. Post-lockdowns, regulations for international travel have tended to
be stricter than domestic ones, with many countries requiring either proof of
vaccination or a negative test, or both. Support for vaccine passports for
travel into the country was highest in Kenya (76%), and for travel out of the
country, Australians had the highest support (75%). In no country did fewer than half of their citizens support requiring
proof of vaccination for travel into the country, although for travel out of
the country, Russia stands out as the only country surveyed which had
significantly under half supporting a vaccine passport, at 45%. In fact, Russia had the lowest levels of support across all settings
we asked about, ranging from just 19% of Russians who would support
introducing a vaccine passport to shop in supermarkets to 51% who support
compulsory vaccine certification for travel into the country. Russia opened
its borders to travellers on 4 September 2021, while fieldwork for this
survey was being carried out, requiring
a negative PCR test to enter, but not proof of vaccination.
In terms of other places where vaccine passports could conceivably be
introduced (or are already being used in some countries), there is high
average support (56%) across the countries surveyed for requiring people to
show a vaccination passport to attend large public events, like sporting
matches or concerts. The UK introduced this policy in England in December
last year, requiring attendees of large events to show
their Covid pass in order to enter, but lifted it soon
afterwards. The introduction of vaccine passports for doing indoor exercise at a
gym (50% average support across 26 countries), eating in restaurants (47%
average), going to bars or cafes (47% average) or travelling on public
transport (46% average) had middling support, while shopping in supermarkets
and in clothes shops were at the bottom of our list, both with 41% average
support. (YouGov UK) February 17, 2022 730-43-21/Polls Ipsos’ Global Consumer Confidence Index This Month Reads At 48.7,
Unchanged From Last Month; Survey Conducted In 24 Countries
Ipsos’ Global Consumer Confidence Index this month reads at 48.7, unchanged
from last month and exactly as it read in January 2020 before the Covid-19
pandemic. The Global Consumer Confidence Index is the average of 24 countries’
National Indices. It is based on a monthly survey of more than 17,500 adults
under the age of 75 conducted on Ipsos’ Global Advisor
online platform. This survey was fielded between January 21, 2022 and
February 4, 2022. Only two of the countries show any significant month-over-month
change in their National Index score (at least +/- 1.5 points): Russia (+1.5
since January) and Japan (-2.6). Globally, the Jobs, Investment, and Expectations sub-indices trend
similarly. All three are showing little change from last month and remain at
levels on par with their January 2020 readings. National Index Trends February marks another month of remarkable stability for the Global
Consumer Confidence Index as it has remained within the same one-point range
since July 2021.
Jobs, Expectations, and Investment Index
Trends At a global level, all three sub-indices have hardly changed since
last month (Jobs +0.2, Expectations -0.2, Investment +0.0). Russia is the
only country to show significant gains (at least + 1.5 points) from last
month across all three sub-indices and Japan is the only one to post
significant losses across all three.
Visit our interactive portal, Consolidated
Economic Indicators for graphic comparisons and trended data
pertaining to the Ipsos Global Consumer Confidence Index and sub-indices—and
all the questions on which they are based. (Ipsos Australia) 18 February 2022 Source: https://www.ipsos.com/en-au/global-consumer-confidence-index-february-2022 730-43-22/Polls Corporate Social Responsibility And The Influence On Purchase
Decisions; Views And Beliefs Of Citizens From 39 Countries Across The Globe
WIN International, the world’s leading association in market research
and polling has published the Annual Win World Survey (WWS – 2021) exploring
the views and beliefs of 33236 individuals among citizens from 39 countries
across the globe about Corporate
Social Responsibility, what do people know about this concept, its
importance and influence on their daily purchases. HEADLINES General knowledge about CSR The awareness about Corporative Social Responsibility among
interviewed people was equally distributed between positive and negative
answers: while 48% already heard about
the concept, 42% of the group did not; 10% didn’t answer the
question or didn’t know. Even when looking at age groups and gender, data are equally
distributed between those who know about CSR and those who don’t, while some
differences can be found when looking at global regions. On one hand, in Europe and APAC there are more people who are aware
of the concept than people who are not. In America as well, but
the difference is of less than one percent. On the other hand, respondents in MENA region are less aware about CSR,
with 60% of people not knowing what CSR stands for over 35% who do know. Across the world, the higher
the level of education, the more people know about Corporate Social
Responsibility. When it comes to employment, people who work full
time, students and retired people tend to know more about CSR, while part –
time workers and unemployed or housewives are less aware about the concept. Efforts to embrace and promote CSR When thinking about the real efforts to embrace and promote
CSR, 39% tends to believe that
companies are not seriously doing it, and that the actions in
place are only made for appearance, followed by 25% who believes most companies do not care at all
about CSR. Results highlight how negative the opinions towards the
efforts put in place by companies are, with the majority of people affirming
that corporates seem to have little interest in sustainability and eco –
friendly habits. However, there is also a share of people who tend to be more
optimistic: 19% say most companies are
seriously operating with corporate social responsibility and sustainability,
a share that reaches 31% in APAC region. Most critical opinions can be found
in Europe, where 48% say companies only talk about CSR for appearance (+9%
than global average) and MENA, where 35% say companies do not care at all
(+10% compared to global average). Among higher educated people there are more respondents believing
that companies are seriously operating with CSR, but the conviction that ‘it
is only appearance’ still prevails. Within the countries that were included in the present research, the
option “most companies are seriously operating with CSR and sustainability”
got its highest percentages in APAC countries. Nevertheless, the opinions
about companies being careless about CSR are the ones that predominate almost
in every country. The importance of being aware of actions
taken by companies/brands When asked about the
importance of being aware of the socially responsible behaviors of
companies/brands that they are customers of, most people (70%) consider it
important, while only 24% do not think it is relevant[1].
When looking at occupations, the ones that are more conscious about the
importance of being aware of the actions undertaken by companies are
students, full-time workers and retired people. In addition, the higher
education level, the more important being aware of CSR practices is.
The influence of CSR Finally, the results related to the influence of Corporate Social
Responsibility on purchase decisions provide some more interesting insights:
on a global level, 62% say socially
responsible behaviors of companies influences their purchase decisions,
while 31% say they do not[2],
meaning that people are increasingly more paying attention to companies’
ethical conducts and social role. Results reflect the same distribution when comparing data between
regions and gender, while an indirect relationship can be found when looking
at age: older people tend to be less influenced by CSR and companies’ ethical
conducts when it comes to their purchases. Vilma Scarpino, President of WIN
International Association, said: “Corporate Social Responsibility is an increasingly more important
subject, which however is not widely known yet: indeed, there is still a
large share of the population who does not know what CSR stands for, which
means that efforts in terms of communication and awareness need to be
undertaken. Respondents are also skeptical about companies’ commitment to
sustainable goals, which stresses ones again the need for companies to
increase awareness on one hand, and trust and transparency on the other. On the other hand, individuals not only believe that being aware of
companies’ CSR commitments is important for them as consumers, but they also
believe a company’s conduct directly influences their purchase decisions. (WIN) 18 Feb 2022 |
||||||||||||||||||||||||||||||||||||||||||||||||||||||||||||||||||||||||||||||||||||||||||||||||||||||||||||||||||||||||||||||||||||||||||||||||||||||||||||||||||||||||||||||||||||||||||||||||||||