|
BUSINESS & POLITICS IN THE WORLD GLOBAL OPINION REPORT NO. 732-734 Week:
February 28 –March 20, 2022 Presentation:
March 25, 2022 Inside
Afghanistan: Record Numbers Struggle to Afford Basics UAE
Parents Have High Concerns over Their Child’s Exposure To Inappropriate
Online Content Health
Insurance Coverage for Nigerians Still Abysmal; An Urgent Call For New
Strategy. Labour
Voters More Wary about Politics of Child’s Spouse Most
Brits Expect Recession, As Consumer Confidence Dips To Six-Year Low Half
of Leave Voters Doubt Johnson Can Secure New Brexit Deal Few
Believe the Government's Explanation of Why Parliament Is To Be Suspended Brits
Oppose Parliament Suspension By 47% to 27% 5
Facts about the Abortion Debate In America U.S.
Concern about Climate Change Is Rising, But Mainly Among Democrats Most
Americans Say Science Has Brought Benefits to Society and Expect More to Come Parents'
Concern about School Safety Remains Elevated As
Labor Day Turns 125, Union Approval Near 50-Year High Americans'
Satisfaction with U.S. Education at 15-Year High Most
Cannabis Consumers Use on a Weekly Basis or More Ride-Sharing
App Uber Overtakes Taxis as Preferred Private Transport Service Rising
Numbers of Australians Looking At Electric and Hybrid Vehicles for Their Next
Set of Wheels Toyota
And Mazda Drivers Most Brand Loyal; Have The Luxury Brands Lost Their Lustre? Britons
Make Worst Tourists, Say Britons (And Spaniards And Germans) Brazilians
Least Satisfied in Amazon With Environment India
Ranks 9th on Happiness among 28 Global Markets: Ipsos Global Happiness Survey The
Biggest Beauty Influencer Isn’t Who You Think It Is INTRODUCTORY NOTE 732-734-43-65/Commentary: Rising
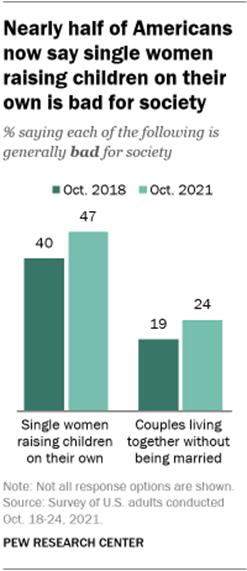
Share Of Americans See Women Raising Children On Their Own, Cohabitation As
Bad For Society
Americans
are more likely than they were three years ago to say single women raising
children on their own and couples living together without being married are
bad for society, according to a Pew Research Center survey conducted in
October 2021. On both, the change has occurred more among Republicans and
those who lean toward the Republican Party than Democrats and Democratic
leaners. Views on these family arrangements vary across many demographic
lines.
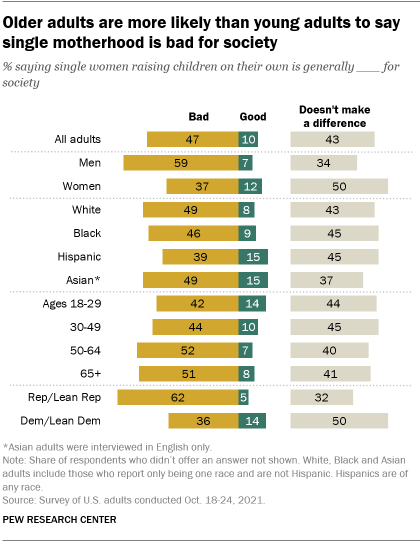
Some 47% of
U.S. adults say single women raising children on their own is generally a bad
thing for society, an increase of 7 percentage points from the 40% who said
the same in a 2018 Center survey. A smaller share (43%) says it doesn’t make
a difference, and just 10% of adults say it is good for society. The share of
births to unmarried women has remained relatively
stable over the past decade, after increasing
steadily from 1980 to around 2009. In 2020,
that share was 41%, about double the percentage from 40 years ago. Views on
single motherhood differ somewhat by race and ethnicity. About half of White
and Asian adults (49% each) say single women raising children alone is bad
for society, compared with a smaller share of Hispanic adults (39%). Some 46%
of Black adults say the same. Since 2018, White adults have had the largest
increase in the share saying this is bad for society – up 8 points from 41%.
Among Black and Hispanic adults, the shares saying single women raising
children on their own is bad for society didn’t change significantly from
2018. The sample size for Asian adults in 2018 was not large enough to
analyze separately.
Gender is
strongly related to perspectives on single women raising children alone. A
majority of men (59%) say single motherhood is bad for society, compared with
37% of women. In contrast, women are more likely than men to say women
raising children on their own generally doesn’t make much of a difference for
society (50% of women vs. 34% of men). However, the share of both men and
women saying this is bad for society has increased since 2018 (up 9 points
for men and 7 points for women). There are
also significant differences in these views across age groups. About half of
adults ages 50 and older say single motherhood is bad for society, compared
with 42% of those younger than 30 and 44% of 30- to 49-year-olds. Along party
lines, about six-in-ten Republicans and Republican leaners (62%) say single
women raising children alone is bad for society, up from 53% in 2018. In
contrast, 36% of Democrats and Democratic leaners say this is bad for
society, up 6 points from three years ago. Within each party, there are
differences by gender. About three-quarters of Republican men (73%) say
single women raising children on their own is bad for society, compared with
half of Republican women. Among Democrats, 45% of men say this is generally
bad for society; only 28% of Democratic women say the same. When it
comes to views on cohabitation, Americans are more likely than they were in
2018 to say that couples living together without being married is bad for
society, even as cohabitation
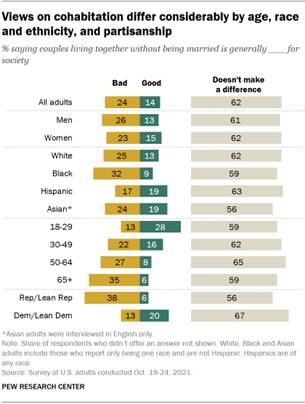
is on the rise. Roughly a quarter of U.S. adults (24%)
now say that couples living together without being married is generally bad
for society, up 5 points from three years ago. A smaller share says it is
good for society (14%). Still, a majority of Americans (62%) say it doesn’t
make much of a difference.
Views on
cohabitation differ by race and ethnicity, gender, age and political
affiliation. About one-third of Black adults say couples living together
without being married is bad for society (32%), compared with about a quarter
of White (25%) and Asian (24%) adults and 17% of Hispanic adults. Since 2018,
opinions shifted the most among Black adults, with an increase of 8
percentage points in the share saying cohabitation is bad for society. White
adults had a smaller increase of 5 points, while views didn’t change
significantly among Hispanic adults. The sample size for Asian adults in 2018
was not large enough to analyze separately. There are
modest differences in views by gender. Women are less likely than men to say
cohabitation is bad for society (23% of women vs. 26% of men). This has
changed from 2018, when equal shares of men and women (19% each) thought it
was bad for society. There are
also large differences across age groups. Young adults ages 18 to 29 are
the least likely to
say couples living together without being married is bad for society (13% say
this), while 28% say it is good for society. About one-in-five adults ages 30
to 49 (22%) say cohabitation is bad for society, and roughly a quarter of
adults 50 to 64 (27%) say the same. Among those 65 and older, 35% say
cohabitation is bad for society, while a mere 6% say it is generally good.
Along party
lines, Republicans and Republican leaners are more likely to say cohabitation
is a bad thing for society than a good thing. Some 38% of Republicans say it
is bad for society, and only 6% say it is a good thing. Democrats and
Democratic leaners, on the other hand, are more likely to say it is good
rather than bad. One-in-five Democrats say cohabitation is good for society,
while 13% say it is generally bad. More than half in each party say it
doesn’t make much of a difference. While opinions are largely unchanged since
2018 among Democrats, Republicans are more likely now than in 2018 to say it
is bad for society (30% of Republicans said so in 2018). (PEW) 732-734-43-66/Country Profile:
SUMMARY
OF POLLS
ASIA (Japan) 40%
Of Municipalities Not Gearing Up To Handle Calamity; Japan Earthquake Nearly 40 percent of municipalities remain
woefully underprepared to grapple with the prospect of widespread
reconstruction from a natural disaster, according to a survey by
the Ministry of Land, Infrastructure, Transport and Tourism. The central
government is pushing local authorities to develop reconstruction strategies
before disaster strikes, citing the experience of towns, cities and villages
in northeastern Japan devastated by the magnitude-9.0 Great East Japan
Earthquake and tsunami 11 years ago. (Asahi Shimbun) March 2, 2022 (South
Korea) South Koreans Vote For President In Tight, Bitter Election South Koreans were voting for a new
president Wednesday, with an outspoken liberal ruling party candidate and a
conservative former prosecutor considered the favorites in a tight race that
has aggravated domestic divisions. Pre-election surveys showed liberal Lee
Jae-myung, a former governor of South Korea’s most populous Gyeonggi
province, and his main conservative challenger, ex-prosecutor general Yoon
Suk Yeol, with neck-and-neck support, way ahead of 10 other contenders. The
winner will take office in May and serve a single five-year term as leader of
the world’s 10th-largest economy. (Asahi Shimbun) March 9, 2022 (Turkey) 7 Out Of 10 Women Cannot Participate In Working Life
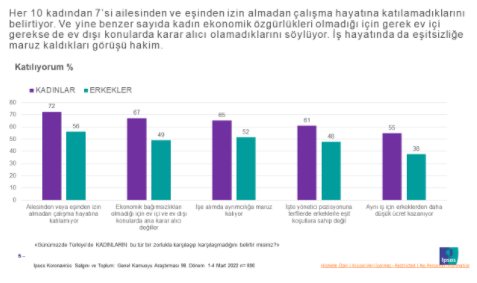
Without Getting Permission From Their Husbands Even today, 7 out of 10 women say that they
cannot participate in working life without the permission of their husbands
and family, and because they do not have economic independence, they cannot
be decision-makers both inside and outside the home. In addition, the opinion
that women are exposed to discrimination in business life is a very dominant
opinion. 65% of women think they are discriminated against at work, do not
have equal rights to promotions and 55% think they are paid less than men for
the same job. Although the participation rate of men in these issues is
lower, in general, half of the men have a similar opinion with women. (Ipsos Turkey) 7 March 2022 67% Of Turkish People Express That They Will Continue To
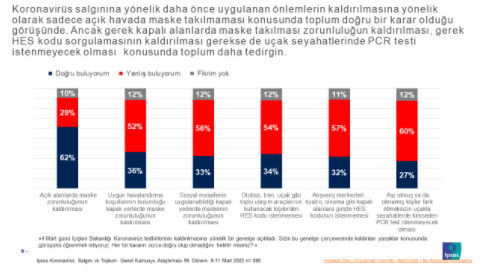
Wear Masks No Matter What Happens Indoors While 6 out of 10 people evaluate the
decision to remove the obligation to wear masks in open areas as correct,
removing the mask requirement in closed areas when social distance or
ventilation is sufficient is considered a wrong decision by more than half of
the society. And 67% of individuals say that they already wear masks in
closed places and will continue to wear them. However, the rate of those who
do not wear masks or who say they will no longer wear masks is not low. 1 out
of every 4 people states that they will not wear a mask in such places. Only
1/3 of the society thinks that the HEPP code will not be requested both when
entering closed areas and for travels such as buses and planes, only 1/3 of
the society is the right decision. (Ipsos Turkey) 15 March 2022 (Singapore) More
Than Half (52%) Of Celebrity-Influenced Buyers Prefer Making Purchases Over
The Web Than In Physical Stores In Singapore Latest data from YouGov Profiles suggest that celebrity endorsements
can encourage greater e-commerce spending in Singapore. Celebrity-influenced
buyers – consumers who agree that celebrity endorsements have an effect on
the things they buy – are more likely to prefer shopping online than the
average consumer in Singapore. While slightly more than half (52%) of
celebrity-influenced buyers prefer making purchases over the web than in
physical stores, just over one-third (35%) of Singapore consumers in general
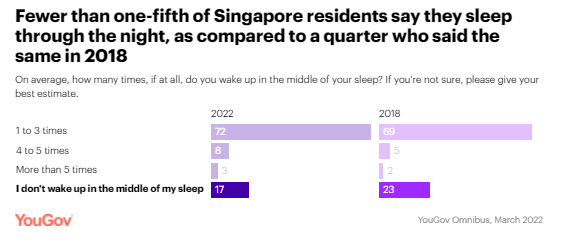
prefer buying things online than offline. (YouGov Singapore) Singaporeans would like to sleep for at least seven hours
but only a quarter have that routine YouGov’s latest survey reveals only one in
four people in Singapore (27%) have an ideal sleep cycle (of 7 hours or
more). It is most common for Singaporeans to get six to seven hours of
sleep a night (39%), followed by four to six hours (32%). Residents also
generally sleep less than they would like – a substantial eight in ten (80%),
wish they had seven or more hours of sleep on the daily, but only a quarter
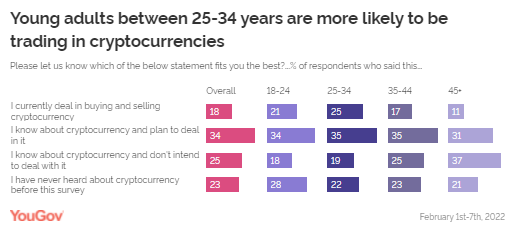
(27%) actually do. (YouGov Singapore) MENA (KSA) A
Majority Of KSA Residents Are Aware Of Cryptocurrencies, But Only A Few
Invest In Them YouGov's latest survey shows that digital
banking has become increasingly popular in Saudi Arabia, with nine out of ten
respondents (91%) saying they prefer banking online. In addition to this, 86%
of respondents have even shown an intent to switch to digital-only banking
methods in the future. Digitization has not just revolutionised banking but
also facilitated the growth of digital currencies. Over the last few years,
the cryptocurrency market has rapidly expanded. Data shows that in Saudi
Arabia, cryptocurrency has as an asset class has generated a fair amount of
awareness, and more than three-quarters of residents (77%) claim to be aware
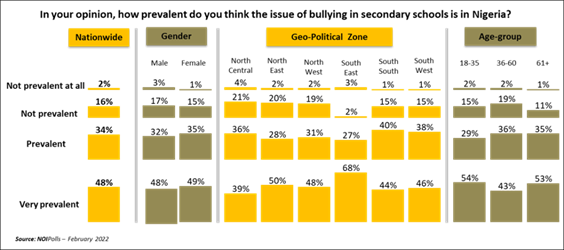
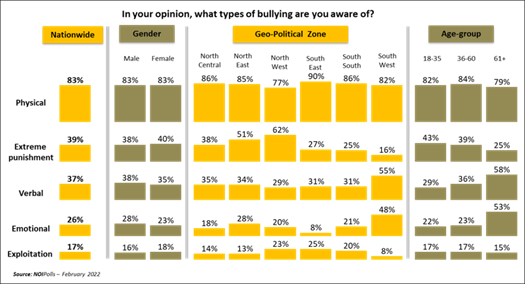
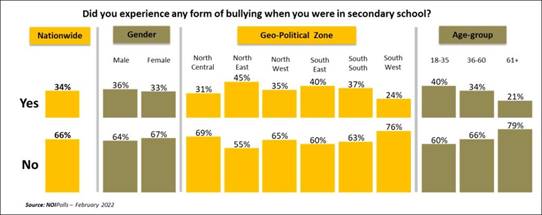
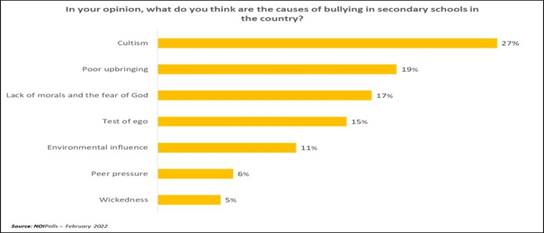
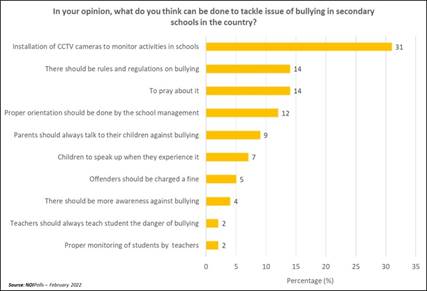
of it. (YouGov MENA) AFRICA (Nigeria) Over 3 In 10 Nigerians Have Experienced Bullying In
Secondary School A new public opinion poll conducted by
NOIPolls has revealed that 34 percent of adult Nigerians have disclosed that
they experienced some form of bullying during their secondary school days.
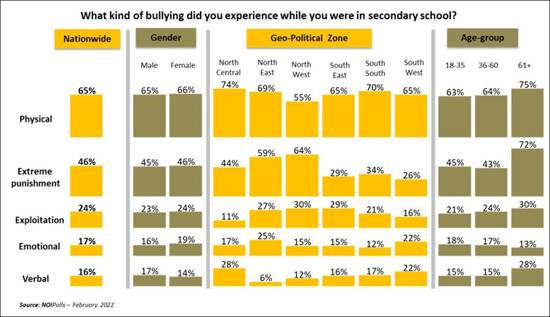
More findings from the poll revealed that physical (65 percent), extreme punishment
(46 percent) and exploitation (24 percent) are the top three forms of
bullying mostly experienced in various secondary schools across the country. (NOI Polls) March 3, 2022 82% Nigerians See Discrimination Against Women A new public opinion poll conducted by
NOIPolls has revealed that there is discrimination against women in Nigeria
as stated by 82 percent of adult Nigerians. Additionally, analysis by
geographical locations indicates that the North-East zone had more
respondents (89 percent) who made this assertion. Similarly, there are more
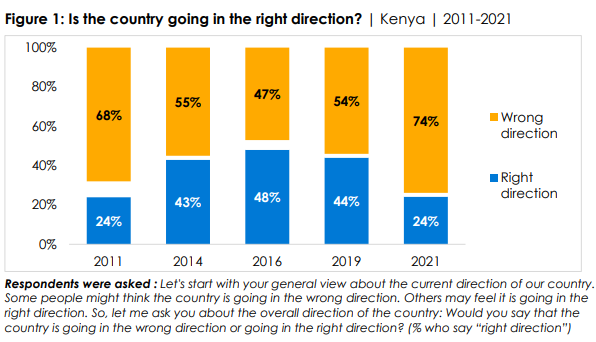
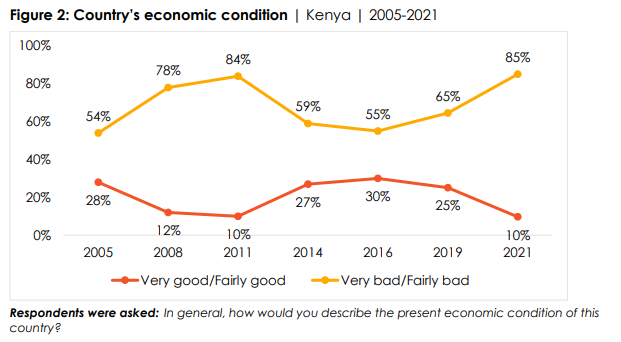
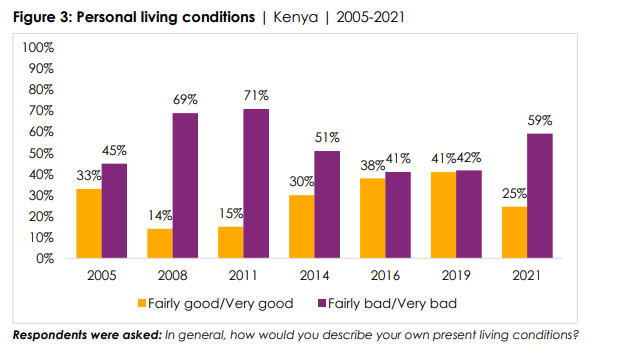
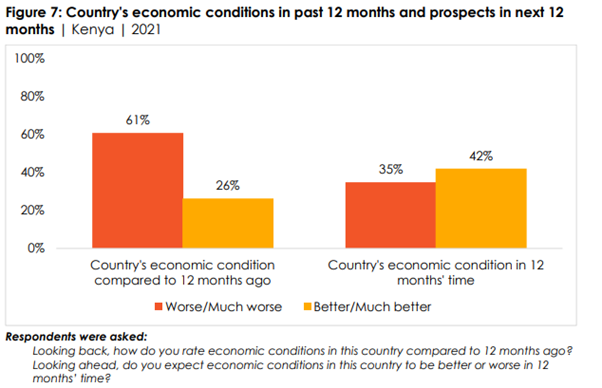
female (86 percent) than male (78 percent) respondents in this category. (NOI Polls) March 8, 2022 (Kenya) Three-Fourths
(74%) Of Kenyans Say The Country Is Going In The Wrong Direction Three-fourths (74%) of Kenyans say the
country is going in “the wrong direction,” a 20- percentage-point increase
compared to 2019 (54%). Almost nine out of 10 citizens (85%) describe the
country’s economic condition as “fairly bad” or “very bad,” a 30-point
increase since 2016 (55%). Only one in four Kenyans (25%) describe their
personal living conditions as “fairly good” or “very good,” a 16-point
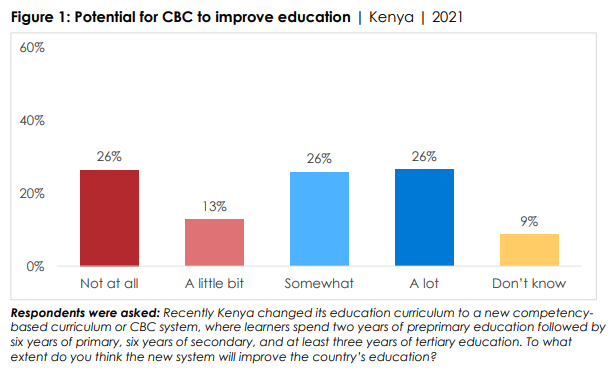
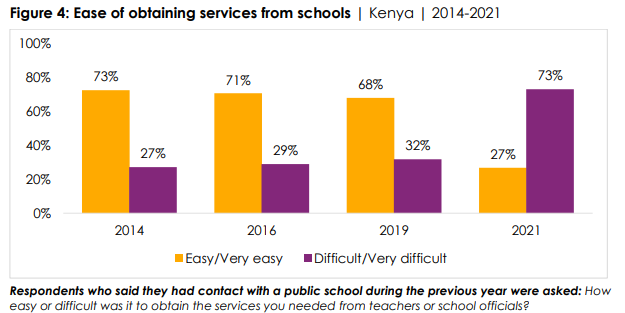
decline compared to 2019 (41%). (Afrobarometer) 2 March 2022 Majority Of Kenyans Say Competency-Based
Curriculum Will Improve Quality Of Education Two-thirds of Kenyans believe that the new
competency-based curriculum or CBC system will improve education in the
country at least “a little bit,” a new Afrobarometer survey shows. More than
half (52%) of Kenyans believe that the new competency-based curriculum or CBC
system will improve education in the country “somewhat” or “a lot,” in
addition to 13% who think it will help “a little bit.” Only one in four (26%)
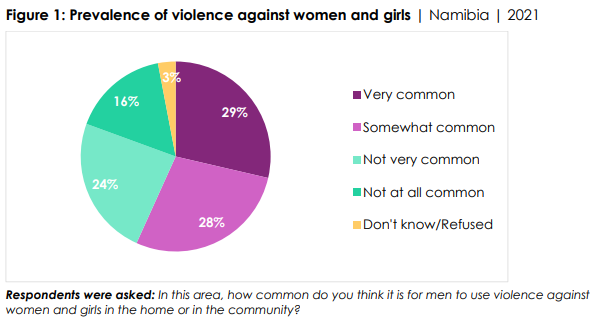
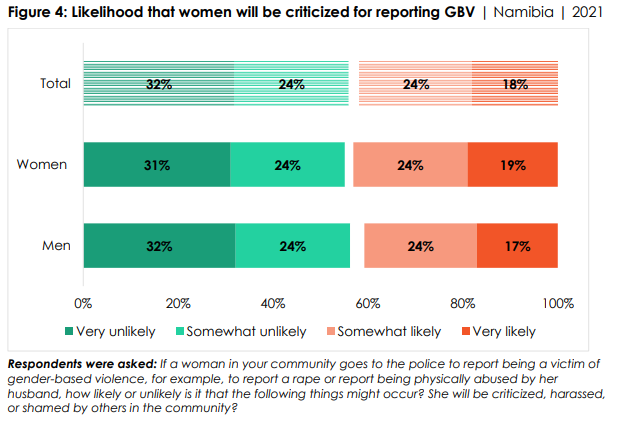
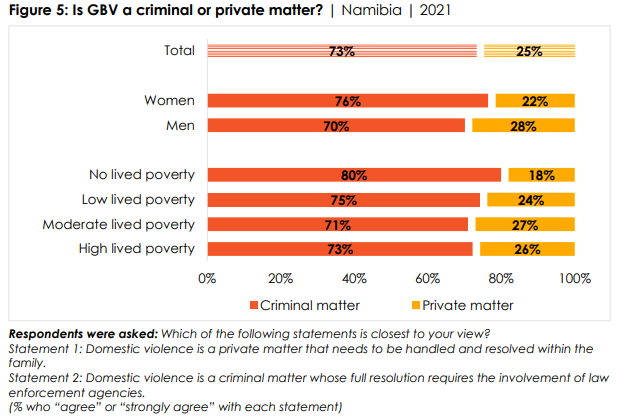
say the CBC system will do nothing to improve education. (Afrobarometer) 09 March 2022 (Namibia) Nearly Six In 10 Namibians (57%) Report That In Their Area,
It Is Either Very Common (29%) Or Somewhat Common (28%) For Men To Use
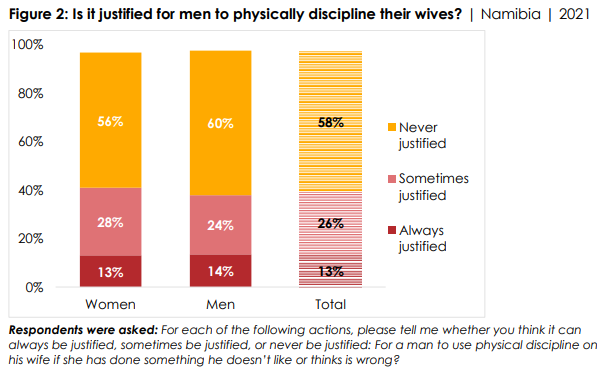
Violence Against Women A majority of Namibians believe that
violence against women and girls is common in their homes and communities,
the most recent Afrobarometer survey shows. While more than half believe that
men are never justified in physically disciplining their wives, about four in
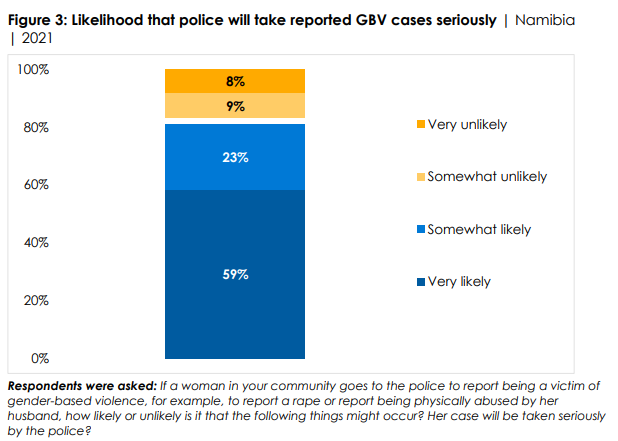
10 say this can be justified at least some of the time. Most citizens believe
that the police take reported cases of gender-based violence seriously, but
many report that community members will criticize or harass the complainant
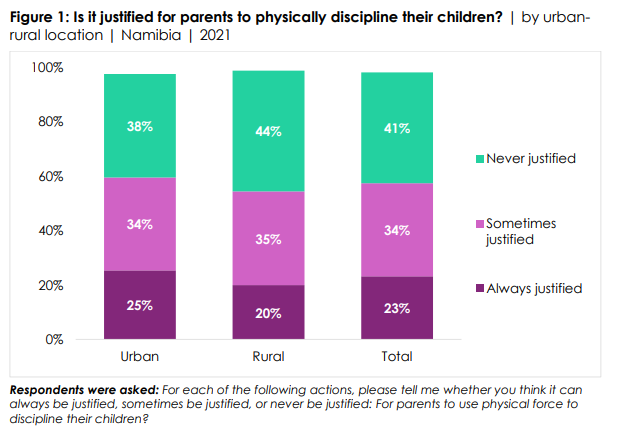
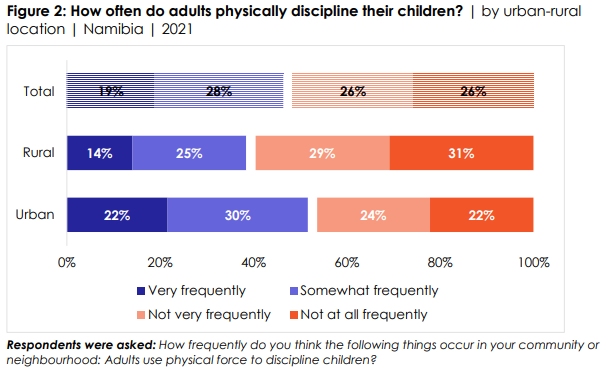
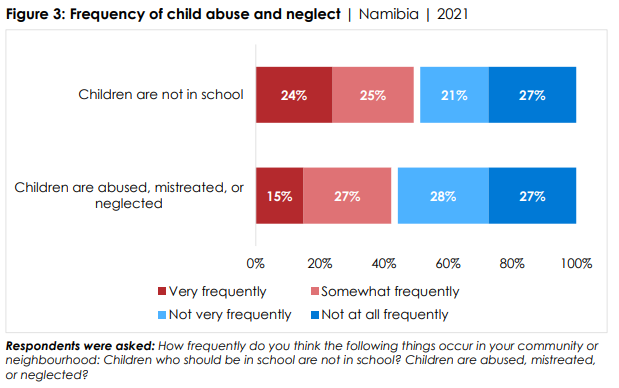
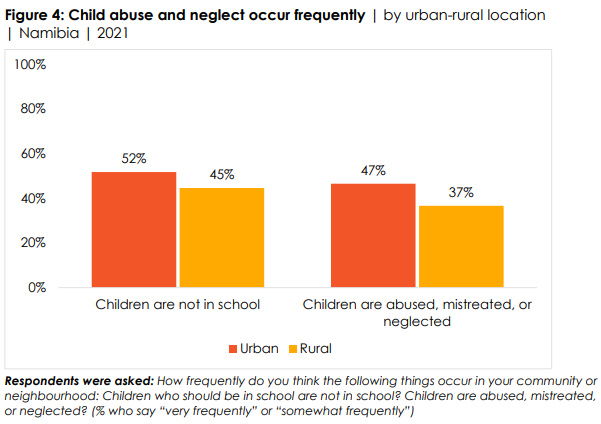
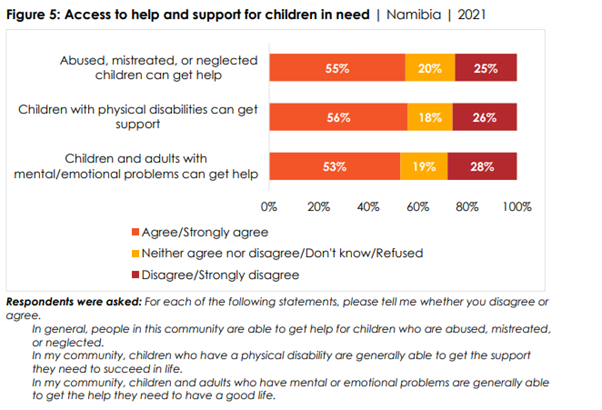
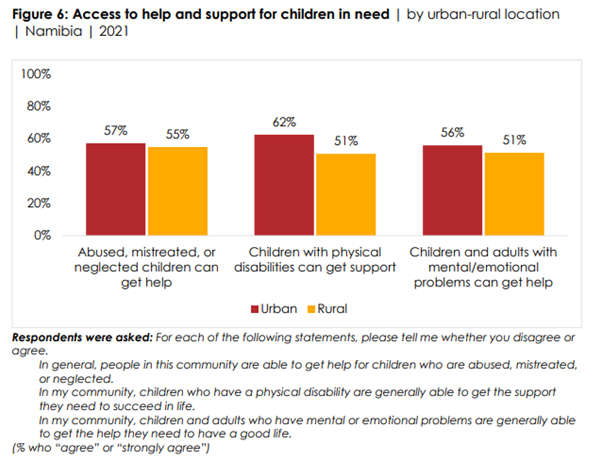
for seeking help from the police. (Afrobarometer) 7 March 2022 More Than Half Of Namibians (57%) Believe That It Is Either
Always Justified (23%) Or Sometimes Justified (34%) For Parents To Discipline
Their Children Using Physical Force More than half of Namibians believe parents
are justified in using physical force to discipline their children, at least
on some occasions, a recent Afrobarometer survey indicates. Four in 10 say
the practice is never justified. Views are similarly divided on other aspects
of child well-being, with four in 10 citizens reporting that child abuse and
neglect are widespread in their communities and half saying school-age
children are frequently not attending school. But a majority of Namibians are
confident that people in their communities can secure help for abused,
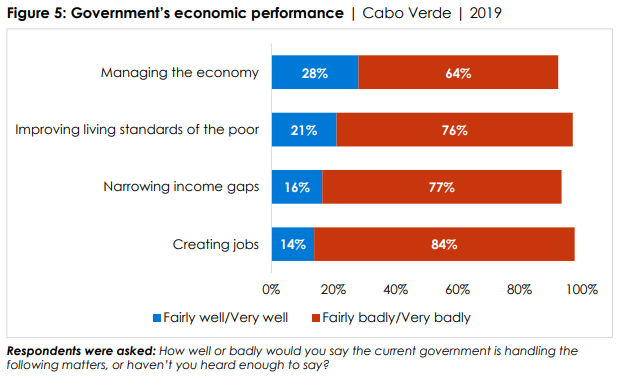
mistreated, or neglected children. (Afrobarometer) 10 March 2022 (Cabo
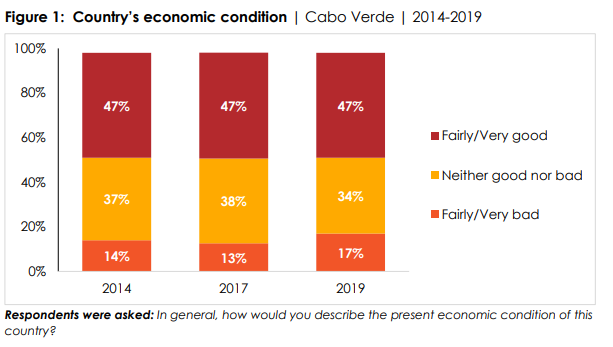
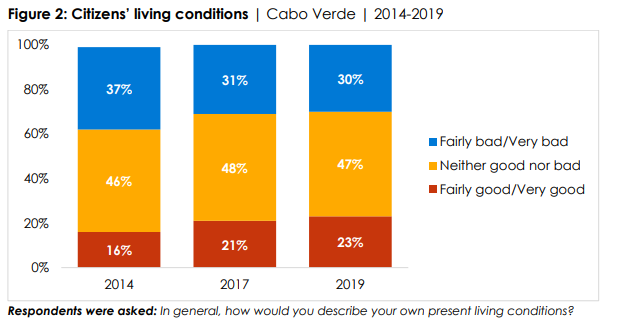
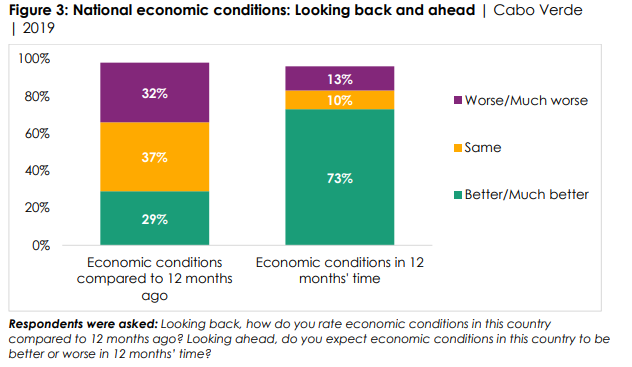
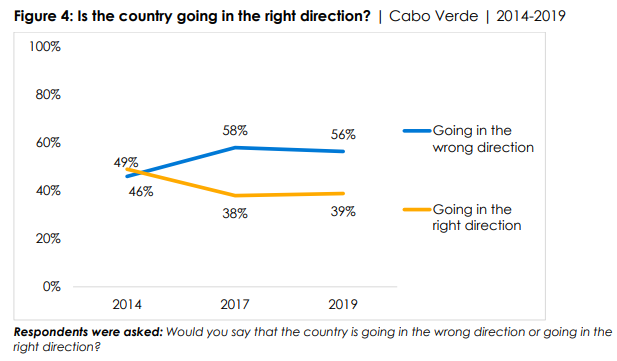
Verde) Three-Fourths (73%) Of Cabo Verdeans Are Optimistic That
Things Will Be Better Or Much Better In 12 Months’ Time Cabo Verdeans offered a fairly gloomy
assessment of their country’s economic situation, but most expected things to
improve, according to an Afrobarometer survey. The survey, in late 2019,
found that few citizens thought economic conditions had improved over the
previous year, and only a minority described their personal living conditions
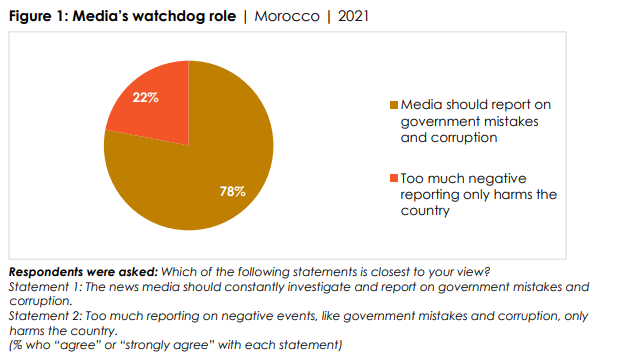
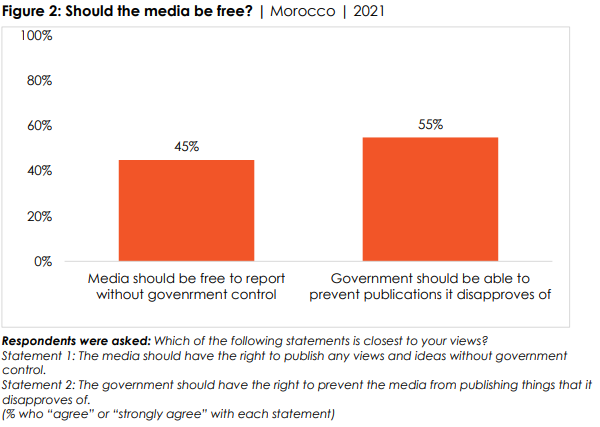
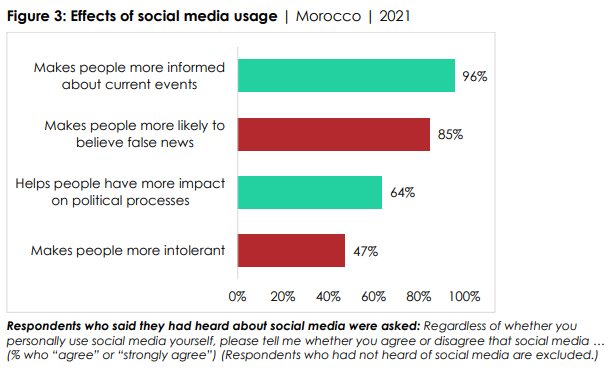
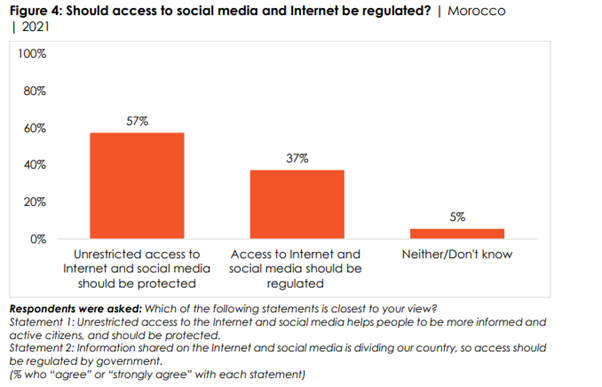
as good. A majority said the country was going in “the wrong direction.” (Afrobarometer) 9 March 2022 (Morocco) More Than Three-Fourths (78%) Of Moroccans Say The Media
Should Constantly Investigate And Report On Government Mistakes And
Corruption More than three-fourths (78%) of Moroccans
say the media should “constantly investigate and report on government
mistakes and corruption”. But fewer than half (45%) insist on media freedom,
while 55% endorse the government’s right to prevent the publication of things
it disapproves of. Among Moroccans who have heard of social media, majorities
say it makes people more informed about current events (96%) and helps them
have more impact on political processes (64%), but also makes them more
likely to believe false news (85%). (Afrobarometer) 14 March 2022 WEST
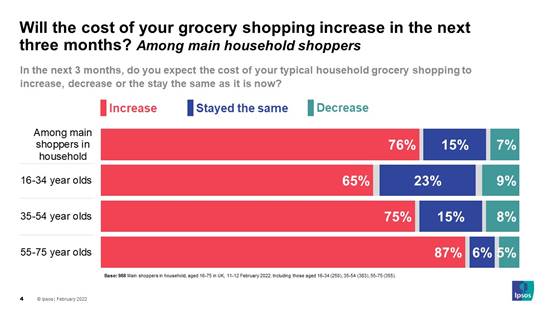
EUROPE (UK) 7 In 10 Are Already Seeing An Increase To Their Typical
Household Grocery Bill Around 4 in 10 (39%) shoppers are finding
it difficult to afford the increase in their grocery bills in 2022 compared
to 2021. More than 8 in 10 (85%) UK shoppers are changing how they shop to
reduce grocery bills in 2022. 18% of shoppers have changed their regular
supermarket to cover the increase of their grocery shop as ALDI becomes the
most popular destination for those looking to cut costs. (Ipsos MORI) 2 March 2022 9 In 10 Brits Are Following The News Closely, And Concerned
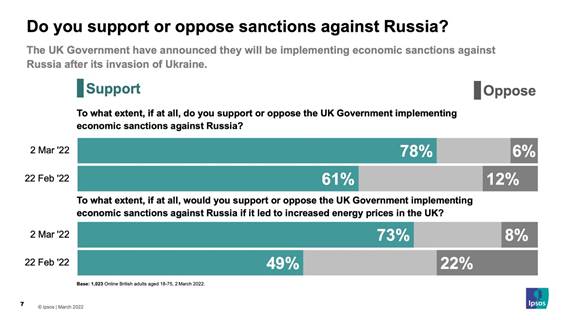
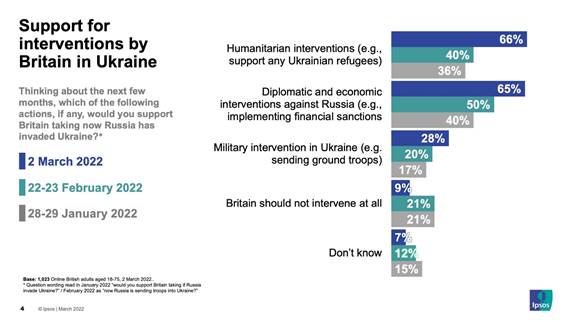
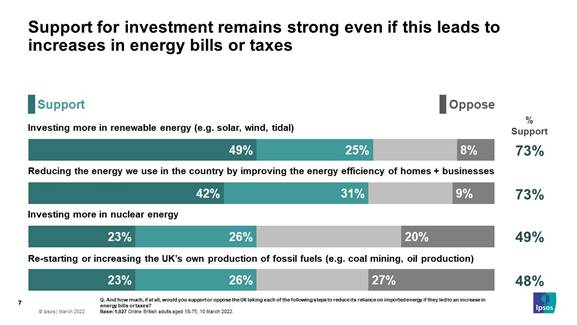
About The Impact On The UK Economy And Security On Ukrainian Civilians NEW polling by Ipsos finds an increase in
support for the UK Government implementing economic sanctions against Russia,
now at 78% compared to 61% in late February, immediately before the
invasion. Support for economic sanctions has hardened even if it leads
to increased energy prices, from 49% in in late February, to 73% in this
latest poll. Two thirds (66%) of people support humanitarian interventions by
Britain, up by 26 percentage points since February and less than 1 in 10
think we shouldn’t get involved, down from 2 in 10. While support for
military interventions remains lower than humanitarian, diplomatic and
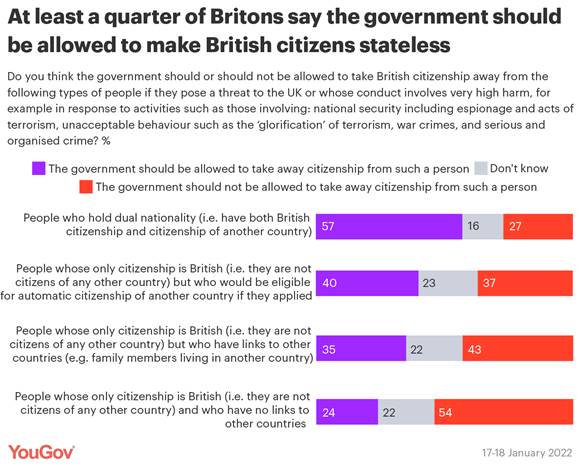
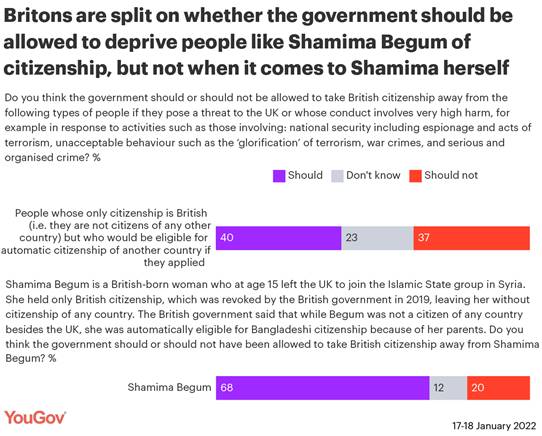
economic action, it has also risen slightly, by 8 percentage points, to 28%. (Ipsos MORI) 3 March 2022 A Quarter (24%) Think That The Government
Should Be Allowed To Make A British Person Entirely Stateless By 57% to 27%, Britons say the government
should be allowed to take away British citizenship in these circumstances
from dual nationals – that is, people who have citizenship of another country
– with 16% unsure. Two in five (40%) say they should be allowed to take citizenship
away from someone whose only citizenship is British, but who would be
eligible for automatic citizenship of another country if they applied, with
37% saying this should not be allowed. Some countries grant automatic
citizenship to people whose parents are citizens of that country, but this is
fairly rare. (YouGov UK) March 07, 2022 Nearly Six Out Of Ten Women (58%) Say
Caring Responsibilities Have Stopped Them Applying For Promotion Or A New Job Nearly six out of ten women (58%) say
caring responsibilities have stopped them applying for promotion or a new
job, and one in five (19%) have left a job because it was too hard to balance
work and care, according to wide-ranging research by Ipsos and Business in the Community (BITC). Whilst 35% of all adults, and
44% per cent of working adults, have caring responsibilities, the research
found that they are not spread equally. Women account for 85% of sole carers
for children and 65% of sole carers for older adults. More people from ethnic
minority backgrounds (42%) have caring responsibilities than from white
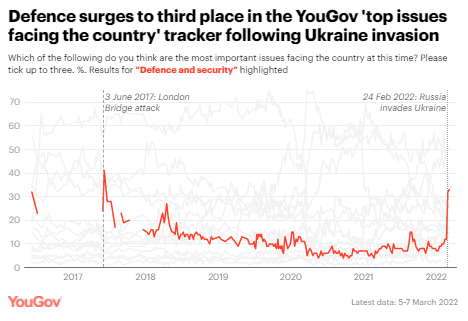
backgrounds. (Ipsos MORI) 7 March 2022 Defence Surges To Third Most Important
Issue Facing The UK With all eyes turned east following the
Russian invasion of Ukraine, “defence and security” has shot up the rankings
in for YouGov’s ‘top issues facing the country’ tracker. Currently, 33% of Britons say
defence is one of the top issues facing the country, about the same who say
“health” (35%), although still a long way off from “the economy” (50%).The
shift took place last week, when concern surged to 32% from 12% the prior
week. These figures are the highest that YouGov has recorded for defence
since the London Bridge attack in June 2017, when 41% of people said defence
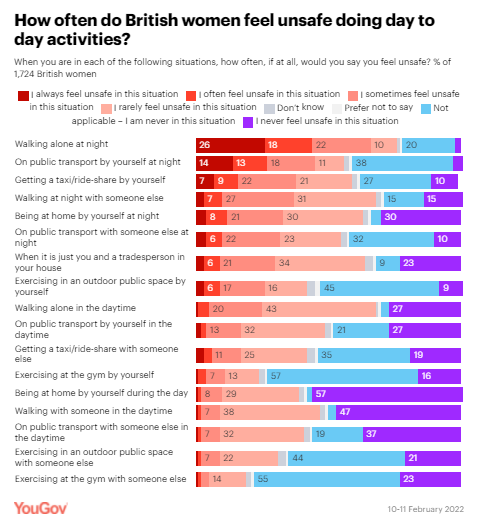
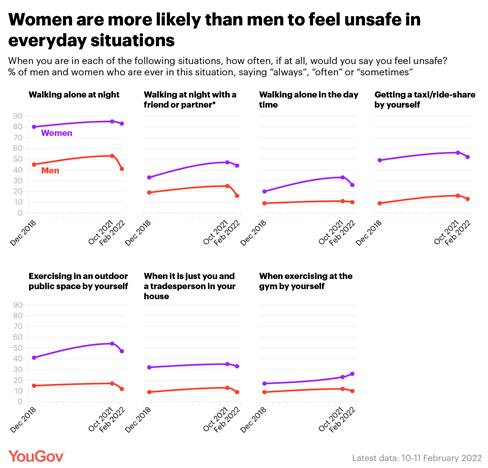
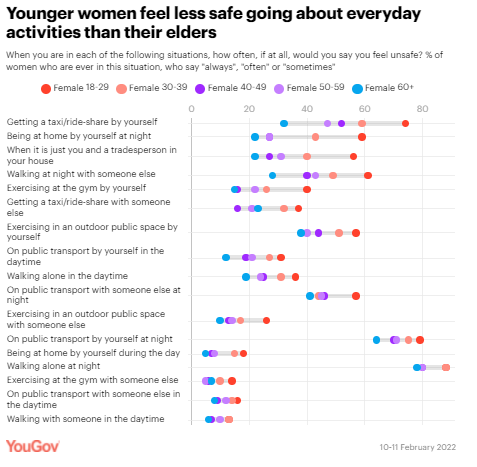
and security was a top issue. (YouGov UK) 66% Of Women Say They Feel Unsafe Walking
Home At Night At Least Sometimes A year after the nation asked itself how to
better protect women, following the murder of Sarah Everard, a new YouGov
poll for the BBC shows that many women continue to feel unsafe going about
day to day activities. Women are most likely to say they feel unsafe walking
alone home at night, including a quarter (26%) who say they “always” feel
unsafe doing so. Overall, 66% of women say they feel unsafe walking home at
night at least “sometimes”, and another 20% never do so in the first place,
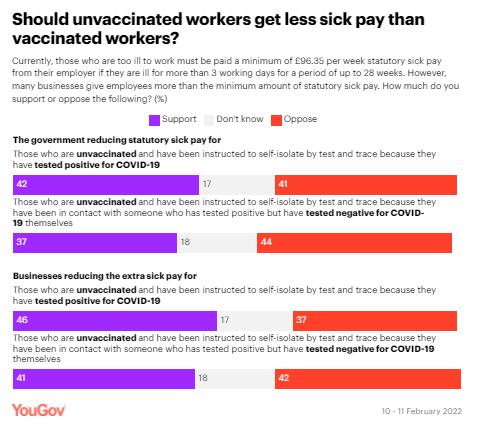
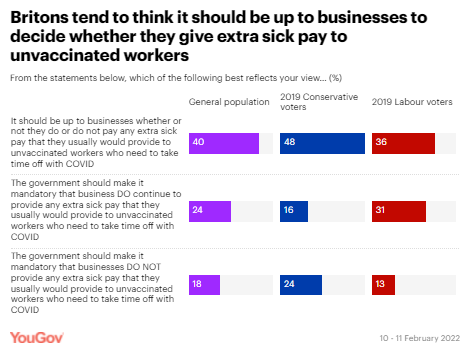
some of whom will be doing so for safety reasons. (YouGov UK) Should Unvaccinated Workers Get Less Sick
Pay Than Those Vaccinated Against Covid-19 Several big-name retailers have announced
they will slash sick pay for unvaccinated workers who are isolating after
being exposed to COVID-19. New YouGov research shows that by 46% to 37%
Britons support businesses reducing the extra sick pay they give on top of
statutory sick pay for those who are unvaccinated and have been instructed to
isolate because they have COVID-19. However, people are split 41% support to
42% opposed on businesses reducing extra sick pay for unvaccinated workers
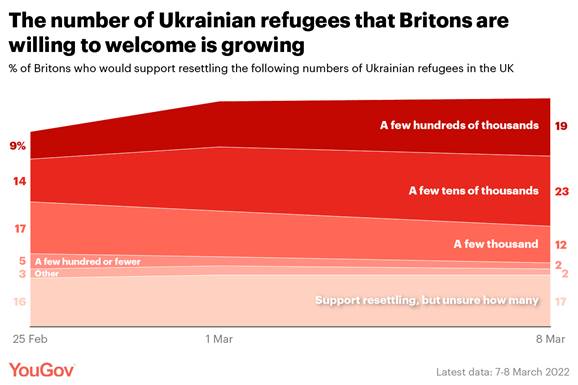
who test negative for COVID-19 but still have to self-isolate. (YouGov UK) March 09, 2022 Four In Ten Britons (42%) Believe The UK
Should Take In At Least “A Few Tens Of Thousands” Of Ukrainian Refugees Since Vladimir Putin’s forces invaded
Ukraine almost two weeks ago, YouGov have tracked British public opinion on
receiving Ukrainians fleeing the conflict and seeking asylum here. When we
first posed the question on 24-25 February, in the immediate aftermath of the
invasion, we found that 63% of the public supported introducing a scheme to
resettle some Ukrainian refugees fleeing the Russian invasion. That figure
quickly rose to around three-quarters (76%) of the public as soon as 2 March. Our
latest data released today shows that figure remains effectively unchanged
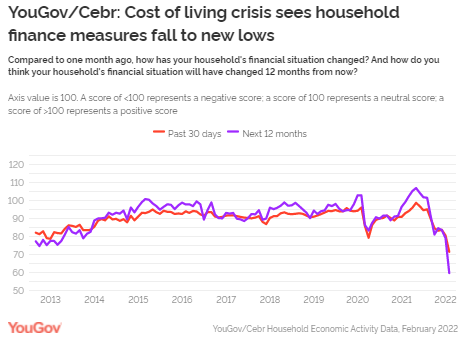
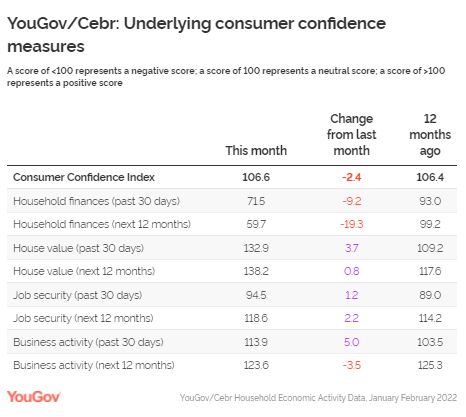
(75%). (YouGov UK) Consumer Confidence Falls As Household
Finance Measures Take A Historic Nosedive Consumer confidence dips by -2.4 points in
February 2022 Household finance measures for the previous month (-9.2) and
the year ahead (-19.3) see the worst scores in the near-ten-year history of
the index. House value metrics for the past 30 days (+3.7) and the next 12
months (+0.8) climb upwards for the third month in a row. Business activity
sees a five-point jump for the past 30 days, but outlook deteriorates (-3.5)
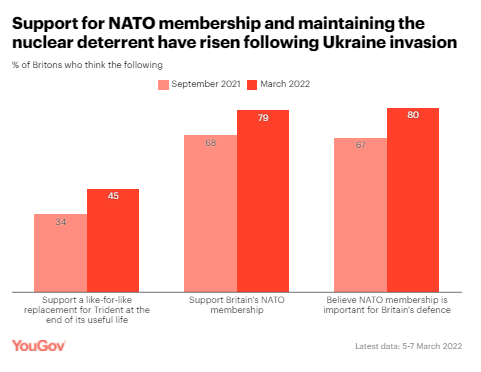
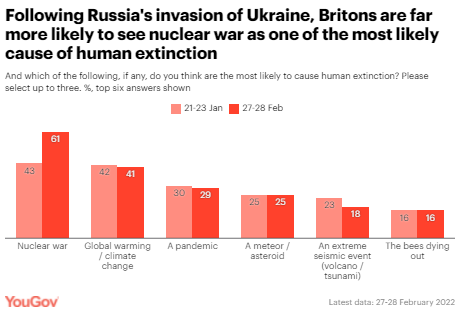
to lowest levels since April 2021. (YouGov UK) March 09, 2022 Nuclear Fears Rise Among Extinction Worries
Following Ukraine Invasion In January, YouGov conducted new research looking at what the British public
thought the most likely causes of human extinction might be. At that time,
nuclear war (43%), climate change (42%) and a pandemic (30%) were seen as the
three most likely causes of our annihilation. But following the outbreak of
war in Ukraine and renewed questions about the nuclear threat
posed by Vladimir Putin, new data shows the British public have
become far more likely to see nuclear war as a top probable cause of human
extinction. Six in 10 Britons (61%) now think nuclear war is one of the most
likely ways the human race will end, a rise of 18 points since our prior
survey on 21-23 January. All other causes remain effectively unchanged,
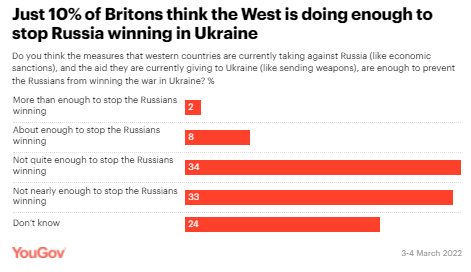
leaving climate change in a distant second at 41%. (YouGov UK) March 10, 2022 Just 10% Of Britons Think The West Is Doing
Enough To Stop Russia Winning In Ukraine The
Ukrainian leader has been critical of the West’s failure to offer more
support, saying that NATO should tell Ukrainians
whose children had died “sorry we didn't do it yesterday, one week ago… We
did nothing and it's true, yesterday the world did nothing”. Now a new YouGov
survey shows only 10% of Britons think that the economic actions the West is
taking against Russia, and the military aid being sent to Ukraine, is enough
to stop the Russians from winning. Two thirds (67%) say that it is not
enough, evenly split between the 34% who say it is “not quite enough” and the
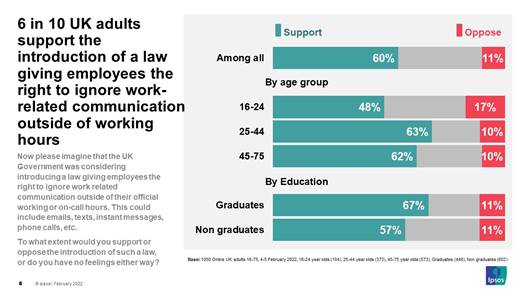
33% who say it is “not nearly enough”. (YouGov UK) March 10, 2022 6 In 10 Across The UK Would Support A Law Giving Employees The Right
To Ignore Work-Related Communications Outside Of Working Hours New research by Ipsos shows a majority of
UK adults aged 16-75 are in favour of introducing a law giving employees the
right to ignore work-related communications, such as emails, texts and
instant messages, outside of their official working/on-call hours. Sixty per
cent would support the Government introducing such a law, including 34% who
would strongly support it. Only around 1 in 10 (11%) would be against
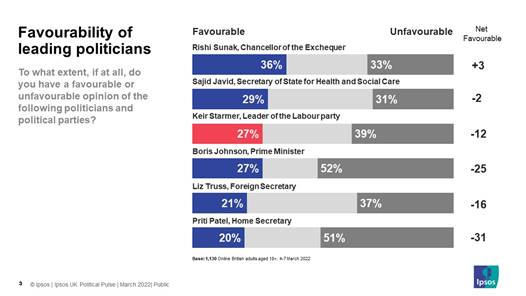
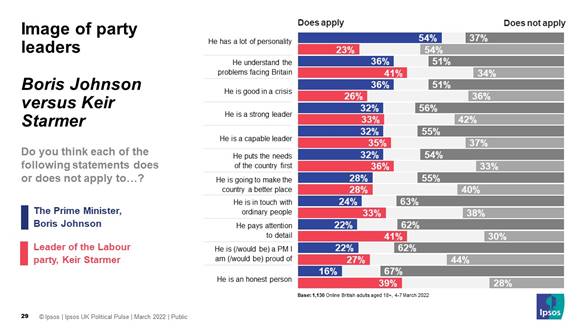
it. (Ipsos MORI) 11 March 2022 27% Of Britons Are Favourable Towards Boris
Johnson (+7 Points From February) And 52% Are Unfavourable (-6 Points) 27% of Britons are favourable towards Boris
Johnson (+7 points from February) and 52% are unfavourable (-6 points).
Figures today are comparable to those witnessed in November where 24% were favourable
and 51% unfavourable. However, they are still weaker than May 2021 where 40%
were favourable and 40% unfavourable. 27% are favourable towards Labour
leader Keir Starmer (-5 points) and 39% are unfavourable (+1 pt). Elsewhere,
Rishi Sunak continues to have the strongest levels of favourability of the
politicians included in the poll. 36% are favourable towards the Chancellor
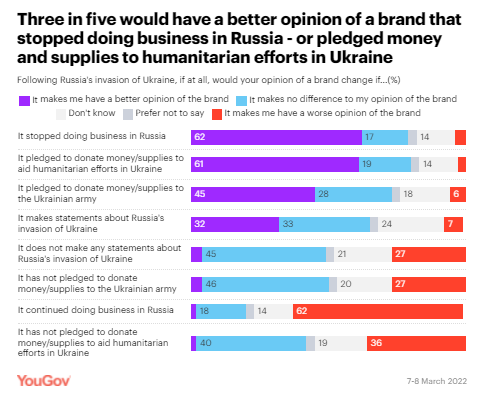
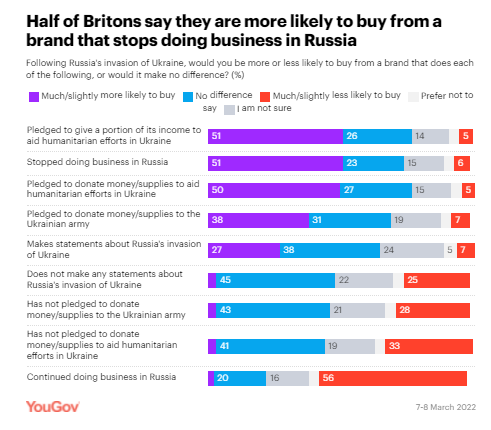
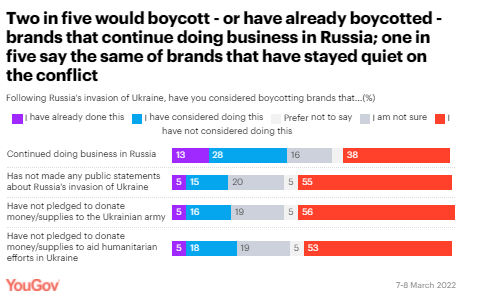
(+1 pts from Feb) and 33% are unfavourable (+1pt). (Ipsos MORI) 11 March 2022 Two-Thirds Of The Public Say Brands Should
Take A Stance On Ukraine New YouGov data reveals that two in three
Britons (68%) say it’s important that brands publicly take a stand on the
Russia-Ukraine conflict – with fewer than one in five (17%) in
dissent. More specifically, three-quarters of the public think
companies should stop doing business in Russia entirely (76% vs. 6%), and the
same proportion say they should donate money and supplies to humanitarian
efforts in Ukraine (77% vs. 4%). A majority also want brands to offer this
kind of support to the Ukrainian army (54% vs. 15%), and issue statements in
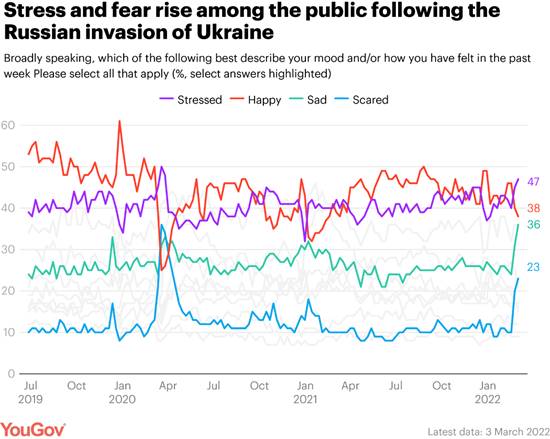
support of Ukraine (61% vs. 11%). (YouGov UK) March 14, 2022 War In Ukraine Leads To Spiking Stress,
Fear, And Sadness Among Britons A third of Britons (36%) say they’ve been
sad in the last seven days, up 5pts from 31% on 24th February,
and 12pts compared to 10th February. This latest datapoint is
higher than the beginning of the initial COVID-19 lockdown (March 2020), when
sadness reached a peak of 33%.Another fifth report feeling scared in the last
week (23%), a leap of 13pts versus 17th February – and the
highest since the previous peak of 36% in mid-March 2020. This rise has been
steepest among the oldest Britons – many of whom will no doubt be drawing
parallels between recent events and the nuclear tensions of the 60s. The
number of those 65 and over feeling scared rose 16pts from 6% in mid-February
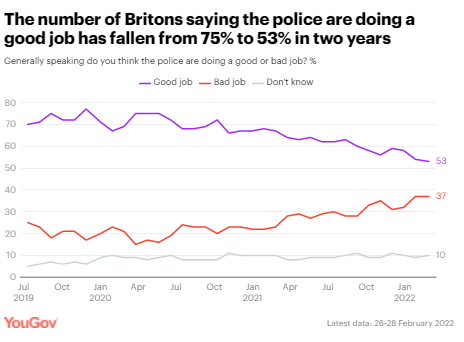
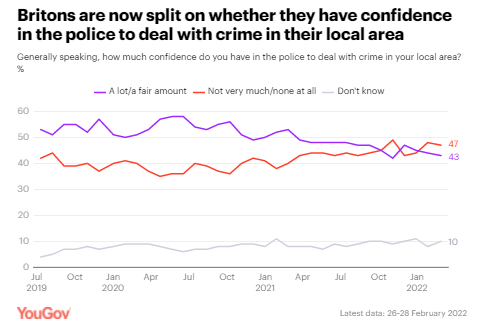
to 22% now. (YouGov UK) March 14, 2022 Confidence In The Police Sinks In Two Years In recent months, the proportion of Britons
saying the police are doing a good job has declined. Two years ago, in
February 2020, seven in 10 Britons said they thought the police were doing
well. Now barely half of the public (53%) do so, while the percentage saying
that the police are doing a bad job has more than doubled from 15% to
37%.Conservative voters are more likely to think the police are doing a good
job (61%) than Labour voters (44%). The collapse of approval in the police
has been particularly acute among Labour voters, falling 31pts from 75% in
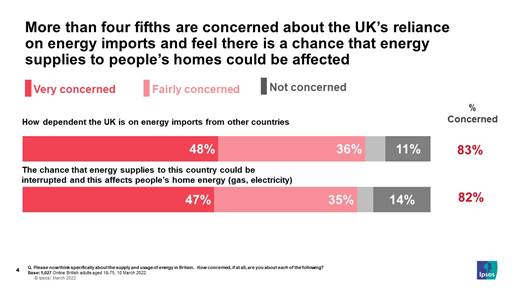
February 2020. (YouGov UK) March 15, 2022 8 In 10 Britons Are Concerned About The
UK's Dependence On Foreign Countries For Its Energy Supply New research from Ipsos shows more than 8
in 10 (83%) Britons are concerned about how dependent the UK is on energy
imports from other countries. A similar proportion (82%) are concerned
about the chance that energy supplies to this country to be interrupted and
this affects people’s home energy. Looking forward three quarters (76%)
think the chances of interruptions to the UK’s energy supplies will get worse
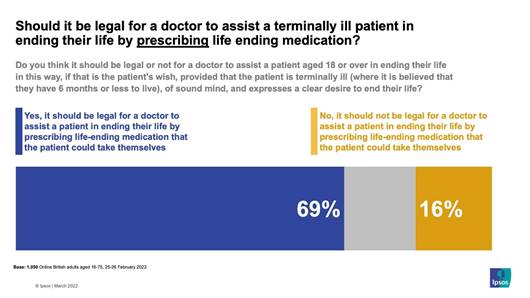
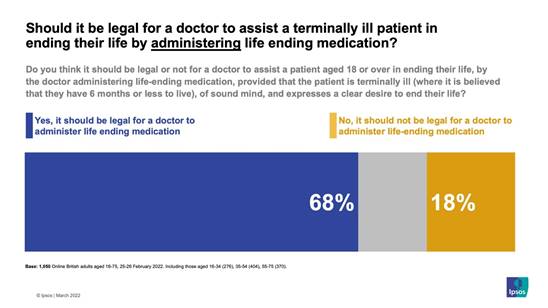
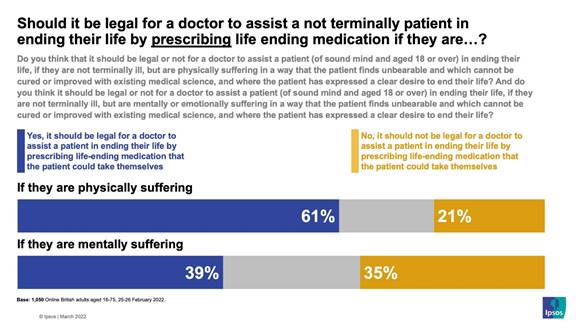
over the next 6 months, and that this will affect energy supplies to homes. (Ipsos MORI) 15 March 2022 7 In 10 Britons Support Assisted Dying In
Latest Ipsos Poll On the day the House of Lords considers an
assisted dying amendment to the Health and Social Care Bill, a new online
Ipsos poll has found that 7 in 10 Britons aged 16-75 think it should be legal
for doctors to prescribe life ending medication for a patient to take
themselves (69%) as well as doctors being able to administer life ending
medication to a patient (68%).Conditions under which patients would be able
to request this course of action were shown to survey respondents: the
patient must be 18 or over and have made a voluntary decision to end their
life (signed in front of witnesses) with time to consider other options, two
doctors must agree the patient is of sound mind, terminally ill and believed
to have six months or less to live, and the High Court confirms it is
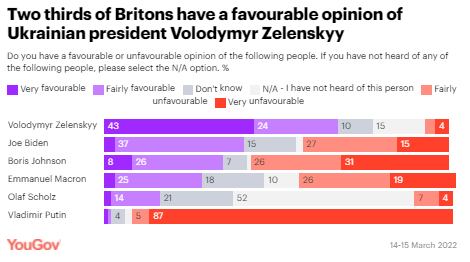
satisfied these conditions have been met. (Ipsos MORI) 16 March 2022 85% Of Britons Say They Have Heard Of The
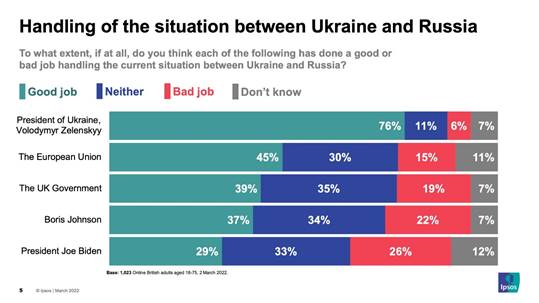
Ukrainian Leader Now new YouGov data shows that two thirds
of Britons (67%) have a favourable opinion of Zelenskyy, including 43% who
have a “very” favourable view. Only 7% have a negative view. Another 15% say
they have never heard of the Ukrainian president, meaning that of the people
who have heard of him, 79% have a favourable view. By contrast, Russian
president Vladimir Putin is near-universally reviled. Fully 92% of Britons have
an unfavourable view of him, including 87% with a “very unfavourable” view.
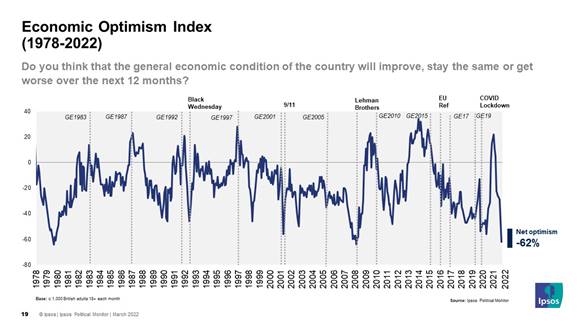
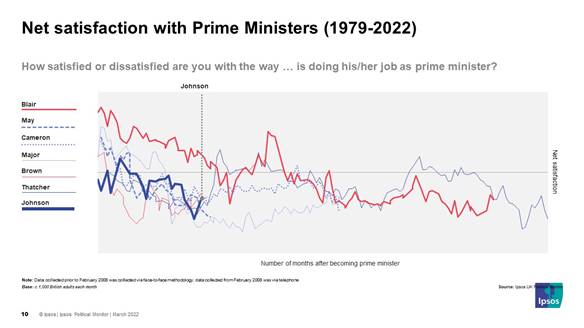
Just 2% say they have a favourable view. (YouGov UK) March 17, 2022 Three In Four (76%) Expect The Economy To
Get Worse Over The Next Twelve Months 76% think economy will get worse in the
next 12 months. This matches the worst ever levels in 44 years of tracking
(in 2008 and 1980). Boris Johnson’s leader ratings recover to pre partygate
levels, but 6 in 10 still dissatisfied. Labour retains 4 point lead (down
from 9 points in January). Economic optimism is weaker than at the start of
the COVID-19 pandemic. 69% expected the economy to worsen over the next year
in March 2020. It is also weaker than October 1992 when it stood at 60%. The
only times Ipsos has recorded similar levels of economic pessimism are
January 1980 (74%) and July 2008 (75%). (Ipsos MORI) 18 March 2022 (France) Two Out Of Three French People Have Already Practiced
Skiing If the mountain seems to be a key
destination for the French in winter, more than one in two (53%) say they
never go there. The destination is therefore not popular with a majority
of French people, only 1 in 3 (34%) say they go there from time to time, and
it is a tradition for only 13%, who say they go there every year. Young
people (22% of 16-24 year olds) and Parisians (19%) are the most likely to go
to the mountains in winter. But even if 34% of French people occasionally go
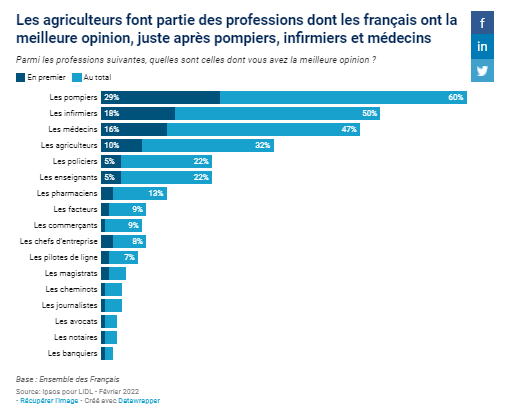
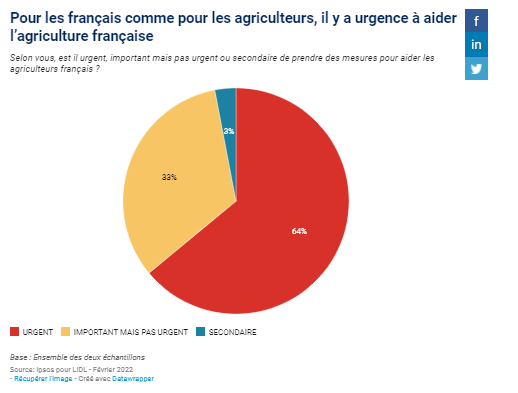
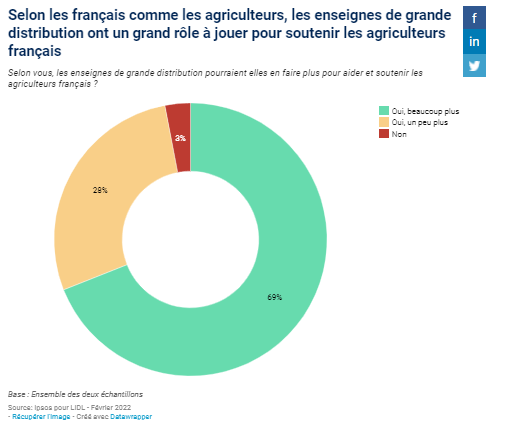
to the mountains in winter, it is not always to go skiing. (Ipsos France) March 1, 2022 91% Of French People Have A Good Opinion Of Farmers In the midst of a health crisis, farmers
take 4th place among the favorite professions of the French (cited by 32% of
those interviewed) , behind firefighters (60%), nurses (50%) and doctors
(47%) but far ahead of police officers and teachers (22%) or even pharmacists
(13%). Bankers bring up the rear of this ranking (2%).9 out of 10 French
people have a good opinion of farmers (91%). For their part, farmers are
much less convinced that the French like them (only 59% are aware of this).
(Ipsos France) March 4, 2022 76% Of French People Claim To Know The Difference Between
Criminal Majority And Criminal Responsibility Criminal responsibility is
the age at which a minor can be found guilty of an offence. When the
criminal majority is reached, the minor no longer benefits from a
reduction in sentence. 76% of French people claim to know the difference
between criminal majority and criminal responsibility, a figure drawn up by
the inhabitants of the Paris region (82%). 27% of French people even say
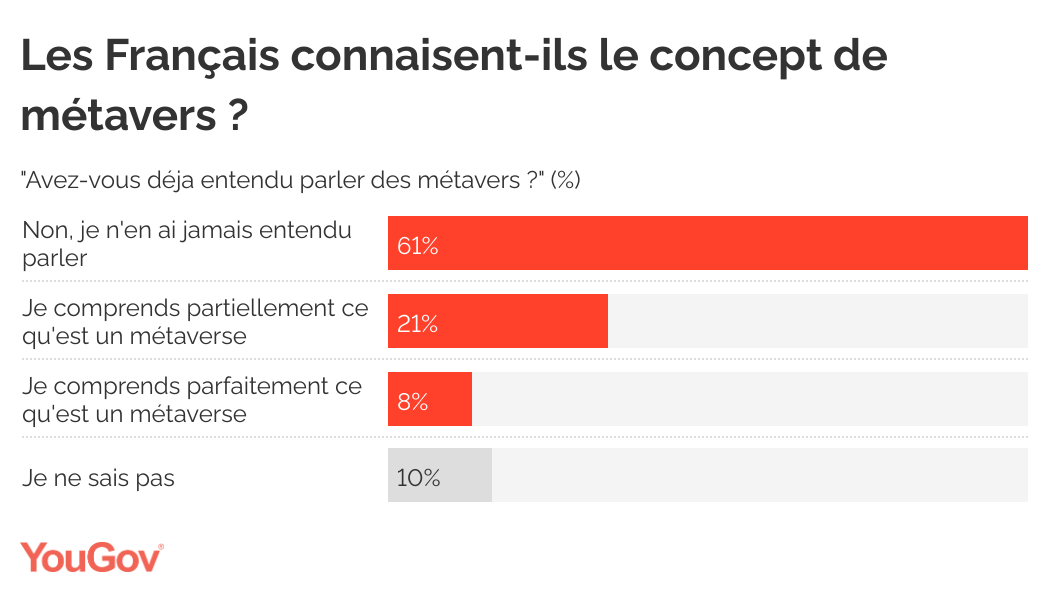
they know exactly the difference. (YouGov France) March 8, 2022 61% Of French People Have Never Heard Of The Concept Of
Metaverse On October 28, Mark Zuckerberg announced
the change of identity of his company: Facebook then became Meta. This new
name marks the bet of the Californian giant to embark on a huge metaverse
project, with nearly 10 billion dollars allocated in 2021. But behind the
"hype" aroused by this project supposed to tip the world into an
ever more digitized future, what about the perception of the French? Are
they familiar with the concept of metaverse and what activities in their
daily life are they really ready to digitize? (YouGov France) March 8, 2022 37% Of French Women Consider That Prioritizing Their Family
Life Is A Threat To Their Career Having to choose between professional life
and family responsibilities and facing discrimination at work when you are a
woman are also a problem for 14% of French people , as are all the
tasks they have to perform without pay. From this point of view, France is
well behind the world average: 32% of French people (34% of men and
30% of women) say they think that men and women are treated on the same
level in their place work compared to 44% of those interviewed worldwide. (Ipsos France) March 9, 2022 Despite An Increasing Amount Of Time Spent On Screens,
Young People Still Read As Much The 2022 edition of Junior Connect' reveals
that 13-19 year olds have an average of 2.9 personal screens. A figure
that increases with age, since it is 1.6 among 7 to 12 year olds. In
detail, how is this distributed? The smartphone remains the preferred
personal device for teenagers; 89% of 13-19 year olds have one, i.e. 12
points more than in 2016. This increase is also very strong among 7-12 year
olds (35% equipped in 2021). 13-19 year olds have an average of 3 personal
screens, compared to 1.6 on average for 7-12 year olds. The smartphone
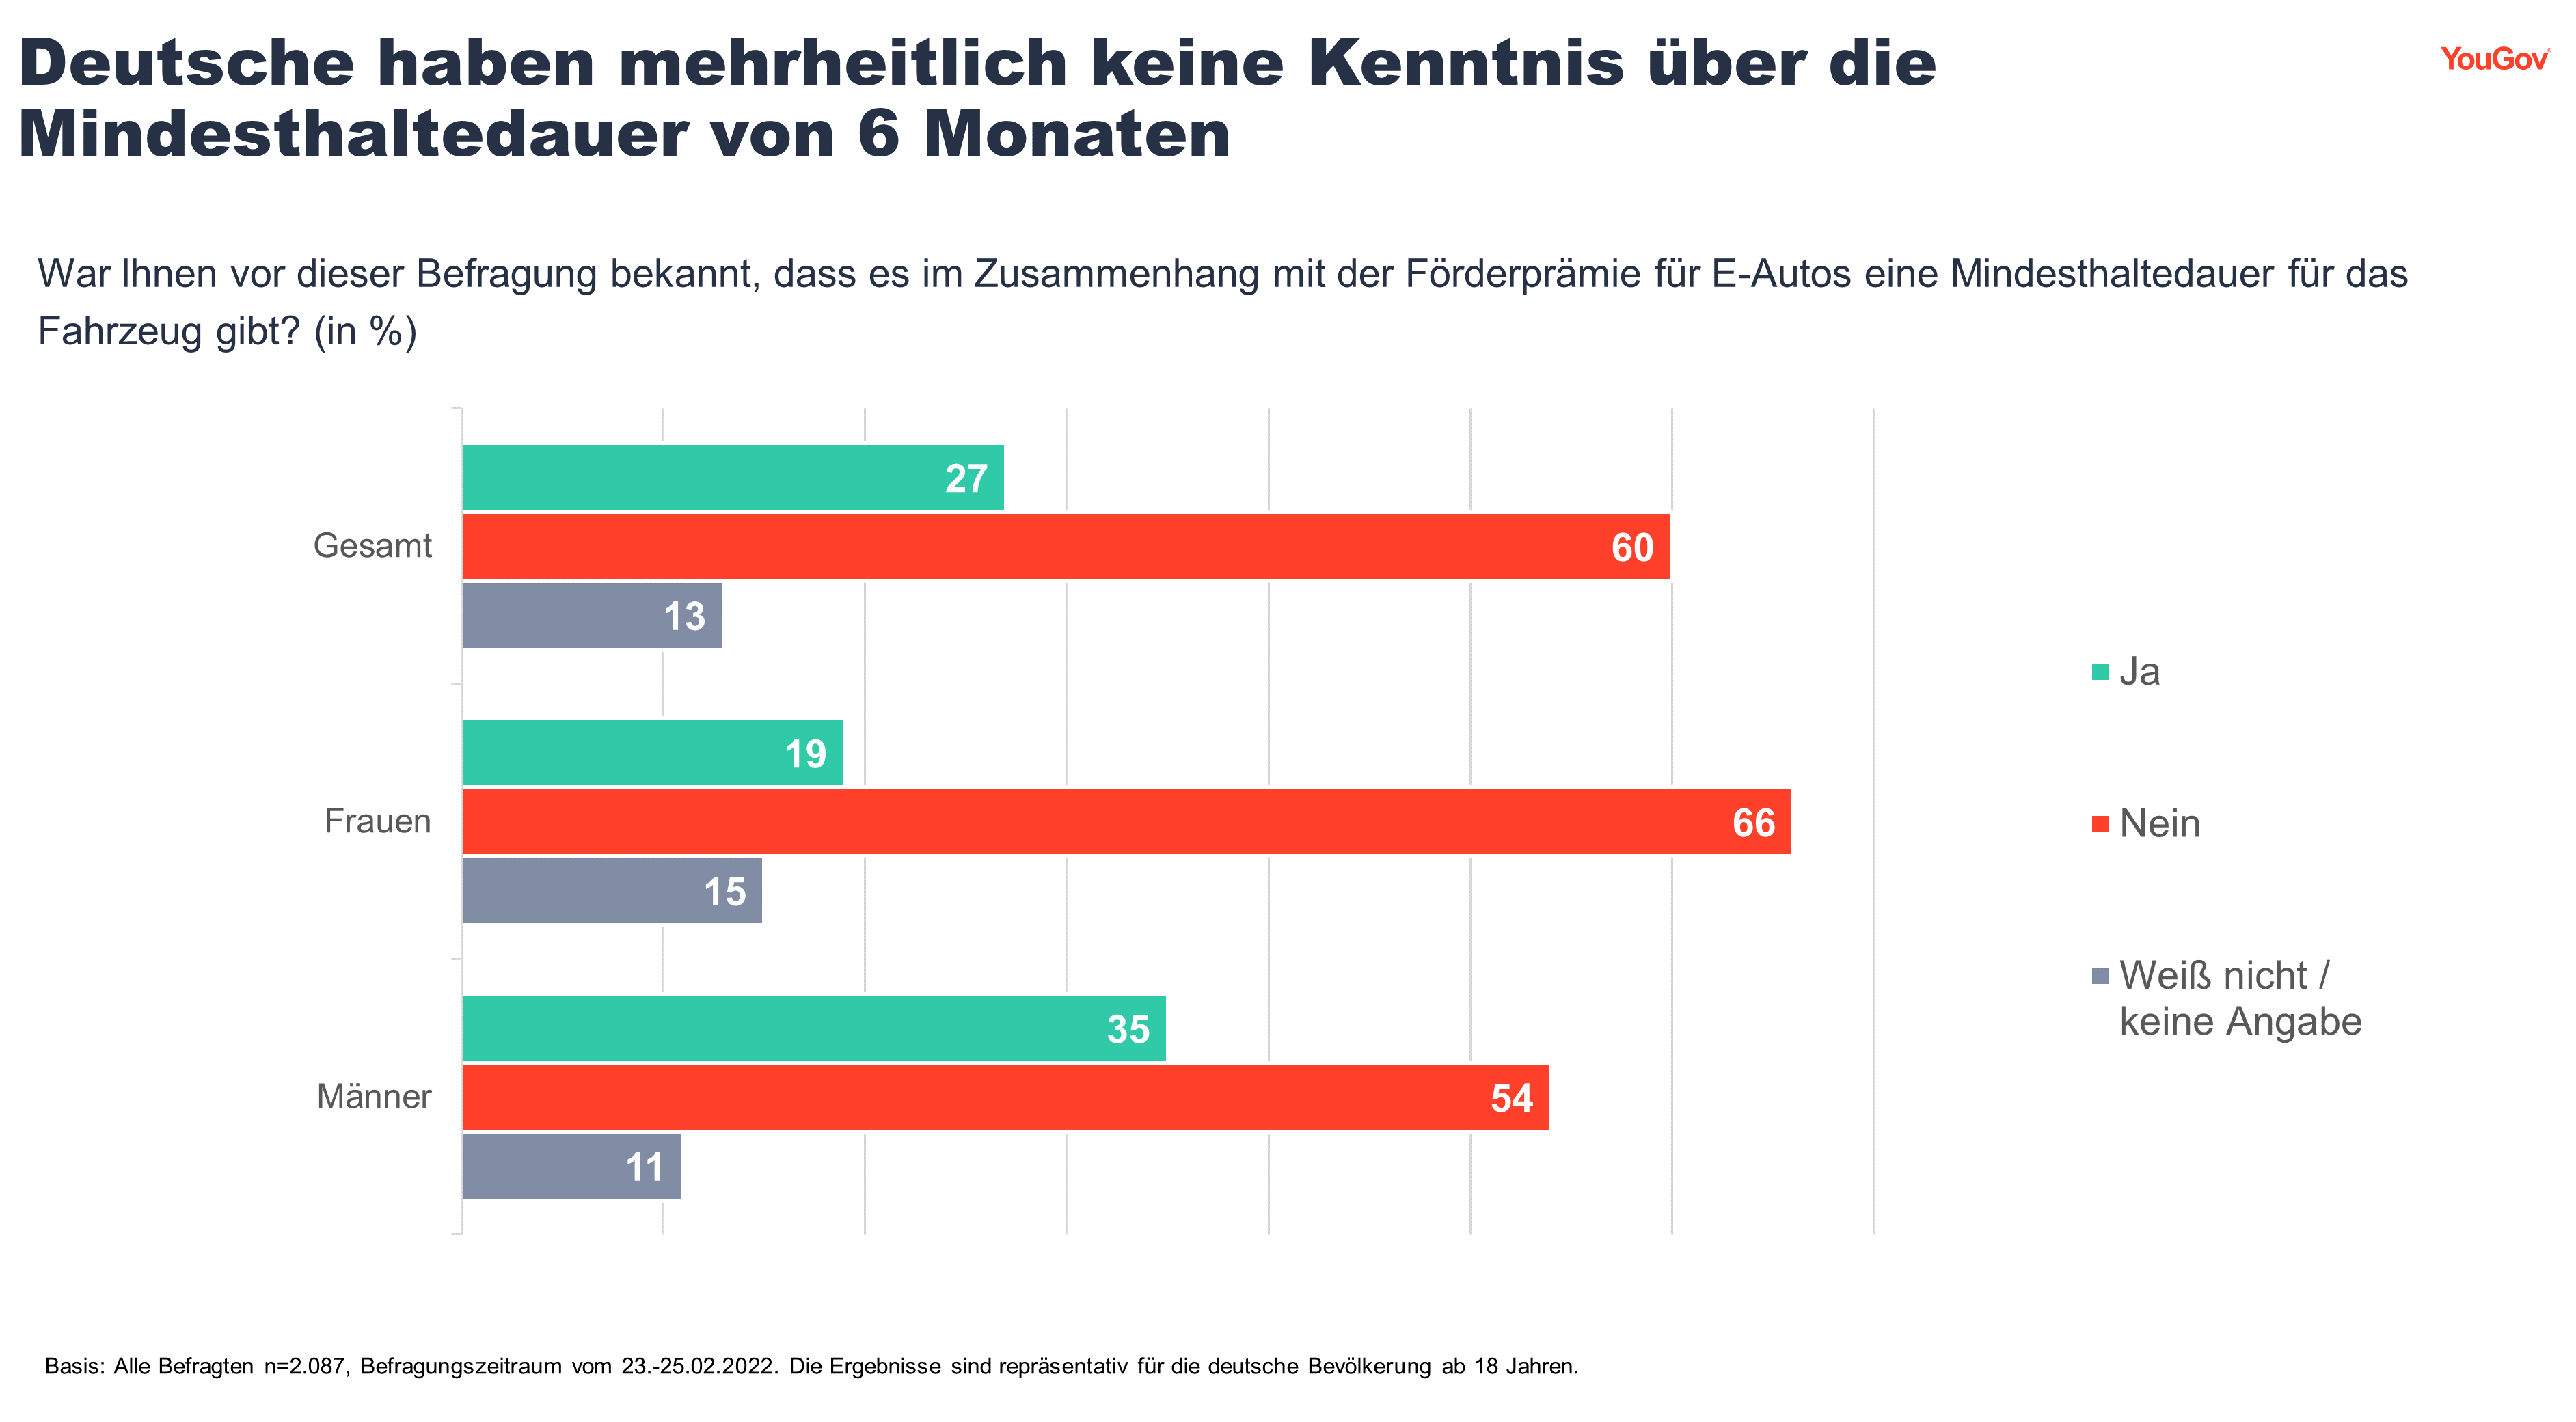
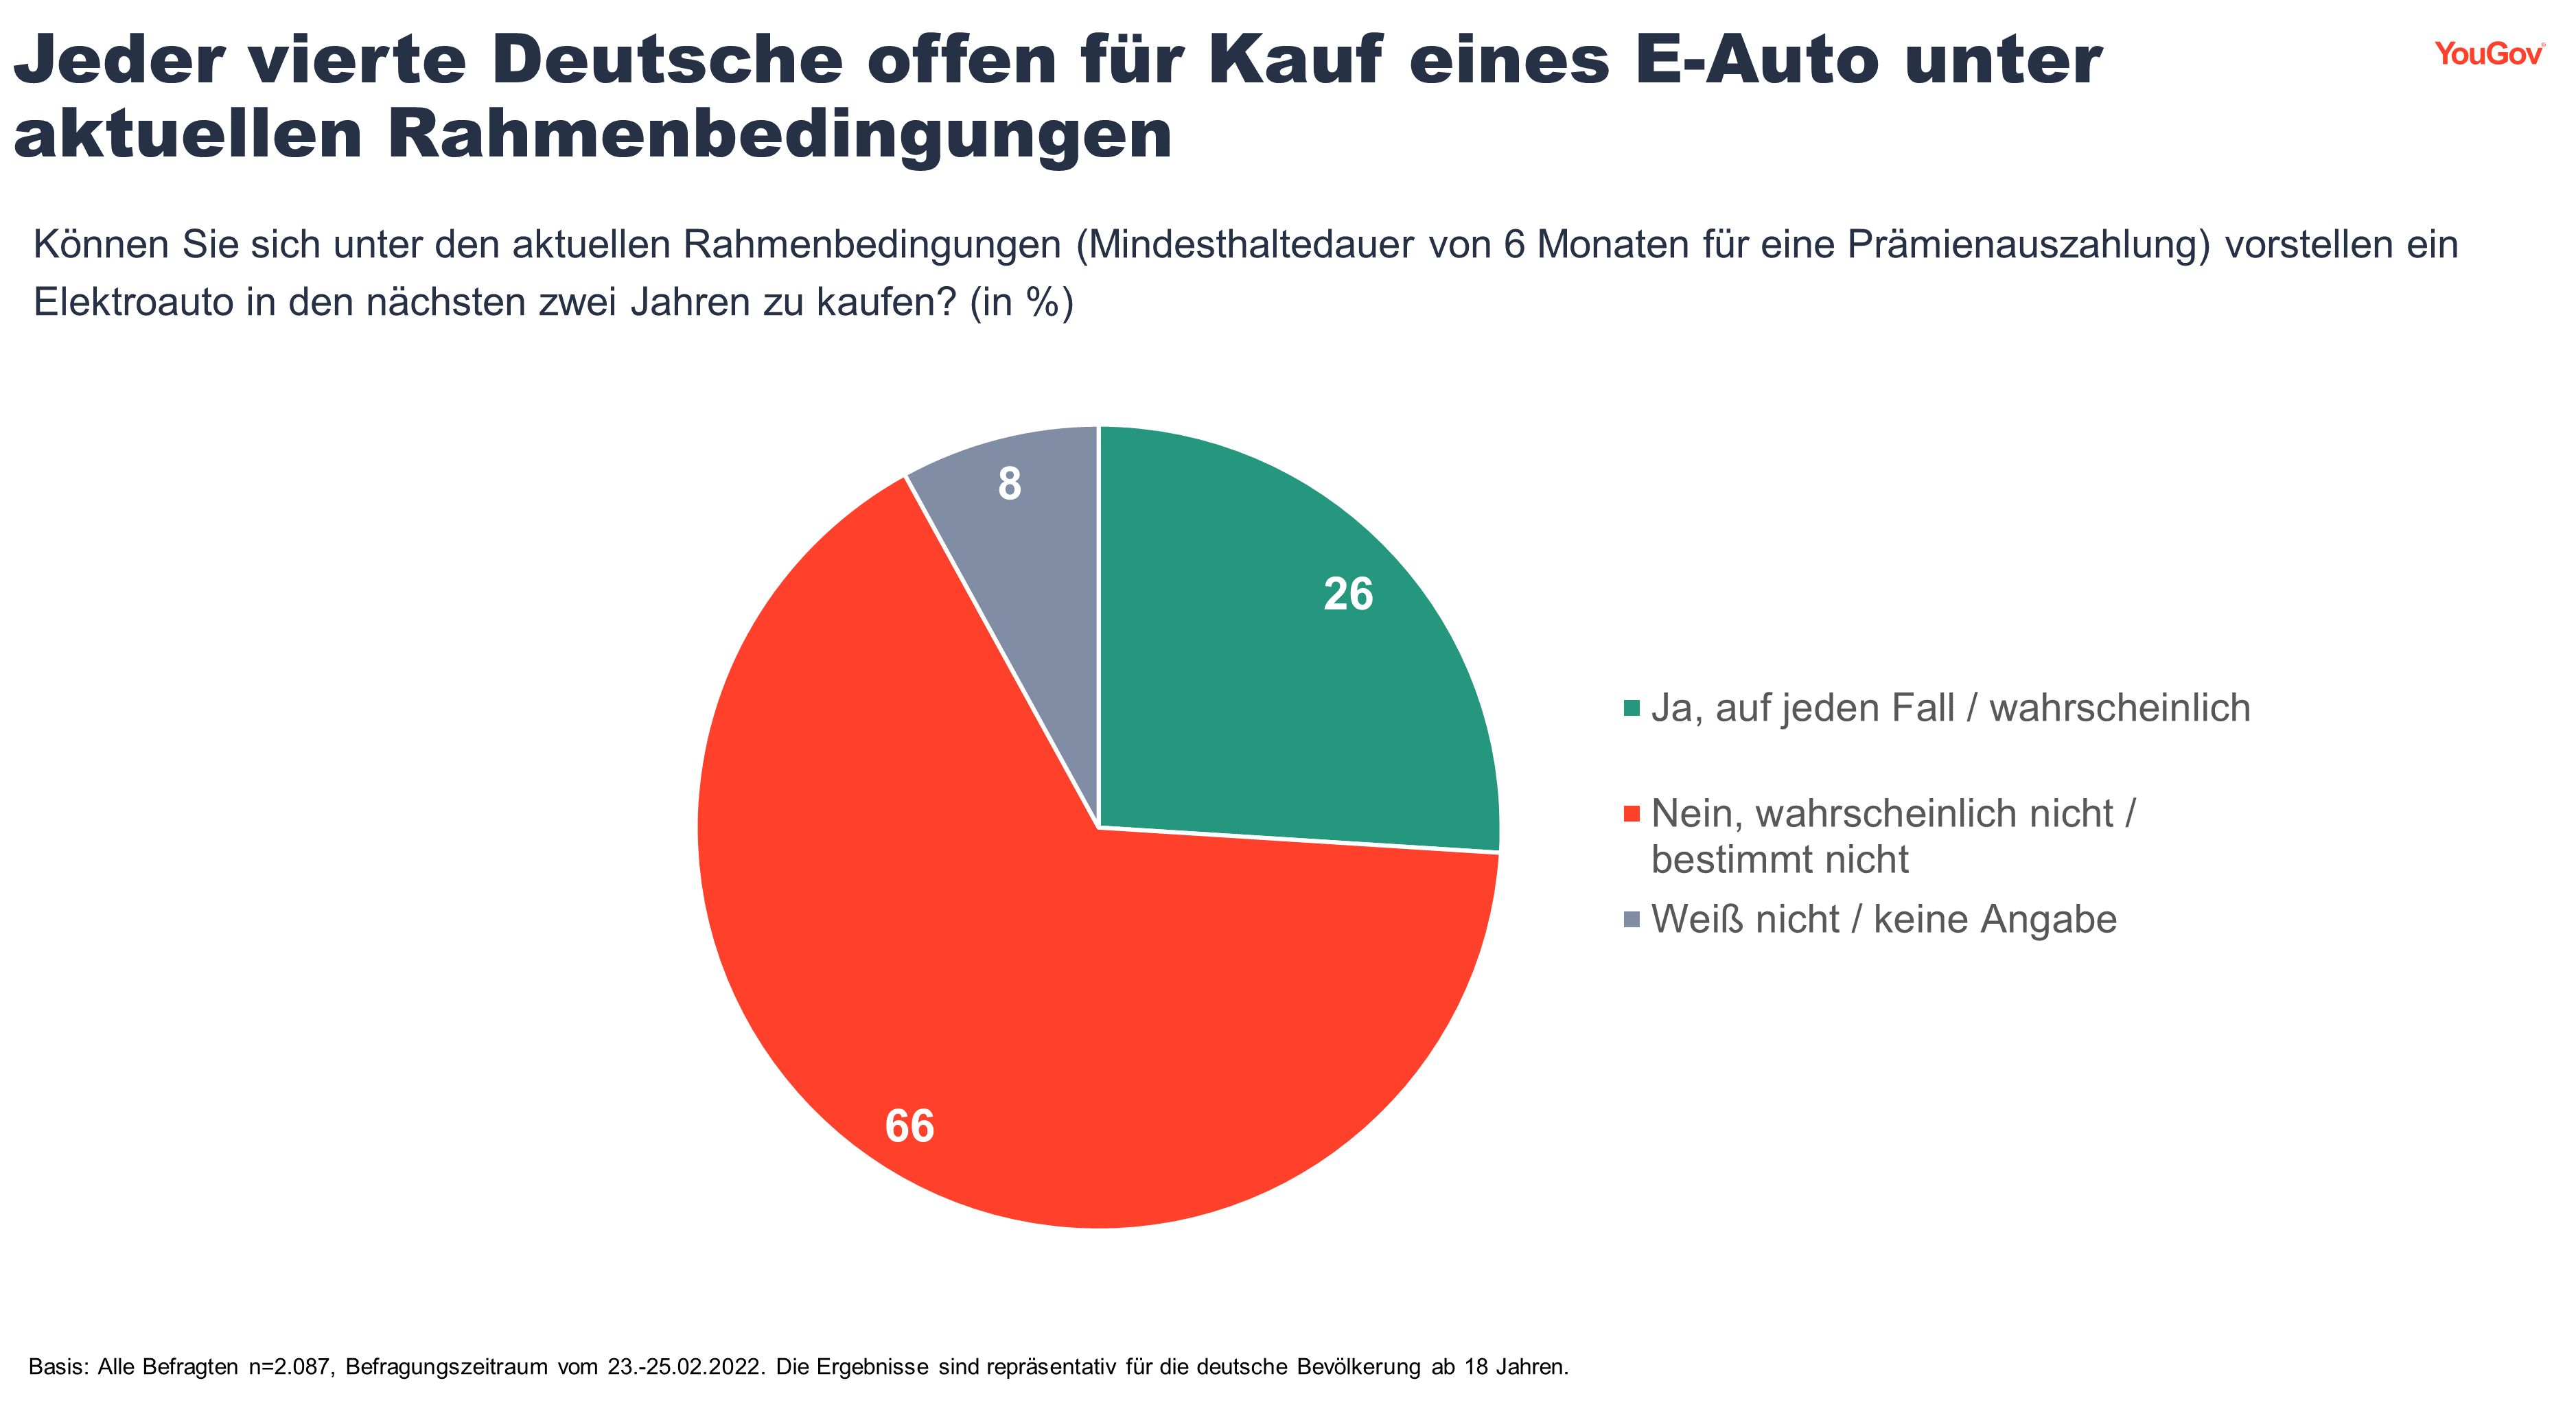
is the fetish terminal of teenagers (90% of equipment). (Ipsos France) March 18, 2022 (Germany) The Majority Of Germans Do Not Know The Minimum Holding
Period When Buying E-Cars In order to achieve the climate goals that
have been set and the desired turnaround in traffic, switching to an electric
car must also be financially attractive for consumers. Therefore, the
German state is currently promoting the purchase of an e-car with a bonus of
up to 9,000 euros, which is paid out after registration. This means that the
subsidy must be repaid by the consumer if the vehicle is sold again before
six months have elapsed. Only slightly more than every fourth German is
aware of this fact (27 percent), men more often than women (35 percent vs. 19
percent). However, 60 percent of all respondents were not aware of this
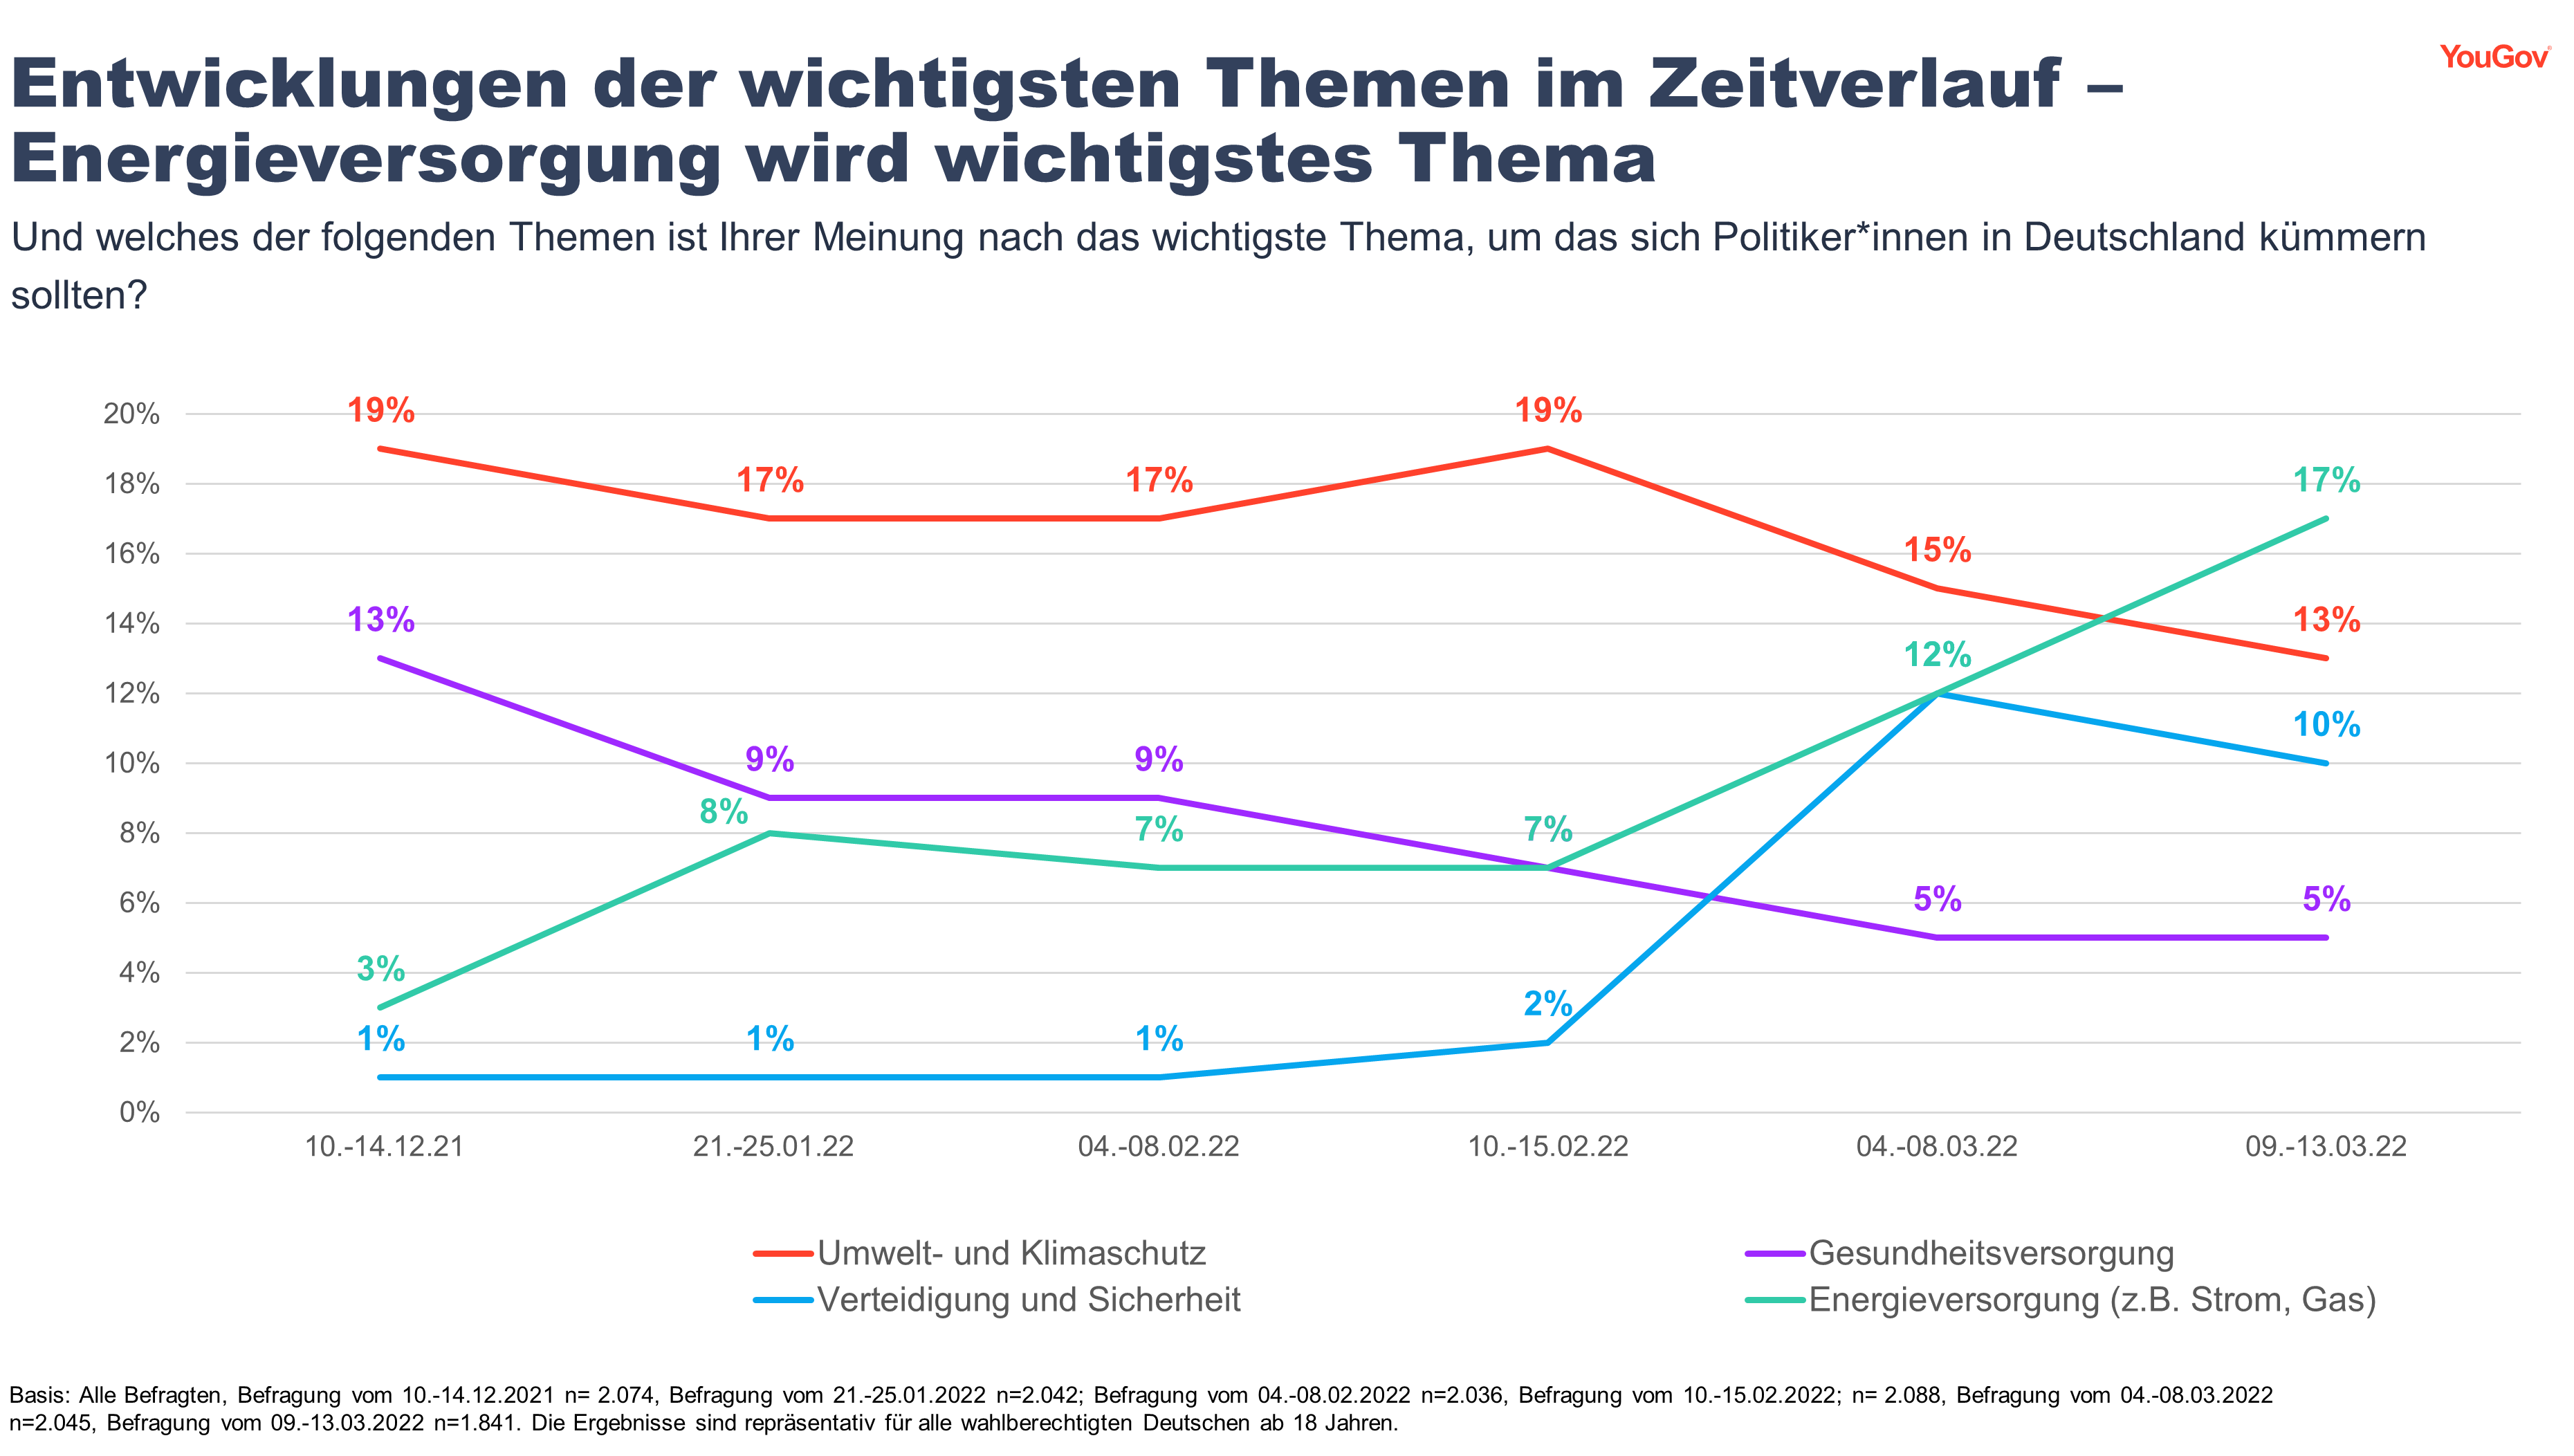
fact before the survey. (YouGov Germany) March 15, 2022 Energy Supply Is The Most Important Issue For Germans,
Ahead Of Environmental Protection In Germany, the increased prices for fuel,
heating, etc. are currently on everyone's lips. The federal government
wants to relieve consumers of the sharp rise in costs with packages of
measures. Currently, 17 percent of German citizens who are entitled to
vote say that the energy supply (e.g. electricity, gas) is the most important
issue that politicians in Germany should concern themselves with. This
value has risen significantly in recent weeks: in mid-December, only 3
percent made this statement. The energy supply has thus currently
overtaken environmental and climate protection, which has been the most
important issue for Germans since February 2021 that politicians should
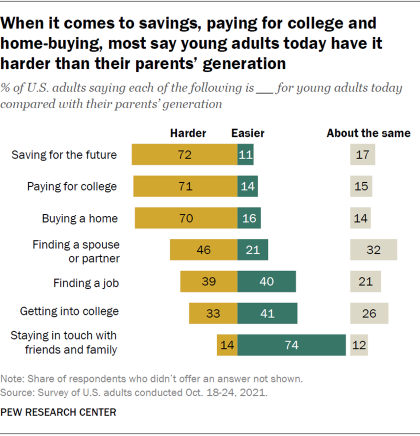
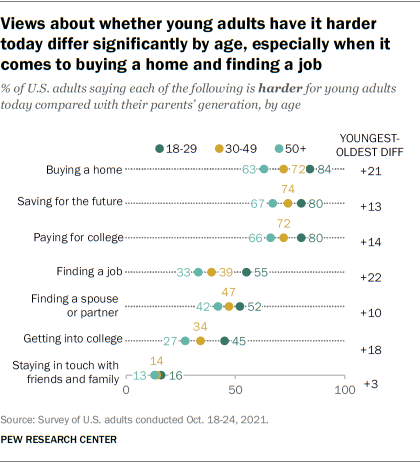
concern themselves with. (YouGov Germany) March 16, 2022 NORTH AMERICA (USA) Most In The U S Say Young Adults Today Face More Challenges
Than Their Parents’ Generation In Some Key Areas About seven-in-ten Americans think young
adults today have a harder time than their parents’ generation when it comes
to saving for the future (72%), paying for college (71%) and buying a home
(70%), according to a Pew Research Center survey conducted in October 2021.
These findings come at a time when younger Americans are more likely than
previous generations to have taken on student debt with tuition costs steadily rising, and to face an
affordable housing crisis as rent and housing prices have grown markedly faster than
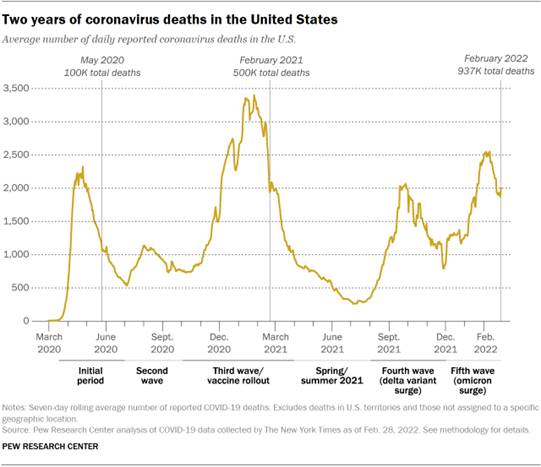
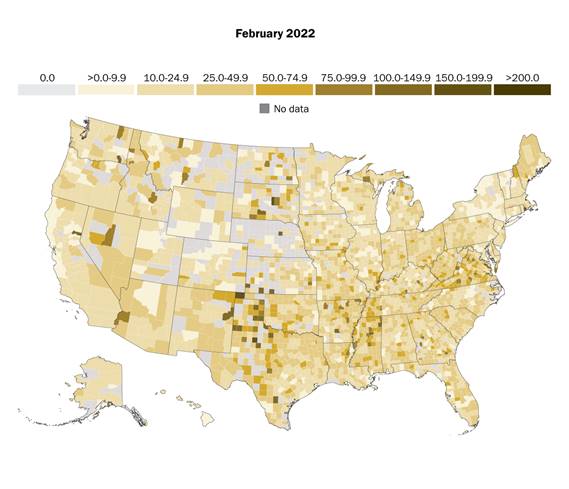
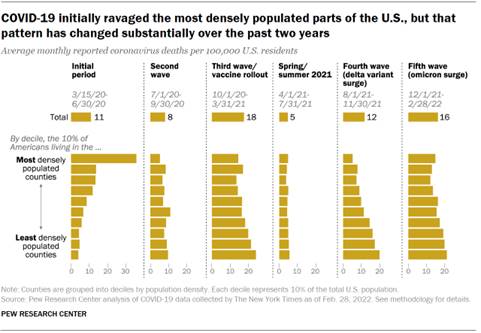
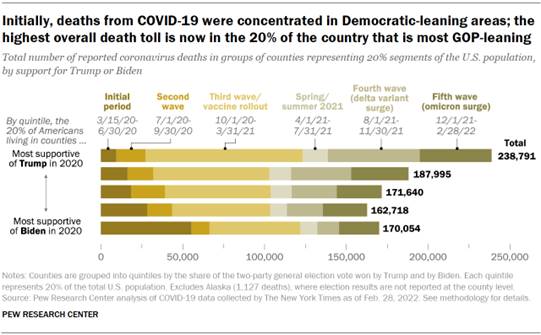
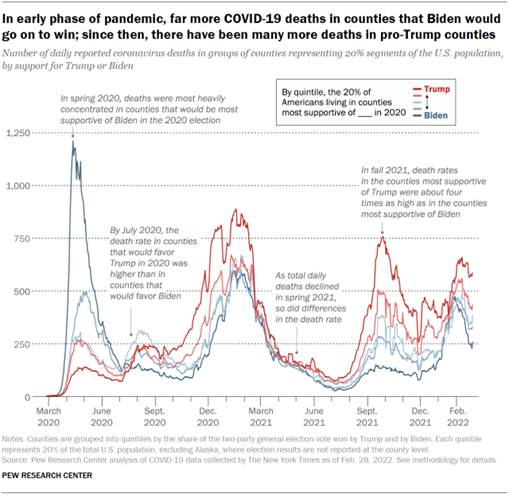
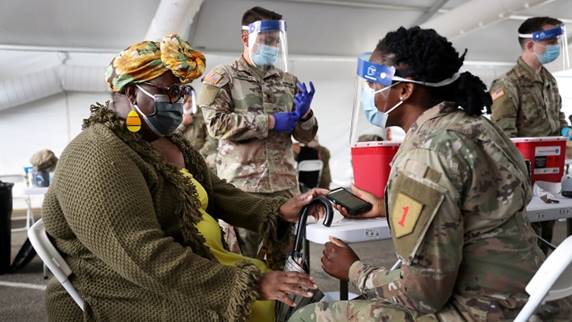
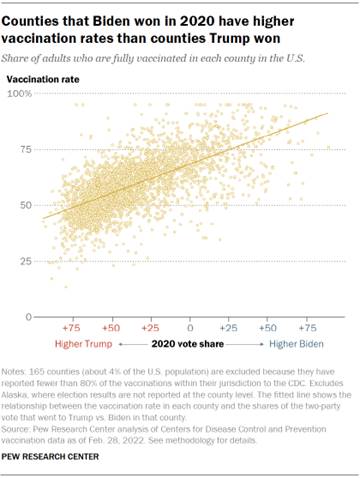
incomes in the last decade. (PEW) FEBRUARY 28, 2022 The Changing Political Geography Of Covid-19 Over The Last
Two Years A new Pew Research Center analysis of
official reports of COVID-19-related deaths across the country, based on
mortality data collected by The New York Times, shows how the dynamics of the
pandemic have shifted over the past two years. By the spring and summer of
2021, the nationwide death rate had slowed significantly, and vaccines were
widely available to all adults who wanted them. But starting at the end of
the summer, the fourth and fifth waves (marked by new variants of the virus,
delta and then omicron) came in quick succession and claimed more than
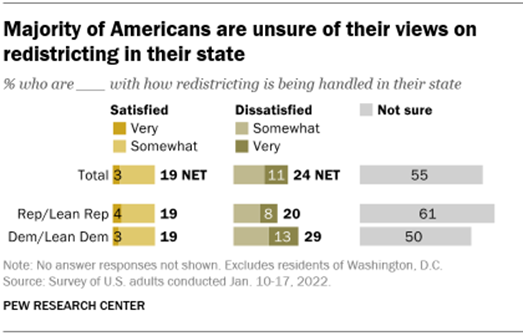
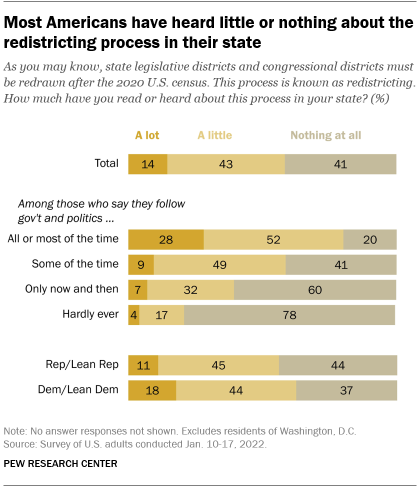
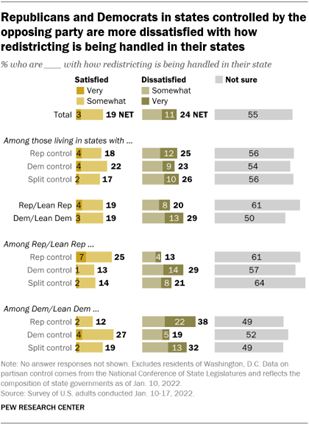
300,000 lives. (PEW) MARCH 03, 2022 With Legislative Redistricting At A Crucial Stage, Most
Americans Don’t Feel Strongly About It The once-a-decade process of legislative
redistricting is a topic of intense interest for both parties and scores of
lawmakers whose jobs may be riding on the outcome. But when asked their view
of how redistricting is being handled in their state, only a small share of
Americans have heard a lot about it and a majority are not sure how they
feel. Just 14% of U.S. adults say they have heard a lot about the
redistricting process in their state, according to a mid-January Pew Research
Center survey. Overall, more than eight-in-ten Americans (85%) say they have
heard a little or nothing at all about legislative redistricting in their
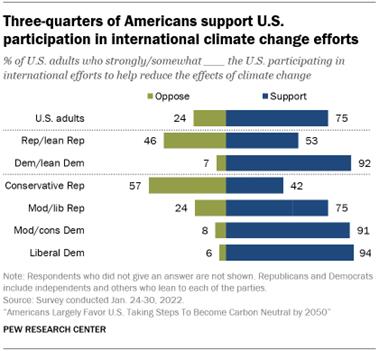
state. (PEW) MARCH 4, 2022 Three-Quarters Of Americans Support The
United States Participating In International Efforts To Help Reduce The
Effects Of Climate Change Three-quarters of Americans support the
United States participating in international efforts to help reduce the
effects of climate change, according to a recent Pew Research Center survey. Nearly all Democrats and
Democratic-leaning independents (92%) support a U.S. role in international
efforts to reduce climate change impacts, as do 53% of Republicans and GOP
leaners. Within the Republican Party, 57% of conservative Republicans oppose
U.S. participation in international efforts while 42% support it. Most
moderate or liberal Republicans favor U.S. involvement (75%). (PEW) Rising Share Of Americans See Women Raising
Children On Their Own, Cohabitation As Bad For Society Americans are more likely than they were
three years ago to say single women raising children on their own and couples
living together without being married are bad for society, according to a Pew
Research Center survey conducted in October 2021. On both, the change has
occurred more among Republicans and those who lean toward the Republican
Party than Democrats and Democratic leaners. Views on these family
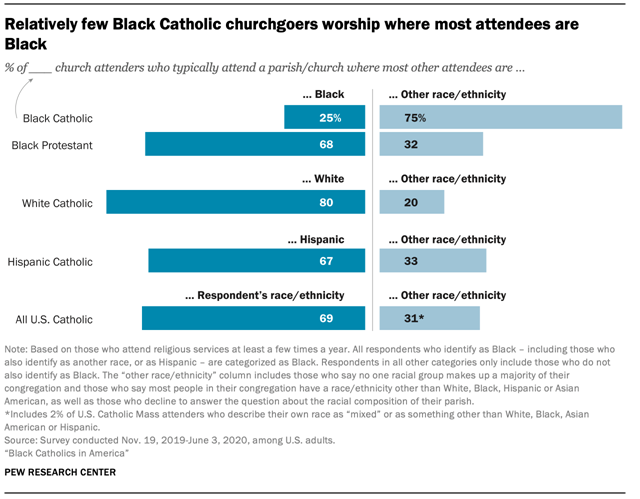
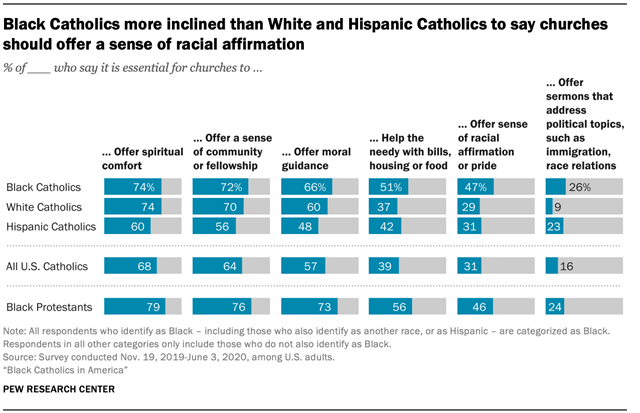
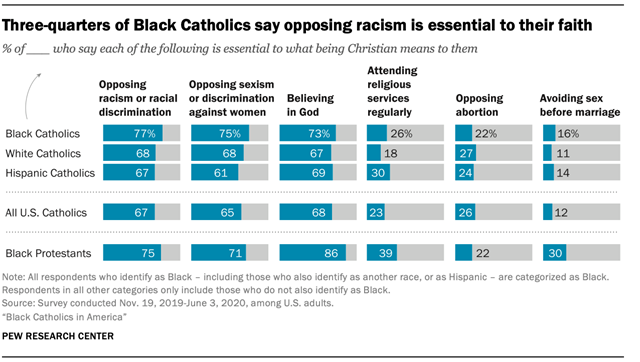
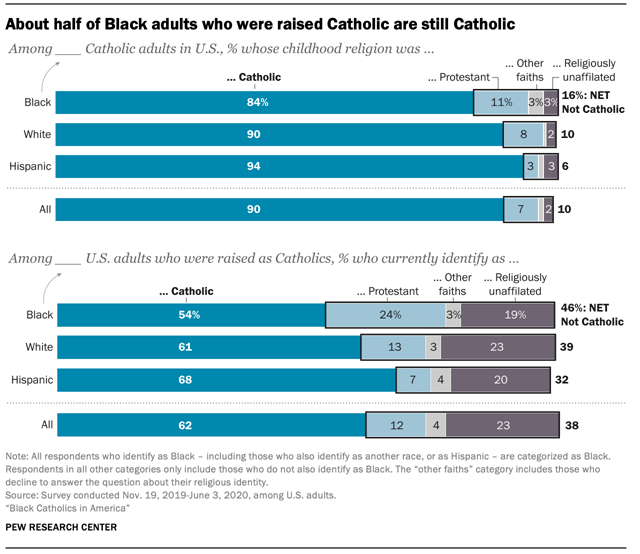
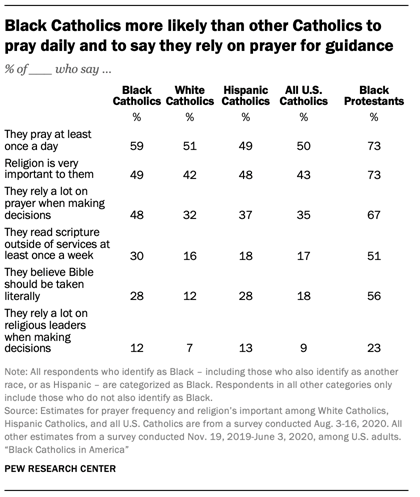
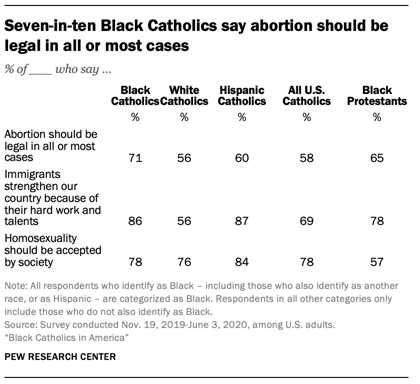
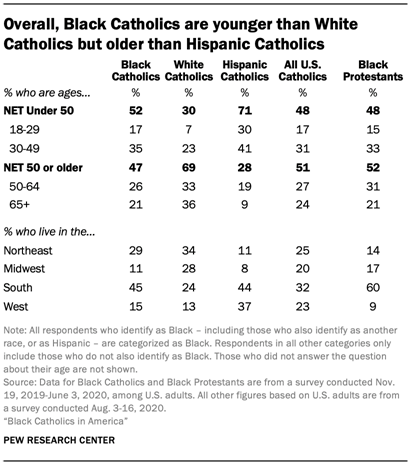
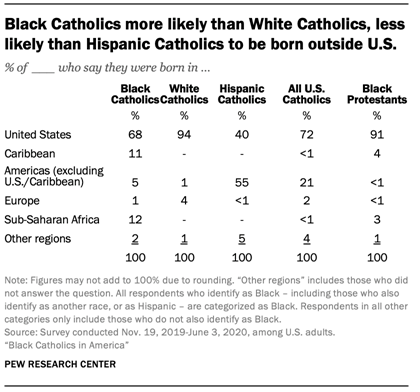
arrangements vary across many demographic lines. (PEW) Black Catholics In America Black Catholics are a minority in the
United States in numerous ways. They comprise a small share of Black adults
(6%) and an even smaller share of Catholic adults (4%). Still, there are
approximately 3 million Black Catholics in the U.S., and the group received media
attention after Wilton Gregory, the archbishop of Washington, D.C.,
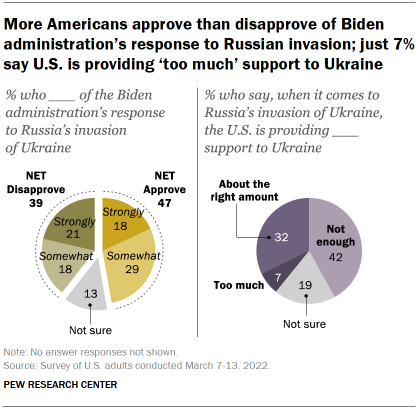
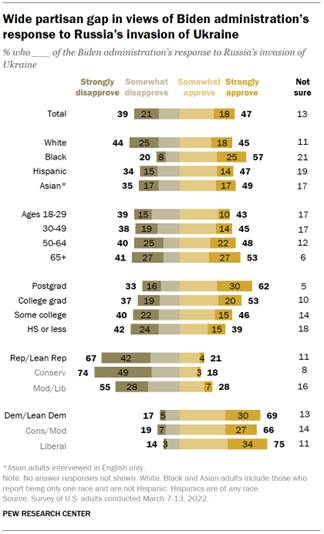
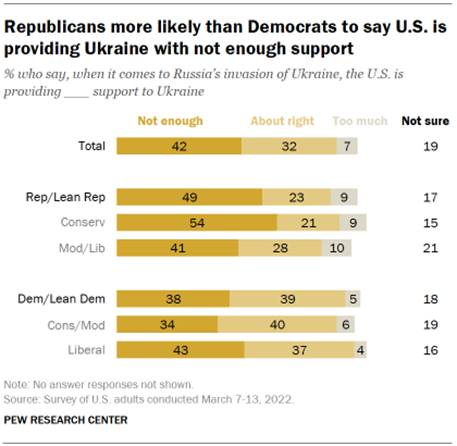
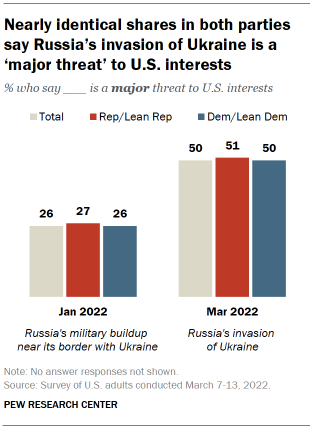
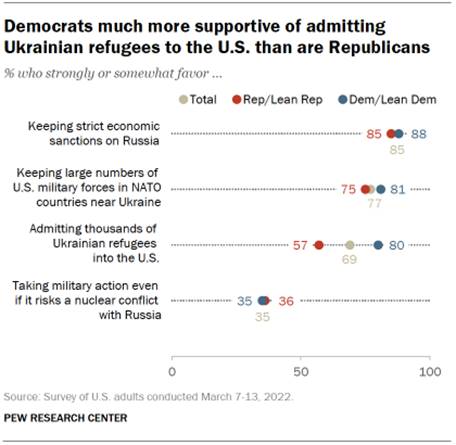
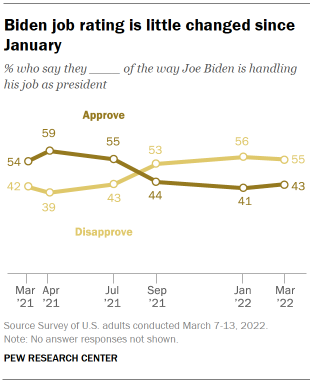
became the first Black American cardinal in 2020. (PEW) 35% Public Favor U S Military Action Even If It Risks
Nuclear Conflict With Russia Three weeks into Russia’s military invasion
of Ukraine, nearly half of Americans (47%) approve of the Biden
administration’s handling of the Russian invasion, while about four-in-ten
(39%) disapprove; 13% say they are not sure. Roughly a third of Americans
(32%) say that the United States is providing about the right amount of
support to Ukraine as it fights to hold off the Russian invasion. A larger
share – 42% – say the U.S. should be providing more support to Ukraine, while
just 7% say it is providing too much support. About one-in-five (19%) say
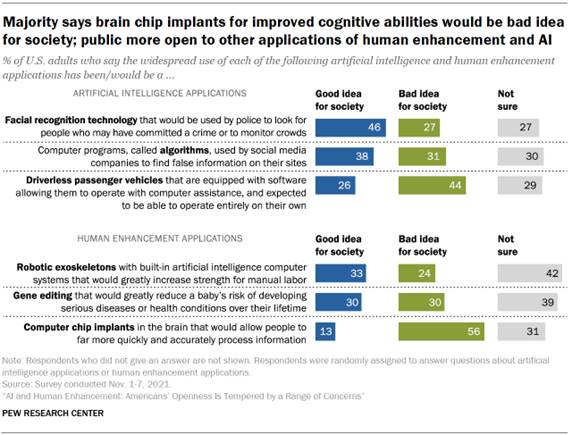
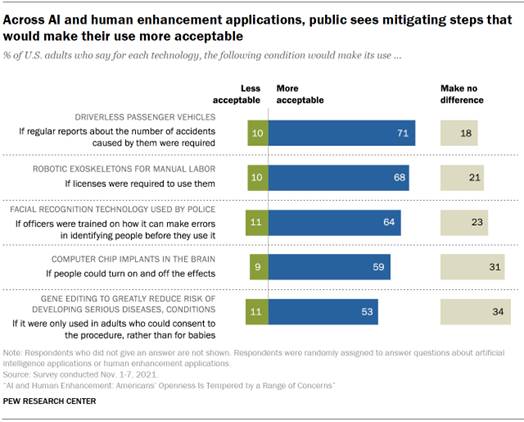
they are not sure. (PEW) 46% Of U S Adults Think Use Of Facial
Recognition Technology By Police Would Be A Good Idea For Society This survey looks at a broad arc of
scientific and technological developments – some in use now, some still
emerging. It concentrates on public views about six developments that are
widely discussed among futurists, ethicists and policy advocates. Three are part
of the burgeoning array of AI applications: the use of facial recognition
technology by police, the use of algorithms by social media companies to find
false information on their sites and the development of driverless passenger
vehicles. 46% of U.S. adults think this would be a good idea for society,
while 27% think this would be a bad idea and another 27% are unsure. (PEW) MARCH 17, 2022 (Canada) Majority (55%) Disagrees That Canada Cannot
Afford To Help Ukraine, But Fewer Than Half (47%) Are Willing To Pay More For
Gas Because Of Sanctions Against Russia As Russia’s invasion of Ukraine enters its
third week, Canadians support increasing sanctions against Russia and support
for Ukraine, but stop short of supporting direct military involvement of
Canadian troops against Russia. As gas prices across the country catapult to
roughly $2 per litre, Canadians are split on whether they’re personally
willing to pay the costs associated with the tough sanctions against Russia. While
half of Canadians (48%) believe that Canada’s level of support to Ukraine
thus far has been about right, on balance the scales tip towards doing more
to help: 39% believe Canada has not done enough to support Ukraine and needs
to do more. (Ipsos Canada) 11 March 2022 Meeting Energy Needs: More Than Half Of Quebecers (52%)
Agree To Developing Own Oil Resources Instead Of Importing All Its Oil The recent geopolitical instability caused
by the war in Ukraine has underlined the importance of rethinking how the
global economy meets its energy needs. In this context, a new Ipsos survey on
behalf of the Montreal Economic Institute shows that more than 52% of
Quebecers think their province should develop its own oil resources instead
of importing all the oil that is consumed – this represents a 9-point
increase compared to last year. Inversely, almost one in three Quebecers
(28%) thinks 100% of the oil consumed should be imported and a fifth (20%)
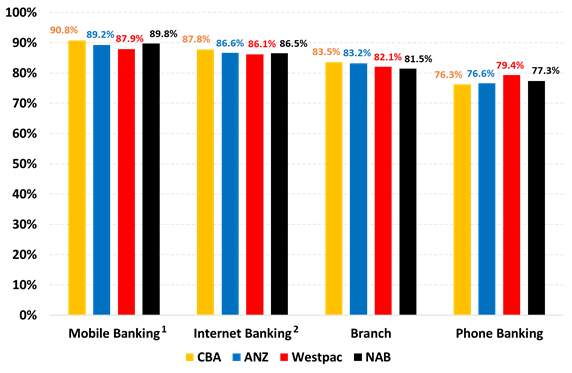
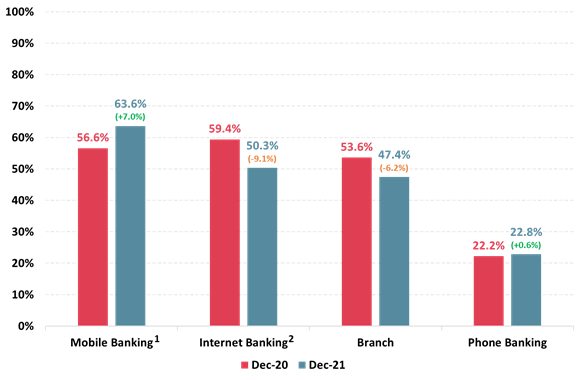
are undecided. (Ipsos Canada) 17 March 2022 AUSTRALIA (Australia) Mobile Banking Apps And The Internet Are More Satisfying
For Customers Than Branch Visits Or Phone Banking As of December 2021, CBA was the strongest
performer of the big four with the highest customer satisfaction across three
of the service channels including mobile banking (90.8%), internet banking
(87.8%) and branch banking (83.5%). The CBA had customer satisfaction of
76.3% for phone banking. There was little to split their three competitors
with ANZ coming in second overall with 89.2% (mobile), 86.6% (internet),
83.2% (branch) and 76.6% (phone). Westpac followed with 87.9% (mobile), 86.1%
(internet), 82.1% (branch) and the highest of the big four for phone banking
(79.4%). NAB rounded out the big four with 89.8% (mobile), 86.5% (internet),
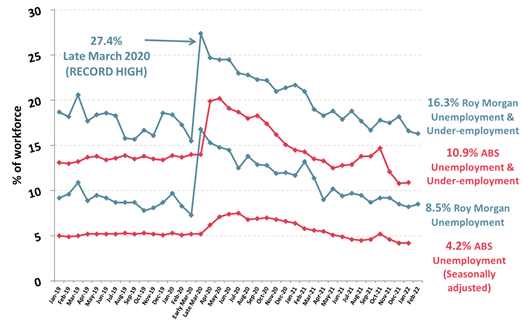
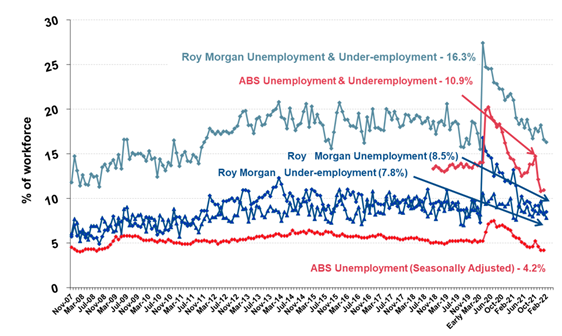
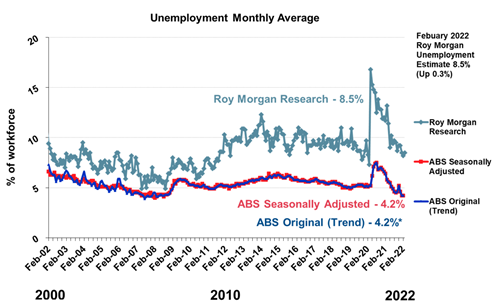
81.5% (branch) and 77.3% (phone). (Roy Morgan) February 28 2022 Australian Unemployment Up To 8.5% In February As Omicron
Variant Slowly Recedes Around Australia And Restrictions Ease The moves in the employment market led to a
rise in Australian unemployment with 1.23 million Australians (8.5% of the
workforce) unemployed in February, up 26,000 on January. The increased
unemployment was driven entirely by an increase in part-time unemployment (up
26,000) as summer jobs came to an end while full-time unemployment was
virtually unchanged. In better news there was a significant drop in
Australian under-employment with 1.13 million Australians (7.8% of the
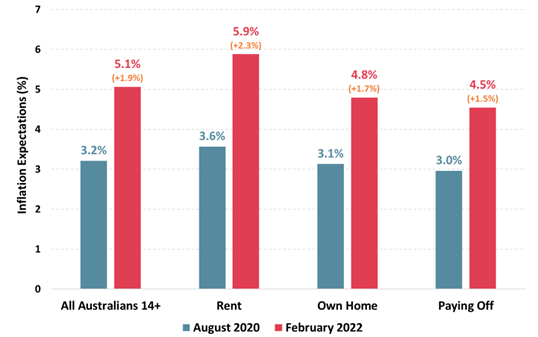
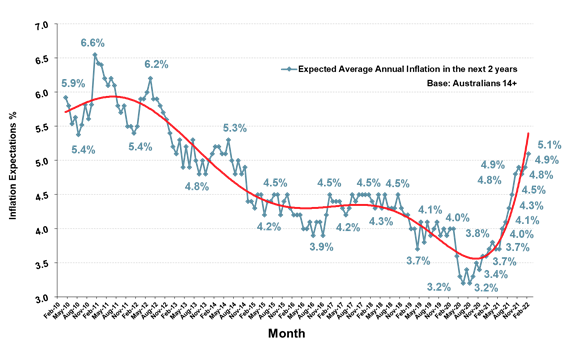
workforce) now under-employed, down 96,000 (down 0.6% points) on January. (Roy Morgan) March 07 2022 Inflation Expectations Up 0.2% Points To 5.1% In February;
Highest For Nearly Eight Years Since June 2014 Inflation Expectations are now 0.4% points
above the long-term average of 4.7% and a large 1.4% points higher than a
year ago in February 2021 (3.7%). A look at Inflation Expectations by home
ownership status in February 2022 shows renters have clearly the highest
Inflation Expectations at 5.9%, up a large 2.3% points since the low point of
August 2020. People who are currently paying off their homes have the lowest
Inflation Expectations at only 4.5% (up 1.5% points since August 2020) while
those who own their own home now have Inflation Expectations of 4.8% (up 1.7%
points). (Roy Morgan) March 15 2022 (New Zealand) 2.9 Million New Zealanders Read Newspapers And Nearly 1.8
Million Read Magazines In 2021 2.9 million, or 69.5%, of New Zealanders
aged 14+ now read or access newspapers in an average 7-day period via print
or online (website or app) platforms. In addition, almost 1.8 million New
Zealanders aged 14+ (42.5%) read magazines whether in print or online either
via the web or an app. These are the latest findings from the Roy Morgan New
Zealand Single Source survey of 6,514 New Zealanders aged 14+ over the 12
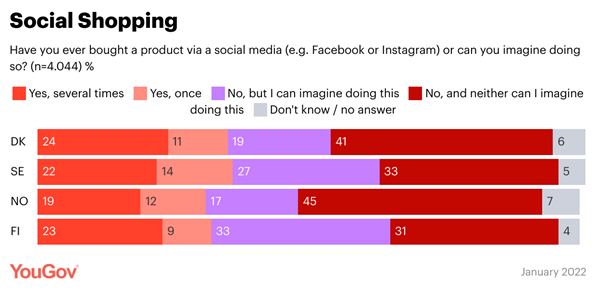
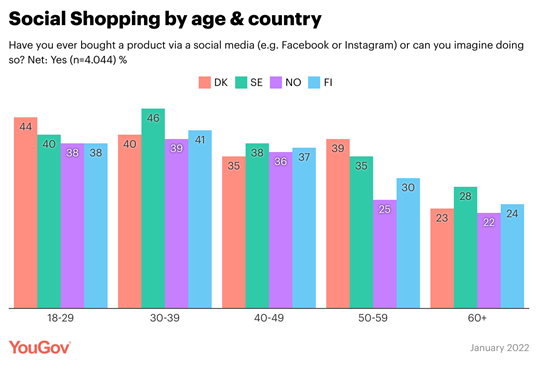
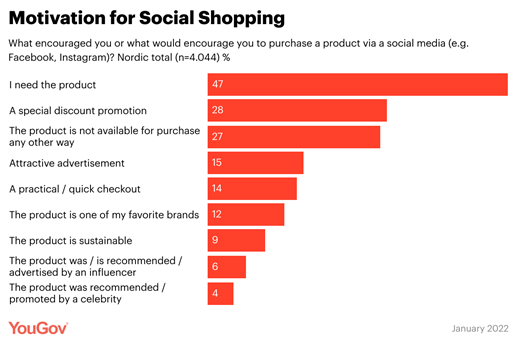
months to December 2021. (Roy Morgan) March 16 2022 MULTICOUNTRY STUDIES Every Third Person Has Shopped Via Social Media In The
Nordic Countries, Survey In 4 Countries 33% of the population in the Nordic
countries have tried social shopping, and 22% shop regularly via social
media. 64% of the population in the Nordic countries have not tried social
shopping; however, 24% can imagine doing so. In Norway, we see the
highest proportion of consumers who have not shopped via social media and can
not imagine it (45%). Denmark has the second largest proportion of consumers
who do not have or want to shop via social media (41%). In Sweden and
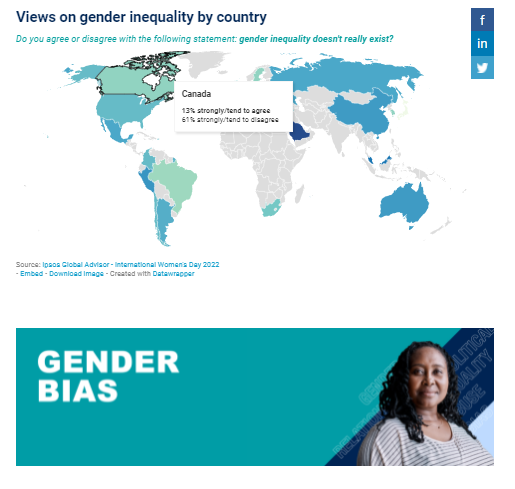
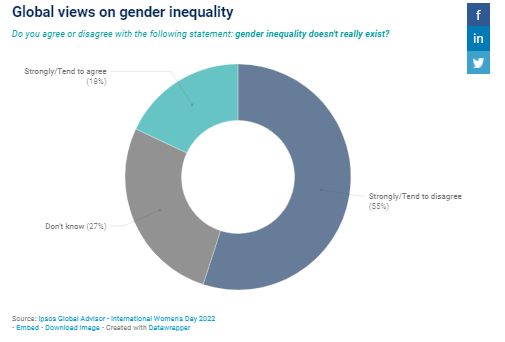
Finland, this second is somewhat lower (32%). (YouGov Denmark) March 3, 2022 Source: https://yougov.dk/news/2022/03/03/hver-tredje-har-shoppet-sociale-medier-i-norden/ A Global Country Average Of 55% Disagree With The Idea That
Gender Inequality Doesn’t Really Exist, Result Of 30-Country Survey One in seven (15%) Britons think gender
inequality doesn’t really exist, with men (19%) more likely than women (11%)
to hold this view, according to a major survey conducted ahead of
International Women’s Day on 8 March. A global country average of 55%
disagree with the idea that gender inequality doesn’t really exist. Men (21%)
are more likely to agree that
this is the case than women (14%), and in several countries, the proportion
of men who agree is double that for women – including Australia (30% vs 14%),
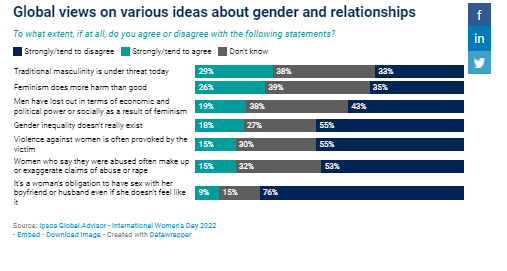
Romania (27% vs 13%) and Russia (30% vs 12%). (Ipsos MORI) 4 March 2022 One In Three Men Says Feminism Does More Harm Than Good; A
Study In 30 Countries Only two in 10 deny that there is gender
inequality, but public opinion is split on the benefits of feminism. Concerns
about online abuse remain, with one in 10 men saying it's acceptable to send
explicit images without the other party's request. Four out of 10 people say
they've been abused or exposed to sexist content online, but one in three say
women overreact. The majority of people globally do not agree that gender
inequality really does not exist. (55%). (Ipsos Turkey) 4 March 2022 Source: https://www.ipsos.com/tr-tr/one-three-men-believe-feminism-does-more-harm-good March 8: Women's Rights Around The World,
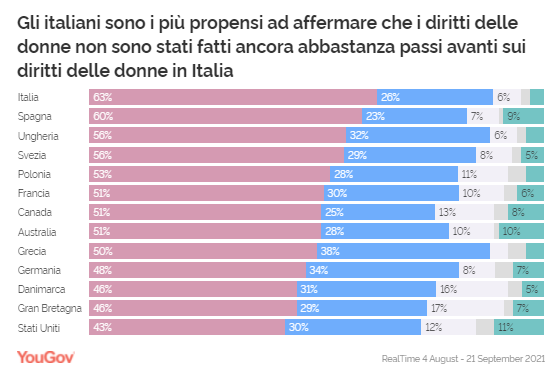
Survey In 13 Countries Data from the YouGov-Cambridge Globalism
Project shows that while some countries are calling for changes abroad, most
people think there is more to be done to advance women's rights in their
countries. Lower percentages of people in Germany (48%), Britain (48%),
Denmark (46%) and the United States (43%) think their countries have not gone
far enough in promoting women's rights. About three in ten (between 34%
and 29%) in each of these nations say that "women's rights have reached
the point where they should be" (YouGov Italy) March 7, 2022 Source: https://it.yougov.com/news/2022/03/07/8-marzo-i-diritti-delle-donne-nel-mondo/ Equal Opportunities And Rights: A Global Picture From 39
Countries WIN International, the world’s leading
association in market research and polling has published the Annual WIN World
Survey – WWS 2021 – exploring the views and beliefs of 33236 individuals
among citizens from 39 countries across the globe. On International Women’s
Day, WIN releases the latest results of the survey about gender equality, violence and sexual harassment,
to understand what are, if any, the improvements around the world in terms of
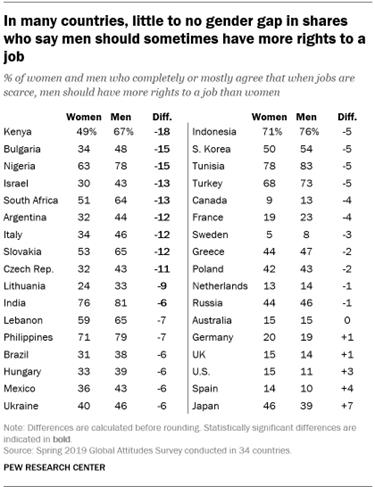
equal opportunities and rights. (WIN) 8 Mar 2022 Source: https://winmr.com/equal-opportunities-and-rights-a-global-picture/ Gap Between Men And Women In Attitudes On Gender Issues In
A Survey In 34 Countries In 14 countries, including Brazil and
Poland, roughly the same shares of men and women say equal rights for women
are very important, and in an additional seven countries, gender gaps on this
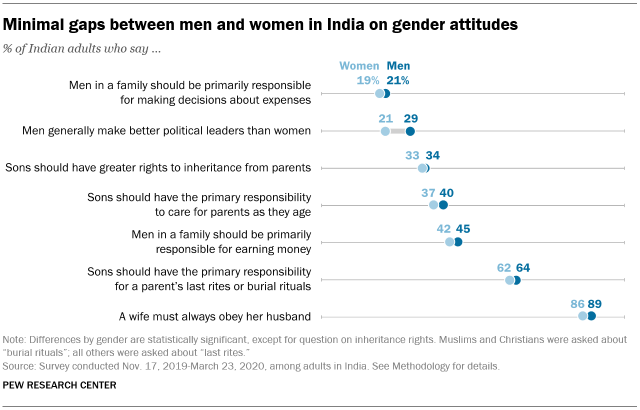
question are 10 percentage points or less. In India, women (75%) are only
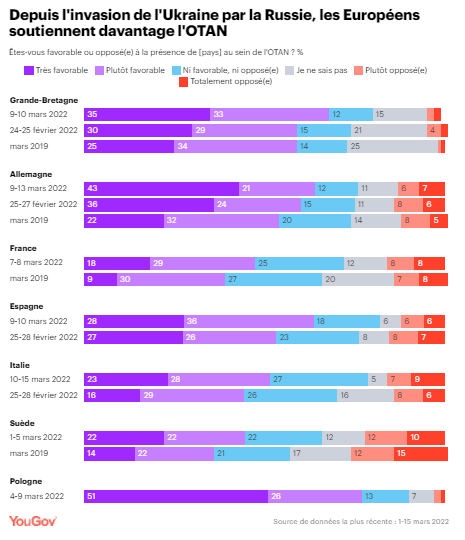
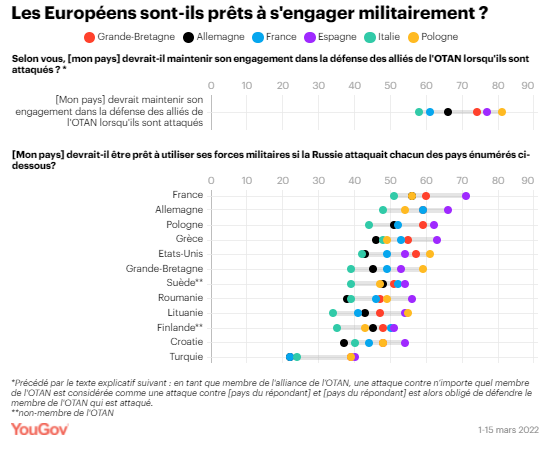
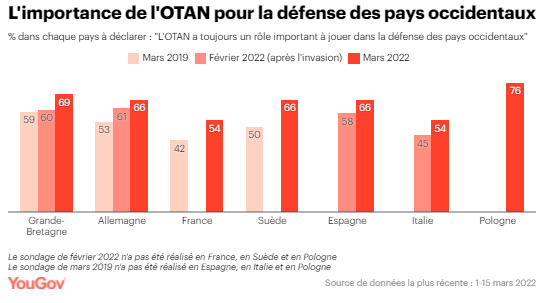
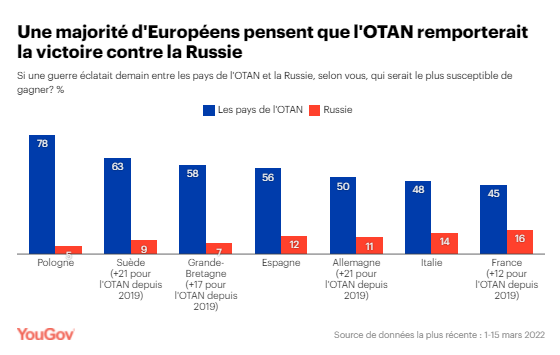
modestly more likely than men (70%) to support equal rights for both genders. (PEW) MARCH 15, 2022 NATO: Has Europeans' Perception Changed Since The Invasion
Of Ukraine, Survey In 7 Countries In Britain, support for NATO membership
rose from 59% in March 2019 to 68% in March 2022*, and in Germany from 54% to
64%. Note: this question used a
five-point scale, including a "neither for nor against" option.
In France, the number of people in favor of the country's presence in NATO
rose by 8 points (from 39% to 47%) , while the opposition remained
stable (15-16%).In Sweden, where NATO membership has long been debated but
remains outside the alliance for the time being, support for membership fell
from 36% in 2019 to 44% in early March. At the same time, the opposition
fell from 27% to 22%. (YouGov France) March 16, 2022 Source: https://fr.yougov.com/news/2022/03/16/OTAN-evolution-perception-des-europeens/ ASIA
732-734-43-01/Polls 40% Of Municipalities Not Gearing Up To
Handle Calamity; Japan Earthquake
Nearly 40 percent of municipalities remain
woefully underprepared to grapple with the prospect of widespread
reconstruction from a natural disaster, according to a survey by the
Ministry of Land, Infrastructure, Transport and Tourism. The central government is pushing local
authorities to develop reconstruction strategies before disaster strikes,
citing the experience of towns, cities and villages in northeastern Japan
devastated by the magnitude-9.0 Great East Japan Earthquake and tsunami 11
years ago. At that time, town development plans
were compiled only after the event, which led to delays in reconstructing
affected areas and helping residents to get back on their feet due to a lack
of data on public land and land registry surveys. The government is calling on municipalities
to develop reconstruction strategies while they continue to step up disaster
preparedness efforts. A 2017 revision to the
government’s basic disaster preparedness plan calls on municipalities to
actively prepare for recovery from disasters. The following year, the government compiled
guidelines on five tasks municipalities need to tackle: deciding which
division will be responsible for rebuilding disaster-hit areas; establishing
procedures for drafting reconstruction plans; training officials; gathering
and analyzing basic data necessary for reconstruction; and setting goals and
creating plans for town development based on estimates of disaster damage and
challenges facing municipalities. In a survey of 1,788 municipalities
conducted by the ministry last year, only about 62 percent said they had
started at least one of the five tasks. In particular, only 6 to 7 percent
said they have worked on training officials, collecting the necessary basic
data or setting town development goals. In a separate ministry survey, some
municipalities said they had no time to spare on following the
guidelines due to other pressing tasks, while others said they have no
idea what they are supposed to do. The government will start drafting new
guidelines from April to urge municipalities to have reconstruction
strategies in place. It will also send experts to municipalities upon
request. Under the new guidelines, the government
will give specific examples of what preparations municipalities should make
based on, among other things, whether they are urban or regional areas or
coastal regions prone to tsunami. (Asahi Shimbun) March 2, 2022 Source: https://www.asahi.com/ajw/articles/14561820 732-734-43-02/Polls South Koreans Vote For President In Tight,
Bitter Election
SEOUL--South Koreans were voting for a new
president Wednesday, with an outspoken liberal ruling party candidate and a
conservative former prosecutor considered the favorites in a tight race that
has aggravated domestic divisions. Pre-election surveys showed liberal Lee
Jae-myung, a former governor of South Korea’s most populous Gyeonggi
province, and his main conservative challenger, ex-prosecutor general Yoon
Suk Yeol, with neck-and-neck support, way ahead of 10 other contenders. The
winner will take office in May and serve a single five-year term as leader of
the world’s 10th-largest economy. Lee and Yoon conducted one of the most
bitter political campaigns in recent memory. Both recently agreed that if
they won they would not conduct politically motivated investigations against
the other, but many believe the losing candidate could still face criminal
probes over some of the scandals they’re been implicated in. Critics say neither candidate has presented
a clear strategy on how they would ease the threat from North Korea and its
nuclear weapons. They also say voters are skeptical about how both would
handle international relations amid the U.S.-China rivalry and how they would
address widening economic inequality and runaway housing prices. “Despite the significance of this year’s
election, the race has centered too much on negative campaigning,” said Jang
Seung-Jin, a professor at Seoul’s Kookmin University, adding that neither
leading candidate laid out a convincing blueprint on how they would lead
South Korea. The election comes as South Korea has been
grappling with an omicron-driven COVID-19 surge. On Wednesday, South Korea’s
health authorities reported 342,446 new virus cases, another record high. After the voting began at 6 a.m.,
masks-wearing voters waited in long lines at some polling stations before
putting on vinyl gloves or using hand sanitizers to cast ballots. People
infected with the coronavirus were to vote after regular voting ends
Wednesday evening. About 44 million South Koreans aged 18 or
order are eligible to vote, out of the country’s 52 million people. About 16
million cast ballots during early voting last week. About 3 1/2 hours after
Wednesday’s voting began, the turnout stood at 8.2 %, according to the
website of the National Election Commission. Ahead of the vote, Jeong Eun-yeong, a
48-year-old Seoul resident, said she was agonizing over which candidate is
“the lesser of two evils.” “Nobody around me seems happy about voting”
for either Lee or Yoon, she said. “We need a leader who would be really
devoted to improving the lives of working-class citizens.” While both Lee and Yoon share some similar
economic and welfare policies, they’ve clashed over North Korea and other
foreign policy issues. Lee, who has often expressed nationalistic
views, calls for exemptions to U.N. sanctions so that dormant inter-Korean economic
projects can be revived, and hopes to mediate between Pyongyang and
Washington over the North Korean nuclear crisis. Yoon, for his part, says he
would sternly deal with North Korean provocations and seek to boost
trilateral security cooperation with Washington and Tokyo. On confrontation between Washington,
Seoul’s top military ally, and Beijing, its biggest trading partner, Lee says
picking a side would pose a greater security threat to South Korea. Yoon
wants to place a priority on an enhanced alliance with the United States. After North Korea’s latest reported
ballistic missile launch Saturday, Yoon accused North Korean leader Kim Jong
Un of trying to influence the results of the South Korean election in favor
of Lee. “I would (teach) him some manners and make
him come to his senses completely,” Yoon told a rally near Seoul. Lee wrote on Facebook that he would push
for a diplomatic solution to North Korean nuclear tensions but won’t tolerate
any act that would raise animosity. South Korea’s constitution limits a
president to a single five-year term, so Lee’s party colleague, President
Moon Jae-in, cannot seek a reelection. Moon came to power in 2017 after
conservative President Park Geun-hye was impeached and ousted from office
over a huge corruption scandal. With conservatives initially in shambles
after Park’s fall, Moon’s approval rating at one point hit 83% as he pushed
hard to achieve reconciliation with North Korea and delve into alleged
corruption by past conservative leaders. He eventually faced strong backlash
as talks on North Korea’s nuclear program faltered and his anti-corruption
drive raised questions of fairness. Yoon had been Moon’s prosecutor general but
resigned and joined the opposition last year following infighting over probes
of Moon’s allies. Yoon said those investigations were objective and
principled, but Moon’s supporters said he was trying to thwart Moon’s
prosecution reforms and elevate his own political standing. Yoon’s critics have also attacked him over
a lack of experience in party politics, foreign policy and other key state
affairs. Yoon has responded he would let experienced officials handle state
affairs that require expertise. Lee, a former human rights lawyer who
entered local politics in 2005, has established an image as a tough-speaking,
anti-elitist who can get things done and fix establishment politics. But his
opponents call him a dangerous populist relying on divisions and demonizing
opponents. Yoon has launched a political offensive on
Lee over allegations that Lee is a key figure in a corrupt land development
project launched in the city of Seongnam when he was mayor there. Lee has
tried to link Yoon to that scandal. Both of their wives have offered public
apologies over separate scandals. Whoever wins will likely struggle to bridge
conservative-liberal divisions, some experts say. “Both candidates have failed to create
their own, distinctive images because they became absorbed in party
allegiances amid partisan animosity, so the race was defined by negative
campaigning,” said Shin Yul, a politics professor at Seoul’s Myongji
University. “Whoever wins will be tasked with an important but difficult task
of healing the divisions.” (Asahi Shimbun) March 9, 2022 Source: https://www.asahi.com/ajw/articles/14567802 732-734-43-03/Polls 7 Out Of 10 Women Cannot Participate In
Working Life Without Getting Permission From Their Husbands
An important problem faced by women is
their inability to be economically independent. Even today, 7 out of 10 women say that they
cannot participate in working life without the permission of their husbands
and family, and because they do not have economic independence, they cannot
be decision-makers both inside and outside the home. In addition, the opinion
that women are exposed to discrimination in business life is a very dominant
opinion. 65% of women think they are discriminated against at work, do not
have equal rights to promotions and 55% think they are paid less than men for
the same job. Although the participation rate of men in these issues is
lower, in general, half of the men have a similar opinion with women.
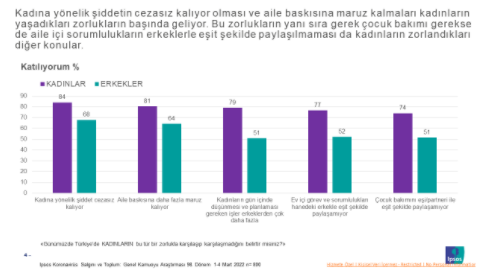
Impunity for Violence Against Women The
Most Important Challenge for 84% of Women In addition to impunity for violence
against women, family pressure is another important problem faced by women.
Apart from these two issues, women's domestic responsibilities and the fact
that these responsibilities are not shared equally with their husbands are
other issues that women say they have difficulty with. Although the rate of
answers given by men to these issues is lower, 7 out of 10 men still think
that violence against women goes unpunished.
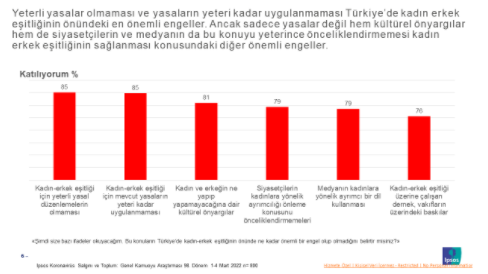
85% of the Society State that Lack of
Sufficient Laws and Implementation of Existing Laws Are the Most Important
Obstacles to Ensuring Gender Equality in Turkey In addition to the inadequacy and
non-implementation of the laws, cultural prejudices are another important
obstacle to the lack of equality between women and men. Apart from these two
main issues, the fact that both the politicians and the media do not pay
enough attention to this issue is stated by 80% of the society as another
important obstacle in this regard.
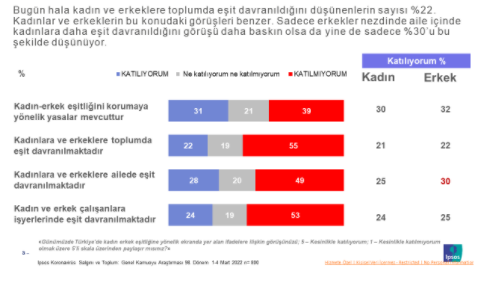
The Proportion of Those Who Think Men and
Women Are Treated Equally in Turkey Only 22% While 22% of the society think that men and
women are treated equally, 55% think that they are not treated equally. The
opinions of men and women are similar in this regard. Half of the society
thinks that men and women are not treated equally, both within the family and
at work. The rate of those who think that there are laws to protect the
equality of women and men is only 31%.
Ipsos, Social Research and Qualitative
Research Service Units Leader, Executive Board Member Ece Ertürk made the
following evaluations about the data; Although we feel its visibility and
priority in the agenda more in certain periods, gender inequality (not only
in Turkey but also in the world) is a social problem that both women and men
agree with the negative aspects of the issue. We see that the perception that women and
men are not treated equally in society in Turkey is an accepted reality
regardless of gender. 70% of the society thinks that there are no laws to
protect gender equality. Although there is a common opinion about gender
inequality in society and business life, men are more positive than women in
terms of equality within the family. While impunity for violence against
women and family pressure stand out as the most fundamental social problems,
the unequal distribution of domestic and child-related responsibilities,
which we felt the reflections of during the pandemic period, are other
problems that should be taken into account. Economic independence and equal
access to resources that can lead women to economic independence, as one of
the issues that affect women's stance both in society and in the family, are
also among the social issues that need attention and improvement. Today, 70%
of women still cannot participate in working life without the permission of
their families and spouses. Again, a similar number of women do not
have economic freedoms, so they cannot be the decision maker in matters both
inside and outside the home. The existence and correct implementation of the
necessary laws for a more egalitarian and inclusive social order; At the same
time, the prioritization and ownership of the gender issue by both
politicians and the media in a more concrete and continuous manner, which is
independent of the agenda, seems to be the first action that will meet the
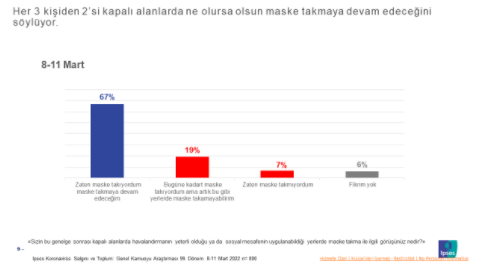
social expectation on this issue and provide improvement. (Ipsos Turkey) 7 March 2022 Source: https://www.ipsos.com/tr-tr/10-kadindan-7si-esinden-izin-almadan-calisma-hayatina-katilamiyor 732-734-43-04/Polls 67% Of Turkish People Express That They
Will Continue To Wear Masks No Matter What Happens Indoors
While 6 out of 10 people evaluate the
decision to remove the obligation to wear masks in open areas as correct,
removing the mask requirement in closed areas when social distance or
ventilation is sufficient is considered a wrong decision by more than half of
the society.
And 67% of individuals say that they
already wear masks in closed places and will continue to wear them. However,
the rate of those who do not wear masks or who say they will no longer wear
masks is not low. 1 out of every 4 people states that they will not wear a
mask in such places. Only 1/3 of the society thinks that the HEPP code will
not be requested both when entering closed areas and for travels such as
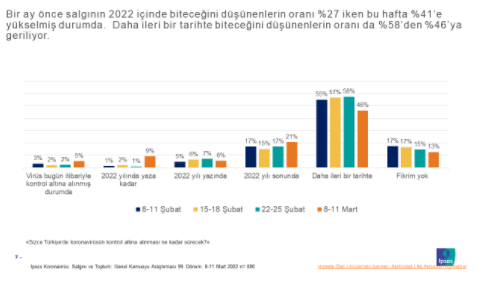
buses and planes, only 1/3 of the society is the right decision. The Most Concern for Individuals Is That
The PCR Test Is Not Required During Travel By Airplane. The Proportion of
Those Who Think This Decision Is Right Only 27%
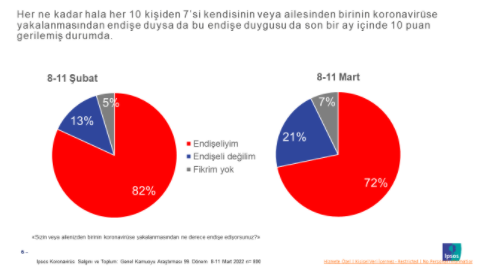
The Anxiety of Individuals Also Decreases. Although 72% of the society is still
worried about catching the coronavirus, this rate was 82% of those who stated
that they were worried a month ago. It is seen that there is a 10-point
decrease in the sense of anxiety within a month. The percentage of those who
say they are not worried has increased from 13% to 21%.
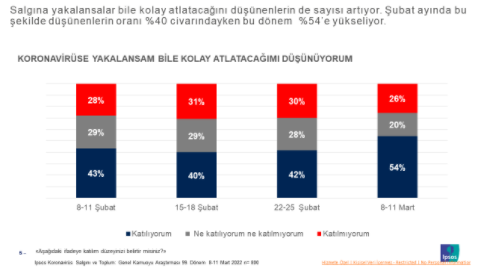
Even if they are caught with this virus,
the belief that it will be easily overcome is also increasing. Although 3 out of 10 people still think
that they will get through this virus even if they get it, the increase in
the number of people who think that they will get over it easily is quite
remarkable. A month ago, the rate of those who thought that they would get
over this virus when they were caught was 43%, but today, 54% of individuals
believe that they will get over it easily.
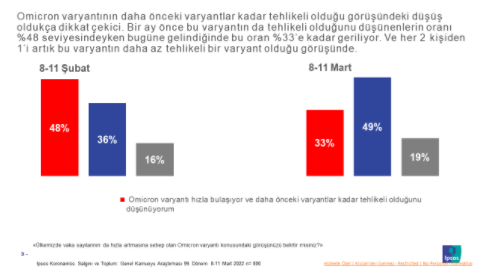
Omicron Variant Considered Less Dangerous
Than Other Variants A month ago, half of the population thought
that the Omicron variant was as dangerous as the previous variants, but today
the perception of danger created by this variant has declined considerably.
Today, the rate of those who think that this variant is also dangerous is
33%. And the rate of those who think it is not dangerous rises to 49%.
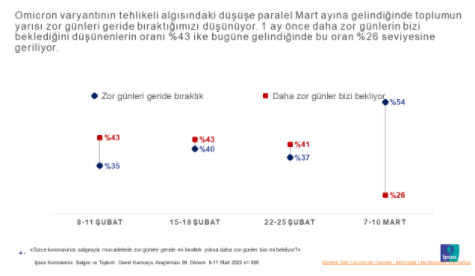
Half of the Society Says We Have Left the
Hard Days Behind Parallel to the fact that the Omicron
variant is found to be less dangerous, the rate of those who think that the
difficult days are behind, is 54%. This rate was 35% exactly one month ago.
Sidar Gedik, CEO of Ipsos Turkey, made the following
evaluations about the data; We have always witnessed controversial processes
from the beginning of the epidemic. Let's remember, the World Health
Organization said that masks should not be worn in the first days of the
epidemic, then recommended the opposite. The vaccine development process led
to separate discussions, and the production methods of the developed vaccines
created different differences of opinion. The fronts of support for,
distrust, and anti-vaccine are still controversial. With or without
restrictions, their content has always been on the agenda. There were also
long discussions on the economic support packages for the epidemic. In the
past month or two, the questions of whether the end of the epidemic is in
sight or do we still have a way to go have been on the agenda. While there was no vaccine in 2020, the
number of cases in the thousands caused us to wash packaged foods with soap,
and towards the end of 2021, even the number of cases expressed in hundreds
of thousands -with the convenience of vaccines- did not cause much panic.
This state of relaxation is getting stronger. Even in just 1 month, we
observe great relief. The proportion of people who think that Omicron is as
dangerous as the old variants has dropped from almost 50% a month ago to
one-third now. Now, more than half of the citizens believe that even if they
get sick, they will get over it easily. In the last month, there has been a
10% decrease in the rate of those who are worried that they or a family
member will get the disease. The relaxation of restrictions accelerated
the relief. The rate of those who think that we have left the difficult days
behind in the epidemic was 35% at the beginning of February, this rate
remained at approximately this level until the end of February. As of March
7, it rose to 54%. Now, more than half of the society thinks that the next
process will be an easier one. A month ago, the rate of those who believed
that the epidemic would end by the end of this year was 27%, last week this
rate increased to 41%. Those who, for the first time, point out after 2022 in
response to this question, are in the minority. As I mentioned, we are experiencing faster
relief with the relaxation of restrictions. It is a fact that society needs
this relief materially and morally. Citizens strongly support the abolition
of the mask requirement in the open air, and six out of ten people agree with
this decision. However, when it comes to the use of masks in closed areas,
the abolition of the HES code application in public transport-shopping
centers, the requirement for PCR negative test results on plane trips, the
table is reversed. More than half of the citizens do not support the
relaxation decisions on these issues. There are differences of opinion among citizens
about the use of masks in closed areas. While two out of three people state
that they will continue to use masks indoors, the rest, except for a small
group of people who have no idea about this, state that they will not wear
masks indoors. The other day, I witnessed a small quarrel between two people
in the supermarket about the use of masks, both people were very confident,
but the principles regarding the use of masks in a closed environment are
quite vague and the situations I witnessed seem to happen frequently. (Ipsos Turkey) 15 March 2022 Source: https://www.ipsos.com/tr-tr/cogunluk-kapali-alanlarda-maske-takmaya-devam-edecegim-diyor 732-734-43-05/Polls More Than Half (52%) Of
Celebrity-Influenced Buyers Prefer Making Purchases Over The Web Than In
Physical Stores In Singapore
They’re all popular celebrities in
Singapore and have served as brand ambassadors for various e-commerce
platforms – including Shopee, Lazada and Qoo10. But are endorsements by popular media
personalities useful in encouraging Singapore consumers to online shop more? Should e-commerce brands rope in
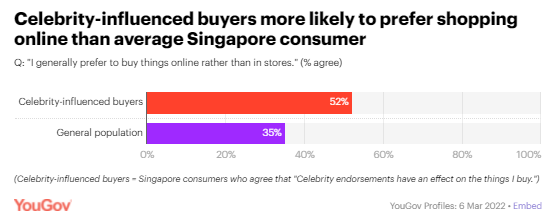
celebrities to provide endorsements? Latest data from YouGov Profiles suggest that celebrity endorsements
can encourage greater e-commerce spending in Singapore. Celebrity-influenced
buyers – consumers who agree that celebrity endorsements have an effect on
the things they buy – are more likely to prefer shopping online than the
average consumer in Singapore. While slightly more than half (52%) of
celebrity-influenced buyers prefer making purchases over the web than in
physical stores, just over one-third (35%) of Singapore consumers in general
prefer buying things online than offline.
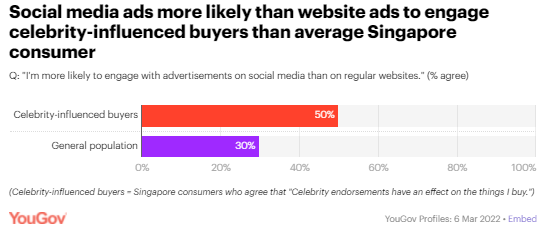
How should e-commerce brands target
celebrity-influenced buyers? Additionally, as of March 2022, one in two
celebrity-influenced buyers (50%) say that social media advertisements are
better at getting their engagement compared to regular webpage
advertisements. In contrast, less than one in three consumers (30%) in
Singapore as a whole say they are more likely to engage with ads on social
media platforms than those on regular websites.
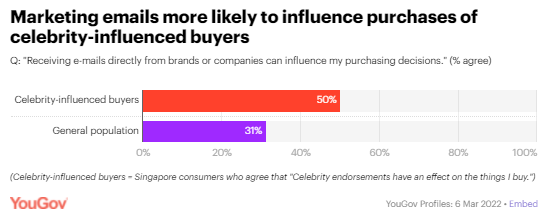
Further, celebrity-influenced buyers are
more likely to agree that receiving electronic and printed marketing mailers
from brands can influence their purchasing decisions. In the case of
marketing emails, half of celebrity-influenced buyers (50%) say these can
influence what they buy, compared to less than one third of Singapore
consumers (31%) in general.
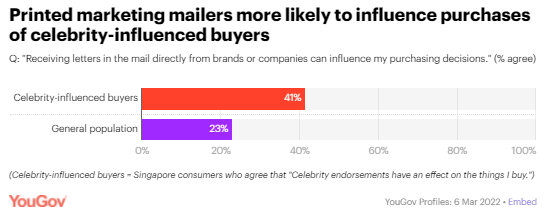
In the case of printed mailers, about two
in five celebrity-influenced buyers (41%) say these can influence what they
buy, compared to over one in five consumers (23%) in Singapore as a whole.
(YouGov Singapore) Source: https://sg.yougov.com/en-sg/news/2022/03/15/celebrity-endorsements-online-shopping-impact-poll/ 732-734-43-06/Polls Singaporeans would like to sleep for at
least seven hours but only a quarter have that routine
Singaporeans have been cited as being
amongst the most sleep deprived globally. While the National Sleep Foundation
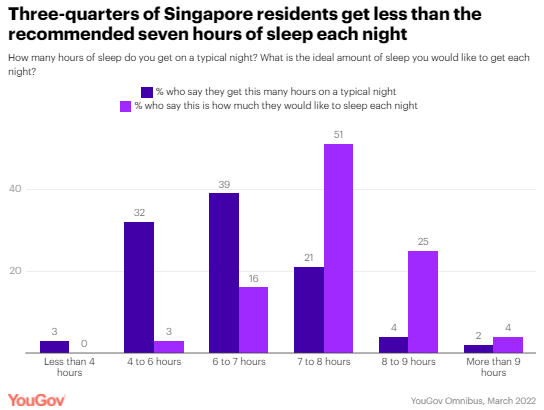
recommends at least seven hours of sleep each night, YouGov’s latest survey reveals only one
in four people in Singapore (27%) have an ideal sleep cycle (of 7 hours or
more). It is most common for Singaporeans to
get six to seven hours of sleep a night (39%), followed by four to six hours
(32%). Residents also generally sleep less than they would like – a
substantial eight in ten (80%), wish they had seven or more hours of sleep on
the daily, but only a quarter (27%) actually do.
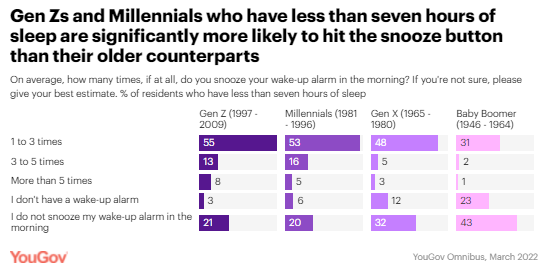
Among these sleep-deprived adults, six in
ten snooze their wake-up alarms in the morning (59%). Gen Zs and Millennials
are significantly more likely to hit the snooze button (76% for Gen Zs, 74%
for Millennials), while Baby Boomers are most likely to either not snooze
their alarms (43%) or not have any alarms at all (23%), likely due to many in
this group being retired.
As for how good or bad these hours of sleep
are, fewer than one-fifth of all respondents say they sleep through the night
(17%), as compared to one-quarter (23%) who said
the same when a similar study was run by YouGov in 2018, which could point to a declining sleep
quality. Those who wake up in the middle of the night are most likely to stir
between one and three times (72%). (YouGov Singapore) Source: https://sg.yougov.com/en-sg/news/2022/03/18/singaporeans-would-sleep-least-seven-hours-only-qu/ MENA
732-734-43-07/Polls A Majority Of KSA Residents Are Aware Of
Cryptocurrencies, But Only A Few Invest In Them
YouGov's latest survey shows that digital
banking has become increasingly popular in Saudi Arabia, with nine out of ten
respondents (91%) saying they prefer banking online. In addition to this, 86%
of respondents have even shown an intent to switch to digital-only banking
methods in the future. Digitization has not just revolutionised
banking but also facilitated the growth of digital currencies. Over the last
few years, the cryptocurrency market has rapidly expanded. Data shows that in
Saudi Arabia, cryptocurrency has as an asset class has generated a fair
amount of awareness, and more than three-quarters of residents (77%) claim to
be aware of it. While awareness is high, only 18% currently
trade in cryptocurrencies. Young adults between 25-34 years are more likely
to say they are dealing in cryptocurrencies (at 25%), while older adults aged
45+ seem hesitant and don’t intend to deal with it (37%).
Popularity of cryptocurrencies is also
higher among high-income households (earning SAR 30,000+), and they are more
likely than others to trade in this asset class. Despite the small number of active crypto
investors in the country, the future of this digital asset looks promising as
more than a third (34%) of surveyed respondents who are aware about
cryptocurrencies said they intend to invest in them. The idea of investing in
crypto is more appealing to men than women (36% vs 30%). A quarter (25%) of those aware, do not
intend to invest in cryptocurrency and almost as many (23%) are simply
unaware of it. Currently, the key motivation for most KSA
residents who either invest or plan to invest in digital currencies is the
easy accessibility of virtual coins for trading (49%). High returns compared to other investments
(43%) comes as the second biggest motivator, and this aspect has a higher
appeal among 45+ adults as compared to the rest.
Many invest in crypto to diversify their
portfolio (38%), because they consider this mode secure (27%), transparent
(15%) or because they think it is a long-term investment option (20%). Few
invest based on recommendations from friends and family (13%). Crypto as a means of diversifying
investment portfolio is considered to be more of a stimulating reason for high-income
individuals earning 30,000+, while recommendations from friends and family is
more important to those earning SAR 2000 to 15000 than others. Although people are motivated to invest in
cryptos, there are many who deter from investing in this asset. Almost two in
five (37%) KSA residents who do not plan to invest in cryptocurrencies
consider the volatility and instability of the virtual currency market as the
key factor discouraging them from investing.
No past investment experience (36%) and lack
of knowledge (31%) are also seen as top deterrents. Women are more
likely than men to cite these reasons for not investing. Religion beliefs (15%) and cybersecurity
threats (13%) are some other reasons for not wanting to invest in them. (YouGov MENA) Source: https://mena.yougov.com/en/news/2022/02/28/majority-ksa-residents-are-aware-cryptocurrencies-/ AFRICA
732-734-43-08/Polls Over 3 In 10 Nigerians Have Experienced
Bullying In Secondary School
A new public opinion poll conducted by
NOIPolls has revealed that 34 percent of adult Nigerians have disclosed that
they experienced some form of bullying during their secondary school days.
More findings from the poll revealed that physical (65 percent), extreme
punishment (46 percent) and exploitation (24 percent) are the top three forms
of bullying mostly experienced in various secondary schools across the
country. Reports of bullying of students across
secondary schools in Nigeria is now becoming the norm. Some of the victims
suffer physical and mental trauma, while others lose their lives in the
process. Very recently, 12-year-old, Sylvester Oromoni, a Junior Secondary
School 2 (JSS2) student of Dowen College, in the Lekki axis of Lagos State,
tragically died under controversial circumstances leading to a public outcry.
The late Dowen student was reportedly said to have been bullied by the boys
in his school who were quite older than him.[1] Insights from the poll results further
revealed that 82 percent of adult Nigerians interviewed believe that bullying
in secondary schools in the country is prevalent. However, it is worrisome
that out of the (34 percent) who have been bullied before, (70 percent) did
not report the incident while (27 percent) said they reported the incident.
Also, of the (27 percent) who mentioned that they reported, (41 percent) of
them claimed that nothing was done to the perpetrators after they were
reported. Opinions on causes of bullying revealed cultism as the main cause
of bullying in secondary schools as stated by (27 percent) of the respondents
interviewed. While this is followed by those who attributed it to poor
upbring (19 percent), 17 percent ascribed it to lack of morals and fear of
God. With regards to the solution to this
menace, 31 percent of the respondents recommended that CCTV cameras should be
installed to monitor activities in secondary schools. Also, 14 percent
advocated for a policy on bullying given that there are no specific
anti-bullying laws and policies implemented in secondary schools. Given the
current situation, there is an urgent need for extensive implementation of
legislations that will define prohibited bullying behaviours, reporting
requirements, investigation process, and method of sanctions. These are the
key highlights from the Bullying Poll conducted in the week commencing February 14th,
2022. Survey Background The word “Bullying” can be described as
seeking to harm, intimidate or coerce someone or people perceived as
vulnerable, whereas, bullying in schools refers to one or more perpetrators
who have greater physical or social power than their victim and act
aggressively towards their victims by verbal or physical means. Bullying
comes in different forms i.e., Emotional, Verbal, Physical, Exploitation etc.
Bullying in secondary schools in Nigeria has existed since time immemorial
especially in the boarding system and usually centers on students in the
lower cadre. Senior students tend to intimidate the junior students either
for gratification, maintaining the superiority status or just simply for the
fun of it. Some teachers or staff sometimes also pick on students for
no just cause. The effects of bullying are numerous and
are mostly negative as they tend to affect the emotional, mental, and
physical wellbeing of the victims. Emotional, verbal bullying and
exploitation affects the victim’s self-esteem, mind-set and also instills
fear and paranoia in the victim to the extent of losing concentration, focus
and confidence in the classroom and also socially. Physical bullying leads to
physical pain, ailments, fractures and sometimes death. An incident that
occurred in Lagos State Nigeria, shocked the nation as Sylvester Oromoni, a
12-year-old student in a private boarding school was alleged to have been
bullied by his school mates. He was claimed to have been beaten, assaulted
and poisoned, an incidence that led to his death. The case is still a matter
of jurisprudence. Exploitation leads the victims to starvation or
malnutrition, mental disorientation because their provisions or pocket money
have been seized. The most impactful side effect is the unending vicious
cycle of bullying that lingers for years unending. First step to mitigate against bullying is
creating awareness on the ills and dangers of bullying and the negative
effects it has on students’ who desire to acquire quality education in a
conducive environment. School administrations should pay close and proper
attention to the activities of the students during school hours and even
after, fostering a harmonious student relationship. Guidance and Counselling
centers should be established in secondary schools for easy access to address
students’ academic, vocational, individual challenges and social adjustment
needs. Parents and Guardians should also ensure they pay keen attention to
their children’s or wards’ behavior in order to notice any changes either
physical or emotional. Schools should treat each reported incident of
bullying with utmost attention and quick resolution and most importantly
adopt a Zero tolerance to bullying. These and many more will help rid the
country of the ugly menace of bullying in schools. Against this backdrop,
NOIPolls conducted a survey to gauge the pulse of Nigerians regarding
bullying in secondary schools. Survey findings The first question sought the publics
understanding of bullying in secondary school and the result revealed that
most adult Nigerians (77 percent) understand it as intimidating or
threatening of junior students by senior students in secondary schools. With regards to prevalence, an overwhelming
proportion of Nigerians (82 percent) believe that the issue of bullying in
secondary schools in Nigeria is prevalent. The South East zone had more
respondents (95 percent) who mentioned that it is prevalent in the
region.
There are various ways and types of
bullying however, when respondents were asked of the type of bullying they
are aware of, (83 percent) of respondents mentioned physical bullying and
this cuts across gender, geo-political zones and age-group with at least 77
percent representation. Other types of bullying mentioned includes extreme
punishment (39 percent), verbal bullying (37 percent), emotional bullying (26
percent) and exploitation bullying (17 percent).
Furthermore, the survey result showed that
97 percent of the respondents interviewed disclosed they attended secondary
school in Nigeria while a minor 3 percent stated otherwise.
Subsequently, 97 percent respondents who
admitted that they attended secondary school in the country were further
probed and the findings revealed that while (33 percent) were boarders, (67
percent) were day students.
Irrespective of whether the respondents
were boarders or day students, 34 percent mentioned that they had experienced
at least one form of bullying during their secondary school days. On the other
hand, 66 percent stated that they did not experience any bullying during
their days in secondary school. Analysis by age-group showed that
respondents aged 18 – 35 years accounted the highest proportion who
experienced bullying in secondary school than other age category. This points
to the fact that bullying in secondary school is becoming a growing concern.
Respondents were further probed, and the
poll result revealed that majority of the respondents (65 percent)
experienced physical bullying when they were in secondary school. This is
followed by those who experienced extreme punishment (46 percent) and
exploitation (24 percent) amongst others forms of bullying.
With regards to taking action, it is
gratifying to note that (27 percent) of the respondents were courageous
enough to report the incidence to the authorities. However, it is worrisome
to note that majority of those that were bullied did not take any action.
Furthermore, findings revealed that (41
percent) of the respondents who reported the incidence claimed that no action
was taken against perpetrators. However, (28 percent) stated that the
perpetrators were cautioned while (13 percent) asserted that the parents of
the perpetrators were invited to the school.
With regards to causes of bullying in
secondary schools, cultism (27 percent), Poor upbringing (19 percent), Lack
of morals and the fear of God (17 percent) were the top three causes
responsible for bullying in secondary schools in the country amongst other
causes mentioned.
In terms of proffering solutions, the top
three solutions recommended by the respondents are installation of CCTV
cameras to monitor activities in secondary schools (31 percent), schools
should ensure strict rules on bullying (14 percent) and praying about the
incidence (14 percent).
Conclusion In conclusion, the poll has clearly
revealed that, undoubtedly, there is a significant problem in the occurrence
of bullying in secondary schools in Nigeria as 82 percent stated that it is
prevalent. Also, 34 percent of the respondents interviewed disclosed that
they had experienced one form of bullying during their days in secondary
school. Age group analysis on personal experience of bullying also concurs
that bullying is becoming an growing concern. Finally, bullying should be seen as the
responsibility of everyone including the government, educators, policymakers,
police, parents, community organizations, religious organizations, and
students themselves to see to it that bullying is reduced to the minimum or
is eliminated permanently from secondary schools. As advocated by 14 percent
of the respondent, it is important that a policy on bullying should be
implemented given that there are no specific anti-bullying laws and policies
in secondary schools. Therefore, there is the need for extensive
implementation of legislations that will define prohibited bullying
behaviors, reporting requirements, investigation process, and method of
sanctions. (NOI Polls) March 3, 2022 Source: https://noi-polls.com/over-3-in-10-nigerians-have-experienced-bullying-in-secondary-school/ 732-734-43-09/Polls 82% Nigerians See Discrimination Against
Women
A new public opinion poll conducted by
NOIPolls has revealed that there is discrimination against women in Nigeria
as stated by 82 percent of adult Nigerians. Additionally, analysis by geographical
locations indicates that the North-East zone had more respondents (89
percent) who made this assertion. Similarly, there are more female (86
percent) than male (78 percent) respondents in this category. This is not particularly surprising given
that women have continued to fight for the protection of their rights in
Nigeria. Unfortunately, the Gender and Equal
Opportunity Bill which seeks gender equality in the country recently suffered
another setback at the National Assembly. On March 1st, 2022, despite
extensive lobbying, sensitization, consultation, and advocacy, the 9th National
Assembly joined previous ones to legislate over and legitimize the
discrimination of women. The bill was to allow for the domestication
and prohibition of all forms of discrimination against Women, with the aim to
create gender parity and end negative gender stereotypes. To mark the 2022 International Day of
Women, NOIPolls goes to the street to ask what Nigerians think about gender
inequality in support of an existing survey It is remarkably worrisome that this
happened on the first day of the International Women’s month, and on the Zero
Discrimination Day when the world commemorates and celebrates the right of
everyone to live a full and productive life, and live it with dignity, free
from discrimination. Subsequently, despite the rejection of this
Bill by the 9th National Assembly, the poll further revealed
that most adult Nigerians believe that women, if given the opportunity as
men, will do well in academics (95 percent), economy (93 percent), science
& technology (90 percent), innovation (89 percent) as well as political
leadership (84 percent). With regards to challenges faced by women
in Nigeria, the three top challenges singled out by adult Nigerians includes
gender inequality (36 percent), gender-based violence (35 percent) and
limited opportunity which affects women in the country. Contrary to the rejection of the Gender and
Equal Opportunity Bill by the 9th National Assembly, 30
percent of adult Nigerians nationwide advocated for the execution of women’s
right, 25 percent suggested that gender discrimination should be banned while
13 percent recommended that the Gender Equality Bill should be sponsored
again. Finally, it is imperative that the Ministry
of Women affairs and Social Development, policy makers, civil society
organizations and all relevant stakeholders synergize to address the issue
raised in this survey to ultimately improve gender parity in the country.
These are some of the key findings from the Gender Equality Poll conducted in
the week commencing February 28th, 2022. (NOI Polls) March 8, 2022 Source: https://noi-polls.com/gender-inequality/ 732-734-43-10/Polls Three-Fourths (74%) Of Kenyans Say The
Country Is Going In The Wrong Direction
After recording significant gains between
2014 and 2019, Kenyans’ assessments of the country’s overall direction, the national
economy, and their personal living conditions have taken a nosedive, according to a new
Afrobarometer survey. Large majorities of citizens say the
country is headed in the wrong direction and describe their living conditions as bad. Majorities
experienced shortages of basic necessities such as food, water, and medical care during the
year preceding the survey. Citizens overwhelmingly give the government
poor performance ratings on key economic issues, including management of the
economy, job creation, and poverty reduction. Key findings ▪ Three-fourths (74%) of Kenyans say
the country is going in “the wrong direction,” a 20- percentage-point increase compared to 2019
(54%) (Figure 1).
▪ Almost nine out of 10 citizens
(85%) describe the country’s economic condition as “fairly bad” or “very bad,” a 30-point
increase since 2016 (55%) (Figure 2).
▪ Only one in four Kenyans (25%)
describe their personal living conditions as “fairly good” or “very good,” a 16-point decline
compared to 2019 (41%) (Figure 3).
▪ Substantial proportions of the
population frequently (“many times” or “always”) went without a cash income (47%), needed medical
care (26%), enough clean water (22%), enough food (18%), and enough
cooking fuel (11%) during the previous year, in addition to many who suffered these
shortages “just once or twice” or “several times” (Figure 4).
▪ Based on these reported
deprivations, most Kenyans can be described as experiencing moderate lived poverty (37%)
or low lived poverty (36%). But more than one in five (22%) fall into the high lived
poverty category (Figure 5).
▪ Most citizens say the government is
performing “fairly badly” or “very badly” on managing the economy (83%), improving
living standards of the poor (83%), creating jobs (85%), narrowing income gaps (90%),
and keeping prices stable (92%) (Figure 6).
▪ Despite these gloomy perceptions,
four in 10 citizens (42%) expect the country’s economic condition to improve over the next
year (Figure 7).
(Afrobarometer) 2 March 2022 732-734-43-11/Polls Majority Of Kenyans Say Competency-Based
Curriculum Will Improve Quality Of Education
Two-thirds of Kenyans believe that the new
competency-based curriculum or CBC system will improve education in the
country at least “a little bit,” a new Afrobarometer survey shows. A large majority of citizens also say that
the country’s education services have improved in the past five years. But the latest survey findings also show a
massive rise in the number of citizens who say they find it difficult to obtain services
they need from teachers or school officials. Key findings ▪ More than half (52%) of Kenyans
believe that the new competency-based curriculum or CBC system will improve education in the
country “somewhat” or “a lot,” in addition to 13% who think it will help “a
little bit.” Only one in four (26%) say the CBC system will do nothing to improve education
(Figure 1).
▪ Education ranks sixth among the
most important problems that Kenyans want their government to address, down from fourth
place in 2019 (Figure 2).
▪ Seven in 10 Kenyans (69%) say that
education services have improved over the past five years (Figure 3).
o Urban residents are likely to report
improved services than their rural counterparts, 74% vs. 66%. ▪ Among the 50% of Kenyans who say
they had contact with a public school during the year preceding the survey, almost
three-fourths (73%) say it was “difficult” or “very difficult” to obtain the services they
needed (Figure 4).
o The proportion reporting problems
obtaining school services more than doubled from 2019 (32%). (Afrobarometer) 09 March 2022 732-734-43-12/Polls Nearly Six In 10 Namibians (57%) Report
That In Their Area, It Is Either Very Common (29%) Or Somewhat Common (28%)
For Men To Use Violence Against Women
A majority of Namibians believe that
violence against women and girls is common in their homes and communities, the most recent
Afrobarometer survey shows. While more than half believe that men are
never justified in physically disciplining their wives, about four in 10 say this can be justified
at least some of the time. Most citizens believe that the police take
reported cases of gender-based violence seriously, but many report that community members will
criticize or harass the complainant for seeking help from the police. And while most Namibians see gender-based
violence as a criminal matter that requires the involvement of law enforcement agencies to
resolve, about one in four say it is a private matter that needs to be handled within the
family. Key findings ▪Nearly six in 10 Namibians (57%)
report that in their area, it is either “very common” (29%) or “somewhat common” (28%) for men to
use violence against women and girls in the home or in the community. Only
16% say it is “not at all common” (Figure 1).
▪A majority (58%) of Namibians say it
is never justified for a man to use physical discipline on his wife. About one quarter
(26%) believe that it is sometimes justified, and 13% say that it is always justified
(Figure 2).
▪An overwhelming majority (82%) of
citizens say that it is either “very likely” (59%) or “somewhat likely” (23%) that the police
will take reported cases of gender-based violence seriously. Fewer than one in five
believe that it is unlikely (Figure 3).
▪But more than four in 10 respondents
(42%) think it is likely that a woman will be criticized, harassed, or shamed by others
in the community if she reports an incident of gender-based violence (Figure 4).
▪Overall, nearly three in four
Namibians (73%) say that domestic violence is a criminal matter that requires the involvement of law
enforcement agencies to resolve. One quarter (25%) see it as a private matter
that needs to be handled within the family (Figure 5).
(Afrobarometer) 7 March 2022 732-734-43-13/Polls More Than Half Of Namibians (57%) Believe
That It Is Either Always Justified (23%) Or Sometimes Justified (34%) For
Parents To Discipline Their Children Using Physical Force
More than half of Namibians believe parents
are justified in using physical force to discipline their children, at least on some occasions,
a recent Afrobarometer survey indicates. Four in 10 say the practice is never justified. Views are similarly divided on other
aspects of child well-being, with four in 10 citizens reporting that child abuse and neglect are
widespread in their communities and half saying school-age children are frequently
not attending school. But a majority of Namibians are confident
that people in their communities can secure help for abused, mistreated, or neglected
children. And they say that help and support are also
available for children with physical disabilities and for adults and children
with mental health problems. Key findings ▪ More than half of Namibians (57%)
believe that it is either “always justified” (23%) or “sometimes justified” (34%) for parents to
discipline their children using physical force. Four in 10 (41%) consider it “never
justified” (Figure 1).
o The view that using physical force to
discipline children is justified is slightly more common in cities than in rural areas (59%
vs. 55%). ▪ Almost half (47%) of citizens say
physical disciplining of children is “very frequent” (19%) or “somewhat frequent” (28%) in their
communities (Figure 2).
o Urbanites are significantly more likely
than rural residents to report that adults frequently use physical force to discipline
their children (52% vs. 39%). ▪ More than four in 10 Namibians
(42%) report that child abuse and neglect occur “very frequently” (15%) or “somewhat
frequently” (27%) in their communities (Figure 3).
o Even more (49%) say that school-age
children are often not in school. o More urbanites than rural residents see
both child abuse/neglect (47% vs. 37%) and out-of-school children (52% vs. 45%) as
frequent occurrences (Figure 4).
▪ Slim majorities say that help and
support are available in their communities for children who are abused or neglected (55%),
children with physical disabilities (56%), and children and adults with mental or
emotional problems (53%) (Figure 5).
o Residents in urban areas report better
access to support services than their rural counterparts for children with physical
disabilities (62% vs. 51%) and for children and adults with mental or emotional
problems (56% vs. 51%) (Figure 6).
(Afrobarometer) 10 March 2022 732-734-43-14/Polls Three-Fourths (73%) Of Cabo Verdeans Are
Optimistic That Things Will Be Better Or Much Better In 12 Months’ Time
Cabo Verdeans offered a fairly gloomy
assessment of their country’s economic situation, but most expected things to improve, according
to an Afrobarometer survey. The survey, in late 2019, found that few
citizens thought economic conditions had improved over the previous year, and only a minority
described their personal living conditions as good. A majority said the country was going in
“the wrong direction.” Most Cabo Verdeans gave their government
poor marks on key economic issues, including job creation and poverty reduction. But a
majority expressed optimism that economic conditions would improve over the next 12
months. Key findings ▪ Fewer than half (47%) of Cabo
Verdeans describe the country’s economic condition as “fairly good” or “very good,” unchanged
from 2014 (Figure 1).
▪ The proportion of Cabo Verdeans who
describe their personal living conditions as “fairly good” or “very good” has increased
slightly compared to 2014, from 16% to 23% (Figure 2).
▪ Even though only 29% of Cabo
Verdeans say the country’s economic condition has improved over the past 12 months, almost
three-fourths (73%) are optimistic that things will be “better” or “much better” in 12
months’ time (Figure 3).
▪ The share of citizens who say the
country is going in the wrong direction increased by 10 percentage points since 2014, from 46%
to 56% (Figure 4).
▪ A majority of citizens say the
government is performing “fairly badly” or “very badly” on creating jobs (84%), narrowing income
gaps (77%), improving the living standards of the poor (76%), and managing the economy
(64%) (Figure 5).
(Afrobarometer) 9 March 2022 732-734-43-15/Polls More Than Three-Fourths (78%) Of Moroccans
Say The Media Should Constantly Investigate And Report On Government Mistakes
And Corruption
Most Moroccans want a media that helps them
hold the government accountable, the latest Afrobarometer survey shows. But a majority also believe that the
government should be able to prevent the media from publishing things it disapproves of. Moroccans see social media as having both
positive and negative effects on society, helping create better-informed and more effective
citizens but also making people more likely to believe false news. Despite their mixed
feelings, Moroccans say unrestricted access to the Internet and social media should be
protected. The 2021 World Press Freedom Index ranks
Morocco’s media among the least free in the world (136th out of 180 countries).
Similarly, Freedom House (2021) rates Morocco only “partly free” in terms of Internet freedom. Key findings ▪ More than three-fourths (78%) of
Moroccans say the media should “constantly investigate and report on government
mistakes and corruption” (Figure 1).
▪ But fewer than half (45%) insist on
media freedom, while 55% endorse the government’s right to prevent the
publication of things it disapproves of (Figure 2).
▪ Among Moroccans who have heard of
social media, majorities say it makes people more informed about current events (96%)
and helps them have more impact on political processes (64%), but also makes
them more likely to believe false news (85%) (Figure 3).
▪ A majority (57%) of Moroccans say
unrestricted access to the Internet and social media should be protected (Figure 4).
(Afrobarometer) 14 March 2022 WEST
EUROPE
732-734-43-16/Polls 7 In 10 Are
Already Seeing An Increase To Their Typical Household Grocery Bill
New research by Ipsos reveals three in four (76%) UK supermarket
shoppers are expecting a rise in their grocery bills over the next three
months, as a similar proportion (73%) are already seeing an increase to their
typical household grocery bill in 2022 compared to last year.
Among shoppers who have seen an increase in the costs of their
groceries, 4 in 10 (39%) have found this difficult. As prices continue
to soar, so do the worries of shoppers with half of those expecting an
increase (46%) saying they will find it difficult to afford. With surging supermarket prices, shoppers are being pushed to change
where and how they buy groceries as 37% move to cheaper brands, 1 in 3 (34%)
have stopped buying non-essential groceries and 32% are buying ‘yellow
sticker’ discounted items approaching their use-by date to save money. Where are cash-strapped Britons doing their
weekly shops now? With almost a fifth (18%) changing where they shop, research by Ipsos
shows that 30% currently do their main grocery shop at Tesco and 15% at ALDI.
Of those planning to switch, almost one in four (23%) say they plan to switch
to ALDI for most of their grocery shopping, with one in five (19%) plumping
for Lidl and one in ten (10%) favouring Asda. Are shoppers getting more savvy? Smarter shopping appears to be one way forward as 28% wait to buy
items until they are on promotion, 28% shop at several supermarkets to find
better deals, whilst 26% of bargain hunters bulk buy to manage the price
increase. However, sacrifices are still being made with 18% revealing they
have cut other household expenses to afford their weekly shop and 10% forgo
getting their online grocery deliveries. Kelly Beaver, CEO of Ipsos, UK commented: Within a turbulent climate affecting
government, oil prices and employment, basic amenities like food and
household goods are being hit heavily by inflation in the UK. Our data shows
three in four UK shoppers expect prices of cornerstone items that families
need on a weekly basis to increase over the next three months. We’re seeing a
year-on-year increase in the cost of living that’s resulting in shopper
sacrifices with 18% confessing to forgoing non-essential items as well as
changing where they shop. As disposable income comes under growing pressure,
we expect to see shoppers becoming savvier and shopping cheaper, so
households can afford the price increase in their weekly shop. (Ipsos MORI) 2 March 2022
732-734-43-17/Polls 9 In 10
Brits Are Following The News Closely, And Concerned About The Impact On The
UK Economy And Security On Ukrainian Civilians
NEW polling by Ipsos finds an increase in support for the UK
Government implementing economic sanctions against Russia, now at 78%
compared to 61% in late February, immediately before the invasion.
Support for economic sanctions has hardened even if it leads to increased
energy prices, from 49% in in late February, to 73% in this latest poll.
Two thirds (66%) of people support humanitarian interventions by
Britain, up by 26 percentage points since February and less than 1 in 10
think we shouldn’t get involved, down from 2 in 10. While support for
military interventions remains lower than humanitarian, diplomatic and
economic action, it has also risen slightly, by 8 percentage points, to 28%.
Most Britons (87%) are keeping a close eye on reports on the
situation in Ukraine, more so than last week, and with 9 in 10 (91%) concerned
about civilians in Ukraine (75% very concerned). 83% of people surveyed are
concerned about the potential economic impact and 77% of people are concerned
about the potential impact on the UK’s national safety and security. Six in
10 (62%) are concerned about the impact on themselves personally. President Volodymyr Zelenskyy has the highest levels of support for
his handling of the situation. Three quarters (76%) of those surveyed said that the President of
Ukraine, Volodymyr Zelenskyy, is doing a good job of handling the situation.
Only 6% of people think he is doing a bad job. The European Union are seen to be doing a good job by 45% of Britons.
Whilst 39% of people think the same about the UK Government, this is up 13
percentage points since February, and 37% think Boris Johnson is doing a good
job, up 11 percentage points. Three in 10 (29%) think Joe Biden is
doing a good job, up 6 percentage points.
As the conflict in Ukraine continues with
no sign of abating, the British public are watching the story unfold closely,
and they clearly have a lot of sympathy for Ukraine. This is translating
through to the growing support for Britain playing a greater role in
providing humanitarian assistance for the Ukrainian people as well as
sanctions against Russia. And while many are concerned about the
potential impact on the UK’s economy and security, this seems to be making
less of a difference to support for action, and support for the job done by the
Prime Minister and UK Government has now become more positive even if still
some way from being unanimous. (Ipsos MORI) 3 March 2022 Source: https://www.ipsos.com/en-uk/polling-ukraine-support-for-sanctions-and-governments-handling-grows 732-734-43-18/Polls A Quarter
(24%) Think That The Government Should Be Allowed To Make A British Person
Entirely Stateless
The UK government is allowed to remove British citizenship from
people if it is ‘conducive
to the public good’ – in the interests of national security, for example,
or if someone has committed serious crimes or an act of terrorism – or if
someone ‘obtained their citizenship fraudulently’. Citizenship issues have been in the news recently, with the new
Nationality and Borders Bill, which is currently being considered by the House
of Lords after passing the Commons on 8 December, allowing the
government to strip citizenship from people without notifying them if the
authorities do not have a ‘reasonably practical’ way to contact them. The British government is not, in theory, allowed to deprive a
British citizen of their citizenship if that is the only form of citizenship
they have. Doing so would make them “stateless”, which is illegal under
the UN
Convention on the Reduction of Statelessness. But how much does that matter to Britons? A new YouGov survey finds
that a sizeable minority could support the government making British citizens
stateless in certain circumstances. In what circumstances should the government
be allowed to deprive a person of citizenship? We asked Britons about taking citizenship away from people who posed
a threat to the UK, or whose activities involve very high harm, for example,
espionage, acts of terrorism, glorification of terrorism, war crimes and
serious and organised crime – language and examples which the government uses
in its
own explanation of when deprivation of citizenship can be justified. By 57% to 27%, Britons say the government should be allowed to take
away British citizenship in these circumstances from dual nationals – that
is, people who have citizenship of another country – with 16% unsure.
The public is more split on whether the government should be allowed
to deprive someone of British citizenship if they are only citizens of the UK
i.e. if doing so would leave them stateless. Two in five (40%) say they should be allowed to take citizenship away
from someone whose only citizenship is British, but who would be eligible for
automatic citizenship of another country if they applied, with 37% saying
this should not be allowed. Some countries grant automatic citizenship to
people whose parents are citizens of that country, but this is fairly rare. A third (35%) think that the government should be allowed to take
citizenship away from people whose only citizenship is British but who have
links to other countries, such as family members in a different country, with
two in five (43%) saying they should not be allowed to. Finally, a quarter (24%) think that the government should be allowed
to make a British person entirely stateless - stripping someone of their
British citizenship when they have no other citizenship and no links to other
countries – with more than half (54%) saying this should not allowed. In theory, but not in practice? The case of
Shamima Begum British-born Shamima Begum left
the UK at the age of 15 to join the Islamic State in Syria. She held only
British citizenship, which then-home secretary Sajid Javid revoked in 2019 on
the grounds of national security. The British government argued that while Begum was not a citizen of
any other country besides the UK, she was automatically eligible for
Bangladeshi citizenship because of her parents. Last year, the supreme court
ruled that Begum would not
be able to enter the UK to appeal for her citizenship to be
restored. Shamima Begum’s case caused controversy and anger on both sides of
the political spectrum, after a Sky
News interview in 2019 showed her saying she was “okay with
beheadings” but that she “didn’t know what she was getting into” when she
left the UK for Syria. Some see her as a victim
of trafficking.
Begum was technically eligible for automatic citizenship of
Bangladesh through her parents, although the Bangladeshi government greeted
news of her citizenship revocation by saying that she would not be allowed to
apply because of her terror links. Despite the fact that in, principle, 37% of Britons oppose making
someone stateless when they would be automatically eligible for citizenship
elsewhere, in the Begum’s practical example that figure withers to just 20%.
Two-thirds (68%) of Britons say the government should have been allowed to
withdraw her citizenship. (YouGov UK) March 07, 2022 732-734-43-19/Polls Nearly Six
Out Of Ten Women (58%) Say Caring Responsibilities Have Stopped Them Applying
For Promotion Or A New Job
Nearly six out of ten women (58%) say caring responsibilities have
stopped them applying for promotion or a new job, and one in five (19%) have
left a job because it was too hard to balance work and care, according to
wide-ranging research by Ipsos and Business in the Community (BITC). Whilst 35% of all adults, and 44% per cent of working adults, have
caring responsibilities, the research found that they are not spread equally.
Women account for 85% of sole carers for children and 65% of sole carers for
older adults. More people from ethnic minority backgrounds (42%) have caring
responsibilities than from white backgrounds. Ipsos and BITC interviewed a representative sample of 5,444 people
across the UK to better understand contemporary attitudes and experiences
around combining paid work and care. Although 94% agreed that caring
responsibilities should be spread equally, 52% of women who are joint carers
say they do more than their fair share—with only 30% of men admitting they do
less. Only 27% of people believe men and women are treated equally in the
workplace and one in five men (20%) said caring had stopped them from
applying for promotion or a new job, compared to the much higher percentage
for women. The impact of caring responsibilities on workplace progression is
greatest on women, who are twice as likely than men to work part-time, and on
lower-paid workers and shift workers, who find it more difficult to take time
off during the day at short notice. People from Black, Asian, Mixed Race or other ethnically diverse
groups are disproportionately affected, with one in two (50%) who have caring
responsibilities saying they had been unable to pursue certain jobs or
promotions because of this. One in three (32%) have left or considered
leaving a job due to a lack of flexibility, compared with around one in five
(21%) white people. Is flexible working a myth? Despite the focus on more flexible working during the pandemic, more
than 50% of people would not feel comfortable asking to work flexibly when
applying for a job and 43% say there is still a stigma around the subject.
More than one in three respondents (35%) believe flexible working blocks
career progression, with fewer than one in five (17%) having asked their
employer to work flexibly. The research suggests that employers may not always share these
attitudes - 80% of people who made formal flexible working requests had them
accepted. Is there a low pay trap? Three out of four people (75%) earning £26,000 a year or more said
they felt supported by their employer in managing caring responsibilities for
children, but that dropped to 50% for those earning less. More than one in
four (28%) of those working shifts said they did not feel supported by their
employer, compared to 10% of those working regular office hours. Is there a care divide? Women make up over half of the lone carers for all groups, including
85% of lone carers for children, 54% of lone carers for working age adults,
and 65% of lone carers for older adults. People who care for older adults
(68%) are less likely to feel supported than those with childcare
responsibilities (78%) or caring for working age adults (77%). 8% of carers identify themselves as ‘sandwich carers’, looking after
both children and older adults at the same time. Almost half (46%) of current workers have had childcare
responsibilities come up ‘during the working day’ and 52% of women, compared
to 42% of men, say their day job has been interrupted because of this. More
than one in three women (37%) said other caring responsibilities had come up,
compared to 31% of men. What can employers do? There is strong support for employers to take the lead and 70% of
carers believe that business and government leaders need to increase their
commitment to supporting gender equality in the workplace. Employers should do
more to support flexible working by providing information on the type of
options available – 67% said this was among the most convincing ways of
demonstrating their commitment – and how their culture supports this. But the focus should be on educating women and men about how they can
balance work and caring responsibilities; at present, more men (22%) than
women (15%) did not feel supported at work, and 57% agree that men are less
likely to be supported at work with their childcare responsibilities. Among
those who agreed that men are less likely to be supported with childcare,
priorities for improvements included flexible working being promoted to men
and women (70%), challenging the stigma around male care givers (46%), and
offering longer paid time off for new fathers (36%). What is the call to action? The research project by Ipsos and BITC is one of the largest of its
kind in recent years, combining extensive quantitative research with focus
groups to gain more detailed insight. BITC has launched a ‘Who Cares?’ campaign, calling on employers and
policy makers to transform the way they think about combining paid work and
care, including equal parental leave for birth and non-birth parents. Their
four key recommendations for employers are:
Charlotte Woodworth, Gender Equality
Campaign Director at BITC, said: Employers and policy makers need to
understand that caring, for children and others, is a routine part of many
people’s lives, and adjust working cultures to better support this.
Otherwise, we will continue to see working carers, particularly women and people
from Black, Asian, mixed race and other ethnically diverse backgrounds,
pushed down and in some cases out of the workforce. Kelly Beaver, Chief Executive of Ipsos, UK
and Ireland, said: A record number of women are in paid work
in the UK, and they make up nearly 50% of the workforce, but our research shows
that many feel they are held back in their careers by caring responsibilities
which are not shared evenly. The majority of those we surveyed believe that
more of this responsibility should be shared equally, irrespective of gender,
and that employers have a key role in making flexibility at work the rule not
the exception. (Ipsos MORI) 7 March 2022 732-734-43-20/Polls Defence
Surges To Third Most Important Issue Facing The UK
With all eyes turned east following the Russian invasion of Ukraine,
“defence and security” has shot up the rankings in for YouGov’s ‘top
issues facing the country’ tracker. Currently, 33% of Britons say defence is one of the top issues facing
the country, about the same who say “health” (35%), although still a long way
off from “the economy” (50%).
The shift took place last week, when concern surged to 32% from 12%
the prior week. These figures are the highest that YouGov has recorded for
defence since the London Bridge attack in June 2017, when 41% of people said
defence and security was a top issue. For Conservative voters, defence is the second highest issue facing
the country, at 48%. This puts it behind the economy still at 57%, but ahead
of not only health (30%) but also immigration (41%). Among Labour voters, defence is only the sixth most important issue,
at 21% (although this is still elevated compared to the 5% it was before the
invasion). Labour voters are more concerned about the economy (47%), health
(45%), the environment (38%), Britain leaving the EU (28%) and housing (24%).
Support for NATO membership and maintaining
the nuclear deterrent also rise following Ukraine invasion With Vladimir Putin having put his nuclear forces on a higher alert
in a clear warning to the West, our tracker
on attitudes to the Trident nuclear missile system shows increased
support for replacing it with an equally powerful system. Since late 2019
between 32-36% of people were in favour of a like-for-like replacement for
Trident; following the Russian invasion of Ukraine that figure has since
risen to 45%. Fewer people now want to see Britain give up nuclear weapons
(18%, from 23% in the previous poll in September 2021). Support for Britain's membership of NATO has
increased from 68% in September to 79% now, which includes an increase in
"strongly support" from 33% to 50%. Likewise, belief
that NATO membership is important for Britain's defence has risen
from 67% to 80%. Confidence that NATO members would come to
our aid has risen from 48% to 67%, and willingness
to go to the aid of other NATO members has risen from 63% to 74%. (YouGov UK) 732-734-43-21/Polls 66% Of Women
Say They Feel Unsafe Walking Home At Night At Least Sometimes
A year after the nation asked itself how to better protect women,
following the murder of Sarah Everard, a new YouGov poll for the BBC shows
that many women continue to feel unsafe going about day to day activities.
Women are most likely to say they feel unsafe walking alone home at
night, including a quarter (26%) who say they “always” feel unsafe doing so.
Overall, 66% of women say they feel unsafe walking home at night at least
“sometimes”, and another 20% never do so in the first place, some of whom
will be doing so for safety reasons. Indeed, a separate question in the survey found that half of women
(53%) regularly avoid being out at certain times in order to reduce the risk
of encountering harassment or sexual assault. Only 16% of men say the same,
and just 5% say they never walk alone at night. More than two in five women (45%) say they feel unsafe at least
sometimes when alone on public transport, including 14% who say they always
feel unsafe. Approaching four in ten women (38%) women feel unsafe sometimes or
more frequently when travelling alone in a taxi or ride share. These results are broadly the same as they were six
months ago, when YouGov last polled this topic. In all cases, women are
substantially more likely than men to say that they find themselves afraid in
what should be innocuous everyday situations.
Younger women are more likely to feel
afraid for their safety than older women After accounting for the likelihood to be in certain situations, the
results also show that younger women are consistently more likely to feel
unsafe than their elders. For instance, 74% of women aged 18-29 who ever use a taxi or ride
share by themselves say they feel unsafe at least sometimes when doing so,
compared to 59% of women in their 30s, 52% of women in their 40s, 47% of
women in their 50s, and 32% of women aged 60 and over.
(YouGov UK) 732-734-43-22/Polls Should
Unvaccinated Workers Get Less Sick Pay Than Those Vaccinated Against Covid-19
Several big-name retailers have announced they will slash sick pay
for unvaccinated workers who are isolating after being exposed to COVID-19.
This has prompted debate as to whether workers who are unvaccinated against
the virus should receive the same amount of sick pay as vaccinated workers. New YouGov research shows that by 46% to 37% Britons support
businesses reducing the extra sick pay they give on top of statutory sick pay
for those who are unvaccinated and have been instructed to isolate because
they have COVID-19. However, people are split 41% support to 42% opposed on
businesses reducing extra sick pay for unvaccinated workers who test negative
for COVID-19 but still have to self-isolate.
Opinion is similarly split on reductions in statutory sick pay for
the unvaccinated who have to isolate because they have been in contact with
someone who has tested positive, but test negative themselves (42% support
and 41% oppose). However, people tend to oppose cutting statutory sick pay
for unvaccinated employees who test positive for COVID-19 by 44% to 37%. The young are more inclined to oppose cuts to statutory and extra
sick pay. For example, 52% of 18-24 year olds oppose businesses reducing sick
pay for unvaccinated employees who test positive for COVID-19 and have to
isolate, versus 29% of those aged 65 and over. Those who voted Labour in the 2019 general election are more likely
to oppose reductions to both government statutory sick pay and extra sick
pay. For instance, while half of Conservative voters (52%) would support
reducing statutory sick pay for unvaccinated workers who test positive for
COVID-19, only a third of Labour voters (34%) would support this, with 48%
opposed. The results also show that Britons tend to think businesses should
have full autonomy over whether they pay extra sick pay to unvaccinated
workers (40%), as opposed to the government mandating businesses to continue
to pay unvaccinated employees extra sick pay (24%), or for all businesses to
not provide any extra sick pay for unvaccinated workers (18%).
However, Labour voters are split between 36% who think it should be
up to businesses to decide, and three in ten (31%) think the government
should prevent firms from withholding extra sick pay based on vaccination
status. By comparison, Conservative voters are much more likely to think it
should be up to businesses as to whether or not they continue to provide
extra sick pay to unvaccinated employees (48%) – only 16% think it should be
compulsory. (YouGov UK) March 09, 2022 732-734-43-23/Polls Four In Ten
Britons (42%) Believe The UK Should Take In At Least “A Few Tens Of
Thousands” Of Ukrainian Refugees
Since Vladimir Putin’s forces invaded Ukraine almost two weeks ago,
YouGov have tracked British public opinion on receiving Ukrainians fleeing
the conflict and seeking asylum here. When we first posed the question on 24-25 February, in the immediate
aftermath of the invasion, we found that 63%
of the public supported introducing a scheme to resettle some
Ukrainian refugees fleeing the Russian invasion. That figure quickly rose
to around three-quarters (76%) of the public as soon as 2 March. Our
latest data released today shows that figure remains effectively unchanged
(75%). What has shifted slightly is the number of refugees Britons are willing
to accept. Today’s results show that a figure equivalent to more than four in
ten Britons (42%)* believe the UK should take in at least “a few tens of thousands”
of Ukrainian refugees, including one in five (19%) who say the figure should
be “a few hundreds of thousands”. Those figures have risen from 36% and 15%,
respectively, in our previous poll.
To date, however, only around 300 Ukrainians refugees have
been admitted into the UK, according to Home Office data. This is a figure
that will satisfy the mere 2% of the public who believe that ‘a few hundred’
is the right amount of Ukrainian refugees who should be allowed entry into
the UK. The public’s desire for a fresh scheme is at odds with current
government policy, which still insists that Ukrainian refugees apply for
visas through official consulates and embassies, and has so far only relaxed
rules for refugees with family already in the UK. Under current rules, the UK
is unlikely to see anywhere near the numbers of refugees they are happy to
take any time soon. YouGov data published in the Times this week suggested that, for now,
the public are more likely to think that the government have
done well in responding to Russia’s invasion of Ukraine than badly
(41% vs 33%), and defence minister Ben Wallace has promised that the
government ‘will do more’ to help Ukrainian refugees. But judgement on the
handling of the crisis could change quite quickly if the government continues
not to match public preferences on the topic of refugees. * Only those who said that they would
support setting up a resettlement scheme for Ukrainian refugees were asked
how many refugees should be resettled. For simplicity of understanding, the
results above have been recalculated to show them as a percentage of the
entire population (YouGov UK) 732-734-43-24/Polls Consumer
Confidence Falls As Household Finance Measures Take A Historic Nosedive
The cost of living crisis has had a devastating impact on consumer
confidence, according to the latest analysis from YouGov and the Centre for
Economics and Business Research. If last month saw the
first whispers of discontent, this month the public are in much fuller
voice: soaring energy bills have taken the overall index from 109.0 to 106.6
– a fall of -2.4 points, and one that can be significantly attributed to a
catastrophic decline in household finance measures. While consumer confidence
scores are still positive, they are propped up to an extent by stronger
performance in the home value, job security, and retrospective business
indices. YouGov collects consumer confidence data every day, conducting over
6,000 interviews a month. Respondents answer questions about household
finances, property prices, job security, and business activity, both over the
past 30 days and looking ahead to the next 12 months.
Each month we ask Britons about whether their household finances have
improved or worsened over the past 30 days, and whether they expect their
household finances to improve or worsen over the next 12 months. With
retrospective scores plummeting to 71.5 (-9.2), and outlook plunging to 59.7
(-19.3), both household finance measures saw the lowest scores in the
near-decade-long history of the Consumer Confidence Index. As sanctions
related to Russia’s invasion of Ukraine drive gas prices to record
highs – and as April’s 54% increase to the energy price cap draws
closer – these unprecedentedly negative attitudes could yet get worse. But if households are more pessimistic about their finances than
ever, homeowners are (for the fourth month in a row) feeling more buoyant.
House price measures for the past month rose to 132.9 (+3.7), while outlook
rose to 138.2 (+0.8). Among workers, retrospective (+1.2) and forward-looking
(+2.2) perceptions of job security also trended upwards, reaching 94.5 and
118.6 respectively. These employees may be feeling more secure in their positions thanks
to a jump in business activity over the past 30 days: scores for this measure
hit 113.9 – a five-point jump on the month before (+5.0), and one that
follows two months of falling scores. But with outlook diminished to 123.6 (-3.5),
they do not have the same levels of optimism when it comes to their
employers’ prospects for the next 12 months.
Darren Yaxley, Head of Reputation Research
at YouGov: “The
cost of living crisis is having a serious impact on consumer confidence.
Although the overall index remains positive, the dip in February is
compounded by tumbling household finance measures with both retrospective and
forward-looking scores at their lowest ever level since tracking began almost
ten years ago. However, other measures give more cause for optimism – with
both homeowner scores increasing for the fourth month in a row and job
security metrics improving following two months of decline.” Kay Neufeld, Head of Forecasting and
Thought Leadership at Cebr: “February’s drop in the Consumer Confidence Index
was mainly driven by precipitous declines in the measures tracking
households’ financial situation. Against a backdrop of accelerating inflation
and the upcoming increase in the energy price cap, households are
understandably nervous about the outlook for their personal finances.
Meanwhile, the war in Ukraine is likely to further add to spiralling energy
costs, based on the turbulence in oil and gas markets in recent days
following the imposition of Western sanctions on Russia. “Gains in the job security measures and the
backward looking business activity score indicate that the UK economy has
started the year on a strong footing as the impact of Omicron has faded.
However, the decline in expected business activity over the coming 12 months
suggests that the energy crisis and the war in Ukraine could have a
considerable negative effects on UK economic output this year.” (YouGov UK) March 09, 2022 732-734-43-25/Polls Nuclear
Fears Rise Among Extinction Worries Following Ukraine Invasion
In January, YouGov
conducted new research looking at what the British public thought
the most likely causes of human extinction might be. At that time, nuclear
war (43%), climate change (42%) and a pandemic (30%) were seen as the three
most likely causes of our annihilation. But following the outbreak of war in Ukraine and renewed
questions about the nuclear threat posed by Vladimir Putin, new data
shows the British public have become far more likely to see nuclear war as a
top probable cause of human extinction. Six in 10 Britons (61%) now think
nuclear war is one of the most likely ways the human race will end, a rise of
18 points since our prior survey on 21-23 January. All other causes remain
effectively unchanged, leaving climate change in a distant second at 41%.
Similarly, support for the government developing contingency plans to
prepare for nuclear war as an existential threat has risen eight points (now
up to 87%) – a rise that was not seen in any of the other contingency plans
asked about in our survey.
(YouGov UK) March 10, 2022 732-734-43-26/Polls Just 10% Of
Britons Think The West Is Doing Enough To Stop Russia Winning In Ukraine
Ukrainian President Volodymyr Zelensky has
once again called upon NATO countries to impose a no-fly zone over his
country to keep Russian aircraft away. The Ukrainian leader has been critical of
the West’s failure to offer more support, saying that
NATO should tell Ukrainians whose children had died “sorry we didn't do it
yesterday, one week ago… We did nothing and it's true, yesterday the world
did nothing”. Now a new YouGov survey shows only 10% of
Britons think that the economic actions the West is taking against Russia,
and the military aid being sent to Ukraine, is enough to stop the Russians
from winning. Two thirds (67%) say that it is not enough,
evenly split between the 34% who say it is “not quite enough” and the 33% who
say it is “not nearly enough”.
This opinion is non-partisan, with
Conservative and Labour voters sharing the same views. None of this is to say that the British
public is willing to take more concrete steps to help Ukraine in its
struggle. A question on the same survey found that Britons
oppose a no-fly zone by 38% to 29%. Likewise, only
24% back sending troops to Ukraine, and 27% support air strikes against
Russian targets in the country. Those who think the West is doing “not
nearly enough” to help Ukraine are no more likely than those who think our
efforts are more adequate to want to take stronger action in the country. (YouGov UK) March 10, 2022 732-734-43-27/Polls 6 In 10
Across The UK Would Support A Law Giving Employees The Right To Ignore Work-Related
Communications Outside Of Working Hours
New research by Ipsos shows a majority of UK adults aged 16-75 are in
favour of introducing a law giving employees the right to ignore work-related
communications, such as emails, texts and instant messages, outside of their
official working/on-call hours. Sixty per cent would support the Government
introducing such a law, including 34% who would strongly support it. Only
around 1 in 10 (11%) would be against it.
There is little difference in the views of workers and non-workers,
nor between Conservative and Labour 2019 voters, although graduates are more
in favour than non-graduates, and 16-24 year olds are also less strongly in
support. Currently, two-thirds of UK workers say they participate in work-related
communications outside of their working hours (67%). Four in 10 (43%) check
work-related communications while a similar proportion (40%) reply to them. A
third (34%) proactively send work-related communications. Only 3 in 10 (30%)
do not communicate with work outside of their official working hours.
Those earning upwards of £55,000 a year are more likely to be
checking, replying to and sending work-related communications outside of
working hours, 82% say they do this compared with 65% of workers earning up
to £54,999. More than half of UK adults say it is not acceptable for employers to
expect their employees to participate in work-related communications outside
of official working/on-call hours. Fifty-five per cent say is is unacceptable
for employers to expect their employees to check for work-related
communications, while 58% say the same for responding to them and 57% for
sending them. Younger people tend to be most likely to believe such
expectations are acceptable – for example, 56% of 16-34 year olds believe it
is acceptable for employers to expect their employees to check work-related
communications out of hours, compared with 34% of 35-75 year olds. Opinion is split as to whether priority should be given to the right
to disconnect or flexible working. A third (32%) say it is more important to
give employees the right to disconnect than it is to give them more
flexibility around the time that they work. However, a quarter (24%) believe
it’s more important to give employees a degree of choice over the times they
work. But more, almost 4 in 10 (37%), say both are equally important.
Kelly Beaver, Chief Executive UK and
Ireland, Ipsos, says: The pandemic has had a huge impact on our
working patterns, providing businesses and employees an opportunity to
re-evaluate the way we work. For many, this has resulted in increased
flexibility, but there is also the blurring of lines between work and
homelife. (Ipsos MORI) 11 March 2022 Source: https://www.ipsos.com/en-uk/6-in-10-across-uk-would-support-right-to-disconnect-law 732-734-43-28/Polls 27% Of
Britons Are Favourable Towards Boris Johnson (+7 Points From February) And 52%
Are Unfavourable (-6 Points)
The latest Ipsos UK Political Pulse survey, taken March 4th to March
7th, shows public favourability towards Boris Johnson recovering to pre
partygate levels following the Russian invasion of Ukraine, although almost
twice as many Britons remain unfavourable – rather than favourable – towards
the PM. Favourability towards Johnson and Starmer
Leadership traits
Elsewhere in the poll
Keiran Pedley, Director of Politics at
Ipsos, UK said of the findings: Having seen his personal poll ratings fall
sharply amidst police investigations into Downing Street parties, the Prime
Minister will be pleased to see his favourability ratings rebound somewhat
this month. However, Johnson’s numbers on a host of leadership attributes
remain worse than they were a year ago and Labour are still ahead in the
polls. So Johnson still has work to do, if he is to restore his standing with
the public to where it once was. (Ipsos MORI) 11 March 2022 732-734-43-29/Polls Two-Thirds
Of The Public Say Brands Should Take A Stance On Ukraine
The Russian invasion of Ukraine has met with vocal condemnations from
world leaders – and escalating economic sanctions. But with chains such as
McDonalds and Starbucks shutting down business in Russia, are the public content
to leave punishing Vladimir Putin up to the government? New YouGov data reveals that two in three Britons (68%) say it’s
important that brands publicly take a stand on the Russia-Ukraine conflict –
with fewer than one in five (17%) in dissent. More specifically, three-quarters of the public think companies
should stop doing business in Russia entirely (76% vs. 6%), and the same
proportion say they should donate money and supplies to humanitarian efforts
in Ukraine (77% vs. 4%). A majority also want brands to offer this kind of
support to the Ukrainian army (54% vs. 15%), and issue statements in support
of Ukraine (61% vs. 11%). There could be commercial incentives for businesses that are
perceived to be doing the right thing when it comes to the conflict. Three in
five Britons, for example, say they would have a better opinion of a brand
that stopped doing business in Russia (62%) or offered humanitarian support
to Ukraine (61%).
Taking this even further, half of the public say they are more likely
to buy from a brand that pledges income to Ukraine (51%) or promises money
and supplies to humanitarian efforts (50%). The same proportion would reward
a business that stops operating in Russia (51%).
So brands like Shell, which recently announced that it would sell its
Russian investments, may have had one eye on the perceived benefits of
publicly rebuking the invaders. But just as there are PR incentives for
taking an anti-Putin stance, there may be considerable drawbacks if you’re –
for example – caught
buying barrels of Russian crude oil at a discount price.
Two in five Britons (41%) say they have either already boycotted or
would consider boycotting a brand that continues doing business in the
invading country, while one in five (20%) say they would stop buying from a
company that has not pledged any support for or made any public statements
about Ukraine. (YouGov UK) March 14, 2022 732-734-43-30/Polls War In Ukraine
Leads To Spiking Stress, Fear, And Sadness Among Britons
The impact of the Russian
invasion of Ukraine is being felt around the world, as Cold-War
tensions between the superpowers of the East and West resurface. While those
in Britain remain far from the frontlines, the war is nevertheless taking an
emotional toll on the public. The latest data from YouGov's
"mood tracker" shows feelings of stress, fear, and sadness
have all in recent days.
A third of Britons (36%) say they’ve been sad in the last seven days,
up 5pts from 31% on 24th February, and 12pts compared to 10th February.
This latest datapoint is higher than the beginning of the initial COVID-19
lockdown (March 2020), when sadness reached a peak of 33%. Another fifth report feeling scared in the last week (23%), a leap of
13pts versus 17th February – and the highest since the
previous peak of 36% in mid-March 2020. This rise has been steepest among the
oldest Britons – many of whom will no doubt be drawing parallels between
recent events and the nuclear tensions of the 60s. The number of those 65 and
over feeling scared rose 16pts from 6% in mid-February to 22% now. Coupled with this, the proportion of people feeling happy has also
dropped 8pts (to 38%) compared to the middle of February – representing its
lowest point since March 2021. Finally, approaching half (47%) of Britons say they have felt
stressed in the past week – up 7pts. The last time this many Britons reported
feeling stressed was late-March 2020 – again, amidst the uncertainty of the
first pandemic lockdown. Young people are particularly hard hit by stress,
with two-thirds of those aged 18 to 24 (66%) feeling this way recently -
double that of their elders. In comparison, 54% of those aged between 25-49
and 42% of 50- to 64-year-olds feel the same, as do 30% of those 65 and over. (YouGov UK) March 14, 2022
732-734-43-31/Polls Confidence
In The Police Sinks In Two Years
In recent months, the proportion of Britons saying the police are doing
a good job has declined. Two years ago, in February 2020, seven in 10 Britons
said they thought the police were doing well. Now barely half of the public
(53%) do so, while the percentage saying that the police are doing a bad job
has more than doubled from 15% to 37%.
Conservative voters are more likely to think the police are doing a
good job (61%) than Labour voters (44%). The collapse of approval in the
police has been particularly acute among Labour voters, falling 31pts from
75% in February 2020. Britons are losing confidence in the
police’s ability to deal with crime locally As approval of the police declines, so does Britons’ confidence in
the police’s ability to deal with crime in their local area. The proportion
of Britons saying they have ‘a great deal’ or ‘a fair amount’ of confidence
in the police’s ability to tackle local crime now sits at 43%, and around
half (47%) of the public now have ‘not very much confidence’ or ‘no
confidence at all’ in the police.
Again, confidence in the police has fallen more dramatically among
Labour voters than Conservative ones. Both groups had the same level of
confidence in the police in February 2020 (56%), but while this has since
fallen to 47% among Tories, it has sunk to just 35% among Labour voters. Britons tend to think crime has gone up –
but fewer think crime is on the rise in their local area A consistently
high proportion of Britons think that crime has gone up nationally –
latest YouGov data shows that 61% of the public believe crime has risen over
the last few years. One in six (17%) think the level of crime across Britain
has remained constant, while just 4% think it has gone down and 17% are
unsure. When it comes to crime in their local area, Britons are much more
split, although similarly few think that crime has gone down. One in three
(37%) think crime has risen in their local area over the last few years,
while 39% say it has stayed the same, 5% think it has gone down and 20% are
unsure. (YouGov UK) March 15, 2022 Source: https://yougov.co.uk/topics/politics/articles-reports/2022/03/15/confidence-police-sinks-two-years 732-734-43-32/Polls 8 In 10 Britons
Are Concerned About The UK's Dependence On Foreign Countries For Its Energy
Supply
New research from Ipsos shows more than 8 in 10 (83%) Britons are
concerned about how dependent the UK is on energy imports from other
countries. A similar proportion (82%) are concerned about the chance
that energy supplies to this country to be interrupted and this affects
people’s home energy. Looking forward three quarters (76%) think the
chances of interruptions to the UK’s energy supplies will get worse over the
next 6 months, and that this will affect energy supplies to homes.
When considering how Britain should become less reliant on imported
energy, the public are most likely to support investing more in renewable
energy and reducing energy use through improving the energy efficiency of
homes and businesses (both 77%). These levels of support did not drop
substantially even if the change leads to increases in energy bills or
taxes: when asked to consider how much they support investment in
renewables or energy efficiency, over seven in ten UK adults still supported
these initiatives to reduce the country’s reliance on imported energy.
Levels of support were lower for investing in nuclear energy (53%
support) or re-starting or increasing the UK’s own production of fossil fuels
(51% support). Bridget Williams, Research Director at
Ipsos, says: The current energy crisis and high cost of
energy bills, and the Russian invasion of Ukraine and discussions around reliance
on Russian oil and gas imports, appear to have brought issues of energy
security more top of mind to the British public recently. Many are
concerned about energy bills now, and how these will change in the
future. The public also see increasing chances that events may cause
interruptions to energy supplies in the future. (Ipsos MORI) 15 March 2022 732-734-43-33/Polls 7 In 10
Britons Support Assisted Dying In Latest Ipsos Poll
On the day the House of Lords considers an assisted dying amendment
to the Health and Social Care Bill, a new online Ipsos poll has found that 7
in 10 Britons aged 16-75 think it should be legal for doctors to prescribe
life ending medication for a patient to take themselves (69%) as well as doctors
being able to administer life ending medication to a patient (68%). Conditions under which patients would be able to request this course
of action were shown to survey respondents: the patient must be 18 or over
and have made a voluntary decision to end their life (signed in front of
witnesses) with time to consider other options, two doctors must agree the
patient is of sound mind, terminally ill and believed to have six months or
less to live, and the High Court confirms it is satisfied these conditions
have been met.
A majority of Britons (61%) also support doctors being able to
prescribe life ending medication to patients who are not terminally ill but
are physically suffering in a way that the patient finds unbearable and which
cannot be cured or improved under existing medical science. However, Britons are more divided over the same question if the
patient is mentally suffering in a way they find unbearable with 39%
supporting and 35% opposed.
Gideon Skinner, Research Director at Ipsos said: “The issue of
assisted dying has always been sensitive and, understandably, highly emotive
– and public opinion is just one part of that argument. Even so, the
results of Ipsos’ new polling shows that a majority of Britons support the
legalisation of assisted dying under specific conditions, as has been seen in
previous polls on this matter. Around one in six are against
legalisation, although opposition increases in the case of non-terminal
mental or emotional suffering, even if the patient finds it unbearable.” (Ipsos MORI) 16 March 2022 Source: https://www.ipsos.com/en-uk/7-10-britons-support-assisted-dying-latest-ipsos-poll 732-734-43-34/Polls 85% Of Britons
Say They Have Heard Of The Ukrainian Leader
Ukrainian president Volodymyr Zelenskyy has won admirers across the
world for rallying his country in the face of Russian aggression, and his
decision to stay in Kyiv despite the proximity of Russian forces and covert
hit squads in the capital looking to assassinate him. Now new YouGov data shows that two thirds of Britons (67%) have a
favourable opinion of Zelenskyy, including 43% who have a “very” favourable
view. Only 7% have a negative view. Another 15% say they have never heard of
the Ukrainian president, meaning that of the people who have heard of him,
79% have a favourable view.
By contrast, Russian president Vladimir Putin is near-universally
reviled. Fully 92% of Britons have an unfavourable view of him, including 87%
with a “very unfavourable” view. Just 2% say they have a favourable view. The survey of attitudes to world leaders shows that the British
public are divided on Joe Biden, with 40% thinking positively of him but 42%
thinking negatively. Britons are, however, more likely to have a “very
unfavourable” view of the US president (15%) than a “very favourable” one
(4%). Currently, a third of Britons (34%) have a negative view of Boris
Johnson, versus 57% who have a positive one. This compares to 66% who had an
unfavourable view of the prime minister a week prior to the invasion of
Ukraine, and 27% who had a favourable one. French president Emmanuel Macron is seem positively by 28% of Britons
and negatively by 45%. Finally, the new German chancellor – Olaf Scholz – remains largely
unknown to the British public three months into his tenure. Half (52%) say
they have not heard of him, while a further 21% have but don’t know what to
make of him. Around one in six (16%) have a favourable view of the SPD
politician, while 11% hold an unfavourable view. By contrast, only 7% of Britons had not heard of Angela Merkel in
July 2021. At the eve of her departure, 46% of Britons had a positive view of
the then-chancellor vs 31% who had an negative one. (YouGov UK) March 17, 2022 732-734-43-35/Polls Three In Four (76%) Expect The Economy To Get Worse Over The Next
Twelve Months
Economic optimism
Leader satisfaction
Handling of the Russian invasion of Ukraine
Voting intention
Gideon Skinner, Head of Politics at Ipsos
in the UK, says of the findings: Amidst public concerns about the rising
cost of living and the impact of the war in Ukraine, economic optimism has
dropped sharply amongst all groups (including Conservative supporters). It is
now comparable with the worst scores we have ever recorded in over 40 years –
worse than at the start of the pandemic and during Black Wednesday, and only
matched by the very high levels of pessimism during the summer of 2008 and at
the start of 1980. So although there is some good news for Boris Johnson and
the Conservatives, who see some recovery from their own low scores at the
start of the year, the amount Britons are worrying about the future means
they still face challenges ahead. (Ipsos MORI) 18 March 2022 Source: https://www.ipsos.com/en-uk/ipsos-poll-shows-economic-optimism-falls-lowest-2008-financial-crash 732-734-43-36/Polls Two Out Of
Three French People Have Already Practiced Skiing
If the mountain seems to be a key destination for the French in
winter, more than one in two (53%) say they never go there. The
destination is therefore not popular with a majority of French people, only 1
in 3 (34%) say they go there from time to time, and it is a tradition for
only 13%, who say they go there every year. Young people (22% of 16-24
year olds) and Parisians (19%) are the most likely to go to the mountains in
winter. “The 36% increase in 2022 compared to the 2019-2020 season in planned
arrivals for Zone C, which concerns Paris and the Paris region in particular,
confirms our results. underlines Yves Bardon, director of the Flair
program , Ipsos Knowledge Centre. 2 out of 3 French people have already worn But even if 34% of French people occasionally go to the mountains in
winter, it is not always to go skiing. 14% of French people say they ski often , a figure that rises to
21% among CSP+, and 17% among men, more numerous than women (11%). 24%
of French people claim to ski from time to time, and 28% practice this sport
more rarely. But skiing remains the prerogative of a minority of French people:
34% say they have never skied in their life. A figure that rises to 38%
among retired or inactive French people. For Yves Bardon. “The proportion of French people who spend
their winter holidays in the mountains during the winter holidays has only
increased by 3% since 2010; this is room for improvement to demonstrate
that ski holidays are not immune to the democratization of most leisure
activities, even if they may reflect geographical and financial disparities
between territories and incomes! ". French skiers, self-taught Among these skiers, the majority (42%) claim to have started on the
slopes between the ages of 10 and 19. For a third of French skiers, this
initiation took place earlier, at less than 10 years old (34%). What is the ski level of the French? Among the classification of
ESF levels, the most achieved levels are 1st and 3rd star (9%). Very few
French people have a higher level with only 2% who have obtained their gold
star and 1% the professional level . In their learning, the French have rather practiced
alone: 4 out of 10 skiers (40%) have never taken ski
lessons, and 12% have taken lessons, but without ever validating their level. (Ipsos France) March 1, 2022 Source: https://www.ipsos.com/fr-fr/presidentielle-2022/deux-francais-sur-trois-ont-deja-pratique-le-ski 732-734-43-37/Polls 91% Of French
People Have A Good Opinion Of Farmers
In the midst of a health crisis, farmers
take 4th place among the favorite professions of the French (cited by 32% of
those interviewed) , behind firefighters (60%),
nurses (50%) and doctors (47%) but far ahead of police officers and teachers
(22%) or even pharmacists (13%). Bankers bring up the rear of this
ranking (2%). 9 out of 10 French people have a good
opinion of farmers (91%). For their part,
farmers are much less convinced that the French like them (only 59% are aware
of this). The French, however, trust them massively to offer quality
agricultural products (86%), to ensure a good level of health safety for
their products (82%) or to pay more and more attention to the well-being of
animals that they raise (78%). To a lesser extent, a majority of French
people also have confidence in themselves to pay attention to the impacts of
their activities on global warming (61%) or to use pesticides and
phytosanitary products responsibly (59%).
The efforts undertaken in recent years are
recognized by all. Farmers are perceived as
having done more in recent years to offer quality products (68% of French
people think so but also 83% of farmers), ensure health safety (64% of French
people and 81% of farmers) but also to avoid as much as possible to pollute
soil and water (54% of French people and 84% of farmers) and pay attention to
the impacts of their activities on global warming (52% of French people and
75% of farmers). But for the French and the farmers, French
agriculture is in danger and this could have serious consequences. Farmer: a profession that the French
perceive as very devastated, much more than farmers who defend their quality
of life even if all is not rosy. For the
majority of French people, the situation of farmers is bad, whether it is the
quality of life (67%), working time (77%) or the ability to go on vacation
(81%). Moreover, only 1 out of 2 French people would advise their child
to become a farmer. But farmers are less pessimistic, they claim their
quality of life (78%) but are less satisfied with their working time (only
52% believe that the situation is good) and holidays (33%). On the other
hand, the majority consider that their situation is deteriorating (56%).
The French and the farmers consider that
French agriculture is today in danger and that it risks disappearing
(respectively 85% and 93%) . The vast
majority fear the consequences and in particular that France will end up
being dependent on other countries to feed its population if the population
of farmers continues to decline (76% of French people and 82% of farmers). Moreover, the French are showing themselves
to be more and more attentive to the origin of the agricultural products they
consume and favor those of their local farmers. Local products, a guarantee of satisfaction
but also of pride . The French are now
massively convinced that the food products offered by farmers in their region
are tastier (80%), more respectful of health rules and the environment (76%)
and even more original (54%). The French even say that the agricultural
products of their region are part of their heritage (88%), that they are
among the best in France (72%) and that some of them are found nowhere else
(67% ). In short, they are proud of it (87%).
Local origin, a real criterion for choice
and purchase. Moreover, when they go shopping,
they say they pay attention to the fact that the product is made in France
(88%), in their region (79%), but also choose according to the labels on the
products (75% ) or take into account their method of selection in stores
(70%). More than 8 out of 10 French people even say they prefer to pay a
little more for my food products and be certain that they come from France or
their region (83%).
For the French as for farmers: there is an
urgent need to help French agriculture, in particular by making it less
fragile in the face of competition from other countries. For the vast majority of French people and
farmers, it is urgent to take measures to help French farmers (respectively
64% and 81%).Among the most urgent measures to be
taken, they would like, as a priority, to make farmers less fragile in the
face of competition from other countries whose agricultures are less
respectful of the environment and health standards (89% of farmers and 74% of
French people consider it “urgent”). They also consider that it is
urgent that we guarantee them a fixed income (57% of farmers and 67% of
French people), that we allow them to take sick or maternity leave under good
conditions when they need it ( 54% of farmers and 61% of French people) or
that we help them to promote their activity to transmit their farm more
easily when they retire (48% of farmers and 55% of French people).
Very strong expectations with regard to
large retailers to help French farmers (97% of French people and 96% of
farmers) . Moreover, the vast majority of
people questioned even expect these brands to invest “much more” in
supporting farmers: this is the case for 69% of French people and even 81% of
farmers.
(Ipsos France) March 4, 2022 Source: https://www.ipsos.com/fr-fr/91-des-francais-ont-une-bonne-opinion-des-agriculteurs 732-734-43-38/Polls 76% Of
French People Claim To Know The Difference Between Criminal Majority And
Criminal Responsibility
Criminal responsibility is the age at which a minor
can be found guilty of an offence. When the criminal majority is
reached, the minor no longer benefits from a reduction in sentence. 76% of French people claim to know the difference between criminal
majority and criminal responsibility, a figure drawn up by the inhabitants of
the Paris region (82%). 27% of French people even say they know exactly
the difference. What age to be responsible? If in France the
criminal majority can be engaged from the age of 13, 56% of respondents think
that it is between 14 and 16 years old.
- Penal majority fixed at 18 years in
France: Among the French who
agree on the criminal majority before
18 years (44%), 50% of them think that it should be fixed at 16 years and 79%
between 15 and 16 years. 18-24 year olds are more in favor of postponing it after 18 (23%). Minors and prison Today in France,
children under 13 cannot go to
prison. 43% of French people, however, think that this should be the
case. On the question, we see a strong difference between Men and Women
(50% vs 36%)
Nevertheless, from the age of 16, a minor can go to prison if he
commits an offence. 56% of French people think that people under 16
should go to prison if they commit a crime. A figure pulled up by 65%
of men who share the same opinion. Military service for all Nearly 7 out of 10
French people (68%) are in favor of military service for all. They seem to be even more so for
minors who have committed offenses (79%).
(YouGov France) March 8, 2022 Source: https://fr.yougov.com/news/2022/03/08/positionnement-francais-delinquance-juvenile/ 732-734-43-39/Polls 61% Of French People Have Never Heard Of The Concept Of Metaverse On October 28, Mark Zuckerberg announced the change of identity of
his company: Facebook then became Meta. This new name marks the bet of
the Californian giant to embark on a huge metaverse project, with nearly 10
billion dollars allocated in 2021. But behind the "hype" aroused by this project supposed to
tip the world into an ever more digitized future, what about the perception
of the French? Are they familiar with the concept of metaverse and what
activities in their daily life are they really ready to digitize? 61% of French people have never heard of
the concept of metaverse A metaverse is defined
as a set of virtual worlds in which
an Internet user creates his avatar and can interact with others, in
augmented or virtual reality. These platforms are for
entertainment. They originally came from the world of video games, but
the idea is to be able to play there, attend concerts, go shopping there,
etc. Individuals who at least partially understand the concept of
metaverse constitute 30% of the population. This figure rises to 48%
among 18-24 year olds and drops to 19% among those over 55. More than a quarter of French people are
interested in shopping via a metaverse
Musical events and shopping are the two activities for which the
French express the most interest vis-à-vis metavers, with 28% and 27%
respectively. Interest in these two activities even reaches 42% and 50%
among 18-24 year olds. Finally, one in five French people (21%) is
interested in the possibility of working through a metaverse. In addition, more than half of 18-24 year olds indicated that they
were interested in attending shows on a set (show, debate, interview, etc.)
via a metaverse (51%). Nearly one in two young people between the
ages of 18 and 24 say they are ready to visit a tourist destination or an
amusement park through a metaverse
Tourist destinations and amusement parks are the places that 18-24
year olds most want to visit through a metaverse, with 47% and 46% curiosity
respectively. In line with their interest in shopping seen in the
previous graph, ready-to-wear stores come in 4th position with 26%. Entertainment, leisure, travel: which
actors have a card to play? Top 5 brands for which French people aged
18 to 24 expressed the most purchase intention in 2021 in the Destination,
Amusement Parks & Museums, Fashion Retail and TV & Video Services
sectors
(YouGov France) March 8, 2022 Source: https://fr.yougov.com/news/2022/03/08/marques-qui-gagneraient-a-miser-sur-le-metaverse/ 732-734-43-40/Polls 37% Of
French Women Consider That Prioritizing Their Family Life Is A Threat To
Their Career
Having to choose between professional life and family
responsibilities and facing discrimination at work when you are a woman are
also a problem for 14% of French people
, as are all the tasks they have to perform without pay. From this point of view, France is well behind the world
average: 32% of French people
(34% of men and 30% of women) say they
think that men and women are treated on the same level in their place work
compared to 44% of those interviewed worldwide. Women are also not equal to men when it
comes to the impact of family responsibilities on their careers More than one in three people globally believe that having a family
penalizes women (35%, including 26% of men and 43% of women) and 3 in 10 women also say their careers would have been
different without these responsibilities. That said, the
perception of the French is less negative, with 18% sharing the idea that
having a family penalizes women, even if the perception diverges between men
(12%) and women (23%, almost twice more). The balance between personal and professional life is a difficult
exercise which also complicates the prospects for development because they
deprive of two advantages: socialization and availability. Not being able to share moments with colleagues outside of strict
working hours because you have to take care of your family harms your career
more or less directly for 21% of women
in the world, compared to 13% of men ( 22% of women vs
12% of men in France). Not being reachable outside contractual time is also perceived as a
risk for 28% of women (vs. 15% of men) – 29% of women vs. 15% of men in
France. In this context, even talking
about your family can seem detrimental to 22% of women (13%
of men) – a result that is fortunately more nuanced in France with 12% of men
and 18% of women. We will therefore not be surprised that putting your family life before
your professional life threatens a
priori the career of women for 36% of them (vs. 19% of
men), 37% of women vs.
22% of men in France . Despite these differences, men's and women's expectations of work
flexibility are comparable globally: 39%
of women and 37% of men would like to choose when they start and end their
work , 31% would be happy to choose place of work (32% / 30%)
and a quarter (in equal proportions regardless of gender) would like to work
fewer hours per week or concentrate their hours to work fewer days in the
week and free up time for self, the issue no. 1. (Ipsos France) March 9, 2022 732-734-43-41/Polls Despite An
Increasing Amount Of Time Spent On Screens, Young People Still Read As Much
13-19 year olds have an average of 3 personal screens, compared to
1.6 on average for 7-12 year olds. The smartphone is the fetish terminal
of teenagers (90% of equipment). The Internet has become their No. 1 medium, for watching videos,
chatting with loved ones, listening to music, or playing video games:
In a context of media diversification, the press is consolidating its
audience:
Youth remains one of the periods of life during which we read the
most.
More and more equipped “adol-screens” The 2022 edition of Junior Connect' reveals that 13-19 year olds have
an average of 2.9 personal screens. A figure that increases with age,
since it is 1.6 among 7 to 12 year olds. In detail, how is this
distributed? The smartphone remains the preferred personal device for
teenagers; 89% of 13-19 year olds have one, i.e. 12 points more than in
2016. This increase is also very strong among 7-12 year olds (35% equipped in
2021). The computer is the second screen favored by those over 13: they
are nearly 7 out of 10 (69%) to have one. However, there remains a secondary
device for 7-12 year olds (19% equipment). The game console remains a
popular terminal, since 58% of 7-12 year olds and 63% of over 13 year
olds have a personal console. If this rate is in slight erosion, this
does not mean that young people play less, on the contrary: part of their
practice has now migrated from the console to the computer, and especially to
the smartphone. A multiplication of digital uses If the equipment of the under 20s evolves and differs according to
age, screen time is increasing for all the children
questioned, mainly to the benefit of the internet. How is this time consumed? Mainly to watch videos on
streaming platforms, replay channels and SVOD platforms: Netflix in the
lead (70% of over 13s), followed by Amazon PrimeVideo and Disney. The
uses then diverge according to age: those under 12 also use the Internet
to watch live television and tutorials, while those over 13 favor above all
social use: social networks carried by video (Youtube, Snapshat, Instagram,
TikTok) and video games (Fortnite, Discord, Twitch), and instant
messaging. Listening to music is also one of the most popular
uses, on YouTube, Spotify and Deezer. Children under 12 still addicted to reading and the youth press Despite this appetite for the screens, those under 20 remain
faithful to reading the press, especially the youth press. This
practice is still significant among children under 12: more than 7 out of 10
(71%) consult it regularly (+1 point since 2018). Same trend among 1-6
year olds, who are 74% read (+4 points since 2018). This appetite does not decline among " screen addicts ", showing
that the practice of screens does not slow down the reading of young people:
35% of adolescents read the youth press, and this rate remains at 32% among
the biggest consumers of screens. Among young people's favorite press titles are Petit Ours
Brun, Popi and J'aime Lire, published by Bayard; Picsou and Le Journal
de Mickey, from the publisher UHM. What arouses attachment to
magazines? A moment of sharing and exchange for the youngest, a desire
to relax and have fun for the elders. Like what, among young people too,
reading remains synonymous with leisure and escape! (Ipsos France) March 18, 2022 732-734-43-42/Polls The Majority
Of Germans Do Not Know The Minimum Holding Period When Buying E-Cars
In order to achieve the climate goals that have been set and the
desired turnaround in traffic, switching to an electric car must also be
financially attractive for consumers. Therefore, the German state is
currently promoting the purchase of an e-car with a bonus of up to 9,000
euros, which is paid out after registration. However, car buyers must
take into account a minimum holding period of six months. This means
that the subsidy must be repaid by the consumer if the vehicle is sold again
before six months have elapsed. Only slightly more than every fourth
German is aware of this fact (27 percent), men more often than women (35
percent vs. 19 percent). However, 60 percent of all respondents were not
aware of this fact before the survey.
One in four could imagine buying an e-car
under the current minimum holding period regulations Under the current framework conditions, i.e. the minimum holding
period of 6 months in order not to have to pay back the state subsidy, one in
four Germans (26 percent) can imagine buying an electric car within the next
two years, two thirds (66 percent) on the other hand not. There is a
significant difference between the sexes: 30 percent of men can imagine
buying an electric car, given the current minimum holding period of six
months, compared to 23 percent of women. A look at the age groups shows
that the 25 to 34 year olds in particular can imagine buying an electric car
with the current minimum holding period regulation (38 percent). Among
those aged 55 and over, only 19 percent do so.
(YouGov Germany) March 15, 2022 Source: https://yougov.de/news/2022/03/15/mehrheit-der-deutschen-kennt-mindesthaltedauer-bei/ 732-734-43-43/Polls Energy
Supply Is The Most Important Issue For Germans, Ahead Of Environmental
Protection
In Germany, the increased prices for fuel, heating, etc. are
currently on everyone's lips. The federal government wants to relieve consumers
of the sharp rise in costs with packages of measures. Currently, 17
percent of German citizens who are entitled to vote say that the energy
supply (e.g. electricity, gas) is the most important issue that politicians
in Germany should concern themselves with. This value has risen
significantly in recent weeks: in mid-December, only 3 percent made this
statement. The energy supply has thus currently overtaken environmental
and climate protection, which has been the most important issue for Germans
since February 2021 that politicians should concern themselves with.
This is the result of a current survey by the Data & Analytics
Group YouGov, for which 1,841 eligible respondents were surveyed between
March 9th, 2022 and March 13th, 2022 using standardized online interviews. Satisfaction with the federal government
has increased since the Ukraine crisis At the beginning of February, more than half of those surveyed (58
percent) stated that they were (rather) dissatisfied with the work of the traffic
light government so far, almost a third was (rather) satisfied with their
work (32 percent). A more positive picture is currently emerging: 41
percent of Germans say they are satisfied with the work of the federal
government, the proportion of those who are not satisfied with the government
has fallen by 10 percentage points compared to early February to 48
percent. This increasing approval of the basic work of the federal
government coincides with the Russian invasion of Ukraine and the associated decisions
and measures by Chancellor Scholz and his government.
Satisfaction levels for Annalena Baerbock
and Christian Lindner are increasing Before the war broke out in Ukraine at the beginning of February,
every third German voter (34 percent) said that Annalena Baerbock was doing a
good job as foreign minister. Since the beginning of the war, the figure has
risen to 48 percent. At the same time, the figure for those who are
dissatisfied with their work has fallen from 50 percent to 38 percent. The
values for Finance Minister Christian Lindner are also
positive: 43 percent of Germans currently believe that Lindner is doing a
good job, while 36 percent say he is doing a bad job. The voting intentions of the Germans – SPD
and Union are getting closer 26 percent of German voters currently state that they will vote for
the CDU/CSU if the general election is next Sunday. The SPD would
currently choose 25 percent. Accordingly, the SPD gains further
percentage points and the lead of the Union shrinks to 1 percentage
point. The Greens currently have 17 percent of the votes, the values
for the FDP fall slightly to 7 percent (9 percent
in the previous week). The left can unite an unchanged 6 percent, and
the AfD also remains unchanged at 11 percent in the voting intention of
German voters.
(YouGov Germany) March 16, 2022 Source: https://yougov.de/news/2022/03/16/energieversorgung-wichtigste-thema-fur-die-deutsch/ NORTH
AMERICA
732-734-43-44/Polls Most In The
U S Say Young Adults Today Face More Challenges Than Their Parents’
Generation In Some Key Areas
About seven-in-ten Americans think young adults today have a harder
time than their parents’ generation when it comes to saving for the future
(72%), paying for college (71%) and buying a home (70%), according to a Pew
Research Center survey conducted in October 2021. These findings come at a
time when younger Americans are more likely than previous generations to have
taken on student
debt with tuition costs steadily
rising, and to face an affordable housing crisis as rent and housing
prices have grown markedly faster than incomes in the last decade.
There’s less consensus when it comes to assessing labor market
outcomes for young people today compared with their parents’ generation.
Similar shares say finding a job is easier (40%) as say it is harder (39%)
for young adults today. A smaller share of U.S. adults (21%) say it’s about
the same. When it comes to finding a spouse or partner, Americans are more than
twice as likely to say younger adults today have it harder than their parents’
generation (46%) than to say they have it easier (21%). Around a third (32%)
say it’s about the same. On some other measures, Americans are more positive in their
assessments of young adults’ circumstances. A significant majority of U.S.
adults (74%) say it is easier for younger generations today to stay in touch
with family and friends. Only 14% say this is harder for young adults
compared with their parents’ generation. A plurality (41%) says getting into
college is easier for young adults today compared with their parents’
generation; 33% say it’s harder for young adults today and 26% say it’s about
the same. There are notable age differences when it comes to assessing the
circumstances of young adults today. While majorities across all age groups say young adults have it
harder when it comes to buying a home, saving for the future and paying for
college, Americans ages 18 to 29 are more likely than older age groups to say
this. More than eight-in-ten adults younger than 30 (84%) say buying a home is
harder for young adults today, while 80% say the same about saving for the
future and paying for college. Among those ages 30 to 49, 72% say buying a
home and paying for college is harder for young adults today, and 74% say
this about saving for the future. Those 50 and older are the least likely to
say these measures are harder for younger generations to reach, with 63%
saying this about buying a home, 67% saying this about saving for the future,
and 66% saying this about paying for college.
When it comes to finding a job, younger Americans are again the most
likely to say this is harder for young adults today. Overall, 55% of 18- to
29-year-olds say finding a job is harder for young adults today than it was
for their parents’ generation. About four-in-ten or less of those ages 30 to
49 and those 50 and older say this about young adults (39% and 33%,
respectively). There are also double-digit differences between the views of
adults younger than 30 and those ages 50 or older when it comes to finding a spouse
or partner (52% of 18- to 29-year-olds say this is harder for young adults
today vs. 42% in the older group) and getting into college (45% vs. 27%,
respectively). In fact, a plurality of adults 50 and older say getting into
college is easier today
(44%). There are no large differences by age on the measure of staying in
touch with family and friends. Generally, these views differ only modestly by gender, with one
exception. On finding a spouse or partner, about half of women (51%) –
compared with 40% of men – say this is harder for young adults today than it
was for their parents’ generation. This gap is only present among those ages
30 and older; roughly equal shares of women (53%) and men (52%) younger than
30 say this is harder for young adults today. Notably, women in older age
groups give similar answers as younger women, while older men are less likely
than their younger counterparts to say finding a spouse or partner is harder
for young adults today (42% of men 30 to 49 and 34% of men 50 and older say
this). Finally, on most of these measures, there are no significant
differences between adults who are parents of children ages 18 to 29 and
those who are not. On a few items where such differences exist, they tend to
disappear when looking at adults 50 and older. The only item where such
differences persist among older adults is on assessments of finding a job.
Interestingly, those 50 and older who are parents of adult children ages 18
to 29 are more likely than those in the same age group who do not have young
adult children to say young adults today have it easier when it comes to
finding a job (47% vs. 42%, respectively). (PEW) FEBRUARY 28, 2022 732-734-43-45/Polls The Changing
Political Geography Of Covid-19 Over The Last Two Years
Over the past two years, the official count of coronavirus deaths
in the United States has risen and is now approaching 1 million lives. Large
majorities of Americans say they personally
know someone who has been hospitalized or died of the coronavirus, and it
has impacted – in varying degrees – nearly
every aspect of life.
A new Pew Research Center analysis of official reports of
COVID-19-related deaths across the country, based on mortality data collected
by The New York Times, shows how the dynamics of the pandemic have shifted
over the past two years. A timeline of the shifting geography of the
pandemic Monthly reported coronavirus deaths per
100,000 residents by county
Source: Pew Research Center analysis of COVID-19 data collected by
The New York Times as of Feb. 28, 2022. See methodology for details. The pandemic has rolled across the U.S. unevenly and in waves. Today,
the death toll of the pandemic looks very different from how it looked in
the early
part of 2020. The first wave (roughly the first 125,000 deaths from March
2020 through June 2020) was largely geographically concentrated in the
Northeast and in particular the New York City region. During the summer of
2020, the largest share of the roughly 80,000 deaths that occurred during the
pandemic’s second wave were in the southern parts of the country. The fall and winter months of
2020 and early 2021 were the deadliest of the pandemic to date. More than
370,000 Americans died of COVID-19 between October 2020 and April 2021; the
geographic distinctions that characterized the earlier waves became much less
pronounced.
By the spring and summer of 2021, the nationwide death rate had
slowed significantly, and vaccines were widely available to all adults who
wanted them. But starting at the end of the summer, the fourth and fifth
waves (marked by new variants of the virus, delta and then omicron) came in
quick succession and claimed more than 300,000 lives. In many cases, the characteristics of communities that were
associated with higher death rates at the beginning of the pandemic are now
associated with lower death rates (and vice versa). Early in the pandemic,
urban areas were disproportionately impacted. During the first wave, the
coronavirus death rate in the 10% of the country that lives in the most
densely populated counties was more than nine times that of the death rate
among the 10% of the population living in the least densely populated
counties. In each subsequent wave, however, the nation’s least dense counties
have registered higher death rates than the most densely populated places. Despite the staggering death toll in densely populated urban areas
during the first months of the pandemic (an average 36 monthly deaths per
100,000 residents), the overall death rate over the course of the pandemic is
slightly higher in the least populated parts of the country (an average
monthly 15 deaths per 100,000 among the 10% living in the least densely
populated counties vs. 13 per 100,000 among the 10% in the most densely
populated counties).
As the relationship between population density and coronavirus death
rates has changed over the course of the pandemic, so too has the
relationship between counties’ voting patterns and their death rates from
COVID-19. In the spring of 2020, the areas recording the greatest numbers of
deaths were much more likely to vote Democratic than Republican. But by the
third wave of the pandemic, which began in fall 2020, the pattern had
reversed: Counties that voted for Donald Trump over Joe Biden were suffering
substantially more deaths from the coronavirus pandemic than those that voted
for Biden over Trump. This reversal is likely a result of several factors
including differences in mitigation efforts and vaccine uptake, demographic
differences, and other differences that are correlated with partisanship at
the county level.
During this third wave – which continued into early 2021 – the
coronavirus death rate among the 20% of Americans living in counties that
supported Trump by the highest margins in 2020 was about 170% of the death
rate among the one-in-five Americans living in counties that supported Biden
by the largest margins. As vaccines became more widely available, this discrepancy between
“blue” and “red” counties became even larger as the virulent delta strain of
the pandemic spread across the country during the summer and fall of 2021,
even as the total number
of deaths fell somewhat from its third wave peak.
During the fourth wave of the pandemic, death rates in the most
pro-Trump counties were about four times what they were in the most pro-Biden
counties. When the highly transmissible omicron variant began to spread in
the U.S. in late 2021, these differences narrowed substantially. However,
death rates in the most pro-Trump counties were still about 180% of what they
were in the most pro-Biden counties throughout late 2021 and early 2022. The cumulative impact of these divergent death rates is a wide
difference in total deaths from COVID-19 between the most pro-Trump and most
pro-Biden parts of the country. Since the pandemic began, counties
representing the 20% of the population where Trump ran up his highest margins
in 2020 have experienced nearly 70,000 more deaths from COVID-19 than have
the counties representing the 20% of population where Biden performed best.
Overall, the COVID-19 death rate in all
counties Trump won in 2020 is substantially higher than it is in
counties Biden won (as of the end of February 2022, 326 per 100,000 in Trump
counties and 258 per 100,000 in Biden counties). Partisan divide in COVID-19 deaths widened
as more vaccines became available Partisan differences in COVID-19 death rates expanded dramatically
after the availability of vaccines increased. Unvaccinated people are
at far
higher risk of death and hospitalization from COVID-19, according to
the Centers for Disease Control and Prevention, and vaccination decisions
are strongly
associated with partisanship. Among the large majority of counties for
which reliable vaccination data exists, counties that supported Trump at
higher margins have substantially lower vaccination rates than those that
supported Biden at higher margins.
Counties with lower rates of vaccination registered substantially
greater death rates during each wave in which vaccines were widely available.
During the fall of 2021 (roughly corresponding to the delta wave),
about 10% of Americans lived in counties with adult vaccination rates lower
than 40% as of July 2021. Death rates in these low-vaccination counties were about
six times as high as death rates in counties where 70% or more of the adult
population was vaccinated. More Americans were vaccinated heading into the winter of 2021 and
2022 (roughly corresponding to the omicron wave), but nearly 10% of the
country lived in areas where less than half of the adult population was
vaccinated as of November 2021. Death rates in these low-vaccination counties
were roughly twice what they were in counties that had 80% or more of their
population vaccinated. (Note: The statistics
here reflect the death rates in the county as a whole, not rates for
vaccinated and unvaccinated individuals, though individual-level data finds
that death rates among unvaccinated people are far higher than among vaccinated people.) (PEW) MARCH 03, 2022 732-734-43-46/Polls With
Legislative Redistricting At A Crucial Stage, Most Americans Don’t Feel
Strongly About It
The once-a-decade process of legislative redistricting is a topic of
intense interest for both parties and scores of lawmakers whose jobs may be riding
on the outcome. But when asked their view of how redistricting is being
handled in their state, only a small share of Americans have heard a lot
about it and a majority are not sure how they feel.
Just 14% of U.S. adults say they have heard a lot about the
redistricting process in their state, according to a mid-January Pew Research
Center survey. Overall, more than eight-in-ten Americans (85%) say they have
heard a little or nothing at all about legislative redistricting in their
state. While somewhat more Americans are dissatisfied (24%) than satisfied
(19%) with how redistricting is being handled, 55% say they are not sure. Over the past several months, state legislatures and independent
commissions have been busy drafting new legislative maps. As in the past, the
process has turned contentious in many states – and has resulted in scores
of lawsuits. Every state has begun the redistricting process and most
have approved their maps. Redistricting got off to a slow start with the
delayed release of 2020 census data due to pandemic complications. There are only modest partisan differences in views of redistricting:
Democrats and Democratic leaners are more likely than Republicans and
Republican leaners to have an opinion about the process in their state (48%
vs. 39%), and Democrats on balance are more negative in their views of the
process compared with Republicans.
Even among those who are generally attentive to political matters –
the 32% of Americans who say they follow what is going on in government and
politics most of the time – only 28% say they have read or heard a lot about
the redistricting process.
For the minority of Americans who have some view – positive or
negative – about the redistricting process, their attitudes vary by which
party is in control of their state’s government. Republicans living in states with unified Republican control of their
states’ governments are substantially more positive about the process than
those living in states controlled by Democrats or where power is split
between the two parties. Still, the majority of Republicans, regardless of
who is in control of their states’ governments, are indifferent about the
process. A similar dynamic is seen among Democrats. While the greatest share
of Democrats have no opinion either way, those living in states with unified Democratic
control are more positive on balance toward the process than those living in
states with unified Republican control. (PEW) MARCH 4, 2022 732-734-43-47/Polls Three-Quarters
Of Americans Support The United States Participating In International Efforts
To Help Reduce The Effects Of Climate Change
Three-quarters of Americans support the United States participating
in international efforts to help reduce the effects of climate change,
according to a recent Pew
Research Center survey. The survey was conducted shortly before the release of a United
Nations report from the Intergovernmental Panel on Climate Change
that issued a dire warning of the global consequences ahead, unless there are
dramatic increases in climate adaptation efforts.
Nearly all Democrats and Democratic-leaning independents (92%)
support a U.S. role in international efforts to reduce climate change
impacts, as do 53% of Republicans and GOP leaners. Within the Republican
Party, 57% of conservative Republicans oppose U.S. participation in
international efforts while 42% support it. Most moderate or liberal
Republicans favor U.S. involvement (75%).
But the public generally rejects the idea that the U.S. has a
responsibility to help countries with developing economies build their
capacity for renewable energy as part of international efforts to reduce the
effects of global climate change. About four-in-ten Americans (39%) say the U.S. has a responsibility
to provide financial assistance to developing countries to help them expand
renewable energy sources. A majority of Americans (59%) say that the U.S.
does not have this responsibility. The question of aiding developing countries as they transition to
renewable energy sources was among the more contentious issues at the
UN Climate Change Conference (COP26) held in Glasgow, Scotland, last
November. Americans are divided along partisan and ideological lines over the
country’s responsibility to help developing nations. Seven-in ten liberal
Democrats say the U.S. has a responsibility to provide aid for this purpose.
In contrast, just 11% of conservative Republicans say this, while 88% of them
say the U.S. does not have
such a responsibility. Those with more moderate views in either party fall in
between.
Americans are somewhat pessimistic that countries around the world,
including the U.S., will do enough to avoid the worst impacts of climate
change. Fewer than half (36%) say that collective efforts will avoid the
worst climate effects, while 53% say this will not happen. That gloomy outlook is shared by about half or more of Republicans
(56%) and Democrats (51%). One-in-ten U.S. adults (and two-in-ten Republicans) do not consider
climate change impacts to be a problem. A 2021
Center survey of publics in 17 advanced economies found an overall
median of 46% expressing confidence that actions taken by the international
community would significantly reduce the effects of global climate change. A
larger share – 52% – were not confident this would happen. The U.S. was near
the median on this measure, while those in South Korea (68%) and Singapore
(66%) were particularly optimistic that international efforts to address
climate change would significantly reduce the effects of global climate
change. France stood out for more pessimistic views on this matter, with 65%
of its public saying they were not confident this would happen. (PEW) 732-734-43-48/Polls Rising Share
Of Americans See Women Raising Children On Their Own, Cohabitation As Bad For
Society
Americans are more likely than they were three years ago to say
single women raising children on their own and couples living together
without being married are bad for society, according to a Pew Research Center
survey conducted in October 2021. On both, the change has occurred more among
Republicans and those who lean toward the Republican Party than Democrats and
Democratic leaners. Views on these family arrangements vary across many
demographic lines.
Some 47% of U.S. adults say single women raising children on their
own is generally a bad thing for society, an increase of 7 percentage points
from the 40% who said the same in a 2018 Center survey. A smaller share (43%)
says it doesn’t make a difference, and just 10% of adults say it is good for
society. The share of births to unmarried women has remained relatively
stable over the past decade, after increasing
steadily from 1980 to around 2009. In 2020, that share was 41%,
about double the percentage from 40 years ago. Views on single motherhood differ somewhat by race and ethnicity.
About half of White and Asian adults (49% each) say single women raising
children alone is bad for society, compared with a smaller share of Hispanic
adults (39%). Some 46% of Black adults say the same. Since 2018, White adults
have had the largest increase in the share saying this is bad for society –
up 8 points from 41%. Among Black and Hispanic adults, the shares saying
single women raising children on their own is bad for society didn’t change significantly
from 2018. The sample size for Asian adults in 2018 was not large enough to
analyze separately.
Gender is strongly related to perspectives on single women raising
children alone. A majority of men (59%) say single motherhood is bad for
society, compared with 37% of women. In contrast, women are more likely than
men to say women raising children on their own generally doesn’t make much of
a difference for society (50% of women vs. 34% of men). However, the share of
both men and women saying this is bad for society has increased since 2018
(up 9 points for men and 7 points for women). There are also significant differences in these views across age
groups. About half of adults ages 50 and older say single motherhood is bad
for society, compared with 42% of those younger than 30 and 44% of 30- to
49-year-olds. Along party lines, about six-in-ten Republicans and Republican
leaners (62%) say single women raising children alone is bad for society, up
from 53% in 2018. In contrast, 36% of Democrats and Democratic leaners say
this is bad for society, up 6 points from three years ago. Within each party,
there are differences by gender. About three-quarters of Republican men (73%)
say single women raising children on their own is bad for society, compared with
half of Republican women. Among Democrats, 45% of men say this is generally
bad for society; only 28% of Democratic women say the same. When it comes to views on cohabitation, Americans are more likely
than they were in 2018 to say that couples living together without being
married is bad for society, even as cohabitation
is on the rise. Roughly a quarter of U.S. adults (24%) now say that
couples living together without being married is generally bad for society,
up 5 points from three years ago. A smaller share says it is good for society
(14%). Still, a majority of Americans (62%) say it doesn’t make much of a
difference.
Views on cohabitation differ by race and ethnicity, gender, age and
political affiliation. About one-third of Black adults say couples living
together without being married is bad for society (32%), compared with about
a quarter of White (25%) and Asian (24%) adults and 17% of Hispanic adults.
Since 2018, opinions shifted the most among Black adults, with an increase of
8 percentage points in the share saying cohabitation is bad for society.
White adults had a smaller increase of 5 points, while views didn’t change
significantly among Hispanic adults. The sample size for Asian adults in 2018
was not large enough to analyze separately. There are modest differences in views by gender. Women are less
likely than men to say cohabitation is bad for society (23% of women vs. 26%
of men). This has changed from 2018, when equal shares of men and women (19%
each) thought it was bad for society. There are also large differences across age groups. Young adults ages
18 to 29 are the least likely
to say couples living together without being married is bad for society (13%
say this), while 28% say it is good for society. About one-in-five adults
ages 30 to 49 (22%) say cohabitation is bad for society, and roughly a
quarter of adults 50 to 64 (27%) say the same. Among those 65 and older, 35%
say cohabitation is bad for society, while a mere 6% say it is generally
good. Along party lines, Republicans and Republican leaners are more likely
to say cohabitation is a bad thing for society than a good thing. Some 38% of
Republicans say it is bad for society, and only 6% say it is a good thing.
Democrats and Democratic leaners, on the other hand, are more likely to say
it is good rather than bad. One-in-five Democrats say cohabitation is good
for society, while 13% say it is generally bad. More than half in each party
say it doesn’t make much of a difference. While opinions are largely
unchanged since 2018 among Democrats, Republicans are more likely now than in
2018 to say it is bad for society (30% of Republicans said so in 2018). (PEW) 732-734-43-49/Polls Black
Catholics In America
Black Catholics are a minority in the United States in numerous ways.
They comprise a small share of Black adults (6%) and an even smaller share of
Catholic adults (4%). Still, there are approximately 3 million Black
Catholics in the U.S., and the group received media attention after Wilton
Gregory, the archbishop of Washington, D.C., became the first Black
American cardinal in 2020. A recent Pew
Research Center study designed to capture the diversity of Black American
religious life offers new insights into Black Catholics’ religious habits and
experiences, finding that their experiences at parishes and at Mass are often
distinctive from those of other U.S. Catholics. It also shows that their
religious beliefs and practices differ from those of Black Protestants. One way the religious experience of Black Catholics stands out is
that they are a lot less likely than White or Hispanic Catholics – who
together make up the vast majority of U.S. Catholics – to worship in parishes
where most people share their race or ethnicity. Just 25% of Black Catholics who attend Mass at least a few times a
year report that they typically go to a Mass where most other attendees are
Black. That compares with 80% of White Catholic churchgoers who worship where
most attendees are White and 67% of Hispanic Catholic church attenders who
worship where most attendees are Hispanic. In this way, Black Catholics also tend to have very different
experiences than Black Protestants, who make up the majority of Black
Christians in the U.S. About two-thirds of Black Protestants who attend
church at least a few times a year (68%) say they routinely worship where
most other attendees are Black. Many Black Protestants belong to historically
Black Protestant denominations, such as the National Baptist
Convention and the African Methodist
Episcopal Church, which were formed during the 19th century when Black
Americans could not freely worship elsewhere. Others attend nondenominational
Black congregations or Black congregations in majority White denominations.
While relatively few Black Catholics attend predominantly Black
parishes, Black Catholics express some distinctive preferences and
expectations about their congregations. For example, they are more likely
than White or Hispanic Catholics to say they think it is essential that
churches offer a sense of racial affirmation, as well as to say it is
essential that churches assist people who need help with bills, housing or
food. And Black (40%) and Hispanic Catholics (42%) are more likely than White
Catholics (18%) to say it is essential that churches teach practical job and
life skills, and that they offer sermons that address political topics such
as immigration and race relations.
In addition, the majority of Black Catholics say that opposing racism
is important to how they think about being Christian. About three-quarters of
Black Catholics (77%) say opposition to racism is essential to what being
Christian means to them. Most Black Catholics also say opposition to sexism
(75%) and believing in God (73%) are essential to what being Christian means
to them, while much smaller shares say attending religious services regularly
(26%), opposing abortion (22%) and avoiding sex before marriage (16%) are
essential to their Christian faith. Black Catholics are a little more likely than White or Hispanic
Catholics to say that opposing racism and sexism are essential to what being
a faithful Christian means to them. They are about as likely as Black
Protestants to say that opposing discrimination is essential to their faith,
but they are somewhat less likely
than Black Protestants to view regular church attendance, belief in God and
avoiding sex before marriage as essential to their religious identity. Movement into and out of Catholicism The survey finds that 16% of Black Catholics are converts to the
faith – people who identify as Catholic now, though they were raised in
another religious tradition or as religiously unaffiliated. The share of
Black Catholics who are converts to Catholicism is higher than the share of
White or Hispanic Catholics who are converts. That said, the share of Black Americans who were raised as Catholics
and remain Catholics
is lower than the corresponding shares of Hispanic and White Catholics.
Roughly half of Black adults who were raised Catholic still identify as
Catholic (54%), compared with 61% of White adults and 68% of Hispanic adults
who were raised as Catholics and still identify with the faith.
Furthermore, the survey shows that among Black adults, there are more
people who have left Catholicism than have come to the faith. Overall, 4% of
Black Americans say they were raised Catholic and no longer identify as such,
while 1% of Black adults are converts to Catholicism. A similar pattern prevails among U.S. Catholics as a whole. The
Center’s 2014
Religious Landscape Study found that 13% of all U.S. adults are
former Catholics – people who left Catholicism after having been raised in
the church – while 2% of U.S. adults have become Catholic after being raised
in another religion (or no religion). The same study found that Catholicism
had experienced the greatest net losses due to religious switching of any
Christian religious tradition in the U.S. as of 2014. These are among the key findings of a new Pew Research Center
analysis of the characteristics of Black Catholics. The analysis draws
largely on a survey conducted Nov. 19, 2019-June 3, 2020, among a nationally
representative sample of 13,234 adults, including 8,660 Black Americans. The
survey was designed to capture the diversity of Black religious life in the
U.S., allowing for a detailed look at the religious views and experiences of
Black subgroups. A broad overview of the survey’s findings is available in
the 2021 report “Faith
Among Black Americans.” While this new analysis focuses specifically on
Black Catholics, it also incorporates data on White and Hispanic Catholics,
as well as on Black Protestants, for comparison purposes. While Protestantism historically has dominated the Black religious
landscape in the U.S., Catholicism has long had a significant presence among
Black Americans. For example, Pierre
Toussaint, a leader in New York City charities in the 1800s, was the
first lay Catholic buried in the crypt of that city’s St. Patrick’s
Cathedral. The Black Catholic population grew in the early and mid-20th
century when Black Americans migrated from
the rural South to cities across the country with large preexisting Catholic
populations and, in many cases, strong parochial school systems. In more
recent years, immigration
from Africa and the Caribbean further boosted the Black Catholic
population.1 Attendance and experiences at Mass for
Black Catholics
While the share of Black Catholics who attend Mass weekly is similar
to that of other Catholics, the survey suggests that their experiences
while at Mass differ
from those of White and Hispanic Catholics in certain ways.
Black Catholics also travel farther to get to their services – 41% of
Black Catholic attenders report traveling more than 15 minutes to get to
their parish, compared with smaller shares among White (26%) and Hispanic
(30%) Catholics. And the services attended by Black Catholics tend to be longer than
those attended by White Catholics. Roughly a third of Black Catholic
attenders (36%) say the services at their parish typically last at least 1.5
hours, as do 31% of Hispanic Catholics. By contrast, just 9% of White
Catholics say the Masses they attend generally last 90 minutes or longer.
Majorities in all three groups say their services are an hour or less, though
Black (62%) and Hispanic (68%) Catholics are less likely than White Catholics
(91%) to say this. At the same time, Black Catholics tend to have shorter services than
Black Protestants. The vast majority of Black Protestant churchgoers (80%)
say the services they attend typically last 90 minutes or more. What Black Catholics report hearing from the pulpit differs in many
cases from what other Catholics say they hear in sermons. For example, Black
Catholics are more likely than White and Hispanic Catholics to say they heard
a sermon, lecture or group discussion in the past year about race relations
or criminal justice reform. Roughly four-in-ten Black Catholics report having
heard a discussion at church about race relations or racial inequity during the
12 months prior to the survey, compared with 29% of Hispanic Catholics and
18% of White Catholics. At the same time, Black Catholics are less likely to say they heard
sermons on abortion than are White and Hispanic Catholics. Roughly a third of
Black Catholics (35%) say they heard a sermon, lecture or discussion about
abortion in the 12 months prior to the survey, compared with half of White
(50%) and Hispanic (51%) Catholics. Black Catholics are less likely than Hispanic Catholics, but more
likely than White Catholics, to have heard sermons or discussion about
immigration at church.
By comparison, only about a third of Black Catholics say that having
most of the other attendees share their race would be at least somewhat
important (32%) to their choice of a new church, while two-thirds say it
would be “not too” (30%) or “not at all” important (36%). Black Catholics
give similar priority to finding a congregation where most of the clergy
share their race.
About six-in-ten Black Catholics (59%) say they pray at least once a
day, while roughly half (49%) say that religion is very important in their
lives. Black Catholics are somewhat more likely than White and Hispanic
Catholics to say they pray every day, and somewhat more likely than White
Catholics to say religion is very important to them. Black Catholics also are more likely than other Catholics to rely “a
lot” on prayer for guidance in major life decisions. Nearly half of Black
Catholics (48%) say they do this, compared with around four-in-ten Hispanic Catholics
(37%) and about a third of White Catholics (32%). There are additional differences by race and ethnicity when it comes
to reading scripture outside of religious services. Three-in-ten Black
Catholics say they do this at least once a week, compared with 16% of White
Catholics and 18% of Hispanic Catholics. Black Catholics also are more likely
than White Catholics to say the Bible should be taken literally (28% vs.
12%). While Black Catholics tend to be more religious than White Catholics
on these measures, they tend to be less religious
than Black Protestants, who are much more likely to pray at least daily
(73%), to say religion is very important in their lives (73%) and to read
scripture at least once a week (51%).
Black Catholics also are more likely than White Catholics to say they
believe that immigrants strengthen society. More than eight-in-ten Black
(86%) and Hispanic (87%) Catholics say that immigrants “strengthen our
country because of their hard work and talents,” compared with 56% of White
Catholics who say this. Asked whether homosexuality should be accepted by society, Black
Catholics (78%) are about as likely as White (76%) and Hispanic (84%)
Catholics to say that it should. Black Catholics are much more likely than
Black Protestants (57%) to take this position. Age, U.S. region and country of origin
Looking at the Black Catholic population regionally within the U.S.,
there are more Black Catholics in the South than in any other region.
Overall, 45% of Black Catholics in the U.S. live in the South, while roughly
three-in-ten (29%) live in the Northeast. An additional 15% live in the West,
and 11% live in the Midwest.
The survey also shows that Catholicism has a greater
presence among Black immigrants than among U.S.-born Black adults.
One-in-five Black immigrants from sub-Saharan Africa say they are Catholic,
as do 15% of Black immigrants from the Caribbean. By comparison, just 5% of
U.S.-born Black adults identify as Catholic. (PEW) Source: https://www.pewforum.org/2022/03/15/black-catholics-in-america/ 732-734-43-50/Polls 35% Public
Favor U S Military Action Even If It Risks Nuclear Conflict With Russia
Three weeks into Russia’s military invasion of Ukraine, nearly half
of Americans (47%) approve of the Biden administration’s handling of the
Russian invasion, while about four-in-ten (39%) disapprove; 13% say they are
not sure.
Roughly a third of Americans (32%) say that the United States is
providing about the right amount of support to Ukraine as it fights to hold
off the Russian invasion. A larger share – 42% – say the U.S. should be
providing more support to Ukraine, while just 7% say it is providing too much
support. About one-in-five (19%) say they are not sure. The new Pew Research Center survey, conducted March 7-13, 2022, among
10,441 U.S. adults on the Center’s American
Trends Panel, finds wide partisan differences in views of the
administration’s handling of the crisis and the level of support the U.S. has
provided to Ukraine. However, virtually identical shares in both parties – 51% of
Republicans and Republican-leaning independents and 50% of Democrats and
Democratic leaners – regard the Russian invasion as a “major threat” to U.S.
interests.
Moreover, there are several aspects of U.S. policy toward Russia and
Ukraine that draw bipartisan support. While Republicans have
previously expressed skepticism about the extent to which the U.S. should
work with its allies, nearly three-quarters of Republicans (73%) say that
working closely with allies to respond to the Russian invasion is the right
approach. An even larger share of Democrats (85%) say the same. Americans also are largely united in their support for strict
economic sanctions on Russia in response to the invasion of Ukraine. An
overwhelming majority of the public (85%) – including similar shares of
Republicans (85%) and Democrats (88%) – favors maintaining strict economic
sanctions. About six-in-ten Americans (63%) strongly favor strict sanctions.
Large majorities also favor keeping large numbers of U.S. military
forces in NATO countries near Ukraine in response to the conflict (77%), a
position shared by 75% of Republicans and 81% of Democrats. However, most Americans (62%) say they would oppose the U.S. “taking
military action even if it risks a nuclear conflict with Russia.” About a
third (35%) of Americans say they would favor military action in this
scenario. Comparable shares in both parties (36% of Republicans, 35% of
Democrats) say they would favor military action even if it risks nuclear
conflict with Russia. And while nearly seven-in-ten Americans (69%) favor admitting thousands
of Ukrainian refugees into the U.S., including majorities of those in both
parties, Democrats are substantially more likely than Republicans to say this
(80% vs. 57%). The new survey also finds: Broad public attention to Russian invasion. About
seven-in-ten adults (69%) now report having read or heard a lot about the
Russian invasion, compared with 23% who said they had read or heard a lot
about Russia’s military buildup on its border with Ukraine in
a January survey. Today, nearly identical
shares of Republicans (70%) and Democrats (71%) say they have heard or read a
lot about the invasion. Biden job approval largely unchanged from
January. Currently, 43% of Americans approve of
how Joe Biden is handling his job as president, while 55% disapprove. That is
little changed since
January, when 41% approved of Biden’s job performance. Nearly half approve of Biden
administration’s response to Russia’s invasion; more say U.S. is doing too
little than right amount for Ukraine Overall, more Americans approve (47%) than disapprove (39%) of the
Biden administration’s response to Russia’s invasion of Ukraine, while 13%
say they are not sure.
For the most part, the patterns of opinion on the administration’s
handling of the Russian invasion are similar to those in views of Biden’s
overall job performance. Democrats and Democratic leaners largely approve of the
administration’s response to the Russian invasion (69% approve), while
Republicans and Republican leaners mostly disapprove (67% disapprove). Among demographic groups, Black adults are particularly likely to
approve of the administration’s response to Russia’s invasion of Ukraine: 57%
approve, 20% disapprove. Hispanic and Asian adults are more likely to approve
than disapprove of the Biden administration’s response, while White adults
are divided (45% approve, 44% disapprove). There also are educational differences in views of the Biden
administration’s response to the Russian invasion. Nearly six-in-ten (57%) of
those with at least a four-year college degree approve of the
administration’s response, compared with 42% of those who have not completed
college. There is a correlation between Biden’s overall job rating and views
of his administration’s response to the Russian invasion of Ukraine. Among
those who disapprove of Biden’s job performance, most (63%) disapprove of the
administration’s Ukraine response; still, 22% approve and 14% are not sure.
Among the 43% of the public who approves of Biden’s overall job performance,
very few (just 9%) disapprove of the administration’s response to the
invasion, while 11% are unsure and 79% approve. U.S. support for Ukraine About a third of Americans overall say the U.S. is providing about
the right amount of support for Ukraine, while a larger share (42%) say it is
not providing enough support; just 7% say it is providing too much support,
while 19% are not sure.
While there are deep partisan divides in views of the
administration’s response to the crisis, views on U.S. support to Ukraine are
less divided. Nearly half of Republicans (49%) say the U.S. is providing too
little support; 23% say it is providing about the right amount and 9% think
the U.S. is giving Ukraine too much support. Among Democrats, comparable shares say the U.S. is providing Ukraine
about the right amount of support (39%) and too little backing (38%). Just 5%
of Democrats say the U.S. is giving Ukraine too much support – roughly half
the share of Republicans who say the same. There are modest ideological differences within both parties in views
of support for Ukraine: A 54% majority of conservative Republicans (54%) say
the U.S. is not doing enough for Ukraine, compared with 41% of moderate and
liberal Republicans. Among Democrats, liberals (43%) are more likely than
moderates and conservatives (34%) to say the U.S. is not providing enough
support. Among those who disapprove of the Biden administration’s response to
the invasion, a majority (54%) says the U.S. is not providing enough support
to Ukraine, compared with 18% who say it is providing about the right amount
of support and just 13% who say it is providing too much support. About half of those who approve of the administration’s response
(48%) say the U.S. is providing about the right amount of support to Ukraine,
while four-in-ten favor increasing the amount of support and hardly any (2%)
say the U.S. is providing too much support. Half of adults say Russia’s invasion of
Ukraine is a ‘major threat’ to U.S. interests
Half of Americans say Russia’s invasion of Ukraine is a major threat
to U.S. interests, while another 28% say it is a minor threat; just 6% say
the invasion is not a threat to U.S. interests, while 16% are not sure. This
marks a substantial change since before the Russian invasion; in January,
just 26% said “Russia’s military buildup near its border with Ukraine” posed
a major threat to U.S. interests. Republicans and Democrats express virtually identical views of the
threat from Russia’s invasion; 51% of Republicans and 50% of Democrats say it
is a major threat to U.S. interests. In January, about a quarter in each
party viewed Russia’s military buildup near Ukraine as a major threat. Bipartisan backing for keeping strict
sanctions against Russia, keeping large numbers of U.S. forces in Ukraine’s
NATO neighbors More than eight-in-ten Democrats and Democratic leaners (88%) and
Republicans and Republican leaners (85%) favor keeping strict economic
sanctions on Russia. And at least six-in-ten in each party strongly favor maintaining strict
sanctions (68% of Democrats, 61% of Republicans).
Similar shares of Republicans (75%) and Democrats (81%) favor keeping
a large military presence in NATO countries located near Ukraine. And there
is limited support among both Republicans and Democrats for taking military
action, even if it risks a nuclear conflict with Russia: About a third of the
public (35%) and nearly identical shares of Democrats (35%) and Republicans
(36%) favor this. However, Democrats are substantially more likely than Republicans to
favor admitting thousands of Ukrainian refugees into the U.S. Eight-in-ten Democrats say they favor admitting thousands of
Ukrainian refugees, compared with a narrower majority of Republicans (57%). And Democrats are about twice as likely as Republicans to strongly favor admitting thousands
of Ukrainian refugees into the U.S.: 42% of Democrats strongly favor this,
compared with 20% of Republicans. Little change in views of Biden’s job
performance
The public’s views of Joe Biden’s job performance have changed little
since January. Today, 43% of Americans say they approve of the way Joe Biden
is handling his job as president; 41% gave Biden a positive job rating in
January. Biden’s job ratings have remained fairly stable over the past six
months, after declining sharply last summer. While Republicans overwhelmingly disapprove of Biden’s job
performance (91% disapprove), a smaller majority of Democrats (72%) approve
of the way he is handling his job as president. (PEW) 732-734-43-51/Polls 46% Of U S
Adults Think Use Of Facial Recognition Technology By Police Would Be A Good
Idea For Society
Developments in artificial intelligence and human enhancement
technologies have the potential to remake American society in the coming
decades. A new Pew Research Center survey finds that Americans see promise in
the ways these technologies could improve daily life and human abilities. Yet
public views are also defined by the context of how these technologies would
be used, what constraints would be in place and who would stand to benefit –
or lose – if these advances become widespread. Fundamentally, caution runs through public views of artificial
intelligence (AI) and human enhancement applications, often centered around
concerns about autonomy, unintended consequences and the amount of change
these developments might mean for humans and society. People think economic
disparities might worsen as some advances emerge and that technologies, like
facial recognition software, could lead to more surveillance of Black or
Hispanic Americans. This survey looks at a broad arc of scientific and technological
developments – some in use now, some still emerging. It concentrates on
public views about six developments that are widely discussed among
futurists, ethicists and policy advocates. Three are part of the burgeoning
array of AI applications: the use of facial recognition technology by police,
the use of algorithms by social media companies to find false information on
their sites and the development of driverless passenger vehicles. The other three, often described as types of human enhancements,
revolve around developments tied to the convergence of AI, biotechnology,
nanotechnology and other fields. They raise the possibility of dramatic
changes to human abilities in the future: computer chip implants in the brain
to advance people’s cognitive skills, gene editing to greatly reduce a baby’s
risk of developing serious diseases or health conditions, and robotic
exoskeletons with a built-in AI system to greatly increase strength for
lifting in manual labor jobs. The current report builds on previous Pew Research Center analyses of
attitudes about emerging scientific and technological developments and their
implications for society, including opinion about animal
genetic engineering and the potential to “enhance”
human abilities through biomedical interventions, as well as views
about automation and
computer algorithms. As Americans make judgments about the potential impact of AI and
human enhancement applications, their views are varied and, for portions of
the public, infused with uncertainty. Americans are far more positive than negative about the widespread
use of facial recognition technology by police to monitor crowds and look for
people who may have committed a crime: 46% of U.S. adults think this would be
a good idea for society, while 27% think this would be a bad idea and another
27% are unsure. By narrower margins, more describe the use of computer algorithms by
social media companies to find false information on their sites as a good
rather than bad idea for society (38% vs. 31%), and the pattern is similar
for the use of robotic exoskeletons with a built-in AI system to increase
strength for manual labor jobs (33% vs. 24%).
By contrast, the public is much more cautious about a future with
widespread use of computer chip implants in the brain to allow people to far
more quickly and accurately process information: 56% say this would be a bad
idea for society, while just 13% think this would be a good idea. And when it
comes to the much-discussed possibility of a future with autonomous passenger
vehicles in widespread use, more Americans say this would be a bad idea (44%)
than a good idea (26%). Still, uncertainty is among the themes seen in emerging public views
of AI and human enhancement applications. For instance, 42% are not sure how
the widespread use of robotic exoskeletons in manual labor jobs would impact
society. Similarly, 39% say they are not sure about the potential
implications for society if gene editing is widely used to change the DNA of
embryos to greatly reduce a baby’s risk of developing serious diseases or
health conditions over their lifetime. Ambivalence is another theme in the survey data: 45% say they are
equally excited and concerned about the increased use of AI programs in daily
life, compared with 37% who say they are more concerned than excited and 18%
who say they are more excited than concerned. A survey respondent summed up his excitement about the increased use
of artificial intelligence in an open-ended question by saying: “AI can help slingshot us into the future.
It gives us the ability to focus on more complex issues and use the computing
power of AI to solve world issues faster. AI should be used to help improve
society as a whole if used correctly. This only works if we use it for the
greater good and not for greed and power. AI is a tool, but it all depends on
how this tool will be used.” – Man, 30s Another respondent
explained her ethical concerns about the increased use of AI this way: “It’s just not normal. It’s removing the
human race from doing the things that we should be doing. It’s scary because
I’ve read from scientists that in the near future, robots can end up making
decisions that we have no control over. I don’t like it at all.” – Woman, 60s It is important to note
that views on these specific
applications do not constitute the full scope of opinions about the growing
number of uses of AI and the proliferating possible
advances being contemplated to boost human abilities. The survey was built around six vignettes, to root opinion in a
specific context and allow for a deeper exploration of views. Thus, our
questions about public attitudes about facial recognition technology are not
intended to cover all possible uses but, instead, to measure opinions about
its use by police. Similarly,
we concentrated our exploration of brain chip implants on their potential to
allow people to far more efficiently process information rather than on the
use of brain implants to address therapeutic needs, such as helping people
with spinal cord injuries restore movement. The survey findings underscore how public opinion is often contingent
on the goals and circumstances around the uses of AI and human enhancement
technologies. For example, in addition to exploring views about the use of
facial recognition by police in depth, the survey also sought opinions about
several other possible uses of facial recognition technology. It shows that
more U.S. adults oppose than favor the idea of social media sites using
facial recognition to automatically identify people in photos (57% vs. 19%)
and more oppose than favor the idea that companies might use facial
recognition to automatically track the attendance of their employees (48% vs.
30%). Some of the key themes in the survey of 10,260 U.S. adults, conducted
in early November 2021: A new era is emerging that Americans
believe should have higher standards for assessing the safety of emerging
technologies. The survey sought public views
about how to ensure the safety and effectiveness of the four technologies
still in development and not widely used today. Across the set, there is
strong support for the idea that higher standards should be applied, rather
than the standards that are currently the norm. For instance, 87% of
Americans say that higher standards for testing driverless cars should be in
place, rather than using existing standards for passenger cars. And 83%
believe the testing of brain chip implants should meet a higher standard than
is currently in use to test medical devices. Eight-in-ten Americans say that
the testing regime for gene editing to greatly reduce a baby’s risk of
serious diseases should be higher than that currently applied to testing
medical treatments; 72% think the testing of robotic exoskeletons for manual
labor should use higher standards than those currently applied to workplace
equipment.
Sharp partisan divisions anchor people’s
views about possible government regulation of these new and developing
technologies. As people think about possible
government regulation of these six scientific and technological developments,
which prospect gives them more concern: that government will go too far or
not far enough in regulating their use?
Majorities of Republicans and independents who lean to the Republican
Party say they are more concerned about government overreach, while
majorities of Democrats and Democratic leaners worry more that there will be
too little oversight. For example, Republicans are more likely than Democrats to say their
greater concern is that the government will go too far regulating of the use
of robotic exoskeletons for manual labor (67% vs. 33%). Conversely, Democrats
are more likely than Republicans say their concern is that government
regulation will not go far enough. People are relatively open to the idea that a variety of actors – in
addition to the federal government – should have a role in setting the
standards for how these technologies should be regulated. Across all six
applications, majorities believe that federal government agencies, the
creators of the different AI systems and human enhancement technologies and
end users should play at least a minor role in setting standards. Less than half of the public believes these
technologies would improve things over the current situation. One
factor tied to public views of human enhancement is whether people think
these developments would make life better than it is now, or whether reliance
on AI would improve on human judgment or performance. On these questions,
less than half of the public is convinced improvements would result. For example, 32% of
Americans think that robotic exoskeletons with built-in AI systems to
increase strength for manual labor would generally lead to improved working
conditions. However, 36% think their
use would not make much difference and 31% say they would make working
conditions worse. In thinking about a future with widespread use of driverless cars,
39% believe the number of people killed or injured in such accidents would go
down. But 27% think the number killed or injured would go up; 31% say there
would be little effect on traffic fatalities or injuries. Similarly, 34% think the widespread use of facial recognition by
police would make policing more fair; 40% think that it would not make much
difference, and 25% think it would make policing less fair. Another concern for Americans ties to the potential impact of these
emerging technologies on social equity. People are far more likely to say the
widespread use of several of these technologies would increase rather than
decrease the gap between higher- and lower-income Americans. For instance,
57% say the widespread use of brain chips for enhanced cognitive function
would increase the gap between higher- and lower-income Americans; just 10%
say it would decrease the gap. There are similar patterns in views about the
widespread use of driverless cars and gene editing for babies to greatly
reduce the risk of serious disease during their lifetime.
Even for far-reaching applications, such as
the widespread use of driverless cars and brain chip implants, there are
mitigating steps people say would make them more acceptable. A
desire to retain the ability to shape their own destinies is a theme seen in
public views across AI and human enhancement technologies. For even the most
advanced technologies, there are mitigating steps – some of which address the
issue of autonomy – that Americans say would make the use of these
technologies more acceptable. Seven-in-ten Americans
say they would find driverless cars
more acceptable if there was a requirement that such cars were labeled as
driverless so they could be easily identified on the road, and 67% would find
driverless cars more acceptable if these cars were required to travel in dedicated
lanes. In addition, 57% say their use would be more acceptable if a licensed
driver was required to be in the vehicle. Similarly, about six-in-ten Americans think the use of computer chip
implants in the brain would be more acceptable if people could turn on and
off the effects, and 53% would find the brain implants more acceptable if the
computer chips could be put in place without surgery. About half or more also see mitigating steps that would make the use
of robotic exoskeletons, facial recognition technology by police and gene
editing in babies to greatly reduce the risk of serious disease during their
lifetime more acceptable.
(PEW) MARCH 17, 2022 732-734-43-52/Polls Majority
(55%) Disagrees That Canada Cannot Afford To Help Ukraine, But Fewer Than
Half (47%) Are Willing To Pay More For Gas Because Of Sanctions Against
Russia
As Russia’s invasion of Ukraine enters its third week,
Canadians support increasing sanctions against Russia and support for
Ukraine, but stop short of supporting direct military involvement of Canadian
troops against Russia. As gas prices across the country catapult to roughly
$2 per litre, Canadians are split on whether they’re personally willing to
pay the costs associated with the tough sanctions against Russia. While half of Canadians (48%) believe that Canada’s level of support
to Ukraine thus far has been about right, on balance the scales tip towards
doing more to help: 39% believe Canada has not done enough to support Ukraine
and needs to do more. Conversely, just 13% believe that Canada has done too
much to support Ukraine and should scale back it support. Assessing various measures that Canada’s leaders might be
considering, a consensus has formed around some, but other ideas are more
contentious:
Canadians not only want to offer support to Ukraine in its armed
conflict, but also to the people of Ukraine, millions of whom have fled their
country as refugees over the last two weeks. Specifically, most (84%) support
(32% strongly/52% somewhat) the idea that Canada should send aid to neighbouring countries in the region that are
welcoming refugees from Ukraine, while relatively few (16%)
disagree (6% strongly/10% somewhat). Moreover, four in five (81%) Canadians
support (35% strongly/46% somewhat) Canada
doing whatever it can to take in Ukrainian refugees itself,
while just one in five (19%) oppose (6% strongly/12% somewhat) Canada opening
its borders to Ukrainian refugees in Europe. Canadians Paying Attention, Concerned about
Conflict’s Impact on Canada The data reveal that three quarters are paying attention to the
conflict (29% very closely/45% fairly closely), while just one quarter aren’t
following it (5% not at all/21% not very closely). Interestingly, Albertans
(81%) are most likely to be following the news about Ukraine, while Quebecers
(66%) are the least likely. Given the severity of the situation, it’s perhaps not surprising that
most Canadians are concerned about its impact on the Canadian economy,
Canadian security, and indeed their own family:
With high inflation already a worry among many Canadians, it’s
perhaps not surprising that Canadians are split on whether they are
personally willing to bear the costs of some of the economic sanctions that
are in place against Russia. Slightly less than half (47%) agree (13%
strongly/34% somewhat) that they’re prepared
to pay more for gas because of Canada’s sanctions against Russia,
while a slim majority (53%) disagree (27% strongly/25% somewhat) that they
are prepared to pay more. Those under the age of 55 are most likely to say
they’re not fine
paying more (60%), while those over the age of 55 are less likely (39%) to be
opposed to paying more. Moreover, nearly half (45%) of Canadians agree (14% strongly/32%
somewhat) that given the current
economic crisis, Canada cannot afford to give financial support to Ukraine –
the proportion of which rises to 55% among those aged 18-34, and 52% among
those aged 35-54. Only 32% of Canadians aged 55+ see this as a reason not to
support Ukraine. Despite not being happy about the costs inflicted on average
Canadians as a result of higher gas prices, for example, a majority of
Canadians see the need for sanctions: six in ten (59%) agree (11%
strongly/47% somewhat) that the economic
sanctions we have placed on Russia are the most effective way for Canada to
stop this invasion, and seven in ten (73%) agree that if Canada does nothing to help Ukraine it will
encourage Russia to take further military action elsewhere. So
while Canadians aren’t happy with the hit to their pocketbook, they appear to
accept that it is a necessary consequence of providing support to Ukraine.
There is a relatively small contingent of Canadians, however, which
believes that Canada has no business getting involved in this conflict
whatsoever. One quarter (25%) agrees (9% strongly/16% somewhat) that Canada should stay out of Ukraine’s problems because
Ukraine is not a NATO country and we have no treaty obligation to them.
Three quarters (75%) disagree (31% strongly/44% somewhat) with this premise.
Similarly, one in five (20%) agree (7% strongly/13% somewhat) that the problems of Ukraine are none of our business,
while most (80%) disagree (44% strongly/36% somewhat) with this argument. Canadians Approve of Response of Political
Leaders and Alliances to Ukraine Crisis Canadians have given strong assessments of the performance of various
political leaders in response to the crisis in Ukraine, with top marks going
to Ukrainian President Volodymyr Zelenskyy himself.
Focusing on Canadian Prime Minister Justin Trudeau, approval of his
response is significantly higher among those aged 55+ (73%) and 35-54 (66%)
than those aged 18-34 (56%). Approval is also higher in Quebec (72%) British
Columbia (71%) and Atlantic Canada (69%) than it is in Ontario (64%), Alberta
(61%) and Saskatchewan and Manitoba (54%). (Ipsos Canada) 11 March 2022 Source: https://www.ipsos.com/en-ca/news-polls/canadians-support-increased-sanctions-to-deter-russia 732-734-43-53/Polls Meeting
Energy Needs: More Than Half Of Quebecers (52%) Agree To Developing Own Oil
Resources Instead Of Importing All Its Oil
The recent geopolitical instability caused by the war in Ukraine has
underlined the importance of rethinking how the global economy meets its
energy needs. In this context, a new Ipsos survey on behalf of the Montreal
Economic Institute shows that more than 52% of Quebecers think their province
should develop its own oil resources instead of importing all the oil that is
consumed – this represents a 9-point increase compared to last year.
Inversely, almost one in three Quebecers (28%) thinks 100% of the oil
consumed should be imported and a fifth (20%) are undecided. Economic Uncertainty and Meeting Energy
Needs The increase in inflation, interest rates and the price of gas seems
to have contributed to a rise in anxiety over the fluctuations of the energy
sector: three quarters of Quebecers (73%) think that taxes and duties on
gasoline are already too high and shouldn’t be increased any further.
Moreover, more than half (51%) say they strongly agree, while only 15%
disagree. Those aged 55 and over are more likely to agree (79% vs 70%: 35-54
et 68%: 18-34), which is also the case for the residents of the greater
Montreal region (9% vs. 6% for the Quebec region and 5% for other regions). Elsewhere, half of Quebecers (50%) think that the actions taken by
some environmental groups are preventing too many job-creation projects from
moving forward – which represents a 9-point increase compared to August 2021.
A third (33%) of Quebecers disagree while 18% remain undecided. In the same vein, less than half of Quebecers (47%, 23% ‘completely’;
25% ‘somewhat’) believe it is more important for them to create jobs in their
region than to reduce global greenhouse gas emissions by 0.06% by reaching
the target set by the Quebec government for 2030. Inversely, 41% disagree
(21% ‘a little’; 20% ‘strongly’). Men are more likely to agree than women by
a 7-percentage point difference. Governmental Management of the Energy
Sector When it comes to the management of green energy sector by the
government of Quebec, more than half (55%, 22% ‘completely’; 33 ‘somewhat’)
of Quebecers believe that the government should promote competition around
the production of green hydrogen, rather than maintaining its monopoly. 19%
disagree and more than a quarter (26%) don’t know. Similarly, more than half
(54%, 21% ‘completely’; 33% ‘somewhat’) believe that Quebec should follow the
European Union’s example and designate natural gas as a source of green
energy; 22% disagree and 24% remain undecided. For these two propositions,
men are more likely to agree than women by an 11-point and 8-point difference
respectively. Concerning the recent proposal by the government of Quebec to
prohibit the exploration and exploitation of the province’s oil and gas
potential, 45% of Quebecers agree with this proposition, while a third
disagree. If this idea were implemented, more than half (51%) believe that
the companies that hold licenses should be compensated according to the
market value of their license. (Ipsos Canada) 17 March 2022 AUSTRALIA
732-734-43-54/Polls Mobile
Banking Apps And The Internet Are More Satisfying For Customers Than Branch
Visits Or Phone Banking
As of December 2021, CBA was the strongest performer of the big four
with the highest customer satisfaction across three of the service channels
including mobile banking (90.8%), internet banking (87.8%) and branch banking
(83.5%). The CBA had customer satisfaction of 76.3% for phone banking. There was little to split their three competitors with ANZ coming in
second overall with 89.2% (mobile), 86.6% (internet), 83.2% (branch) and
76.6% (phone). Westpac followed with 87.9% (mobile), 86.1% (internet), 82.1%
(branch) and the highest of the big four for phone banking (79.4%). NAB
rounded out the big four with 89.8% (mobile), 86.5% (internet), 81.5%
(branch) and 77.3% (phone). This new data comes from Roy Morgan Single Source, Australia’s most
comprehensive consumer survey, derived from in-depth interviews with over
60,000 Australians each year. Mobile banking (via a mobile or tablet app) proved to be the banking
channel with the highest customer satisfaction, with an average rating among
the big four banks of 89.4%. Internet banking, which is visiting a bank’s
website received the second highest average satisfaction rating with 86.8%.
Branch banking followed with 82.6%, and phone banking, which involves calling
the bank directly, came in fourth with 77.4%. Customer satisfaction ratings of bank
service channels – December 2021
Mobile banking has now overtaken internet
banking as the most used banking service channel The high customer
satisfaction for mobile banking is
good news for the big four banks as it is increasingly the preferred way for
customers to access their banking accounts – overtaking usage of internet
banking for the first time during 2021. Nearly two-thirds of Australians, 63.6%, now use mobile banking apps
on a mobile phone or tablet to access their bank accounts, up 7% points on a
year ago. Internet banking, which is conducting banking through an
institution’s website, remains as the second most used channel with a bare
majority of 50.3% using this service, but down 9.1% points on a year ago. Visiting a branch is clearly the third preferred service channel used
by 47.4% of people, down 6.2% points on a year ago while phone banking is
used by only 22.8% of people, virtually unchanged on a year ago. Service channels used in the last 12 months
– December 2021
Roy Morgan CEO Michele Levine says mobile
banking apps continue to grow in popularity and the good news for the banks
is that customer satisfaction is over 2.5% points higher for mobile banking
apps than any other service channel: “If we consider the four main banking channels
available to customers it is clear mobile banking apps are increasingly the
preferred channel customers are using to conduct their banking and financial
transactions – especially at the expense of internet banking and visiting a
branch. “The ease of using a mobile app to check on
one’s account balance and transactions means it is no surprise this is not
only the most used banking service channel, but also that with the highest
customer satisfaction – at an average of 89.4% for customers of the big four
banks. “For the first time in 2021 more
Australians used a mobile banking app: 63.6% (up 7% points on 2020) than
internet banking: 50.3% (down 9.1% points), to conduct their banking – a
swing of 16.1% points on a year earlier. The rise of mobile banking apps is
also coming at the expense of visiting a branch – which fell 6.2% points to
47.4%. “The good news for the big four banks is
that customer satisfaction with mobile banking apps is higher for customers
of the big four banks (89.4%) than the industry average for all banks (89.0%)
– the only banking service channel the big four banks have an advantage. “Leading the way is the CBA with a customer
satisfaction rating of 90.8% for its mobile banking app, just ahead of its
peers including NAB (89.8%), ANZ (89.2%) and Westpac (87.9%) – with less than
3% points separating all four banks. “The CBA also performs well when it comes
to internet banking with a market leading customer satisfaction of 87.8%, and
customer satisfaction with visiting a branch at 83.5%. Westpac is the best
performer in terms of phone banking with a customer satisfaction rating of
79.4%. “The higher customer satisfaction ratings
of the automated banking channels give an extra incentive to banks and other
financial services firms to increasingly move as many of their services
online as possible. “An added benefit for the banks of moving
customers online is the reduced labour costs associated with these
frictionless banking channels and it’s easy to see why the trends of recent
years are set to continue with even greater technological integration and
less face-to-face interaction with staff in an increasingly connected world.” (Roy Morgan) February 28 2022 Source: https://www.roymorgan.com/findings/8909-banking-channels-services-december-2021-202202280410 732-734-43-55/Polls Australian
Unemployment Up To 8.5% In February As Omicron Variant Slowly Recedes Around
Australia And Restrictions Ease
The moves in the employment market led to a rise in Australian
unemployment with 1.23 million Australians (8.5% of the workforce) unemployed
in February, up 26,000 on January. The increased unemployment was driven
entirely by an increase in part-time unemployment (up 26,000) as summer jobs
came to an end while full-time unemployment was virtually unchanged.
The workforce in
February was 14,443,000 (down 137,000 from January – a second straight
monthly decline) – comprised of
13,216,000 employed Australians (down 163,000, also a second straight monthly
decline) and 1,227,000 unemployed Australians looking for work (up 26,000);
Australian employment
fell by 163,000 to 13,216,000 in February driven by a fall in part-time
employment, down by 191,000 to 4,423,000. However, full-time employment
increased by 28,000 to 8,793,000;
1,227,000 Australians
were unemployed (8.5% of the
workforce), an increase of 26,000 from January with more people
looking for part-time work (up 27,000 to 764,000). The number of Australians
looking for full-time work was virtually unchanged at 463,000.
In addition to the
unemployed, 1.13 million Australians (7.8% of the workforce) were
under-employed – working part-time but looking for more work, a decrease of 96,000 (down 0.6% points) from January. In total 2.36 million Australians (16.3% of the workforce) were
either unemployed or under-employed in February, a decrease of 70,000 on
January and the lowest combined unemployed and under-employed in the
Australian labour force since pre-pandemic in November 2019 – 2.23 million
(16.1%). Compared to early March 2020, before the
nation-wide lockdown, in February 2022 there were almost 200,000 more
Australians either unemployed or under-employed (+0.7% points) even though
overall employment (13,216,000) is over 300,000 higher than it was
pre-COVID-19 (12,872,000). Roy Morgan Unemployment &
Under-employment (2019-2022)
Michele Levine, CEO Roy Morgan, says the
impact of the Omicron variant on Australia’s employment markets continued
into February with a second straight monthly decline in both the workforce
and the total number of employed Australians: “The latest Roy Morgan employment estimates
for February show unemployment up 0.3% points to 8.5% and returning to its
level in December 2021. There was better news for under-employment which fell
0.6% points to 7.8%. Overall unemployment and under-employment have now
dropped to their lowest since the pandemic began in mid-March 2020 – nearly
two years ago. “Although total unemployment and
under-employment is at its lowest since the pandemic began the lingering
impact of the Omicron variant continued to disrupt the Australian employment
market in February. Overall employment fell 163,000 to 13,216,000, a second
straight monthly decline. “The good news is that the high number of
cases associated with the Omicron variant are now behind us, except for
Western Australia which just re-opened its borders, and we have moved onto
other pressing worries. During February mask wearing mandates and
restrictions on movement around the country and internationally have now been
relaxed as we finally enter a period of ‘COVID-normal’. “However, the dissipation of COVID-19
doesn’t mean we are able to return to calmer economic times just yet. There
were big challenges that emerged towards the end of February with devastating
flooding in Queensland and New South Wales leaving tens of thousands of
Australians homeless and on the international stage Russia’s invasion of
Ukraine is causing huge disruption to global markets. “Although the direct impact of the conflict
on Australia is likely to be small, the sanctions imposed on Russia and its
energy exports are set to increase inflation worldwide and lead to a surge in
demand for key Australian export goods – particularly gas and coal but
potentially other metals as well. “The increases in the price of oil seen
since Russia’s invasion of Ukraine is set to have the biggest immediate
impact on the Australian economy. The increasing price of oil will likely see
petrol prices in Australia exceed $2 per litre for the first time ever in the
next few weeks. “This presents a huge problem for the Federal
Government as it seeks re-election in mid-May. Soaring petrol prices will
feed into higher inflation – the latest Roy Morgan figures show Inflation Expectations at
4.9% in January – an equal seven year high. High and rising inflation increases the pressure
on the RBA to raise interest rates earlier than forecast and will clearly
cause a slowdown in economic growth which will in turn have a negative impact
on Australia’s recovering employment markets.” Roy Morgan Unemployed and ‘Under-employed’*
Estimates
*Workforce includes
those employed and those looking for work – the unemployed. This Roy Morgan survey
on Australia’s unemployment and
‘under-employed’* is
based on weekly interviews of 814,217 Australians aged 14 and over between
January 2007 and February 2022 and includes 6,090 telephone and online
interviews in February 2022. *The
‘under-employed’ are those people who are in part-time work or freelancers
who are looking for more work. Contact Roy Morgan to learn more about
Australia’s unemployed and under-employed; who and where they are, and the challenges they
face as they search for employment opportunities. Visit the Roy Morgan Online Store to
purchase employment profiles, including for Australians who are employed, unemployed, under-employed, employed part-time, employed full-time, retired, studying and many more. Roy Morgan Research cf. ABS Unemployment
Estimates
Note: Roy Morgan unemployment estimates are actual
data while the ABS estimates are seasonally adjusted.
(Roy Morgan) March 07 2022 Source: https://www.roymorgan.com/findings/8924-australian-unemployment-estimates-february-2022-202203070529 732-734-43-56/Polls Inflation
Expectations Up 0.2% Points To 5.1% In February; Highest For Nearly Eight
Years Since June 2014
Inflation Expectations are now 0.4% points above the long-term
average of 4.7% and a large 1.4% points higher than a year ago in February
2021 (3.7%).
Inflation Expectations by Home Ownership
Status: August 2020 (record low) cf. February 2022
Inflation Expectations continue to be
higher in Country Areas (5.2%) than Capital Cities (5.0%) Inflation Expectations
have been consistently higher in Country Areas than Capital Cities since
bottoming in mid-2020 during the early stages of the pandemic and that trend continues in the early months of
2022. On a State-based level Inflation Expectations were highest in
Queensland at 5.5%, a State with a significant regional-based population.
Inflation Expectations were also higher than the national average at 5.4% in
both Western Australia and South Australia. Inflation Expectations were slightly below the national average in
Tasmania (5.0%) and the two largest States of Victoria (4.9%) and New South
Wales (4.8%). Inflation Expectations Index long-term
trend – Expected Annual Inflation in next 2 years
See below for a comprehensive list of RBA interest rate changes
during the time-period charted above. “Inflation Expectations increased 0.2%
points to 5.1% in February 2022, the highest the measure has been at for
almost eight years since June 2014 (5.3%). The increase in Inflation
Expectations came largely before the Russian invasion of Ukraine which began
in the last few days of the month. “The Russian invasion of Ukraine, which
began on Thursday February 24, has caused a round of heavy sanctions against
Russian exports and led to a surge in the price of key commodities including
oil, gas, coal, wheat and other foodstuffs. “The price of a barrel of oil has now
exceeded $150 AUD since the war began and the upward pressure has already
seen petrol prices increase beyond $2 per litre in many parts of Australia.
If the war continues, petrol prices could well go far higher over the next
few months. “Although the latest ABS quarterly Consumer Price Index showed
Australian inflation rising by only 3.5% over the 12 months to December 2021, this figure is set to rise during 2022 – and
especially now with the increasing geo-political tensions in Europe and the
heavy sanctioning of Russia. “The biggest concern for the Federal
Government as it faces re-election is that wage growth is not keeping up with
inflation. The latest ABS Quarterly Wage Price Index shows an annual
increase of 2.3% for wages over the 12 months to December 2021 – more than 1% points below the inflation
rate. “The rising level of inflation in the
economy is hitting some people far harder than others and this disparity is
clear when examining Australians by home ownership status. Australians who
are renting have easily the highest Inflation Expectations at 5.9% - up a
stunning 2.3% points since August 2020 when the measure hit a record low. “In comparison, people who own their home
outright have Inflation Expectations of 4.8% (up 1.7% points) and people who
are paying off their home have the lowest of all at only 4.5% (up 1.5%).
Although Inflation Expectations for renters are generally higher, they have
increased far more rapidly for renters over the last 18 months than for
homeowners and those paying off their home. “The risk of a spike in inflation in the
next few months increases the likelihood the RBA will raise interest rates
earlier than initially forecast. Although the RBA has consistently stated that
it has no plans to raise interest rates until wage growth in Australia is
‘sustainably above an annual rate of 3%’ the new economic disruptions caused
by the conflict between Russia and Ukraine will cause a reassessment if they
mean prices persist at a higher-than-expected level over the next few months. “However, although the rising inflation
will cause a political headache in the run-up to the Federal Election due in
mid-May they are likely to avoid the prospect of the RBA raising interest
rates during the middle of an election campaign which may be of small
comfort. “The latest Roy Morgan Poll on Federal
voting intention taken in the week following the Russian invasion of Ukraine
shows the ALP 56.5% continuing to hold a commanding two-party
preferred lead over the L-NP 43.5% in early March 2022.”
The questions used to calculate the Monthly
Roy Morgan Inflation Expectations Index. The Roy Morgan
Inflation Expectations Index is a forward-looking indicator unlike the
Consumer Price Index (CPI) and is based on continuous (weekly) measurement,
and monthly reporting. The Roy Morgan Inflation Expectations Index is current and relevant.
RBA interest rates changes during the
time-period measured: 2010-2020. (Roy Morgan) March 15 2022 Source: https://www.roymorgan.com/findings/8921-australian-inflation-expectations-february-2022-202203150148 732-734-43-57/Polls 2.9 Million
New Zealanders Read Newspapers And Nearly 1.8 Million Read Magazines In 2021
2.9 million, or 69.5%, of New Zealanders aged 14+ now read or access
newspapers in an average 7-day period via print or online (website or app)
platforms. In addition, almost 1.8 million New Zealanders aged 14+ (42.5%)
read magazines whether in print or online either via the web or an app. These are the latest findings from the Roy Morgan New Zealand Single
Source survey of 6,514 New Zealanders aged 14+ over the 12 months to December
2021. A majority of the top ten newspapers grew
their total cross-platform audience in 2021 The leading performer
during the pandemic has been New Zealand’s most widely read publication
the New Zealand Herald with
a total cross-platform audience of 1,844,000 in the 12 months to December
2021. Stuff.co.nz retains
the position as New Zealand’s leading news website for those on the lookout
for the latest news bringing together leading newspapers the Dominion Post, The Press and Sunday Star-Times, and magazines such as
the TV Guide and NZ Gardener. The total digital audience
for Stuff in an
average 7 days is over 1.75 million New Zealanders, up nearly 40,000 on a
year ago and over 200,000 ahead of main rival NZHerald.co.nz on 1.55 million. A majority of six of the top ten titles grew their total
cross-platform audiences during 2021 led by the Otago Daily Times, which was up an
impressive 50,000 (+20%) to an audience of 304,000, the Northern Advocate, up 35,000 (+33%) to an
audience of 142,000 and the Taranaki
Daily News, up 31,000 (+29.7%) to an audience of 137,000. Other newspapers to increase their total cross-platform audiences
during 2021 included Hawke’s Bay Today,
up 19,000 (+12.4%) to 173,000, Bay of
Plenty Times, up 4,000 (+3%) to 149,000, Waikato Times, up 2,000 (+0.9%) to
195,000. Filling out the top ten are the Dominion Post in second place with an audience of
408,000 readers ahead of The Press in
fourth place on 272,000 followed by the Sunday Star-Times on 216,000. Despite the challenges of the last two years a majority of Stuff’s
newspapers have grown their total cross-platform audiences during 2021 led by
the Waikato Times, Taranaki Daily News, Southland Times, Nelson Mail, Sunday News and Timaru Herald.
Full Newspaper Readership Results available
to view here. *Cross-Platform Audience is the number of
New Zealanders who have read or accessed individual newspaper content via
print or online. Print is net readership in an average 7 days. Online is net
readership online in an average 7 days. New Zealand Listener and AA Directions
increase their print readership during 2021 The weekly New Zealand Listener was temporarily
suspended from publication during 2020 as the initial stages of the COVID-19
pandemic caused a sharp drop in advertising revenue early. Later in the
year New Zealand Listener was
relaunched and has experienced impressive growth in the year to December 2021,
up by 36,000 to an average issue readership of 221,000. However, despite the improvement for the second-placed New Zealand Listener, New Zealand’s most
widely read magazine is easily the driving magazine AA Directions which had an average
issue readership of 374,000 during the year to December 2021, up 9,000 on a
year ago. There were also strong results for NZ House & Garden which increased its readership by
18,000 to 110,000, Habitat which
grew its readership by 10,000 to 100,000 and Dish, up 3,000 to 92,000. Other widely read magazines included TV Guide with a readership of 157,000, NZ Woman’s Day on 146,000, Australian Women’s Weekly (NZ Edition) on
141,000, NZ Woman’s Weekly unchanged
on 105,000 and NZ Gardener on
93,000. Women’s Lifestyle and Fashion magazines were among the big improvers
in 2021 with Mindfood, up
2,000 to 80,000, Simply You Living,
up 26,000 to 50,000, NZ Fashion
Quarterly, up 20,000 to 50,000 and Fashion, up 20,000 to 50,000. Other magazines to grow their readership during 2021 included Heritage NZ, up 27,000 to 76,000, Home NZ, up 25,000 to 60,000, New Zealand’s Best Dining Guide, up
37,000 to 55,000, Your Home &
Garden, up 3,000 to 54,000, Kiwi
Gardener, up 21,000 to 51,000, Good, up 32,000 to 49,000, New Idea, up 1,000 to 47,000, Metro, up 18,000 to 43,000 and NZ Fishing News, up 17,000 to 40,000. Several Are Media magazines including New Zealand Listener, Australian
Women’s Weekly (NZ Edition), NZ Woman’s Day and NZ Woman’s Weekly were temporarily suspended from publication
in the June and September 2020 quarters due to the New Zealand lockdown. The
figures for these magazines show average readership for the available
quarters. New Zealand’s Top 10 Magazines by Average
Issue Print Readership
Full Readership Results for over 60 New
Zealand Magazines available to view here. *Roy Morgan has measured additional
readership for this magazine via Cross-Platform Audiences – see next section.
**Note: Are Media magazines were temporarily suspended during the June and
September 2020 quarters. Results for these magazines have been suppressed for
the impacted quarters, average issue readership is allocated instead. AA Directions and New Zealand Listener lead
cross-platform* audience growth in 2021 Of the top ten magazines by cross-platform audience there were five
which experienced growth during 2021 – led by the two most widely read AA Directions and New Zealand Listener.
A majority of eight out of the top ten magazines grew their digital
audience over the past year during the pandemic including AA Directions, up 23,000 to
171,000, Dish, up 37,000 to
116,000, Mindfood, up
33,000 to 109,000, NZ House &
Garden, up 37,000 to 91,000, North & South, up 6,000 to 90,000, New Zealand Listener, up 18,000 to
74,000, Australian Women’s Weekly (NZ
Edition), up 6,000 to 65,000 and TV Guide, up 8.000 to 58,000.
Full Newspaper Readership Results available
to view here. *Cross-platform audience is the number of
New Zealanders who have read or accessed individual magazine content via
print or online. Print is average issue readership. Digital is average
website visitation and app usage (if available) in last 7 days for weekly
titles (National Business Review, New Idea, NZ Listener, NZ Woman's Day, NZ Woman's
Weekly, Property Press, That's Life, Time, TV Guide) and last 4 weeks for all
other non-weekly titles. **Note: Are Media magazines were
temporarily suspended during the June and September 2020 quarters. Results
for some of these magazines have been suppressed for the latest quarter,
average issue readership is allocated instead. Five Newspaper Inserted Magazines grew
their readership during 2021 – led by Canvas and Viva The Weekend New Zealand Herald newspaper
inserted magazine Canvas (North Island) is clearly the most widely
read with an average issue readership of 272,000, up 41,000 on a year ago.
There was also a strong increase in readership for the second most widely
read Viva (North Island) with an increase of 29,000
on a year ago to a readership of 176,000. Other newspaper inserted magazines to increase their readership
during 2021 were the third most widely read Sunday Magazine, up 8,000 to an average issue readership of
172,000, Bite (North Island) with a readership of
158,000 (up 28,000) and Your Weekend with
a readership of 136,000 (up 6,000). Behind the four market leaders is Weekend (North Island)
with an average issue readership of 153,000.
Full Readership Results for over 60 New
Zealand Magazines available to view here. “The latest Roy Morgan readership figures
for New Zealand covering the year to December 2021 show 2.9 million New
Zealanders (69.5% of the population aged 14+) now read or access newspapers
in an average 7-day period via print or online (website or app). The leading
newspaper is again the New Zealand
Herald with a total cross-platform audience of over 1.84
million. The Herald is
read by over four times as many people as any other newspaper. “There was widespread growth in
cross-platform audiences over the last year for the country’s leading
newspapers with six out of the top ten growing their audiences in 2021.
Leading newspapers to significantly grow their cross-platform audiences
include the Otago Daily Times,
up 20% to 304,000, Northern Advocate,
up 33% to 142,000 and Taranaki Daily
News, up 29.7% to 137,000. “In the purely digital realm Stuff holds a clear advantage. Over
1.75 million New Zealanders access the Stuff platform
in an average 7 days, an increase of nearly 40,000 on a year ago. The Stuff group of newspapers brings
together ten of the country’s leading newspapers such as the Dominion Post, The Press, and the Sunday Star-Times through their news
portal Stuff.co.nz. “New Zealand’s magazines have faced a
challenging period over the last two years with several magazines forced to
suspend their publishing during the early stages of the pandemic, especially
in the period from April 2020 to September 2020. “Despite these challenges the audiences for
New Zealand’s magazines are holding steady and in the year to December 2021
nearly 1.8 million New Zealanders (42.5% of the population aged 14+) read
magazines whether in print or online either via the web or an app. “There have been many magazines to grow
both their print readership and their cross-platform audiences during 2021
led by some of the most widely read such as AA Directions, the relaunched New Zealand Listener, Dish and NZ House & Garden. “Women’s Fashion and Lifestyle magazines
were also big winners during 2021 with several growing their print readerships
led by Mindfood, Simply You Living, NZ Fashion Quarterly, Fashion and the Mass Women’s
magazine New Idea as
they recovered strongly from the significant disruptions of the early stages
of the pandemic.” (Roy Morgan) March 16 2022 MULTICOUNTRY
STUDIES
732-734-43-58/Polls Every Third
Person Has Shopped Via Social Media In The Nordic Countries, Survey In 4
Countries
33% of the population in the Nordic countries have tried social
shopping, and 22% shop regularly via social media.
64% of the population in the Nordic countries have not tried social
shopping; however, 24% can imagine doing so. In Norway, we see the
highest proportion of consumers who have not shopped via social media and can
not imagine it (45%). Denmark has the second largest proportion of
consumers who do not have or want to shop via social media (41%). In
Sweden and Finland, this second is somewhat lower (32%). People aged 18-39 are the most active
social shoppers
A general assumption is that the youngest generation is the most
active when it comes to social shopping. However, the 30-39 year olds
shop just as much via social media. Among the 40-49 year olds, 37% have
tried social shopping, while 28% of consumers aged 50+ have tried it. What motivates consumers to shop via social
media?
The need for a product motivates most consumers to shop via social
media (47%). Other main reasons are special discount promotions (28%)
and the exclusivity of a product (27%). It is perhaps surprising that recommendations
and advertisements from influencers and celebrities play only a minor role
(only 6% mention this as a motivation to act via social media). The biggest regional difference in what motivates consumers in the
Nordic countries is discount campaigns. Finns are most motivated by
discount campaigns (40% mention this as a reason to shop via social media),
while only 20% of Norwegians are motivated by this. (YouGov Denmark) March 3, 2022 Source: https://yougov.dk/news/2022/03/03/hver-tredje-har-shoppet-sociale-medier-i-norden/ 732-734-43-59/Polls A Global
Country Average Of 55% Disagree With The Idea That Gender Inequality Doesn’t Really
Exist, Result Of 30-Country Survey
One in seven (15%) Britons think gender inequality doesn’t really
exist, with men (19%) more likely than women (11%) to hold this view,
according to a major survey conducted ahead of International Women’s Day on 8
March. While most Britons (57%) do believe gender inequality exists, the new
global research, by Ipsos and the Global Institute for Women’s Leadership at
King’s College London, reveals that notable minorities of the British public
are not only failing to accept the reality of inequality between women and
men, but are even seeing efforts to address it as causing harm, as well as
feeling that traditional masculinity is under threat. The findings – which are based on a survey of over 20,000 people in
30 countries – also highlight British and international attitudes to online
harassment and violence or abuse of women, with some considerable differences
in how women and men see these issues. One in five Britons – higher among men –
question the benefits of feminism In Great Britain
Internationally A global country average of 55% disagree with the idea that gender
inequality doesn’t really exist. Men (21%) are more likely to agree that this is the case than
women (14%), and in several countries, the proportion of men who agree is
double that for women – including Australia (30% vs 14%), Romania (27% vs
13%) and Russia (30% vs 12%). Across the countries surveyed, a third of men think feminism does
more harm than good (32%) and that traditional masculinity is under threat
(33%), while a fifth of men (23%) think that feminism has resulted in men
losing out in terms of economic or political power or socially – similar to
the proportions of British men holding these views. Most Britons think online harassment and
abuse are unacceptable and agree that women should not have to put up with
it, but one in 10 have encountered misogynistic statements online In Great Britain
And there are notable gender differences in views on online abuse and
how to deal with it:
Overall, however, despite these minority views, 84% of Britons agree
women should not have to put up with online abuse – not far behind Sweden
(89%), which comes top for this belief. Internationally Nearly half – a global country average of 45% – say they have
experienced online abuse or seen sexist content in the past two years, with
one in six having viewed comments or images suggesting men are superior to
women (16%) or suggesting that women cause many of the problems faced by men
(16%). The majority agree that women should not have to put up with online
abuse (78% global country average). Agreement is lower among men (74%) than
women (82%), and younger generations (75% of under 50s) than older ones (85%
of over 50s). A minority of Britons hold victim-blaming
attitudes when it comes to violence against women In Great Britain Britons are far more likely to disagree than agree with statements
that attempt to justify or downplay violence or coercion against women, but
there are some small minorities who say they hold these views:
Internationally Around one in six (15%) agree that women who say they were abused
often make up or exaggerate these claims, with men (20%) twice as likely as
women (10%) to hold this view. Concerningly, younger people are more likely to agree with
victim-blaming statements. For example, around one in five Gen Z (18%) and
Millennials (19%) agree that violence against women is often provoked by the
victim, compared with 14% of Gen X and 11% of Baby Boomers. A global country
average of 15% agree with this statement. Kelly Beaver,
chief executive of Ipsos UK, said: We often hear about online abuse, and the
disproportionate impact of that abuse on women in particular is well known
and understood. It’s encouraging therefore that the vast majority of Britons
reject this sort of abuse. But it is deeply worrying that a minority continue
to believe it’s acceptable to act in abusive or harassing ways towards women,
as well as the minority that blame women for the abuse they face. Professor Rosie Campbell,
director of the Global Institute for Women’s Leadership at King’s College
London, said: An overwhelming majority of the population
share feminist values but there is also a persistent minority who believe
gender equality has gone too far or caused more harm than good. A vocal minority
can have a disproportionate impact and we have a lot of work to do to
guarantee gender equality and ensure women’s safety both on and offline. (Ipsos MORI) 4 March 2022 732-734-43-60/Polls One In Three
Men Says Feminism Does More Harm Than Good; A Study In 30 Countries
Key findings Only two in 10 deny that there is gender inequality, but public
opinion is split on the benefits of feminism. Concerns about online abuse remain, with one in 10 men saying it's
acceptable to send explicit images without the other party's request. Four out of 10 people say they've been abused or exposed to sexist
content online, but one in three say women overreact. In the countries where the research was conducted, it is seen that a
minority blame the victim.
More men question the existence of gender inequality and the benefits
of feminism The majority of people globally do not agree that gender inequality
really does not exist. (55%). On the other hand, despite the evidence that
gender inequality has risen globally since the start of the Covid-19
pandemic, only 18% agreed.
Men seem more skeptical about the benefits of our femininity and the
existence of gender inequality: One-third of men (32%) say feminism does more harm than good, and
traditional masculinity is in danger (33%) Women agree less on this. Only a fifth (20%) believe that feminism
will do harm. Again, one-fifth (19%); She states that feminism arose as a result of
men's loss of economic or political or social power.
Victim blaming attitude towards violence against women is present in
a minority group, but only half of the participants state that they do not
fully agree with the statements blaming the victim. 55% do not agree with the statement that violence against women is
often provoked by the victim, and 53% do not agree with the statement that
abused women often make it up or exaggerate it. Only a minority have
worrisome views on violence against women: About one in seven (15%) state that violence against women is often
provoked by women, and 13% of women agree on this issue. Again, a similar
proportion of women, who stated that they were abused, stated that they
either made it up or exaggerated it. (15% general rate, 20% men, 10% women
agree on this issue) Although 76% do not agree with the statement that a woman must have
sexual intercourse with her partner or spouse, although she does not want to,
9% agree with it.
(Ipsos Turkey) 4 March 2022 Source: https://www.ipsos.com/tr-tr/one-three-men-believe-feminism-does-more-harm-good 732-734-43-61/Polls March 8:
Women's Rights Around The World, Survey In 13 Countries
Data from the YouGov-Cambridge Globalism Project shows that while
some countries are calling for changes abroad, most people think there is
more to be done to advance women's rights in their countries. Italians are
most likely to say that women's rights have not progressed far enough in
their country (62%), followed by similar numbers for Spaniards (60%), Hungarians
(57%) and Swedes (56%). In countries like Poland, France, Canada,
Australia and Greece, about half of people think their nation could go
further in women's rights (50-53%).
Lower percentages of people in Germany (48%), Britain (48%), Denmark
(46%) and the United States (43%) think their countries have not gone far
enough in promoting women's rights. About three in ten (between 34% and
29%) in each of these nations say that "women's rights have reached the
point where they should be" - with generally fewer than one in ten
thinking that women's rights have gone too far. (YouGov Italy) March 7, 2022 Source: https://it.yougov.com/news/2022/03/07/8-marzo-i-diritti-delle-donne-nel-mondo/ 732-734-43-62/Polls Equal
Opportunities And Rights: A Global Picture From 39 Countries
WIN International, the world’s leading association in market research
and polling has published the Annual WIN World Survey – WWS 2021 – exploring
the views and beliefs of 33236 individuals among citizens from 39 countries
across the globe. On International Women’s Day, WIN releases the latest
results of the survey about gender
equality, violence and sexual harassment, to understand what are,
if any, the improvements around the world in terms of equal opportunities and
rights. HEADLINES Achievements in Gender Equality When considering
different environments where to measure the level of gender equality, home is still the place where equal rights are
perceived the most, just like in previous years. In 2021, 70% of
the global population believes gender equality has been achieved at home,
however, there is also a slight but constant decrease when comparing the last
three years (from 72% to 71% to 70%)[1]. Globally, 60% of the
population believes gender equality has been achieved in workplaces, but
it is indeed the political
sphere once again the most difficult environment for men and women to be
considered equal: half of the
population thinks gender equality has been achieved in politics, a
share that slightly decreases compared to last year results (from 48% in 2019
to 51% in 2020 and 50% in 2021). The countries where the highest net indexes in gender equity have
been obtained are Vietman (69 points), Finland (75 points) and the
Philippines (74 points), for work, politics and home, respectively. On the
other hand, the lowest net indexes are obtained by Italy in work (-22
points), Japan in politics (-51) and Kenya at home (-22 points). Job opportunities and career Having established that
60% of the population believes gender equality has been achieved at work, the
survey deep dives for the first time this year into some more specifical questions about equal job opportunities
and careers. On a total level, 37%
of the population believes that women have the same opportunities than men
when it comes to jobs and career achievements, a share that is interestingly
a bit lower among females themselves (32%). Most of the population, both on a
total level and within females, believes women have less opportunities than men (total: 45%;
among women: 55%). There is also a minor share of the respondents (14% of the
total population, 10% among females) who believes women have more
opportunities. Europe and Americas seem to be the most critical regions in the
world, as 55% and 52% of the respondents respectively believe women have less
opportunities than men at jobs; women having the same opportunities is, on
the other hand, an opinion widely shared in APAC, where 48% of the population
believes it, +11% than global average. Violence At a global
level, results about women
experiencing physical or psychological violence are unfortunately stable compared
to previous years: 16% in 2021, 17% in 2020, 16% in 2019. However, when
analyzing data by regions, some small improvements can be found: in Africa,
MENA, APAC and Americas the net index about women experiencing violence in
the past year decreases by -7, -5, -2 and -1 respectively. Young women aged 18 to 24 experience the highest incidence of
physical and psychological violence (22%) although the share decreases by two
points compared to last year. Likewise, women who have reached only full
primary school are more likely to say they experienced violence (20%), and
the same goes for female students among other occupational groups (20%). Regarding the results by country, women in Ecuador report a sharp
increase in the levels of violence (from 14% to 24%); the same happens in
Mexico (from 32% to 36%) and Brazil from 24% to 28%. Greece also shows a high
level of violence against women (32%). Sexual harassment The trend about women who experienced
sexual harassment is also almost stable: 9% of women
interviewed worldwide suffered sexual harassment in the last year, compared
to 8% of the previous year. Young women from 18 to
24 years are the ones who have suffered the most from sexual harassment
compared to other age groups, even
one point more than the previous year (19% in 2021 and 18% in 2020). On a brightest note, Africa seems to have reduced the share of women
who experienced sexual harassment, with a share that decreases by 4
percentage points (from 8% to 4%). However, in the Americas, victims of
sexual harassment keep being 16% just like last year. The countries where women report the highest percentages of sexual
harassment in 2021 are Mexico (26%), Ecuador (24%) and Chile (22%). While the
Philippines (1%), China (1%) and Croatia (1%) are the countries with the
lowest percentages. Ecuador has suffered a sharp increase in sexual
harassment (from 15% to 24%) also Chile (from 18% to 22%) and Argentina (from
11% to 15%). India surprises with a reduction from 29% to 16% and Hong Kong
from 13% to 9%. (WIN) 8 Mar 2022 Source: https://winmr.com/equal-opportunities-and-rights-a-global-picture/ 732-734-43-63/Polls Gap Between
Men And Women In Attitudes On Gender Issues In A Survey In 34 Countries
Most Indians support gender equality, but a new
Pew Research Center survey finds that traditional gender norms still
hold sway for many people in the country. And even though traditional norms
tend to give men, rather than women, more prominent roles in several aspects
of family and public life, women do not differ substantially from men in
their opinions on these issues. One example is how Indians view interactions between husbands and
wives. Asked if they agree with the statement that “a wife must always obey
her husband,” women in India (86%) are only slightly less likely than Indian
men (89%) to say they either completely or mostly agree.
This phenomenon, where women are either as likely as or only modestly
less likely than men to express traditional attitudes about gender, is not
unique to India. In a different survey
of 34 countries conducted by Pew Research Center in the spring and
summer of 2019, only 11 countries had statistically significant differences
between men and women in the shares who say that if jobs are scarce, men
should have more rights to employment than women. This included India, where
Indian women (76%) were only somewhat less likely than Indian men (81%) to
hold this view. In other words, in most of the countries surveyed, women were
about as likely as men to favor job preferences for men in times of high unemployment. Another question on the same 34-country survey asked respondents how
important it is for women to have the same rights as men in their country. In
most countries surveyed, women are more likely than men to voice support for
gender equality, but this pattern is far from universal. In 14 countries,
including Brazil and Poland, roughly the same shares of men and women say
equal rights for women are very important, and in an additional seven
countries, gender gaps on this question are 10 percentage points or less. In
India, women (75%) are only modestly more likely than men (70%) to support
equal rights for both genders. Gender differences also are muted when it comes to Indians’ views
about relationships between children and their parents. In Indian society,
sons historically have been the primary caregivers for aging parents and the
main beneficiaries of inheritance. In line with these and other traditions,
families have tended to place higher value on – and provide more support to – their sons than their daughters, a
set of attitudes and practices known as “son
preference.” Today, while most Indian adults believe that sons and daughters
should have equal responsibility to care for parents as they age, women (37%)
are almost as likely as men (40%) to say it is sons who should have the
primary responsibility for this. And when asked whether sons or daughters
should be primarily responsible for a parent’s last rites or burial rituals,
women (62%) are nearly as likely as men (64%) to say it should be sons. In
addition, most Indians say sons and daughters should have equal rights to
inheritance from their parents, but about a third of both women (33%) and men
(34%) say that sons should have greater inheritance rights than daughters. Against the backdrop of violence
against women in India that has attracted both national and
international attention, three-quarters of Indian men and women say violence
against women is a “very big problem” in their country. The survey also asked
respondents whether, to improve the safety of women in their community, it is
more important to teach boys to respect all women or to teach girls to behave
appropriately. Around half of the Indian population – including 53% of women and 48%
of men – says teaching boys to respect women is more important. But women
(24%) are almost as likely as men (27%) to put the onus on women’s own
behavior, saying that teaching girls to behave appropriately is the better
way to improve women’s safety. Roughly a quarter of both men and women don’t
take a clear position on the issue, with some saying both approaches are
important, that women are already safe, or that the issue is one of law and
order rather than gender norms.
(PEW) MARCH 15, 2022 732-734-43-64/Polls NATO: Has
Europeans' Perception Changed Since The Invasion Of Ukraine, Survey In 7
Countries
In Britain, support for NATO membership rose from 59% in March 2019
to 68% in March 2022*, and in Germany from 54% to 64%. Note: this question used a five-point scale,
including a "neither for nor against" option.
In France, the number of people in favor of
the country's presence in NATO rose by 8 points (from 39% to 47%) ,
while the opposition remained stable (15-16%). In Sweden, where NATO membership has long been debated
but remains outside the alliance for the time being, support for membership
fell from 36% in 2019 to 44% in early March. At the same time, the
opposition fell from 27% to 22%. Are citizens ready to engage in collective
defence? The NATO alliance is
based on a mechanism called "Article 5", which states that an
attack on one NATO member will be considered an attack on all
members. This article has been invoked only once in history, by the
United States after the attacks of
September 11, 2001. Article 5 obliges NATO members to help each other, and the majority
of respondents in each country (58-81%) support maintaining this commitment. But are they ready to implement it if necessary? Europeans would be particularly willing to
come to the aid of France if the country were attacked by Russia
(51-71%). Germany comes in second place
(48-66%).
At the bottom of the list is Turkey, itself a member of
NATO. Less than half of respondents in each country would be willing to
use their national army to protect Turkey from Russian attacks (22-40%). Europeans are even more numerous to
consider that NATO is important for the defense of the West The most significant
change is seen in non-member Sweden, where two-thirds of residents (66%) are aware of the important role
played by NATO, compared to 50% in 2019. A similar change is seen in Germany
( from 53% to 66%), while a majority
of French people are also convinced of this (54%, compared to
42% in 2019).
Who would win in a war between NATO and
Russia? If NATO and Russia were
to come into conflict, the citizens interviewed are convinced that NATO would
emerge victorious. We note that the French are the least confident: 45%
of them think that NATO would win the victory, against 63% of the Swedes and 78% of the Poles.
(YouGov France) March 16, 2022 Source: https://fr.yougov.com/news/2022/03/16/OTAN-evolution-perception-des-europeens/ |
||||||||||||||||||||||||||||||||||||||||||||||||||||||||||||||||||||||||||||||||||||||||||||||||||||||||||||||||||||||||||||||||||||||||||||||||||||||||||||||||||||||||||||||||||||||||||||||||||||||||||||||||||||||||||||||||||||||||||||||||||||||||||||||||||||||||||||||||||||||||||||||||||||||||||||||||||||||||||||||||||||||||||||||||||||||||||||||||||||||||||||||||||||||||||||||||||||||||||||||||||||||||||||||||||||||||||||||||||||||||||||||||||||||||||||||||||||||||||||||||||||||||||||||||||||||||||||||||||||||||||||||||||||||||||||||||||||||||||||||||||||||||||||||||||||||||||||||||||||||||||||||||||||||||||||||||||||||||||||||||||||||||||||||||||||||||||||||||||||||||||||||||||||||||||||||||||||||||||||||||||||||||||||||