|
BUSINESS & POLITICS IN THE WORLD GLOBAL OPINION REPORT NO. 735 Week:
March 21 – March 27, 2022 Presentation:
April 01, 2022 731-43-23/Commentary:
Two Years Of Life Under Lockdown - How Has The UK And People's Lives Changed Urban
Indians Are Worried About The Impact Of Russia- Ukraine Crisis On Their
Personal Lives Most
Feel Positively About The Easing Of Covid-19 Curbs In Singapore, But One In
Three Are Concerned Around
Two-Thirds (65%) Of Malaysians Have Shopping Plans For Ramadan This Year Community
Concern About Catching Coronavirus Seriously Decreases From 74% To 41% Kenyans
See Government Failing On Their Top Priorities – The Economy And Corruption Just
31% Of Britons Think The Government Is Doing The Right Amount To Help
Ukrainians Come To The UK How
Should Journalists Report Racially Offensive Language Two
Years Of Life Under Lockdown - How Has The UK And People's Lives Changed The
Passion Of The French For Video Games Is Undeniable Every
Fifth Person In Germany Has Felt Racially Discriminated Against Biden's
Job Approval Is 42%, Statistically Unchanged From 41% Last Month 71%
Of Republican Voters Say Their Vote For Congress Is Against Biden After
A Month Of War, Ukrainian Refugee Crisis Ranks Among The World’s Worst In
Recent History About
Two-Thirds Of U S Adults (65%) Say Science Has Had A Mostly Positive Effect
On Society Australians
To Spend Billions On Holidays, Food And Chocolate This Easter U S
Image Improves Across Most Of NATO, A Survey Of 27 NATO Countries What
MENA Citizens Think About The Environment, Among 12 Countries Surveyed Are
Europeans In Favor Of Ukraine Joining The EU, A Study In 4 Countries An
Average Of 30% People Believe Most People Can Be Trusted In 30 Countries Is
Mother’s Day A ‘Proper’ Special Occasion, Or Is It Too Commercialized, A
Survey In 18 Countries INTRODUCTORY NOTE
735-43-24/Commentary:
Two
Years Of Life Under Lockdown - How Has The UK And People's Lives Changed
New research
by Ipsos and the Policy
Institute at King’s College London finds that
3 in 10 UK adults (31%) say they are feeling lonelier now than before the
pandemic (58% report no change). Alongside this, nearly half think they see
friends and family less (46%) and leave the house less (45%) than before the
pandemic began. Four in ten 16-34 year olds (39%) say they feel more
lonely than before the pandemic started about two years ago. The new study,
the latest in a series that has tracked opinion since April 2020, does find
though that across many of these aspects of people’s lives, a large
proportion (usually slightly more or less than half) say there has been no
change now compared with before the pandemic. Participants were also
asked to report all changes – whether or not they felt they had been caused
by the pandemic. A third of
Brits believe that their physical (32%) and mental (33%) health has got worse
(half in each case say it is about the same). The youngest (16-34) are most
likely to feel that their mental health has deteriorated during the pandemic,
with 42% saying it had, though one in four (23%) said that it had
improved. Women are also more likely than men to feel their mental health
is now worse (by 38% to 28%). About a
third (36%) think they have put on weight compared with before the pandemic –
although almost as many (30%) say they are exercising more. 50% of
Britons say they are spending more time looking at screens than before the
pandemic. And just over two in five of those aged 16-75 (46%) say they check
social media at least once a day for news about the pandemic including 7%
saying they check hourly (though this is down from 56% checking social media
daily for information about the coronavirus at the start of the first
lockdown in April 2020). Overall, a quarter (27%) say their ability to
concentrate is worse than before the pandemic (58% say no change), rising to
38% of younger people (though 24% of 16-34s also say this has improved). When it
comes to sleep, overall around a third (32%) say the overall quality of their
sleep has got worse (53% no change). The most common changes in
people’s sleeping patterns are more disturbed sleep (25%) or sleeping fewer
hours (20%). The state of the pandemic
Government handling of the pandemic The public
are more positive about the UK government’s handling of the pandemic now than
at earlier points in the pandemic. 54% of those aged 16-75 believe that the
UK government’s response to the pandemic has been confused and inconsistent,
but that has declined since 2020 and particularly fallen since the second
lockdown in November 2020 when two-thirds (68%) said that was the case. On the other
hand 38% believe that the government has responded well to changing
scientific advice (up from 27% in November 2020), while 28% say they have
not. And when comparing our government to others, 42% of 16-75 year-olds say
the UK government has responded well to the pandemic compared to other
countries (up from 28% in July 2020), with 27% disagreeing. On balance,
UK adults think that advice from scientists and experts has been good during
the pandemic and that government has used it effectively. Only one in five
(21%) believe that scientists and medical experts have given the government
poor advice during the pandemic while 46% disagree. Four in ten (43%) believe
that the UK government has made good use of that advice while 28% do not. Perceptions of the NHS A majority
believe that a range of the NHS services have got worse since before the
pandemic began, but they also tend to think that this is at least partly
because of the pandemic. Britons
believe that the following services have got worse since before the pandemic
began:
But amongst
those who think things have got worse, half or more tend to believe that this
is at least mostly because of the pandemic rather than other reasons:
Gideon Skinner, Research Director at Ipsos said: These findings, marking the two-year anniversary of the first
national lockdown, are further evidence of how over that time life in the UK
has changed for many people, affecting a range of aspects of our physical and
mental health. Although we shouldn’t overestimate this (more people
think there has been no impact, and some of these changes may have happened
naturally without the pandemic), it is notable that it is often younger
generations who feel harder hit. This all suggests that most Britons
are right to feel that the after-effects of the coronavirus are not over yet. Professor Bobby Duffy, director of the Policy Institute at King’s
College London, said: The effects of the pandemic and the measures to control it are still
keenly felt by significant proportions of the UK population – with a third of
us saying we’re lonelier and sleeping less well, nearly half of us seeing our
friends less and leaving home less, and half spending more time on our screens.
It’s no surprise then that a third of us feel our mental or physical health
is worse. And, as with so much in the pandemic, some groups are feeling the
effects more, with the young and women more likely to experience many of
these negative impacts. We’re also deeply worried about the impact on the
NHS, particularly waiting times and how the pandemic has affected the
wellbeing of NHS staff. (Ipsos MORI) 23 March
2022 Source: https://www.ipsos.com/en-uk/two-years-of-life-under-lockdown-how-has-uk-and-peoples-lives-changed SUMMARY
OF POLLS
ASIA (India) Urban
Indians Are Worried About The Impact Of Russia- Ukraine Crisis On Their
Personal Lives As the Russia-Ukraine crisis intensified,
YouGov’s latest data shows that nearly two-thirds of urban Indians (64%) feel
the ongoing crisis may have an impact on India’s economy leading to an
increase in fuel prices. Just about the same number (63%) think it will
increase the price of essential commodities. These issues are more concerning
to Gen X (70% for fuel prices and 61% for the cost of commodities) than their
younger counterparts. (YouGov India) March 22, 2022 (Singapore) Most
Feel Positively About The Easing Of Covid-19 Curbs In Singapore, But One In
Three Are Concerned Following yesterday’s announcement on
the easing of community safe management
measures in Singapore,
latest data from YouGov Omnibus reveals that residents are most
anticipative of resuming larger-scale social gatherings, with seven in ten
(75%) looking forward to the increase in group sizes from five to ten persons
– a cap that has been in place since end-2021. In particular, those above the
age of 55 are significantly more likely to say they are looking forward to
the increased group sizes, with eight in ten expressing anticipation (81%). (YouGov Singapore) (Malaysia) Around
Two-Thirds (65%) Of Malaysians Have Shopping Plans For Ramadan This Year Latest research from YouGov RealTime Omnibus shows that around two-thirds (65%) of
Malaysians have shopping plans for Ramadan this year. Segmenting by region
reveals that Malaysians residing in the peninsula’s east coast (Pahang,
Terengganu, Kelantan) are more likely to have Ramadan shopping plans (77%),
compared to Malaysians residing in other regions. Across both genders,
clothes and apparel (male 75% vs female 81%) is the most popular category. Among
men, household items (52%) took second place, ahead of footwear (42%), with
electronics (32%) and furniture (31%) rounding out the top five. (YouGov Malaysia) March 25, 2022 (Turkey) Community
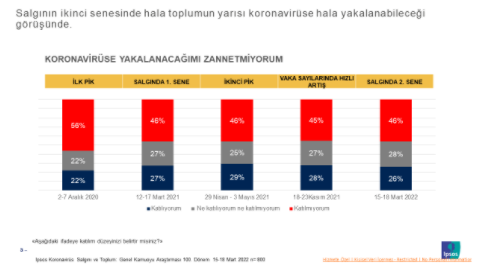
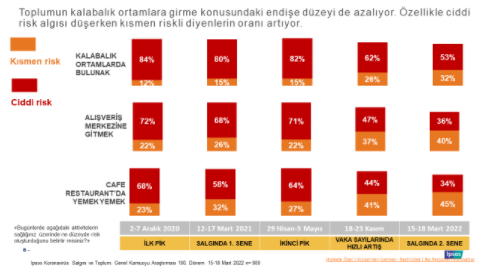
Concern About Catching Coronavirus Seriously Decreases From 74% To 41% Although half of the society thinks that
they will catch this virus, they are less worried about it now. According to
the research of Ipsos, 74% of individuals in the first month of the epidemic
stated that they were very worried about themselves or a member of their
family catching the corona virus, while the rate of individuals who are very
worried has decreased to 41% today. While 56% of the society thought that
they would catch the epidemic in the first years of the epidemic, this rate
decreased by 10 points to 46% in the first year of the epidemic, and half of
the society thinks that they will catch this virus today. (Ipsos Turkey) 21 March 2022 AFRICA (Kenya) Kenyans
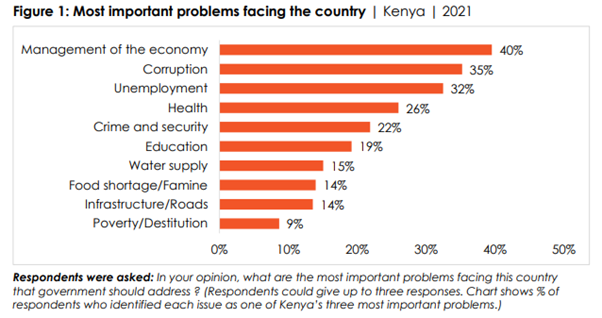
See Government Failing On Their Top Priorities – The Economy And Corruption Management of economy tops the list of
important problems that Kenyans want their government to address, followed by
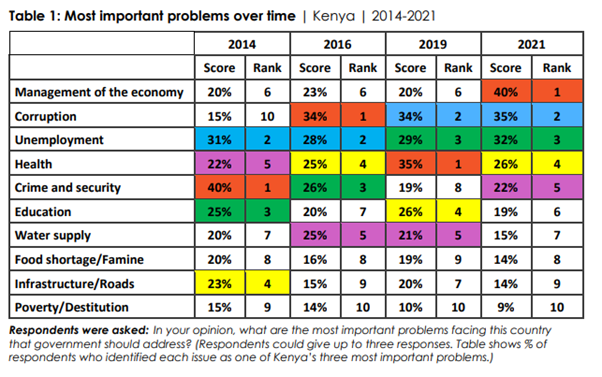
corruption, health, unemployment, and crime/security. Management of the
economy climbed from sixth place on citizens’ priority list in 2014-2019 to
the No. 1 spot in 2021. Corruption has ranked as one of the top two
priorities for the past six years. (Afrobarometer) 25 March 2022 More Than Three-Fourths (78%) Of Kenyans
Support Regular, Open, And Honest Elections As The Best Way To Choose Leaders More than three-fourths of Kenyans support
regular, open, and honest elections as the best way to choose leaders, the
most recent Afrobarometer survey shows. And most citizens favour the
existence of many political parties to ensure that voters have real choices
in electing their leaders. More than three-fourths (78%) of Kenyans support
regular, open, and honest elections as the best way to choose leaders. (Afrobarometer) 25 March 2022 WEST
EUROPE (UK) Just
31% Of Britons Think The Government Is Doing The Right Amount To Help
Ukrainians Come To The UK New YouGov research shows Britons remain
broadly of the opinion the government is not doing enough to help those
trying to reach the UK from Ukraine, although opinion has shifted in recent
days. Two-fifths of Britons (43%) now think the government is not doing
enough to enable refugees from Ukraine to come to the UK. However, this is
down 14 points since 8-9 March, with this previous survey conducted before
the Homes for Ukraine scheme announcement. The proportion of those thinking
the government is doing about the right amount to help Ukrainians come to the
UK is up 12 points, from 19% to 31%. (YouGov UK) March 24, 2022 How Should Journalists Report Racially
Offensive Language New YouGov research among ethnic minority
Britons looks at how people think racial slurs should be quoted in written
and broadcast news media. While all broadcast outlets will have differing
editorial guidelines, ethnic minority Britons tend to think slurs should be
quoted as a euphemism, using such phrases as "the N-word" or
“P-word” (28%) in TV and radio news. At the other end of the scale, 20% think
television and radio reporters should use the language in full, without any
sort of censorship or alteration. (YouGov UK) March 21, 2022 Two Years Of Life Under Lockdown - How Has
The UK And People's Lives Changed New research by Ipsos and the Policy Institute at King’s College London finds that 3
in 10 UK adults (31%) say they are feeling lonelier now than before the
pandemic (58% report no change). Alongside this, nearly half think they see
friends and family less (46%) and leave the house less (45%) than before the
pandemic began. Four in ten 16-34 year olds (39%) say they feel more
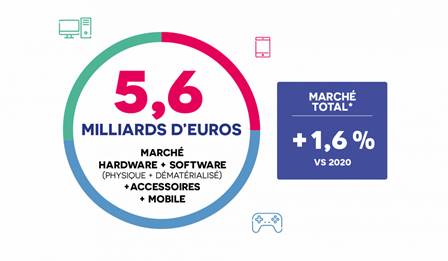
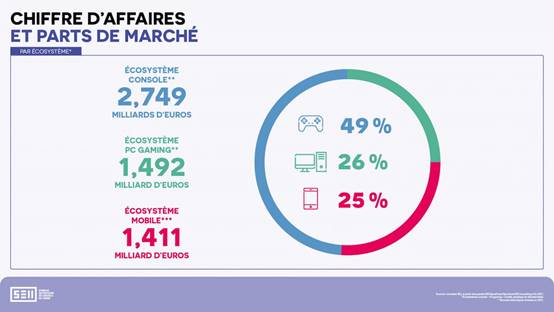
lonely than before the pandemic started about two years ago. (Ipsos MORI) 23 March 2022 (France) The Passion Of The French For Video Games Is Undeniable The console ecosystem (Hardware, Software
and Accessories), which represents 49% of the total value of the video game
market, generates 2.749 billion euros (+1%) and achieves its second historic
performance; the previous record was set at 3.03 billion euros in 2008. The
PC Gaming ecosystem (Hardware, Software and Accessories), which represents
26% of the total value of the video game market, reached a new record with
1.492 billion euros and growth of +5% in one year. (Ipsos France) March 24, 2022 (Germany) Every
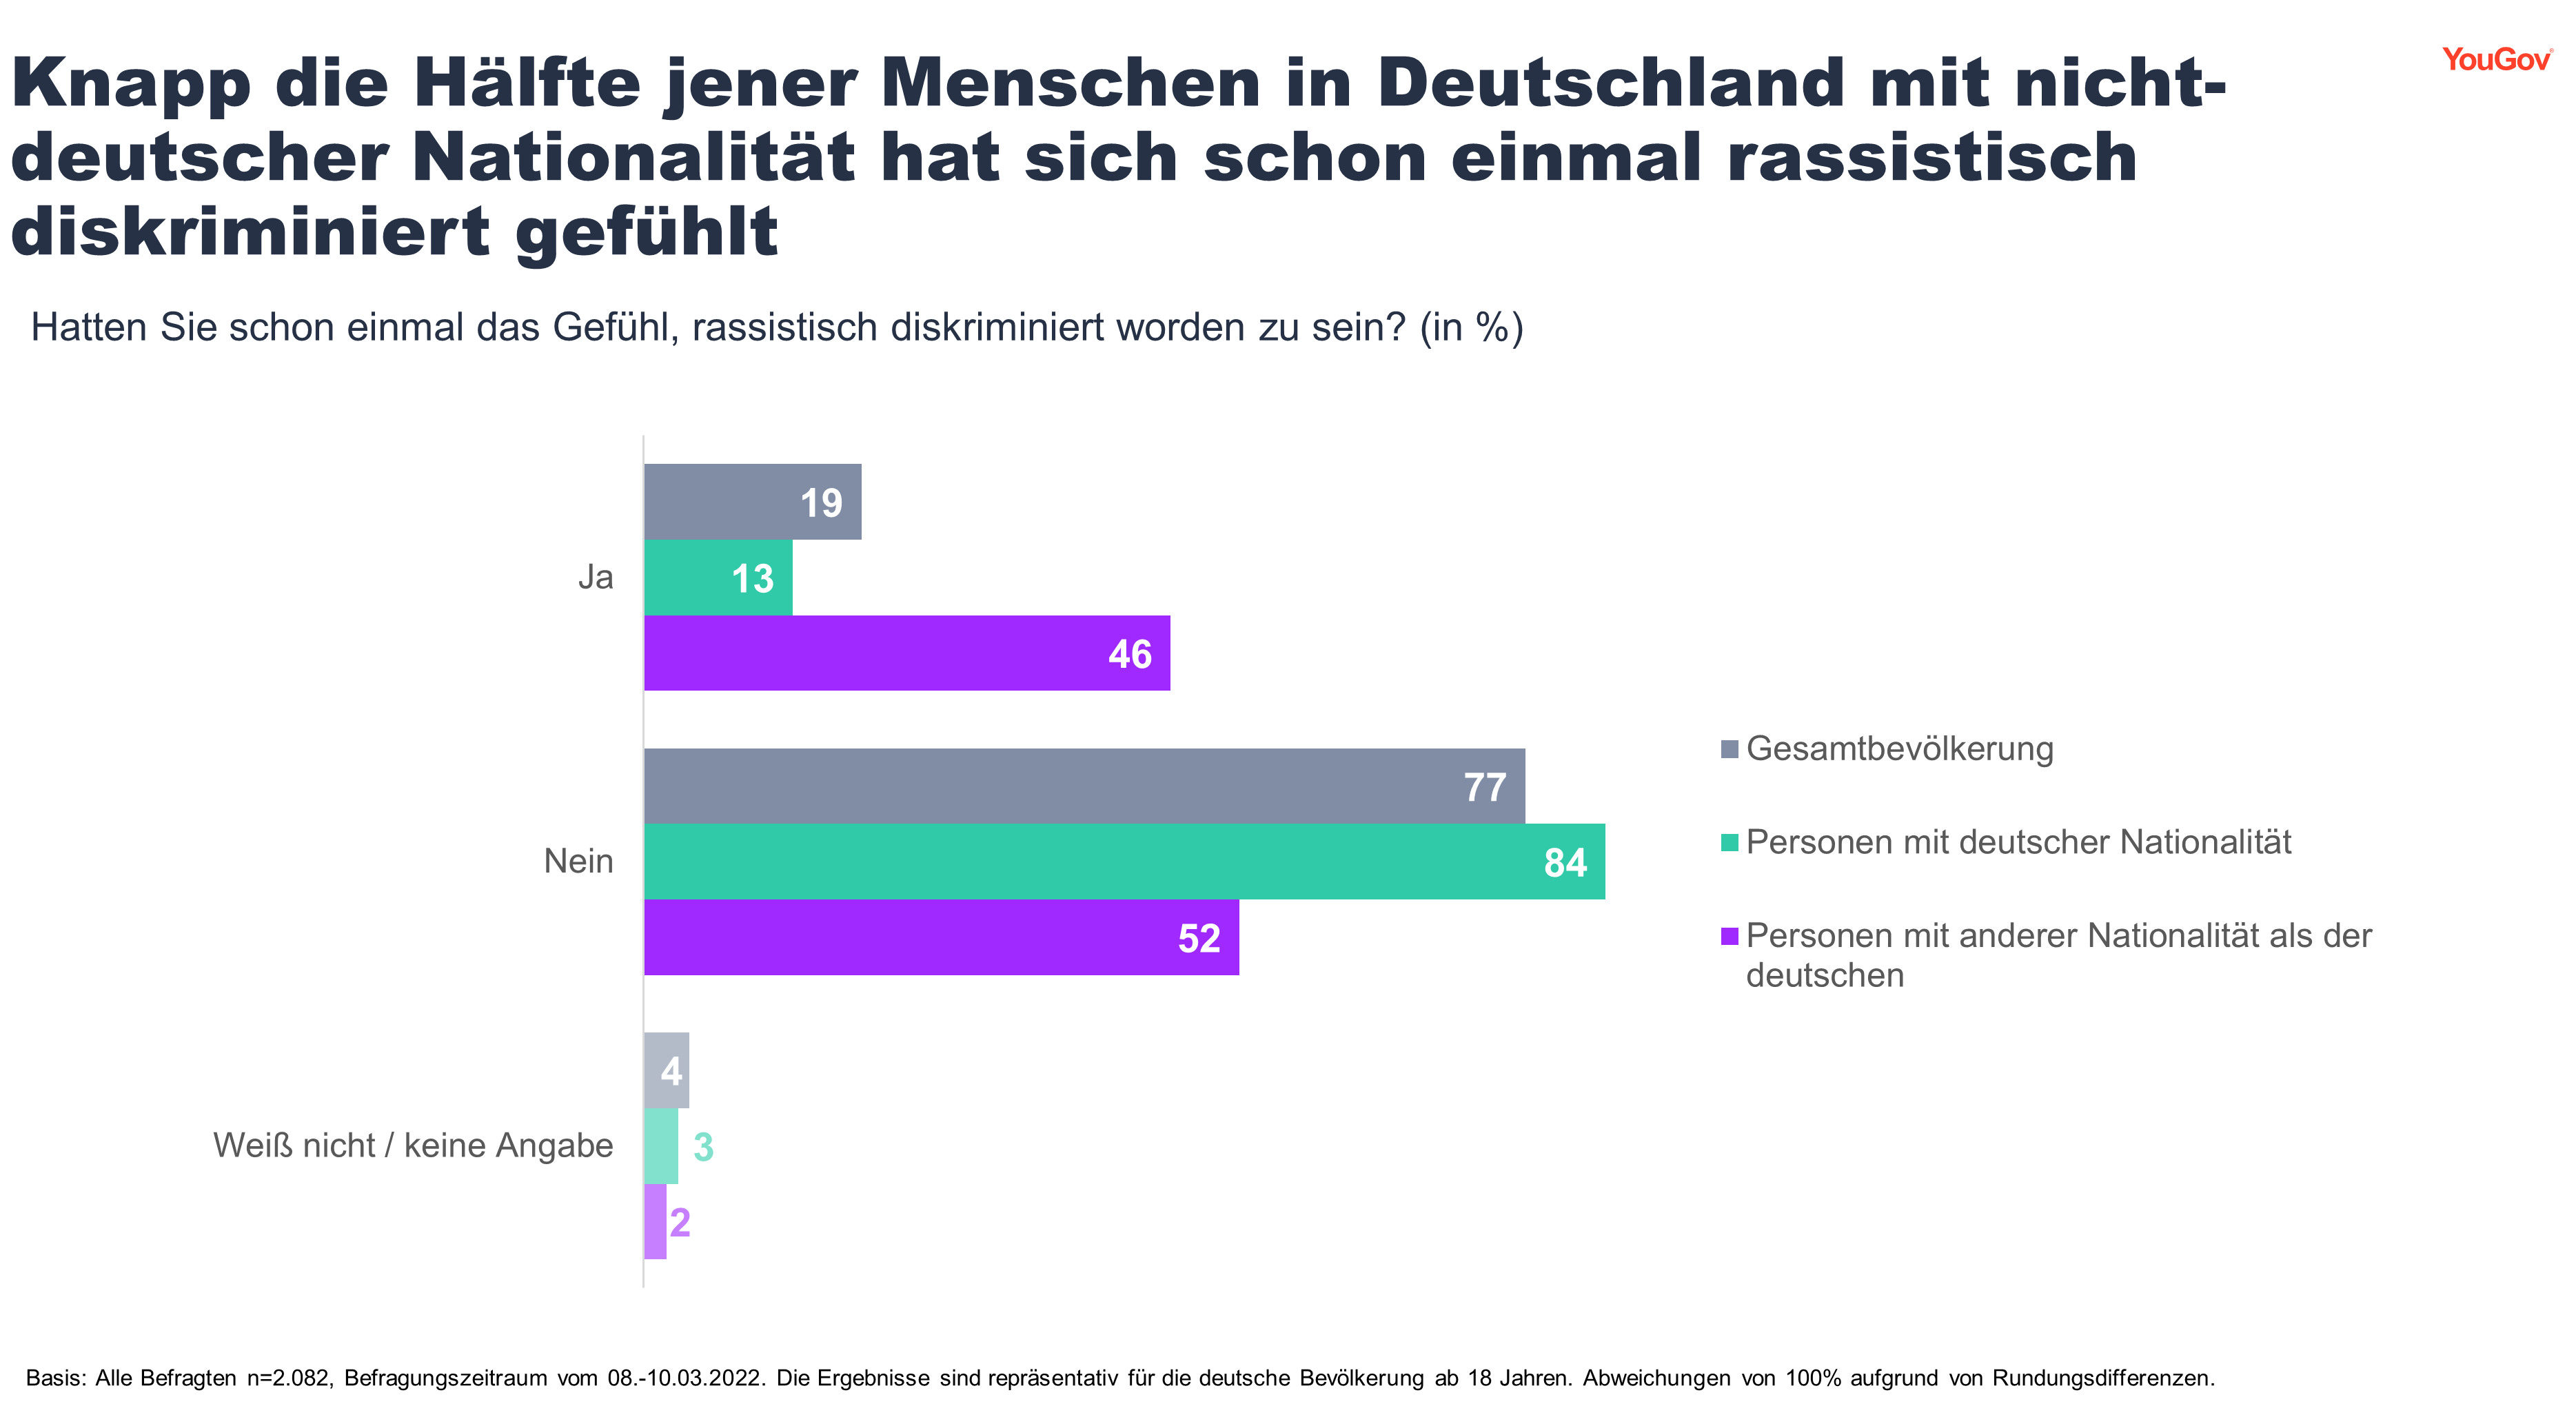
Fifth Person In Germany Has Felt Racially Discriminated Against Today, March 21st, is the annual
International Day Against Racism. Racism is not only a much-discussed,
socially relevant topic in Germany. 19 percent of all respondents in
Germany state that they have had the feeling of being racially discriminated
against. Among people who are exclusively German nationals, 13 percent
say so. On the other hand, 46 percent of those surveyed in Germany who
are not of German nationality say so. (YouGov Germany) March 21, 2022 NORTH AMERICA (USA) More Houses Of Worship Are Returning To Normal Operations,
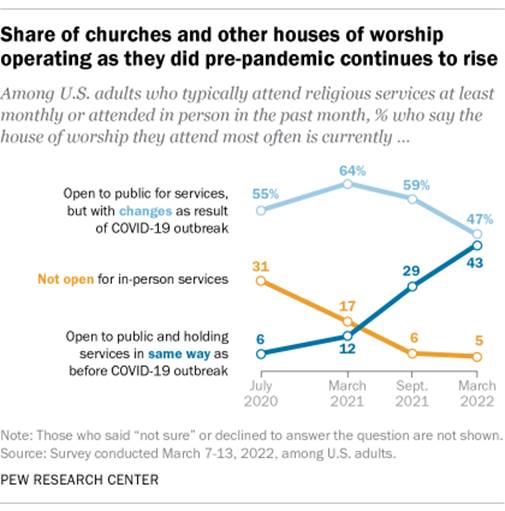
But In-Person Attendance Is Unchanged Since Fall Among U.S. adults who say they attend
religious services, 43% now report that their house of worship is currently
open and holding services the same way it did before the COVID-19 outbreak – up 14 percentage points in the last
six months and 31 points since last March. Meanwhile, 47% say their
congregation is open but with modifications still in place due to the
pandemic, such as mask requirements or social distancing. (PEW) MARCH 22, 2022 Biden's Job Approval Is 42%, Statistically Unchanged From
41% Last Month At 42%, President Joe Biden's latest
job approval rating marks his seventh consecutive reading below 44%, while a
majority of Americans, 54%, continue to disapprove of the job he is doing. Although
Biden's overall rating is flat, Americans' approval of his handling of the
coronavirus response (53%) and the situation with Russia (42%) has each risen
six points over the past month. At the same time, approval of his handling of
foreign affairs (43%) and the economy (36%) is not significantly different
than in February. (Gallup) MARCH 22, 2022 A Broad Majority Of Americans (69%) Favor The United States
Taking Steps To Become Carbon Neutral By 2050 A broad majority of Americans (69%) favor
the United States taking steps to become carbon neutral by 2050, according to
a Pew Research Center survey conducted in January. But while some
advocates suggest that nuclear power – a source that emits no carbon – should
have a more prominent role in the nation’s energy makeup, the public
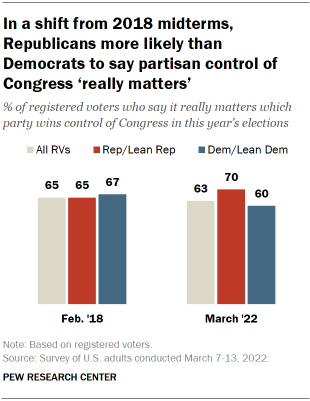
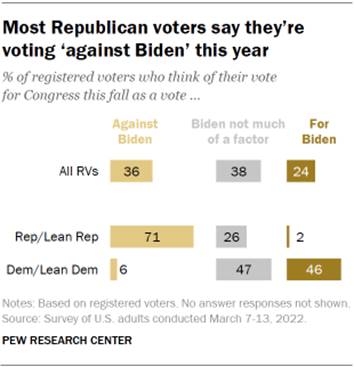
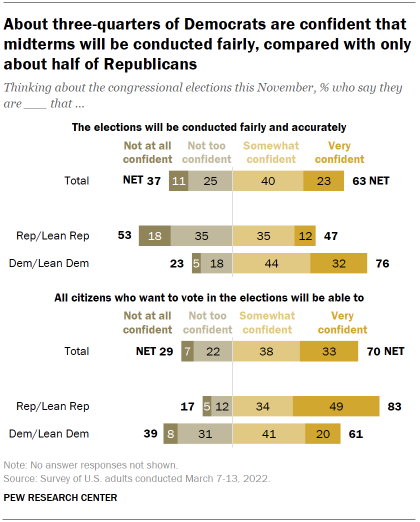
continues to express mixed views about it as an energy source. (PEW) MARCH 23, 2022 71% Of Republican Voters Say Their Vote For Congress Is
Against Biden Pew Research Center conducted this study to
understand how the public views control of Congress, issues for the upcoming
midterm elections and confidence in how the elections will be conducted. For
this analysis, we surveyed 10,441 U.S. adults in March 2022. Everyone who
took part in this survey is a member of the Center’s American Trends Panel
(ATP), an online survey panel that is recruited through national, random
sampling of residential addresses. This way nearly all U.S. adults have a
chance of selection. The survey is weighted to be representative of the U.S.
adult population by gender, race, ethnicity, partisan affiliation, education
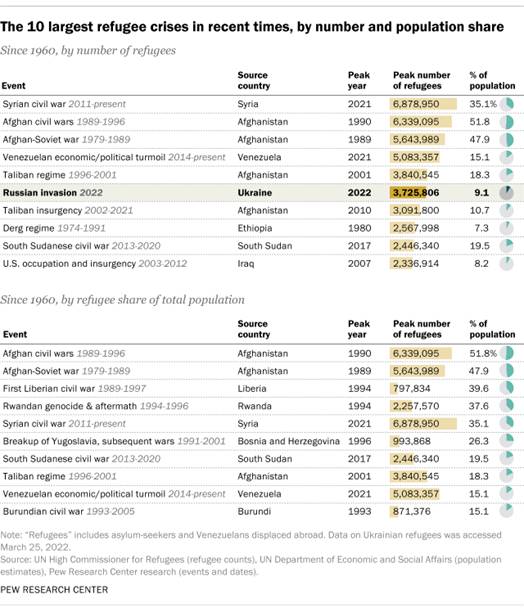
and other categories. (PEW) MARCH 24, 2022 After A Month Of War, Ukrainian Refugee Crisis Ranks Among
The World’s Worst In Recent History Russia’s invasion of Ukraine has created
one of the biggest refugee crises of modern times. A month into the war, more
than 3.7 million Ukrainians have fled to neighboring countries –
the sixth-largest refugee outflow over the past 60-plus years, according to a
Pew Research Center analysis of United Nations data. There are now almost as
many Ukrainian refugees as there were Afghan refugees fleeing the (first)
Taliban regime in 2001, according to figures compiled by the UN High Commissioner for Refugees (UNHCR). They represent about 9.1% of
Ukraine’s pre-invasion population of about 41.1 million – ranking the current
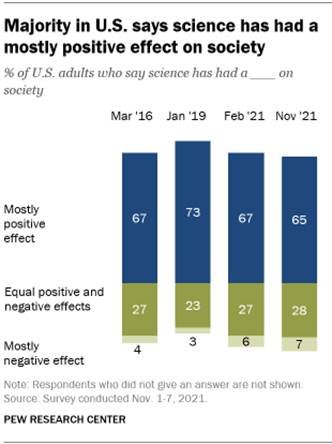
crisis 16th among 28 major refugee crises by share of population. (PEW) MARCH 25, 2022 About Two-Thirds Of U S Adults (65%) Say Science Has Had A
Mostly Positive Effect On Society About two-thirds of U.S. adults (65%) say
science has had a mostly positive effect on society, while 28% say it has had
an equal mix of positive and negative effects and just 7% say it has had a
mostly negative effect, according to a recent Pew Research Center survey.
Over the past few years, around two-thirds or more of Americans have seen
science’s effect on society as mostly positive. (PEW) MARCH 25, 2022 AUSTRALIA Australians To Spend Billions On Holidays, Food And
Chocolate This Easter Over four million Australians are planning
a trip away this Easter with $7.1 billion to be spent on holidays, while
around $1.5 billion will be splurged on food and chocolate, in a major boon
for tourism operators and retail businesses. Of the Australians going away
this Easter, 63% will be travelling within their own state, 34% will be going
interstate and 3% overseas. Those aged 35-49, and the most likely to have a
family in tow, are set to spend an average of $2,000 on their Easter
holidays, totalling $2.6 billion overall - more than any other age group March 25 2022 MULTICOUNTRY STUDIES U S Image Improves Across Most Of NATO, A Survey Of 27 NATO
Countries Gallup surveys conducted before Russia
invaded Ukraine in February 2022 showed the image of U.S. leadership was
stronger across much of NATO than it had been in years, after languishing at
low levels during the Trump administration. Between 2020 and 2021, U.S.
leadership saw double-digit gains in 20 of the 27 NATO members surveyed both
years. Lithuania was the only NATO member where approval ratings headed in a
negative direction, with a six-percentage-point drop. But even so, the
leadership of the U.S. earned higher approval in Lithuania last year than did
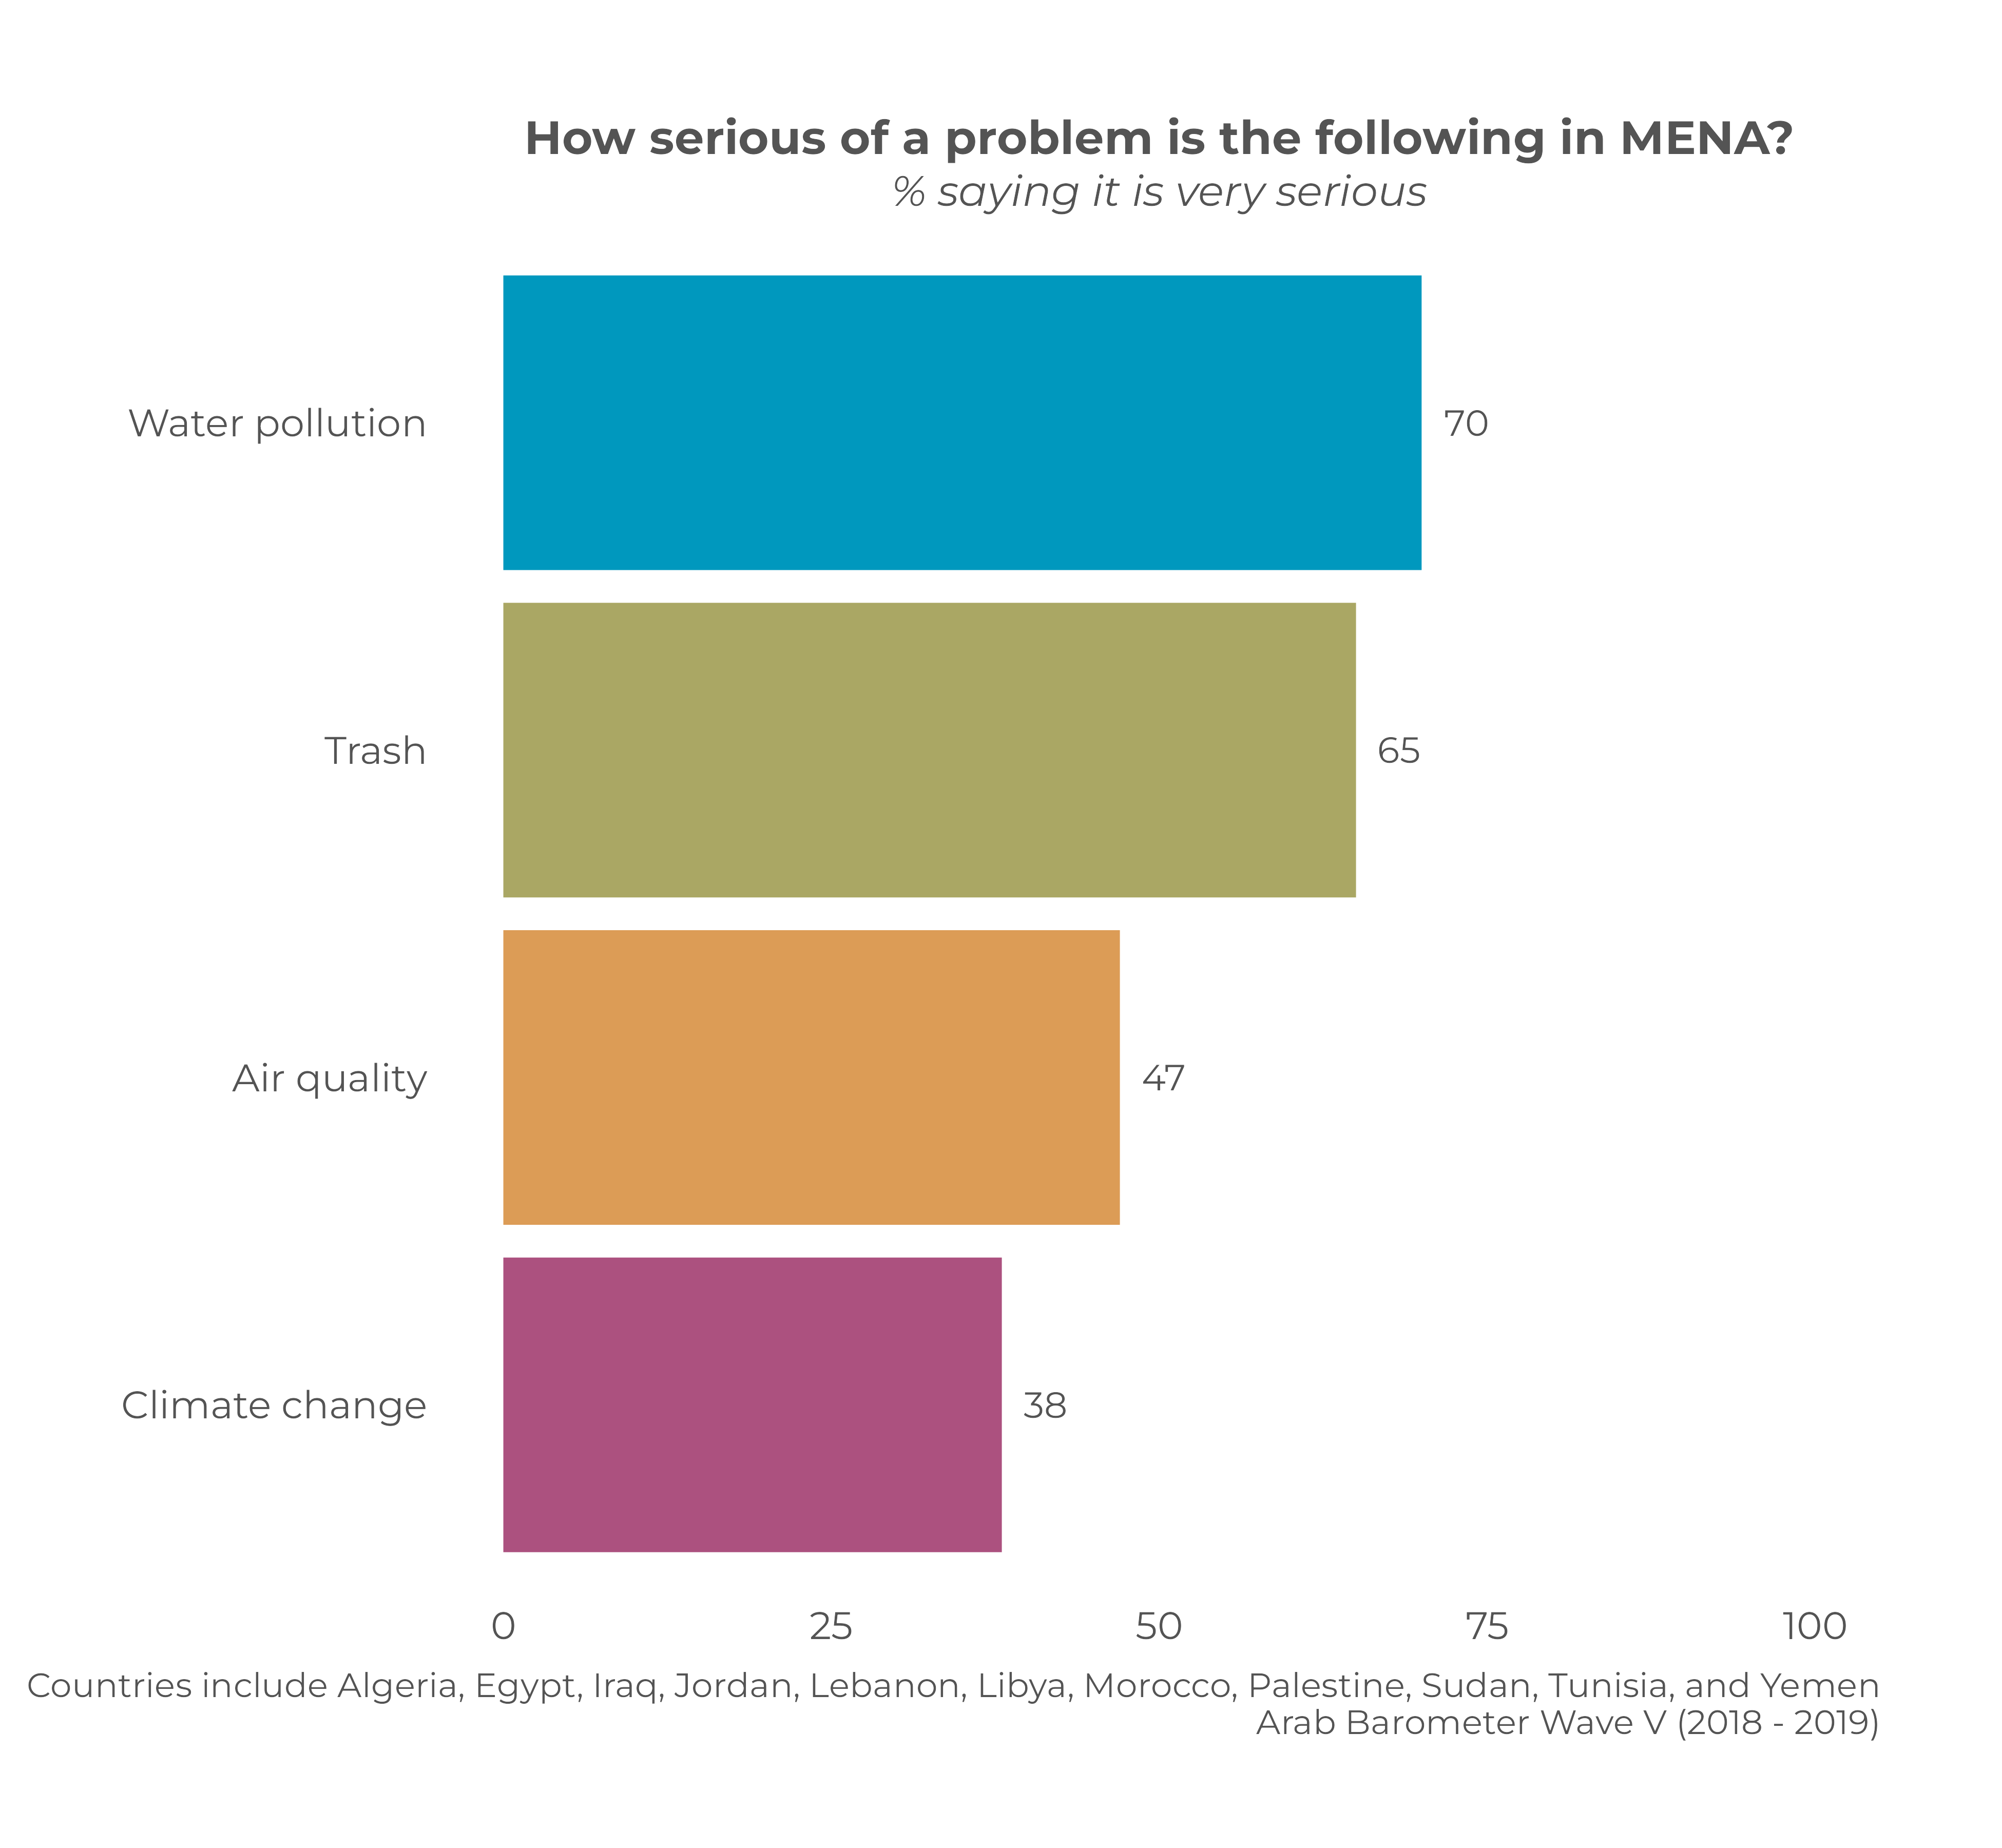
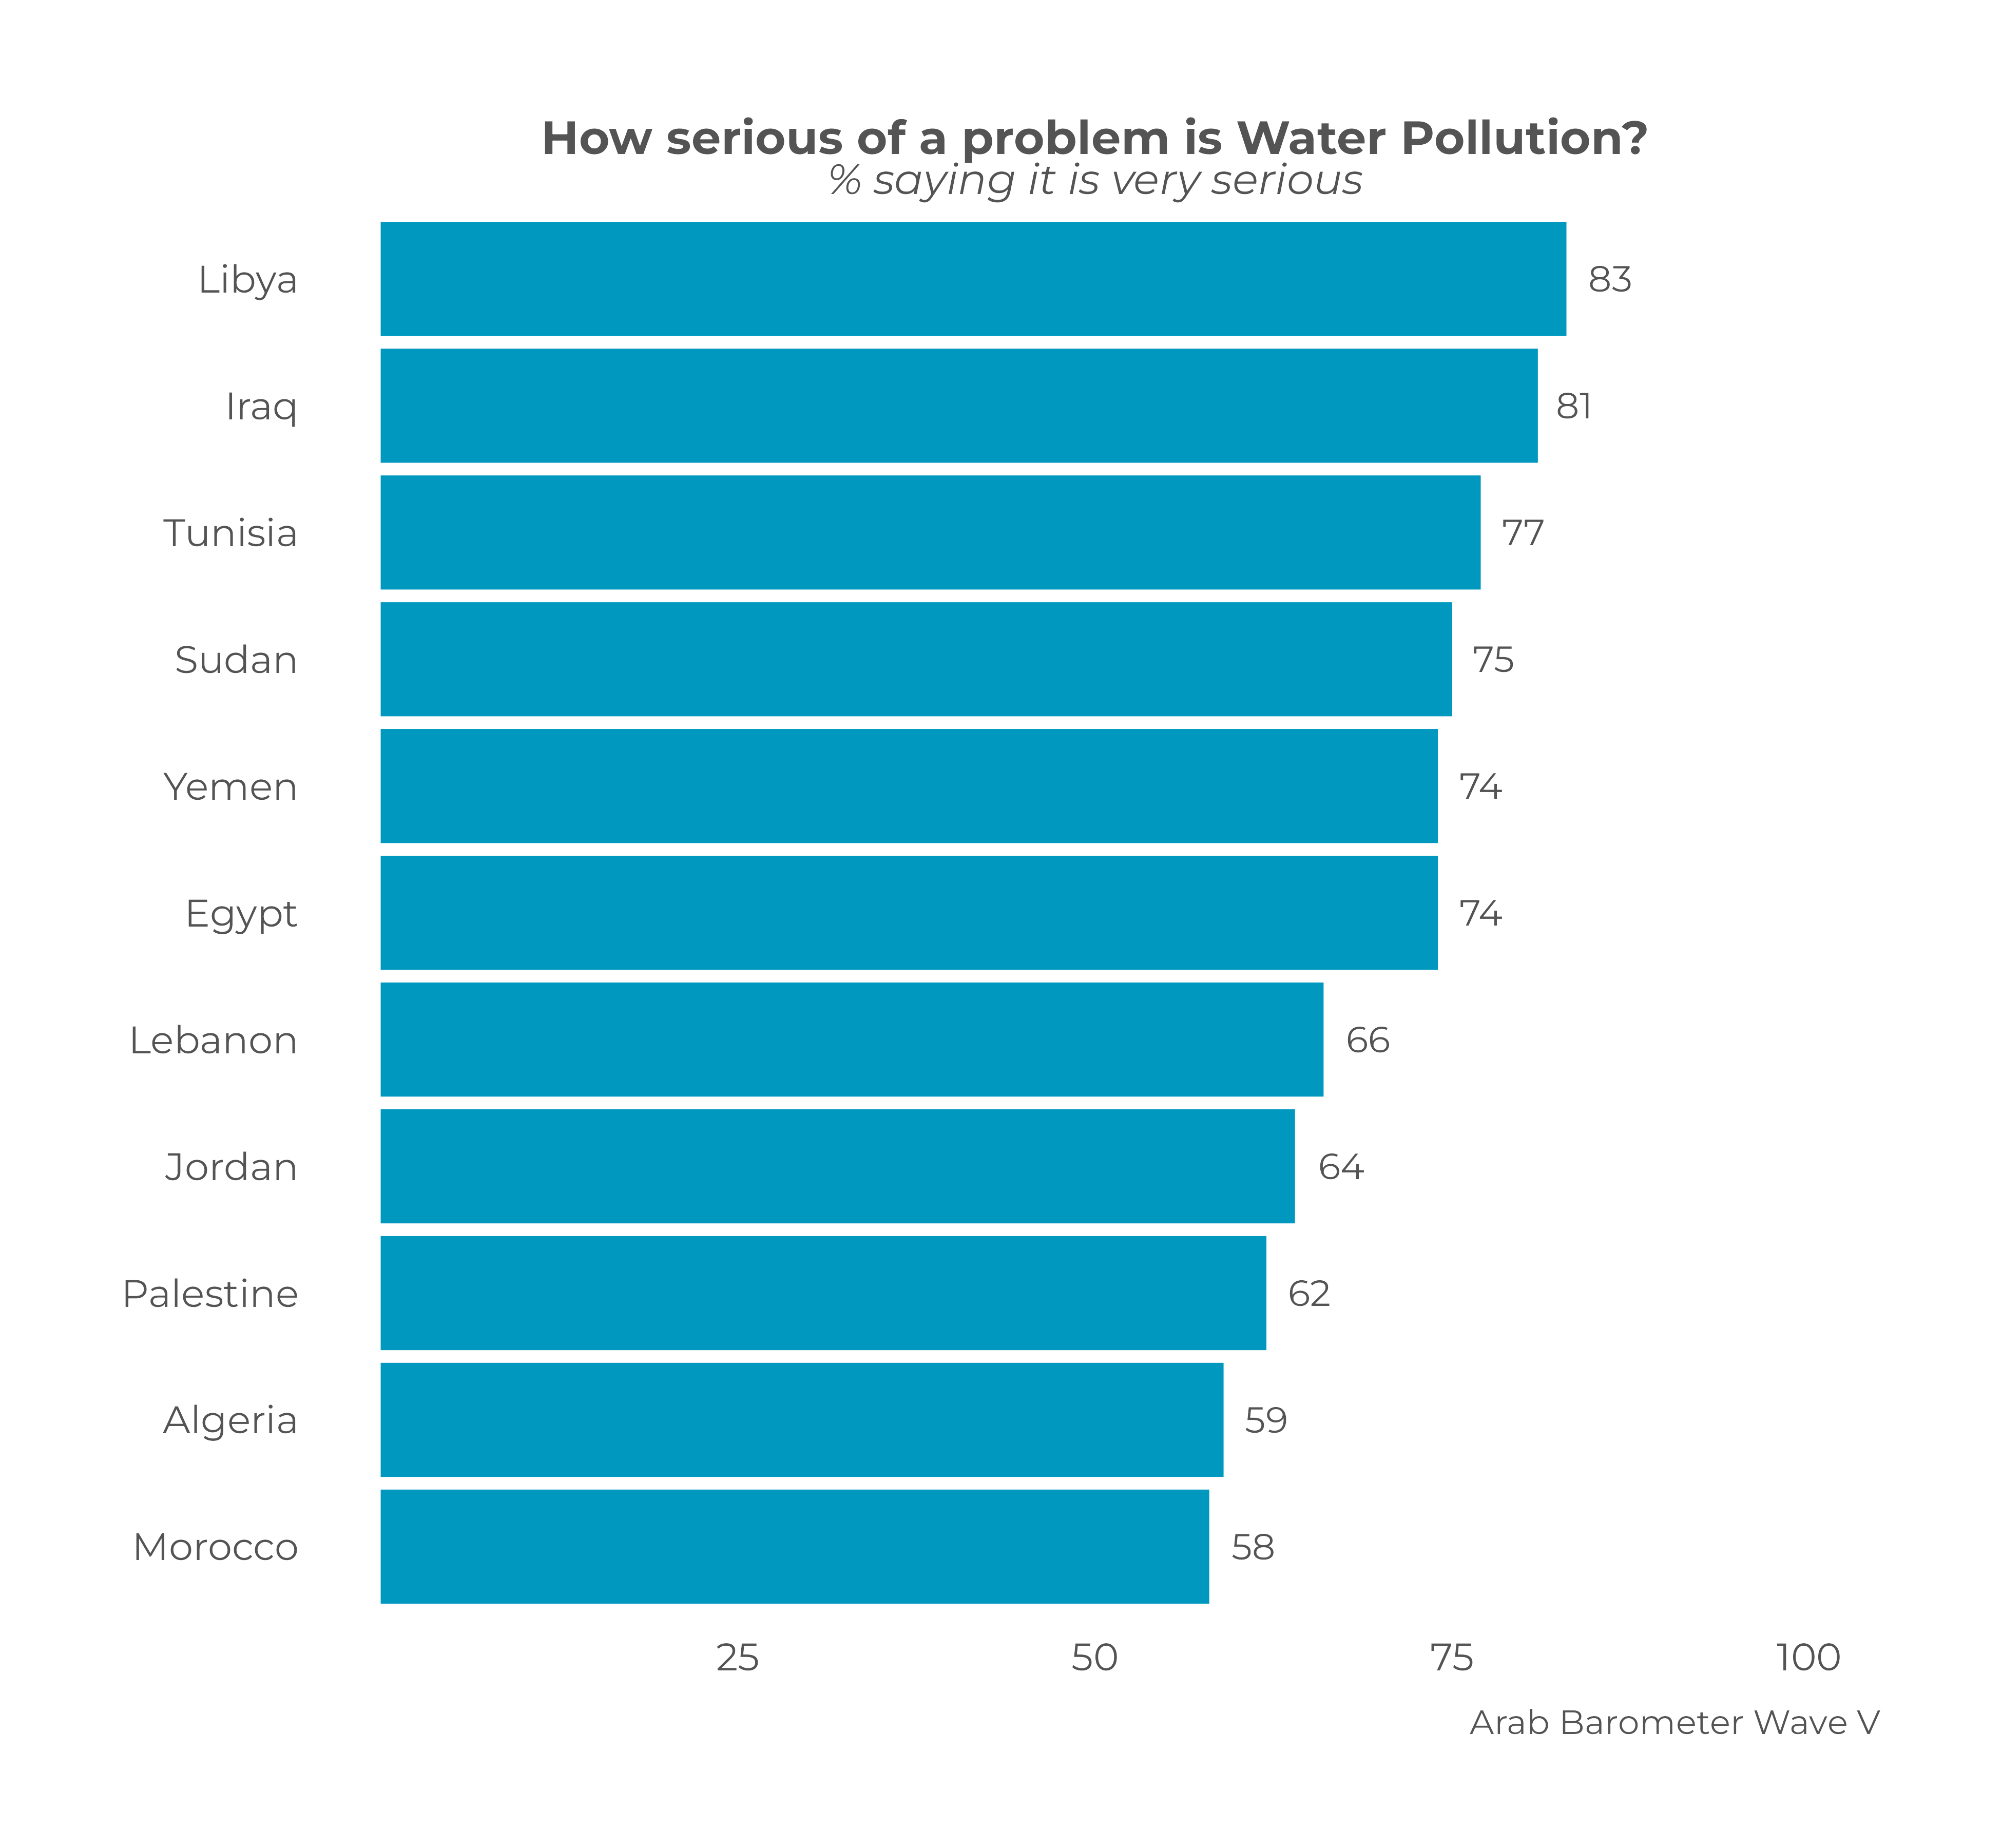
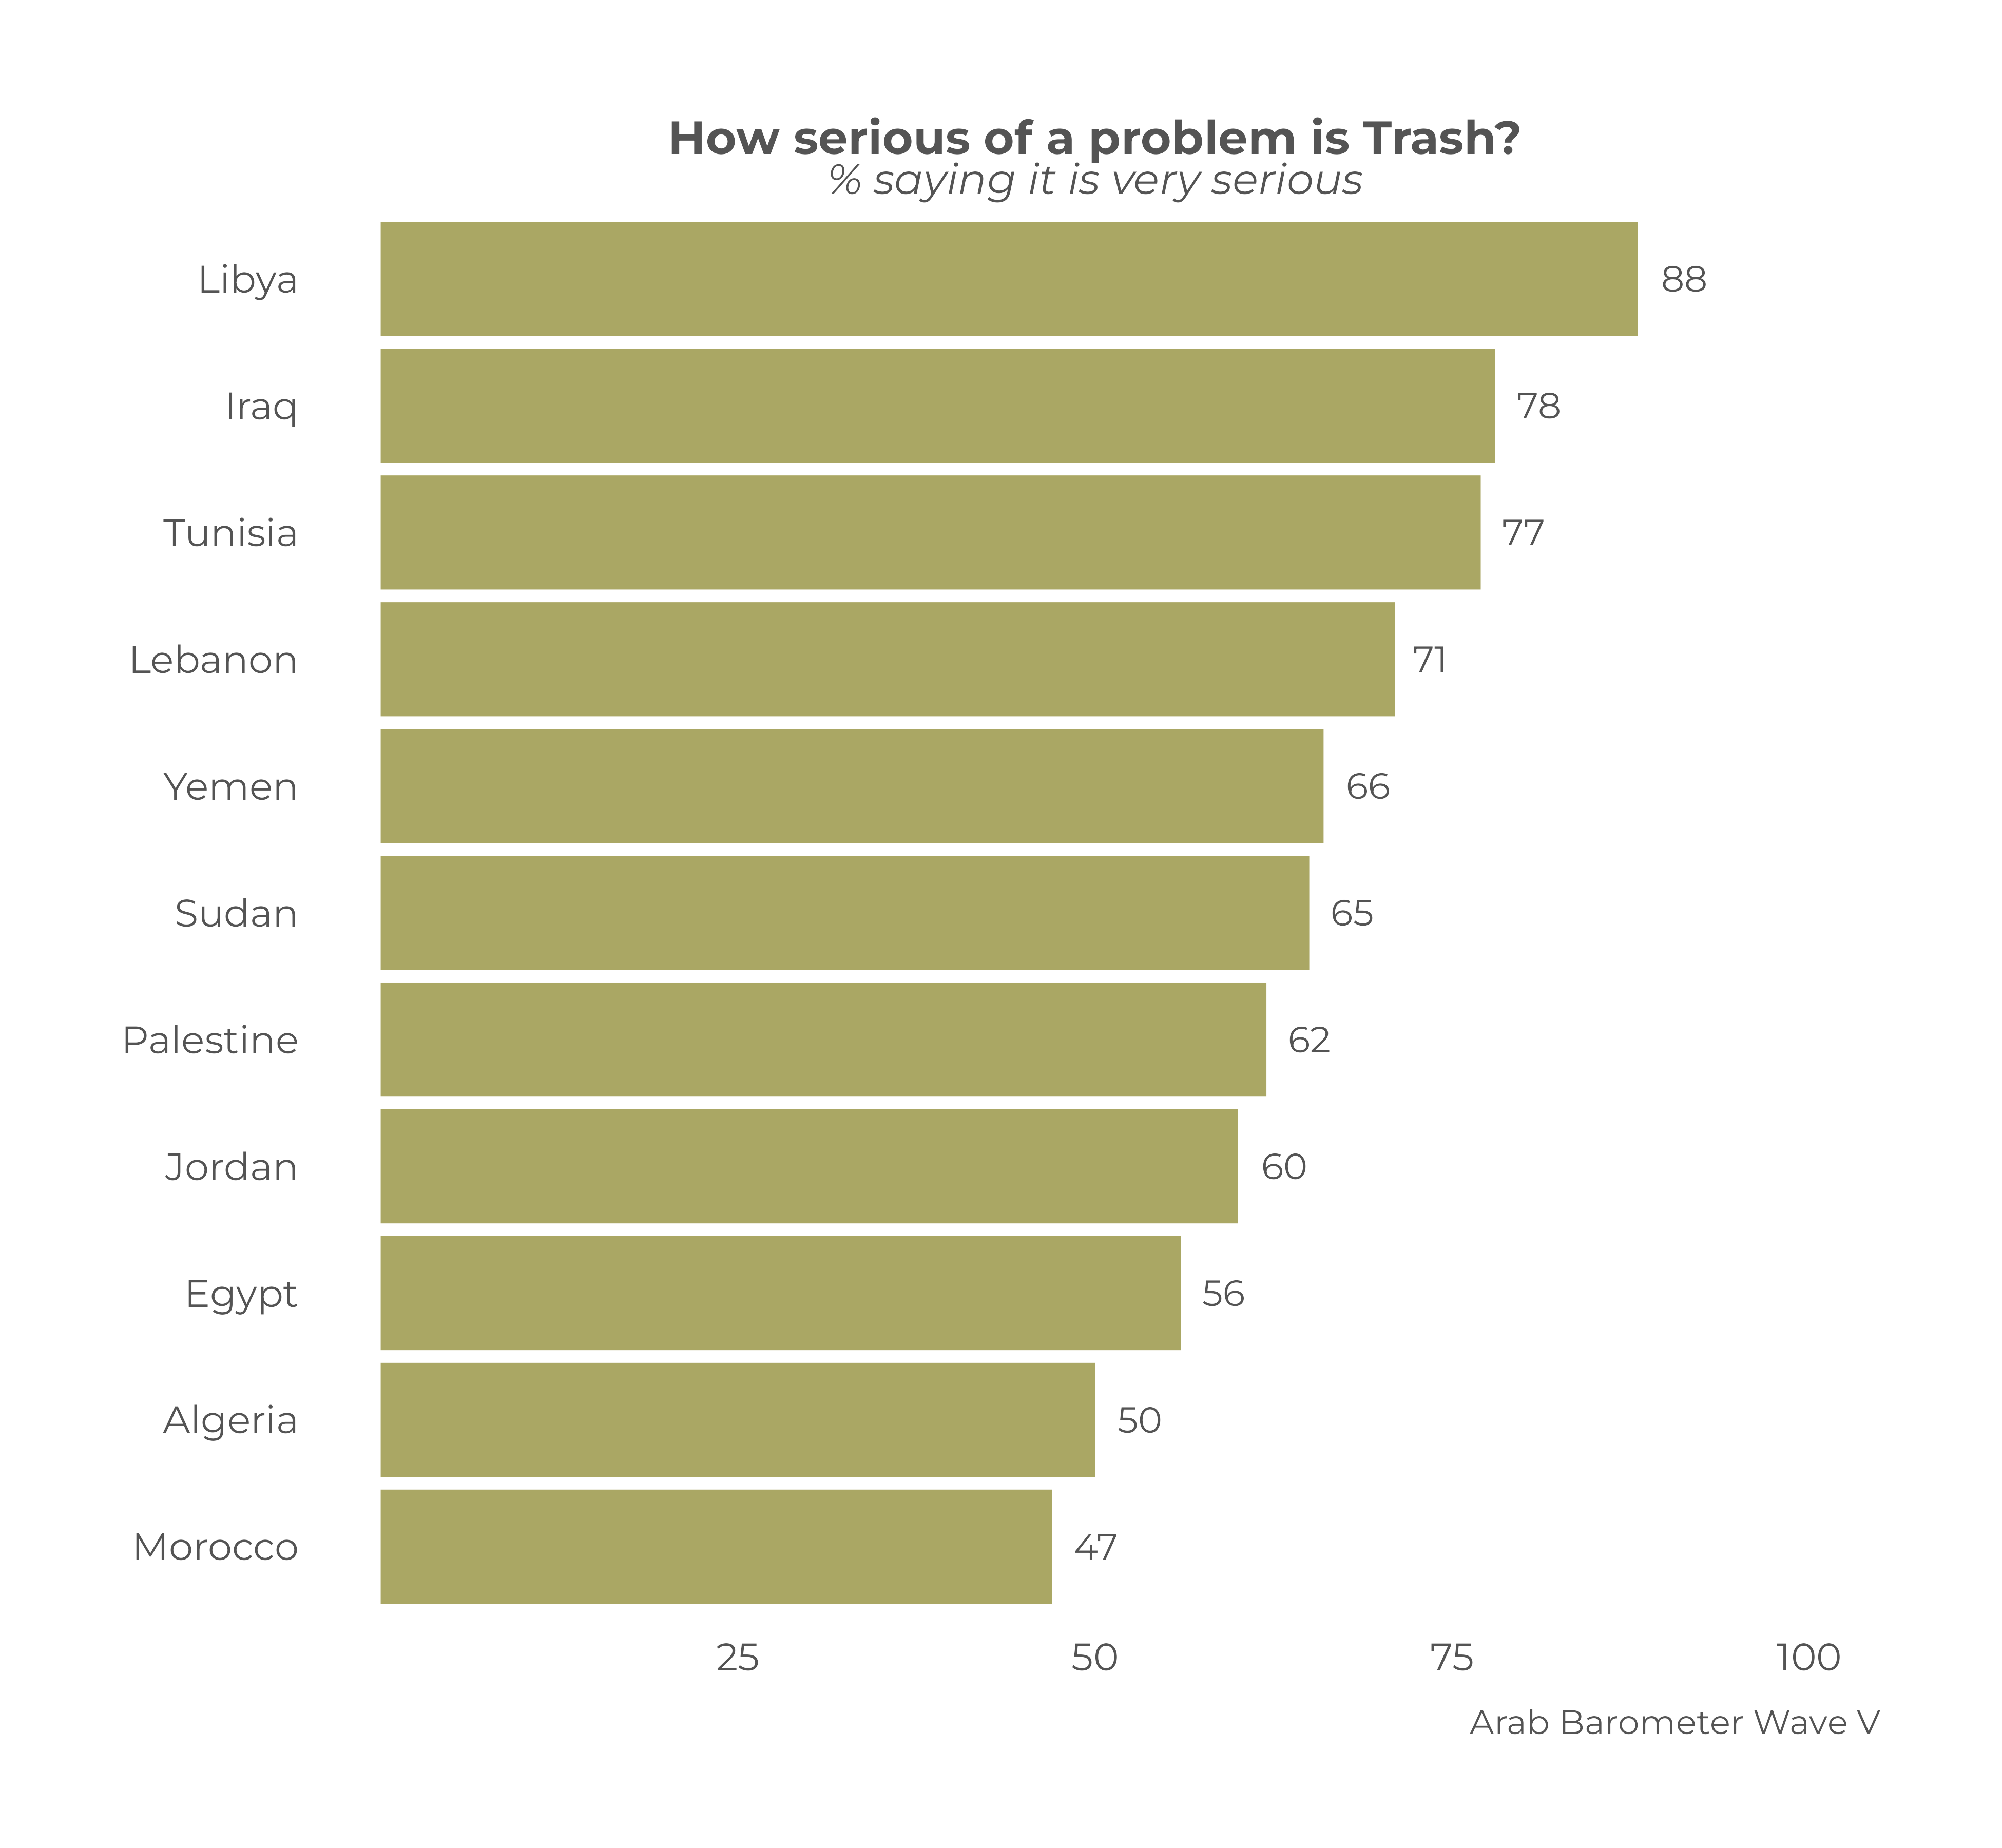
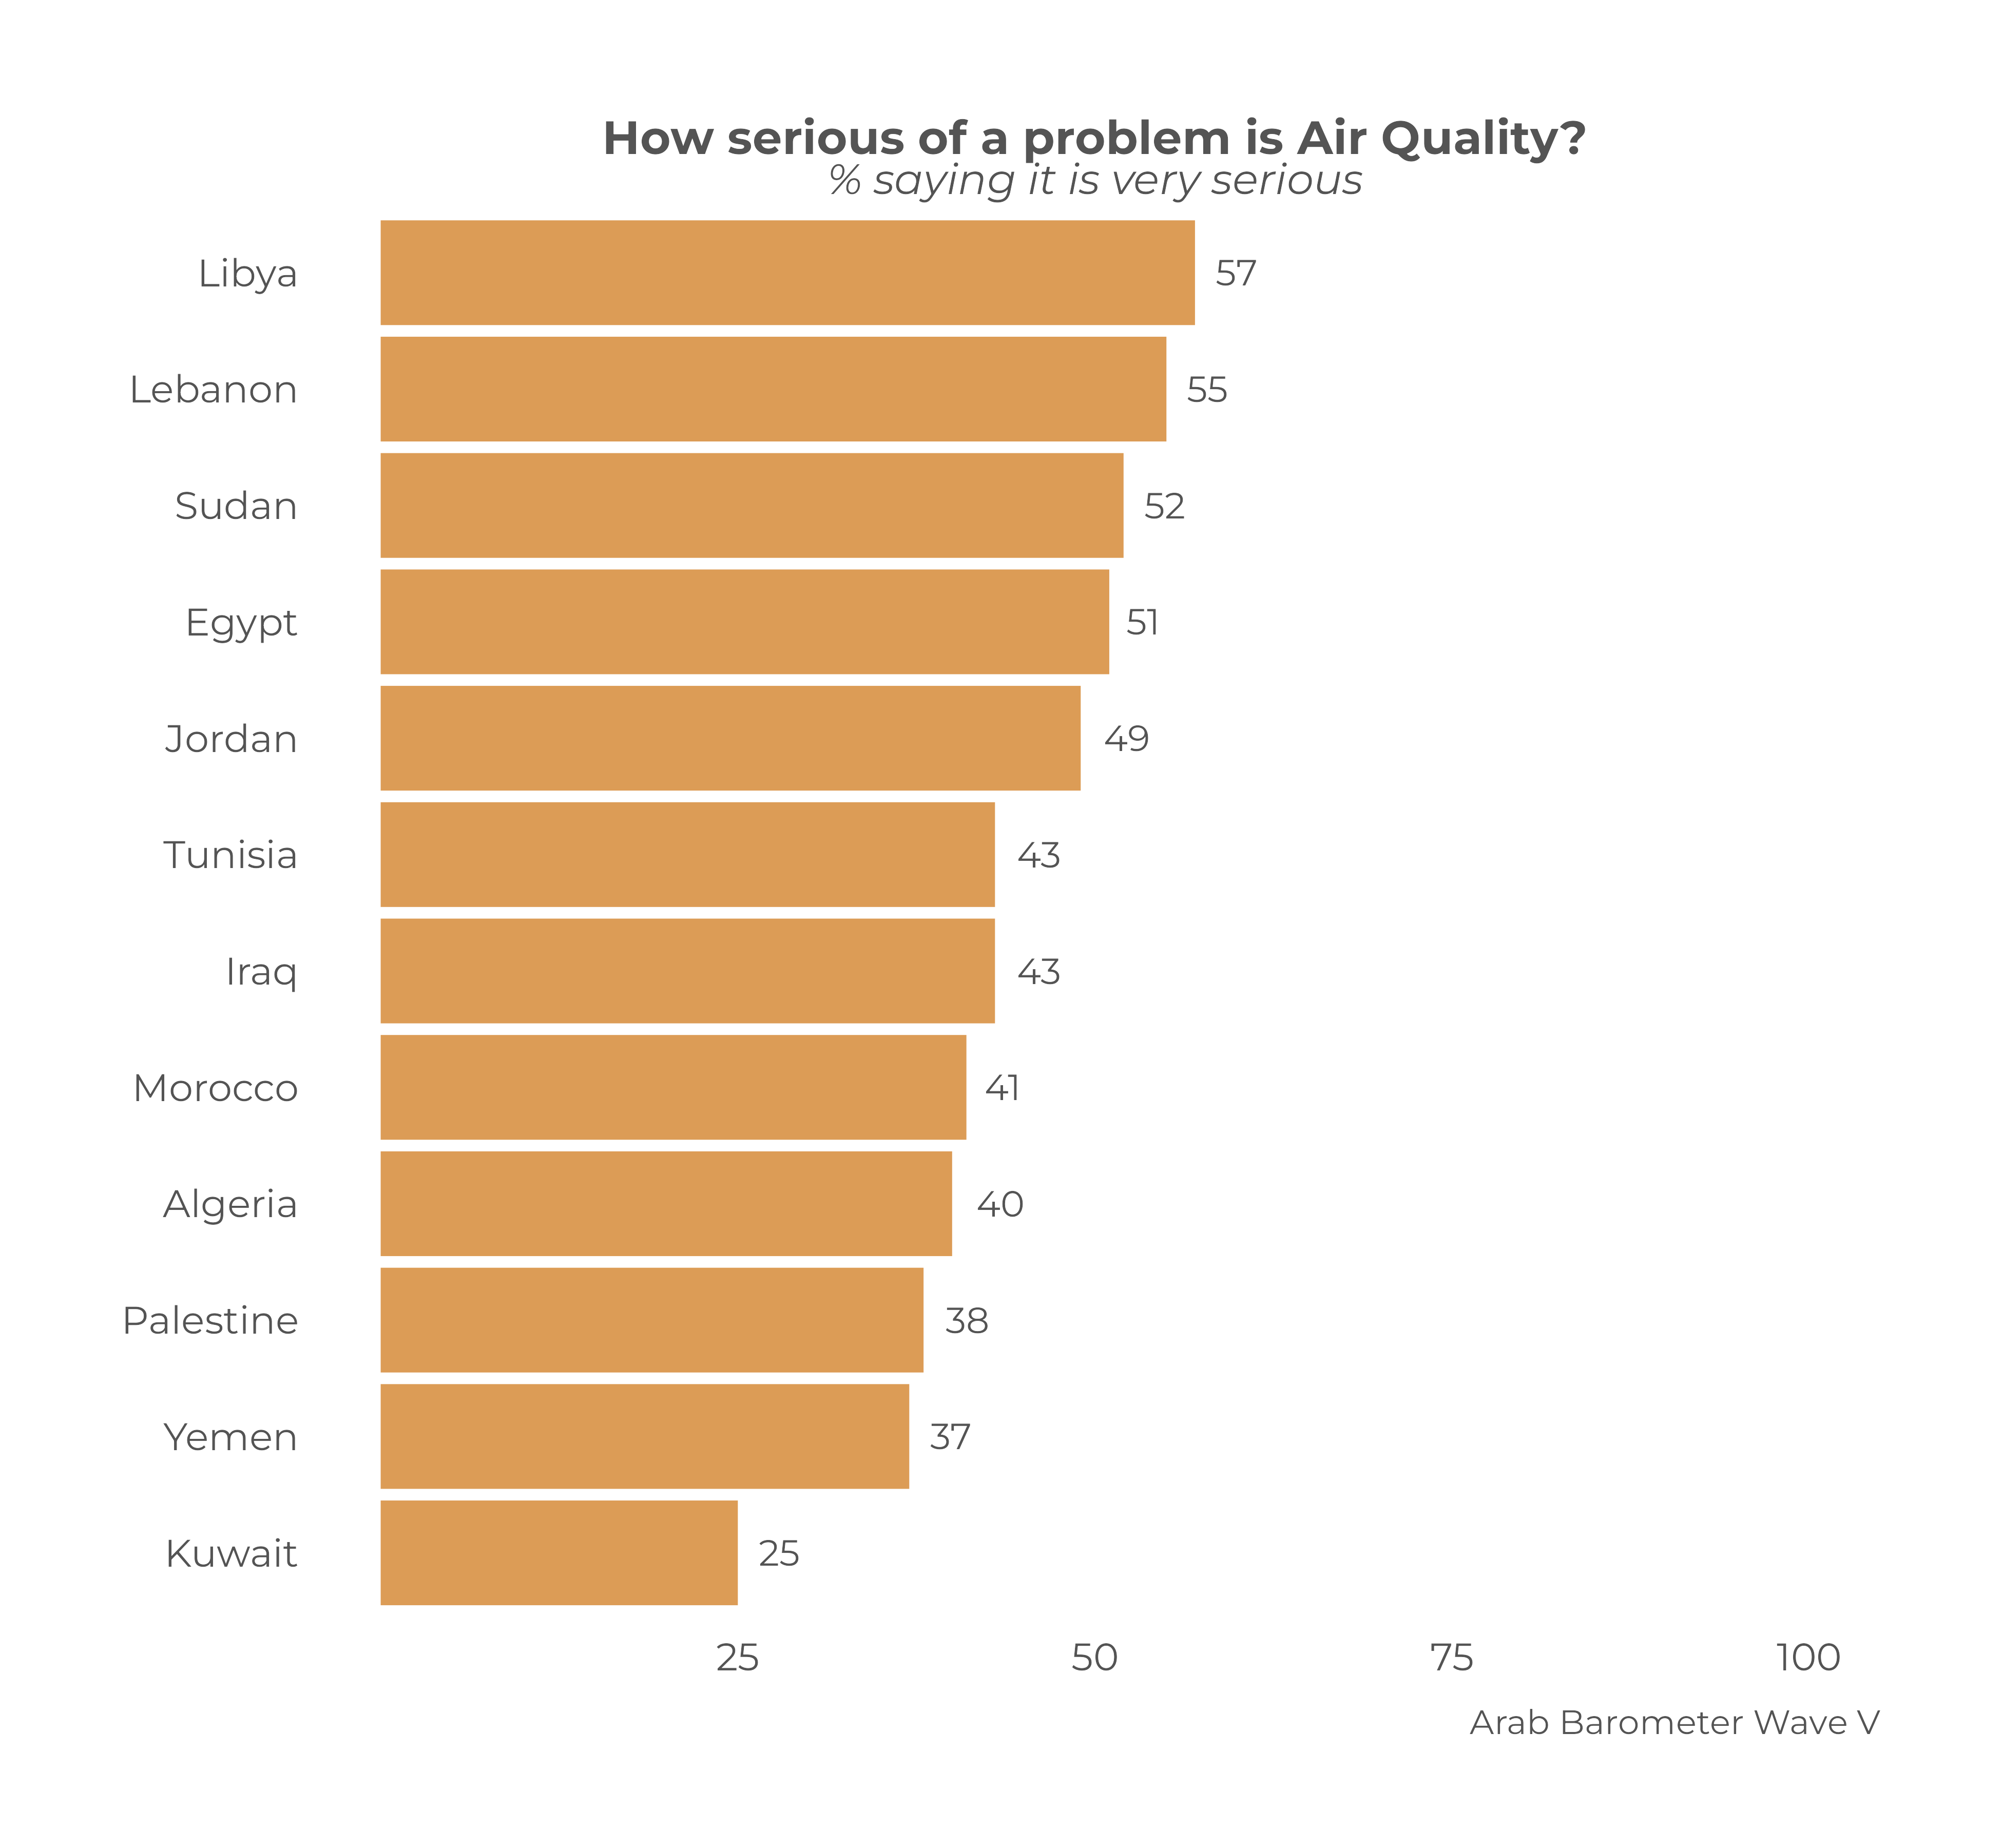
the leadership of Russia (8%) and China (5%). (Gallup) MARCH 23, 2022 Source: https://news.gallup.com/poll/391160/image-improves-across-nato.aspx What MENA Citizens Think About The Environment, Among 12
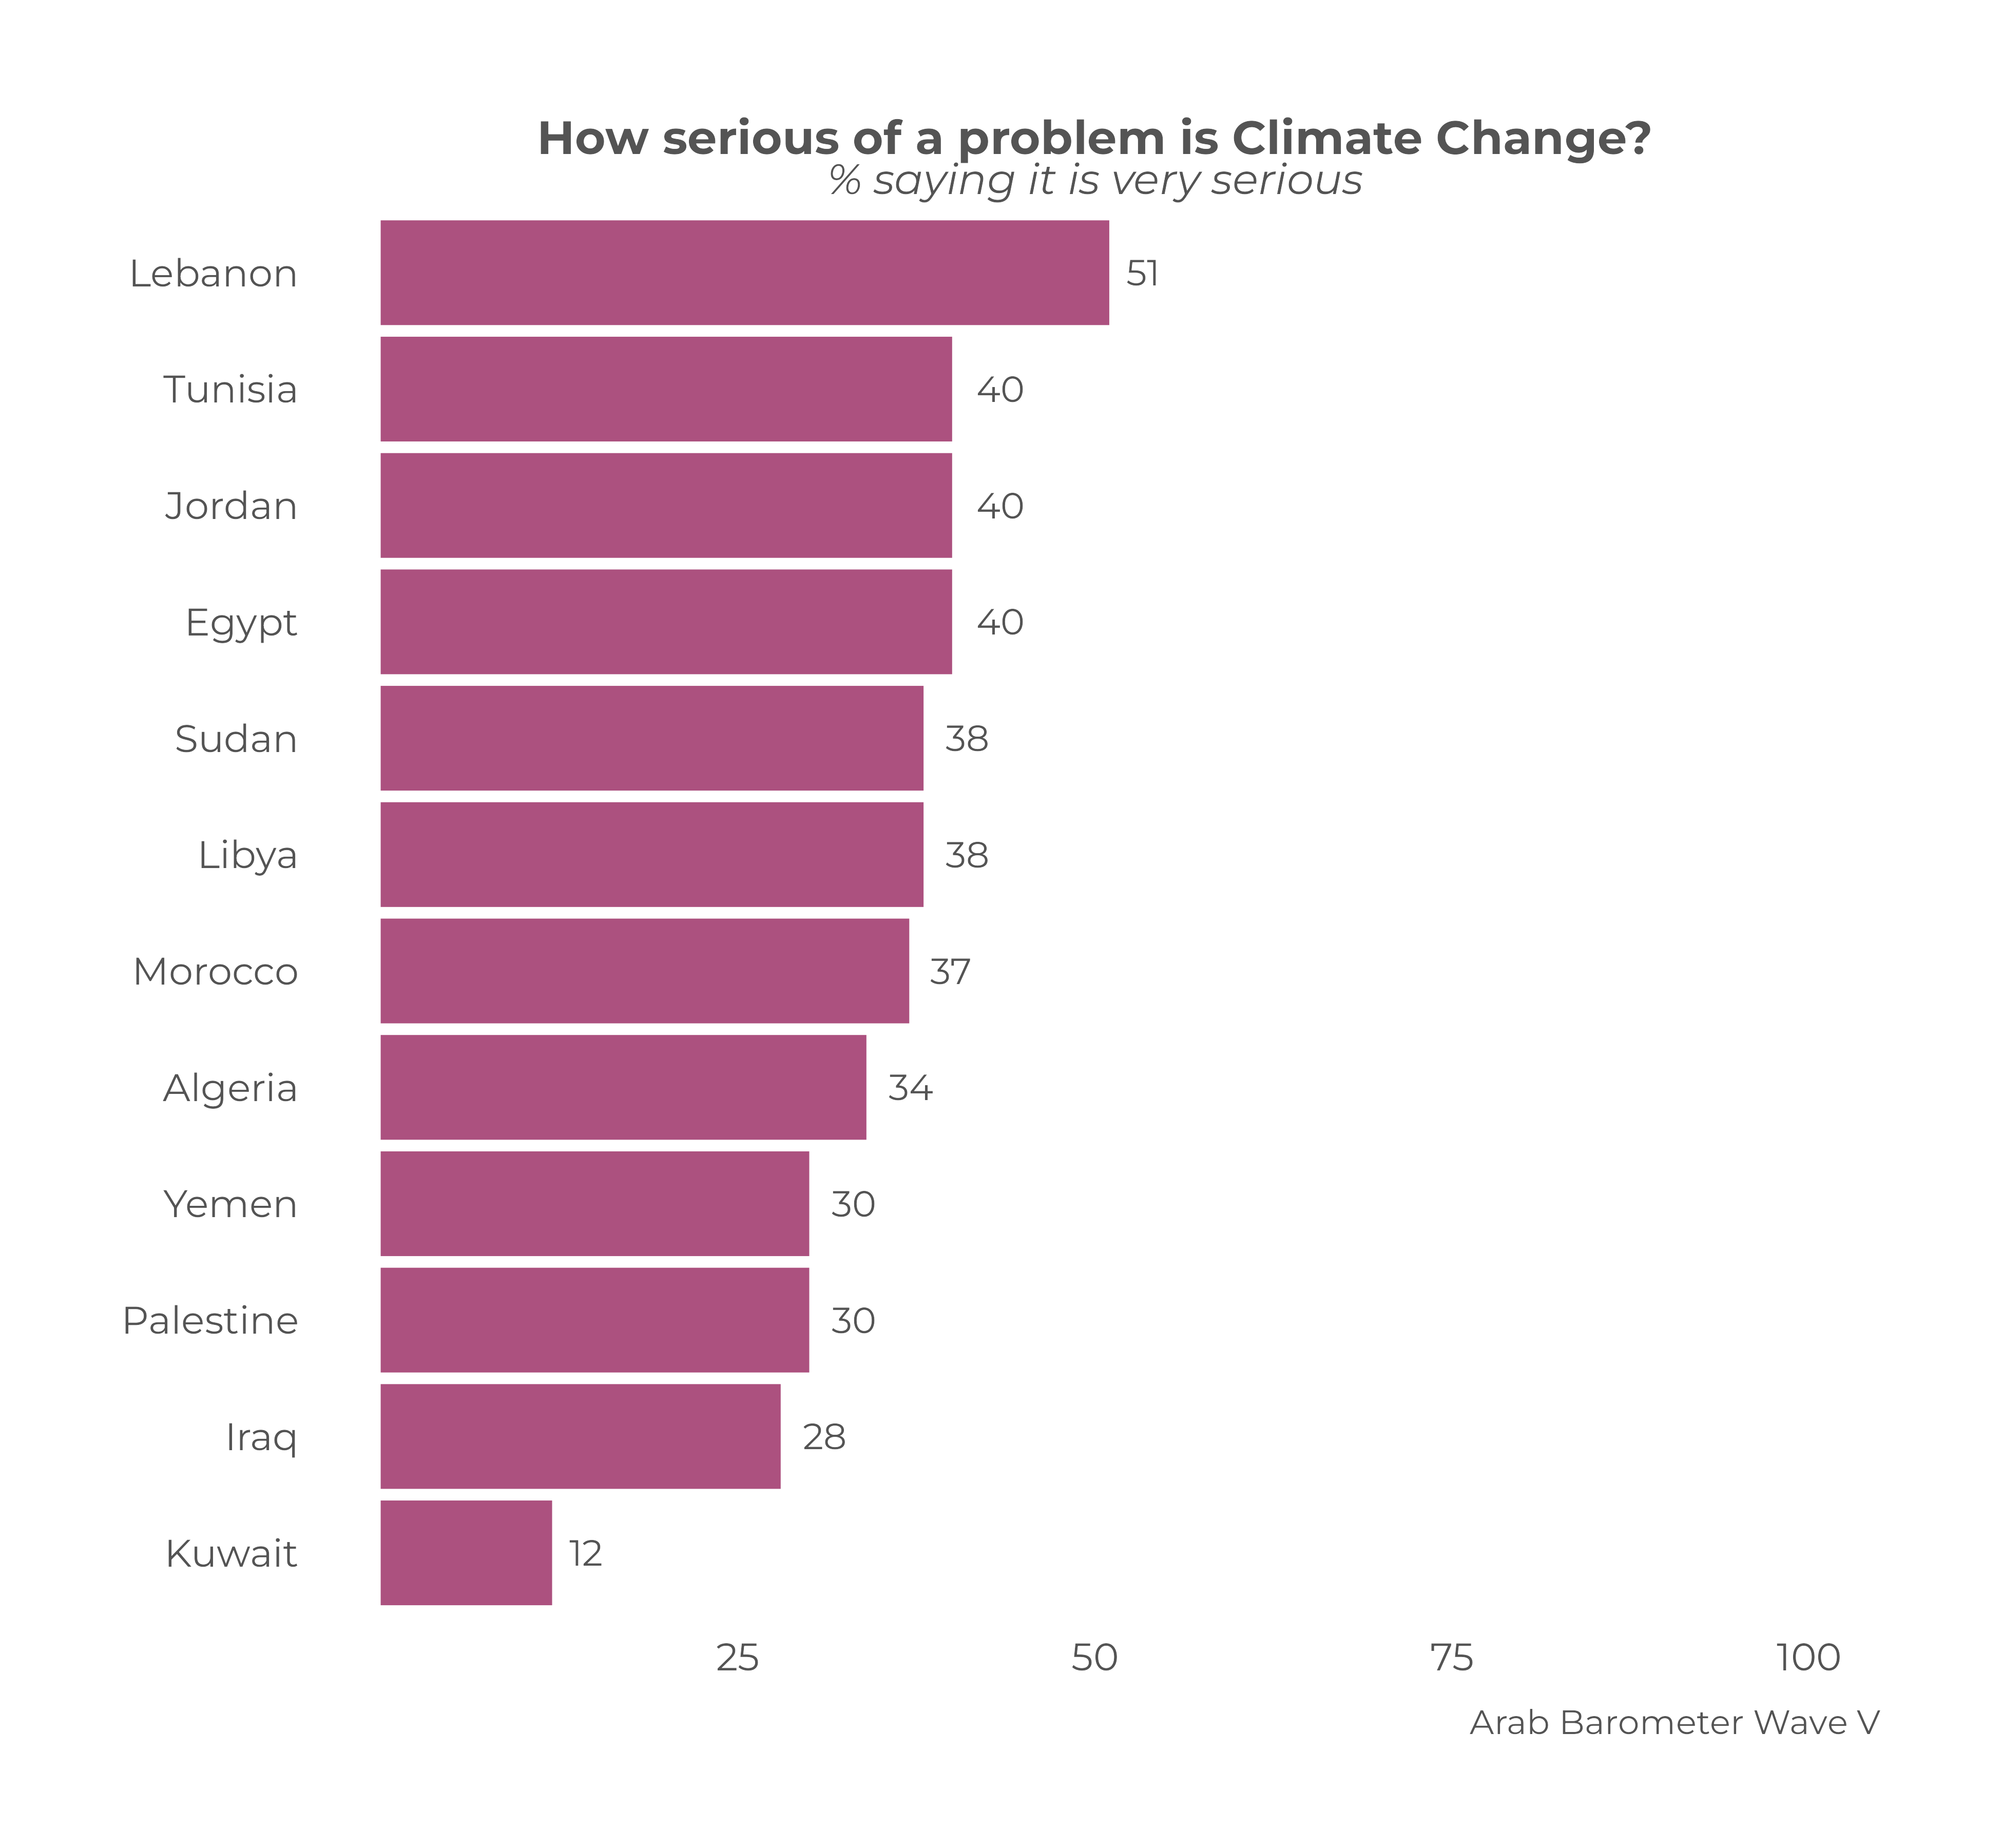
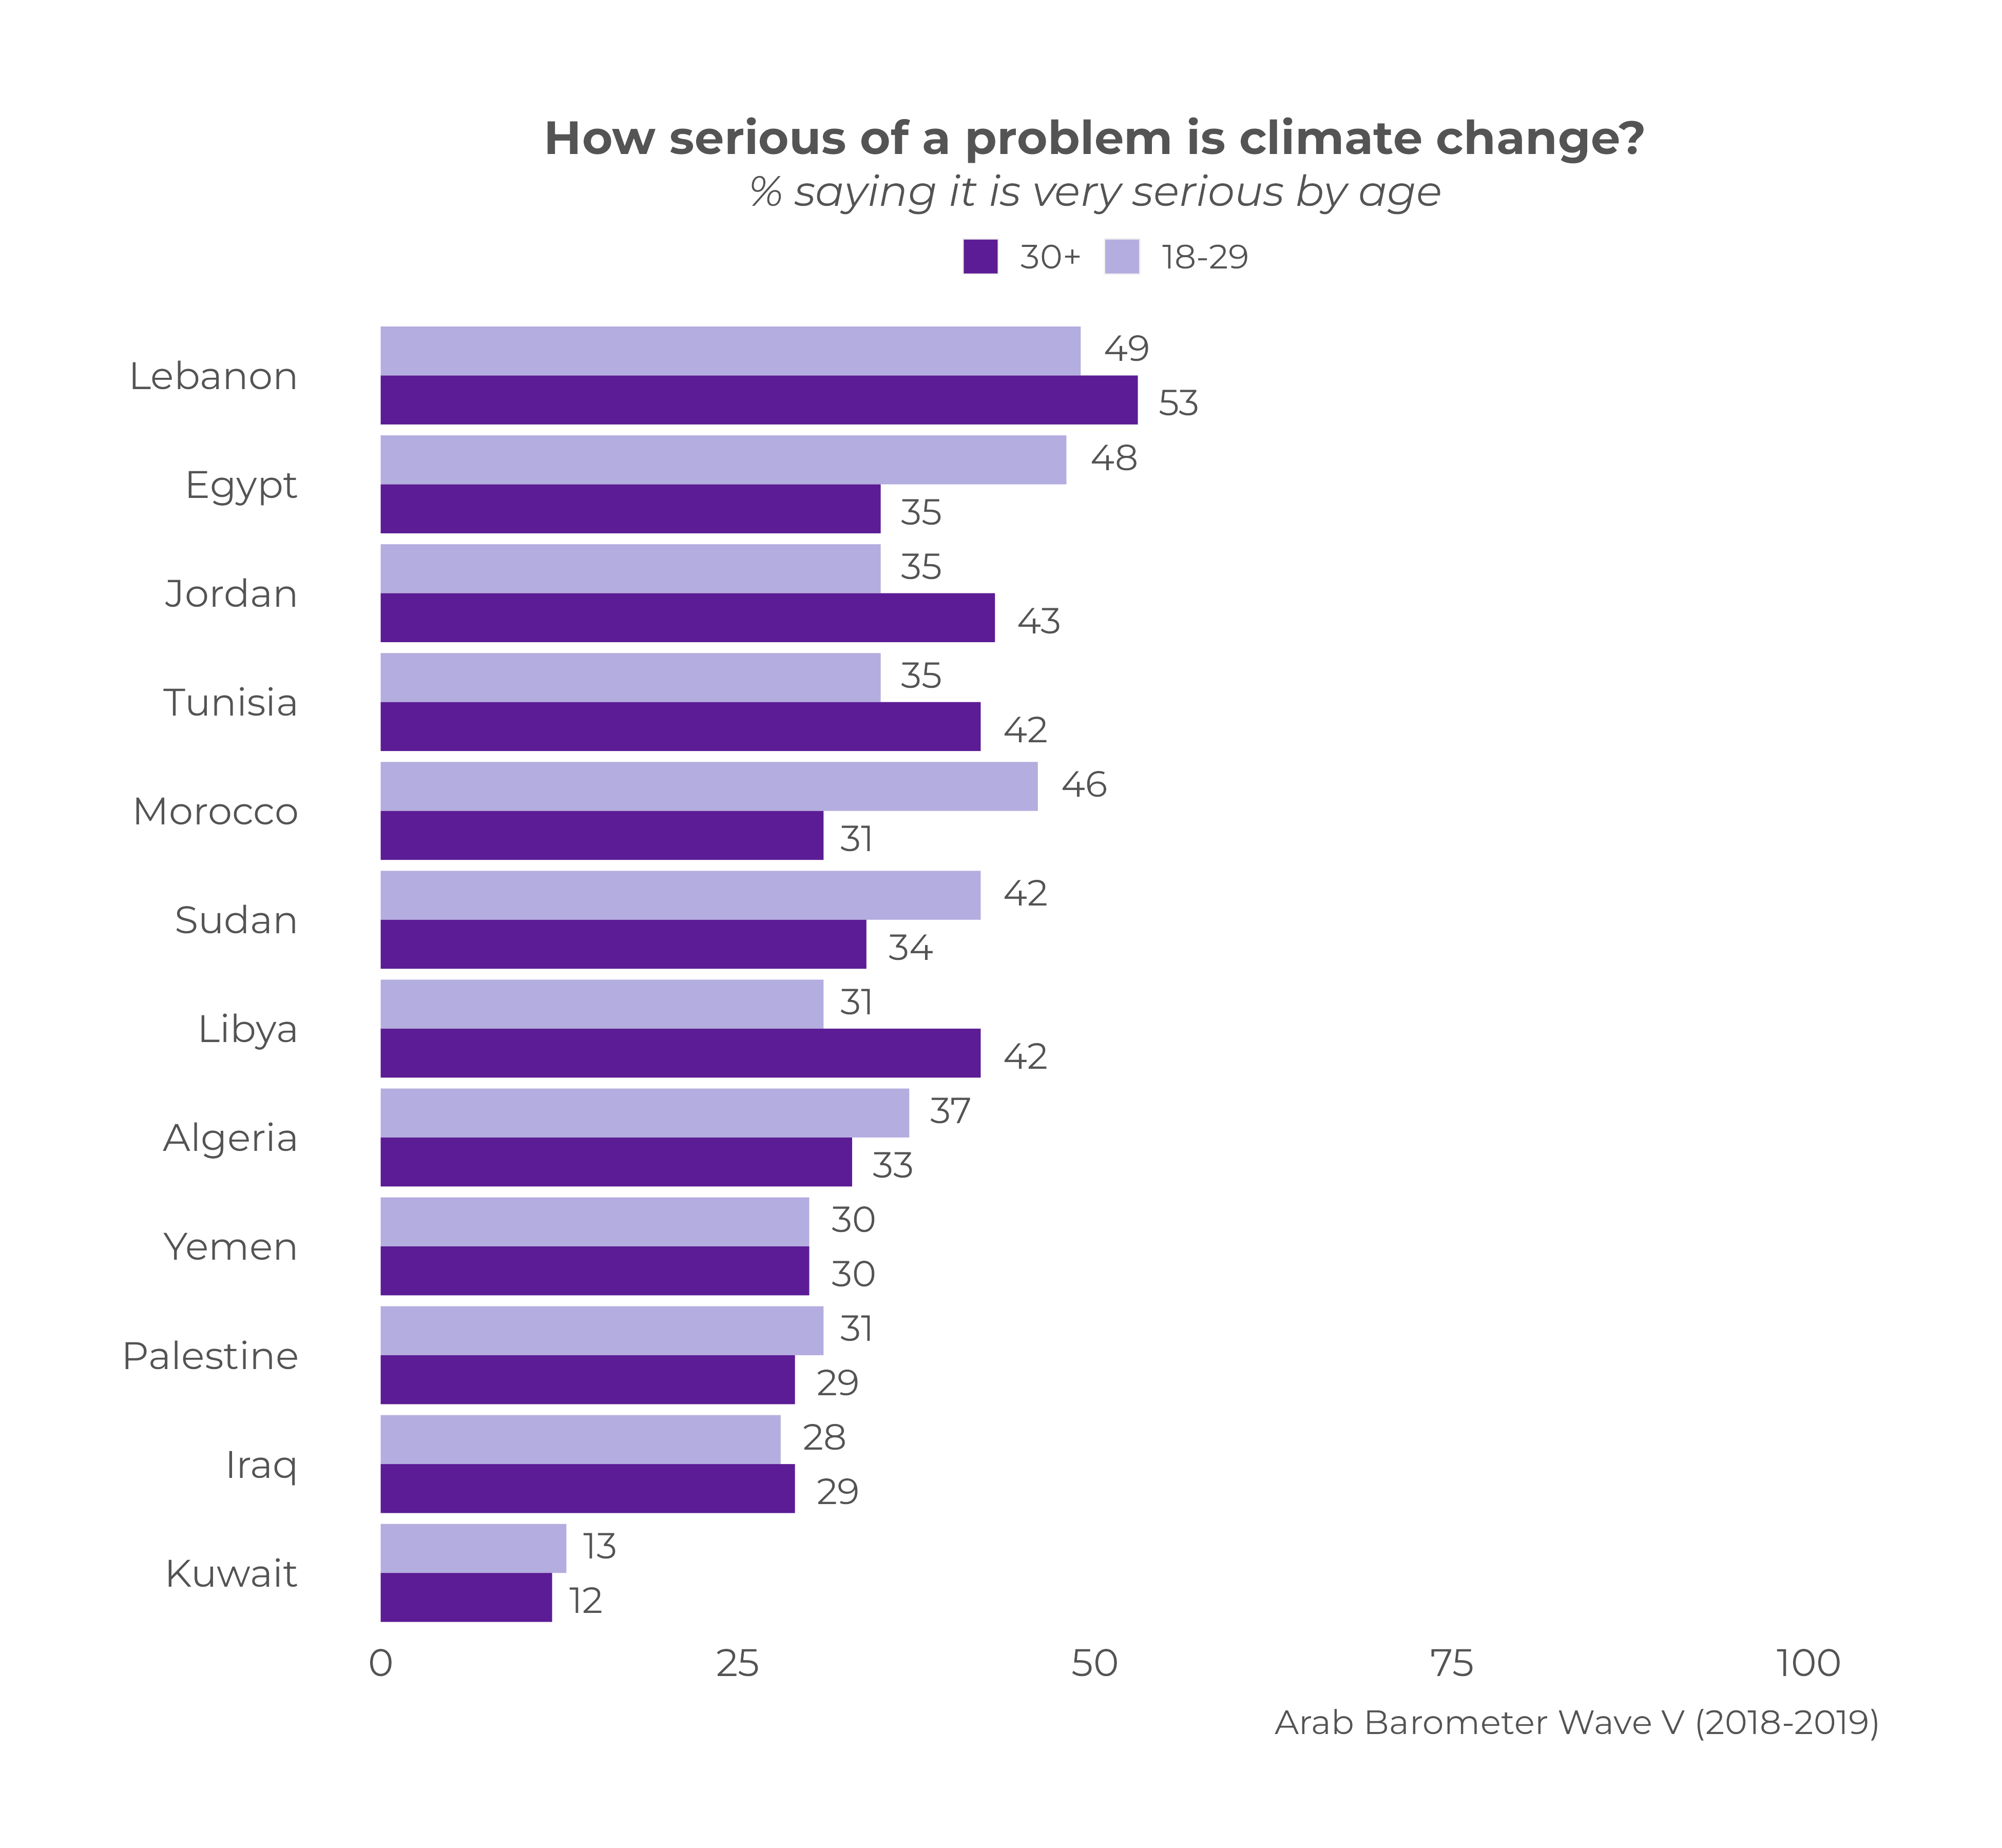
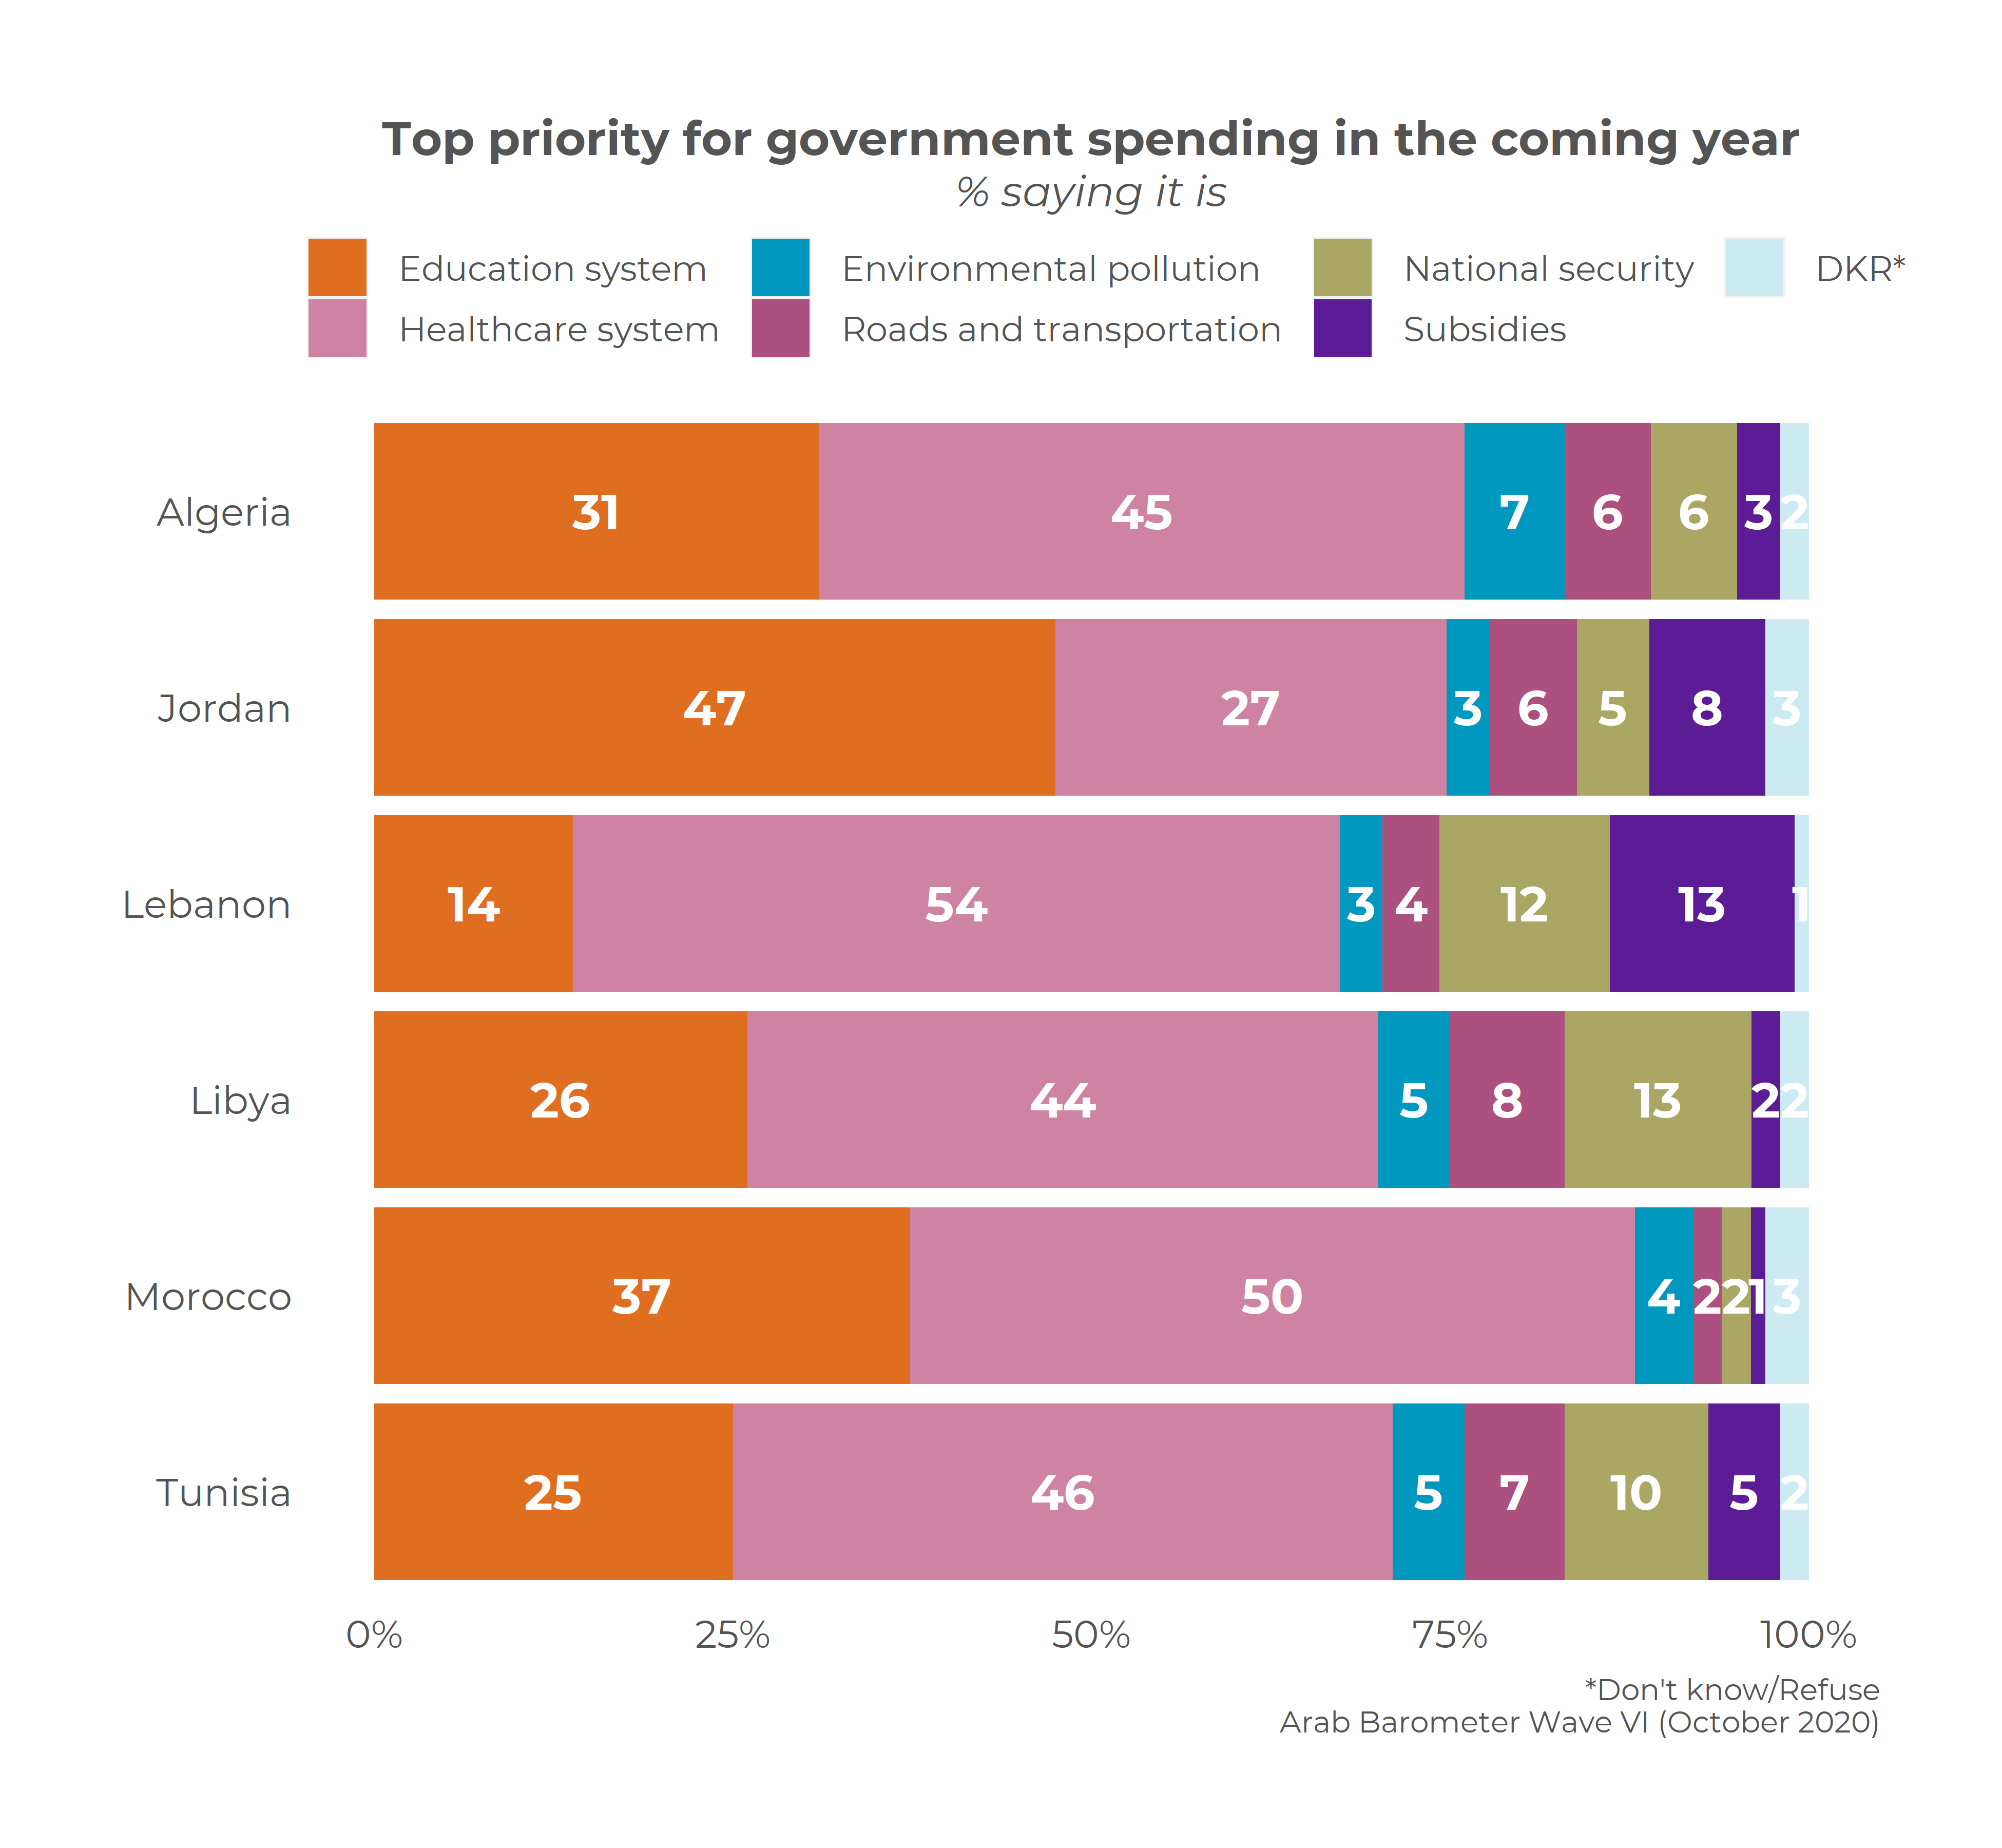
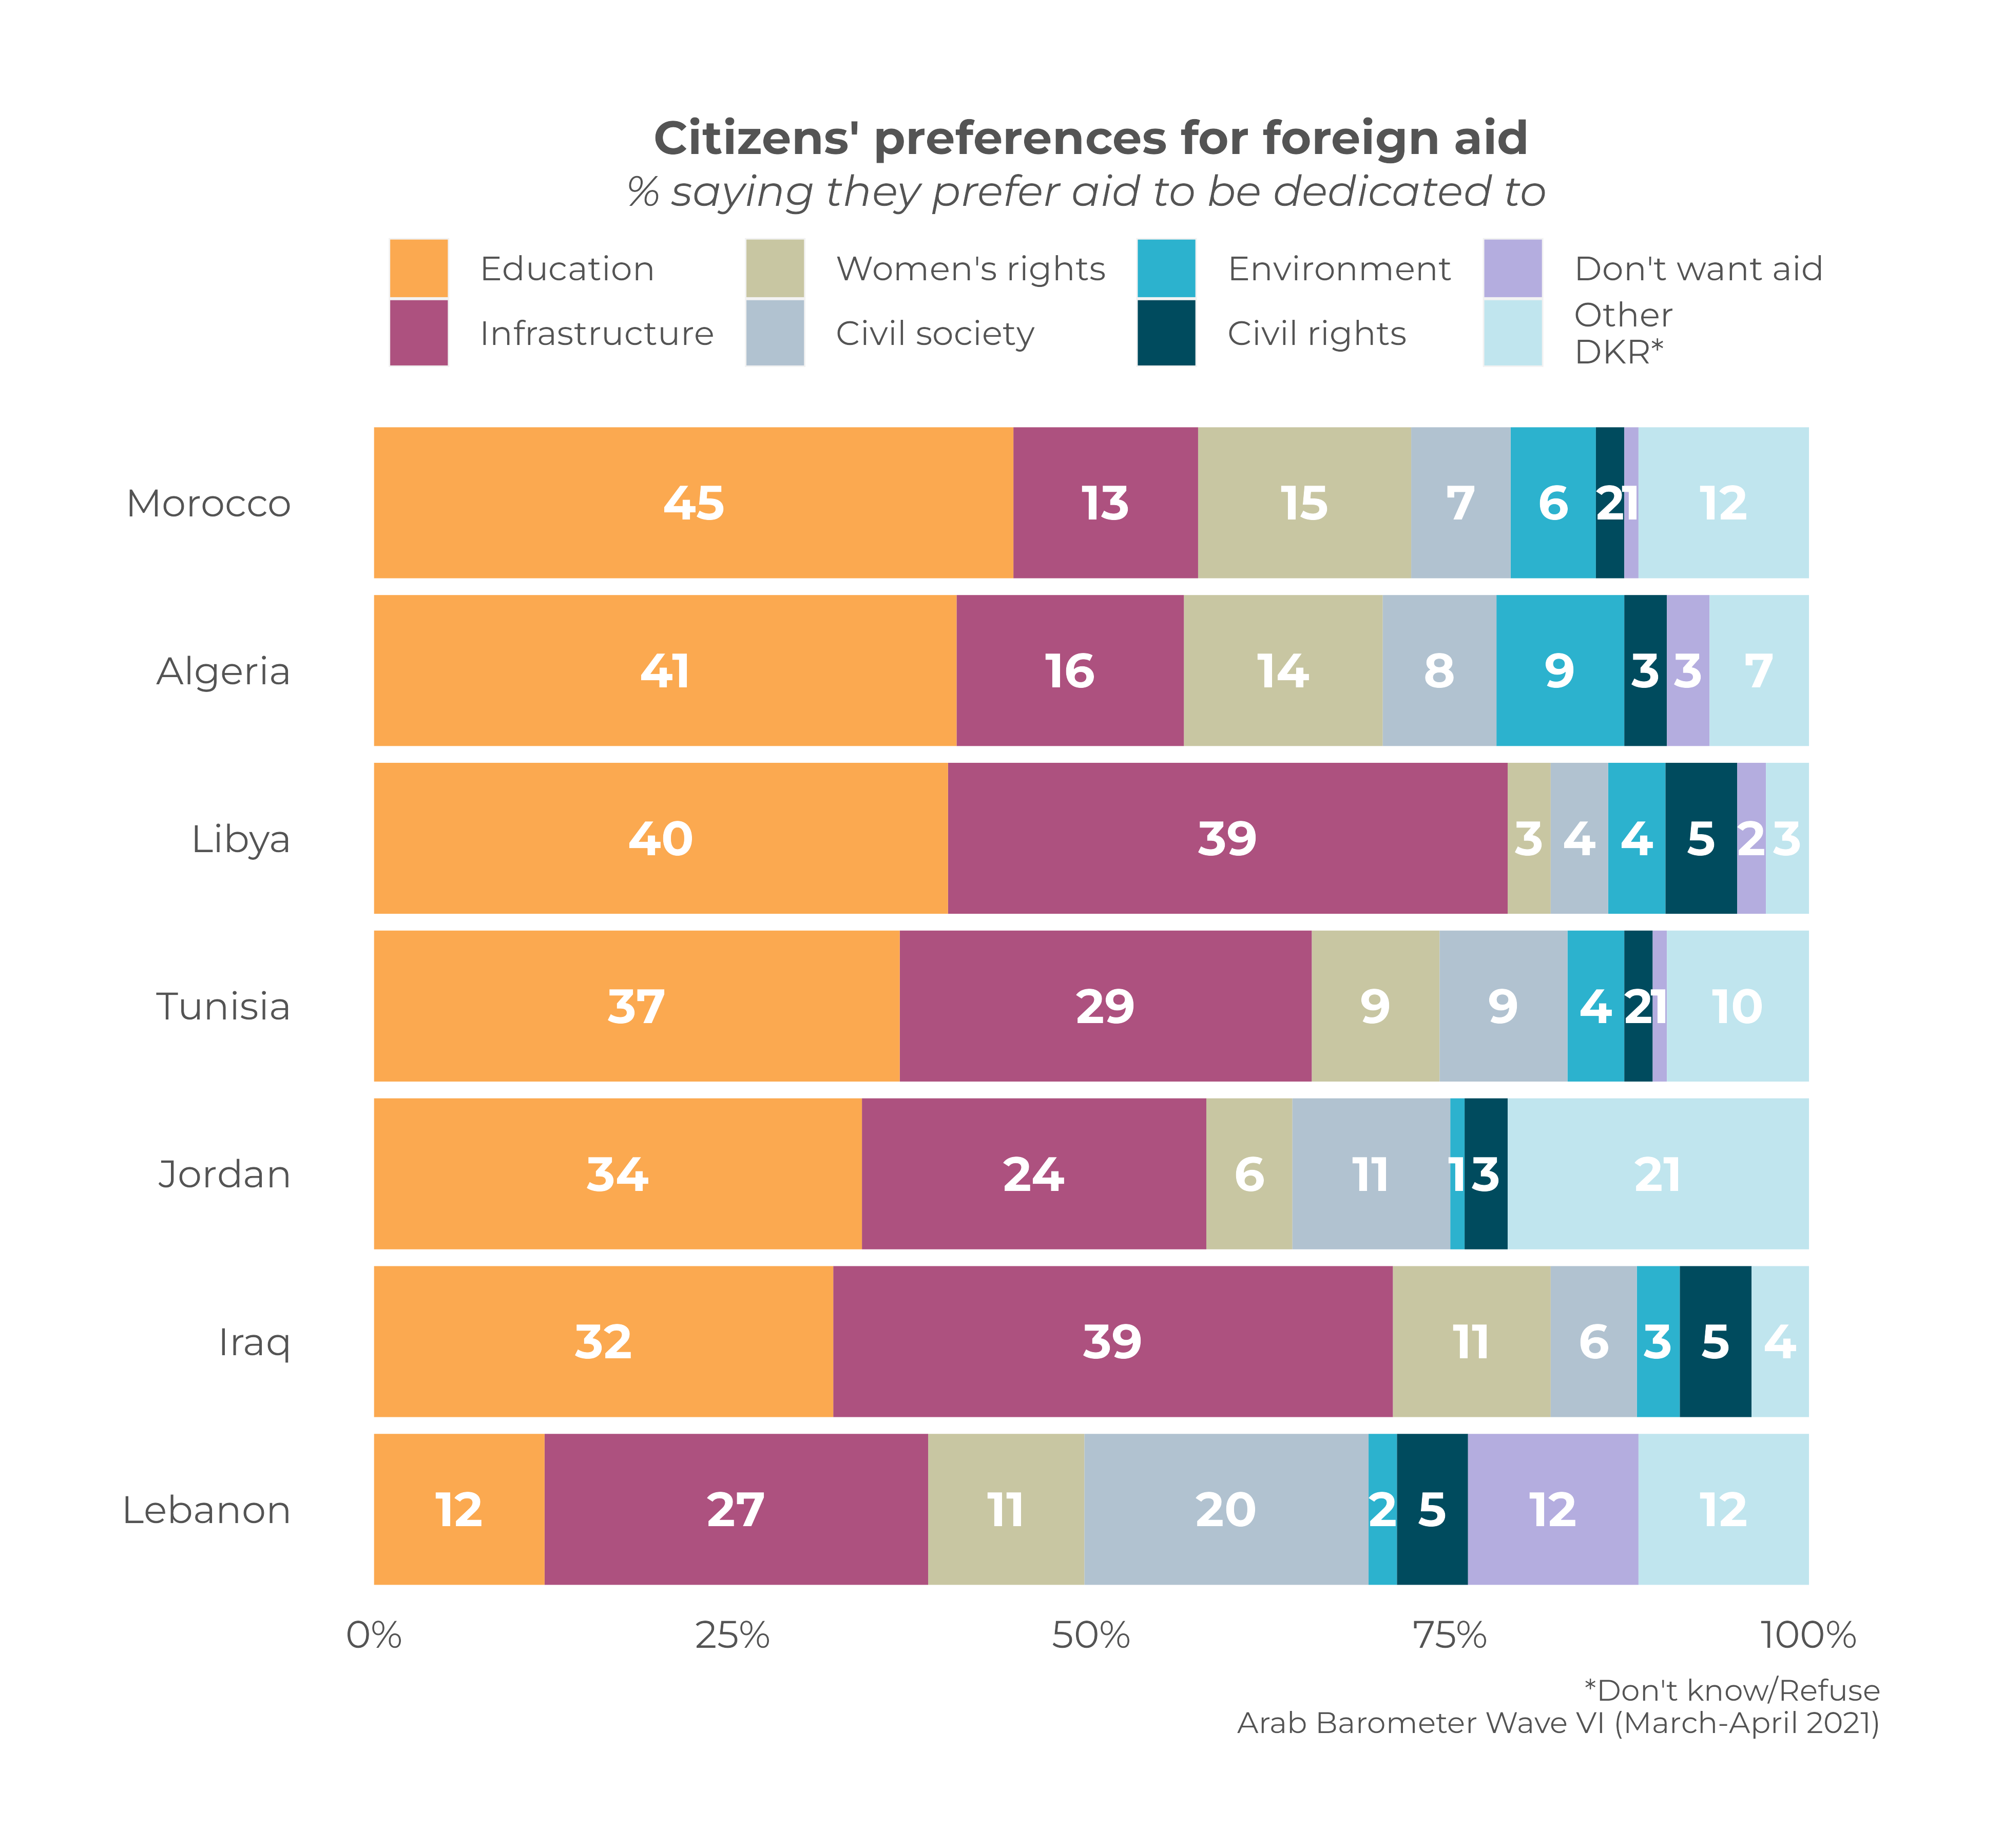
Countries Surveyed From 28 to 31 March 2022, the inaugural
Middle East and North Africa Climate Week 2022 in Dubai, UAE will bring
together key stakeholders to take the pulse of climate action in the region,
explore climate challenges and opportunities to build forward from the
pandemic and showcase ambitious solutions. Arab Barometer’s 2018-2019
wave of surveys found that citizens across MENA overwhelmingly regard water
pollution and trash as grave environmental concerns, while relatively fewer
citizens worry about air pollution and climate change. (Arabbarometer) March 24, 2022 Are Europeans In Favor Of Ukraine Joining The EU, A Study
In 4 Countries Regarding Ukraine joining the EU the
Spaniards are the most in favor of Ukraine's membership: 6 people out of 10
(60%) want the country to join the Union. Only 14% are against it. At
the same time, a relative majority of Germans (46%), Italians (45%) and French (42%) share this
opinion. Conversely, 30% of the citizens of each of these countries are
opposed to Ukraine's membership. (YouGov France) March 24, 2022 Source: https://fr.yougov.com/news/2022/03/24/les-europeens-favorables-adhesion-de-lukraine/ An Average Of 30% People Believe Most People Can Be Trusted
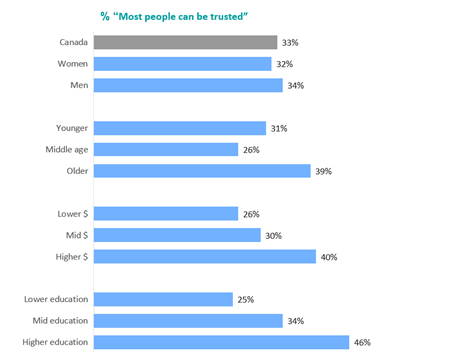
In 30 Countries Ipsos’ tracking of sense of Social Cohesion
(part of Ipsos Context Advantage Knowledge Suite) across 28 countries has
shown that societies have been becoming less cohesive over the past couple of
years. In Canada, only 33% of citizens believe that most people can be
trusted, against 67% who believe that you can’t be too careful dealing with
people, placing Canadians in the middle of the spectrum when compared to 29
other countries. Interpersonal trust is uniformly low across Latin America
and closer to the global average in North America. Levels vary widely across
countries within other regions: In Europe, from 48% in the Netherlands to
only 16% in Poland; and in the Asia-Pacific region, from 56% in China and
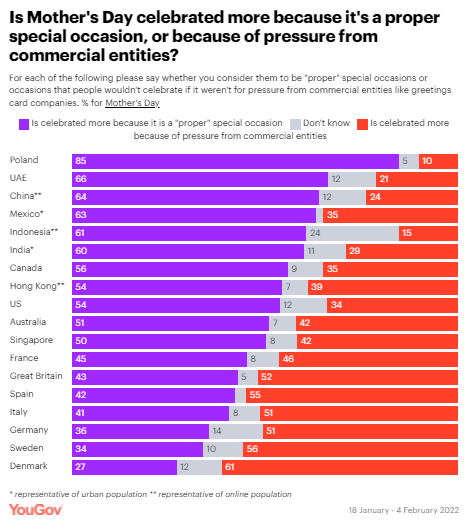
India to 13% in Malaysia. (Ipsos Canada) 24 March 2022 Is Mother’s Day A ‘Proper’ Special Occasion, Or Is It Too
Commercialized, A Survey In 18 Countries A new YouGov survey in 18 countries and
territories shows a mixed picture regarding Mother’s Day. We asked more than
19,000 people whether they thought Mother’s Day is celebrated more because it
is a ‘proper’ special occasion, or if it was an occasion that people wouldn’t
celebrate if it weren’t for pressure from commercial entities like greetings
card companies. Belief that Mother’s Day is still being celebrated as a
‘proper’ special occasion is generally lower in the West, and particularly in
Western Europe. Danes are the most cynical, with 61% saying they think that
entities like greeting card companies are the driving force behind the
celebration these days, compared to only 27% who disagree. (YouGov UK) March 26, 2022 ASIA
735-43-01/Polls Urban
Indians Are Worried About The Impact Of Russia- Ukraine Crisis On Their
Personal Lives
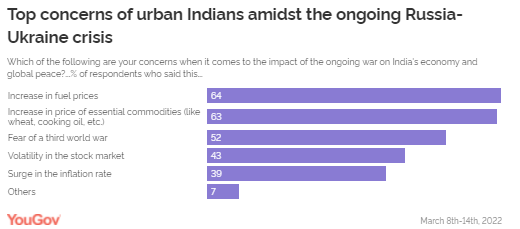
As the Russia-Ukraine crisis intensified,
YouGov’s latest data shows that nearly two-thirds of urban Indians (64%) feel
the ongoing crisis may have an impact on India’s economy leading to an
increase in fuel prices. Just about the same number (63%) think it will
increase the price of essential commodities. These issues are more concerning
to Gen X (70% for fuel prices and 61% for the cost of commodities) than their
younger counterparts.
Apart from this, half fear a third world
war (52%) while many foresee volatility in the stock market and a surge in
inflation rates (43% and 39%). Of those who cited an increase in fuel
price as a concern, more than a third (36%) of respondents said they might
consider taking public transportation instead of using their own vehicles if
there is a further increase in the fuel price. The older generation (42% of
GenX respondents) is more likely to take this step than millennials (33%) and
Gen Z (36%). While some are planning to switch/buy an EV
vehicle (11%) or start using two-wheelers instead of cars (10%), only a few
indicated that they would halt their plans of buying a new car (7%). The conflict between the countries has
stoked uncertainty in global trade, affecting the price of crude oil and
other commodities. While the direct impact on India will be limited, the
combination of supply disruptions and ongoing terms of trade shock is likely
to weigh on the economy, resulting in a sharper rise in inflation in the
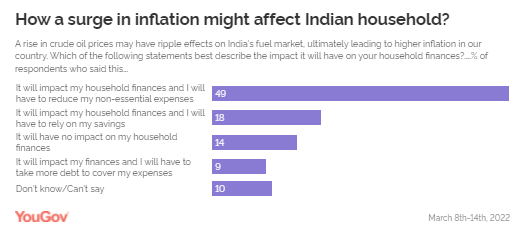
country. When asked about this, most urban Indians
think a rise in the inflation rate will impact their household finances and
they will either have to reduce their discretionary expenses (49%), rely on
their saving (18%) or take debt (9%) to cover their expenses. While residents
of West and North India are more likely to say that they will cut back on
their discretionary expenses, those in South India are most likely than
others to tap their savings or take out a loan to cover their expenses.
Only 14% of the total respondents indicated
that their household finances will not be impacted if the inflation rate in
India surges. Millennials are most likely to say this compared to the rest of
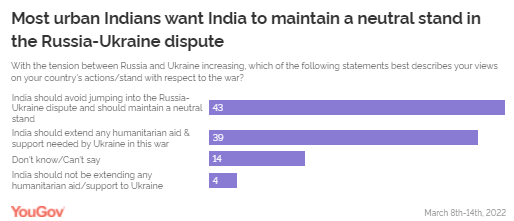
the population. When asked about their views on the crisis,
four in five (43%) want India to maintain a neutral stand in the
Russia-Ukraine dispute. Almost as many (38%), however, want the government to
offer humanitarian aid and support to Ukraine. Only a few (4%) think India
should refrain from providing any assistance.
While Indians have a mixed view about
offering help, a vast majority (63%) of urban Indians support India’s
abstention from UN General Assembly’s vote against Russian aggression. (YouGov India) March 22, 2022 Source: https://in.yougov.com/en-hi/news/2022/03/22/urban-indians-are-worried-about-impact-russia-ukra/ 735-43-02/Polls Most Feel
Positively About The Easing Of Covid-19 Curbs In Singapore, But One In Three
Are Concerned
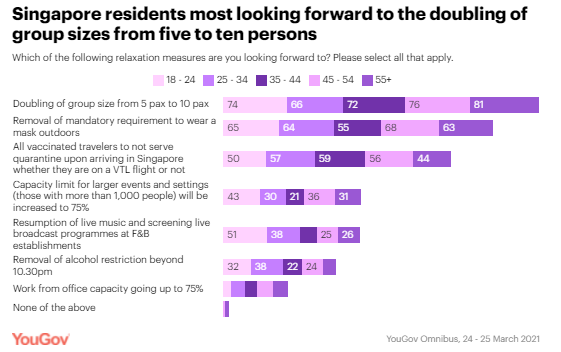
Following yesterday’s announcement on
the easing of community safe management
measures in Singapore,
latest data from YouGov Omnibus reveals that residents are most
anticipative of resuming larger-scale social gatherings, with seven in ten
(75%) looking forward to the increase in group sizes from five to ten persons
– a cap that has been in place since end-2021. In particular, those above the
age of 55 are significantly more likely to say they are looking forward to
the increased group sizes, with eight in ten expressing anticipation (81%). The removal of the mandatory requirement to
wear masks outdoors (63%) and reduction of quarantine rules for travel (51%)
also come up top in the minds of people here, with full-time working adults
most looking forward to the increased ease of travel (58%). Notably, young adults are especially
looking forward to the lifting of restrictions on alcohol and live
entertainment, with half of those aged 18-24 anticipating the resumption of
live music and screening of live broadcast programmes at F&B
establishments (51%), and four in ten of those aged 25-34 looking forward to
consuming alcohol beyond 10.30pm (38%).
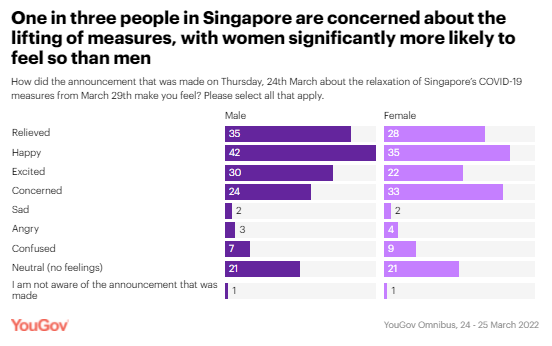
As for the general sentiment toward the
relaxation of measures, while one in four Singapore residents feel happy
about them (38%) and a third feel relieved (31%), a further third feel
concerned (29%). There is also some disparity in how men and
women feel about the issue, with men significantly more likely to express
positive sentiment of relief (35%), happiness (42%) and excitement (30%), and
women more likely to resonate with the negative sentiment of concern (33%).
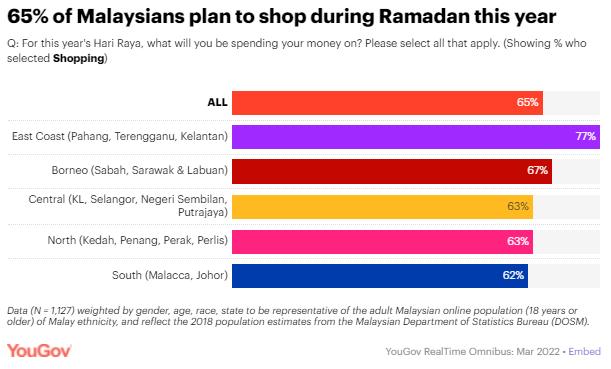
(YouGov Singapore) Source: https://sg.yougov.com/en-sg/news/2022/03/25/most-feel-positively-about-relaxation-covid-19-cur/ 735-43-03/Polls Around
Two-Thirds (65%) Of Malaysians Have Shopping Plans For Ramadan This Year
Latest research from YouGov RealTime Omnibus shows that around two-thirds (65%) of
Malaysians have shopping plans for Ramadan this year. Segmenting by region
reveals that Malaysians residing in the peninsula’s east coast (Pahang,
Terengganu, Kelantan) are more likely to have Ramadan shopping plans (77%),
compared to Malaysians residing in other regions.
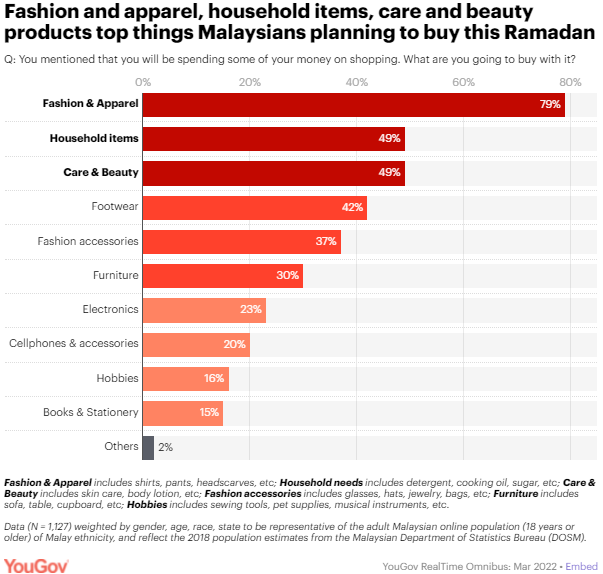
What are Malaysians planning to buy this
Ramadan? Among Malaysians planning to shop this
Ramadan, nearly four-fifths (79%) say they will buy clothes and apparel – in
line with the tradition of donning new clothes on Hari Raya Puasa/Aidilfitri
or Eid al-Fitr, a day after Ramadan. Almost half (49%) also intend to buy
household items – such as washing detergent and cooking oil – and personal
care / beauty products. Additionally, footwear is on the Ramadan
shopping lists of around two-fifths (42%) of Malaysians, followed by fashion
accessories (37%) – such as hats, jewelry and bags – and furniture (30%).
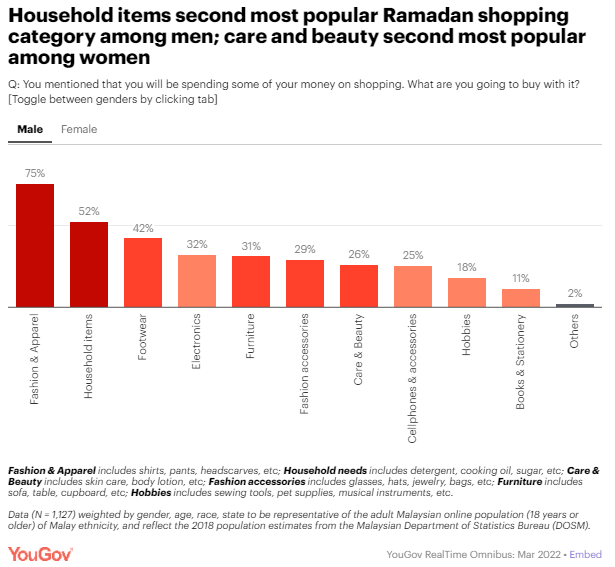
Across both genders, clothes and apparel
(male 75% vs female 81%) is the most popular category. Among men, household
items (52%) took second place, ahead of footwear (42%), with electronics
(32%) and furniture (31%) rounding out the top five. Among women, care / beauty products (61%)
took second place, ahead of household items (48%), with footwear (42%) and
fashion accessories (33%) rounding out the top five.
(YouGov Malaysia) March 25, 2022 Source: https://my.yougov.com/en-my/news/2022/03/25/malaysia-ramadan-shopping-trends-2022/ 735-43-04/Polls Community
Concern About Catching Coronavirus Seriously Decreases From 74% To 41%
However, the Level of Concern About
Catching the Coronavirus is Decreasing Significantly. Although half of the society thinks that
they will catch this virus, they are less worried about it now. According to
the research of Ipsos, 74% of individuals in the first month of the epidemic
stated that they were very worried about themselves or a member of their
family catching the corona virus, while the rate of individuals who are very
worried has decreased to 41% today.
In these days when we left the 2nd year
behind in the epidemic, 1 out of every 4 people think that they will not
catch the coronavirus While 56% of the society thought that they
would catch the epidemic in the first years of the epidemic, this rate
decreased by 10 points to 46% in the first year of the epidemic, and half of
the society thinks that they will catch this virus today. About one in four
people think that they will not be infected with this virus since the first
day of the epidemic.
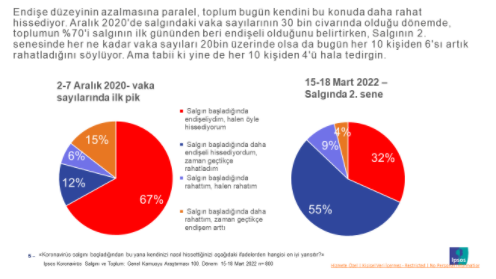
Parallel to Decreasing Anxiety Level,
Society Feels More Comfortable About the Epidemic Today In December 2020, when there was a serious
increase in the number of cases in the epidemic, 7 out of 10 people stated
that they have always been worried since the first day of the epidemic, while
the number of cases is still high today, the level of anxiety of individuals
has decreased considerably. Today, the proportion of individuals who have
been worried since the first day of the epidemic has decreased by half and
regressed to 32%. 55% of individuals state that while they were more worried
at the beginning of the epidemic, they felt more comfortable in this regard
today.
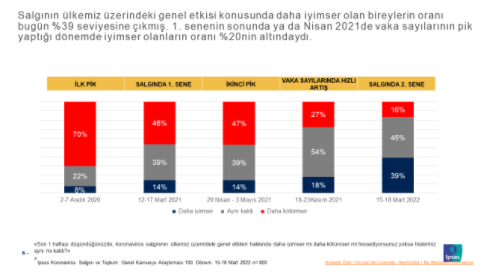
The number of people who are more
optimistic about the general effects of the epidemic on our country is
increasing. While 70% of the society thought that the
general impact of the coronavirus epidemic on our country would be more
negative in December 2020, when the epidemic first peaked, the number of
people who are pessimistic has decreased to 16% today. More than 4 out of 10
people are more optimistic about the impact of the epidemic.
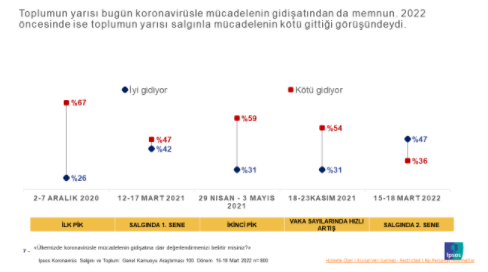
The Number of People Who Think the Fight
Against the Pandemic Is Going Well Is Also Increasing Until 2022, more than half of the society
thought that the fight against the epidemic was going badly. However, today 1
out of 3 people think that it is going bad. The rate of those who think that
the fight against the epidemic is going well has increased from 30% to 47%.
The decrease in the sense of anxiety in the
society and the serious risk perception of being in closed places are also
decreasing in parallel with the people's feeling more comfortable. Of course, as the epidemic continues, the
rate of people who think that it is risky to be in closed areas such as
shopping malls, cafes / restaurants, etc. is still high. However, the
decrease in the number of individuals who think they are particularly at risk
is remarkable. The rate of those who thought that being in crowded
environments was too risky at the beginning of the epidemic was 84%, but
today it has decreased to 53%. The rate of those who think that it is too
risky to eat in places such as cafes / restaurants is reduced by half.
Society Pays Less Attention to Mask
Distance Issue Now 82% of individuals think that other
individuals in the society do not comply with social distance today. In the
first days, the rate of those who were of this opinion was not very low
(67%). However, there is an opinion that everyone is more careful about
masks. While the rate of those who think that other people do not or rarely
wear masks in the first year of the epidemic was 20%, today this rate is 67%.
Sidar Gedik, CEO of Ipsos Turkey, made the
following evaluations about the data; Last week we talked about great relief.
The signs of this determination continue to come. The rate of those who think
that they will not catch the epidemic is increasing, there is a 10% decrease
in the rate of those who do not agree with this statement. The proportion of
those who are “very worried” that they or a member of their family will get
the disease has decreased by almost half. The rate of those who think that
the fight against the epidemic is going well is higher than those who do not
think so after a long time. The rate of those who said that the struggle is
going bad has decreased from 54% in November last year to 36% now. There is a
society that is increasingly relaxed about socialization. Being in crowded
environments meant "serious risk" for 80% of the population a year
ago, this rate dropped to 62% in November 2021 and to 53% last week. For one
in three citizens, going to the mall or eating at a cafe-restaurant still
represents a serious risk, but this rate was 70% last year and almost 50% in
November 2021. There is also relaxation in attention to social
distance and sensitivity to mask use. 1 year ago, there was an observation
that 3% of the people around did not wear masks at all, now this rate has
increased to 11%. With the warming of the weather, it seems that we will get
out of the epidemic psychology even more, especially towards the summer. I
hope the virus does not surprise us and the spring and summer months will be
lived with the enthusiasm of the pre-epidemic. (Ipsos Turkey) 21 March 2022 AFRICA
735-43-05/Polls Kenyans See
Government Failing On Their Top Priorities – The Economy And Corruption
Kenyans see the economy and corruption as
the most important problems facing the country, and most say the government is
doing a poor job on both, the latest Afrobarometer survey findings show. Management of the economy and corruption
top the list of problems that Kenyans want the government to address, ahead of
unemployment, health, and crime/security. But most survey respondents give the
government a failing grade on these priority issues. As the country gears up for elections in
August 2022, these findings suggest that the government’s ability to address economic
problems and corruption may be a key issue for voters. Key findings ▪ Management of economy tops the list
of important problems that Kenyans want their government to address, followed by
corruption, health, unemployment, and crime/security (Figure 1).
▪ Management of the economy climbed
from sixth place on citizens’ priority list in 2014- 2019 to the No. 1 spot in 2021. Corruption
has ranked as one of the top two priorities for the past six years (Table 1).
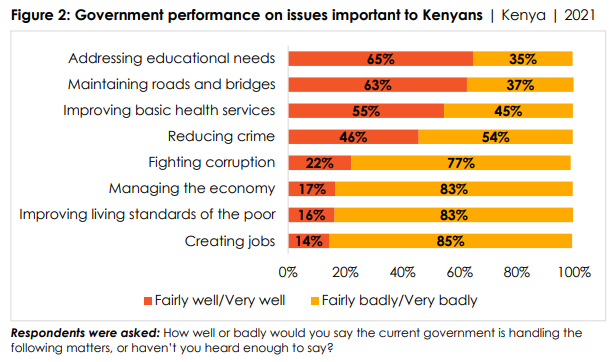
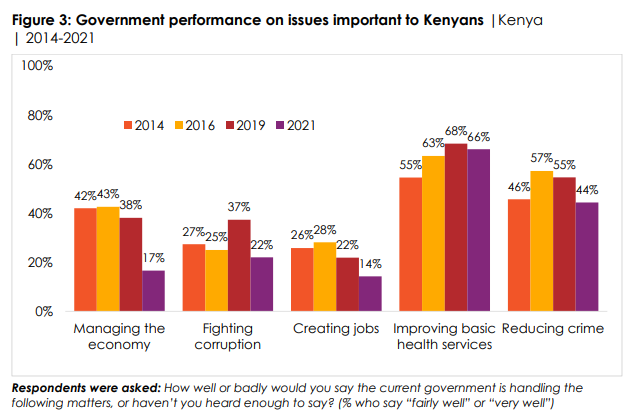
▪ Very few Kenyans say the government
is performing “fairly well” or “very well” on job creation (14%), improving living standards
of the poor (16%), managing the economy (17%), and fighting corruption (22%)
(Figure 2).
▪ Citizens’ ratings of the
government’s performance in addressing the economy, fighting corruption, and creating jobs have
declined sharply over the past six years (Figure 3).
(Afrobarometer) 25 March 2022 735-43-06/Polls More Than
Three-Fourths (78%) Of Kenyans Support Regular, Open, And Honest Elections As
The Best Way To Choose Leaders
More than three-fourths of Kenyans support
regular, open, and honest elections as the best way to choose leaders, the most recent
Afrobarometer survey shows. And most citizens favour the existence of
many political parties to ensure that voters have real choices in electing their
leaders. But fewer than half express trust in the
Independent Electoral and Boundaries Commission (IEBC), the body charged with
managing the country’s elections. As Kenyans approach the August 2022 general
elections, these perceptions are critical as they hold the key to the realization of
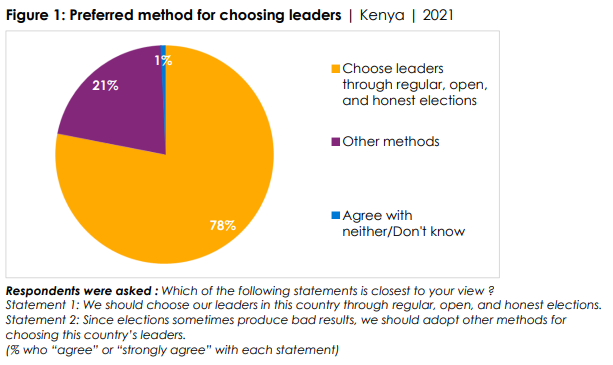
a peaceful electoral process that has eluded the country for several electoral cycles. Key findings ▪ More than three-fourths (78%) of
Kenyans support regular, open, and honest elections as the best way to choose leaders (Figure 1).
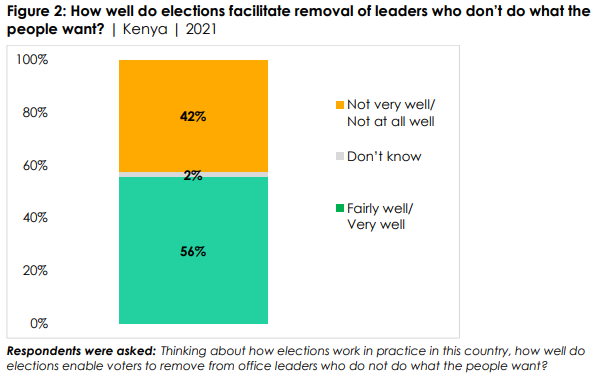
o A weaker majority (56%) believe that
elections work well in enabling voters to remove leaders who don’t do what the people
want (Figure 2).
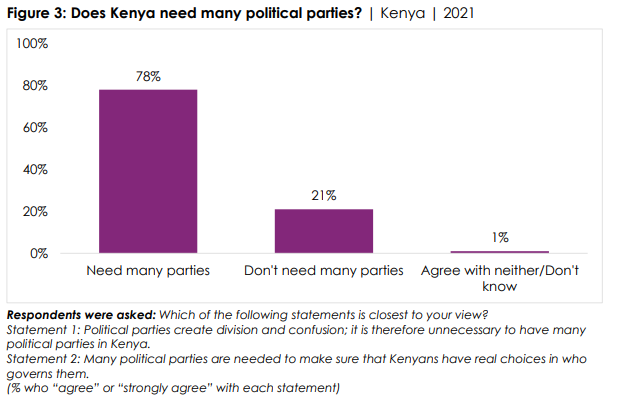
▪ A large majority (78%) say Kenya
needs many political parties to ensure that voters have a real choice when electing their
leaders (Figure 3).
▪ Fewer than one in four Kenyans
(23%) say the 2017 election was “completely free and fair,” while another 31% consider it
“free and fair with minor problems.” More than four in 10 (42%) say the election was
either “free and fair with major problems” or “not free and fair” (Figure 4).
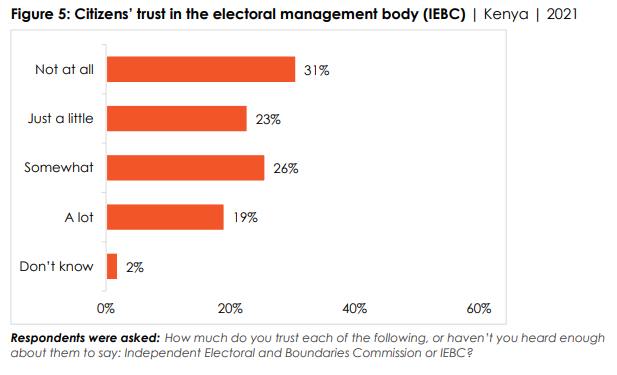
▪ More than half of Kenyans say they
trust the IEBC “just a little” (23%) or “not at all” (31%) (Figure 5).
(Afrobarometer) 25 March 2022 WEST
EUROPE
735-43-07/Polls Just 31% Of Britons Think The Government Is Doing The Right Amount To
Help Ukrainians Come To The UK
The government’s ‘Homes for Ukraine’ scheme has already been met
with criticism as
those willing to host Ukrainian refugees struggle with a “chaotic” visa
system and further delays. Concerns have also been raised over a lack
of organisation and support for those hosting refugees, while others
are worried the scheme is open to exploitation
by traffickers. This comes amid general disappointment with the
government’s handling of the Ukrainian refugee crisis thus far, with many
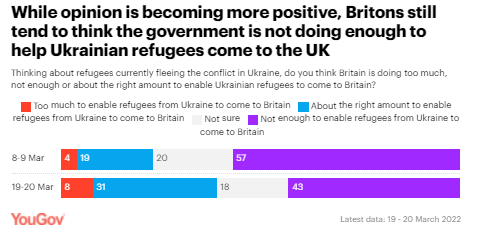
calling on the government to step up its efforts. New YouGov research shows Britons remain broadly of the opinion the
government is not doing enough to help those trying to reach the UK from
Ukraine, although opinion has shifted in recent days. Two-fifths of Britons (43%) now think the government is not doing
enough to enable refugees from Ukraine to come to the UK. However, this is
down 14 points since 8-9 March, with this previous survey conducted before
the Homes for Ukraine scheme announcement. The proportion of those thinking the government is doing about the
right amount to help Ukrainians come to the UK is up 12 points, from 19% to
31%.
Six in ten Labour voters (62%) think that the government is not doing
enough to assist Ukrainians coming to the UK, versus 18% who think they are
doing about the right amount. Elsewhere, Conservative voters tend to think
the government is doing the right amount (50%), although 29% want the
government to do more. YouGov's research also shows that Britons generally want Ukrainians
to be able to come to the UK more easily. However, this is split between 33%
(-6 since the previous poll) who think it should be easier for all Ukrainians
to come to the UK, and 39% (no change) who think eased restrictions should
only apply to those with family already here. Another 13% of Britons (+2) think that no Ukrainians should get
special treatment in seeking refugee status in the UK. Labour voters tend to favour making special provisions for all
Ukrainians (47%) rather than just those with family here (32%). Conservative
voters think the process should only be made easier for Ukrainians with
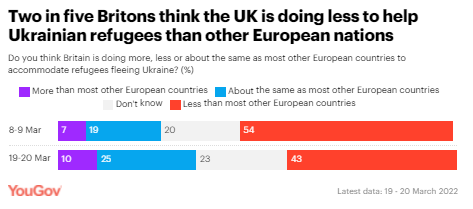
familial connections in the UK (51%) rather than all of them (23%). Britain is seen as doing less to help
Ukrainian refugees than its European allies Britain has granted visas to around 10,000 Ukrainians since the
conflict began. Meanwhile, Poland is taking in five
times that number of refugees per day – with over two million
Ukrainians now believed to be sheltering there. This disparity is not lost on the public – 43% think the UK is doing
less than other European nations to accommodate refugees. While that
proportion is down 11pts on the previous survey, those who think the UK is
doing about the same amount as other nations stands at only 25% (+6). One in
ten Britons (+3) think the UK is doing more than other European countries.
Labour voters are clear in thinking other nations on the continent
are doing more than us (62%) to help Ukrainians fleeing the war. Conservative
voters are split between 35% who think the UK’s efforts are on par with its
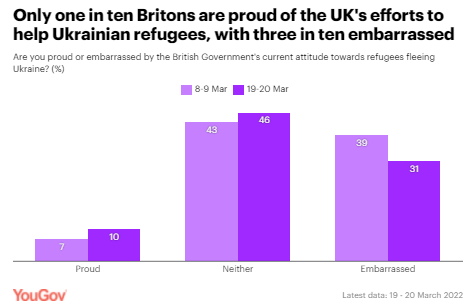
allies, and 32% who think we are doing less than they are. Ultimately, just one in ten Britons (+3) are proud of the
government’s current attitude towards refugees fleeing Ukraine. Three times
as many Britons (31%, -8) are embarrassed of the government’s efforts. A
further 46% (+3) are neither proud nor embarrassed. Half of Labour voters (51%) say they are embarrassed by the
government's attitude to the situation, with only 6% proud of it.
Conservative voters are not as likely to say they are embarrassed (16%), but
aren't proud overall either (19%), with most instead being ambivalent (59%).
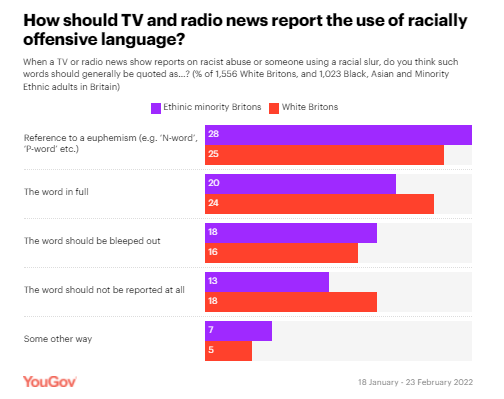
(YouGov UK) March 24, 2022 735-43-08/Polls How Should Journalists Report Racially Offensive Language
The BBC came under fire in 2020 after using a racial slur in full as
part of a report into a racially-aggravated attack in Bristol. The
victim's family supported the BBC using the word to convey the seriousness of
the assault. However, for its efforts, the BBC earned over 18,000 direct and
384 Ofcom complaints. Now, new YouGov research among ethnic minority Britons looks at how
people think racial slurs should be quoted in written and broadcast news
media. While all broadcast outlets will have differing editorial guidelines,
ethnic minority Britons tend to think slurs should be quoted as a euphemism,
using such phrases as "the N-word" or “P-word” (28%) in TV and
radio news. At the other end of the scale, 20% think television and radio
reporters should use the language in full, without any sort of censorship or
alteration.
A similar number of ethnic minority Britons (18%) think racial slurs
should be bleeped out of broadcast reports. Another 13% say such words should
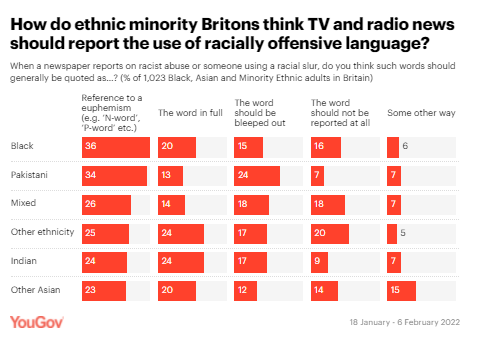
not be reported at all. Britons of Indian descent split on how broadcast news should quote
slurs, 24% to 24% between using the word in full or a euphemism. Those from
Pakistani backgrounds tend to think slurs should be replaced with euphemisms
(34%), and 24% bleeped out.
Black Britons also tend to think euphemisms should be used to quote
racial slurs (36%), while one in five (20%) say using the word in full is the
right way to go and 15% would prefer it bleeped out. Another 16% think slurs
should not be quoted at all. Comparing the attitudes of ethnic minority Britons against those of
white Britons shows similar attitudes, with some small exceptions. A quarter
of white Britons (25%) think these quotes should be represented with
euphemisms, and another 24% think they should be used in full. The biggest
difference comes among those who think these words should not be reported at
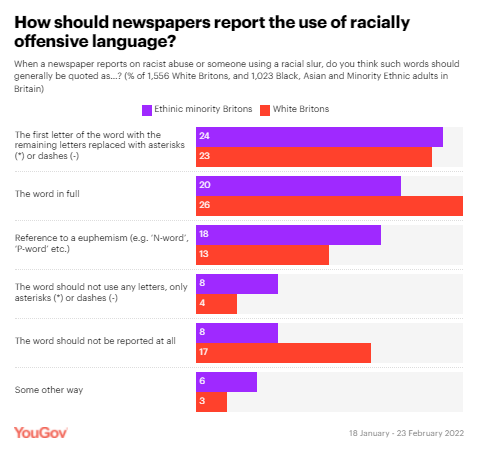
all (18%, versus 13% of ethnic minority Britons). Should newspapers quote racially offensive
language? In 2015, the New York Times faced a
similar dilemma to the BBC. In a podcast highlighting how slavery
still casts a long shadow on life in the US, then-president Barack Obama had
used the N-word – so should they quote it in full? Editors ultimately decided
to print the word in their report to not detract from the president's
message. Approaching one in four ethnic minority Britons (24%) think written
news should report slurs using the initial letter and symbols such as dashes
or asterisks. Another 20% think newspapers should in general not censor these words
and report them fully, the same proportion as those who think broadcast news
should report it in full.
A slightly smaller proportion (18% of ethnic minority Britons) think
written news reports should use euphemisms like ‘the N-word’. An additional
one in twelve (8%) think the word should be censored entirely with symbols,
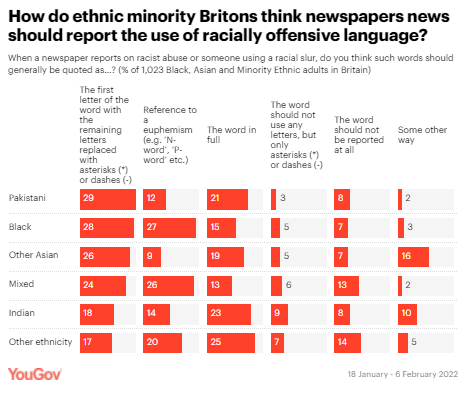
while an identical proportion think the word should not be reported at all. Black Britons are split 28% to 27% whether news outlets should use
the first letter and symbols or a euphemism. People from Indian backgrounds
tend to think quotes should use slurs in full (23%). However, 18% say they
should replace it with the first letter and symbols, while 14% say euphemisms
instead.
One difference between ethnic minority Britons and white Britons is
that the latter are more likely to think newspapers should print slurs in
full (26%, versus 20% of ethnic minority Britons). Further to this, white
Britons are also more likely to think racial slurs should not be printed at
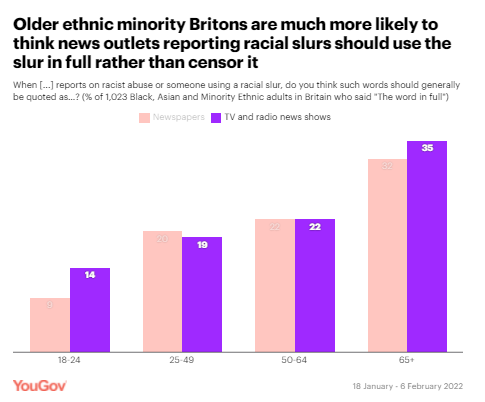
all (17% versus 8%). Older ethnic minority Britons are the most
likely to think media should quote racial slurs without censorship Among ethnic minority Britons, older generations tend to think TV and
radio should report racially offensive language in full. Indeed, those aged
65 and over are more than twice as likely to think TV and radio reports
should quote racial slurs in full (35%) as those aged between 18 and 24
(14%). As with broadcast reports, three in ten ethnic minority people aged
65 and over (32%) think the slurs should be shown unaltered, compared to only
9% of those aged 18 to 24. This younger age bracket splits between thinking
they should quote them as letters and symbols (30%) or euphemisms (25%).
(YouGov UK) March 21, 2022 735-43-09/Polls Two Years Of Life Under Lockdown - How Has The UK And People's Lives
Changed
New research by Ipsos and the Policy
Institute at King’s College London finds that 3 in 10 UK adults
(31%) say they are feeling lonelier now than before the pandemic (58% report
no change). Alongside this, nearly half think they see friends and family
less (46%) and leave the house less (45%) than before the pandemic
began. Four in ten 16-34 year olds (39%) say they feel more lonely than
before the pandemic started about two years ago. The new study, the latest in a series that has tracked opinion since
April 2020, does find though that across many of these aspects of people’s
lives, a large proportion (usually slightly more or less than half) say there
has been no change now compared with before the pandemic. Participants
were also asked to report all changes – whether or not they felt they had
been caused by the pandemic. A third of Brits believe that their physical (32%) and mental (33%)
health has got worse (half in each case say it is about the same). The
youngest (16-34) are most likely to feel that their mental health has
deteriorated during the pandemic, with 42% saying it had, though one in four
(23%) said that it had improved. Women are also more likely than men to
feel their mental health is now worse (by 38% to 28%). About a third (36%) think they have put on weight compared with
before the pandemic – although almost as many (30%) say they are exercising
more. 50% of Britons say they are spending more time looking at screens
than before the pandemic. And just over two in five of those aged 16-75 (46%)
say they check social media at least once a day for news about the pandemic
including 7% saying they check hourly (though this is down from 56% checking
social media daily for information about the coronavirus at the start of the
first lockdown in April 2020). Overall, a quarter (27%) say their
ability to concentrate is worse than before the pandemic (58% say no change),
rising to 38% of younger people (though 24% of 16-34s also say this has
improved). When it comes to sleep, overall around a third (32%) say the overall
quality of their sleep has got worse (53% no change). The most common
changes in people’s sleeping patterns are more disturbed sleep (25%) or sleeping
fewer hours (20%). The state of the pandemic
Government handling of the pandemic The public are more positive about the UK government’s handling of
the pandemic now than at earlier points in the pandemic. 54% of those aged
16-75 believe that the UK government’s response to the pandemic has been
confused and inconsistent, but that has declined since 2020 and particularly
fallen since the second lockdown in November 2020 when two-thirds (68%) said
that was the case. On the other hand 38% believe that the government has responded well
to changing scientific advice (up from 27% in November 2020), while 28% say
they have not. And when comparing our government to others, 42% of 16-75
year-olds say the UK government has responded well to the pandemic compared
to other countries (up from 28% in July 2020), with 27% disagreeing. On balance, UK adults think that advice from scientists and experts has
been good during the pandemic and that government has used it effectively.
Only one in five (21%) believe that scientists and medical experts have given
the government poor advice during the pandemic while 46% disagree. Four in
ten (43%) believe that the UK government has made good use of that advice
while 28% do not. Perceptions of the NHS A majority believe that a range of the NHS services have got worse
since before the pandemic began, but they also tend to think that this is at
least partly because of the pandemic. Britons believe that the following services have got worse since
before the pandemic began:
But amongst those who think things have got worse, half or more tend
to believe that this is at least mostly because of the pandemic rather than
other reasons:
Gideon Skinner, Research Director at Ipsos said: These findings, marking the two-year
anniversary of the first national lockdown, are further evidence of how over
that time life in the UK has changed for many people, affecting a range of
aspects of our physical and mental health. Although we shouldn’t
overestimate this (more people think there has been no impact, and some of
these changes may have happened naturally without the pandemic), it is
notable that it is often younger generations who feel harder hit. This
all suggests that most Britons are right to feel that the after-effects of
the coronavirus are not over yet. Professor Bobby Duffy, director of the
Policy Institute at King’s College London, said: The effects of the pandemic and the measures
to control it are still keenly felt by significant proportions of the UK
population – with a third of us saying we’re lonelier and sleeping less well,
nearly half of us seeing our friends less and leaving home less, and half
spending more time on our screens. It’s no surprise then that a third of us
feel our mental or physical health is worse. And, as with so much in the
pandemic, some groups are feeling the effects more, with the young and women
more likely to experience many of these negative impacts. We’re also deeply
worried about the impact on the NHS, particularly waiting times and how the
pandemic has affected the wellbeing of NHS staff. (Ipsos MORI) 23 March 2022 Source: https://www.ipsos.com/en-uk/two-years-of-life-under-lockdown-how-has-uk-and-peoples-lives-changed 735-43-10/Polls The Passion Of The French For Video Games Is Undeniable
Console, PC Gaming and mobile: the 3
ecosystems achieved solid performances.
“ Video gaming continues to
progress to new heights. The year 2020 had been extraordinary, but
special because of the context. This growth confirmed in 2021 is part of
a real underlying trend. The French have never played so much. 73%
of them play occasionally and 58% regularly, an increase of 6 points compared
to 2020 , ” comments
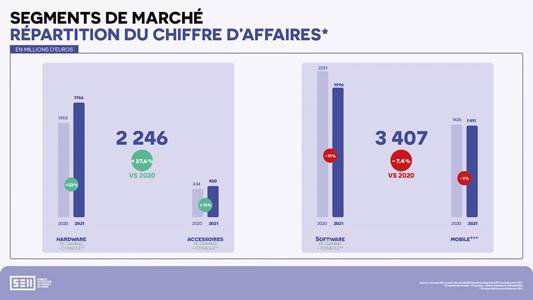
Julie Chalmette, President of SELL. A 2021 market boosted by Hardware sales With the arrival of new consoles and a strong dynamism of PC Gaming,
the 2021 video game market is driven by the growth of Hardware (Console + PC
Gaming) which reached a historic turnover of 1.766 billion euros, i.e. +22%
growth compared to 2020. With 795 million euros generated, the console
hardware segment recorded its best performance since 2010 (€873 million) with
growth of +17%. This even though the supply difficulties in 2021 did not
allow manufacturers to meet the strong demand. Console hardware
therefore benefits from a large reservoir of growth. This should
therefore continue in 2022 and affect the entire sector. The video game
market, whose model is cyclical,
A slight decline in software expected Software (Console + PC / Physical + dematerialized) posted solid
performance, with revenue of 1.996 billion euros, down -11% compared to 2020,
a historically strong year due to the unprecedented context and the very rich
news of the sector. Excluding mobile, nearly 24 million complete games
were sold in France in 2021 (Console + PC), in physical or digital format,
i.e. a drop in volume of -14% compared to 2020: 91% of these complete games
were sold on console, and 58% in physical format. After a year 2021 marked by launch delays, the 2022 market looks very
positive with the launch of many highly anticipated games. (Ipsos France) March 24, 2022 Source: https://www.ipsos.com/fr-fr/la-passion-des-francais-pour-le-jeu-video-ne-se-dement-pas 735-43-11/Polls Every Fifth Person In Germany Has Felt Racially Discriminated Against
Today, March 21st, is the annual International Day Against
Racism. Racism is not only a much-discussed, socially relevant topic in
Germany. 19 percent of all respondents in Germany state that they have
had the feeling of being racially discriminated against. Among people
who are exclusively German nationals, 13 percent say so. On the other
hand, 46 percent of those surveyed in Germany who are not of German
nationality say so.
These are the results of current surveys by the international Data
& Analytics Group YouGov and LINK Marketing Services AG, which belongs to
the YouGov Group, for which 2,082 people in Germany from March 8th to 10th,
2022 and 1,220 people in Switzerland from March 7th to 11th March 2022 were
surveyed using standardized online interviews. The results were weighted
and are representative of the German population aged 18 and over and the
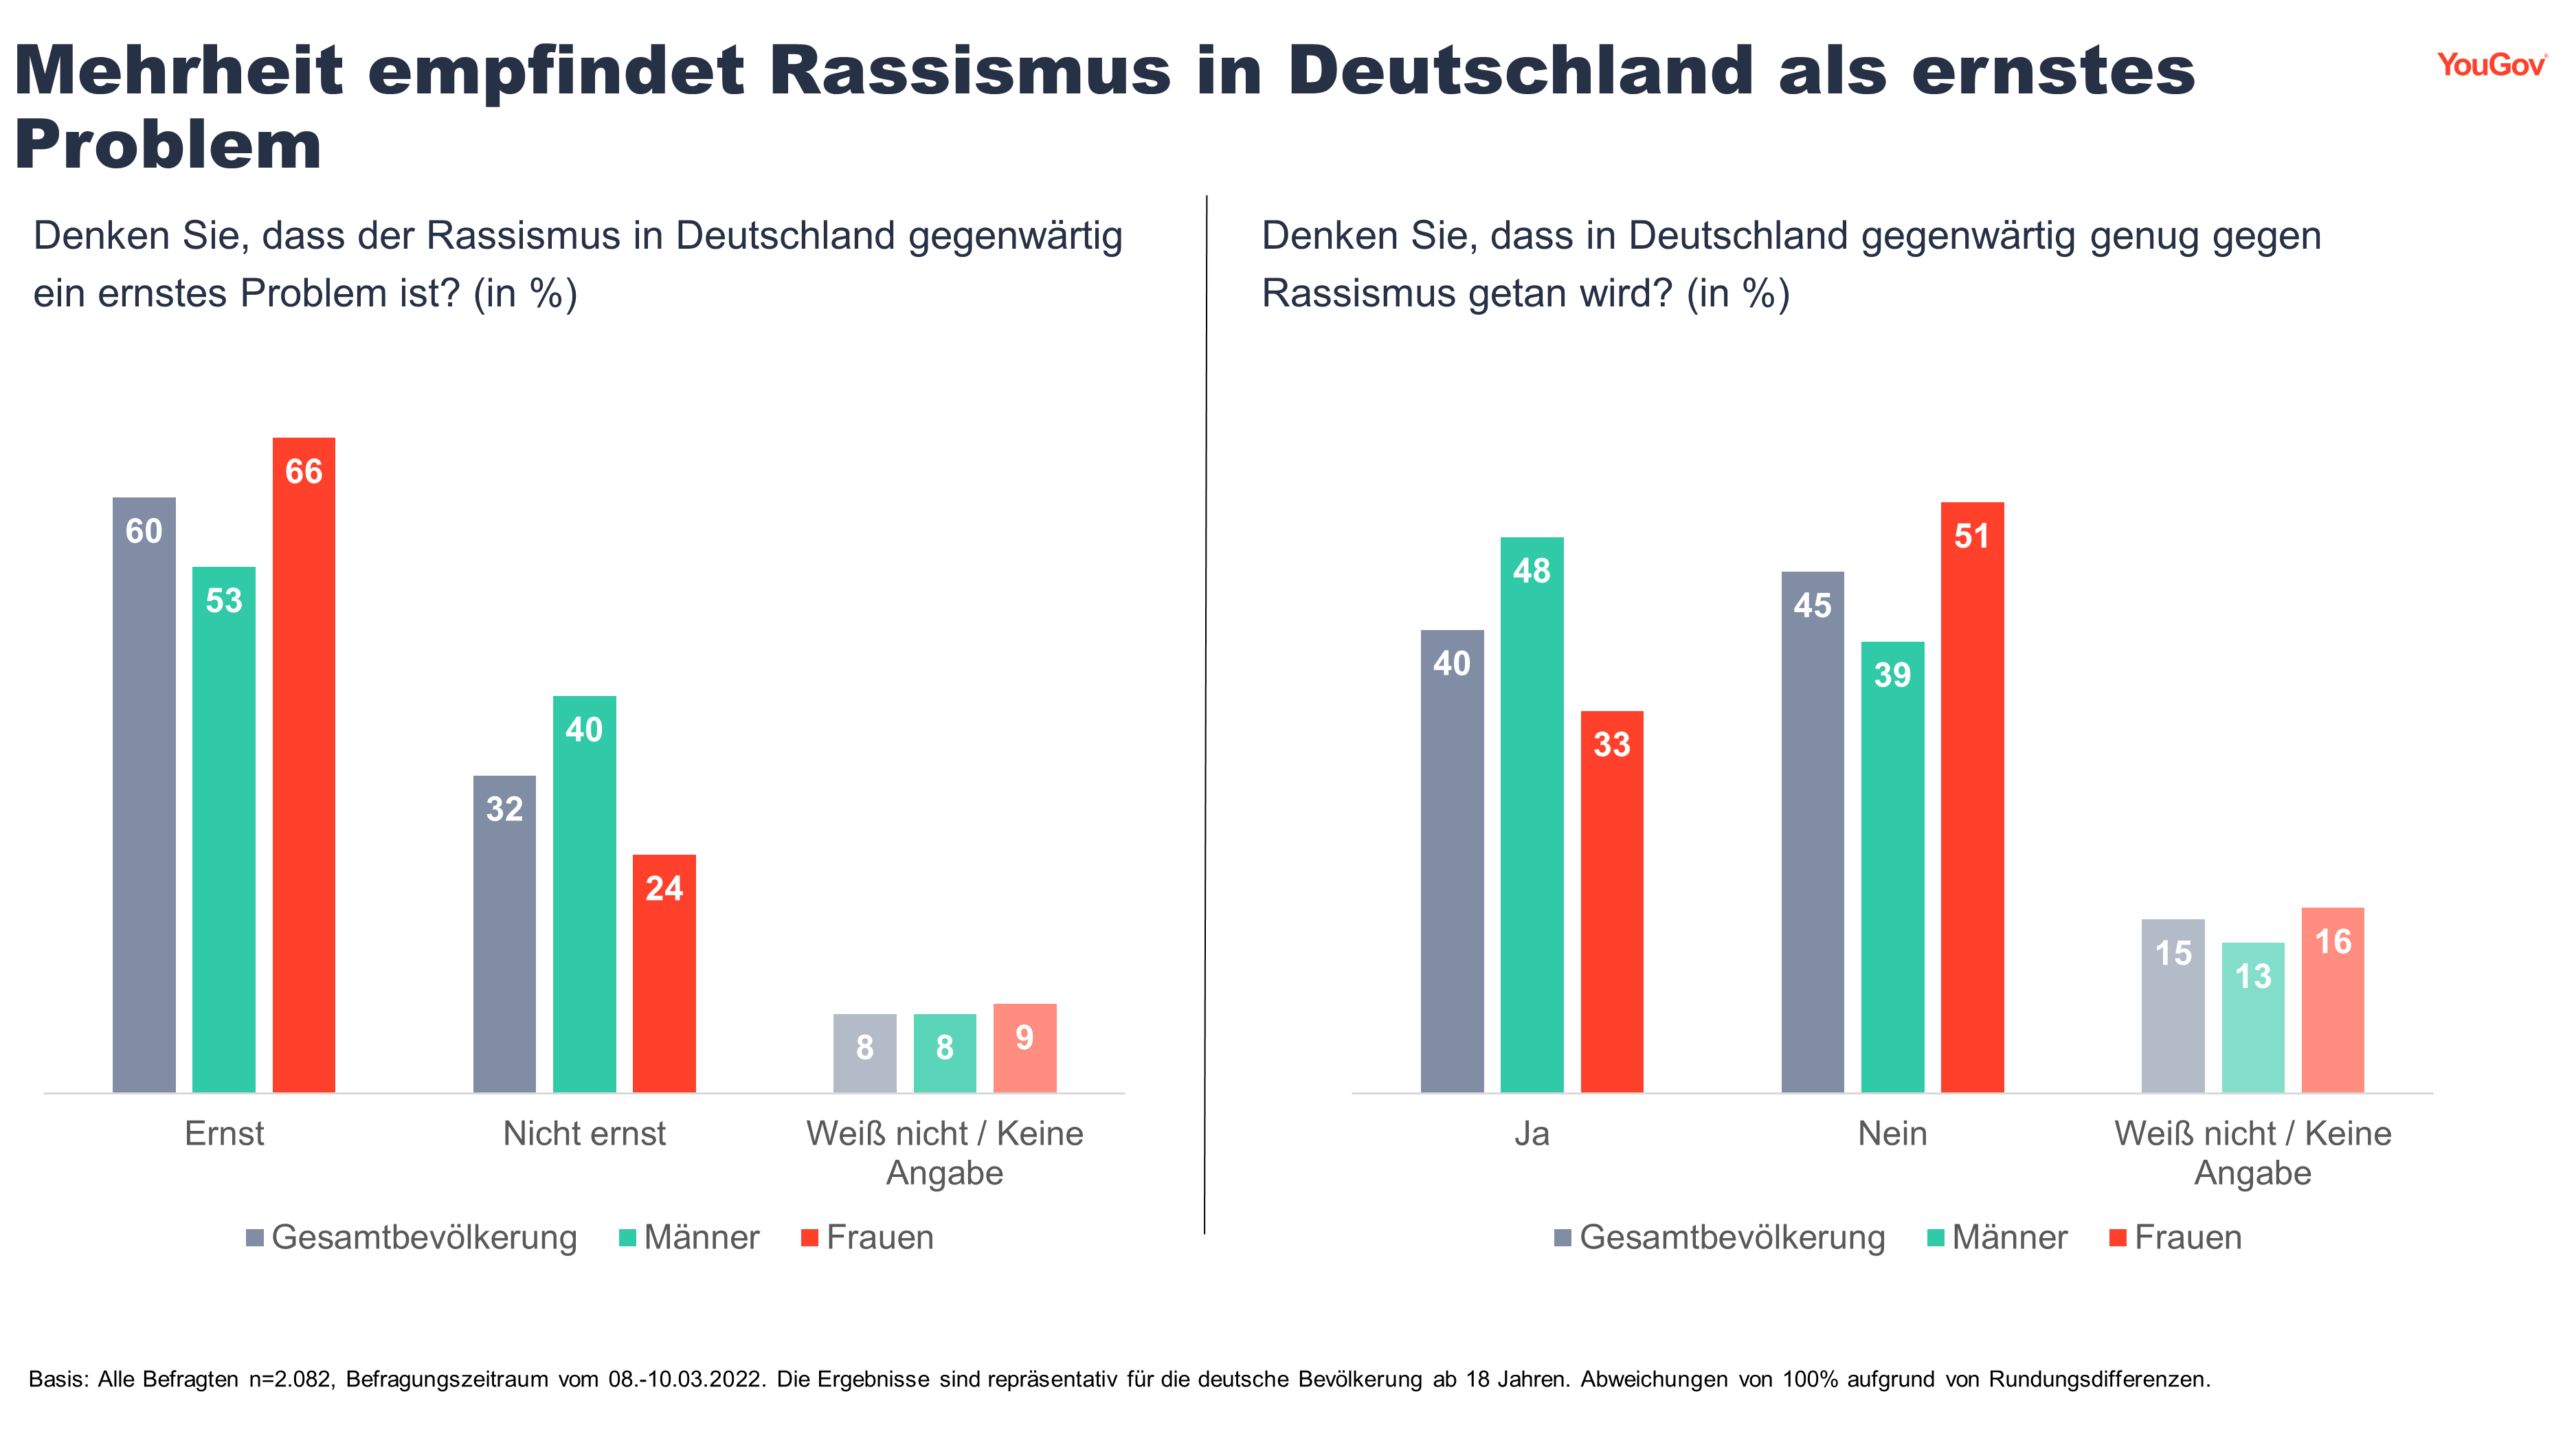
Swiss population aged 15 to 79. For three out of five Germans, racism is a
serious problem in their own country Currently, 60 percent of Germans say that racism is a serious problem
in Germany. Women say this more often than men (66 percent vs. 53
percent of men). More than two out of five Germans (45 percent) are of
the opinion that too little is currently being done against racism in
Germany. Men are less likely to hold this view than women (39 percent
vs. 51 percent of women). For 40 percent of all respondents, not enough
is being done against racism in Germany.
In the same survey of Swiss citizens, 47 percent of respondents
believe that racism is a serious problem in Switzerland at the
moment. The value is therefore 14 percentage points below that in
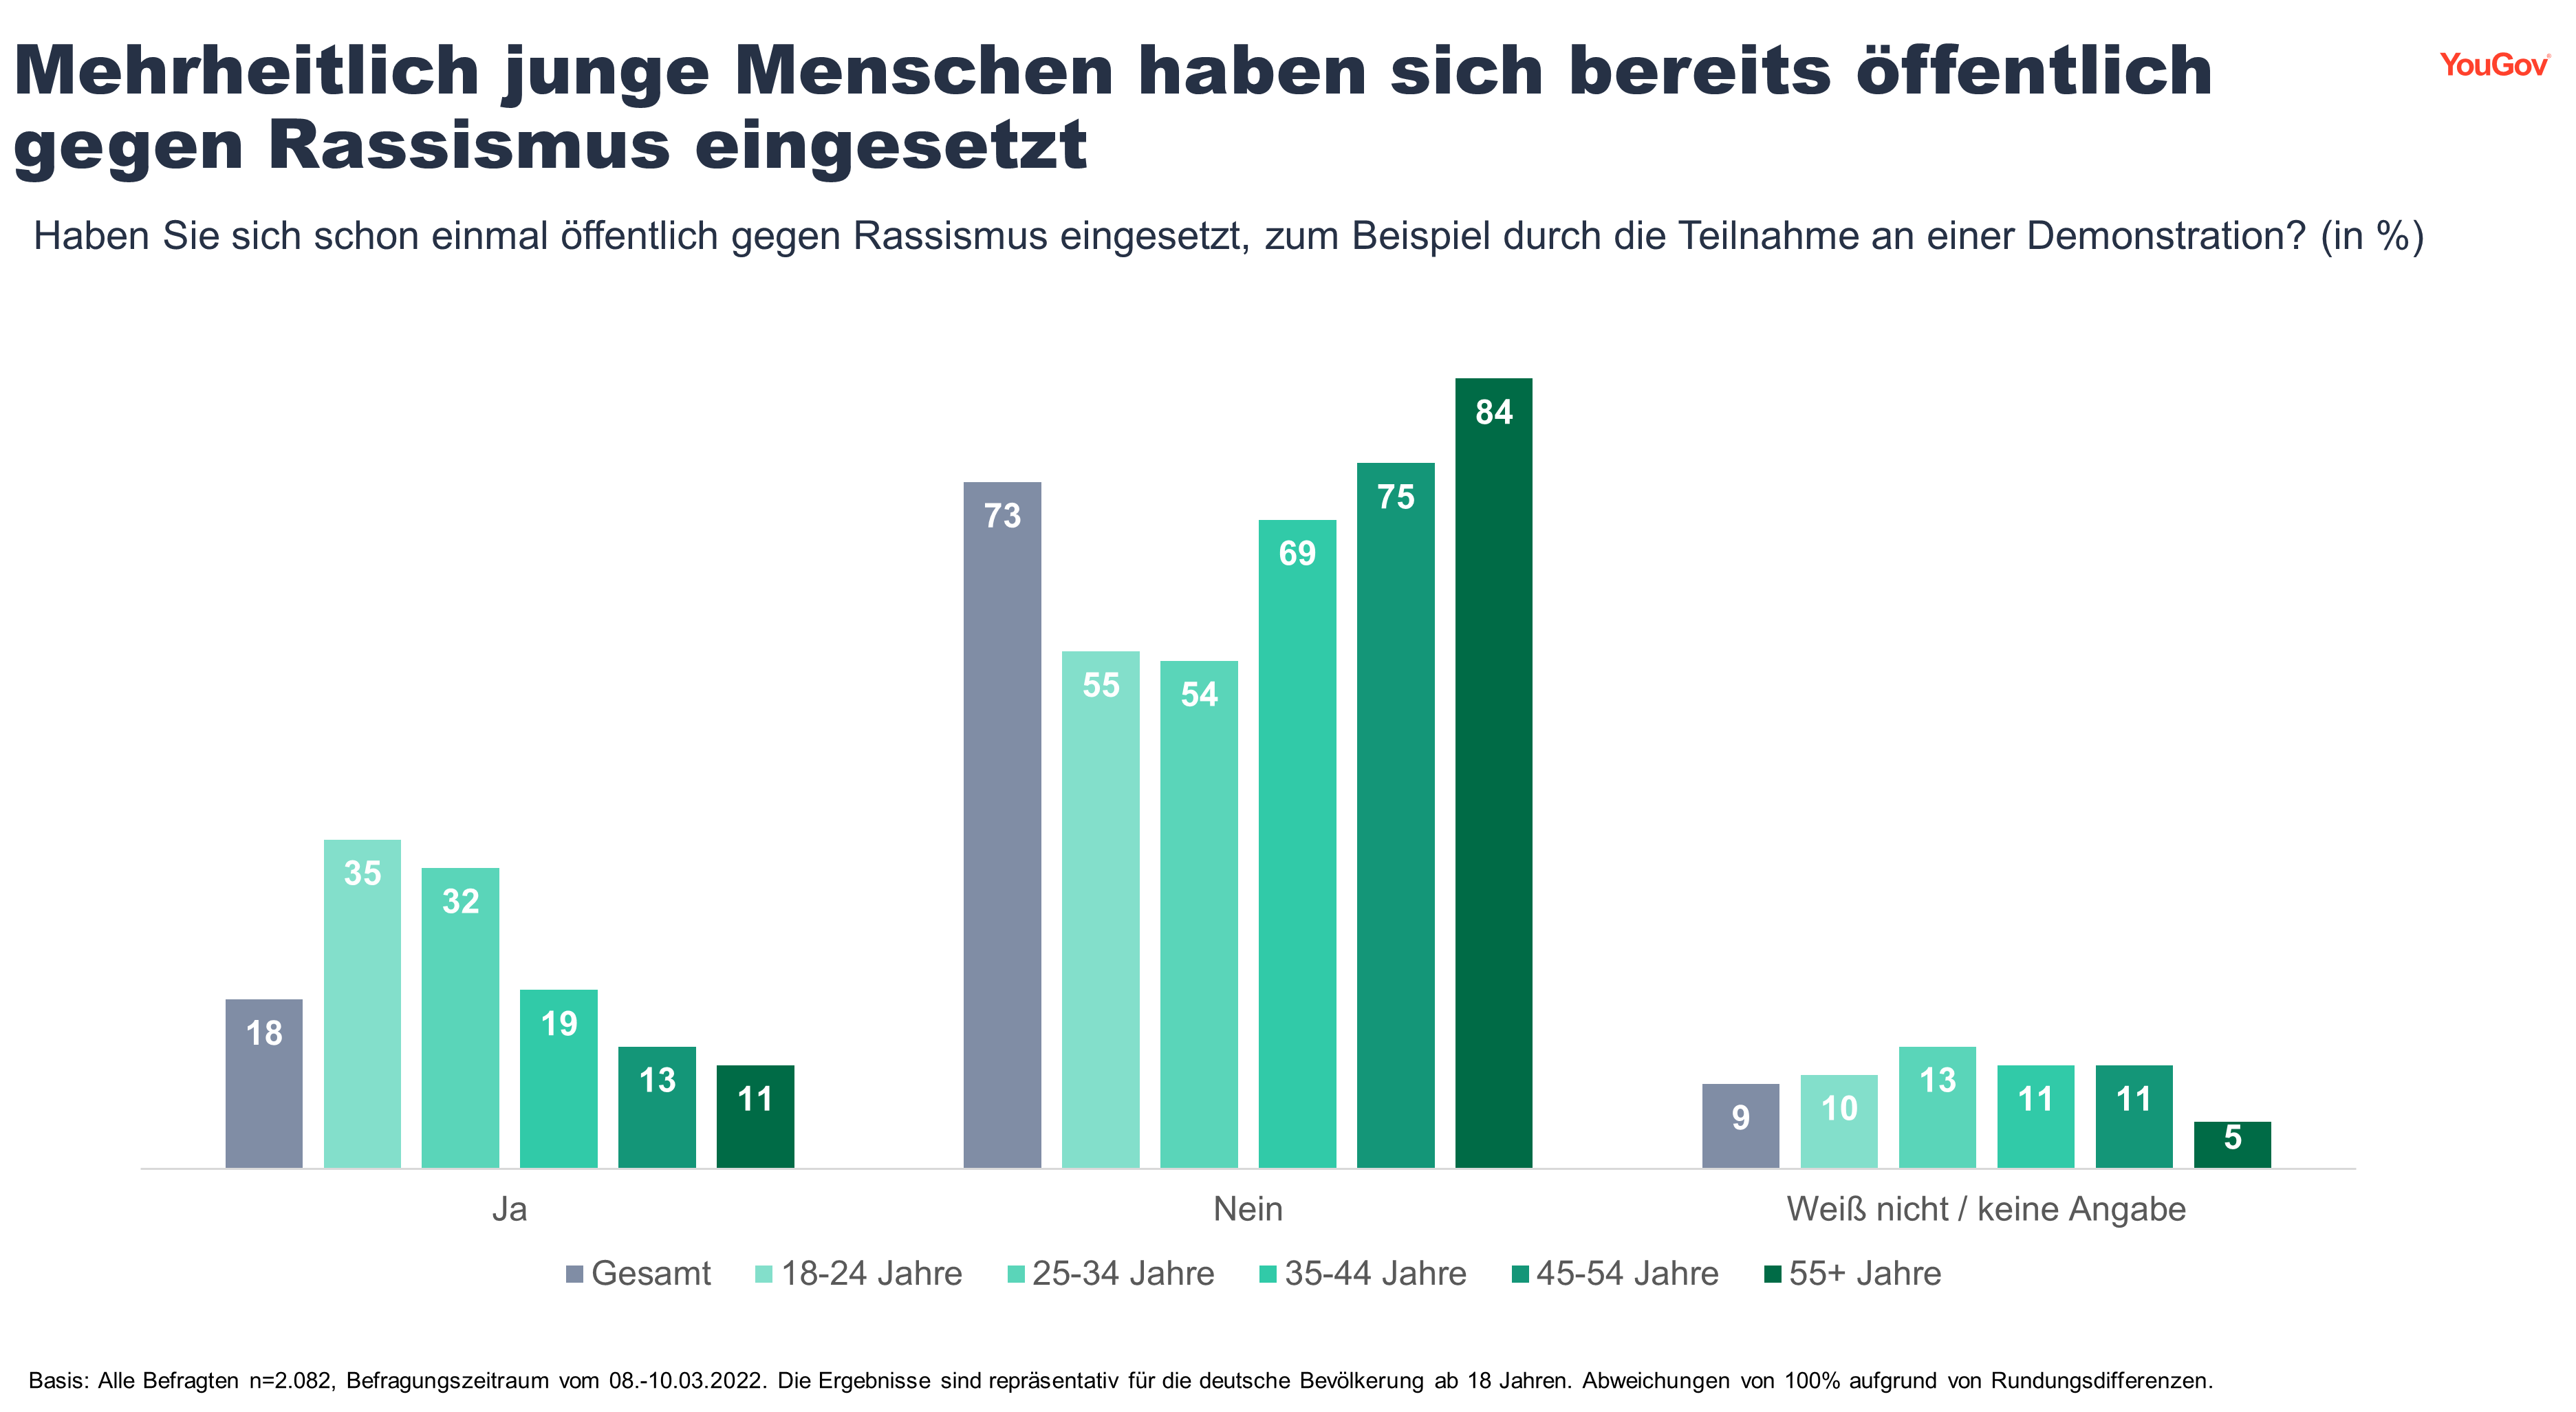
Germany. Almost every fifth person in Germany has
already campaigned against racism 18 percent of those surveyed in Germany state that they have already
taken a public stand against racism, for example by taking part in a
demonstration. Respondents aged 18 to 24 say this most frequently (35
percent), those aged 55 and over least often (11 percent). 12 percent of
all those surveyed in Switzerland say so.
Swiss have taken (ill-considered) racist
attitudes more often than Germans 64 percent of Swiss people currently say they have taken a racist
attitude, even if it was thoughtless. This means that the Swiss make
this statement more often than respondents in Germany: In this country, 40
percent state that they have already taken a racist attitude, even if it was
thoughtless. (YouGov Germany) March 21, 2022 Source: https://yougov.de/news/2022/03/21/jeder-funfte-deutschland-hat-sich-schon-einmal-ras/ NORTH
AMERICA
735-43-12/Polls More Houses Of Worship Are Returning To Normal Operations, But
In-Person Attendance Is Unchanged Since Fall
As COVID-19 cases
continue to decline and pandemic
restrictions are eased across the United States, churches and other
houses of worship increasingly are holding services the way they did before
the outbreak began, according to a new Pew Research Center survey. But there
has not been a corresponding rise over the past six months in the share of
Americans who are attending in-person services.
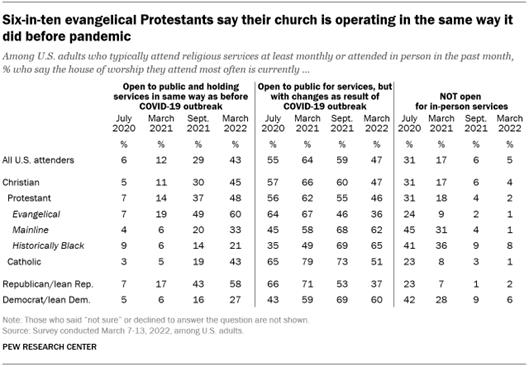
Among U.S. adults who say they attend religious services, 43% now
report that their house of worship is currently open and holding services the
same way it did before the COVID-19
outbreak – up 14 percentage points in the last six months and 31
points since last March. Meanwhile, 47% say their congregation is open but
with modifications still in place due to the pandemic, such as mask
requirements or social distancing. Just 5% say their congregation is still completely closed to
in-person worship, unchanged since September of last year (6%). In other
words, the overall share of U.S. worshippers who say their congregation is
open to in-person services has not increased over the last six months, but
fewer people say their services include coronavirus-related precautions.
The same survey shows that attendance at in-person services – which
grew steadily from July 2020 through September 2021 – has plateaued, as has
the share of adults watching religious services online or on TV. In July 2020, roughly four months after COVID-19 upended life in
America, 13% of U.S. adults reported having attended religious services in
person during the previous month. That figure rose to 17% in March
2021 and then to 26% in September
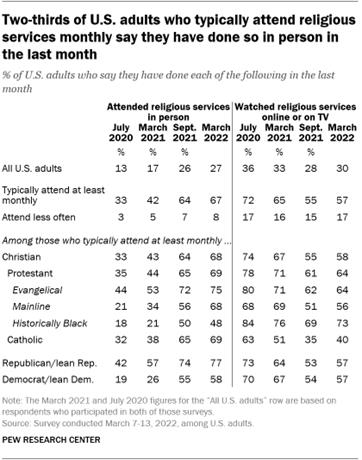
2021, and now stands at 27%. Over the same period, the share of Americans who say they have
streamed religious services online or watched them on TV in the past month
declined from 36% in July 2020 to 28% in September 2021 and is now 30%. About a third of U.S. adults (32%) in the new March survey say
they typically go to
religious services at least once or twice a month. Of these self-described
regular attenders, two-thirds (67%) report that they actually have attended
physically (in person) in the last month, while 57% say they have watched
services online or on TV during that period. The survey’s questions about in-person and virtual attendance can be
combined to provide a sense of how many people are watching services
online instead of
attending in person, and how many are watching online in addition to attending in person.
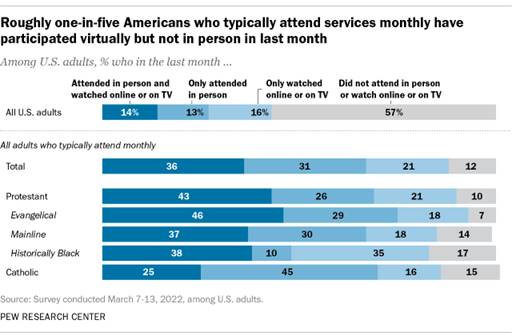
The Center’s survey finds that among all adults who say they typically attend
services at least monthly, 36% have both attended in person and watched services digitally in
the last month, while three-in-ten (31%) say they have only attended in
person but not watched online or on TV in the last month. One-in-five (21%) may still be substituting virtual attendance for
in-person attendance, saying they recently have watched religious services
online or on TV but have not attended in person. Just 12% of self-described
regular attenders report that they have neither gone in person nor watched
services virtually in the last month.
Assessing the impact of the pandemic on religious service attendance
remains difficult for two main reasons. One is that the ultimate course of
the pandemic is still unclear. What appears, at this moment, to be a plateau
in religious service attendance could be followed by a rise if the pandemic
gradually recedes, or by a drop if a new, highly infectious coronavirus
variant emerges. The second reason for uncertainty is that, prior to the pandemic, Pew
Research Center surveys did not clearly distinguish between physical
attendance at religious services and virtual attendance. While religious
congregations as a whole may have experienced a large drop in physical
attendance during the pandemic, there’s good reason to believe that virtual
attendance is much higher today than it was before the coronavirus outbreak
began in early 2020. One piece of evidence is that, in a July
2020 survey, 18% of U.S. adults said that since the pandemic began, they
had watched religious services online or on TV for the first time. Combining both forms
of attendance, nearly nine-in-ten people who say they are regular attenders
(88%) report that they have participated one way or the other in religious
services in the past month. In addition, the share of all
U.S. adults who say they have either attended religious
services in person or watched online or on TV (or both) in the past month
(43%) is substantially greater than the share who say they typically attend
religious services at least once or twice a month (32% among all March 2022
survey respondents). This suggests that people’s actual behavior may vary
from month to month, or that some people may not think of online services when
answering the question about their typical attendance. The new study, like previous surveys, finds notable differences in
attendance patterns across Christian subgroups. For example, Protestant
churchgoers in the historically Black tradition stand out for being the
Christian group most likely to have only watched
religious services online or on TV in the last month, with about a third
(35%) describing their behavior this way. Indeed, while Black Americans are, on average, more
religious than White and Hispanic Americans by a number of religious
commitment measures, churchgoers in the historically Black Protestant
tradition (48%) are substantially less likely than evangelical Protestants
(75%), mainline Protestants (68%) and Catholics (69%) to say they have
attended religious services in person in the last month. (Other
surveys show that the pandemic has hit communities
of color especially hard.) Meanwhile, among those who typically attend religious services at
least monthly, Protestants in the historically Black tradition (73%)
are more likely than
evangelical (64%) and mainline (56%) Protestants to say they have watched
services virtually in the last month, and all of these groups are more likely
than Catholics (40%) to say they have done so. Mainline Protestant churchgoers stand out for rising rates of
in-person attendance, with the share saying they have attended a service in
the last month increasing by 12 points since September 2021 (from 56% to
68%). Although the survey was conducted among Americans of all religious
backgrounds, including Jews, Muslims, Buddhists and Hindus, it did not obtain
enough respondents from non-Christian groups to report separately on their
responses. Small subgroups of Christians are unable to be analyzed separately
for the same reason. When it comes to the operating status of congregations, a majority of
evangelical Protestants who typically attend religious services at least
monthly or say they attended in person in the past month (60%) say their
church is open and holding services in the same way it did before the
pandemic began. Evangelicals are significantly more likely than mainline
Protestants (33%) and Catholics (43%) to say this is the case. Among
Protestants in the historically Black tradition, just 21% say their
congregation is open and operating normally, while roughly two-thirds (65%)
say their church is open but with changes or restrictions still in place due
to the pandemic. Among religious attenders, the share of Republicans and
Republican-leaning independents who say their house of worship is currently
open and operating the way it did before the pandemic is roughly double the
share of Democratic congregants who say the same (58% vs. 27%). Democrats
(and Democratic leaners) who regularly attend religious services are much
more likely than their Republican counterparts to report that their house of
worship is open but operating with pandemic-induced changes in place (60% vs.
37%). Republicans who typically attend religious services also are much
more likely than Democrats in the same category to say they have attended
religious services in person in the last month (77% vs. 58%). But members of
both parties are equally likely to say they recently have watched services
online or on TV (57% each).
(PEW) MARCH 22, 2022 735-43-13/Polls Biden's Job Approval Is 42%, Statistically Unchanged From 41% Last
Month
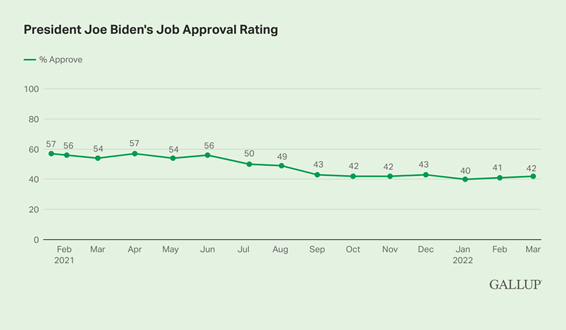
At 42%, President Joe Biden's latest job approval rating marks
his seventh consecutive reading below 44%, while a majority of Americans,
54%, continue to disapprove of the job he is doing. Although Biden's overall rating is flat, Americans' approval of his
handling of the coronavirus response (53%) and the situation with Russia
(42%) has each risen six points over the past month. At the same time,
approval of his handling of foreign affairs (43%) and the economy (36%) is
not significantly different than in February. President Joe Biden's Approval Ratings Among U.S. Adults % Who approve of way Biden is handling each
The latest readings are from a March 1-18 Gallup poll, during which
Russian military forces pressed farther into Ukraine and many Ukrainians fled
the country. In response to Russia's continued military action, the Biden
administration increased sanctions on the country and Congress passed an aid
package to support Ukraine. Meanwhile, the sagging U.S. economy worsened, as inflation hit its
highest point since 1982 and gas prices rose to all-time highs. One bright
spot for the country was the further decrease in COVID-19 infections. In addition to the four issues measured in February and March, the
latest survey finds 45% of Americans approving of Biden's handling of the
environment and 38% of his handling of energy policy. This is the first time
Gallup has measured approval on these two issues. Biden's Overall Job Approval Rating Steady,
Sharply Polarized Since September,
Americans' overall approval of Biden has ranged from 40% to 43%, well below
the majority-level ratings he received during the first six months of his presidency.
Line graph. Trend in President Joe Biden's job approval ratings, from
January 2021 to March 2022. After staying at or above 49% through August of
his first year, Biden's job approval rating fell to 43% in September and
since then has ranged from 40% to 43%. The current reading is 42%. The drop
in Biden's approval rating last July was largely the result of a
decline in approval among political independents. Their rating of the
president has not risen above 50% since. Democrats' current 84% rating of
Biden is more than twice independents' 38% and dwarfs Republicans' 5%.
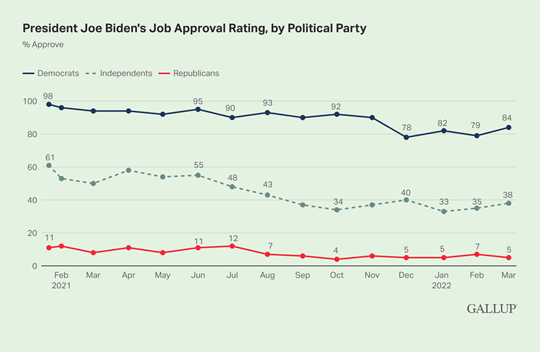
Line graph. Trend in President Joe Biden's job approval ratings by
political party, from January 2021 to March 2022. President Biden has
consistently held approval ratings of 78% or higher among Democrats,
including the latest rating of 84%. His approval ratings among Republicans
have typically been below 10%, including the latest, 5%. Sixty-one percent of
independents approved of Biden at the beginning of his presidency, and a
majority did through June. Since September, independents' rating has been at
or below 40%, including the current 38%. Biden's Issue Approval Ratings Reflect
Recent Events and Partisans' Views Gallup has periodically
tracked Biden's approval ratings on the economy, foreign affairs and the
coronavirus response since the beginning of his presidency. Early on, Biden
had majority-level approval on all three issues; however, by November, those ratings had all fallen
below 50%. Biden's handling of the pandemic has consistently been his
greatest strength among these issues and is back above the majority level in
the latest poll. The current uptick in approval of Biden's response to COVID-19 is
likely tied to Americans' improved
outlook for the pandemic, while the relatively steady but low ratings for
his handling of the economy and foreign affairs may reflect stubbornly
persistent inflation and the challenging international climate right now.
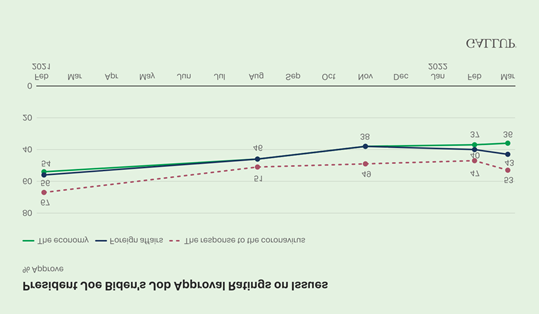
Line graph. President Joe Biden's approval ratings for his handling
of the economy, foreign affairs and the response to the coronavirus since
February 2021, when he had majority-level approval on all three issues. By
November, those ratings had all fallen below 50%. Biden's handling of the
pandemic has consistently been his greatest strength among these issues and
is back above the majority level at 53% in the latest poll. Currently, 43% of
U.S. adults approve of his handling of foreign affairs and 36% of the
economy. Biden's rating for his handling of the situation with Russia has been
measured on only three occasions, including a 39% reading in August, 36% last
month and 42% currently. Partisans' approval ratings of Biden's handling of the six issues are
politically polarized, much like his overall job rating, although a slim
majority of independents and about one in five Republicans express approval
for his handling of the pandemic. Partisans' Issue Approval Ratings of President Joe Biden % Who approve of the way Biden is handling each
Bottom Line Biden is currently
facing sizable challenges at home and abroad, and his approval ratings are
largely mired in mediocrity. In the
current hyperpolarized climate, his ability to achieve approval ratings above
50% hinges largely on independents, whose support for him dwindled during the
coronavirus surge last summer and fell further after the U.S. withdrawal from
Afghanistan. The two areas of modest growth for Biden this month -- his handling
of the response to COVID-19 and the Russia-Ukraine war -- are fragile and
volatile situations. With a new variant of the coronavirus gaining steam and
the fighting in Ukraine intensifying, further gains in Biden's approval
ratings may prove elusive. (Gallup) MARCH 22, 2022 Source: https://news.gallup.com/poll/390953/biden-job-rating-tepid-covid-russia-handling.aspx 735-43-14/Polls A Broad Majority Of Americans (69%) Favor The United States Taking
Steps To Become Carbon Neutral By 2050
A broad majority of Americans (69%) favor the United States taking
steps to become carbon neutral by 2050, according to a Pew
Research Center survey conducted in January. But while some
advocates suggest that nuclear power – a source that emits no carbon – should
have a more prominent role in the nation’s energy makeup, the public
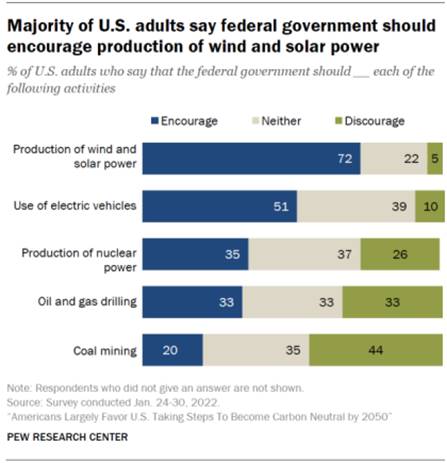
continues to express mixed views about it as an energy source. Around a third of U.S. adults (35%) say the federal government should
encourage the production of nuclear power, while about a quarter (26%) say
the government should discourage it. Another 37% say the federal government
should neither encourage nor discourage the production of nuclear power. The
survey was fielded before Russia’s military invasion of Ukraine and the renewed
discussions about nuclear power and other current energy sources it
has prompted.
Americans are far more likely to say the federal government should
encourage the production of wind and solar power (72%) and the use of
electric vehicles (51%) than to say the same about nuclear power. In fact,
the public is about as likely to say the government should encourage oil and
gas drilling as it is to say the government should encourage nuclear power
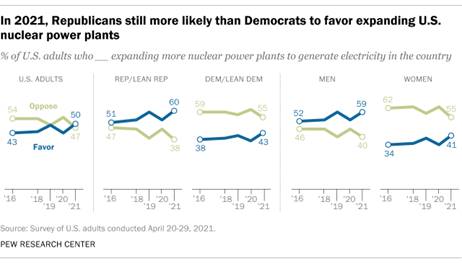
production. Previous surveys by the Center have also found Americans are closely
divided in views of nuclear energy. In an April
2021 survey, half of U.S. adults said they favored expanding nuclear
power plants in the country to generate electricity, compared with 47% who
opposed it. Views on this question have fluctuated somewhat, but no more than
half of adults in any survey since 2016, the first time this question was
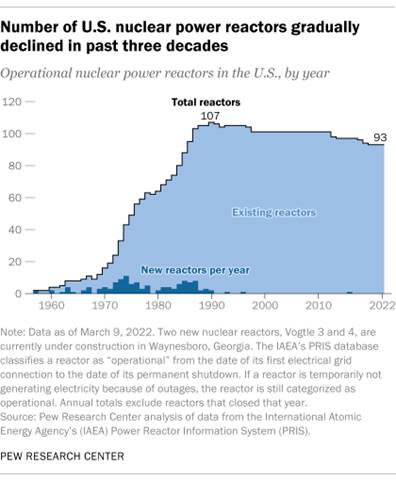
asked, have favored expanding nuclear power plants to generate electricity. The U.S. currently has 93
nuclear power reactors, plus two that are under construction. These
reactors collectively generated 18.8% of
all U.S. electricity last year.
The number of operational nuclear power reactors in the U.S. has
steadily declined since peaking at 107 reactors in 1990. Still, nuclear power
is a part of many state governments’ plans to transition away from fossil
fuels. About two-thirds of states have reported plans to incorporate nuclear
in their energy policies, according
to a recent Associated Press analysis. The nuclear power sector has also
garnered some federal support through the $6
billion Civil Nuclear Credit Program included in the recently
enacted bipartisan infrastructure law. Some policymakers laud nuclear power’s potential ability to cut
greenhouse gas emissions, while others cite radioactive
waste storage issues and notorious
accidents to make the case against nuclear. In Japan, for example,
the 2011 Fukushima
Daiichi accident led the government to drastically decrease reliance
on nuclear power. The accident also led to reappraisals of
nuclear energy production in other countries. More recently (and after the
January survey was completed), Russian military attacks in Ukraine have raised
fears of accidents at several
seized nuclear power plants in the area – including the Chernobyl
site, which experienced a nuclear disaster in 1986. Gender, partisan differences in views of
nuclear power There are long-standing differences by gender and party affiliation
in views about the federal government’s role in nuclear energy production and
nuclear power more broadly. Men are nearly twice as likely as women to say the federal government
should encourage the production of nuclear power (46% vs. 25%). Views differ
by gender globally, too, according to a Center
survey conducted from fall 2019 to spring 2020. Men were more likely
than women to favor using more nuclear power as a source of domestic energy
in 18 of the 20 publics surveyed across Europe, the Asia-Pacific region,
Russia, the U.S., Canada and Brazil. Republicans and GOP-leaning independents are 10 percentage points
more likely than Democrats and Democratic leaners (42% vs. 32%) to say the
federal government should encourage the production of nuclear power.
Conservative Republicans (45%) are most likely to say the government should
encourage nuclear power production, while 36% of moderate and liberal
Republicans say the same. Democrats are 13 percentage points more likely than
Republicans to say the government should discourage this activity (31% vs. 18%).
Partisan differences were also evident in the Center’s earlier
surveys. In April 2021, six-in-ten Republicans favored expanding nuclear
power plants to generate electricity in the country, compared with 43% of
Democrats. Republicans have expressed support of nuclear power expansion in
greater shares than Democrats each time this survey question has been asked since
2016. But there are larger partisan gaps on views of other energy sources,
such as fossil fuels. In 2021, Republicans were far more likely than
Democrats to support more offshore oil and gas drilling in U.S. waters (69%
vs. 22%) and more coal mining in the country (60% vs. 17%). (PEW) MARCH 23, 2022 735-43-15/Polls 71% Of Republican Voters Say Their Vote For Congress Is Against Biden
People vote at the Millennium Youth Entertainment Complex on March 1,
2022, in Austin, Texas. (Montinique Monroe/Getty Images) Pew Research Center conducted this study to understand how the public
views control of Congress, issues for the upcoming midterm elections and
confidence in how the elections will be conducted. For this analysis, we
surveyed 10,441 U.S. adults in March 2022. Everyone who took part in this
survey is a member of the Center’s American Trends Panel (ATP), an online
survey panel that is recruited through national, random sampling of
residential addresses. This way nearly all U.S. adults have a chance of
selection. The survey is weighted to be representative of the U.S. adult
population by gender, race, ethnicity, partisan affiliation, education and
other categories. Read
more about the ATP’s methodology. Here are the questions
used for the report, along with responses, and its
methodology. With the midterm congressional elections still more than seven months
away, registered voters are evenly divided between the two major parties in
their election preferences. At the same time, Republican voters are more
likely than Democratic voters to say it “really matters” which party gains
control of Congress in this fall’s midterms.
At this early stage of the campaign, President Joe Biden is much more
of a motivating factor for Republican than Democratic voters: 71% of
Republican and Republican-leaning voters say they think of their vote as
being “against” Biden; far fewer Democrats and Democratic-leaning voters
(46%) view their vote as a vote “for” the president. The new Pew Research Center survey of 10,441 U.S. adults, including
9,021 registered voters, conducted March 7-13, 2022, finds that most voters
(63%) say which party wins control of Congress in this year’s elections
“really matters,” similar to the share who said this in early 2018 (65%). Today, in contrast with 2018, Republican registered voters (70%) are
more likely than Democratic voters (60%) to say which party wins control of
Congress this year really matters. Four years ago, there were only slight
partisan differences on this measure (67% of Democrats and 65% of Republicans
said it really mattered which party controlled Congress following the
elections) and that remained the case throughout the 2018 campaign.
The new survey finds that equal shares of registered voters say, if
the elections were held today, they would support the Republican candidate or
the Democratic candidate (43% each) in their district. Another 10% say they
are not sure who they would support, while 4% would vote for other
candidates. Early in the 2018 midterm cycle,
Democratic candidates had a double-digit edge over Republicans on the generic
congressional ballot. Democrats went on to gain the majority in the U.S.
House of Representatives that year.
As in previous midterms, voters are more likely to view their vote as
an expression of opposition than support for the president. That is the case
today: 36% say their midterm vote is against Biden, while 24% think of it as
a vote for Biden; 38% say Biden is not much of a factor in their voting
decision. The partisan disparity in these views is wide: Nearly three times as
many Republican voters think of their vote as being against Biden as say the
president is not much of a factor in their vote (71% vs. 26%); by contrast,
Democratic voters are about equally likely to say Biden is not much of a
factor (47%) as to say their midterm vote will be “for” him (46%).
Amid the continuing conflicts over the 2020 election, a majority of
Americans say they are very (23%) or somewhat confident (40%) that the
midterm elections will be conducted fairly and accurately. However, there are
sizable partisan differences in confidence: While 76% of Democrats say they
are confident the fall elections will be conducted fairly and accurately (32%
are very confident), only about half of Republicans (47%) say the same (12%
say they are very confident). Seven-in-ten adults are also very or somewhat confident that all
citizens who want to vote in the congressional elections will be able to do
so. There are partisan differences in these views as well: Democrats are
about 20 percentage points less likely than Republicans to express confidence
that all citizens who want to vote will be able to do so (61% of Democrats
vs. 83% of Republicans). Top election issues for Republicans and
Democrats About eight-in-ten voters (78%) say the economy is very important to
their vote this fall, making it the top issue out of 15 asked about in the
survey. Republicans are particularly likely to say the economy is very
important to their vote in the fall: 90% say this, compared with 68% of
Democrats.
Roughly two-thirds of Republican voters say that immigration (68%),
foreign policy (67%) and violent crime (67%) are very important to their
vote, while nearly as many (62%) say this about the size and scope of
government. Democratic voters are less likely than Republicans to say each of
these is very important, though the gap is particularly pronounced on the
issues of immigration (just 34% of Democrats say immigration is very
important to their vote in the fall) and the size and scope of government
(just 26% of Democrats say this is very important to their vote). By comparison, health care is the top issue for Democratic voters in
the fall, with 74% saying it is very important to their vote; just 44% of
Republican voters say the same. About two-thirds of Democratic voters point to voting policies (66%)
and education (also 66%) as very important to their vote, modestly higher
than the shares of GOP voters naming these issues as very important to their
vote. But the partisan gap over climate change is one of the largest in the
survey: Democratic voters are 50 percentage points more likely than
Republican voters to name it as an important issue in their vote (64% vs.
14%) and are 40 points more likely to say the same about issues around race
and ethnicity (54% vs. 14%). Just a third of voters say that the coronavirus outbreak will be a
very important issue in their vote this fall, though Democrats are more than
twice as likely as Republicans to say this (46% vs. 19%). Congressional vote preferences Overall, voters are split on who they would vote for if the elections
were held today: 43% say they would vote for the Republican candidate in
their district, while an identical share say they would vote for the
Democratic candidate; 4% say they would vote for another candidate and 10%
say they are not sure.
There are wide differences in vote preference based on race and
ethnicity, age and education. About half of White voters (51%) say they would vote for the
Republican candidate, while 37% would vote Democratic. By contrast, a large
majority of Black voters (72%) say they would prefer the Democratic
candidate, while 7% prefer the Republican candidate. Asian voters favor
Democratic over Republican candidates by about two-to-one (59% vs. 31%);
Hispanic voters also favor Democrats (50%) over Republicans (28%). As in recent elections, older voters remain more supportive of
Republican candidates than Democrats: Half of voters ages 65 and older say
they would vote for a Republican if the elections were held today, while 41%
say they would vote for a Democrat. By contrast, about half of voters under
30 say they would vote for a Democratic candidate if the elections were held
today, while 29% say they would back the GOP candidate. Voters under 30 also
are about twice as likely as voters 65 and older to be unsure about who they
would vote for (13% vs. 7%). Voters with college degrees, especially those with postgraduate
degrees, are more supportive of Democrats than Republicans this fall, while
Republicans hold an advantage among voters with some college or less
education. (PEW) MARCH 24, 2022 735-43-16/Polls After A Month Of War, Ukrainian Refugee Crisis Ranks Among The
World’s Worst In Recent History
Russia’s invasion of Ukraine has created one of the biggest refugee
crises of modern times. A month into the war, more than 3.7 million Ukrainians have
fled to neighboring countries – the sixth-largest refugee outflow over the
past 60-plus years, according to a Pew Research Center analysis of United
Nations data. There are now almost as many Ukrainian refugees as there were Afghan
refugees fleeing the (first) Taliban regime in 2001, according to figures
compiled by the UN
High Commissioner for Refugees (UNHCR). They represent about 9.1% of
Ukraine’s pre-invasion population of about 41.1 million – ranking the current
crisis 16th among 28 major refugee crises by share of population.
The Center examined all cases in the UNHCR’s database since 1960
where there were at least 500,000 refugees and similarly displaced people
from a given country in a given year. The analysis doesn’t include
“internally displaced persons” – those who have fled or been forced from
their usual homes but haven’t yet crossed an international border. (Earlier
this week, UNHCR head Filippo Grandi estimated that, all told, 10
million Ukrainians – nearly a quarter of the population – had been
displaced either internally or externally by the war.) Syria’s civil war, which began in 2011, has created more refugees
than any other crisis since the early 1960s, when UNHCR began keeping data on
individual countries. Nearly 6.9 million Syrians – about a third of the
country’s prewar population – are living as refugees or asylum-seekers
outside their home country, with almost 3.7 million now in Turkey. An
additional 6.8 million Syrians have been displaced from their homes but are
living elsewhere in the country – meaning the civil war has uprooted about
two-thirds of Syria’s entire population. Afghanistan, which has been at war either with itself or with outside
forces for more than four decades, has had more than 2 million refugees every
year since 1981. The peak year was 1990, after Soviet troops had withdrawn
from the country and the USSR-backed government was battling to hang onto
power against a coalition of mujahedeen groups. That year, more than half the
country’s total estimated population – 6.3 million people – were listed as
refugees. Venezuela has also seen massive population outflows over the past
several years as the country’s economy has all but collapsed,
its government has cracked
down on dissent, and opposition efforts
to unseat President Nicolas Maduro’s government have stalled.
According to the UNHCR, more than 5 million Venezuelans are refugees in other
countries, are seeking asylum, or have been otherwise displaced abroad – all
told, about 15% of the current estimated population. (PEW) MARCH 25, 2022 735-43-17/Polls About Two-Thirds Of U S Adults (65%) Say Science Has Had A Mostly
Positive Effect On Society
About two-thirds of U.S. adults (65%) say science has had a mostly
positive effect on society, while 28% say it has had an equal mix of positive
and negative effects and just 7% say it has had a mostly negative effect,
according to a recent Pew Research Center survey. Over the past few years,
around two-thirds or more of Americans have seen science’s effect on society
as mostly positive.
Of course, science encompasses a wide swath of disparate fields and
developments. What exactly do Americans have in mind when they think about
science? A few common themes arise when U.S. adults are asked to talk about
science’s effects on society in their own words or when they discuss areas of
science they follow or find interesting. Most prominent among these are
developments in health and medicine, such as new treatments for disease.
Other, less commonly mentioned areas include references to computer and
digital technology, the environment and advances in space exploration. Here’s
a closer look at what Americans mean when they think about science, based on
a new analysis of open-ended survey data and focus group discussions from the
past several years. Many mention health and medical advances when
asked how science influences society In a January
2019 survey, the Center asked Americans who said science has had a mostly
positive effect on society to explain, in their own words, what they had in
mind. The most common answer – given by 56% of those asked – referred to
health and medical advancements, such as disease eradication, medical devices
and new medications, and cancer research leading to longer lifespans and
improved public health. Medical science was also top of mind for some of those who said
science has had a mostly negative effect
on society. Some in this group lamented the wait for cures of serious
diseases while others cited concerns about developments in biotechnology,
such as cloning and “designer babies.” These responses are generally in line with some of the themes that
came up during a series of virtual focus groups the Center conducted in July
2021. The 12 focus groups consisted of 28 Black and 29 Hispanic adults and
were part of a broader effort to better understand opinion about science and
scientists among these racial and ethnic groups. The topics that were
mentioned in these discussions offer another window into what the public sees
as science. Asked to elaborate on the areas of science they find interesting or
exciting – or to discuss the science topic areas they follow in the news –
several focus group participants referenced health and medicine. One Hispanic
man in the 25-39 age group said he paid attention to “anything that has been
developed in the medicine world or just for different treatments.” Others mentioned progress in treatment for specific diseases such as
cancer, sickle cell disease, diabetes or HIV, or the development of
coronavirus vaccines. For example, one Black woman in the 40-65 age range
said she was excited to hear about medical breakthroughs, such as “stuff with
heart patients that they’ve done. Stuff with blood treatments and just going
back to blood transfusions and cancer treatments, things of that sort.” Another Black woman in the 40-65 age group said, “It’s more about the
treatments that they are finding for diseases and for the vaccines and things
they’re coming up with, especially for COVID and just the different types of
treatments that are helping people, the different types of diseases. That’s
what interests me most.” It’s more about the treatments that they are finding for diseases and
for the vaccines and things they’re coming up with, especially for COVID and
just the different types of treatments that are helping people, the different
types of diseases. That’s what interests me most. A Black woman in the 40-65 age group, speaking in a focus group Some connect science with advances in
digital technology In the Center’s 2019 survey, a smaller but still sizable segment of
the public described the effects of science in terms of technology,
computerization, workplace automation, GPS tools or social media platforms. Participants in the Center’s 2021 focus group discussions also
pointed to developments in technology, as well as the so-called “internet of
things” – from GPS navigation to voice-activated assistants – as sources of
interest and excitement for them. A Black man in the 40-65 age group said, “I
find all the new products they are coming out with exciting. I can say,
‘Alexa, play music,’ and she’ll play my music.” Others talked about developments in robotics and artificial
intelligence as an area that catches their attention. A Black woman in the
25-39 age group said, “The improvements, we have drones flying in the air.
Now you’re talking about drones delivering our packages.” Some participants said they were interested in the ways digital
technology connects people. One Hispanic woman in the 40-65 age range said,
“I think technology has taken us to a third dimension, the fact that we can
communicate with people in other parts of the world is something we never
thought we could do.” I think technology has taken us to a third dimension, the fact that
we can communicate with people in other parts of the world is something we
never thought we could do. A Hispanic woman in the 40-65 age range, speaking in a focus group Others think about the environment, space
exploration and more A number of other areas come to mind when people think about the
effects of science on society. Some respondents to the 2019 survey gave a
broad answer, such as the idea that science provides a better understanding
of our world. Others mentioned a range of specifics, including improvements
in food safety and crop yields, weather forecasting and air travel. Among the
ideas that came up repeatedly were references to climate, energy and the
environment, as well as the world of space exploration. Focus group discussions in 2021 also touched on a range of topics,
including some related to space. One Black woman in the 25-39 age group
described what she found interesting as “the commercial travel of people into
outer space, and then the research behind the different planets and finding
out what’s beyond our galaxy.” What science means to people in the UK While this analysis is limited to the United States, there is some
evidence that people in other countries may think of similar things when they
think about science. In the United Kingdom, government surveys have asked respondents to
explain, in their own words, what comes to mind when they think of science.
In the most recent of these, the 2019
UK Public Attitudes to Science survey, 24% of UK adults ages 16 and older
associated science with fields of study such as biology, chemistry or
physics. Another 16% referred to health, drugs, medicine and doctors. As was the case in the U.S., some UK adults in the 2019 survey
referred to technology (mentioned by 13%) or to space, rockets and astronomy
(mentioned by 15%). (PEW) MARCH 25, 2022 AUSTRALIA
735-43-18/Polls Australians To Spend Billions On Holidays, Food And Chocolate This
Easter
Over four million Australians are planning a trip away this Easter
with $7.1 billion to be spent on holidays, while around $1.5 billion will be
splurged on food and chocolate, in a major boon for tourism operators and
retail businesses. Research released today by the Australian Retailers Association (ARA)
in conjunction with Roy Morgan has found that: • Of the Australians going away this Easter, 63% will be travelling
within their own state, 34% will be going interstate and 3% overseas ARA CEO Paul Zahra said Easter is a time for family get togethers,
travel, and specialist food like easter eggs and hot cross buns, which will
be in hot demand this year. (Roy Morgan) March 25 2022 MULTICOUNTRY
STUDIES
735-43-19/Polls U S Image Improves Across Most Of NATO, A Survey Of 27 NATO Countries
U.S. President Joe Biden will need to lean into newfound goodwill
among NATO allies on Thursday as he meets with NATO leaders in a high-stakes
summit about the war in Ukraine. Gallup surveys conducted before Russia invaded Ukraine in February
2022 showed the image of U.S. leadership was stronger across much of NATO
than it had been in years, after languishing at low levels during the Trump
administration. Between 2020 and 2021, U.S. leadership saw double-digit gains
in 20 of the 27 NATO members surveyed both years. Ratings of U.S. leadership in many countries in 2021 -- including key
NATO partners such as Germany and the Netherlands -- matched or surpassed
levels seen during the Obama administration. U.S. Leadership Approval Across NATO Members
Lithuania was the only NATO member where approval ratings headed in a
negative direction, with a six-percentage-point drop. But even so, the
leadership of the U.S. earned higher approval in Lithuania last year than did
the leadership of Russia (8%) and China (5%). Implications In the aftermath of the
U.S. withdrawal from Afghanistan in August 2021, one of the big questions was
how much damage the quick pullout might have done to Biden's credibility on
the world stage and whether it might
hamper his future ability to work with U.S. allies. While a fair number of NATO countries were surveyed before the U.S.
withdrawal and it's not possible to see how much of an effect that might have
had on approval, a fair number were also surveyed during or well after the
U.S. withdrawal. This includes Belgium, which saw a 29-point increase between
2020 and 2021. Few outside Moscow likely could have foreseen how quickly U.S. power
would be tested with Russia's invasion of Ukraine. And even fewer likely
anticipated the entire geopolitical order would essentially be upended as
Biden started his second year in office. The only certainty about what happens next is its potential to shape
the future world order. The data suggest that the U.S. has more support in
the court of global public opinion now than it did in the recent past, and
that could help it exercise its soft power with world leaders. (Gallup) MARCH 23, 2022 Source: https://news.gallup.com/poll/391160/image-improves-across-nato.aspx 735-43-20/Polls What MENA Citizens Think About The Environment, Among 12 Countries
Surveyed
From 28 to 31 March 2022, the inaugural Middle East and North Africa
Climate Week 2022 in Dubai, UAE will bring together key stakeholders to take
the pulse of climate action in the region, explore climate challenges and
opportunities to build forward from the pandemic and showcase ambitious
solutions. Arab Barometer’s 2018-2019 wave of surveys found that
citizens across MENA overwhelmingly regard water pollution and trash as grave
environmental concerns, while relatively fewer citizens worry about air
pollution and climate change. And despite awareness of the danger of certain
environmental issues in MENA, environmental protection doesn’t rise as a
public priority, according to Arab Barometer’s 2020-2021 surveys. Here are key findings from Arab Barometer wave five (2018-2019) and
wave six (2020-2021): 1- Water
Pollution and trash dominate MENA citizens’ list of environmental worries,
while air pollution and climate change are viewed as less important. Still,
the level of concern varies across the region. Lebanon is the most alarmed
about climate change, while Kuwait is the least concerned among the 12
surveyed MENA countries, with only 12 percent of its citizens regarding it as
a very serious problem. Notably, Libya and Iraq are seen as the most
apprehensive about the environment, with the overwhelming majority being very
concerned about water pollution and trash, while many in both countries are
also concerned about air pollution. Nevertheless, both countries exhibit some
of the lowest rates of concern about climate change with Iraq being the
second least worried about it after Kuwait. Perhaps the discrepancy in level
of concerns, in countries like Libya, Iraq and Kuwait is partially because
they are major oil producing countries. As such citizens may fear curtailing
the use of fossil fuels globally could gravely impact their economy.
2- Views by
demographics: across the region, worries about the environment– climate
change, air quality, water pollution, and trash – are greater for individuals
with higher levels of education, as compared to individuals with lower levels
of education. And attitudes toward the environment vary across the
urban/rural divide in MENA. Climate change is viewed as more problematic by
citizens living in rural areas compared to those living in urban areas
especially in Palestine, Yemen, Sudan, Jordan and Algeria. Trash, on the
other hand, is perceived as more problematic in urban areas in Tunisia, Yemen
and Morocco, while it is considered a more serious issue in rural areas in
Sudan. Surprisingly, climate change is not a major environmental concern for
young Arabs in comparison with their peers worldwide. However, young
Egyptians, Moroccans and Sudanese stand out as more worried than their older
counterparts on this issue. Finally, Arab Barometer’s data shows little to no
variation in environmental views by gender.
3- Despite
awareness of the risk of certain environmental issues in MENA, environmental
protection does not rise as public priority. Only seven percent or fewer
citizens in six MENA countries surveyed in October 2020 say that reducing
environmental pollution should be the top priority of government spending in
the coming year. And only nine percent or fewer in seven MENA countries
surveyed in Spring 2021 prefer foreign aid to target the environment.
(Arabbarometer) March 24, 2022 735-43-21/Polls Are Europeans In Favor Of Ukraine Joining The EU, A Study In 4
Countries
The Spaniards are the most in favor of Ukraine's membership: 6 people
out of 10 (60%) want the country to join the Union. Only 14% are against
it. At the same time, a relative majority of Germans (46%), Italians
(45%) and French (42%) share
this opinion. Conversely, 30% of the citizens of each of these countries
are opposed to Ukraine's membership. Opinion swung in favor of membership in
France and Germany Opinion has changed
significantly in France and Germany
since 2018. At the time, only 22% of French people and 30% of Germans thought
that Ukraine should be allowed to join the EU. Conversely, 49% of French
people and 47% of Germans were against it.
While it is possible that attitudes changed during the intervening
period before the start of the conflict, there is every reason to believe
that the Russian invasion had a strong influence on Europeans. Although the net score of most countries has improved since 2018, the
evolution of Ukraine is particularly marked. In France, the net score
increases from -27 to +12, an increase of 39 points , eclipsing the second largest increase
(Albania, +21 points).
Similarly, in Germany, the 33 point increase in net support for
Ukraine's membership is well ahead of Turkey, which recorded a 21 point
increase. The same study also reveals that net support for Russia's membership
has dropped significantly since 2018, dropping from -40 to -69 in France, and
from -35 to -60 in Germany. (YouGov France) March 24, 2022 Source: https://fr.yougov.com/news/2022/03/24/les-europeens-favorables-adhesion-de-lukraine/ 735-43-22/Polls An Average Of 30% People Believe Most People Can Be Trusted In 30
Countries
As citizens around the world were weathering the pandemic, the
accompanying economic and mental health struggles have been postulated to
have led to an inward-looking perspective. Ipsos’ tracking of sense of Social
Cohesion (part of Ipsos Context Advantage Knowledge Suite) across 28
countries has shown that societies have been becoming less cohesive over the
past couple of years. Specifically in Canada, trends in social cohesion have been worrisome.
As an example of this decline, the proportion of Canadians who would trust in
other Canadians to do what is in the best interest of the country has dropped
from 72% in late 2020 to 61% today. Similarly, the belief that “I have the
same outlook on life/priority issues as other Canadians” has dropped from 73%
to 67%, while trust in government to do what is right has dropped from 58% to
43%, now standing at only one in four. These trends all point to the
questions in citizens' minds on their level of interdependence and reliance
on each other and their institutions. Further evidence of an erosion in Social Cohesion is found in
findings from our recent 30 country study which probed interpersonal trust, a
key measure of social capital. A new Ipsos survey
finds that, on average across 30 countries, only 30% of
adults say most people can be trusted against 70% who believe that you can’t
be too careful dealing with people. Among these countries, interpersonal
trust is highest in China and India, where 56% say most people can be
trusted, and lowest in Brazil, Malaysia, and Turkey, where fewer than 15% say
so. The survey was conducted among 22,534 adults under the age of 75
conducted between February 18 and March 4 on Ipsos’s Global Advisor online
survey platform. In Canada, only 33% of citizens believe that most people can be
trusted, against 67% who believe that you can’t be too careful dealing with
people, placing Canadians in the middle of the spectrum when compared to 29
other countries. Interpersonal trust is uniformly low across Latin America and closer
to the global average in North America. Levels vary widely across countries
within other regions: In Europe, from 48% in the Netherlands to only 16% in
Poland; and in the Asia-Pacific region, from 56% in China and India to 13% in
Malaysia.
The Demographics of Social Trust In Canada, while men and women hold similar views about trusting
others, significant differences exist between generational views or by other
characteristics such as income and education. Older Canadians, higher-income
Canadians and higher education Canadians are more trusting, in comparison to
those in middle age groups, or with a lower income and or education. This is in line with the global trends observed, where the propensity
to trust others is greater among those who are business decision-makers,
holders of a higher education degree, married, older, male, and affluent.
The differences in opinions of various demographic sub-groups yet
again underline the contrasting experiences among members of society. While a more cohesive society is associated with a more stable
economy, low social cohesion can be linked to the potential for disruption
and often, the fragility of societal structures. Furthermore, given the high
correlation[1] observed
not only between interpersonal trust and happiness but also between
interpersonal trust and consumer confidence, the current low level of trust
among citizens points to an increased challenge for the government as well as
businesses serving these populations. Governance is more demanding when confronted with the task of
governing populations that are significantly fragmented. Companies (and the
economy more broadly) are challenged in their marketing, sales, etc. when
consumers are divided into various socio-political camps. Ipsos continues to monitor trends in Social Cohesion and public
sentiment and issues regular updates. About the Study These are the findings of a 30-country Ipsos survey conducted
February 18 – March 4, 2022, among 22,534 adults aged 18-74 in the United
States, Canada, Malaysia, South Africa, and Turkey, and 16-74 in 26 other
countries, via Ipsos’s Global Advisor online survey platform. Each country’s sample consists of ca. 2000 individuals in Japan and
the United States, ca. 1000 individuals in Australia, Brazil, Canada, China
(mainland), France, Germany, Great Britain, Italy, and Spain, and ca. 500
individuals in Argentina, Belgium, Chile, Colombia, Hungary, India, Ireland,
Malaysia, Mexico, the Netherlands, Peru, Poland, Russia, Saudi Arabia, South
Africa, South Korea, Sweden, Switzerland, and Turkey. The samples in Argentina, Australia, Belgium, Canada, France,
Germany, Great Britain, Hungary, Italy, Japan, the Netherlands, Poland, South
Korea, Spain, Sweden, Switzerland, and the United States can be taken as
representative of these countries’ general adult population under the age of
75. The samples in Brazil, Chile, China (mainland), Colombia, India,
Malaysia, Mexico, Peru, Russia, Saudi Arabia, Singapore, South Africa, and
Turkey are more urban, more educated, and/or more affluent than the general
population. The survey results for these markets should be viewed as
reflecting the views of the more “connected” segment of their population. The data is weighted so that each market’s sample composition best
reflects the demographic profile of the adult population according to the
most recent census data. The Global average reflects the average result of all the countries
and markets where the survey was conducted that year. It has not been
adjusted to the population size of each country or market and is not intended
to suggest a total result. (Ipsos Canada) 24 March 2022 735-43-23/Polls Is Mother’s Day A ‘Proper’ Special Occasion, Or Is It Too
Commercialized, A Survey In 18 Countries
Mother’s Day is a time for children and adults alike to let their
mothers know how much they mean to them. But are people prompted to say thank
you to their matriarchs by the spirit of the day itself, or because they are
being bombarded by companies telling them to express their affection through
the medium of buying things? A new YouGov survey in 18 countries and territories shows a mixed
picture regarding Mother’s Day. We asked more than 19,000 people whether they
thought Mother’s Day is celebrated more because it is a ‘proper’ special
occasion, or if it was an occasion that people wouldn’t celebrate if it
weren’t for pressure from commercial entities like greetings card companies. Polish people are especially likely to say that Mother’s Day is
celebrated nationally for the right reasons, at 85%. Only 10% see the time of
tribute to their mothers as too commercialised. Almost two thirds of people in the UAE (66%) likewise see Mother’s
Day as something that is still celebrated on its own terms, rather than
because of commercial pressure (21%). Online Chinese respondents come third,
with similar figures (64% vs 24%).
Belief that Mother’s Day is still being celebrated as a ‘proper’
special occasion is generally lower in the West, and particularly in Western
Europe. Danes are the most cynical, with 61% saying they think that entities
like greeting card companies are the driving force behind the celebration
these days, compared to only 27% who disagree. Swedes, Germans, Italians, Spaniards and British people also tend to
be more sceptical than not about people’s motivations on Mother’s Day, with
French people split. In the USA, a small majority (54%) still think that the
maternal moment is marked for traditional reasons, compared to a third (34%)
who see it as more of a commercialised celebration. Men and women in each country/territory tend to hold similar views on
the matter. The biggest differences are in Hong Kong, the UAE and Great
Britain, where women are somewhat more likely than men to say Mother’s Day is
being celebrated true to its original intent. (YouGov UK) March 26, 2022 |
|||||||||||||||||||||||||||||||||||||||||||||||||||||||||||||||||||||||||||||||||||||||||||||||||||||||||||||||||||||||||||||||||||||||||||||||||||||||||||||||||||||||||||||||||||||||||||||||||||||||||||||||||||||||||||||||||||