|
BUSINESS & POLITICS IN THE WORLD GLOBAL OPINION REPORT NO. 781-782 Week:
February 07 – February 19, 2023 Presentation:
February 24, 2023 Women Members Make Up Only 15% Of All Local Assemblies Two In Five S’pore Adults Report Decrease In Disposable
Income, Also Expect Decline In Next Year Nigerians Say Their Country Is Unsafe Only 7% Of Britons Test Their Smoke Alarms As Often As They
Should Britons' Attitudes To The Homeless By 51% To 42%, Londoners Don’t Trust The Metropolitan Police The Majority Of The Public Believe Protests Rarely, If Ever,
Make A Difference One In Nine Britons Skipped Meals In Last Three Months
Because They Couldn’t Afford Food More Than One In Three Britons Feel Lonely – Rising To More
Than Half Of Those Aged 18-24 Public Think Keir Starmer Is More Likely To Hold Key
Leadership Traits Than Rishi Sunak Half Of Britons Support A £10 Fine For Missed NHS
Appointments 2 Out Of 5 French People Say They Follow The News About
Savings And Financial Products 51% Of French People Do Not Say They Are Particularly Afraid
Of Artificial Intelligence Interest In The Super Bowl Has Fallen Among Germans Compared
To Last Year Social Shopping Is Becoming Increasingly Popular Children And Parents In The Digital World, Between Social
Networks, Gaming And The Metaverse Americans Are Greatly Concerned About Social Media’s Impact
On Children Americans Want Medication Abortion To Remain Legal Black Americans Firmly Support Gender Equality But Are Split
On Transgender And Nonbinary Issues More Than Three-In-Five Feel They’re Being Asked To Tip More,
And More Often Fewer Canadians Rate Quality Of Healthcare As Good (60%, Down
12 Points From 2020) Nearly Half (43%) Of Canadians Have Knowingly Been Victimized
By Fraud Or Scams, In Their Lifetime Over Two In Five Australians Report Fall In Disposable
Income, But More Optimistic About Next Year Australian Unemployment Jumps To 10.7% In January – Highest
Since Jobkeeper Ended In March 2021 Yougov Survey Of 18 International Markets Shows That Chatbots
May Not Live Up To Their Potential Citizen Priorities On The Environment And Climate Change In
MENA, A Survey Among 12 Nations INTRODUCTORY NOTE This weekly report consists of thirty-five surveys. The
report includes six multi-country studies from different states across the
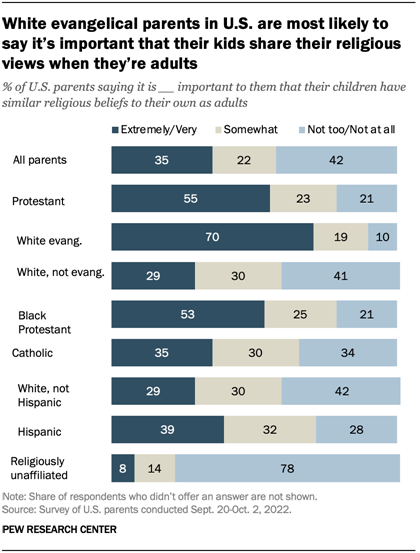
globe. 781-782-43-36/Commentary: A Third (35%) Of U.S. Parents With Children
Under 18 Say It’s Extremely Or Very Important To Them That Their Kids Have
Similar Religious Beliefs To Their Own As Adults, Pew Research Center Survey About a third (35%) of U.S. parents
with children under 18 say it’s extremely or very important to them that
their kids have similar religious beliefs to their own as adults, according
to a recent
Pew Research Center survey. But attitudes on this question vary by
the religious affiliation of the parents.
White evangelical Protestant
parents are twice as likely as U.S. parents overall (70% vs. 35%) to say it’s
extremely or very important that their children grow up to have religious
beliefs that are similar to their own. Some 53% of Black Protestant parents
also express this view. Fewer Catholic (35%) and White non-evangelical
Protestant parents (29%) say this is extremely or very important to them. And
only 8% of religiously unaffiliated parents – those who describe their
religious views as atheist, agnostic or “nothing in particular” – say the
same. The survey was conducted among
Americans of all religious backgrounds, including Jews, Muslims, Buddhists
and Hindus, but it did not obtain enough respondents from non-Christian
groups to report separately on their responses. (Read more about why the
Center typically can’t report the views
of smaller U.S. religious groups.) Views on this question also differ
by how frequently parents attend religious services. Parents who attend
religious services weekly or more often are more than three times as likely
as those who attend less often to say it’s important to raise children who
will share their religious views (76% vs. 21%). Overall, parents are more likely to
say it’s important that their children share their religious beliefs as
adults than to say the same about their kids’ political views. Just 16% of
parents say it’s extremely or very important that their children grow up to
have political views that are similar to their own. “I was raised in a very religious
family, and I want my children to share the same faith.” MOTHER, AGE 42 Religious differences also appear
on other questions related to parents’ hopes for their children, according to
the Center survey, which was conducted in the fall of 2022 among 3,757 U.S.
parents with children under 18. For example, 81% of parents overall
say it’s extremely or very important for their children to grow up to become
people who help others in need. White evangelical Protestant parents are
especially likely to say this (89%). Slightly smaller majorities of parents
from other religious backgrounds, including 81% of Catholics and 76% of the
religiously unaffiliated, hold this view. Most parents (80%) also say it’s
extremely or very important for their children to grow up to be accepting of
people who are different from them. On this question, parents with no
religious affiliation (85%) are slightly more likely than Catholics (79%) and
Protestants (76%) to see this trait as important. Parents overall are about evenly
split on whether they are trying to raise their children similarly (43%) or
differently (44%) from how they were raised themselves. When asked in an
open-ended question in the fall 2022 survey about specific ways they are
raising their children, many parents pointed to values and religion. Among
parents who said they are raising their children similarly to their own
upbringing, 63% pointed to values and religion, but only 13% of parents who
are trying a different parenting approach cited these factors. “I am not taking my kid to the
church, and I am trying to teach my kid to be open and friendly to people
‘different’ than her.” MOTHER, AGE 44 A substantial share (17%) of
parents who are raising their children similarly to how they were raised
mentioned religion, specifically. These parents often pointed to ideas such
as passing along their religious beliefs and prioritizing faith, just as
their parents had done for them. For example, one 42-year-old mother
said, “I was raised in a very religious family, and I want my children to
share the same faith.” And a 41-year-old father said, “I am raising my kids
with a strong Christian foundation. I strive to live my life as an example of
good, godly values for my kids. I impart in them the importance of love,
family and fellowship.” Among parents who said they are
trying to raise their children differently from how they were raised, by
comparison, 7% specifically mentioned religion in their open-ended answers.
Some said they are incorporating religion into their child’s upbringing when
it had been absent from their own. Others said the opposite – that
they are intentionally raising their children with less religious involvement
than they grew up with. One 44-year-old mother said, “I am not taking my kid
to the church, and I am trying to teach my kid to be open and friendly to
people ‘different’ than her.” (PEW) FEBRUARY 6, 2023 SUMMARY
OF POLLS ASIA (Japan) Women Members Make Up Only
15% Of All Local Assemblies Ahead of unified local elections,
an Asahi Shimbun survey showed that women and young people continue to be
vastly underrepresented--if at all--on Japan’s prefectural and municipal
assemblies. In about 40 percent of the local assemblies, there were only one
or no female members. Female assembly members under age 50 made up only 2.9
percent of the total of 31,722. But young men were also hugely
underrepresented as those under 40 made up only 3.1 percent of the total. (Asahi Shimbun) February 18, 2023 (Singapore) Two In Five S’pore Adults
Report Decrease In Disposable Income, Also Expect Decline In Next Year The global economy is facing
significant challenges, as the remnant effects of Covid-19, supply chain
disruptions and rising inflation rates are felt globally. New YouGov
data indicates that consumers in Singapore are feeling the
pinch, with over two in five saying their disposable income has fallen over
the past year (42%). This compares to a fewer third who say their income has
remained the same (32%) and is triple those who say their spending power had
increased (17%). (YouGov Singapore) February 9, 2023 AFRICA (Nigeria) Nigerians Say Their Country
Is Unsafe Majorities of Nigerians say they
felt unsafe while walking in their neighbourhood (61%) and feared crime in
their home (51%) at least once during the previous year. More than
three-fourths (77%) of citizens say Nigeria is a “somewhat unsafe” or “very
unsafe” country to live in. Nigerians consider theft/break-ins, robbery, and
kidnapping the most serious threats to their safety and security in their
neighbourhoods. Most Nigerians consider abductions and kidnappings a serious
problem (84%) and believe that their number has increased over the past year
(74%). (NOI Polls) February 17, 2023 WEST EUROPE (UK) Only 7% Of Britons Test
Their Smoke Alarms As Often As They Should According to the Fire
Industry Association, you are around eight times more likely to
die from a fire if you don’t have a working smoke alarm in your home. Home
Office figures for the year ending March 2022 reveal that,
when attending house fires in homes where alarms were already fitted,
firefighters found they had failed to operate in 26% of cases. While the vast
majority of Britons (92%) say they have at least one smoke alarm in their
home, one in ten (10%) say they never test them. (YouGov UK) February 06, 2023 Britons' Attitudes
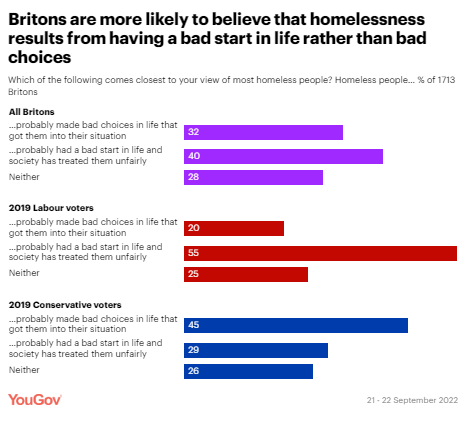
To The Homeless Britons are
divided on whether most homeless people are to blame for their situationWhen
it comes to what Britons think leads people to homelessness, the largest
number (40%) take the view that most homeless people probably had a bad start
in life and have been treated unfairly by society. Labour voters are
particularly likely to take this view (55%) compared to Conservative voters
(24%).However, 32% instead believe that most homeless people have themselves
to blame, having made bad choices that led to their situation. (YouGov UK) February 08, 2023 By 51% To 42%,
Londoners Don’t Trust The Metropolitan Police A new YouGov Political
Research poll of Londoners finds a distinct lack of trust in
the capital’s police. Half of Londoners (51%) say they don’t the Metropolitan
Police very much or at all, compared to 42% who say they do tend to trust
them (although this includes a mere 6% who say they trust them “a lot”). Among
ethnic minority Londoners this gap is even wider still: 55% say they have
little to no trust in the Met, compared to 35% who say they do. (YouGov UK) February 10, 2023 The Majority Of
The Public Believe Protests Rarely, If Ever, Make A Difference The vast majority of Britons (76%)
say they’ve never taken part in a public protest and nearly eight in ten of
those people (78%) say they are not very likely, or not at all likely, to do
so. The
recent imprisonment of Just Stop Oil activist Jan Goodey,
however, shows the kind of risk some members of the public will take to
support the causes they believe in. She is one of the 18% of Britons who say
they have taken part in a protest. (YouGov UK) February 14, 2023 One In Nine
Britons Skipped Meals In Last Three Months Because They Couldn’t Afford Food A newly released YouGov poll shows
that 14% of all Britons had to skip meals in the last 12 months because they
could not afford to eat – and one in nine Britons (11%) had to skip a meal in
the three months prior to the survey. Among working Britons these figures are
similar, at 17% and 13% respectively. The figures are drawn from data that
finds one in four Britons (25%) have ever skipped meals as an adult because
they couldn’t afford to eat. Six in ten of the Britons who say they’ve missed
meals as an adult (60%) say they did so within the previous 12 months,
including 47% who say they skipped a meal in the last three months. (YouGov UK) February 15, 2023 More Than One In
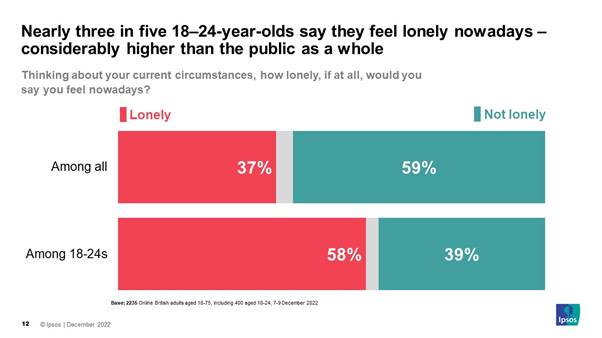
Three Britons Feel Lonely – Rising To More Than Half Of Those Aged 18-24 New research by Ipsos, in
partnership with Sky News, shows more than one in three Britons feeling
lonely, including almost 6 in 10 aged 18-24. The research highlights the
burden that many Britons continue to feel due to the cost of living, with
many struggling to make ends meet. Meanwhile, whilst a majority of Britons
feel the country works well for big business and those on high incomes, less
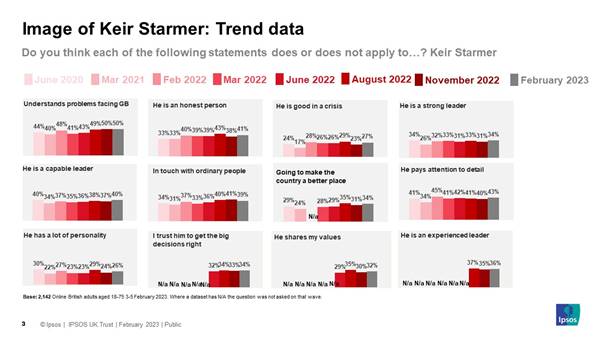
than half think it works well for other groups. (Ipsos MORI) 10 February 2023 Public Think Keir Starmer Is
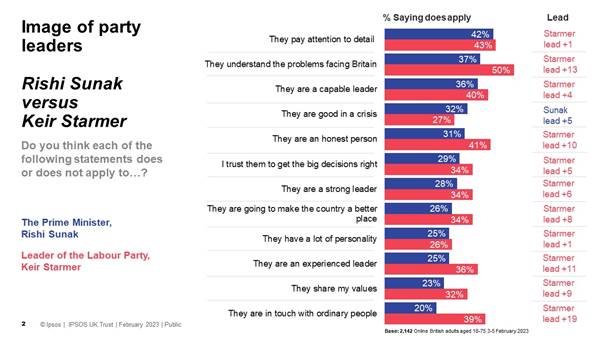
More Likely To Hold Key Leadership Traits Than Rishi Sunak New polling, conducted by Ipsos
between 3rd-5th February, shows the public are more likely to apply several
leadership traits to Keir Starmer than Rishi Sunak. The Leader of the
Opposition leads by ten points or more on being in touch with ordinary people
(39% to 20%), they understand the problems facing Britain (50% to 37%), they
are an experienced leader (36% to 25%) and being an honest person (41% to
31%). (Ipsos MORI) 10 February 2023 Half Of Britons Support A
£10 Fine For Missed NHS Appointments Fines for missing appointments is
the most popular way of those asked about among Britons to secure additional
funding to maintain the NHS, while around 7 in 10 are opposed to increasing
prescription charges and charges for GP visits. Nearly a quarter say they
have avoided making a GP appointment in the past 12 months because they found
it too difficult. Three-quarters would be willing to see their GP virtually,
including 59% who are happy to do this for advice on a minor ailment and 54%
for advice on an ongoing problem or condition (Ipsos MORI) 14 February 2023 Britons Are More Likely To
Trust Labour On Policies Surrounding Immigration And Asylum, But The
Conservatives Are Closing The Gap A third of Britons trust Labour to
have the right policies towards asylum seekers (35%) and immigration (34%),
ahead of the Conservatives on 28% - but trust in the Conservatives has risen
7-8 points since November. Only 12% say Suella Braverman is doing a good job
as Home Secretary while 37% say she is doing badly – though critics have
fallen from 50% in November, Conservative 2019 voters remain more negative
than positive. Labour continues to be more trusted to manage Britain’s taxes
and public spending as well as reducing people’s cost of living. (Ipsos MORI) 16 February 2023 (France) 2 Out Of 5 French People Say
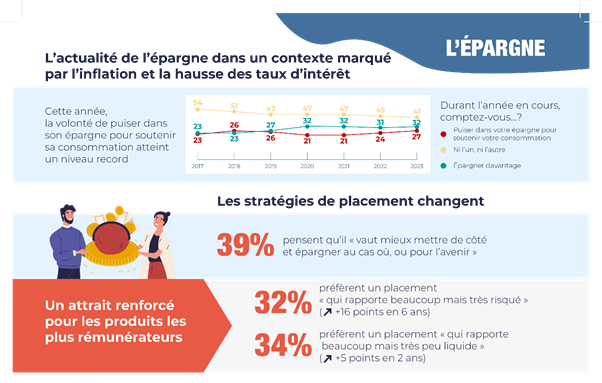
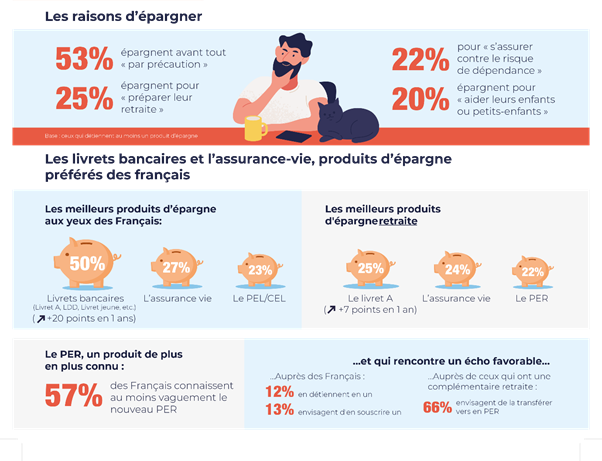
They Follow The News About Savings And Financial Products Nearly 2 out of 5 people say
they follow the news about savings and financial products, a score that has
risen sharply in a context marked by the instability of prices and
interest rates (38%, +9 points in one year). More generally, the French
say they are showing more and more interest in these subjects (50%, +5 points
in one year). The will to save remains stable (32%, +1 point), and still
clearly above the scores of 2017 and 2018 (23%) but at the same
time , the intention to dip into savings is increasing (27%, +3 points
in a year, +6 points in two years) . (Ipsos France) February 6, 2023 51% Of French People Do Not
Say They Are Particularly Afraid Of Artificial Intelligence First observation, artificial
AI is increasingly part of the landscape in France, with 2/3 of French
people declaring that they know what it is. This average should not hide
significant disparities according to CSP, gender and generations: 76% of CSP+
and 18-34 year olds, 73% of men say they know precisely and more or less what
we are talking about, compared to 57% inactive people and 55-75 year olds,
59% of women. Second lesson, 51% are not afraid of AI (including 61% of men
and 42% of women), but it still worries 37% of French people. (Ipsos France) February 7, 2023 (Germany) Interest In The Super Bowl Has
Fallen Among Germans Compared To Last Year Two YouGov polls from 2022 and 2023
show comparative results to this question (adjusted for the correct Super
Bowl date in 2022 and 2023 respectively): "On the night of February
12-13, 2023 (Sunday on Monday) to watch the Super Bowl, the final of the US
National Football League, live?” This year, every tenth German (9
percent) intends to follow the event at night and live. Another 9
percent want to watch the game or highlights from it
afterwards. Interest was stronger last year: At that time, 13 percent
said they wanted to watch the event live before the Super Bowl
night. Another 11 percent wanted to look at it afterwards or highlights
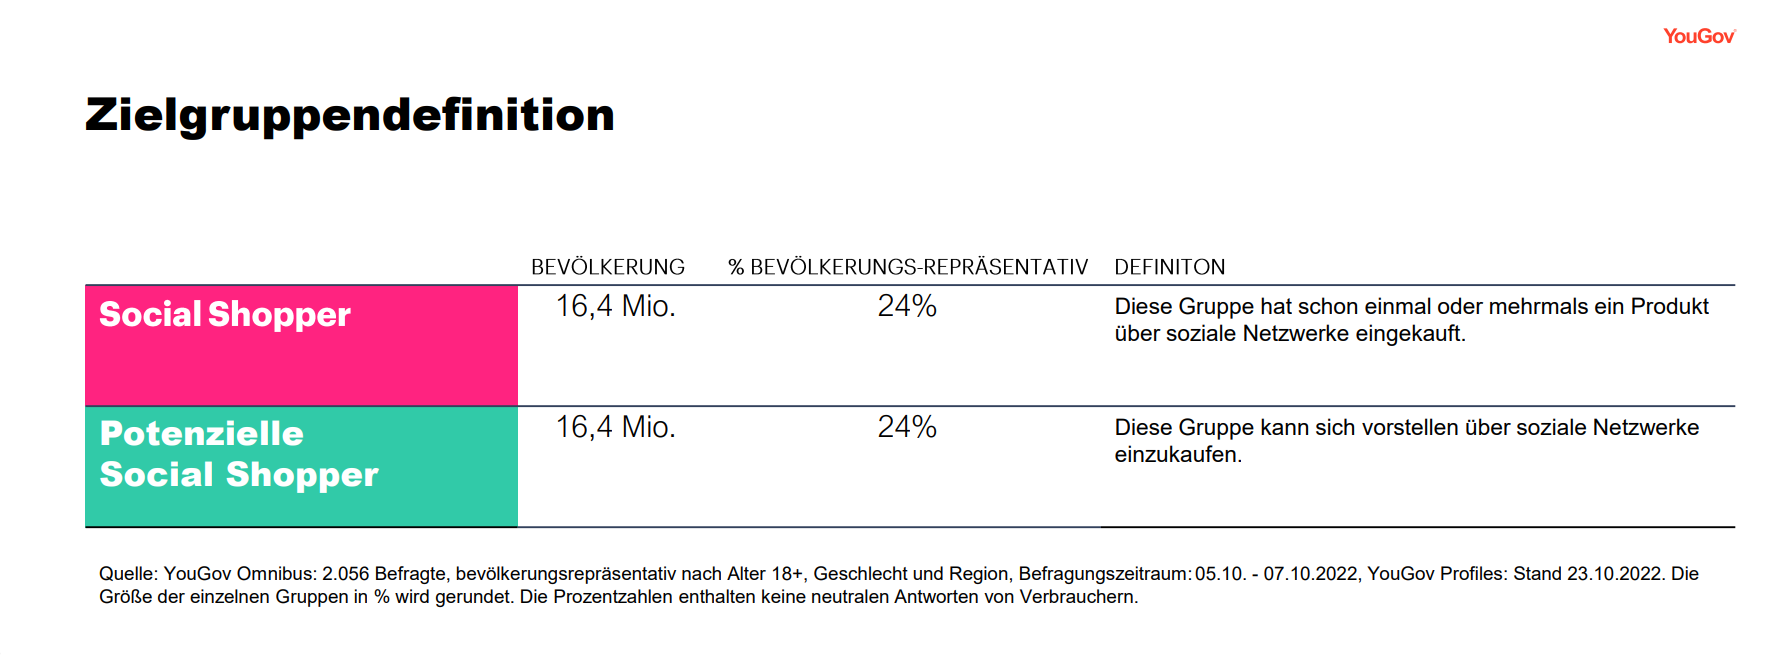
from it. (YouGov Germany) February 10, 2023 Social Shopping Is Becoming
Increasingly Popular Social media is now part of
everyday life for many consumers. In addition to information, entertainment
and social interaction, more and more shopping is taking place on social platforms. The
current target group analysis “ Social
Shopping – shopping via social media has developed into a megatrend ”
shows that more and more people are shopping via social media. Our data
shows that by 2022, nearly a quarter of consumers (24 percent) will have
purchased a product through a social network. (YouGov Germany) February 10, 2023 (Italy) Children And Parents In The
Digital World, Between Social Networks, Gaming And The Metaverse Despite the daily use of the
devices, young users are not always fully aware of how to avoid dangers,
monitor them or report them. 65% of the boys interviewed fear being contacted
by adult strangers (percentage which rises to 70% if only girls and children,
aged 12 to 14, are taken into consideration). This is followed by
bullying (57%), oversharing of personal data (54%), viewing violent (53%) or
sexually explicit content (45%), sending content you might regret (36%),
excessive spending (19%), gambling (14%). (BVA Doxa) February 07, 2023 NORTH AMERICA (USA) Americans Are Greatly
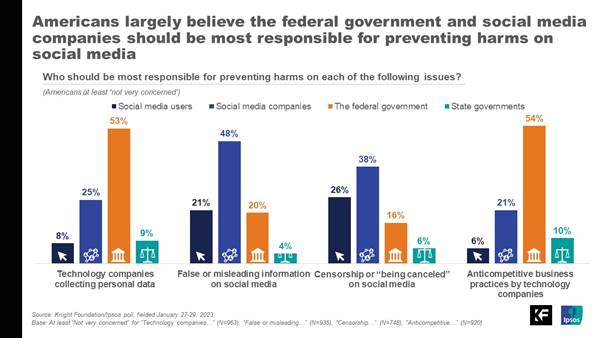
Concerned About Social Media’s Impact On Children A strong majority of Americans show
concern about the pitfalls of social media, particularly the impact it has on
children. Eighty-six percent are concerned about the impact of social media
on children’s mental health, including a slim majority that are very
concerned (55%). A similar percentage of Americans show concern about
algorithms serving inappropriate online content to children (82%) and online
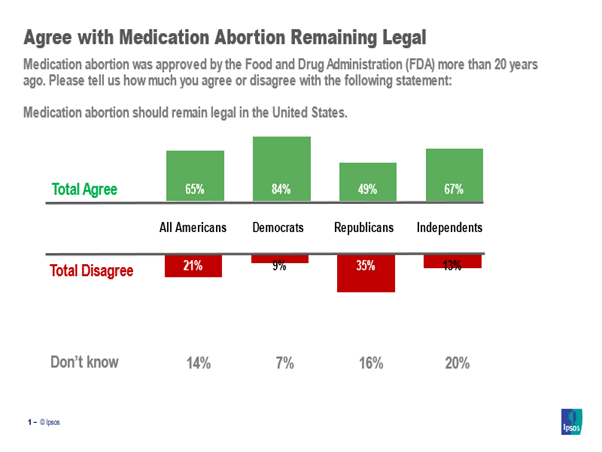
advertisements that target children (80%). (Ipsos USA) 6 February 2023 Americans Want Medication
Abortion To Remain Legal A recent Ipsos poll, conducted on
behalf of the EMAA Project, shows two-thirds of Americans want medication
abortion to remain legal in the United States, and 62% of Americans say that
banning medication abortion would harm women and their families. A
majority of Americans say they disagree with the Supreme court's decision to
overturn Roe vs. Wade (56%). Democrats (80%) are much more likely than
Republicans (35%) to say they disagree with the decision. (Ipsos USA) 13 February 2023 About a third (35%) of U.S. parents
with children under 18 say it’s extremely or very important to them that
their kids have similar religious beliefs to their own as adults, according
to a recent
Pew Research Center survey. But attitudes on this question vary by
the religious affiliation of the parents. White evangelical Protestant
parents are twice as likely as U.S. parents overall (70% vs. 35%) to say it’s
extremely or very important that their children grow up to have religious
beliefs that are similar to their own. Some 53% of Black Protestant parents
also express this view. (PEW) FEBRUARY 6, 2023 Black Americans Firmly
Support Gender Equality But Are Split On Transgender And Nonbinary
Issues About eight-in-ten non-Hispanic
Black adults say it is very important for women to have equal rights with men
(79%). The majority of Black adults (76%) also say the feminist movement has
done a great deal or a fair amount to advance women’s rights. And about half
of Black adults say feminism has helped Black women (49%).The findings in
this report emerge from four Pew Research Center surveys of U.S. adults
conducted from 2019 to 2022. (PEW) FEBRUARY 16, 2023 (Canada) More Than Three-In-Five Feel
They’re Being Asked To Tip More, And More Often New data from the non-profit Angus
Reid Institute finds so-called “tip-flation”
a key pain point. Most Canadians report being asked to tip more (62%) and
more often (64%), and in several cases, they are obliging. In 2016, 43 per
cent of Canadians said they left a tip of less than 15 per cent when they
last ate at a restaurant. Now approximately half as many (23%) say the same.
Meanwhile, one-in-five (21%) say they left a tip of 20 per cent or more when
they last dined out, more than double the rate (8%) of those who said so in
2016. (Angus Reid Institute) February 16, 2023 Fewer Canadians Rate Quality
Of Healthcare As Good (60%, Down 12 Points From 2020) With flu season in full swing, the
aftereffects of the COVID-19 pandemic and the stress it imposed on the
Canadian healthcare system continue to be felt across the country. A new
Ipsos poll conducted on behalf of Global News finds that fewer Canadians now
(60%) than in 2020 (72%) – the height of the pandemic – rate the quality of
the healthcare that they and their family have access to in Canada as good. (Ipsos Canada) 7 February 2023 Inflation Was The Grinch Who
Stole Christmas This Year, As (71%) Say They Felt The Impact Of Inflation
When Holiday Shopping According to a new Ipsos poll
conducted for RBC, seven in ten (71%) Canadians agree that they felt the
impact of inflation when holiday shopping this year, and more than half (57%)
found it hard to cover the costs of holiday gifts and expenses due to
inflation and increased costs. And over one third (36%) of those who
overspent say that it will take until April or longer to get their finances
back on track (Ipsos Canada) 17 February 2023 Nearly Half (43%) Of
Canadians Have Knowingly Been Victimized By Fraud Or Scams, In Their Lifetime reveals that fraud is perhaps more
common in Canada than we might think, as nearly half (43%) of Canadians claim
to have knowingly been victimized by fraud or scams at some point in their
lifetime. And contrary to conventional stereotypes, older Canadians (55+) are
among the least likely to report having knowingly been victimized by fraud or
scams at some point in their lifetime (31% vs. 50% aged 18-54). By
comparison, almost two-thirds (63%) of younger Canadians (aged 18-34) admit
that they’ve knowingly been the victim of fraud or scams at some point in
their lifetime. (Ipsos Canada) 17 February 2023 AUSTRALIA Over Two In Five Australians
Report Fall In Disposable Income, But More Optimistic About Next Year The global economy is facing
significant challenges, as the remnant effects of Covid-19, supply chain
disruptions and rising inflation rates are felt globally. New YouGov
data indicates that consumers in Australia are feeling the
pinch, with over two in five saying their disposable income has fallen over
the past year (46%). This compares to a fewer three in ten who say their
income has remained the same (30%) and more than double those who say their
spending power had increased (19%). (YouGov Australia) February 9, 2023 Supermarkets Remain The Most
Trusted While Qantas’ Reputation Crashes And Distrust For Optus And Medibank
Soars The previously highly trusted
QANTAS has nosedived, falling 31 places, moving from the 9th most
trusted brand in the September quarter to the 40th most
trusted brand in the December quarter. Just six months ago the national
carrier, which has been plagued by perceptions of poor customer service,
flight delays, cancellations, and rising prices, was the 6th most
trusted brand in the country. The brand now records only marginally more
trust than distrust, whereas in the past its trust far surpassed its
distrust. (Roy Morgan) February 07, 2023 Australian Unemployment
Jumps To 10.7% In January – Highest Since Jobkeeper Ended In March 2021 In January unemployment increased
1.4% points to 10.7%, according to the latest Roy Morgan employment series
data. Unemployment increased due to two factors, part-time employment
decreasing after the Christmas retailing season along with more people
joining the workforce to look for both part-time and full-time work.
Unemployment in January increased 223,000 to 1.61 million Australians (10.7%
of the workforce) and under-employment was up by 65,000 to 1.43 million (9.5%
of the workforce). Overall unemployment and under-employment was up a large
288,000 to 3.03 million (20.2% of the workforce). (Roy Morgan) February 14, 2023 ANZ-Roy Morgan Consumer
Confidence Drops To Lowest Since Early April 2020 At Only 78.1 After RBA
Increases Interest Rates To Decade High Consumer Confidence is now a large
25.1pts below the same week a year ago, February 7-13, 2022 (103.2). Consumer
Confidence is now 6.8pts below the 2023 weekly average of 84.9. Driving this
week’s decline in Consumer Confidence was increasing concern about the
performance of the Australian economy over the next year, a comparison of
personal finances compared to a year ago and whether now is a ‘good/bad time
to buy’ major household items. Consumer Confidence was down in all five
mainland States this week and under 80 in all of them except Western
Australia. (Roy Morgan) February 14, 2023 MULTICOUNTRY STUDIES The Percentage Of Consumers
Who Consult Opinions On Social Networks Before Buying A Car Is 31%, A Survey
Conducted In 17 Markets In a recent YouGov survey conducted
in 17 global markets, we asked consumers what kinds of products or services
they check on social media before purchasing certain categories of goods or
services. Mobile phones (45%) and
other technology products such as televisions
(43%) have the highest proportion of consumers who rely on
social media reviews to make a purchase decision. Reviews also play an important
role in hotels , which
are closely following mobile at 43% . (YouGov Spain) February 7, 2023 Source: https://es.yougov.com/news/2023/02/07/el-papel-de-las-redes-sociales-en-la-compra-de-coc/ In A Yougov Survey
Conducted In 18 Countries, One Fifth Of Global Consumers Consider Themselves
Price Sensitive When It Comes To Entertainment Outside The Home According to a recent YouGov survey
conducted in 18 countries, one fifth of global consumers consider themselves
price sensitive when it comes to entertainment outside the home
(19%). Being price conscious means being sensitive to price increases
and making behavioral changes, such as switching brands, comparing prices, or
not making any purchases, in this case, in response to price
increases. Leisure outside the home is one of the most price sensitive
markets, behind food (55%), utilities (36%), clothing (35%), takeaway food
(30%) and phones (20%). (YouGov Spain) February 10, 2023 Source: https://es.yougov.com/news/2023/02/10/el-precio-del-ocio-demasiado-alto-analisis-global/ Yougov Survey Of 18
International Markets Shows That Chatbots May Not Live Up To Their Potential A YouGov survey of 18 international
markets shows that chatbots may not live up to their potential as a customer
service resource for consumers shopping for out-of-home entertainment (live
concerts, sporting events, and cinemas). Despite the widespread adoption of
chatbots by companies in this sector, only a tenth of consumers globally
found chatbots helpful in their shopping experiences (11%). This low
response rate suggests they have yet to prove that they are a valuable
resource for consumers in the out-of-home entertainment sector. (YouGov Spain) February 13, 2023 Source: https://es.yougov.com/news/2023/02/13/chatbot-tecnologia-util-para-la-compra-de-eventos-/ Citizen Priorities On The Environment
And Climate Change In MENA, A Survey Among 12 Nations The results of the seventh
wave survey from Arab Barometer, a non-partisan research
network that provides insight into Arab citizen views, shed light on regional
perspectives on issues of climate change, water resources, and the
environment. Water scarcity is a universally binding challenge for countries
in the MENA region, regardless of the disparities in accessibility to
different sources of water. This view is reinforced by the results of the
survey, where citizens from all surveyed countries indicated that water
issues were their biggest environmental challenge, with citizen responses in
agreement ranging from 32% in Lebanon up to 59% in Tunisia. MENA is
considered the most
water-stressed region in the world. (Arabbarometer) February 14, 2023 What Countries Do Western
Europeans And Americans Consider To Be Similar To Their Own, A Survey Among 8
Nations A new YouGov
Political Research study conducted in Britain, Denmark,
France, Germany, Italy, Spain, Sweden and the USA, asked people to rate how
similar they consider their own country to be to between 38 and 47 different
countries. Those nations that most people in each country surveyed feel
similar to can be seen below. For Britons, Ireland tops the list, with 73%
considering it to be a similar country.* Anglophone nations like Australia
(66%), Canada (61%) and New Zealand (61%) come higher up than European
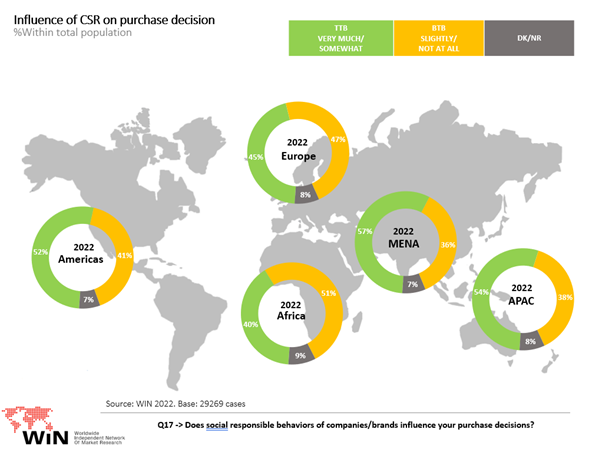
neighbours like Germany (56%) and the Netherlands (56%). (YouGov UK) February 17, 2023 Annual Win World Survey (WWS
– 2022) Exploring The Views And Beliefs Of Individuals In 36 Countries About
Corporate Social Responsibility (CSR) 51% of
respondents have heard about CSR before, with an increase of 3% compared to
last year. Companies and corporations’ responsibility towards society and the
environment is becoming an important part of the conversation, leading to
higher awareness of CSR among citizens worldwide.Respondents’ level of
education is directly linked to their level of awareness: higher education
means higher awareness of CSR. On a regional level, this varies. Europe is at
the top with the highest awareness increase (+6%) compared to the previous
year; followed by the Americas +3%. (WIN) 19 February 2023 Source: https://winmr.com/does-corporate-social-responsibility-influence-purchase-decisions/ ASIA
781-782-43-01/Polls Women
Members Make Up Only 15% Of All Local Assemblies
Ahead of unified local elections,
an Asahi Shimbun survey showed that women and young people continue to be
vastly underrepresented--if at all--on Japan’s prefectural and municipal
assemblies. In about 40 percent of the local
assemblies, there were only one or no female members. Female assembly members under age
50 made up only 2.9 percent of the total of 31,722. But young men were also hugely
underrepresented as those under 40 made up only 3.1 percent of the total. Kazunori Kawamura, an associate
professor of political science at Tohoku University, said it was
difficult for women to run for local office because there still existed in
some communities the strong sentiment that they were incapable of holding public
office. “The structure continues to make it
difficult for women because many local assemblies have not moved away from a
tendency to have older male members who are elected for many terms,” Kawamura
said. “There is the fear that discussions will not be conducted on policies
for women and young people that the local communities need.” The Asahi Shimbun has conducted
surveys of local assembly makeup in conjunction with unified local elections
held every four years. Elections will be held this spring in 40 percent of
the local assemblies with one or no female members. Women made up 15.6 percent of all
local assembly members. While the figure has been slowly increasing from the
11.7 percent in 2015 and 13.2 percent in 2019, the number is similar to the
low figures for female Diet members. Only 10 percent of Lower House members
are women, while the ratio in the Upper House is 25.8 percent. There has also been a gradual
decline in the percentage of local assemblies with one or no female members,
with the figures falling from 49.3 percent in 2015 to 44.7 percent in 2019
and 38.7 percent this year. At the same time, there were four
municipal assemblies where women made up half of the members--Kiyose in
western Tokyo, Shimamoto and Toyono towns in Osaka Prefecture and Ono city in
Hyogo Prefecture. (Asahi Shimbun) February 18, 2023 Source: https://www.asahi.com/ajw/articles/14842725
781-782-43-02/Polls Two
In Five S’pore Adults Report Decrease In Disposable Income, Also Expect
Decline In Next Year
The global economy is facing
significant challenges, as the remnant effects of Covid-19, supply chain
disruptions and rising inflation rates are felt globally. New YouGov
data indicates that consumers in Singapore are feeling the
pinch, with over two in five saying their disposable income has fallen over
the past year (42%). This compares to a fewer third who say their income has
remained the same (32%) and is triple those who say their spending power had
increased (17%). When asked about their financial
outlook for the year to come, similar proportions expect a fall in disposable
income (40%), although slightly more express uncertainty (14% for next 12
months, versus 9% for past 12 months).
YouGov’s latest report, Financial
Outlook 2023: Navigating the storm, uncovers who has been most
affected by these ongoing crises, changes to consumer financial priorities,
and how financial institutions can support the changing needs of different
consumers. By understanding these, financial services marketers can gain a
better understanding of consumer sentiment, behaviour, and attitudes around
the evolving financial landscape. The report additionally highlights
what people in Singapore are doing with their money. Insurance and savings
emerged as the most common financial activities in the last 12 months for two
in five locally (43% for savings, 39% for health insurance) – with those aged
25–34 most likely to do both (59% for savings, 49% for health insurance).
Life or critical illness insurance was the third most common activity (28%). The next tier of activities
comprises of a mix of future proofing and money management. Making
investments into stocks and shares was done by a quarter of Singapore
consumers (26%), and more among those aged 25–34 again (42%). One in six made
regular payments on mortgage or home loans (17%) as part of money management.
At the same time, growing
inflation, rising cost of energy, and higher interest rates are pushing
consumers to take increasing measures to track, review and adapt their
spending – changing the dynamics of how they manage their finances. Though
three in ten Singapore adults (30%) state that they do not need help with
managing their money, the situation is significantly different among young
consumers. Over four-fifths of 18–24-year-olds (81%) and 25–34-year-olds
(82%) report that they need some kind of assistance to manage their money
better. An understanding of how to use
investments to grow their money is the top priority of those aged 18–34 (45%
for 18–24, 47% for 25–34). This is followed by help in planning for future
life events (44%), assessing finances and improving their financial situation
(43%) and budgeting and tracking expenses (42%) for the younger group. Those
aged 25–34 are of similar opinion, with the addition of learning how to
better manage their money (40%) as the second most important avenue of help.
(YouGov Singapore) February 9, 2023 Source: https://sg.yougov.com/en-sg/news/2023/02/09/two-five-spore-adults-report-decrease-disposable-i/ AFRICA
781-782-43-03/Polls Nigerians
Say Their Country Is Unsafe
In Nigeria, crime and violence are
everyday news. From jihadist attacks by Boko Haram and the Islamic State West
Africa Province to herder-farmer conflict to kidnapping-for-ransom by
bandits, violence has surged across all 36 states and the Federal Capital
Territory Abuja without much success by government agencies trying to curb
insecurity ahead of the 2023 general elections (Nextier, 2022; Daka, 2022). Recent headlines hardly scratch the
surface: a deadly attack on an Abuja-Kaduna train in which 61 people were
kidnapped for ransom (Ojiego, 2022); an attack on President Muhammadu
Buhari’s convoy in his home state (Ayitogo, 2022); killings and kidnappings
of religious worshipers and clergy (Mwai, 2022; Associated Press, 2022; Al
Jazeera, 2022; Premium Times, 2022). Armed bandits killed more than 2,600
civilians in 2021 (Global Centre for the Responsibility to Protect, 2022),
and violence of all kinds only intensified in 2022 (ACLED, 2022; Yusuf,
2022). The latest Afrobarometer survey in
Nigeria shows that people’s concern about crime/insecurity also continues to
rise, as a growing number rank it as the most important problem their
government should address. A majority of citizens report feeling unsafe and
describe Nigeria as an unsafe place to live. Most consider abductions a “very
serious” problem. Most also distrust the police and give their government a
failing grade on fighting crime. Afrobarometer surveys Afrobarometer is a pan-African,
nonpartisan survey research network that provides reliable data on African
experiences and evaluations of democracy, governance, and quality of life.
Eight rounds of surveys have been completed in up to 39 countries since 1999.
Round 9 surveys (2021/2022) are currently underway. Afrobarometer conducts
face-to-face interviews in the language of the respondent’s choice. The Afrobarometer team in Nigeria,
led by NOIPolls, interviewed a nationally representative, random, stratified
probability sample of 1,600 adult Nigerians between 5 and 31 March 2022. A
sample of this size yields country-level results with a margin of error of
+/-2.5 percentage points at a 95% confidence level. Previous standard surveys
were conducted in Nigeria in 2000, 2003, 2005, 2008, 2013, 2015, 2017, and
2020. Key findings
o Almost six in 10 respondents
(58%) rate the handling of kidnappings and abductions by the police as
“fairly bad” or “very bad.”
Crime/insecurity a top priority for
Nigerians Nigerians are acutely concerned
about security. When asked what they consider the most important problems
that the government should address, crime/security comes out on top, cited by
41% respondents as one of their three priorities. Management of the economy
comes second (39%), followed by unemployment (35%) and electricity (34%)
(Figure 1). Figure 1: Most
important problems | Nigeria | 2022
Respondents
were asked: In
your opinion, what are the most important problems facing this country that
government should address? (Figure shows % of respondents who cited each issue
as one of up to three important problems.) Crime/security has climbed
dramatically in importance, gaining 32 percentage points since 2017 (Figure
2). Figure 2: Crime
and security as most important problem | Nigeria |
2007-2022
Respondents
were asked: In
your opinion, what are the most important problems facing this country that
government should address? (Figure shows % of respondents who cited crime and
security as one of up to three important problems.) Insecurity and fear of crime In line with their concern about
security, a growing proportion of Nigerians report feeling unsafe (Figure 3).
Six in 10 citizens (61%) say they felt unsafe walking in their neighbourhoods
“once or twice,” “several times,” “many times,” or “always” during the
previous year, almost twice as many as reported this experience in 2017
(33%). More than half (51%) say they feared crime in their homes at least
once during the past year, a 23-percentage-point jump from 2017 (28%). Figure 3: Sense of
insecurity | Nigeria | 2015-2022
Respondents
were asked: Over
the past year, how often, if ever, have you or anyone in your family: Felt
unsafe walking in your neighbourhood? Feared crime in your home? (% who say
“just once or twice,” “several times,” “many times,” or “always”) Men and women are about equally
likely to report feeling insecurity and fear (Figure 4). More Northerners
than Southerners say they felt unsafe walking in their neighbourhoods (65%
vs. 56%) and feared crime in their homes (59% vs. 42%). Fear of crime is
somewhat more common in rural than in cities (53% vs. 47%). Younger respondents are more likely
to report feelings of insecurity and fear than their elders. And these
experiences are more widespread among poor citizens[1] and
those with no formal schooling than among better-off citizens and those with
secondary or post-secondary education. Figure 4: Sense of
insecurity | by demographic group | Nigeria | 2022
Respondents
were asked: Over
the past year, how often, if ever, have you or anyone in your family: Felt
unsafe walking in your neighbourhood? Feared crime in your home? (% who say
“just once or twice,” “several times,” “many times,” or “always”) Given how many people experience
feelings of insecurity and fear, it comes as no surprise that more than
three-fourths (77%) of respondents say Nigeria is a “somewhat unsafe” (30%)
or “very unsafe” (47%) country to live in (Figure 5). Only 23% consider
Nigeria to be “somewhat” or “very” safe. Similarly, a large majority (72%)
say the country has become “somewhat less safe” (36%) or “much less safe”
(36%) over the past five years (Figure 6). Figure 5: Is
Nigeria safe? | Nigeria | 2022
Respondents
were asked: In
general, would you say Nigeria is a safe or unsafe country to live in? Figure 6: Has
Nigeria become safer or less safe? | Nigeria | 2022
Respondents
were asked: Looking
back over the last five years, do you feel that Nigeria has become safer or
less safe? Asked what they consider the most
serious threat to safety and security in their neighbourhood, the most common
response is theft/break-ins (23%), followed by robbery (11%), kidnapping
(10%), theft of livestock (7%), gang violence (7%), and drug or alcohol abuse
(5%) (Figure 7). Rural residents are somewhat more likely than urbanites to
cite kidnapping (11% vs. 8%) and theft of livestock (10% vs. 2%) as threats,
while citizens living in urban areas are more concerned than their rural counterparts
about robbery (15% vs. 9%), gang violence (9% vs. 5%), and drug or alcohol
abuse (8% vs. 3%). Figure 7: Most
serious threat to safety and security in neighbourhood |
by urban-rural location | Nigeria | 2022
Respondents
were asked: In
your opinion, what is the most serious threat to your safety and security in
your neighbourhood? Kidnapping in Nigeria While only one in 10 Nigerians cite
kidnapping as the most serious threat in their own neighbourhood, an
overwhelming majority (84%) consider abductions and kidnappings a serious
problem in their country, including 65% who say they are a “very serious”
problem (Figure 8). And three-fourths (74%) say the number of abductions or
kidnappings of citizens in the country has increased over the past year
(Figure 9). Almost six in 10 citizens (58%) say
the police do a “fairly bad” or “very bad” at handling abductions and
kidnappings, while only 38% rate their efforts positively (Figure 10). Figure 8:
Abduction and kidnapping: A serious problem? | Nigeria
| 2022
Respondents
were asked: How
serious of a problem are abductions and kidnapping of citizens in our country
today? Figure 9: Has the
number of abductions/kidnappings increased? | Nigeria
| 2022
Respondents
were asked: In
your opinion, over the past year, would you say the cases of abduction or
kidnapping in this country have increased, decreased, or stayed the same? Figure 10: Police
handling of abduction and kidnapping | Nigeria | 2022
Respondents
were asked: How
well or badly would you say the police is handling the kidnapping or
abduction of Nigerian citizens? Reporting security concerns When Nigerians are concerned about
their security, to whom do they turn first for assistance? Only 17% cite the
police as their first point of contact. More say they look first to community
or traditional leaders (30%), other family members (26%), or the
neighbourhood, including neighbourhood watch programmes (18%) (Figure 11). Rural residents are twice as likely
as urbanites to say they turn first to community or traditional leaders (38%
vs. 19%), and only half as likely to put the police first (11% vs. 24%). Figure 11: First
point of contact for security concerns | Nigeria |
2022
Respondents
were asked: To
whom do you normally go to first for assistance, when you are concerned about
your security and the security of your family? Trust in and perceived corruption
among the police Nigerians generally distrust their
police. Only 3% say they trust the police “a lot,” while 12% say they trust
them “somewhat” – the lowest trust rating among key public institutions the
survey asked about (Figure 12). Trust in the police has never reached 30%
over the past two decades, and has declined by 12 percentage points since
2017 (Figure 13). Southerners (7%) and highly
educated citizens (9%) are less likely to trust the police than Northerners
(23%) and less educated citizens (23% among those with no formal schooling)
(Figure 14). One reason for low public trust in
the police may be widespread perceptions that the police are corrupt. Almost
three-fourths (73%) of citizens say “most” or “all” police are corrupt, the
worst rating among key public officials the survey asked about (Figure 15). Figure 12: Trust
in institutions | Nigeria | 2022
Respondents
were asked: How
much do you trust each of the following, or haven’t you heard enough about
them to say? Figure 13: Trust
the police ‘somewhat’ or ‘a lot’ | Nigeria | 2000-2022
Respondents
were asked: How
much do you trust each of the following, or haven’t you heard about them to
say: The police? (% who say “somewhat” or “a lot”) Figure 14: Trust
the police ‘somewhat’ or ‘a lot’ | by demographic
group |
Nigeria
| 2022
Respondents
were asked: How
much do you trust each of the following, or haven’t you heard about them to
say: The police? (% who say “somewhat” or “a lot”) Figure 15: Who is
corrupt? | Nigeria | 2022
Respondents
were asked: How
many of the following people do you think are involved in corruption, or
haven’t you heard enough about them to say? Government performance in fighting
crime Overall, few Nigerians offer
positive assessments of the government’s performance on reducing crime. Only
two in 10 citizens (21%) say the government is performing “fairly well” or
“very well” on this issue, while 79% are critical of the government’s efforts
(Figure 16). Negative assessments of the government’s performance on crime
have climbed by 32 percentage points since 2017, when they briefly dipped
below half of survey respondents (47%). Figure 16:
Government performance in reducing crime | Nigeria |
2005-2022
Respondents
were asked: How
well or badly would you say the current government is handling the following
matters, or haven’t you heard enough to say: Reducing crime? Southerners are especially critical
of the government’s anti-crime efforts (89%, vs. 70% of Northerners) (Figure
17). Appraisals are more negative among women than men (81% vs. 77%) and
among urban than rural residents (83% vs. 76%). Disapproval increases with
respondents’ education level, ranging from 69% among those with no formal
schooling to 86% among those with post-secondary qualifications.
Figure 17:
Government performance in reducing crime | by
demographic
group
| Nigeria | 2022
Respondents
were asked: How
well or badly would you say the current government is handling the following
matters, or haven’t you heard enough to say: Reducing crime? Conclusion Nigerians are deeply concerned
about crime and insecurity and consider these a top priority for the government
to address. Fear is increasing, to the point where most citizens now consider
their country an unsafe place to live. Addressing economic and social root
causes of escalating crime and violence is likely to be a daunting challenge
for years to come. In the meantime, the establishment of a trustworthy,
respected police force might at least help assuage the citizenry’s concerns. (NOI Polls) February 17, 2023 Source: https://noi-polls.com/insecurity-top-priority-for-government-action/ WEST EUROPE
781-782-43-04/Polls Only
7% Of Britons Test Their Smoke Alarms As Often As They Should
According to the Fire
Industry Association, you are around eight times more likely to
die from a fire if you don’t have a working smoke alarm in your home. Home
Office figures for the year ending March 2022 reveal that,
when attending house fires in homes where alarms were already fitted,
firefighters found they had failed to operate in 26% of cases. Guidance from Fire
England recommends that people test their smoke alarms at
least once a month, but a new YouGov RealTime survey
has revealed that only 7% of Britons say they test their smoke alarms this
often. While the vast majority of Britons
(92%) say they have at least one smoke alarm in their home, one in ten (10%)
say they never test them. One in five (21%) say they test their
smoke alarms once every six to twelve months – the most popular frequency –
followed by 16% who say they only test their alarms once every one to two
years.
How many Britons
have a smoke alarm on every level of their property? Advice from Fire
England recommends that you have at least one smoke alarm on
every level of your home. While 70% of Britons say they have followed this
guidance, 22% say they don’t have a smoke alarm on every level of their
property, with a further 4% saying their home doesn’t have one at all. In Scotland, where a
new law came into force in February 2022 requiring every home
to have smoke alarms on each storey, 82% of people say they have at least one
on every level in their home compared to 69% in England.
(YouGov UK) February 06, 2023
781-782-43-05/Polls Britons'
Attitudes To The Homeless
Britons are divided on whether most homeless people are to
blame for their situation As the cost
of living crisis bites, and the shortage of affordable housing in
Britain continues to hit the headlines,
analysis from the homelessness charity Crisis and Heriot-Watt University
suggests that 300,000
households will be at risk of homelessness this year. Now, new YouGov data sheds some
light on public attitudes towards homelessness and how the government should
be tackling it. Britons are
divided on why people end up being homeless However, 32% instead believe that
most homeless people have themselves to blame, having made bad choices that
led to their situation. Conservative voters are most likely
to endorse this view (45%), compared to only 20% of Labour voters believing
this to be the case.
How big a priority
should reducing homelessness and providing social housing be for local
authorities? From a list of 12 responsibilities
placed on local authorities by national government, three in ten Britons
(30%) consider reducing homelessness to be a top-three priority for council
spending. This puts it on a par with children’s social services, but behind
provision of social care (42%), and maintaining the roads (34%). Social
housing came next in the rankings, tied with bin collections and recycling,
with 26% overall considering these to be a top priority for local
authorities.
Few Britons are
keen to give their own money to the homeless Most Britons would be unlikely to
give money directly to a person who appeared to be homeless. Only 17% of
Britons would be likely to give money to someone who approached them on the
street, versus seven in ten (68%) who say they would be unlikely to.
When asked why they wouldn’t give
money, the most common reason given, at 38%, is the expectation that the
money would end up being spent on alcohol and drugs. Some are also doubtful
that the individual would really be in need (14%), with 7% suggesting that
the homeless should be earning their own money, not asking others for it. A
third (32%) say they simply cannot afford to give money to people. Instead, 34% say they would prefer
to buy the individual something rather than giving them money, with a quarter
(25%) believing their money to be better spent donating to a homelessness
charity.
A third of Britons
believe there are more homeless people in their local area than there were
ten years ago According to latest
figures from the ONS, there were 2,440 rough sleepers in England
in 2021. This is up slightly from 1,768 people in 2010, but is down from a
peak of 4,751 in 2017. Our data shows that a third (33%)
of Britons now believe there to be more homeless people in their local area
than there were ten years ago, down from 47% in 2018, whilst a further 34%
have not seen any change, with only 6% believing it to have reduced.
In London and other urban areas,
rough sleeping, the most visible form of homelessness, is a larger
problem than elsewhere in the country. The Combined
Homelessness and Information Network (CHAIN) report that 8,329 people slept
rough in London in 2021, with their latest
report finding that 3,628 people in London slept rough
between July and September 2022. This is reflected in the results.
Those living in urban areas are much more likely to believe homelessness to
have risen over the last ten years (35%), compared to those in town and
fringe areas (21%) and rural areas (26%). Those in London are particularly
likely to believe there to be more homeless people now than ten years ago
(44%).
Britons don’t
believe the government is doing enough to tackle homelessness Two thirds (65%) of Britons believe
that the government is not doing enough to tackle homelessness in the UK,
with only one in nine (11%) believing they are doing enough and just 2%
believing they are doing too much. Labour voters are especially likely to
believe the government are doing too little (81%), with half of Conservative
voters (51%) also saying so.
When it comes to
choosing which homeless groups the government should be prioritising in the
face of a shortage of housing, people with dependent children and victims of
domestic violence come top When allocating their limited
housing stocks, local authorities have a system of ‘priority
need’ to ensure that housing is first given to those most in
need of it, as opposed to those who have been waiting for longest. But who
would Britons prioritise if they were deciding? The two groups that the most
Britons believe are in the greatest need are people with dependent children
(48%), and victims of domestic violence (42%). Elderly people (33%) and
military veterans (26%) also score highly. Lower priority for many Britons are
people with addiction problems (3%) and refugees (5%).
February
08, 2023 Source: https://yougov.co.uk/topics/politics/articles-reports/2023/02/08/britons-attitudes-homeless
781-782-43-06/Polls By
51% To 42%, Londoners Don’t Trust The Metropolitan Police
While there is no
gender divide regarding the Met, women are notably less likely than men to
trust individual police officers This week saw former Metropolitan
Police officer David Carrick sentenced for his 17 years of sex crimes against
women. With memories of the 2021 murder of Sarah Everard by Met Officer Wayne
Couzens fresh in the public memory, as well as revelations of more
widespread unacceptable behaviour at the institution, it is no
surprise that a new YouGov Political Research poll of Londoners finds a distinct
lack of trust in the capital’s police. Half
of Londoners (51%) say they don’t the Metropolitan Police very much or at
all, compared to 42% who say they do tend to trust them (although this
includes a mere 6% who say they trust them “a lot”).
While the most recent high profile
cases against Met officers have been for sexual violence against women, the
results among men and women are effectively identical. There is, however, a noticeable
difference between men and women when it comes to trust in individual police
officers. While men tend to trust them by 50% to 39%, women are divided, with
44% distrusting individual officers compared to 41% who tend to trust them.
Ethnic minority Londoners are less
trusting of individual police officers still, with 50% lacking trust in them
compared to 37% who do tend to trust them. Older Londoners are more likely to
have trust in the police than younger Londoners. For instance, while 53% of
those aged 65 and above, and 51% of 50-64 year olds, have a lot or fair
amount of trust in individual police officers, this falls to 36% among 18-24
year olds. February
10, 2023
781-782-43-07/Polls The
Majority Of The Public Believe Protests Rarely, If Ever, Make A Difference
Most Britons –
including protestors themselves – say that disruptive protests do more to
hinder than help a cause The recent imprisonment of Just Stop Oil activist Jan
Goodey, however, shows the kind of risk some members of the public will take
to support the causes they believe in. She is one of the 18% of Britons who
say they have taken part in a protest.
Environmental
issues, war and Brexit are the most common causes Britons say they’ve
protested about Nearly two-thirds (64%) of those
who have protested say they’ve done so repeatedly, with 5% of demonstrators
saying they’ve protested publicly 20 times or more. Labour voters are more than three
times as likely to say they’ve ever protested than Conservative supporters,
by 32% to 9%. At 22% to 13%, those in ABC1 households (which are typically
more middle class) are more likely than those in C2DE households (typically
more working class) to say they’ve taken part in a public protest. When asked what causes had inspired
them to protest, Britons who have taken part in demonstrations are most
likely to cite the environment and climate related issues (18%), war
including conflicts in Iraq, Vietnam and Ukraine (13%) and Brexit (11%).
How much of a
difference does protesting make? According to most Britons, very little Nearly three-quarters of the public
(73%) say they think protests rarely, if ever, make a difference, including
13% who believe they never do. Older people are more pessimistic
than the younger generation in this respect, with nearly nine in ten over-65s
(87%) saying protests don’t often, or never, make a difference and just 9%
saying they do so very or fairly often. In contrast, youngsters aged
between 18 and 24 are three times more likely to say they think protesting
often does make a difference (28%), though around half still believe it
infrequently, or never, does (51%).
Even among the 18% of Britons who
have taken part in public protest, six in ten think it either didn’t make a
difference very often (47%) or never did (14%).
A large majority
of Britons – including six in ten protesters – say disruptive protesting
hinders rather than helps a cause Climate activists Just Stop Oil are
the latest band of campaigners to grab headlines with a series of provocative
protests. From
throwing soup over Van Gogh’s Sunflowers to holding
up traffic on the M25, the group’s contentious methods have
generated a huge amount of publicity. Many campaigners believe so-called
direct action – such as defacing public property, blocking traffic or gluing
people to roads or objects – is an effective way of drawing attention to
their cause. But the vast majority of Britons
(78%) say this kind of protesting hinders, rather than helps a cause –
including 61% who believe it hinders “a lot”. And even among those who say they
have taken part in protests, six in ten (60%) say such protesting hinders a
cause, with a third (33%) saying it helps. Nearly all Conservative voters
(94%) say such protests hinder campaigners and their causes, while just 3%
believe they help. Likewise, two-thirds of Labour supporters (66%) also think
it hinders the protestors’ cause, but nearly a quarter (24%) say direct
action like this helps.
While all age groups are more
likely to say such protests hinder rather than help, 18 to 24-year-olds are
far more likely than their elders to believe in their effectiveness, with 27%
saying this kind of protest helps a cause, compared to 5% of over-65s. February
14, 2023
781-782-43-08/Polls One
In Nine Britons Skipped Meals In Last Three Months Because They Couldn’t
Afford Food
Around a quarter
of parents say they missed meals within the last year to feed their children
instead The continuing cost of living
crisis means many Britons will begin 2023 struggling to make ends meet, while
foodbank use is soaring across the country as people turn for
help in putting food on the table.
A quarter of
parents missed meals within the last year to afford to feed their children Overall, 24% of British parents
with children under the age of 18 say they have missed meals within the last
year in order to afford to feed their children instead, including 18% who did
so in the last 3 months and 13% who had done so in the last month.
Older Britons are
the least likely to say they have skipped meals in childhood While 13% of Britons who say they
had to miss food in childhood because their family could not afford to eat,
older Britons are slightly less likely to say (or remember) that this
happened to them when they were young. Among those aged 55 and above, 10%
say they missed meals when they were children, compared to 14-19% of those
aged 18-44.
February
15, 2023
781-782-43-09/Polls More
Than One In Three Britons Feel Lonely – Rising To More Than Half Of Those
Aged 18-24
Loneliness and
free time Ipsos interviewed 2,235 British
adults aged 18-75 online between December 7-9, 2022; including 400 Britons
aged 18-24. The research showed that 37% said they felt very or fairly lonely
nowadays, with 59% saying they felt not very lonely or not lonely at all. The
proportion of Britons feeling lonely increases to 58% among those aged 18-24.
When asked how this had changed
over time, 1 in 4 Britons (25%) said they felt more lonely than a year ago,
9% said they felt less lonely but most (63%) said there had been no change.
However, among the 18-24 age cohort, 37% said they felt more lonely and 20%
said they felt less lonely (perhaps reflecting the variety of life stages of
respondents within this group). When asked how much free time they
have on an average week, around half of Britons either say they have more
than they need (19%) or less (30%) with little difference observed among the
18-24 cohort. Overall, one in four Britons (24%) say they have less free time
than a year ago, rising to 36% among 18-24s (although this group are also
more likely than average to say they have more free time as well – 27% to
15%). Cost of living
The research shows the continued
burden Britons feel due to the cost of living. One in three (33%) say they
have found it difficult to afford paying their energy bills in the three
months before the survey (a figure largely unchanged when we asked the same
question in October and August last year). Around one in four (27%) say they
have found it easy with 37% saying it has been neither easy nor difficult.
Those with children and those in the 25-34 age bracket (both 44%) and
those in households earning less than £20,000 a year (41%) are some of the
most likely groups to have found things difficult. Meanwhile, 30% of those
paying housing costs (rent or mortgage payments) say they have increased in
the past three months. Research findings also show the
unique impact the rising cost of living has had on young people. Those aged
18-24 are more likely than the overall population to say they have worked
more hours (45% of 18-24s in work versus 31% overall), skipped meals (35%
versus 24%), borrowed more money (30% versus 14%) or had to move back in with
families (23% versus 6%) in response to the crisis. 45% of 18-24s say they
have socialised less – though this is similar to the 43% that say this
overall – and more than half (53%) say they have not turned their heating on
when they usually would have (though this is more common in the wider
population (62%).
Who does the
system work for? When asked about the system more
generally, clear majorities say the system of government in the UK works well
for people on high incomes (70%) and big business (64%). However, less than
half say it works well for all other groups with clear majorities saying it
specifically works badly for ‘people like me’ (55%) and people on low incomes
(63%). Just one in ten think the system works well for young people, with
half saying it works badly, with similar findings observed when the public is
asked about small business owners or regions in the north of England.
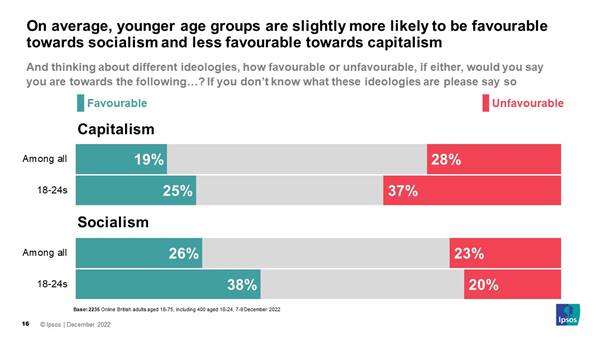
When asked to compare capitalism
and socialism, at least half cannot form a view either way. 19% have a
favourable opinion of Capitalism and 28% are unfavourable with the rest
neutral or saying they don’t know or haven’t heard of the ideology. 26% are
favourable towards socialism and 23% unfavourable. Those aged 18-24 are more
positive about capitalism overall (25% favourable) but also more negative
(37%) unfavourable. However, when it comes to socialism, they are more
positive still (38% favourable) but are no more negative than the overall
population (20% versus 23%).
Keiran Pedley,
Director of Political Research at Ipsos, said: These findings
show that the cost of living continues to be a burden for Britons, with many
still struggling to pay their bills. Whilst young Britons are not the only
group affected, there does appear to be a unique nature to how they are
experiencing the rising cost of living. A majority feel lonely and many are
working longer hours or socialising less, with some having to move in with
family members or skip meals to make ends meet. Overall, it is not surprising
therefore that many Britons do not see the system of government in the UK
working well for anyone other than big business or people on high incomes. 10
February 2023 Source: https://www.ipsos.com/en-uk/more-one-three-britons-feel-lonely-rising-more-half-those-aged-18-24
781-782-43-10/Polls Public
Think Keir Starmer Is More Likely To Hold Key Leadership Traits Than Rishi
Sunak
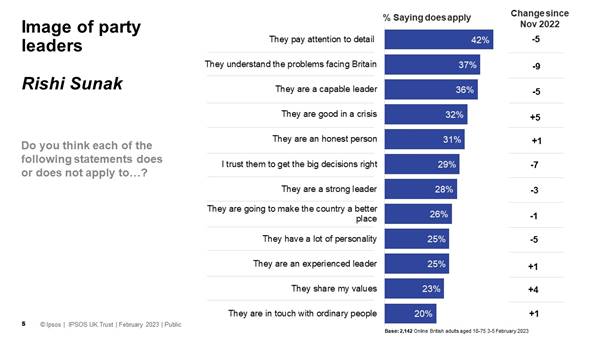
Meanwhile, Sunak sees a lead of
5ppt when it comes to being good in a crisis, a third (32%) say this applies
to the Prime Minister, compared to 27% who say the same for the Labour
Leader. The two party leaders see similar
scores regarding paying attention to detail, 42% say Sunak has this trait
while 43% say the same for Starmer and being a capable leader, 36% apply this
to Sunak and 40% to Starmer. Neither leader appear to be known for their
personality with around 1 in 4 applying the trait to both (25% Sunak, 26%
Starmer). Since November 2022, Starmer has
seen little change in how the public apply various traits, he has seen an
increase in those who say he is good in a crisis (+4ppts), he is a strong
leader, he is a capable leader, he is going to make the country a better
place, an honest person and he pays attention to detail (all +3ppts).
Meanwhile, Sunak’s scores have
generally worsened in that time. The proportion who say the Prime Minister
understands the problems facing Britain has fallen by 9ppts while we see
falls of 5ppts regarding paying attention to detail, being a capable leader
and having a lot of personality. However, we do see increases in the
proportion who believe he is good in a crisis (+5ppts) and that he shares
their values (+4ppts).
Keiran Pedley,
Director of Politics at Ipsos, UK says: These numbers
reflect recent Ipsos polling showing Rishi Sunak’s personal poll ratings
weakening slightly in early 2023. Keir Starmer leads the Prime Minister on
several key leadership attributes and Labour holds a healthy poll lead
overall. Time will tell if the Prime Minister can turn his party’s fortunes
around, with delivery on his five key pledges likely to be a key factor in
whether he can. 10
February 2023
781-782-43-11/Polls Half
Of Britons Support A £10 Fine For Missed NHS Appointments
As the NHS becomes the most
mentioned issue facing the country in our January Issues Index, we see mixed
levels of support for different suggested measures to secure additional
funding to maintain the health service. Support is highest for charging
people who miss appointments. Around half (51%) support a £10 fine for missed
appointments (such as GPs or hospital appointments) while a third (34%) are
opposed to the idea. Support is much lower for other
propositions. Only 12% support increasing prescription charges from £9.35 to
£15 while 7 in 10 are opposed (72%). Similarly, 15% support being charged a
£10 fee for a visit to the GP, 71% are against.
The British public aged 18 to 75
are generally open to video consultations, although more so in some scenarios
than others. Overall, more than 3 in 4 say they would be willing to see their
own GP virtually in at least one of the circumstances given. More
specifically, 59% would be willing to talk online to their GP for advice on a
minor ailment and 54% would do so for advice on an ongoing condition or
problem. There is less willingness to speak virtually regarding immediate or
emergency medical advice (22%). Just under 1 in 5 say they would not be
willing to speak to a GP virtually in any of these circumstances (18%). Among those who are willing to see
a GP virtually, 88% would be willing to see a GP who they didn’t already know
for at least one of the circumstances given. Around 2 in 3 (68%) would be
willing to do so for a minor ailment, decreasing to half (50%) who would be
willing to do so for an ongoing condition and a quarter (25%) for emergency
medical advice.
Looking back over the last year,
just under half of Britons say they have avoided making a general practice
appointment (45%). This includes around a quarter (23%) who say this is
because they found it too difficult while 13% say they were worried about
being a burden on the NHS and 11% say they didn’t have time. One in 10 (9%)
say they were worried about the risk of catching Covid. More than a third
(35%) say they have not avoided making a GP appointment in the last 12 months.
Younger Britons, as well as those
from ethnic minority backgrounds are most likely to have avoided making an
appointment with their GP in the past year: 60% of 18-34 year olds say they
have done this while 67% of those from ethnic minority backgrounds say the
same. These findings are linked to some extent as participants from ethnic
minority backgrounds tend to be younger. Kate Duxbury, at
Ipsos, said: The NHS has faced
a challenging winter and this has been feeding through to the public
consciousness. While we know from other research that the public think the
NHS needs more funding, there is limited support for raising funds to
maintain the NHS by increasing prescription charges or charging a £10 fee to
see a GP – charging for missed appointments is more supported, though still
only by half. 14
February 2023 Source: https://www.ipsos.com/en-uk/half-britons-support-ps10-fine-missed-nhs-appointments
781-782-43-12/Polls Britons
Are More Likely To Trust Labour On Policies Surrounding Immigration And
Asylum, But The Conservatives Are Closing The Gap
New research by Ipsos shows nearly
4 in 10 Britons (37%) now believe Suella Braverman is doing a bad job in her
role as Home Secretary, down from 50% who were critical in November of last
year. Meanwhile, 25% say her performance is neither good nor bad and only 12%
say she is doing well. This slightly improves among Conservative 2019 voters
(17% good job vs 27% who say she is performing poorly). Among 2019 Labour
voters, more than half (54%) say she is doing a bad job while 10% say she is
doing well. Trust in parties When considering which parties can
be trusted to deal with policies surrounding immigration, and asylum seekers,
neither party scores highly although Britons tend to trust Labour more. A
third trust Labour a great deal or fair amount to have the right policies
towards asylum seekers (35%), 28% say the same for the Conservative Party.
Similarly, 34% trust Labour to have the right immigration policies (28%
Conservative). When is comes to handling the issue of migrants crossing the
English Channel, 32% trust Labour and 24% trust the Conservatives.
However, on all of these while Labour’s scores are little changed since
last November, trust in the Conservatives has improved (by 7, 8, and 6 ppts
respectively). There is little difference between the two parties when
it comes to making it harder to enter the country illegally, 31% trust Labour
to do so while 30% trust the Conservatives.
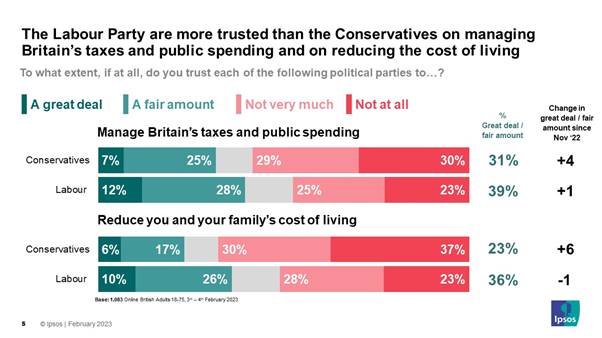
The Labour Party remain more
trusted when it comes to managing Britain’s taxes and public spending, 39% trust
the opposition party compared to 31% who trust the Conservatives. Similarly,
36% trust Labour to reduce their cost of living, and less than a quarter
trust the Conservatives to do the same. It is worth noting, however, that
again there has been slight improvement in the levels of trust in the
Conservatives since last November.
International
students Looking at policies regarding
international students, almost half (48%) say they would support limiting
international students’ abilities to bring dependents (such as spouses of
children) into the UK. Just over 1 in 5 would be opposed to this (22%). Four
in 10 (40%) would be in favour of reducing the time international students
can remain in the UK to work following completion of their studies with 27% against
the policy. Just under 4 in 10 (37%) would support the implementation of new
restriction on international students coming to the UK to study more
generally while 28% would be opposed. Should the government reduce the
amount of time international students can stay in the UK to work after
completing their studies, 41% of Britons believe this would decrease the
number of international students who come to the UK to study while 3 in 10
(31%) believe it would make no difference and only 12% think it would increase
the number. Opinion is split when it comes to
the impact implementing new restrictions on international students will have
on the British economy. Just under a third (31%) say it will have a
very/fairly bad impact while 35% expect it to have no difference and 1 in 5
(22%) say it will be very/fairly good. Allaa Barri,
Associate Director in Public Affairs at Ipsos, said: As we’ve seen
across a number of issues, the public largely mistrusts both the Labour party
and the Conservative party in their handlings of immigration. However,
despite an increase in trust in the Conservatives since November, there is
still slightly more trust in the Labour party., Public backing of the Home
Secretary has also seen some improvement, with more than one in three (37%)
saying she is doing a bad job compared to half (50%) in November, but still
larger than the 12% who say she’s doing a good job. Looking specifically at
opinions towards her proposed potential changes to international student visa
regulations, public attitudes are mixed, with more supporting the potential
changes than opposing – despite more thinking it will be bad for the economy
than good. 16
February 2023
781-782-43-13/Polls 2
Out Of 5 French People Say They Follow The News About Savings And Financial
Products
Focus on savings:
Focus on PER
Focus on pensions
Focus on pension
reform
Focus on gender
inequalities in retirement
February
6, 2023
781-782-43-14/Polls 51%
Of French People Do Not Say They Are Particularly Afraid Of Artificial
Intelligence
The majority of
French people say they are familiar with the concept of AI AI: friend or foe? 40% think it will exceed human
intelligence, including 53% of 18-34 year olds. People aged 55-75 are
the most confident in the resources of human intelligence, with only 30%
believing that AI will surpass human intelligence, and 6% of French people on
average believe that it will replace humans. What uses for AI? What is AI used for? Its first
vocation is to help people for 26%, to imitate human intelligence for 22%, to
learn by itself for 10%. For more than ¾ of French people,
AI is already present in almost all areas for information and entertainment:
voice assistants (79%), connected devices and home automation (77%), search
engines (76% ), mobile applications (75%), video games (74%). It participates in the world of
work with software (69%), in health for research or robotic surgery (68%), in
e-commerce (68%). We find AI at the rendezvous of
streaming music and video-on-demand platforms such as social networks (65%). It is for the automobile and
artistic creation that the margin of progress is clearest: 26% and 25% of
French people believe that AI will be fully operational there in 10 years,
17% even considering that Artificial Intelligence will never be able to
compete with a human in the field of art. Which companies
are associated with artificial intelligence? Logically, Google and Apple are the two companies associated in
priority with AI (15% and 9%), when Alexa, Amazon, Meta, Elon Musk, OpenAI & ChatGPT are
associated by 4% of French people each, followed by Microsoft ( 3%), Siri and Tesla (2%). About OpenAI & ChatGPT , 53% of French people say
they have never heard of it, 15% know it only by name, 16% have a vague idea
of it and 16% "see what it is". Among those who
know what OpenAI & ChatGPT is, we will find 47% of 18-34 year olds, 42%
of CSP+ and 37% of men. One can imagine that companies and
public authorities will do everything to reduce these disparities in terms of
familiarity, knowledge, and use of AI; they are superimposed on the
digital divide that already exists in France in a world that wants to be
increasingly dematerialized. Will AI be able to find the
solution before humans? February
7, 2023
781-782-43-15/Polls Interest
In The Super Bowl Has Fallen Among Germans Compared To Last Year
On February 12th it's that time
again: The Super Bowl will be played, this year the Philadelphia Eagles
against the Kansas City Chiefs at State Farm Stadium in Glendale,
Arizona. The biggest American football event of the year is broadcast
live, allowing millions of people around the world to watch the National
Football League (NFL) final on television, including Germany. But how
excited are the Germans following the Super Bowl? While in 2022 only 71 percent of
those surveyed said they would not watch the Super Bowl, just a year later
the number is 77 percent. The data collected from both years
shows that the Super Bowl particularly appeals to men: In 2022, 18 percent of
the men surveyed said they wanted to watch the sporting event live, while
only 9 percent of women also planned to do so. Currently, 13 percent of
men want to tune in live on Sunday night, vs. 4 percent of women. The Super Bowl was the most popular
must -see in 2022 among younger respondents: almost a quarter of Germans
aged 25 to 34 (24 percent) had planned to watch the Super Bowl 2022 live,
while the 55+ age group had the least (7 percent) showed interest in the
sporting event. This year, 14 percent of 18- to 44-year-olds want to
watch the Super Bowl live (vs. 4 percent of those over 55). Based on the YouGov question of the day, 2,430
people in Germany were surveyed on February 7th, 2023 and based on the YouGov
Survey: Omnibus 2,056 people in Germany were
surveyed from February 1st to 3rd, 2022 using standardized online
interviews . The results were weighted and are representative of the
German population aged 18 and over. February
10, 2023
781-782-43-16/Polls Social
Shopping Is Becoming Increasingly Popular
Social media is now part of
everyday life for many consumers. In addition to information, entertainment
and social interaction, more and more shopping is taking place on social platforms. The
current target group analysis “ Social Shopping – shopping via social
media has developed into a megatrend ” shows that more and more people are shopping via
social media. Our data shows that by 2022, nearly a quarter of consumers
(24 percent) will have purchased a product through a social network. In
particular, younger respondents (25 to 34 years old) say they have shopped on
social media (41 percent), while only 15 percent of those over 55 years old
do so.
Social shoppers
are more often young women Almost a quarter of the population
(24 percent) falls into the “social shopper” category and has already
purchased a product via social networks. This group consists mainly of
women (58 percent) between the ages of 25 and 34 (25 vs. 15 percent of the
total population). More than a quarter (26%) of social shoppers have an
immigrant background and 30% are members of a gym (vs. 19% of the general
population). Almost half of social shoppers (43%) are more likely to
engage with ads on social media than on regular websites (vs. 22% of the
general population), and more than a quarter (27%) say they pay the most
attention to ads online. The majority of social shoppers (78 percent)
like to test products before they hit the market and 33 percent say Potential social
shoppers – young, tech-savvy men 24 percent of Germans are potential
social shoppers, ie these consumers can imagine shopping via social
networks. This group consists more often of men (51 percent) between the
ages of 18 and 24 (14 percent) with a migration background (22 vs. 16 percent
of the total population). The potential social shoppers use their mobile
phone every day to watch TV (13 percent) and listen to the radio live on
their smartphone (29 vs. 23 percent of the population). This demographic
uses social media primarily for news and entertainment (79 percent) and
believe brands need new ways to market themselves and their products (84 vs.
76 percent of the population). Half of potential social shoppers (50
percent) prefer to play games, that offer a great reward and 77 percent
are interested in new technology products, services and apps (vs. 65 percent
of the general population). The consumer group pays by far the most
attention to advertising online (25 percent), but TV advertising can also reach
potential social shoppers well (23 percent). More than half of the
target group (52 percent) use their smartphone when shopping online, while 43
percent use a laptop. February
10, 2023 Source: https://yougov.de/topics/consumer/articles-reports/2023/02/10/social-shopping-wird-immer-beliebter
781-782-43-17/Polls Children
And Parents In The Digital World, Between Social Networks, Gaming And The
Metaverse
“ Between reality and the Metaverse. Adolescents
and parents in the digital world " research carried
out by BVA DoxaKids, for Telefono Azzurro and presented at the Catholic
University of the Sacred Heart on the occasion of Safer Internet Day. The research, conducted on a sample
of 804 parents and 815 young people between 12 and 18 between 7 and 11
November, offers a cross-section of the perceptions of young people between
12 and 18 and their parents, on the relationship with digital world, covering
issues such as gaming, mental health, data sharing and privacy. In general, the report records an
increase in concern, shared by parents and adolescents, about the negative
effects that can arise from excessive exposure to digital screens of very
young people. And despite the daily use of the devices, young users are
not always fully aware of how to avoid dangers, monitor them or report them. Almost 1 out of 2 boys (48%, 53% in
the case of 15-18 year olds) happened to come across inappropriate content
and in 25% the content that appeared upset and impressed them. In 68% of
cases, the most widespread content is violent, followed immediately by
pornographic (59%) and sexually explicit content (59%), discriminatory and
racist content (48%), suicide and self-harm (48%). 40%) or praising anorexia
and bulimia (30%), but also gambling (27%). Parents appear to be a point of
reference for their children, in the event of unpleasant events that occur
online. 19% report that they have accepted the confidences of their
children in the past, while 49% believe that their children would talk about
it in the family, even if no episodes of this type have yet occurred. DATA SHARING, PRIVACY AND AGE –
More than 70% of 12-18 year olds interviewed feel a strong fear of the fact
that the data they share online on a daily basis (updates on social channels,
searches and web browsing, data traces of own use of the Internet and
smartphones) are used without their consent. An interesting figure emerges on
the point relating to age verification by social networks, apps and other
Internet sites: for adolescents it is on average 15 years, for parents a year
more, 16. In both cases it is a higher discrimination than that identified by
Italy (14 years) following the European legislation for consent to data
processing. The result of the report
demonstrates the importance for young users and their parents of age verification systems and
therefore the need to use them for a longer period. For 70% of the
adolescents interviewed, they are very useful in order not to find themselves
in risky situations, for 65% to ensure that they do not take actions without
thinking about the possible consequences and for 61% to prevent them from
seeing inappropriate content. MENTAL HEALTH IN THE DIGITAL WORLD
– The increasingly pervasive use of digital technologies has not only led to
a transformation in the way of communicating, but has also an impact on the
mental health of everyone, including the very young. 27% of young people interviewed say
they feel anxious or agitated without using social media (29% in an age range
from 15-18 years and 26% from 12-14) while 22% would feel lost. Compared
to 2018 there is a +10%. Furthermore, compared to four years ago, the
percentage of young people who claim that a distance from social networks
"would have no effect" has halved. Content used on social media could
arouse negative feelings. More than 1 in 2 boys (53%) report having
experienced unpleasant feelings, such as envy for the lives of others (24%,
especially 15-18 year olds). 21% say they have felt inadequate, 18%
different, 10% approved. The remainder feel loneliness (12%) or anger at
the lives of others (9%). THE DIFFERENT ASPECTS OF GAMING –
35% of the interviewees, especially males, believe that gaming can be useful
in creating a positive class climate among classmates; 27% consider it a
possible useful tool for teaching school subjects and the same percentage
consider it applicable in sports practice. 1 in 4 boys suggest that
gaming can be useful in helping to deal with psychological difficulties and
15% consider it potentially important in the mental health
field. Furthermore, gaming has a relational matrix: 36% (45% in the case
of males) declare that they have met new people while playing. The negative sides of the gaming
world also clearly emerge from the research, where episodes attributable to
discrimination and exclusion are quite frequent: 11% of the young people
interviewed say they have taken someone's defense, 11% admit having teased
someone, 1 in 10 teenagers report being teased, 8% being left out and 6%
having witnessed something that made them feel uncomfortable. How do boys and girls feel when
they play? 32% say they feel capable and 14% feel understood by other
players. At the same time, the game can act as a protective screen
against the world, ending up isolating the boy or girl: 32% admit to losing
track of time, 13% fear being addicted to it, 11% have the impression of
being protected from the outside world and 8% feel isolated. February
07, 2023 Source: https://www.bva-doxa.com/ragazzi-e-genitori-nel-mondo-digitale-tra-social-gaming-e-metaverso/ NORTH AMERICA
781-782-43-18/Polls Americans
Are Greatly Concerned About Social Media’s Impact On Children
A new Knight Foundation poll
conducted by Ipsos finds that a significant majority of Americans are
concerned about the impact of social media on children, particularly when it
comes to mental health and inappropriate content being shown to children.
They say that it is important for the federal government to address issues
involving children. However, they also see parents are responsible for their
kids. By contrast, the poll finds less concern among Americans about
censorship or “being canceled” on social media. For more information, please
click here.
Key Findings
2. Americans also show significant
concern over technology companies collecting personal data, as well as false
or misleading information. There is much less concern over censorship or
anti-competitive practices.
3. Similar to issues involving
children and social media, Americans that find these issues concerning
believe multiple parties should bear responsibility. Government is seen as
responsible for creating a fair market, while social media companies are
responsible for content they host.
4. Americans believe that, when it
comes to social media, it is most important for the federal government to
address algorithms serving inappropriate content to children and the collection
of personal data by technology companies.
6
February 2023 Source: https://www.ipsos.com/en-us/americans-are-greatly-concerned-about-social-medias-impact-children
781-782-43-19/Polls Americans
Want Medication Abortion To Remain Legal
13
February 2023 Source: https://www.ipsos.com/en-us/americans-want-medication-abortion-remain-legal
781-782-43-20/Polls About
a third (35%) of U.S. parents with children under 18 say it’s extremely or
very important to them that their kids have similar religious beliefs to
their own as adults, according to a recent Pew Research Center survey. But attitudes on this question vary by
the religious affiliation of the parents.
White evangelical Protestant
parents are twice as likely as U.S. parents overall (70% vs. 35%) to say it’s
extremely or very important that their children grow up to have religious
beliefs that are similar to their own. Some 53% of Black Protestant parents
also express this view. Fewer Catholic (35%) and White
non-evangelical Protestant parents (29%) say this is extremely or very
important to them. And only 8% of religiously unaffiliated parents – those
who describe their religious views as atheist, agnostic or “nothing in
particular” – say the same. The survey was conducted among
Americans of all religious backgrounds, including Jews, Muslims, Buddhists
and Hindus, but it did not obtain enough respondents from non-Christian
groups to report separately on their responses. (Read more about why the
Center typically can’t report the views
of smaller U.S. religious groups.) Views on this question also differ
by how frequently parents attend religious services. Parents who attend
religious services weekly or more often are more than three times as likely
as those who attend less often to say it’s important to raise children who
will share their religious views (76% vs. 21%). Overall, parents are more likely to
say it’s important that their children share their religious beliefs as
adults than to say the same about their kids’ political views. Just 16% of
parents say it’s extremely or very important that their children grow up to
have political views that are similar to their own. “I was raised in a very religious
family, and I want my children to share the same faith.” MOTHER, AGE 42 Religious differences also appear
on other questions related to parents’ hopes for their children, according to
the Center survey, which was conducted in the fall of 2022 among 3,757 U.S.
parents with children under 18. For example, 81% of parents overall
say it’s extremely or very important for their children to grow up to become
people who help others in need. White evangelical Protestant parents are
especially likely to say this (89%). Slightly smaller majorities of parents
from other religious backgrounds, including 81% of Catholics and 76% of the
religiously unaffiliated, hold this view. Most parents (80%) also say it’s
extremely or very important for their children to grow up to be accepting of
people who are different from them. On this question, parents with no
religious affiliation (85%) are slightly more likely than Catholics (79%) and
Protestants (76%) to see this trait as important. Parents overall are about evenly
split on whether they are trying to raise their children similarly (43%) or
differently (44%) from how they were raised themselves. When asked in an
open-ended question in the fall 2022 survey about specific ways they are
raising their children, many parents pointed to values and religion. Among
parents who said they are raising their children similarly to their own
upbringing, 63% pointed to values and religion, but only 13% of parents who
are trying a different parenting approach cited these factors. “I am not taking my kid to the
church, and I am trying to teach my kid to be open and friendly to people
‘different’ than her.” MOTHER, AGE 44 A substantial share (17%) of
parents who are raising their children similarly to how they were raised
mentioned religion, specifically. These parents often pointed to ideas such
as passing along their religious beliefs and prioritizing faith, just as
their parents had done for them. For example, one 42-year-old mother
said, “I was raised in a very religious family, and I want my children to
share the same faith.” And a 41-year-old father said, “I am raising my kids
with a strong Christian foundation. I strive to live my life as an example of
good, godly values for my kids. I impart in them the importance of love,
family and fellowship.” Among parents who said they are
trying to raise their children differently from how they were raised, by
comparison, 7% specifically mentioned religion in their open-ended answers.
Some said they are incorporating religion into their child’s upbringing when
it had been absent from their own. Others said the opposite – that
they are intentionally raising their children with less religious involvement
than they grew up with. One 44-year-old mother said, “I am not taking my kid
to the church, and I am trying to teach my kid to be open and friendly to
people ‘different’ than her.” FEBRUARY
6, 2023
781-782-43-21/Polls Black
Americans Firmly Support Gender Equality But Are Split On Transgender And Nonbinary
Issues
Discussions about gender equality
and feminism have a long history among Black Americans. Some hallmarks of
this history are Maria
Miller Stewart publicly affirming the place of Black women as
abolitionist leaders in Boston in 1832; the Combahee
River Collective’s formative statement on the intersection of
race, gender, class and sexuality in 1977; Anita
Hill’s sexual harassment allegations against then-Supreme
Court nominee Clarence Thomas in 1991; and the ongoing discussions about
how women are represented in rap music, both as subjects and
performers of songs. These often-contentious debates raise questions about
the relative importance of gender and other inequalities among Black
Americans, given the long history of racial inequality in the United States. To be sure, about six-in-ten
non-Hispanic Black adults1 (62%)
say Black people should prioritize the struggle against racism over other
inequalities, according to a 2021 Pew Research Center survey of Black adults.
Meanwhile, three-in-ten Black adults say the opposite: that racism should not
be prioritized over other inequalities. Among the 30% who say racism
should not be
prioritized, most say this is because racism is just as important as other
inequalities or that racism is interconnected with other inequalities. Although most Black Americans view
the fight against racism as their primary struggle for progress, they also
support women’s equality and think feminism has been a positive force for
women overall and for Black women specifically, according to a 2020 Pew
Research Center survey of U.S. adults. These findings stand in stark
contrast to the contentious history that Black Americans have had with the
feminist movement. Black women were relegated
to the back of feminist marches in the 19th century, if not
completely excluded. Black women redefined their
approach to women’s equality, and even renamed it
“womanism” to make it more inclusive of their needs and to reject the
exclusion they had experienced in feminist organizations. This history provides context for
the findings of the 2020 survey, which indicate that about two-thirds (68%)
of Black adults view feminism as empowering, but nearly half (48%) would not
use the term “feminist” to describe themselves. Black adults are
split over how much society should accept transgender people According to the Williams
Institute, at least 1
million Black adults in the U.S. are lesbian, gay, bisexual
or transgender (LGBT), making up 12% of the nation’s LGBT population. LGBT
Black Americans are younger than non-LGBT Black adults, with nearly 60% under
age 35 compared with 34% of non-LGBT Black adults. Women comprise a larger
share of LGBT Black adults than of non-LGBT Black adults, and LGBT Black
adults are slightly less likely to live in the South than the rest of the
Black population. Black LGBT and non-LGBT adults do
not differ in their sense
of belonging to their own race. Nearly half of both groups
say they feel connected to Black communities. And 62% of Black lesbian, gay
or bisexual adults and 29% of Black transgender adults say they feel a part
of the larger LGBT community, the Williams Institute has found.
Still, over half of Black LGBT
adults (55%) say the city or area they live in is not a good place for
transgender people, and 39% say their
areas are not safe for lesbian, gay or bisexual people. In fact,
the majority of Black LGBT people say they have experienced verbal insults or
abuse (79%) or have been threatened with violence (60%). The social difficulties that Black
LGBT people experience are reflected in Black Americans’ views on gender
identity issues, according to a 2022 Pew Research Center survey of U.S.
adults. Only 13% of non-Hispanic Black adults say that U.S. society is
extremely or very accepting of transgender people. However, Black adults are split in
their views on how accepting society should be. While 36% say society has not
gone far enough in accepting people who are transgender, 31% say the level of
acceptance in society has been about right and 29% say it has gone too far.
And while about four-in-ten Black adults (41%) say views about transgender
people and issues are changing at the right speed, roughly a third (34%) say
they are changing too quickly. These divergent points of view
exist alongside each other, demonstrating that Black Americans’ views on
gender identity issues show much less consensus than their views on gender
equality. The findings in this report emerge
from four Pew Research Center surveys of U.S. adults conducted from 2019 to
2022. Using multiple Center surveys provides a unique
opportunity to summarize Black Americans’ views on gender equality and gender
identity in the United States in the broadest scope. The report provides
context for Black Americans’ views on and experiences with current issues of
national importance, such as their majority disapproval
of the overturning of Roe v. Wade (67%) and the
disproportionate number of Black transgender and nonbinary people who
experience fatal
violence. Here are other findings presented
in this report: Black Americans
are critical of the progress of women’s equality in the U.S. About
seven-in-ten Black adults (69%) say that the U.S. has not gone far enough in
giving women equal rights with men. And among those who say this, a quarter
say it’s not too or not at all likely that there will be equal rights between
women and men in the future. Black Americans
are more likely to have egalitarian views about gender roles than their
houses of worship. Black adults believe that mothers
and fathers who live in the same household should share parenting (86%) and
financial responsibilities (73%). However, the majority of Black Americans
who attend religious services at least a few times a year say their
congregations are more likely to emphasize men’s financial role in the family
and involvement in Black communities as role models than women’s family and
community roles. Black Americans
are more likely to know someone who is transgender or nonbinary than to
identify as such themselves. About 1.4% of Black
adults are transgender or nonbinary. However, 35% of Black adults say they
know someone who is transgender. And among those who have heard at least a
little about people who do not identify as a man or woman, 26% say they know
someone who identifies this way. FEBRUARY
16, 2023
781-782-43-22/Polls More
Than Three-In-Five Feel They’re Being Asked To Tip More, And More Often
Canadians have reached a tipping
point when it comes to gratuities. New data from the non-profit Angus
Reid Institute finds so-called “tip-flation” a key pain point. Most Canadians report
being asked to tip more (62%) and more often (64%), and in several cases,
they are obliging. Canadians also report “tip
creep” – where locations that previously may not have prompted for
a tip have
added the request to digital payment machines – as a source
of fatigue. Four-in-five (83%) say too many places are asking for tips these
days, including at least three-quarters across all regions and demographics.
Meanwhile, few (13%) believe customer service has improved as tips have
increased. The result: a significant increase
in the number of Canadians who say they prefer (59%) a “service included”
model, which would see an end of tipping and higher base wages for employees.
ARI polling from 2016 found respondents were more likely to prefer tipping
(46% to 40%).
More Key Findings:
About
ARI The Angus Reid Institute (ARI) was
founded in October 2014 by pollster and sociologist, Dr. Angus Reid. ARI is a
national, not-for-profit, non-partisan public opinion research foundation
established to advance education by commissioning, conducting and
disseminating to the public accessible and impartial statistical data,
research and policy analysis on economics, political science, philanthropy,
public administration, domestic and international affairs and other
socio-economic issues of importance to Canada and its world. INDEX Part One:
Perceptions on tipping
Part Two: Who do
Canadians tip and how much?
Part One:
Perceptions on tipping Inflation is a spectre haunting all
aspects of Canadian life as the country emerges from the expansionary
monetary policy of the early days of the COVID-19 pandemic. It has touched
food, housing, and even common customary practices like tipping. Gone are the
days of the 15
per cent standard tip, as so-called “tip-flation” has
ballooned tip suggestions from point-of-sales machines to as high as 30
per cent. Three-in-five feel
they are being asked to tip more, and more often A majority (64%) of Canadians say
they are being asked tip more often and a majority (62%) feel they are being
prompted to leave bigger tips in recent years. There are three-in-ten (28%)
who feel the frequency and amount of tips have stayed the same, while
one-in-20 say they are seeing decreasing asks in both cases:
This phenomenon is not seen evenly
across the country. In British Columbia, a province with one of the highest
costs of living in the country, approaching three-quarters say
they are being asked to tip more (73%) and more often (74%). Meanwhile, there
are fewer reports of “tip creep” in Quebec (52%) and “tip-flation” in
Atlantic Canada (42%) than elsewhere in the country:
Four-in-five (83%) say too many
places are asking for tips these days – at least three-quarters across all
demographics agree (see
detailed tables). As well, there is a significant sentiment that
customer service has gone down hill. One-in-eight (13%) disagree in that
case; however, that is the minority opinion across all all ages, genders and
regions (see
detailed tables). Among Canadians, a strong majority
(78%) believe tipping no longer functions as originally intended –
showing appreciation for a job well done. Instead, three-quarters (73%)
believe it is a way for employers to underpay their employees. Perhaps
relatedly, seven-in-ten (69%) say tips are the only thing that make some jobs
worthwhile:
Canadians have tried to weather the
inflationary storm by lightening their budget. Discretionary
spending, such as dining at restaurants, has often been a casualty
of budget cuts. Restaurants Canada reported
lower foodservice sales in almost every month in 2022 when
compared to the same period in 2019, even after nearly all COVID-19 public
health restrictions were lifted in March 2022. With this in the background,
two-in-five (42%) say the extra cost of tipping is keeping them from going
out. This sentiment is more common among Canadians under the age of 55:
Majority support
move to a ‘service included’ model There has been much discussion
about eliminating the practice of tipping. Research
has shown that racial bias can affect the amount diners leave
for tips. When Toronto restaurant Richmond Station banned tipping after the
lifting of COVID-19 public health restrictions in July 2020, one of the
restaurant’s owners described tipping as “predatory:
It’s racist, it’s sexist and it’s not fair.” Richmond Station moved instead to a
“hospitality
included” or “service included” model, which sees restaurant staff
with higher wages, priced into the menu. This is the standard practice
in some
countries where historically there has not been a culture of
tipping. Three-in-five (59%) Canadians would
prefer the country move towards a “service included” model, eliminating
tipping in favour of higher base wages for employees. One-third (32%) prefer
the current system of tipping. This represents a significant shift in public
opinion on tipping since Angus Reid Institute last surveyed on the topic in
2016. Then the current tipping system was preferred by a narrow six-point
margin:
The preference for tipping is more
common among Canadians who voted Conservative and Bloc Québécois in the 2021
federal election. Both groups of voters are split between preferring the
current system of tipping and moving towards a model where tipping is
eliminated because employees are paid higher. Three-quarters of past Liberal
(73%) and NDP (76%) voters would like to see the end of tips:
*Smaller sample
size, interpret with caution While there appears to be a
political divide on the matter, there is no experiential divide.
Three-in-five (58%) Canadians who previously worked a job that earned tips as
part of its compensation prefer to move towards a service included model.
Three-in-five (59%) Canadians who have never received a tip in their life say
the same:
As inflation has increased the cost
of everything, some
experts believe business owners already feeling the pressure
from suppliers are wary of passing any more cost increases onto customers.
Instead of raising the wages of employees, and then incorporating that into
their prices, owners instead use sales machine prompts to encourage higher
tips and “maintain the illusion of lower menu prices,” argued
food reporter Corey Mintz. However, for restauranteurs, there’s
another issue: if they were to raise prices by 20 per cent to increase their
employees’ wages, they would
be taxed on that additional revenue. Approaching three-quarters of
Canadians (73%) believe tips allow employers to underpay their employees,
including more than four-in-five (86%) of those who want tipping to be
eliminated. Two-in-five (39%) of those who prefer the current tipping system
disagree, but even among those who want to see tipping continue, more people
(53%) believe tips allow employers to pinch wages. Notably, in Canada, there is a
two-tiered minimum wage system only
in Quebec which allows businesses to pay those earning tips
at their jobs lower than others. Other provinces have eliminated such minimum
wage differences in recent years.
Part Two: Who do
Canadians tip and how much? Tips are an ingrained part of
dining out but are a less common occurrence in other sectors of the Canadian
economy. Three-quarters (76%) of Canadians who visit barbers and hairdressers
say they almost always tip them after their hair is cut. Canadians also say
they usually tip bartenders at a similar rate (74%) if they imbibe. Canadians
are also likely to tip food delivery drivers (71%), salon workers (68%) and
taxi drivers (60%), but less likely to do so for hotel housekeepers (34%), at
coffee shops (29%), for massage therapists (17%) and delivery drivers (3%). There is some variance in tipping
behaviour depending on age and gender:
Who do Canadians
believe should be tipped? Whether or not Canadians tip a
profession and whether they believe they should tip them are two separate matters. Majorities
believe bartenders (64%), barbers (60%) and food delivery drivers (58%)
should be tipped. Approaching half say the same for workers at beauty salons
(47%) and taxi drivers (47%). There is lower belief that hotel housekeepers
(42%) and baristas (37%) should receive gratuities. Few believe
acupuncturists (13%) and package delivery people (4%) should be tipped. Canadians over the age of 54
support more professions receiving tips at majority levels than other age
groups. The youngest Canadian adults believe only bartenders (58%) and food
delivery drivers (55%) should be tipped at majority levels:
How much is
enough? For most examples, Canadians are
most likely to believe a tip of less than 15 per cent of the cost of the bill
is sufficient, if they support tipping the work at all. This is the case for
those who believe baristas, taxi drivers, food delivery people, and
bartenders should be tipped. For hairdressers and barbers, Canadians who
believe that profession should be tipped are split between believing less
than 15 per cent is enough (30%) and saying the tip should be higher than that
(29%):
Canadians report
tipping more at restaurants now than 2016 Before the pandemic, payment
services company Square
reported the average tip on its platform was 16 per cent. In
the summer of 2020 and 2021, that average rose to 17 per cent. In January of
this year, the average was now 20 per cent. Indeed, Canadians themselves are
reporting tipping more than they were in 2016, the last time ARI surveyed on
this subject. Then, 44 per cent said they tipped less than 14 per cent the
last time they ate at a full-service restaurant. Now, half as many (23%) say
the same, while the proportion who say they left a tip of 20 per cent or more
has more than doubled (8% to 21%):
Canadians aged 35 and older are
more likely to report leaving a larger tip than those aged 18 to 34. Women
(21%) are less likely than men (26%) to say they left a tip of under 15 per
cent at the last restaurant they ate at:
Those who previously worked in jobs
that received tips are more likely to say they left tips of 20 per cent or
more (25%) than those who have not (18%):
February
16, 2023 Source: https://angusreid.org/canada-tipping-service-hospitality-included-tipflation-tip-creep/
781-782-43-23/Polls Fewer
Canadians Rate Quality Of Healthcare As Good (60%, Down 12 Points From 2020)
Moreoever, timeliness of access to
healthcare also remains a challenge, with only 43% rating it as good (10%
very good/33% good). Further, Canadians generally do not see quality
improving any time soon, with 48% (down 13 points) saying they expect the
quality of healthcare that they and their family will have access to locally
will stay the same over the coming years, and 35% (up 13 points) saying it
will worsen. Just 18% (up 1 point) believe the quality of healthcare in
Canada will improve. Insufficient access to healthcare
has been top-of-mind for Atlantic Canadians in recent weeks following two
recent deaths in Nova Scotia resulting from ER wait times, sparking
discussion of provincial reform.[1] Consequently, it is
unsurprising that Atlantic Canadians have the most pessimism about the
healthcare system than those in other regions in the country. Those in
Atlantic Canada are significantly more likely to rate the quality of the
healthcare system (32% vs. 24% AB, 22% QC, 18% ON, 16% SK/MB, 14% BC) and
timeliness of access (43% vs. 37% AB, 36% QC, 29% ON, 29% SK/MB, 25% BC) as
poor than those in other parts of Canada. When taking a national view, most
(65%) say that the quality of healthcare in their local area is about the
same as the quality found in most other parts of the country, while 13% feel
it is better and 22% feel it is worse. Again, Atlantic Canadians are
significantly more likely to feel their local healthcare system is worse than
it is elsewhere (46% vs. 27% AB, 21% QC, 20% SK/MB, 20% BC, 19% ON). Canadians with negative views of
the healthcare system primarily cite staffing shortages (72%) as the reason
for their opinions. Following this, around half cite insufficient funding
from the federal government (51%) and the view that the funding their
provincial government does receive
is not spent effectively or efficiently (48%). Fewer place the blame on
healthcare professionals themselves and their level of training or oversight
(24%).
Those in Alberta are significantly
more likely to cite issues with funding from their provincial government (58%
vs. 44% ON, 39% BC, 34% QC, 31% ATL, 25% SK/MB). Other than this, however,
there are very few notable differences by region, suggesting that while the
challenges of the healthcare system are felt differently across the country,
Canadians consistently agree staffing shortages constitute the number-one
hurdle to overcome if the healthcare system is to be strengthened
post-pandemic. 7
February 2023 Source: https://www.ipsos.com/en-ca/fewer-canadians-rate-quality-of-healthcare-as-good
781-782-43-24/Polls Inflation
Was The Grinch Who Stole Christmas This Year, As (71%) Say They Felt The
Impact Of Inflation When Holiday Shopping
2022 was the first Christmas to
return to some semblance of normal, and Canadians did not skimp when it came
to holiday spending on their family and friends – and pets, as it turns out.
However, many of them are still feeling the after-effects of the hit to their
wallets as inflation was the Christmas Grinch this year. Overall, nearly four in ten (38%)
holiday season shoppers went over budget. Among those who overspent, they did
so by an average of $580, substantially higher than last year’s average of
$414. Canadians with children were the
hardest hit by increased costs. 8 in ten say they felt the impact of
inflation on their holiday spending (80%) and 7 in ten found it tough to cover
holiday expenses and gifts (70%). Over half (56%) spent more than they
intended to, going over budget by $614 on average, significantly outspending
the national average in key gift categories:
When asked how long they thought it
would take for them to get their finances back on track, half (49%) of these
families with children estimated it would take until April or later. When asked what they would do if
they had an extra $5,000, Canadians top choice was pay down debt (35%),
rising to 44% for families with kids, closely followed by putting it into
general savings (31%). Fewer (16%) say they’d treat themselves with the extra
money.
17
February 2023
781-782-43-25/Polls Nearly
Half (43%) Of Canadians Have Knowingly Been Victimized By Fraud Or Scams, In
Their Lifetime
A new Ipsos poll conducted on
behalf of the Chartered Professional Accountants of Canada a Credit card
fraud is most commonly reported (21%), followed at a distance by debit card
fraud (8%) or online phishing scams (8%). The Internet dominates modern life in
Canada – virtually all (96%) Canadians engage in online activities and
virtually everyone (97%) has a debit and/or credit card. Most Canadians
engage in online banking (78%) and/or manage their credit cards online (72%).
Online banking and shopping are now the norm. Most notably, as many as three
in ten (29%) admit they are now making large purchases online (i.e.,
household appliances, vacations, vehicles, etc.) – a figure which rises to
slightly above one-third (35%) among the 18-34 cohort. With so many Canadians’
transitioning their banking (and shopping behaviours) to online platforms, it
is perhaps not surprising that fraud and online scams have become a little
“too common” in modern Canada. Given the prominence of online banking and
shopping in modern life, it is alarming that fewer than half (42%) say they
receive email or text alerts for every transaction on their credit or debit
card which can help to identify fraudulent charges more quickly. The vast majority (91%) of fraud
victims say they found a shoulder to cry on and told someone else about it.
Most were not able to bring themselves to share the experience with loved
ones, however, as only about one in four (27%) report telling family members
about it and even fewer (22%) shared their experience with friends. A
majority (54%), albeit a surprisingly slim one at that, claim to have
reported the incident to their financial institution. 17
February 2023 AUSTRALIA
781-782-43-26/Polls Over
Two In Five Australians Report Fall In Disposable Income, But More Optimistic
About Next Year
The global economy is facing
significant challenges, as the remnant effects of Covid-19, supply chain
disruptions and rising inflation rates are felt globally. New YouGov data indicates that consumers in
Australia are feeling the pinch, with over two in five saying their
disposable income has fallen over the past year (46%). This compares to a
fewer three in ten who say their income has remained the same (30%) and more
than double those who say their spending power had increased (19%). When asked about their financial
outlook for the year to come, Australians appear to be slightly more
optimistic. Fewer expect a fall in disposable income (38%) and more expect an
increase (23%) although slightly more express uncertainty (13% for next 12
months, versus 6% for past 12 months).
YouGov’s latest report, Financial
Outlook 2023: Navigating the storm, uncovers who has been most
affected by these ongoing crises, changes to consumer financial priorities,
and how financial institutions can support the changing needs of different
consumers. By understanding these, financial services marketers can gain a
better understanding of consumer sentiment, behaviour, and attitudes around
the evolving financial landscape. The report additionally highlights
what people in Australia are doing with their money. Insurance and
savings emerged as the most common financial activities in the last 12 months
for two in five locally (38% for health insurance, 37% for savings) – with
those above 55 most likely to prioritise insurance (45%) and those aged 45–54
most likely to save (45%). Paying for home, pet, or automotive insurance was
the third most common activity (36%). The next tier of activities
comprised mostly money management. Making regular payments on mortgages or
home loans was done by one in five Australian consumers (22%), and most among
those aged 35–44 (34%). Another one in five used Buy Now Pay Later services
to cover purchases (21%).
At the same time, growing
inflation, rising cost of energy, and higher interest rates are pushing
consumers to take increasing measures to track, review and adapt their
spending – changing the dynamics of how they manage their finances. Though
almost half of Australian adults (45%) state that they do not need help with
managing their money, the situation is significantly different among young
consumers. Three-quarters of 18–24-year-olds (74%) and four in five
25–34-year-olds (82%) report that they need some kind of assistance to manage
their money better. An understanding of how to use
investments to grow their money is the top priority of those aged 18–34 (34%
for 18–24, 36% for 25–34). This is followed by help in budgeting and tracking
expenses (28%), planning for future life events (27%) and bettering their
money management (26%) for the younger group. Those aged 25–34 are of similar
opinion, with the addition of assessing and improving their financial
situations (40%) and advice on mortgaging and homeowning interest rates (26%)
as the fourth and fifth most important avenues of help.
February
9, 2023 Source: https://au.yougov.com/news/2023/02/09/over-two-five-australians-report-fall-disposable-i/
781-782-43-27/Polls Supermarkets
Remain The Most Trusted While Qantas’ Reputation Crashes And Distrust For
Optus And Medibank Soars
Retail
heavyweights have continued to lead the way in the latest Roy Morgan ‘Net
Trust’ rankings. The top five most trusted brands are unchanged for a fifth
straight quarter - Woolworths, Coles, Bunnings, ALDI and Kmart. The September 2022 data breach has
caused Optus’ Net Distrust Score to deteriorate significantly, moving from
the 17th most distrusted brand in the September quarter, to
the 2nd most distrusted brand in the December quarter –
displacing Telstra. Only Facebook / Meta is now more distrusted than
Optus. Medibank suffered a similar fate as
a result of their own data breach in October 2022. The private health insurer
was previously a trusted brand, but has now become the 14th most
distrusted brand in the country. Roy Morgan data scientists analysed
nominations from more than 22,000 Australians to identify the nation’s most
trusted and most distrusted brands. Click
here to register for the
Roy Morgan webinar on Australia’s most trusted and distrusted brands in
December 2022 quarter with a special focus on Qantas, Optus, Telstra and
Medibank. Roy Morgan CEO
Michele Levine says that brands need to be aware of the dangers that distrust
presents in the wake of major scandals. “What we see with
brands that suffer major scandals is that once distrust takes hold, it is
very difficult to curtail. We saw it with AMP and the big four banks
following the Royal Commission, and we are still seeing it with Harvey
Norman. More than 2 years after the JobKeeper scandal they are still ranked
in the top 10 most distrusted brands in the country.” “The first step
in re-building trust is to eliminate distrust, and only Roy Morgan measures
distrust.” Other big movers in the ‘Net Trust’
rankings include Twitter, which has moved from the 16th most
distrusted brand to the 11th most distrusted brand this
quarter, following the purchase of the social media giant by billionaire Elon
Musk. BP has also moved back into the Top
20 most distrusted brands, moving from 21st to 16th. The top 10 most
trusted brands in Australia: December 2022 (Change from September 2022)
Source:
Roy Morgan Single Source (Australia). Risk Monitor, January 2022 – December
2022. Key commercial brands with 20+ mentions. Base: Australians 14+; n=22,964. The top 10 most
distrusted brands in Australia: December 2022 (Change from September 2022)
Source:
Roy Morgan Single Source (Australia). Risk Monitor, January 2022 – December
2022. Key commercial brands with 20+ mentions. Base: Australians 14+; n=22,964. February
07, 2023
781-782-43-28/Polls Australian
Unemployment Jumps To 10.7% In January – Highest Since Jobkeeper Ended In
March 2021
Australian employment decreased by
150,000 to 13,418,000 in January. The decrease was driven by a drop in
part-time employment, down 280,000 to 4,517,000, while full-time employment
increased, up by 130,000 to 8,901,000. The movements in both full-time and
part-time employment were in line with the normal seasonal trends seen at
this time of year following the Christmas retailing season.
1,607,000 Australians were
unemployed (10.7% of the
workforce) in January, an increase of 223,000 from December
with more people looking for full-time work, up 49,000 to 644,000 and more
people looking for part-time work, up 174,000 to 963,000 – both at their
highest since March 2021.
The workforce in January was
15,025,000 (up 73,000 from December) – comprised of 13,418,000 employed
Australians (down 150,000) and 1,607,000 unemployed Australians looking for
work (up 223,000).
In addition to the unemployed, 1.43
million Australians (9.5% of the workforce, up 0.4% points) were under-employed
– working part-time but looking for more work, up 65,000 from December. In total 3.03 million Australians
(20.2% of the workforce) were either unemployed or under-employed in January,
up a large 288,000 on December. This is the highest level of combined
unemployment and under-employment for two years since February 2021
(3,068,000, 21.0% of the workforce). Compared to early
March 2020, before the nation-wide lockdown, in January 2023 there were more
than 850,000 more Australians either unemployed or under-employed (+4.6%
points) even though overall employment (13,418,000) is over 500,000 higher
than it was pre-COVID-19 (12,872,000). Roy Morgan’s under-employment
figure of 9.5% is over 3% points higher
than the ABS estimate of 6.1% for December. However, the ABS
figures for December show there were 807,400 workers who worked fewer hours
than usual (or zero hours) due to illness, personal injury or sick leave
compared to an average of 541,240 for the month of December over the five
years from December 2017 – December 2021. This difference in the numbers of
people who worked fewer hours (or zero hours) due to illness, personal injury
or sick leave, which can be put down to the highly infectious Omicron variant
of COVID-19, equates to a difference of 266,160 in December 2022 above the
average for the month of December for the previous five years. If these
workers are added to the approximately 876,100 workers, the ABS classifies as
under-employed this creates a total of 1,142,260 – equivalent to 8.0% of the
workforce. When the ABS unemployed (3.5% of
the workforce, 499,800 workers) and this larger than usual level of
under-employed (8.0% of the workforce, approximately 1,142,260 workers) are
combined these figures add to 1.64 million workers, around 11.5% of the
workforce – just over half of the comparable Roy Morgan figure. Roy Morgan
Unemployment & Under-employment (2019-2023)
Source: Roy Morgan Single Source January 2019 – January
2023. Average monthly interviews 5,000. Michele Levine, CEO
Roy Morgan, says the ending of pandemic related restrictions in October 2022
has seen the return of seasonal factors to the Australian employment markets
in recent months including the usual movements in full-time and part-time
employment in January: “The latest Roy
Morgan employment estimates for January show unemployment increasing by
223,000 to 1,607,000 (10.7%, up 1.4% points) – the highest level of
unemployment for nearly two years, since the JobKeeper employment retention
program ended in March 2021. “The usual
seasonal trends were seen in January as part-time employment dropped after
the pre-Christmas retailing season, down 280,000 to 4,517,000 while full-time
employment increased, up 130,000 to 8,901,000. Both of these trends are
usually observed during the new year period as part-time retailing jobs dry
up and people begin new full-time jobs to start the year. “The significant
decline in part-time jobs led to the usual increase in the under-employment
rate in January which increased 65,000 to 1,426,000. Of concern is that over
3 million Australians (20.2% of the workforce) are now either unemployed or
under-employed – the highest combined figure for two years since February
2021 near the end of the JobKeeper employment subsidy. “Despite the
complaints from some sectors who can’t find enough people to work in their
industries, there continues to be a large pool of millions of Australians who
are looking for work or looking for more work. This larger pool of potential
workers than is usually considered has also been covered in the annual ABS Annual ‘Potential workers’ release – last released in
May 2022. “The latest ABS CPI figures released in late January show official annual inflation in Australia
reaching a 32-year high of 7.8% in the December quarter 2022 – a figure that
led the RBA to increase interest rates by another +0.25% to 3.35% at its
first meeting of the year in early February. “The RBA has also
indicated it intends to continue increasing interest rates – at least for the
next two months – as it attempts to bring inflation under control. The next
official ABS quarterly CPI figure for the March quarter 2023 is due to be
released on Wednesday April 26 in just over two months’ time. “The RBA meets
the week after the ABS March quarter CPI reading and Treasurer Jim Chalmers
is scheduled to deliver the Albanese Government’s first Federal Budget under
two weeks later on Tuesday May 9. If the RBA increases interest rates as
expected by +0.25% at each of the next two meetings they will sit at 3.85% in
April – the highest official interest rates for 11 years since April 2012. “This confluence
of official CPI figures, RBA meeting and Federal Budget will be pivotal in
determining the course of the Australian economy over the next few years. The
Albanese Government and other policy-makers must keep at the forefront of
their thoughts the millions of Australians looking for work or looking for
more work and who are the most likely Australians to be struggling with the
challenges of high inflation and the rising cost of living.” Roy Morgan
Unemployed and ‘Under-employed’* Estimates
*Workforce
includes those employed and those looking for work – the unemployed. February
14, 2023 Source: https://www.roymorgan.com/findings/9176-australian-unemployment-estimates-january-2023
781-782-43-29/Polls ANZ-Roy
Morgan Consumer Confidence Drops To Lowest Since Early April 2020 At Only
78.1 After RBA Increases Interest Rates To Decade High
ANZ-Roy Morgan
Consumer Confidence dropped 5.5pts to 78.1 this week after the RBA increased
official interest rates to the highest rate since October 2012, up +0.25% to
3.35%. This was the largest weekly drop in Consumer Confidence following an
RBA meeting since a drop of 6.6pts after the RBA increased interest rates by
+0.5% in early June. Current financial
conditions
Future financial
conditions
Current economic
conditions
Future economic
conditions
Time to buy a
major household item
ANZ Senior
Economist, Adelaide Timbrell, commented: Consumer
confidence fell after the RBA raised interest rates by 25bp. This was the
sharpest weekly drop in confidence since the June 2022 RBA meeting, which
delivered the first 50bp cash rate hike of the current interest rate cycle.
The average confidence among people paying off their mortgages fell sharper
than other housing cohorts last week, by 10pts to its lowest since early
April 2020. Confidence among homeowners and renters also fell, by 5.2pts and
2.9pts respectively. The subindex for whether ‘it is a good time’ to buy a
major household item dropped to its lowest since April 2020. February
14, 2023 Source: https://www.roymorgan.com/findings/9165-anz-roy-morgan-consumer-confidence-february-14 MULTICOUNTRY STUDIES
781-782-43-30/Polls Car brands are already deeply
entrenched on social media: Tesla, for example, has almost 20 million
followers on Twitter. What role do reviews on platforms like YouTube and
TikTok play in the car buying process? Reviews also play an important role
in hotels , which are
closely following mobile at 43% . The percentage of consumers who
consult opinions on social networks before buying a car is lower, but still a third (31%).
Of the 17 markets studied in this
survey, Chinese consumers are the most likely to trust social media reviews
before buying a car (46%). Indonesians follow slightly behind, with
42%. Consumers in other Asian markets are not as likely to say they
check social media reviews before buying a car. Urban Indians (33%)
outperform global respondents (31%) when it comes to seeking opinions on
social media. However, consumers in Hong Kong (24%) and Singapore (21%)
are the least likely among the Asian markets to choose cars as the product
for which they consult these reviews. Consumers in the European region do
not think alike. While a few countries exceed the world audience -Poland
(42%), Italy (36%), Spain (33%) and Sweden (32%)-, in
the other half, a third of consumers say they consult social networks looking
for opinions on cars before buying. In Great Britain, less than a
quarter of consumers (23%) say they use social media, the lowest percentage
in all European markets. Americans and Brits have similar
social media habits: 23% of Americans also say they check reviews on social
media before deciding which car to buy, well below their northern neighbors
Canada (35%). UAE consumers are only slightly
more likely than global respondents to say they check social media reviews
before buying a car (32%). February
7, 2023 Source: https://es.yougov.com/news/2023/02/07/el-papel-de-las-redes-sociales-en-la-compra-de-coc/
781-782-43-31/Polls In
A Yougov Survey Conducted In 18 Countries, One Fifth Of Global Consumers
Consider Themselves Price Sensitive When It Comes To Entertainment Outside
The Home
Recently, AMC, the largest theater
chain in the United States, has revealed that the price of tickets will
depend on the location of the seats: the front seats will be more affordable,
while the first ones will have a higher price. Ticket prices for
Blink-182's concert in Australia, scheduled for 2024, range from $250 to $400
or more for the best standing room seats. As for the Super Bowl, even
the cheapest secondary market tickets are over $5,000. In Spain, the
Beyonce concert reached 7,000 euros in the VIP areas. But to what extent
are consumers aware of the price of entertainment away from home?
Consumer attitudes toward
out-of-home entertainment prices show significant variability across
countries, according to the data. A third of Spanish consumers are aware
of leisure prices, which places this country at the head of all those
surveyed (33%). In Europe, after Spain (33%), Italy
(23%) and Poland (20%) have the highest percentage of price-conscious
consumers, while France (19%) presents similar figures. By contrast,
consumers in Denmark (8%) and Sweden (13%) are less likely to worry about
entertainment prices. In the UK, consumers aged 35-44
(20%) and 45-54 (21%) tend to be more price-conscious than 18-24 and 25-34
(16% each) . On the contrary, those over 55 are the least sensitive to
the cost of leisure outside the home, with only 13% of this age group. In North America, Mexico (28%) and
Canada (24%) have similar percentages of price-conscious consumers, while US
consumers are less sensitive, with only 16% of Americans
price-conscious. Segmenting the data by age, it can be seen that US
adults ages 18-24 (19%), 25-34 (17%), and 35-44 (17%) tend to be more price
sensitive than their counterparts aged 45 to 54 (14%) and 55 and over (15%).
In Asia, the percentage of
price-conscious consumers is relatively constant. India (22%) and Hong
Kong (21%) have comparable shares, while the UAE (20%) has a slightly higher
share. On the other hand, Singaporean consumers (17%) are less price
conscious for out-of-home entertainment compared to other markets in Asia. Brands can take advantage of this
data to tailor their marketing and pricing strategies to the needs and
preferences of consumers in different regions. For example, brands could
offer discounts or promotions in regions where a higher percentage of
consumers are price conscious, in order to attract more customers. February
10, 2023 Source: https://es.yougov.com/news/2023/02/10/el-precio-del-ocio-demasiado-alto-analisis-global/
781-782-43-32/Polls Yougov
Survey Of 18 International Markets Shows That Chatbots May Not Live Up To
Their Potential
The perception of chatbots as a
useful tool for online shopping for out-of-home entertainment options varies
significantly across markets. In Europe, consumers in Germany (12%) and
Spain (15%) see a higher degree of utility in chatbots, while others like
Great Britain (5%), Denmark (5%) and Sweden (6%) have a more skeptical view
Consumers in Mexico (20%) have the
most positive opinion about the usefulness of chatbots for out-of-home
entertainment purchases. However, this view is not shared across the
Americas, with Canada (9%) and the US (6%) showing much lower response rates. Asia presents a mixed picture, with
markets such as India (16%) and the UAE (17%) having a relatively higher
appreciation of chatbots, while others such as Hong Kong (14%) and Singapore
(10%) have a relatively higher outlook. more modest. To maximize the benefits of
chatbots, brands need to understand and address the specific needs and
preferences of their consumers in each market. With the right strategy
and approach, chatbots can play a key role in improving the customer
experience and driving brand loyalty in the highly competitive world of
out-of-home offerings. February
13, 2023 Source: https://es.yougov.com/news/2023/02/13/chatbot-tecnologia-util-para-la-compra-de-eventos-/
781-782-43-33/Polls Citizen
Priorities On The Environment And Climate Change In MENA, A Survey Among 12
Nations
The results of the seventh wave survey from Arab Barometer, a non-partisan
research network that provides insight into Arab citizen views, shed light on
regional perspectives on issues of climate change, water resources, and the
environment. The survey, fielded between October 2021 and July 2022, included
respondents from 12 countries across the Middle East and North Africa:
Algeria, Egypt, Iraq, Jordan, Kuwait, Lebanon, Libya, Mauritania, Morocco,
Palestine, Sudan, and Tunisia. The survey results regarding
citizen priorities on issues of climate change, water, and the environment
indicate that while citizens in the MENA region experience the effects of
climate change on a day-to-day basis, when it comes to their concerns about
these issues, they tend to focus on the micro level (e.g. immediate and
local) vs. the macro level (i.e. long term and global). Concerns from
citizens are largely centered on what affects them most directly, failing to
recognize that by not addressing other, larger issues, the specific
environmental outcome they are most concerned about can actually get worse.
For example, prioritizing water issues as an environmental challenge while
not doing the same for climate change demonstrates a lack of understanding on
how climate change is a key driver of the current state of water resources in
the region. Similarly, suggested actions by citizens that would benefit the
environment are not primarily motivated by concerns for the environment but
rather by social and economic reasons that are more personal in nature, such
as aesthetic concerns associated with trash collection (waste management) and
participating in recycling and reuse as a means to cut costs. Considering this newly-realized
perspective on how citizens are both experiencing and responding to the
effects of climate change, here are five key takeaways gleaned from the
survey results: 1. Water issues
are viewed as the leading environmental challenge but climate change is among
the lowest Water scarcity is a universally
binding challenge for countries in the MENA region, regardless of the
disparities in accessibility to different sources of water. This view is
reinforced by the results of the survey, where citizens from all surveyed
countries indicated that water issues were their biggest environmental
challenge, with citizen responses in agreement ranging from 32% in Lebanon up
to 59% in Tunisia. MENA is considered the most water-stressed region in the world,
with 12 MENA countries experiencing an extremely high baseline of water
stress. While water is clearly at the forefront of citizen concerns, many
fail to see how climate
change influences the state of water resources in the region, and
the potential that climate change has on making it worse. This could be a
consequence of citizens dealing with multiple day-to-day crises, such
as economic
hardships, instability
in governance, and human
rights violations. Therefore, impacts to a much-needed resource
like water may take precedence over policy issues associated with a threat
like climate change, which in contrast may seem more nebulous to citizens
confronting more immediate challenges. 2. The pollution
of drinking water is important to downstream countries in major transboundary
surface water systems For respondents that identified
water issues as the biggest environmental challenge, the pollution of
drinking water was deemed the most important challenge pertaining to water in
Egypt and Iraq (among 93% and 74% of respondents, respectively). Both Egypt
and Iraq are riparians to the two largest surface water systems in MENA, the
Nile River and the Tigris and Euphrates Rivers system. Egypt and Iraq also
share a common transboundary condition; they are both at the tail end of
their respective surface water systems. Most downstream nations of
transboundary rivers traditionally receive the lowest level of water quality
in a shared system. This is due to two main reasons: Exposure of the waterway
to the elements introduces more pollutants the further a river travels, as
does return flow to the river from multiple diversions and consumptive uses
along its run, such as from farming or human uses. Both of these factors can
introduce increased salinity and contaminants into the river. Consequently,
water quality issues have plagued both Egypt and Iraq,
causing elevated risks of water-borne illnesses for their residents
(especially when coupled with inadequate access to clean and treated drinking
water). 3. Waste
management is important but in the context of trash collection Following water issues, waste
management ranked second among all countries polled (with the exception of
Kuwait) as the biggest environmental challenge, with consensus as low as 16%
in Tunisia and as high as 30% in Sudan. All countries indicated a higher rate
of dissatisfaction than satisfaction with their trash collection services.
Solid waste management continues to be an area of where MENA struggles,
whether because of the amount of waste generated or the limitations in public
services to manage waste sufficiently. With the exception of Oman, all of the
Gulf Cooperation Council countries rank
in the top 10 in the world with respect to solid waste
generation per capita. Over the last couple of years, a number of MENA
countries saw massive accumulations
of trash in major cities as municipalities
struggled to keep pace with the rate of waste being
generated. 4. Governments
should do more to address climate change but if not, keep doing the same Respondents from all surveyed
countries agreed that their national government should be doing more to
address climate change; the highest citizen response came from the Maghreb
region with 64% and 62% agreement from Tunisia and Algeria, respectively. As
such it is clear that citizens from MENA recognize that their governments
should do more to contribute towards mitigating against the climate crisis,
particularly within their own respective countries. This push can be
attributed to the various climate youth groups leading the way in terms of
public engagement — groups like the Arab
Youth Climate Movement, Mediterranean Youth
Climate Network, and Libya
Youth Council for Climate Change. However, even though citizens
may want their governments to expand national efforts for a more
climate-resilient future, if their governments are not able to do so (e.g.
due to capacity and funding constraints), citizens would still be satisfied
with the existing level of government engagement on climate change. Citizen
responses for all surveyed countries supported that their national governments
should be doing about the same when it came to addressing climate change as a
second option if they cannot do more; this response was highest among
citizens from the Levant region, where 39% of respondents in both Lebanon and
Jordan agreed. But that public perspective may not exactly correlate with a
country’s level of demonstrable climate action. For example, respondents from
Egypt and Morocco shared this preference for more governmental climate action
first and similar levels of climate action second. But according to the 2023
Climate Change Performance Index, Morocco rated high while Egypt
rated medium when it came to their respective performance vis-à-vis climate
change. 5. Recycling and
reuse are primarily cost-saving measures and not for environmental protection According to respondents, with the
exception of Kuwait, cost savings and not environmental protection
incentivized citizens to recycle or reuse plastic and glass bottles. This
opinion was overwhelmingly supported by responding citizens in each polled
country, where no less than 40% of respondents agreed (with the highest
consent coming from Egypt at 71%). And while the cost savings from this
approach may be modest, MENA citizens are desperate for any financial
reprieve. Citizens across the region are struggling with the effects of sky-rocketing
inflation, devaluing currencies, and high unemployment brought
on by the current economic crisis. An outcome where more MENA citizens are
involved with recycling and reuse is always favorable. However, perversely in
this case, it comes at a cost that is quite literally too high for many MENA
citizens that are enduring economic difficulties. February
14, 2023
781-782-43-34/Polls What
Countries Do Western Europeans And Americans Consider To Be Similar To Their
Own, A Survey Among 8 Nations
A new YouGov Political Research study conducted in Britain, Denmark,
France, Germany, Italy, Spain, Sweden and the USA, asked people to rate how
similar they consider their own country to be to between 38 and 47 different
countries.
Spain tops Italy’s list of similar
countries, while Italy ties with Portugal for the most similar country to
Spain according to Spaniards (78%). While there is an elevated affinity
in Spain for other Spanish-speaking nations, it is substantially lower than
in Britain for other English-speaking nations: 36% of Spanish people believe
Argentina to be a similar country and 24% say the same of Mexico (compared to
14% for Portuguese-speaking Brazil). In France, Belgium is most likely
to be listed as a similar country (70%), while for Germany it is Austria
(74%), followed by the Netherlands (65%). Despite the majority of the
population of Switzerland speaking German, Germans are notably less likely to
consider their two nations to be similar, at 54%. Unsurprisingly, in Denmark and
Sweden the other Nordic nations come towards the top of the similarity list.
In Sweden the top three list is occupied by neighbours Norway, Denmark, and
Finland (82-83%), with more the more far-flung Iceland placing fifth at 65%.
For Denmark, while Sweden and Norway take the joint top spot (86%), further
afield Finland and Iceland come joint-fifth on 71%. Perhaps because English is so
widespread in Scandinavia, there are also many in Denmark and Sweden who take
the view that their countries are akin to Anglophone nations like Canada
(55-64%), New Zealand (45-52%) and Australia (44-47%), although notably not the US, at 25-26%. For the US, only four countries are
seen as similar by at least half of Americans. Parent country the UK (66%)
and sibling Canada (70%) are seen as alike the US by notable majorities of
Americans, with third and fourth-placed Australia and Germany much further
behind on 53% and 51% respectively. Which countries’
perceptions of similarity are most in accordance, and which are most
unrequited? Each of the eight countries the
survey was conducted in was also included in the list of countries we asked
about. This allows us to compare the results between pairs of participating
nations, to see whether there is agreement between two countries on how
similar they are to one another, or if one country’s views are different to
the other’s. Unsurprisingly, the greatest level
of agreement is between the two Nordic nations we surveyed: 82% of Swedes see
the two nations as similar, and 86% of Danes agree. Sizeable majorities in both Spain
and Italy consider their countries to be similar to one another, although
this opinion is more widespread in Spain (78%) than it is in Italy (66%).
France forms the basis of a
‘continental core’, with most people in France considering it to be similar
to major neighbours Germany (63%), Spain (63%) and Italy (61%), and
near-identical numbers in each of those three countries in turn seeing
themselves as similar to France (59-63%). There is no such agreement for
Germany compared to Italy and Spain. Fewer than half of Germans see
themselves as similar to either country (43% in both cases), while fewer
Spaniards and Italians still see their nations as similar (32-34%). Other comparisons are even more
one-sided. In all cases, Americans are more likely to see themselves as
similar to the European countries we surveyed than those countries are to see
themselves as similar to the USA. For example, despite the ‘special
relationship’, while 66% of Americans say the UK and US are similar
countries, this falls to 49% among Britons. While Britons might snub America in
this regard, we are in turn snubbed by our major continental neighbours.
While 53-56% of Britons consider the UK to be similar to France and Germany, just
35-36% of French and German people feel the same. Likewise, while 42-44% of
Britons believe the UK is similar to Spain and Italy, only 24-26% of
Spaniards and Italians hold the same view. A similar story plays out for the
Nordics compared to the rest of the continent, with Britain, France, Germany,
Italy and Spain far less likely to see themselves as similar to Denmark and
Sweden than vice versa. That said, a majority of Germans do consider their
country to be similar (53-58%), but this is still a far cry from the 79% in
Denmark who feel similar to Germany and the 73% of Swedes who say the same. February
17, 2023
781-782-43-35/Polls Annual
Win World Survey (WWS – 2022) Exploring The Views And Beliefs Of Individuals
In 36 Countries About Corporate Social Responsibility (CSR)
WIN
International, the world’s leading association in market research and polling
has published the Annual Win World Survey (WWS – 2022) exploring the views
and beliefs of 29,269 individuals in 36 countries about Corporate Social Responsibility (CSR).
What do people know about it? Is it important when making purchase decisions? Increase
in Awareness Respondents’ level of education is directly linked
to their level of awareness: higher education means higher awareness of CSR. On a regional level, this varies. Europe is at the
top with the highest awareness increase (+6%) compared to the previous year;
followed by the Americas +3%. On the other hand the MENA regions are less
familiar with the concept, with 59% of people not knowing what CSR stands
for.
Companies
aren’t doing enough Respondents are
becoming more skeptical. When asked how much companies embrace and promote
CSR, 42% believe that companies are not seriously embracing CSR and that the
actions in place are only made for appearance (+3% compared to 2021). 25%
also believe that most companies do not care about CSR at all, unchanged
compared to previous year. Only 16% believe
that brands are seriously following CSR guidelines, the more trusting region
is APAC with24% of people believing in companies’ efforts, and countries like
Malaysia, Philippines and India also following this line of thought. Decrease
in CSR’s influence in purchase decisions Surprisingly,
less people compared to last year are influenced by companies’ CSR efforts
when buying products and services. Distrust towards brands translates
to a wider disinterest in guiding purchase decision based on those efforts.
CSR influence on purchase decision dropped from 62% to 50%, but results vary
significantly among countries. India (82%), Mexico (71%) and Turkey
(67%) show the highest levels of influence of CSR on purchase decisions.
While Kenya (71%), Netherlands (66%) and South Korea (60%) appear to be the
most skeptical countries. When making
purchase decisions Africa (51%) and Europe (47%) are the least influenced
continents by CSR.
Vilma
Scarpino, President of WIN International Association, said: ‘We are learning
from every edition of our WIN World Survey that people are increasingly more
worried about the environment and that they want to act upon this concern,
and call companies, institutions, and governments to help. However, at the
same time, a wide distrust towards international actors and their role in
taking care of society and the environment is increasing, leading to citizens
not even considering companies’ CSR efforts in their everyday purchase
decisions. We need to make sure that the widely accepted concerns about
society and the environment have a direct effect on everyone’s actions, and
rely at the same time on the fact that increasingly more people are familiar
with the definition of Corporate Social Responsibility. Those who are getting
familiar with the concept now, should also make sure to keep the value in
mind when making purchase decisions.’ 19 February 2023 Source: https://winmr.com/does-corporate-social-responsibility-influence-purchase-decisions/ |
||||||||||||||||||||||||||||||||||||||||||||||||||||||||||||||||||||||||||||||||||||||||||||||||||||||||||||||||||||||||||||||||||||||||||||||||||||||||||||||||||||||||||||||||||||||||||||||||||||||||||||||||||||||||||||||||||||||||||||||||||||||||||||||||||||||||||||||||||||||||||||||||||||||||||||||||||||||||||||||||||||||||||||||||||||||||||||||||||||||||||||||||||||||||||||