|
BUSINESS & POLITICS IN THE WORLD GLOBAL OPINION REPORT NO. 784-785 Week: March
27 – March 12, 2023 Presentation:
March 17, 2023 Inside
Afghanistan: Record Numbers Struggle to Afford Basics 11 UAE
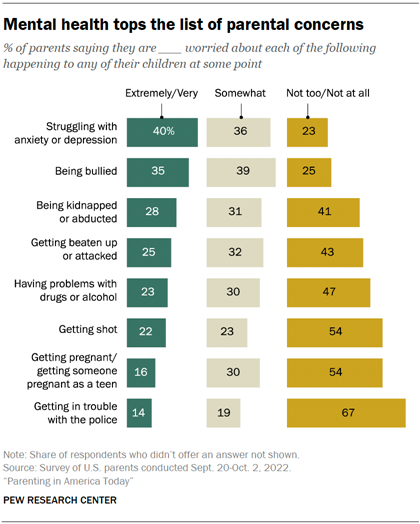
Parents Have High Concerns over Their Child’s Exposure To Inappropriate
Online Content 13 Health
Insurance Coverage for Nigerians Still Abysmal; An Urgent Call For New
Strategy. 15 Labour
Voters More Wary about Politics of Child’s Spouse 17 Most
Brits Expect Recession, As Consumer Confidence Dips To Six-Year Low 19 Half
of Leave Voters Doubt Johnson Can Secure New Brexit Deal 21 Few
Believe the Government's Explanation of Why Parliament Is To Be Suspended 23 Brits
Oppose Parliament Suspension By 47% to 27% 24 5
Facts about the Abortion Debate In America 25 U.S.
Concern about Climate Change Is Rising, But Mainly Among Democrats 28 Most
Americans Say Science Has Brought Benefits to Society and Expect More to
Come 31 Parents'
Concern about School Safety Remains Elevated 34 As
Labor Day Turns 125, Union Approval Near 50-Year High 36 Americans'
Satisfaction with U.S. Education at 15-Year High 38 Most
Cannabis Consumers Use on a Weekly Basis or More 41 Ride-Sharing
App Uber Overtakes Taxis as Preferred Private Transport Service 43 Rising
Numbers of Australians Looking At Electric and Hybrid Vehicles for Their
Next Set of Wheels 45 Toyota
And Mazda Drivers Most Brand Loyal; Have The Luxury Brands Lost Their
Lustre? 48 Britons
Make Worst Tourists, Say Britons (And Spaniards And Germans) 50 Brazilians
Least Satisfied in Amazon With Environment 55 India
Ranks 9th on Happiness among 28 Global Markets: Ipsos Global Happiness
Survey 58 The
Biggest Beauty Influencer Isn’t Who You Think It Is 59 INTRODUCTORY NOTE This weekly report consists of thirty-five surveys.
The report includes eight multi-country studies from different states across
the globe. 784-785-43-36/Commentary: Out
Of The 64 Countries That Were Surveyed, South Korea Tops Security Preference
For US, Pakistan Tops Preference For China, While Serbia Tops The Preference
For Russia And Sweden For EU For Security Partnership: GIA And Gallup & Gilani Pakistan
According to a survey conducted by
Gallup International Association, out of the 64 countries that were surveyed, South Korea tops
security preference for US, Pakistan tops preference for China, while Serbia tops the preference for Russia and
EU for security partnership An opinion poll was conducted by
GIA in 64 countries covering over two thirds of the global population (and more than 90% of
those countries which are free to conduct and publish opinion research). This press release sheds
light on the findings of the survey regarding perceptions on strategic partnerships between countries. The question asked was “Which of
the following would you prefer your country to partner with for security – the US, China, Russia,
or The EU?” 84% people from South Korea said USA, 54% from Pakistan said China, 53% from
Serbia said Russia and 69% from Serbia said EU. The top 5 countries, with the
greatest number of people who responded USA were: 1. South Korea – 84% 2. Israel – 79% 3. Kosovo – 77% 4. Japan – 65% 5. Philippines – 63% The top 5 countries, with the
greatest number of people who responded China were: 1. Pakistan – 54% 2. Russian Federation – 50% 3. United Arab Emirates – 36% 4. Thailand – 25% 5. Palestinian Territories – 24% The top 5 countries, with the
greatest number of people who responded Russia were: 1. Serbia – 53% 2. Ethiopia – 46% 3. Syria – 45% 4. Armenia – 42% 5. Ivory Coast – 40% The top 5 countries, with the
greatest number of people who responded EU were: 1. Sweden – 69% 2. Ireland – 62% 3. Slovenia – 58% 4. Portugal – 54% 5. Switzerland – 52% Results by Demography (Security
Partnership): Age Differences in popularity of
Partnership on Security • Younger and middle-aged
populations are more amiable towards US when it comes to striking Security Partnership while the
older aged population prefers US and EU equally. • Across all age groups US was the
top preference across all the different parts of the world. Popularity Gap in terms of security
partnership between China and US • Among different religious groups,
US is ahead of China in preference for security partnership. • Hindu respondents most upbeat
about security partnership with US • After US, Christians and Hindus
prefer EU while Muslims prefer Russia Popularity of Security Partnership
by Per-capita Income. • Interesting to note that just
like economic preference, low-income economies prefer China for security partnership. • High-Income economies prefer EU
for security partnership, this could perhaps be explained by the fact that most high-income
economies belong to the EU while lower-middle income economies have the highest
preference for US as 39% responded so. Results by Region (Security
Partnership): Popularity of Security Partnership
with China • Popularity of security
partnership with China was found to be highest in South Asia followed by MENA region. The least support was
found in EU (with 3% saying they would prefer that) • Interestingly populations among
G7 countries, the support for partnership with China is highest in US where 16% seek security
partnership with China. The lowest in G7 country is Japan in its preference for China for security
partnership • Widespread support for security
partnership with US exists in East Asia and Oceania where 3 in 5 seek partnership. The lowest
support is non-EU Europe East (they seek partnership with EU and Russia) These interesting findings have
emerged out of an annual, 64 country research conducted by Gallup International (founded by the
world-renowned scholar and pollster Dr. George Gallup in 1947). The survey in Pakistan was done by
Gallup Pakistan, Pakistan’s oldest and trusted survey firm, working since 1979.
(Gallup Pakistan) March 08, 2023 Source: https://gallup.com.pk/wp/wp-content/uploads/2023/03/08-March-GIA-PR_merged.pdf ASIA (Japan) Japan Activists Demand
Dual-Surname Option On Women’s Day Women’s rights activists in Japan
renewed their demand Wednesday for the government to allow married couples
the option to keep both of their surnames, saying the current practice in
which most women face social pressure to adopt their husbands’ surnames--a
prewar tradition based on paternalistic family values--widens gender
inequality. “We strongly urge the parliament to face the issue and promptly
achieve a revision to the civil code,” the activists said in a statement they
handed to lawmakers who also attended the rally in Tokyo. (Asahi Shimbun) March 9, 2023 MENA (UAE) Inflation Is Changing Consumer
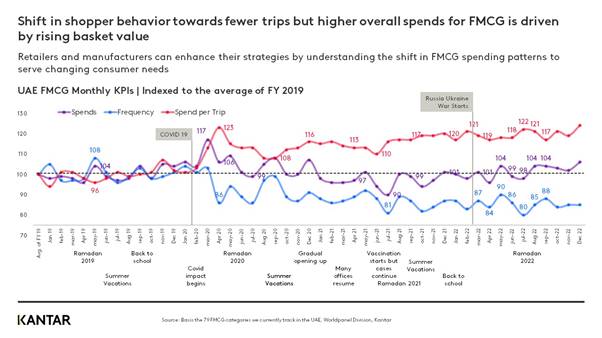
Priorities And FMCG Spend In The UAE Inflation and the resulting price
rises are putting pressure on consumers in the United Arab Emirates (UAE).
Spending has remained high since 2019 and this ongoing financial strain is
leading consumers to change the way they shop. But despite this, the UAE
economy ended 2022 solidly and signs suggest this growth will continue, but might
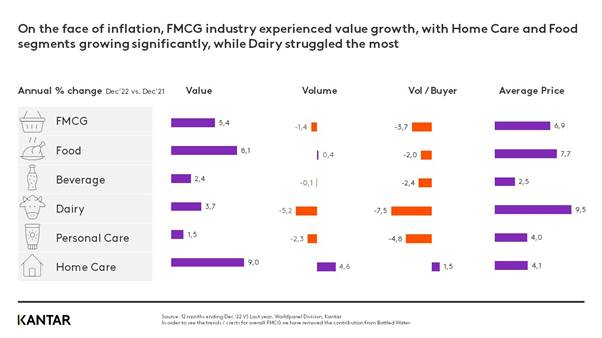
slow in the first half of 2023. Despite the inflationary pressures, the FMCG
industry grew in 2022. Spend on beverages tumbled by -4% and personal care by
-5% due to shoppers shifting their spend to food and home care products,
which grew by 5% and 7%, respectively. (Kantar) 09 March 2023 AFRICA (South Africa) Despite Growing Evidence,
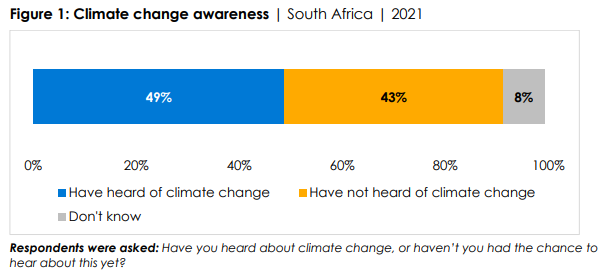
Climate Change Is Still Unknown To Many South Africans About half (49%) of South Africans
said they had heard of climate change, a 7- percentage-point increase since 2018.
Awareness of climate change was particularly low among citizens with less
than a secondary education (36%%), the poor (37%), and rural residents (42%).
o Awareness was slightly above average among citizens who get daily news from
the Internet (58%), newspapers (56%), and social media (55%). Among those who
were aware of climate change, more than six in 10 (62%) said it is making
life in South Africa “somewhat worse” (30%) or “much worse” (32%). (Afrobarometer) 9 March 2023 WEST EUROPE (UK) A Quarter Of Britons Say They
Have A Phobia Of Heights According to the Cambridge
Dictionary, a phobia is “an extreme fear or dislike of a particular
thing or situation, especially one that is not reasonable”. The
NHS states that severe phobias can cause a person to
“organise their life around avoiding the thing that's causing them anxiety.” Five
in ten Britons (21%) say they suffer from arachnophobia, more widely known as
an extreme or irrational fear of spiders. This phobia is more common among
women, with a quarter (26%) saying they suffer from it compared to 16% of
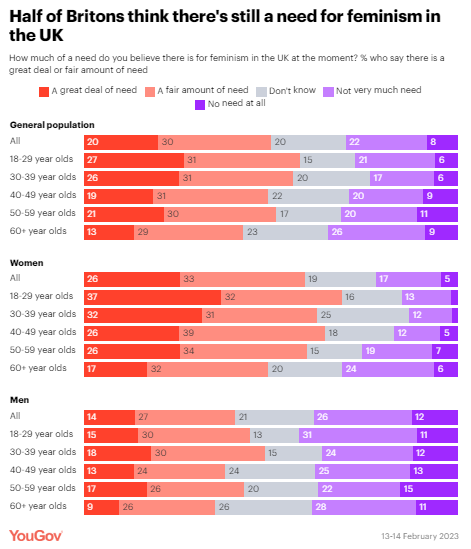
men. (YouGov UK) February 27, 2023 Half Of Britons Say Feminism Is
Still Needed In The UK In 2023 Despite generations of women and
their male allies battling to achieve equality of the sexes, Britons
generally still think there’s work to be done in the UK. The large majority
of the public maintain equality for women and girls has not yet been achieved
across several key areas, from home and family life to work, education, media
representation, crime and politics. One in ten Britons (10%) think there’s
equality for women and girls in the workplace, while 41% say the country is
close to achieving equality and 38% say it’s not close. (YouGov UK) March 08, 2023 Four In Ten
Britons Say They’ve Witnessed Drug Deals In Their Neighbourhoods According to a new YouGov poll,
four in ten Britons (41%) have seen suspected drug deals close to their
doorsteps at least once or twice – including 8% who say they’ve witnessed
dealing “many times”. Young people are more likely to suspect dealing is
going on in their neighbourhoods, with half of 18 to 24-year-olds (51%)
saying they think they’ve witnessed at least one deal in progress, including
14% who’ve seen suspected drug deals on many occasions. (YouGov UK) March 10, 2023 Rising Energy
Costs And Long-Term Price Pressures On UK Farmers Most Likely To Be Seen As
Causes For Fruit And Vegetables Shortages As fruit and vegetable shelves go
empty in supermarkets across the UK, new research by Ipsos shows rising
energy costs and long-term price pressures on UK farmers are most likely to
be seen as key contributors to the shortages with 76% and 73% saying each respectively
has contributed a great deal or fair amount. Other key contributors,
according to people in the UK, include climate change/weather challenges in
countries from which food is imported (65%), agricultural labour shortages
(61%) and Britain leaving the EU (58%). (Ipsos MORI) 6 March 2023 7 In 10 Britons Do Not Think
The Government’s Policies Will Improve Public Services Almost two-thirds think Sunak’s
government has done a bad job managing the economy. The latest Ipsos
Political Monitor, taken, February 22nd to March 1st shows 70% of British
adults do not believe that the government’s policies will improve the state
of public services in the long term, with just 23 per cent thinking they
will. This marks a sharp fall in figures from March last year (2022) where
60% disagreed and 31% agreed, and is the worst set of results for a
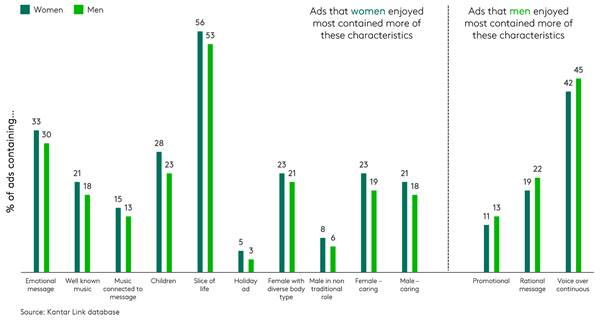
government since Ipsos started asking this question in 2001. (Ipsos MORI) 7 March 2023 How Can Advertising Drive
Gender Equality Women had a difficult time during COVID-19
– more women lost jobs, had to give up income, or handled home education
while continuing to work. And with the current cost of living crisis,
Kantar’s Global
Issues Barometer shows that women are more susceptible to the
implications of recession and inflation, and also felt a lower sense of
wellbeing. Among the ads that men enjoy compared to women we saw higher
numbers of ads with rational messages (+3%) and more use of continuous
voiceovers (+2%) and ads with promotions (+2%). (Kantar) 07 March 2023 (Russia) Romir/M-Holding Research:
Results Of 2022 For The Three Leaders Of The Fast Food Market The research holding
"Romir" (part of "M-Holding") analyzed how the purchasing
behavior of Russians changed towards the most popular fast food restaurants
(QSR) in 2022: Tasty, KFC, Burger King. In total, the top three fast food
restaurants maintained turnover in 2022 (compared to 2021, turnover increased
by 1%). However, the number of visits at the same time decreased by 16% in
annual dynamics, which indicates an increase in prices or the average
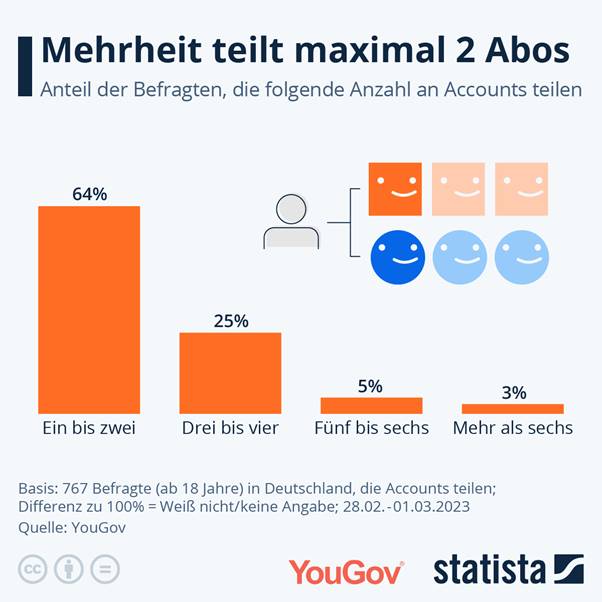
receipt. (Romir) 01 March 2023 (Germany) Almost Two Out Of Five Germans
Use Account Sharing For Their Streaming Subscriptions Almost two out of five Germans (38
percent) share their streaming accounts, including 23 percent within their
own household, 8 percent outside the household and 7 percent
both. Overall, men use account sharing more frequently than women (40
vs. 35 percent). 16 percent of all respondents in Germany say that they do
not share their video or audio streaming accounts with others; men also make
this statement more frequently than women (18 vs. 14 percent). These are
the results of a survey by YouGov in cooperation with Statista. (YouGov Germany) March 09, 2023 Every Fourth German Can Imagine
A Workation For Himself 25 percent of Germans have not yet
done any workation, but can imagine doing so in the future. The “potential
workationers” are significantly more common between the ages
of 45 and 54 compared to the general population (25 vs. 20 percent). In
this potential group, 36 percent have a university or technical college
degree (vs. 30 percent of the total population). 75 percent of
"potential workationers" say that stress makes them ill (vs. 66
percent), 51 percent like to volunteer for a good cause in their free time
(vs. 44 percent). 88 percent say it's okay to be a father these days
(vs. 78 percent), and 79 percent say it's important to be physically
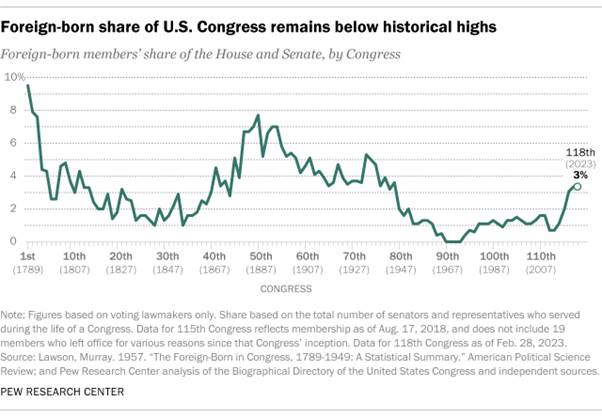
attractive (vs. 69 percent of the general German population). (YouGov Germany) March 09, 2023 NORTH AMERICA (USA) Immigrants And Children Of
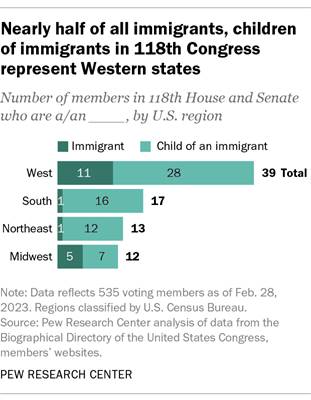
Immigrants Make Up At Least 15% Of The 118th Congress Immigrants and children of
immigrants account for at least 15% of the 118th Congress, a share that has
steadily grown over the past three Congresses. At least 81 voting members of
Congress are foreign born or have at least one parent who was born in another
country, according to a Pew Research Center analysis of members’ biographical
information gathered from the Congressional Research Service, news articles,
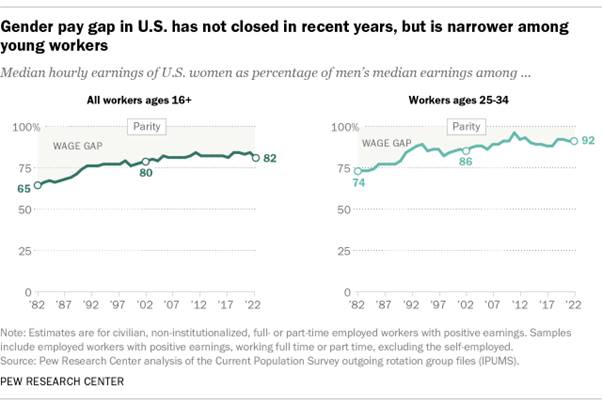
congressional offices and other sources. (PEW) FEBRUARY 28, 2023 Gender Pay Gap In U.S. Hasn’t
Changed Much In Two Decades The gender gap in pay has remained
relatively stable in the United States over the past 20 years or so. In 2022,
women earned an average of 82% of what men earned, according to a new
Pew Research Center analysis of median hourly earnings of
both full- and part-time workers. These results are similar to where the pay
gap stood in 2002, when women earned 80% as much as men. In 2022, women ages
25 to 34 earned an average of 92 cents for every dollar earned by a man in
the same age group – an 8-cent gap. By comparison, the gender pay gap among
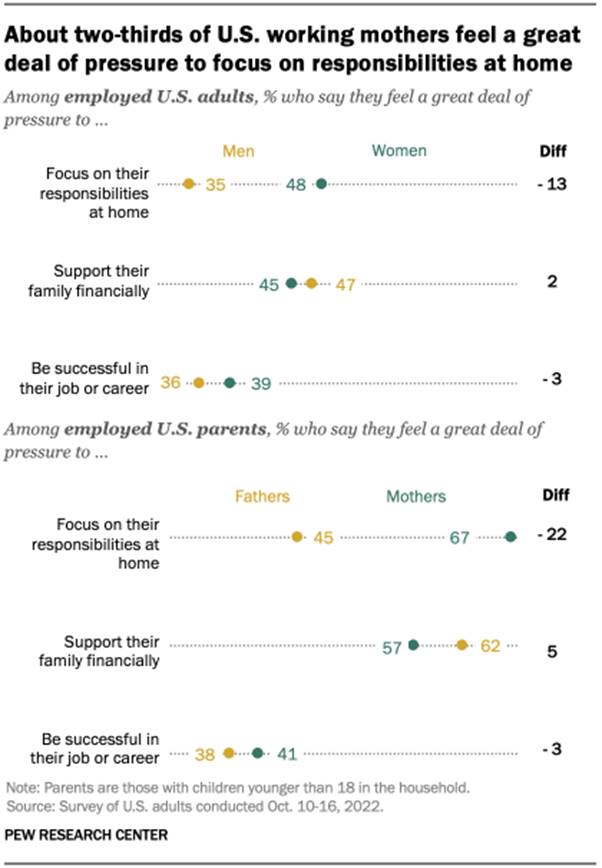
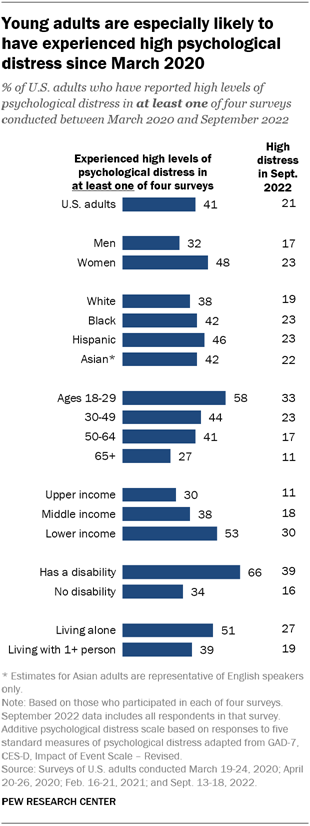
workers of all ages that year was 18 cents. (PEW) MARCH 1, 2023 Mental Health And The
Pandemic: What U.S. Surveys Have Found At least four-in-ten U.S. adults
(41%) have experienced high levels of psychological distress at some point
during the pandemic, according to four
Pew Research Center surveys conducted between March 2020 and
September 2022. Young adults are especially likely to have faced high levels
of psychological distress since the COVID-19 outbreak began: 58% of Americans
ages 18 to 29 fall into this category, based on their answers in at least one
of these four surveys. Women are much more likely than men to have
experienced high psychological distress (48% vs. 32%), as are people in
lower-income households (53%) when compared with those in middle-income (38%)
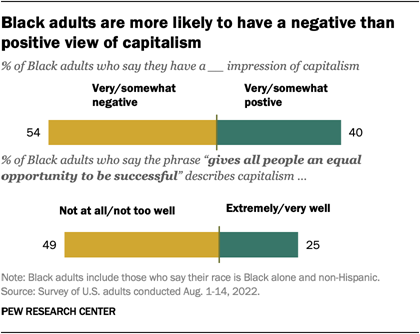
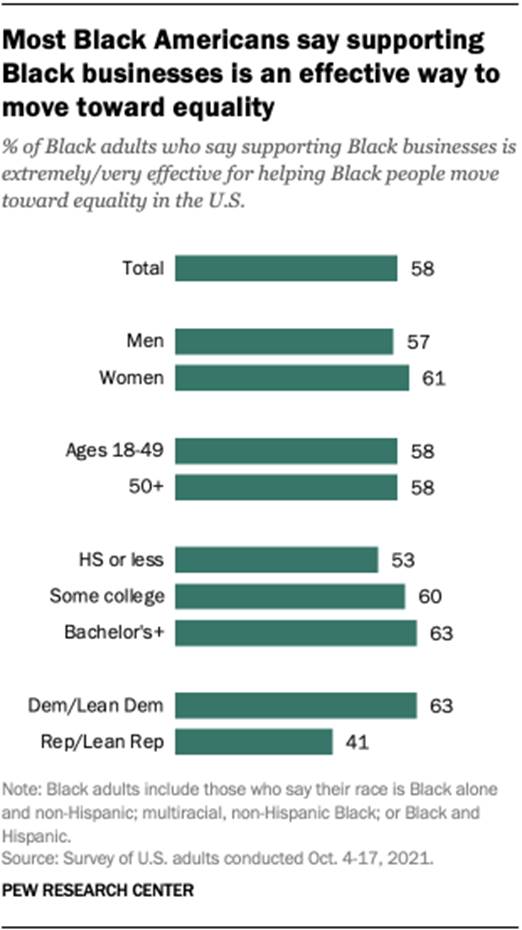
or upper-income (30%) households. (PEW) MARCH 2, 2023 Black Americans
View Capitalism More Negatively Than Positively But Express Hope In Black
Businesses Today, most Black adults say the
U.S. economic system does not treat Black people fairly. And though they are
increasingly dissatisfied with capitalism, most Black adults say supporting
Black businesses will help achieve equality, according to recent Pew Research
Center surveys. Four-in-ten Black adults held a very or somewhat positive
view of capitalism in 2022, down from 57% in 2019. Views of capitalism also
grew more negative among other racial and ethnic groups during this period,
but the movement was particularly pronounced among Black Americans. (PEW) MARCH 8, 2023 (Canada) Eight In Ten (79%) Canadians
Believe Acts Of Violence Will Increase In Canada In The Future A new Ipsos poll conducted on
behalf of Global News finds that Canadians feel more violence in the country
may be on the horizon (79%). For the six in ten (58%) who report feeling that
there has been an increase in violence in their community since the COVID-19
pandemic began, the pandemic’s impacts on mental health (65%), the breakdown
of common values (51%), and economic uncertainty (48%) are believed to be the
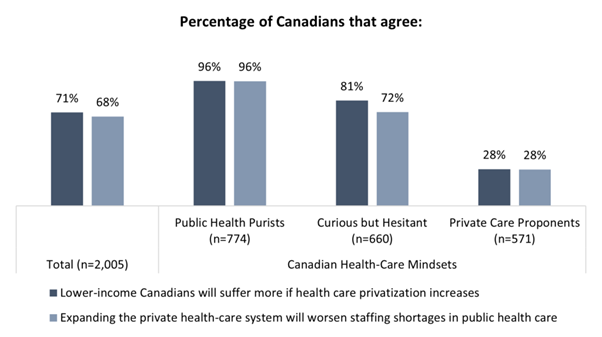
main causes. (Ipsos Canada) 9 March 2023 Public Purists,
Privatization Proponents And The Curious: Canada’s Three Health-Care Mindsets A new study from the non-profit
Angus Reid Institute finds Canadians divided about privatization – and
disagreement over how to define it. Two-in-five (39%) are Public Health
Purists: they see little to no place for privatization and say any movement
in this direction only exacerbates current challenges within the system. On
the other end of the spectrum, approximately three-in-ten (28%) are Private
Care Proponents: they say increasing privatization is a necessary evolution
in Canadian health care and are supportive of seeing a host of hybrid care
options from other countries such as Australia, Germany, and Britain brought
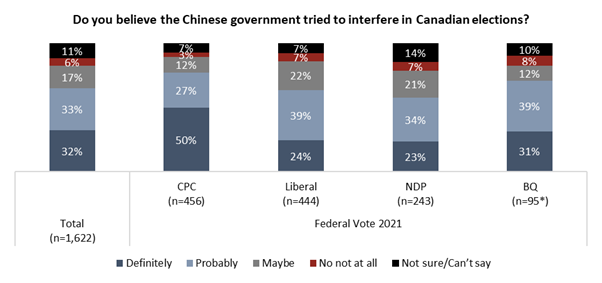
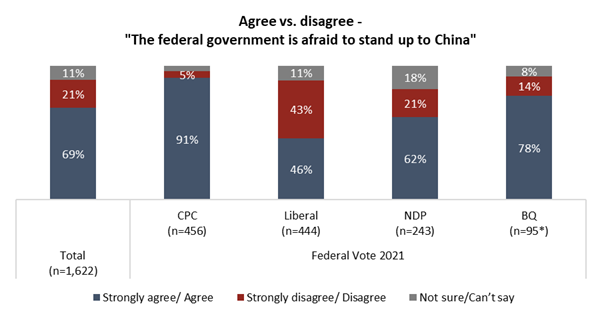
to their own provinces. (Angus Reid Institute) February 27, 2023 China, Canada And
Challenging Diplomacy: Two-In-Three Canadians Believe Beijing Did Attempt
Election Interference Amid allegations Beijing attempted
to influence the outcomes of both the 2019 and 2021 elections
to ensure the federal Liberal Party formed a minority government over the
opposition Conservatives, two-thirds of adult Canadians express belief that
Beijing “definitely” (32%) or “probably” (33%) tried to meddle. Majorities
across the political spectrum are of this view, while half of Canadians say
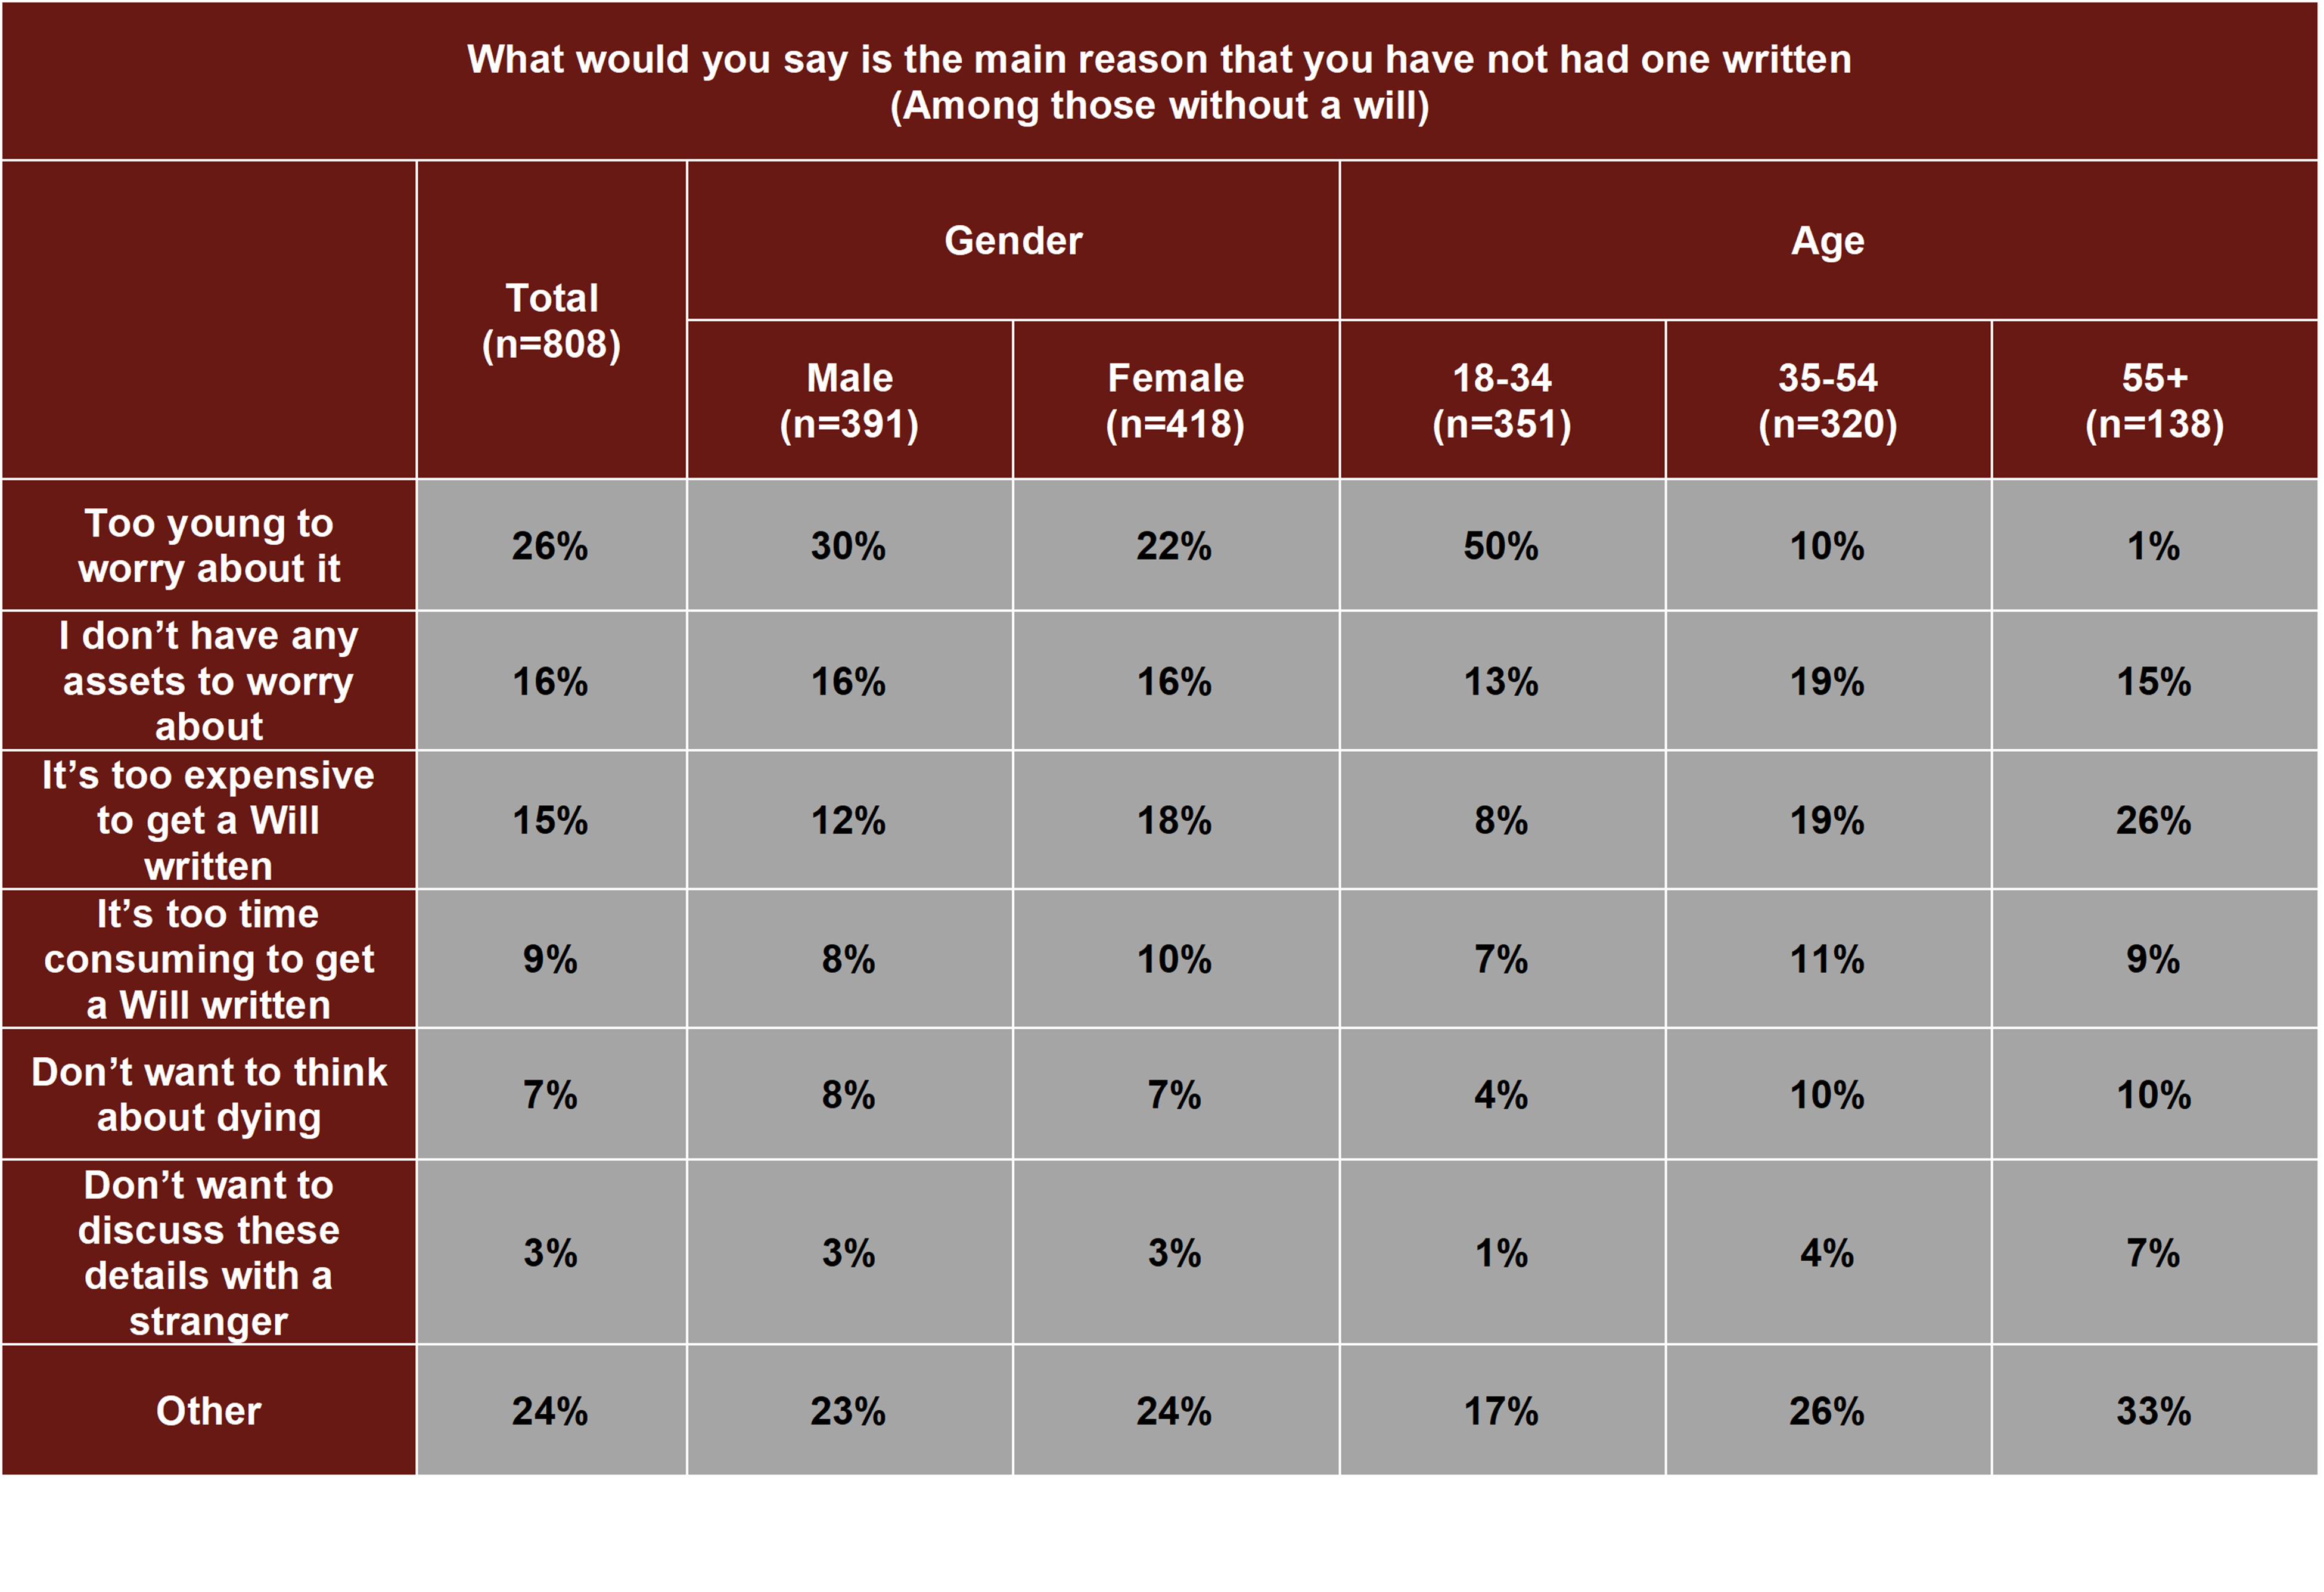
this attempted interference represents a serious threat to democracy (53%). (Angus Reid Institute) March 1, 2023 Lacking The Will:
Half Of Canadians Say They Don’t Have A Last Will And Testament, Including
One-In-Five Aged 55+ New data from the non-profit Angus
Reid Institute finds 50 per cent of Canadians in a similar boat as Harris
before his tragic accident. Half of adults in this country say they don’t
have a last will and testament; a proportion that remains consistent since
ARI surveyed on this subject five years ago. As one might expect, younger
Canadians are less likely to have one. Four-in-five Canadians younger than 35
say they do not have a will, but even half of those between the ages of 45
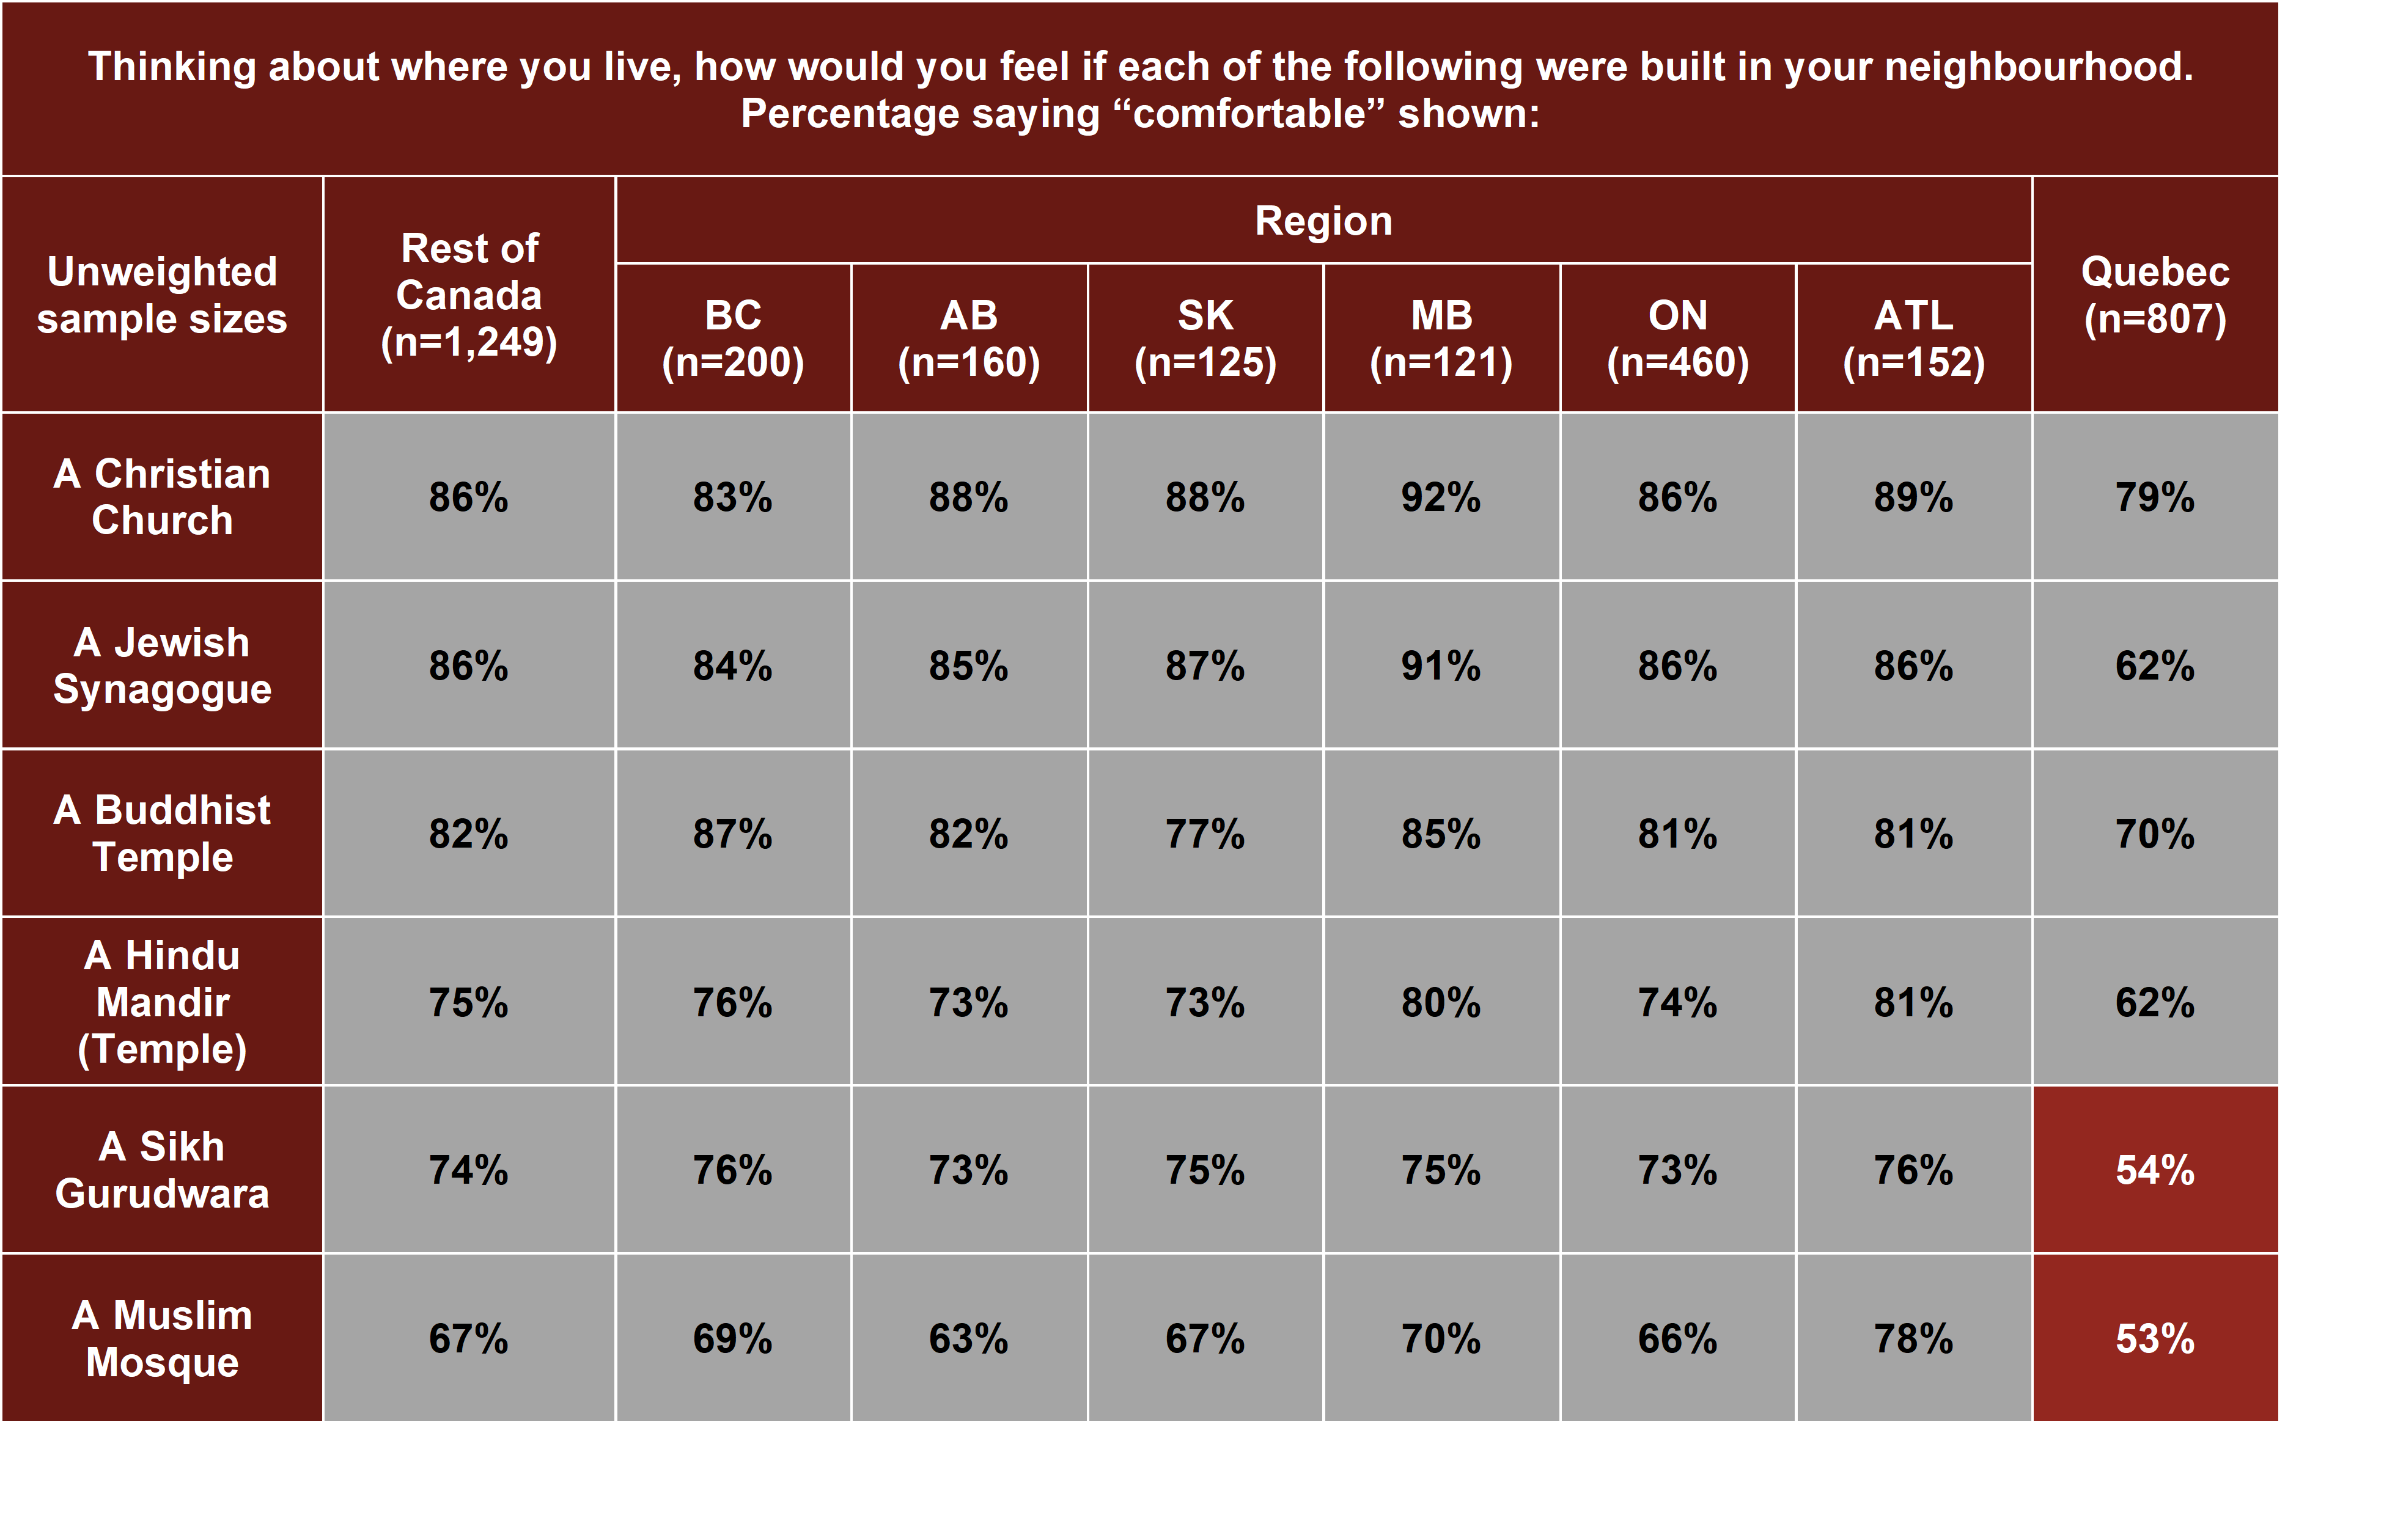
and 54 say the same. (Angus Reid Institute) March 7, 2023 Islamophobia In
Canada: Four Mindsets Indicate Negativity Is Nationwide, Most Intense In
Quebec A new study from the non-profit
Angus Reid Institute finds unfavourable views of Islam prevalent across the
country at varying levels and highest in Quebec. Indeed, two-in-five
Canadians outside of Quebec (39%) hold an unfavourable view of Islam. In
Quebec that number reaches half (52%). These views take more concrete forms,
however, than just the overall sentiment that the religion receives. Its
followers face the risk of being unwelcome in a number of areas of Canadian
society. (Angus Reid Institute) March 13, 2023 AUSTRALIA Think News Brands And Roy
Morgan Total News Figures Show 20.6 Million Australians Over The Age Of 14
Engage With News Every Month The readership figures, produced by
Roy Morgan for ThinkNewsBrands, refer to the 12 months to December 2022 and
show that Total News reaches 97 per cent of the population over the age of
14. Total News represents all news brands across print and digital as well as
standalone news websites. The latest release of Total News readership shows a
slight softening for news consumption, down 0.5 per cent compared to the same
period in 2021 with 20.6 million Australians continuing to consume news in a
four-week period. (Roy Morgan) February 27, 2023 Four In Five Shoppers
Believe Buying Australian-Made Is Important New research shows Australians’
preference for Australian-made goods hasn’t wavered. The data collected by
Australian market research company, Roy Morgan, found that more than four in
five (86%) Australians say buying Australian-made products is important to
them. While very few people, only 2%, said buying Australian-made wasn’t
important to them. Most Australians (67%) stated in the survey that they
‘often’ or ‘always’ buy Australian-made products, citing supporting local
jobs and the economy as their reason for doing so, followed by the quality or
reliability of Australian-made products. (Roy Morgan) February 27, 2023 ‘Mortgage Stress’
Increases To Its Highest Since April 2012 With 24.9% Of Mortgage Holders Now
‘At Risk’ The proportion of mortgage holders
now considered ‘At Risk’ of mortgage stress in the three months to January
2023 (24.9%) is the highest for over a decade since June 2012 and is now
significantly above the long-term average of 22.8% stretching back to early
2007. The number of Australians ‘At Risk’ of mortgage stress has increased by
486,000 over the last year as the RBA increased interest rates for nine
consecutive monthly meetings. Official interest rates are now at 3.35% in
February 2023, the highest official interest rates since October 2012 over a
decade ago. (Roy Morgan) February 28, 2023 Australian Full-Time
Employment Hit A Record High Above 8.9 Million In February As Unemployment
Falls 0.6% To 10.1% Australian employment increased by
99,000 to 13,517,000 in February. The increase was driven by an increase in full-time
employment, up 48,000 to a new record high of 8,949,000 while part-time
employment also increased, up 51,000 to 4,568,000. 1,521,000 Australians were
unemployed (10.1% of the
workforce) in February, a decrease of 86,000 from January
with fewer people looking for full-time work, down 42,000 to 602,000 and
fewer people looking for part-time work, down 44,000 to 919,000. (Roy Morgan) March 06, 2023 ANZ-Roy Morgan Consumer
Confidence At 79.9 – Virtually Unchanged For Second Straight Week In Early
March Consumer Confidence had mixed
results around the country and was up in Queensland and South Australia, down
in New South Wales and Western Australia and unchanged in Victoria. Now 21%
of Australians (down 1ppt) say their families are ‘better off’ financially
than this time last year compared to 48% (unchanged) that say their families
are ‘worse off’ financially. Looking forward, under a third of Australians,
32% (unchanged), expect their family to be ‘better off’ financially this time
next year while just over a third, 35% (unchanged), expect to be ‘worse off’. (Roy Morgan) March 07, 2023 Over Half Of
APAC’s Consumers (54%) Say That Better Money Management Is On Their List Of
Goals For This Year Close to half (47%) of all
Australian residents say there has been no change in their household finances compared to one
month ago. Data from YouGov Profiles reflect cumulative responses over the
past 52 weeks. Three in ten (31%), however, report worsening household finances, while
less than one in five (18%) say their financial situation has improved. Higher income households are significantly more likely
to report that their financial situation has improved (11-15 percentage points higher on average
than middle to lower income households) and significantly less likely to say
their finances have worsened.
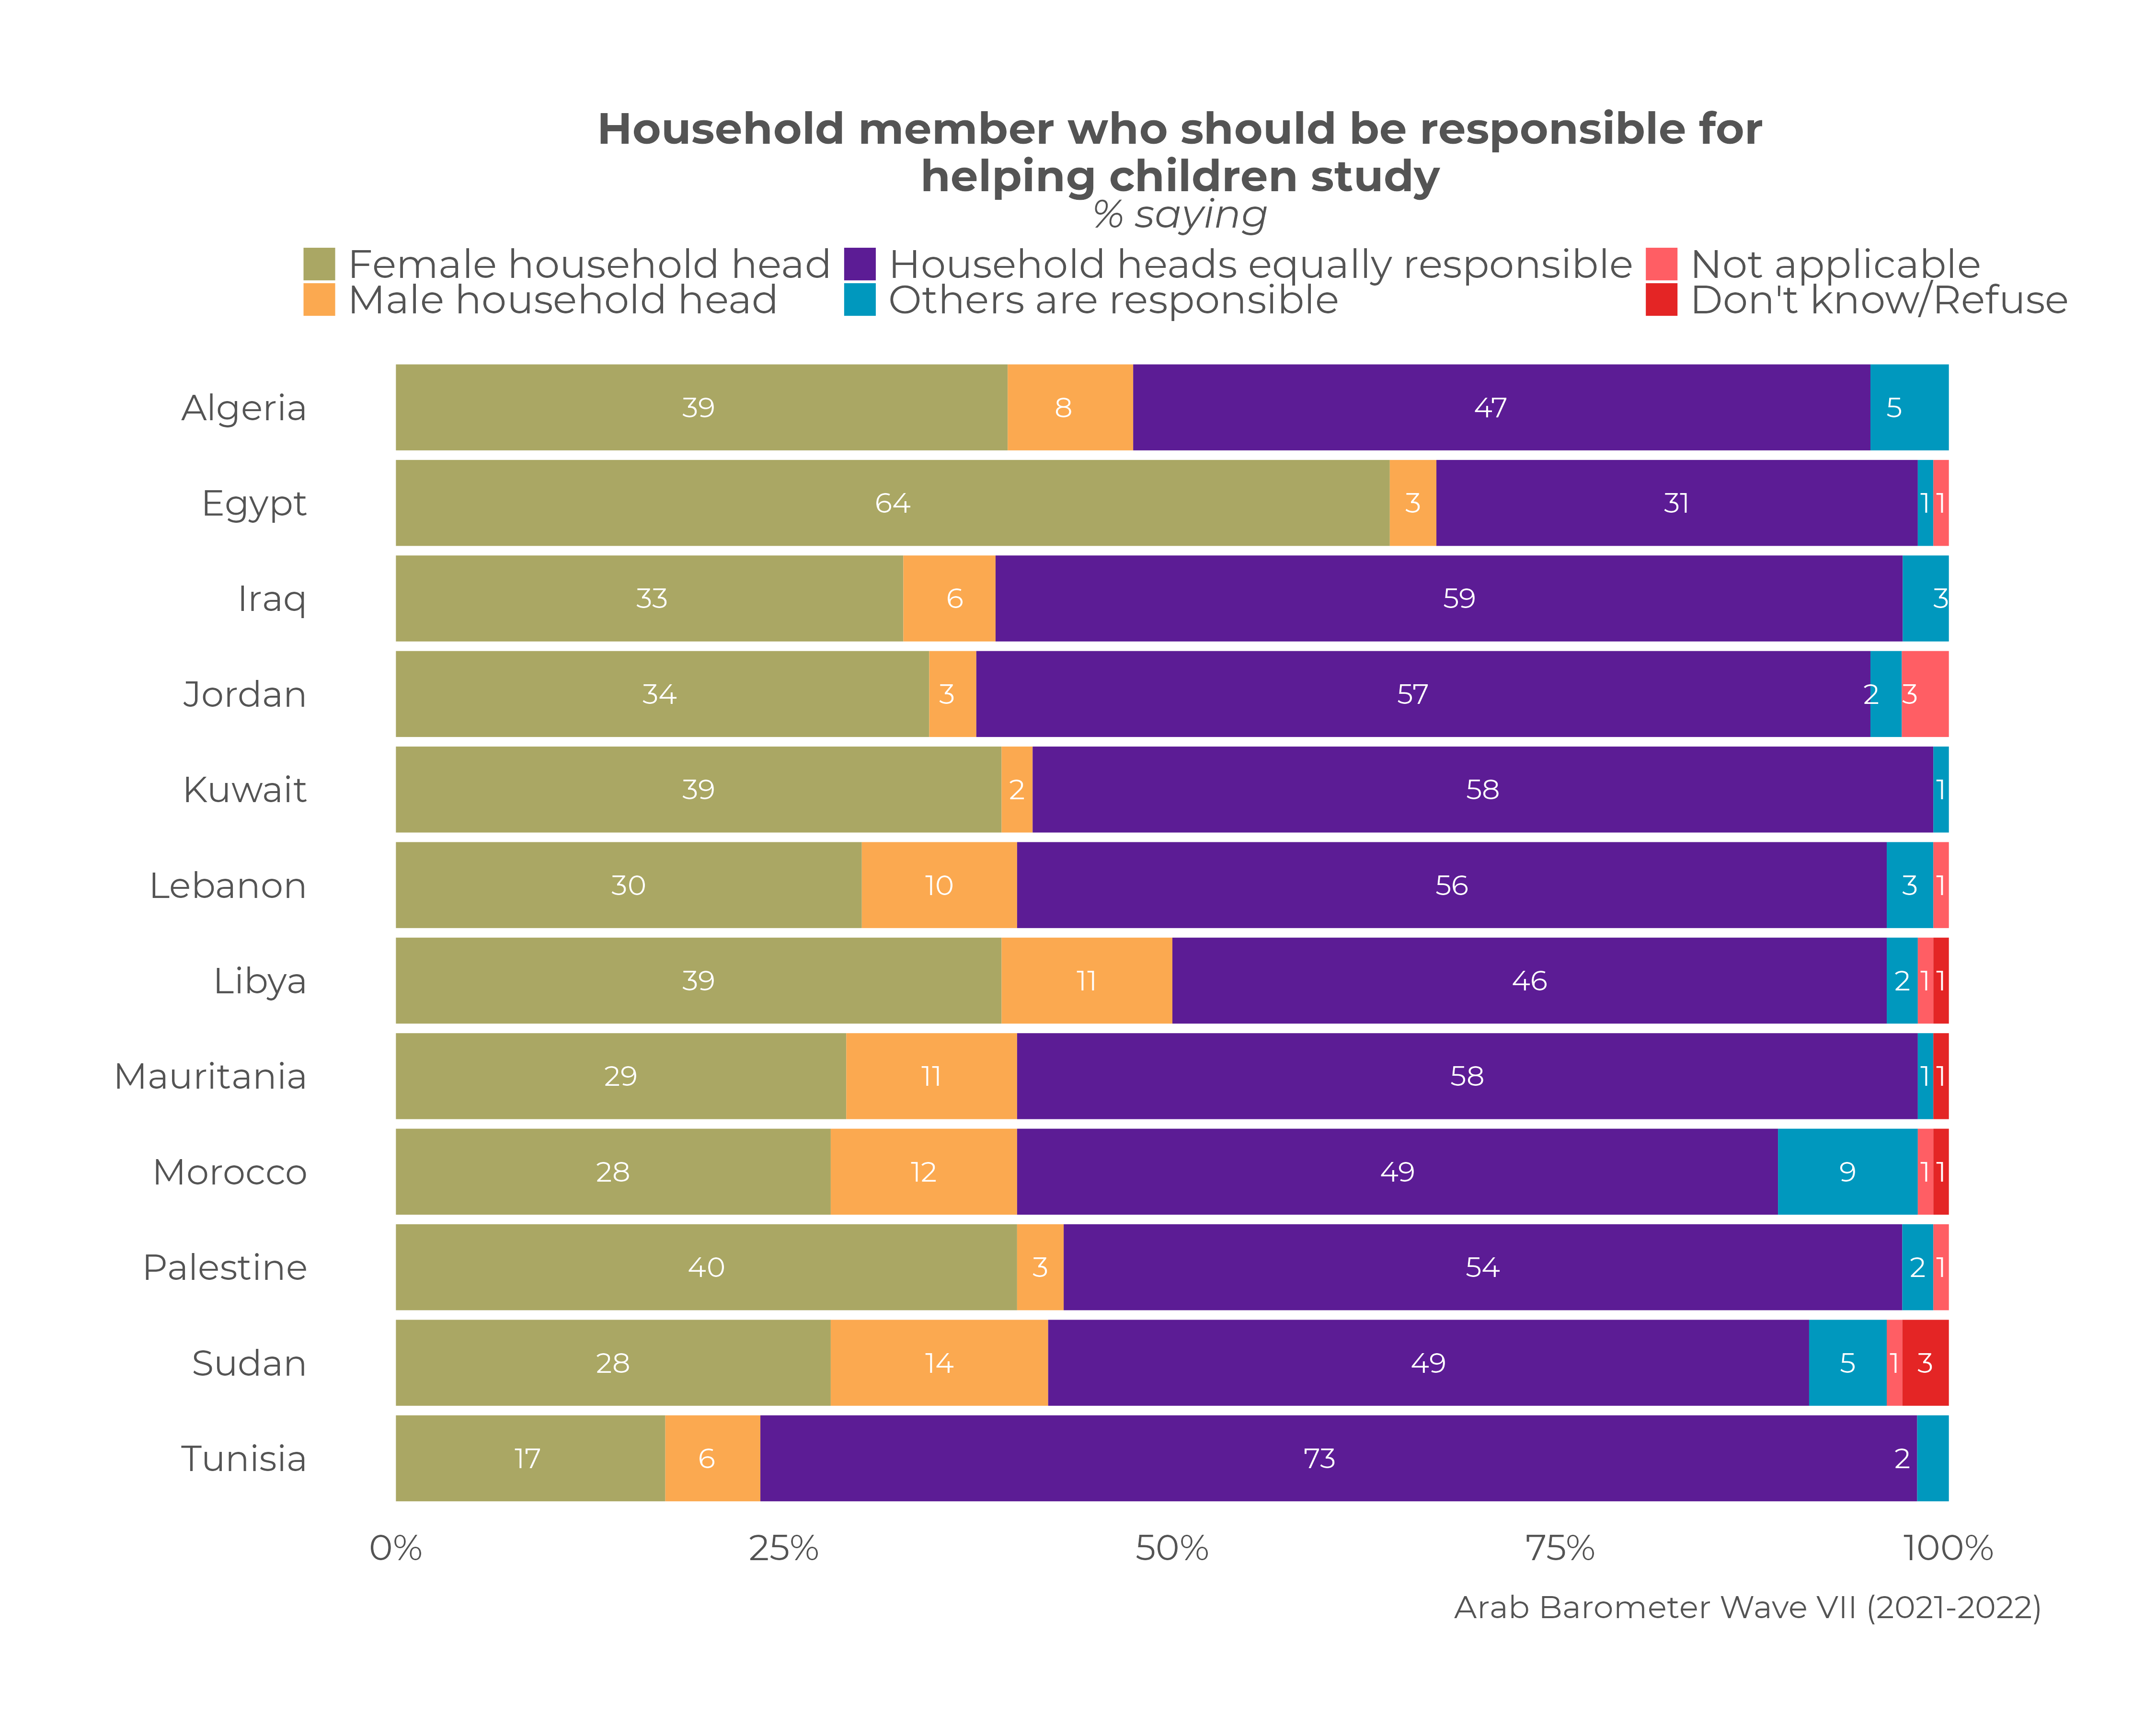
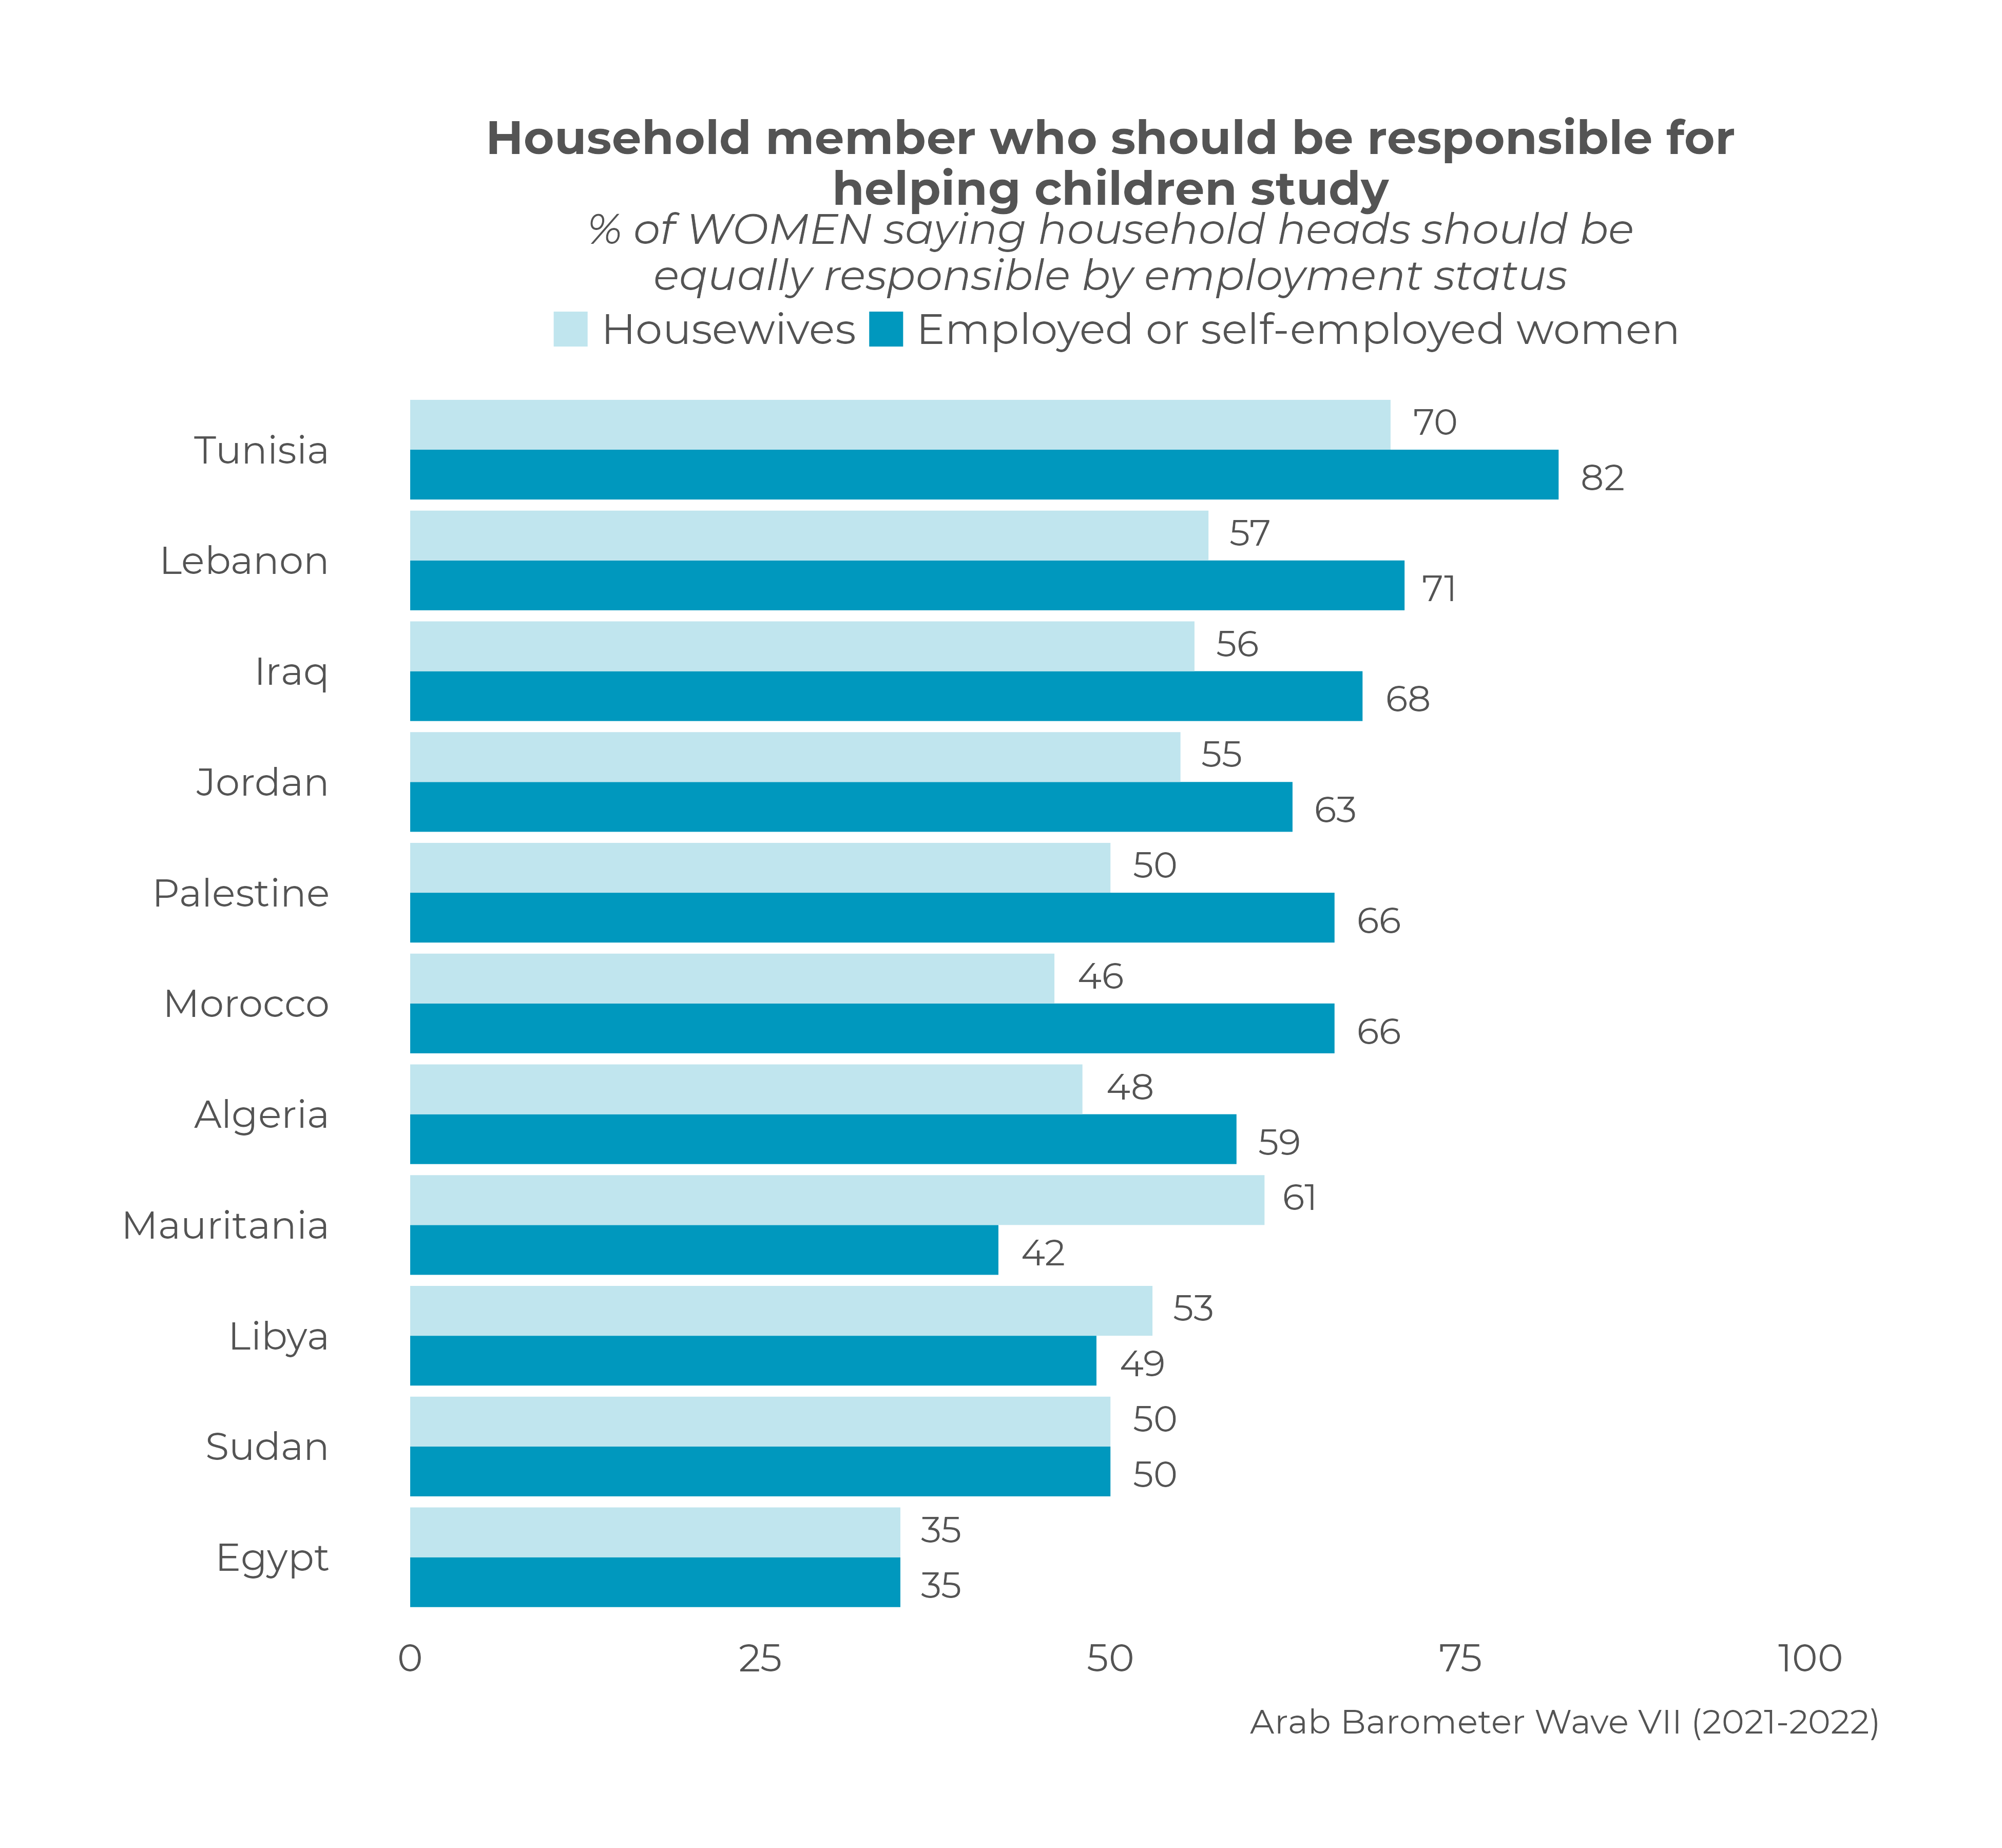
(YouGov Australia) February 28, 2023 MULTICOUNTRY STUDIES Confounding And Confirming
Expectations On The “Care Economy” In MENA, A Survey In 12 Arab Nations Arab Barometer findings from 12
countries surveyed in the seventh wave (2021-2022) partially confound
expectations on unpaid care work in the region. Where it is often assumed
that childcare—including help with schoolwork—is relegated exclusively to
women, survey results instead suggest that most citizens believe helping
children study is a responsibility that should be shared by both male and
female household heads, regardless of who currently completes this
responsibility. Nearly half of citizens or more in nine out of 12 countries
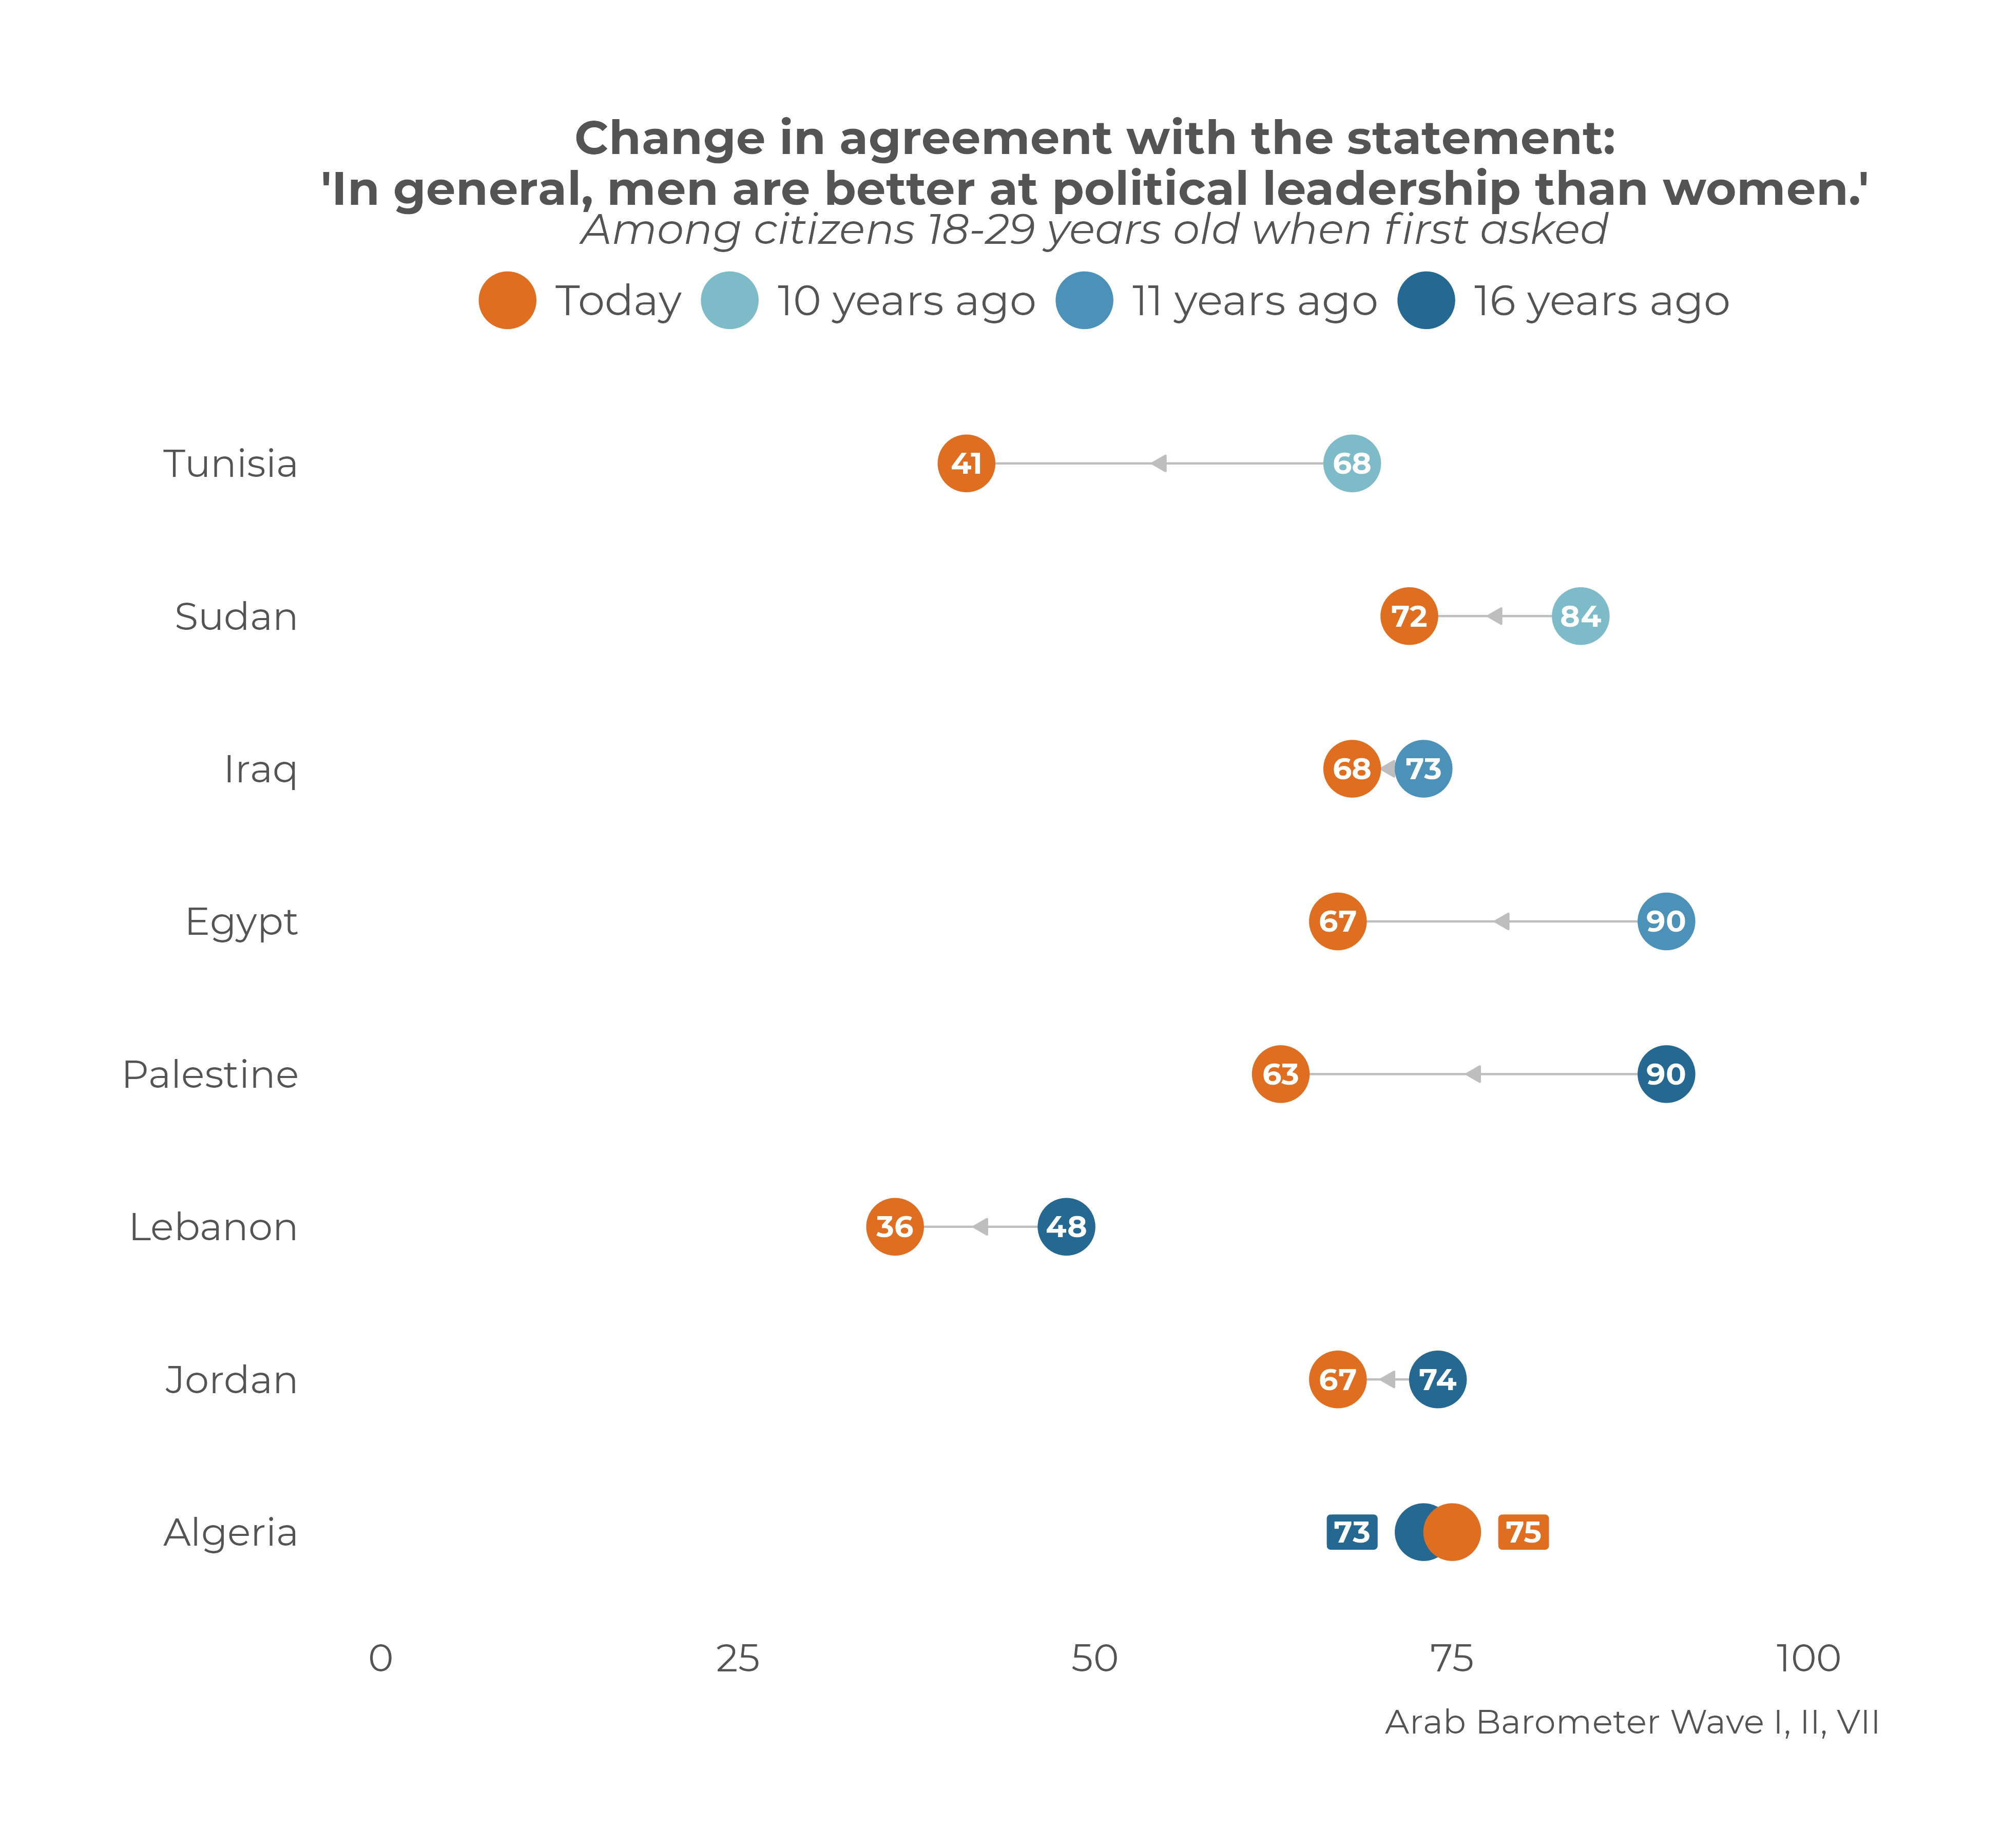
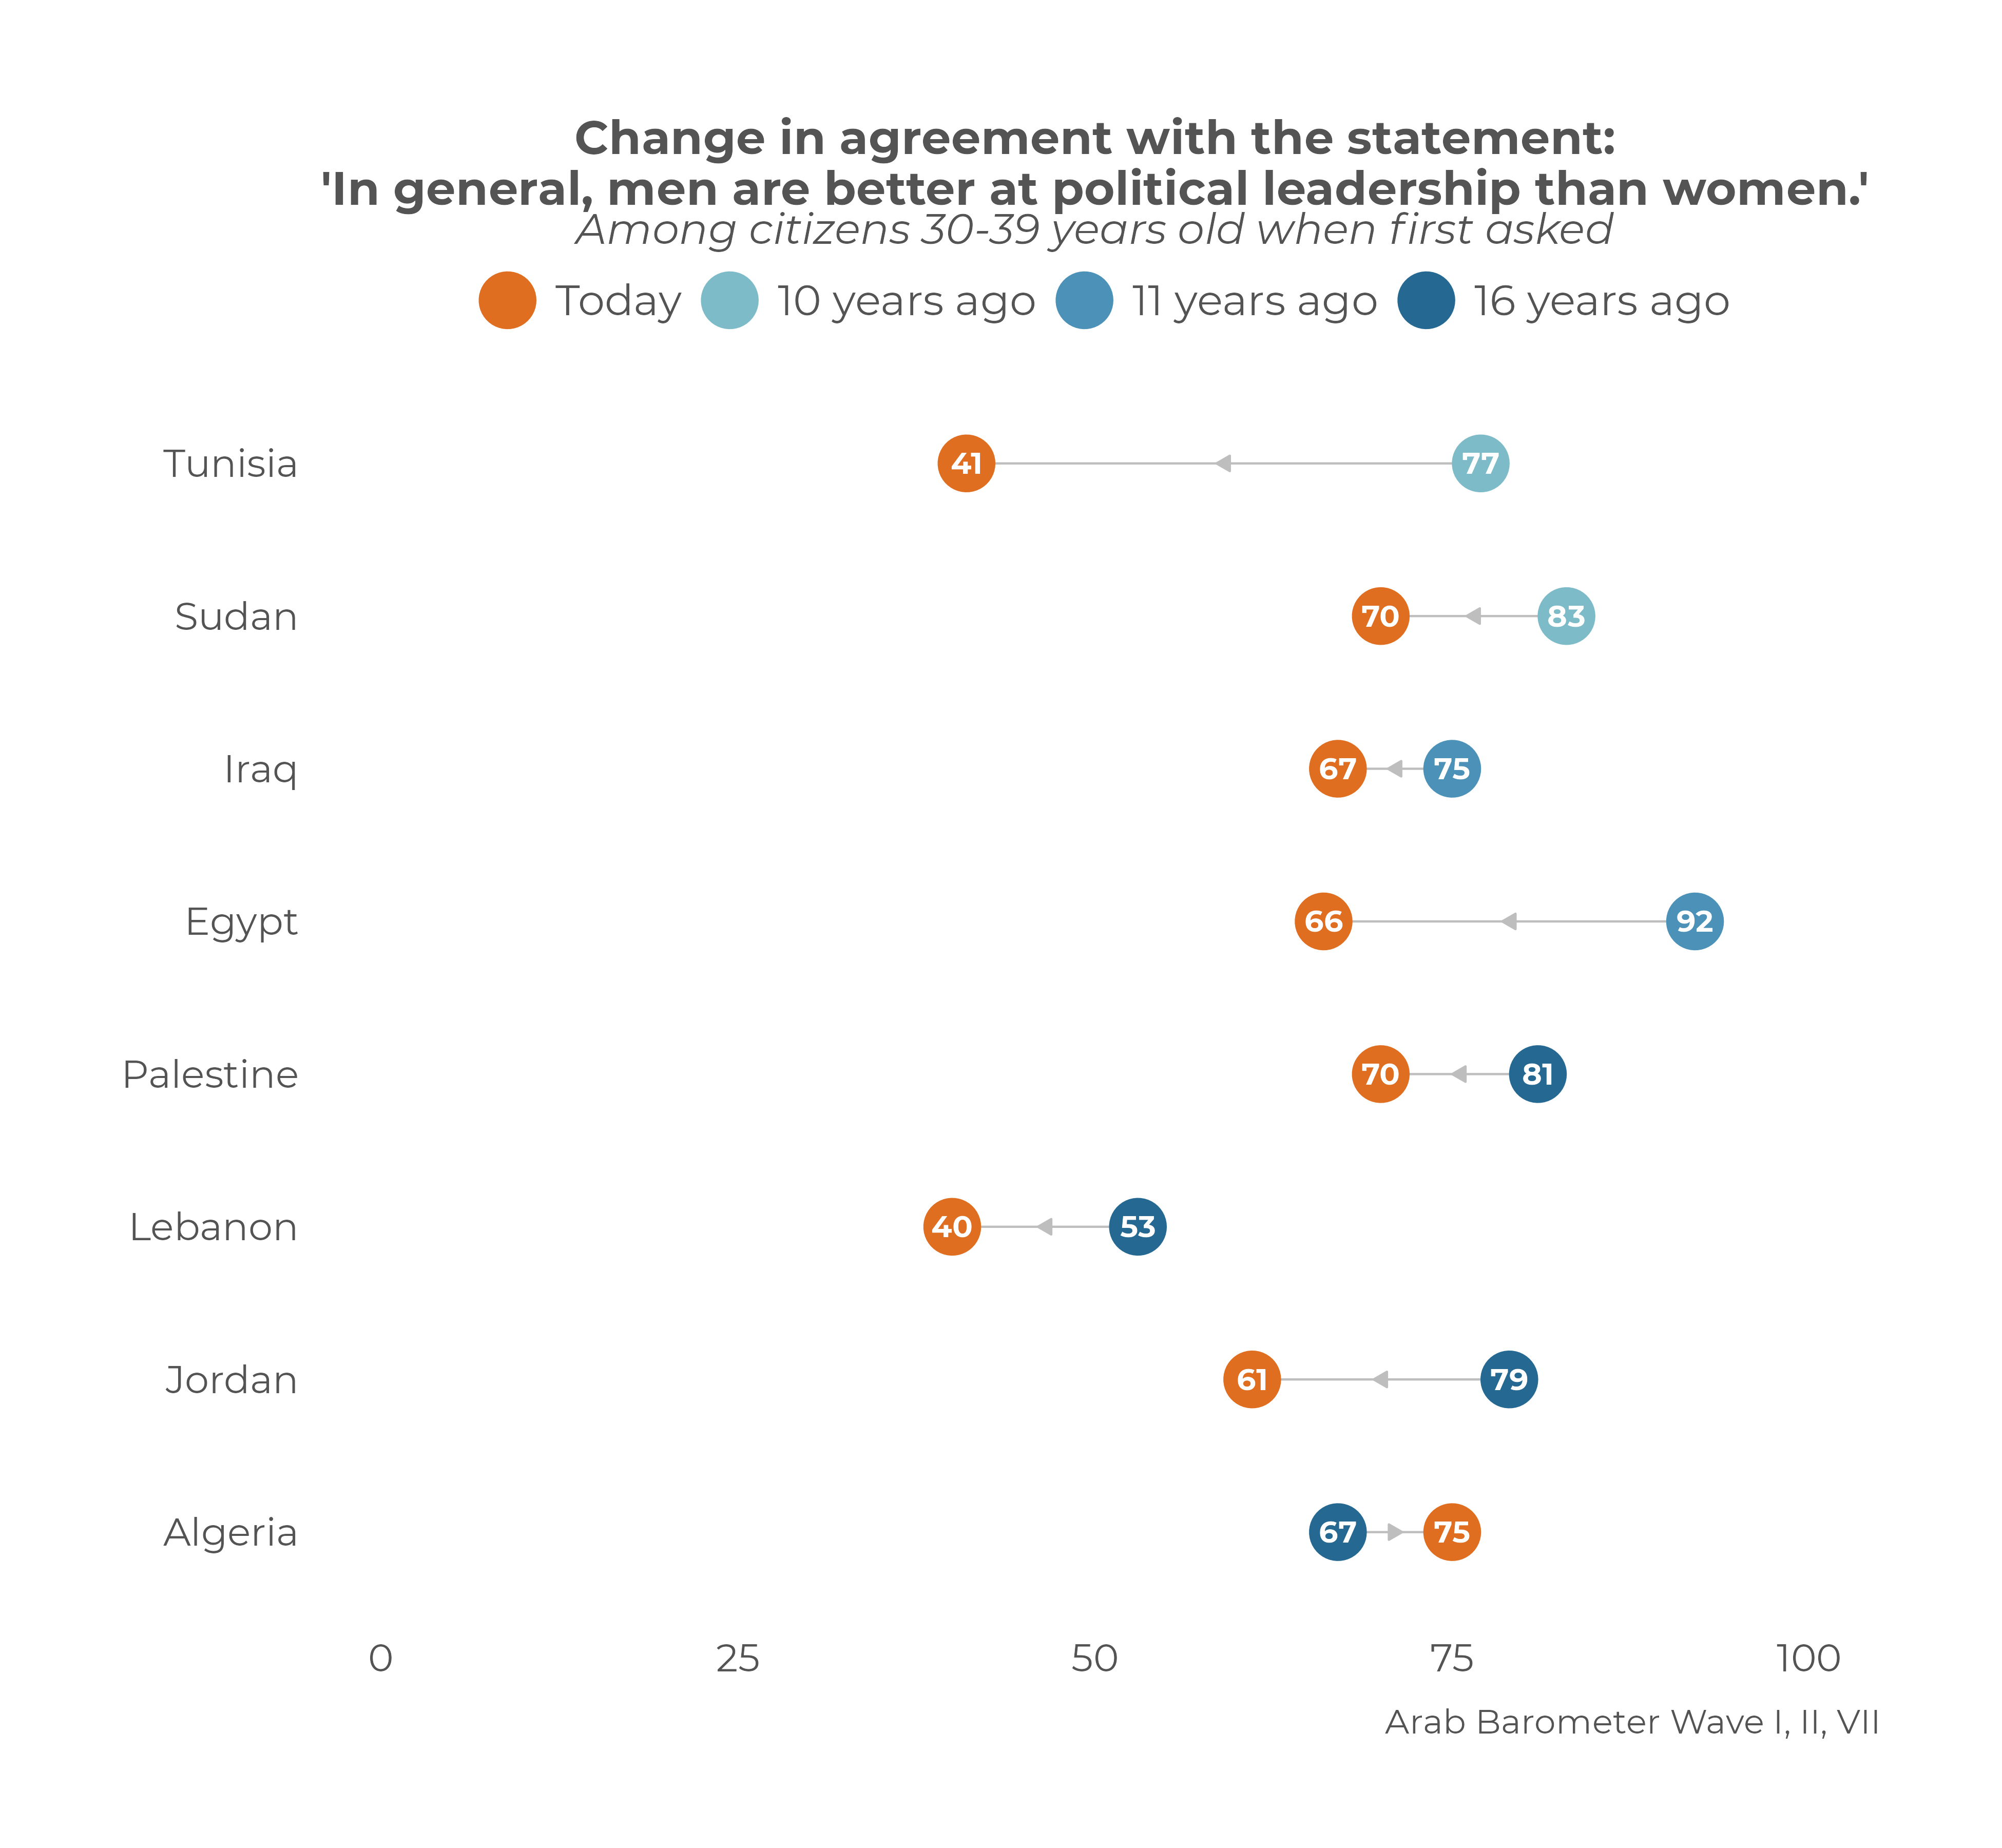
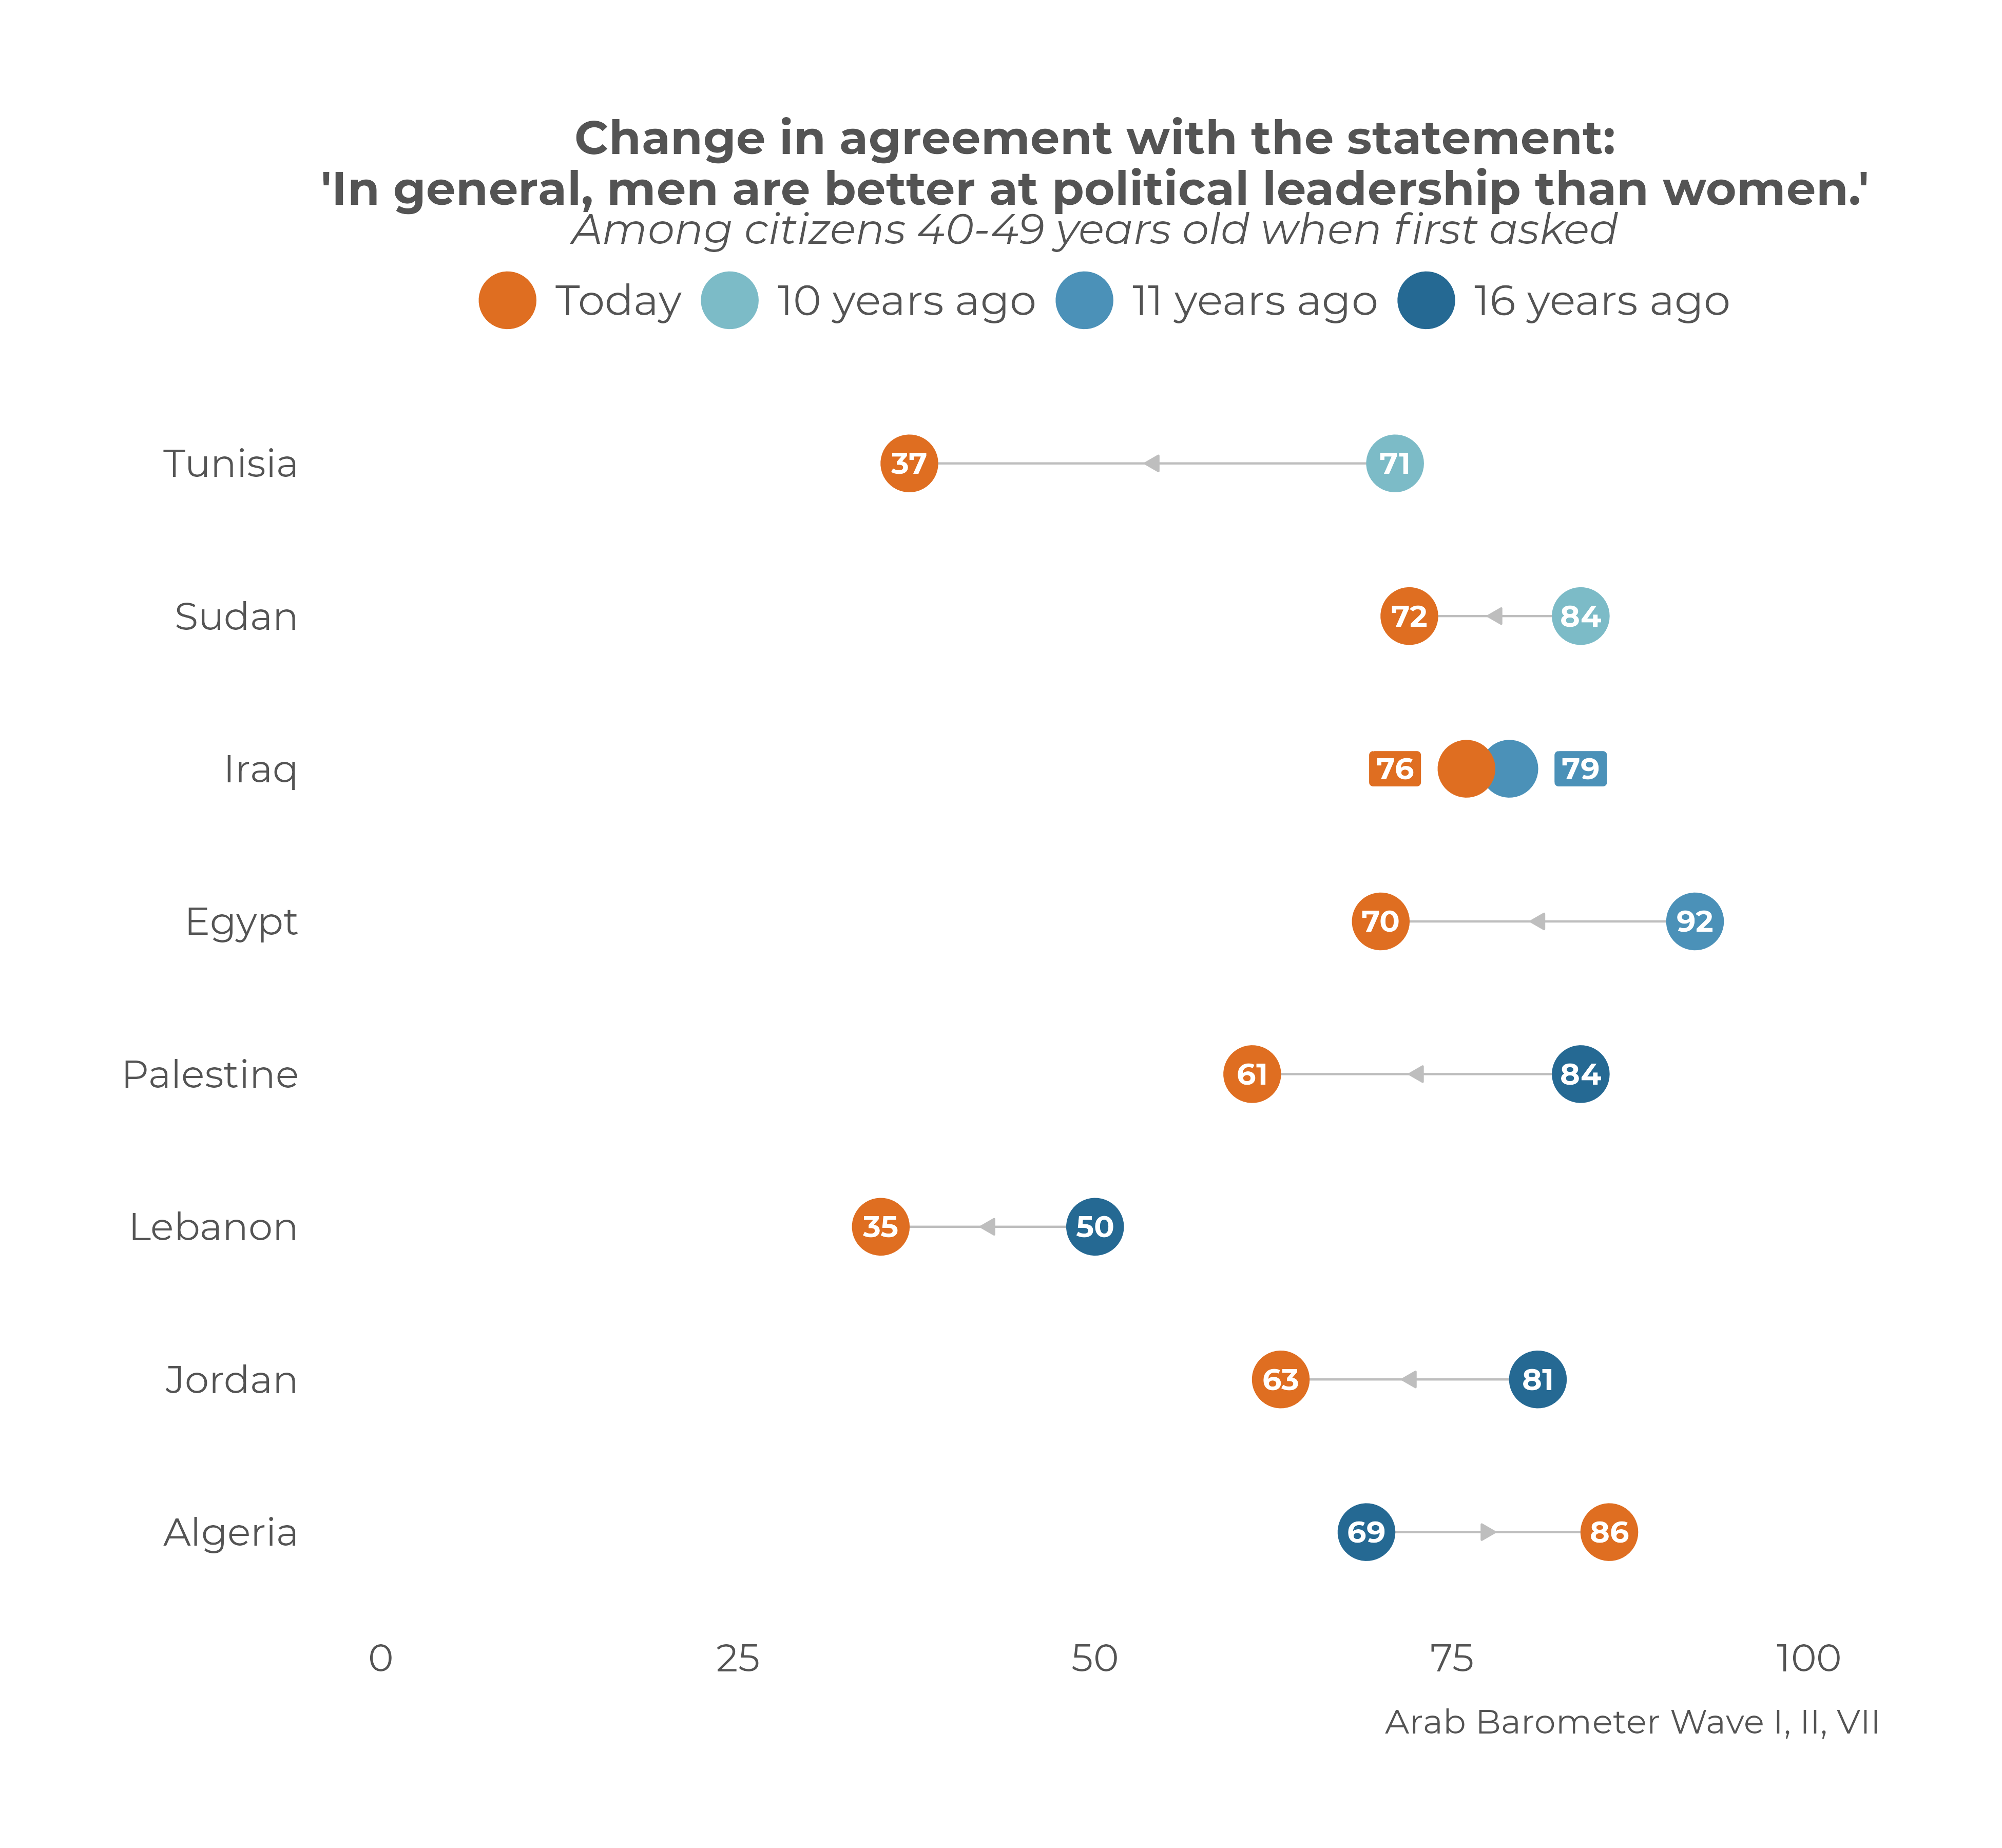
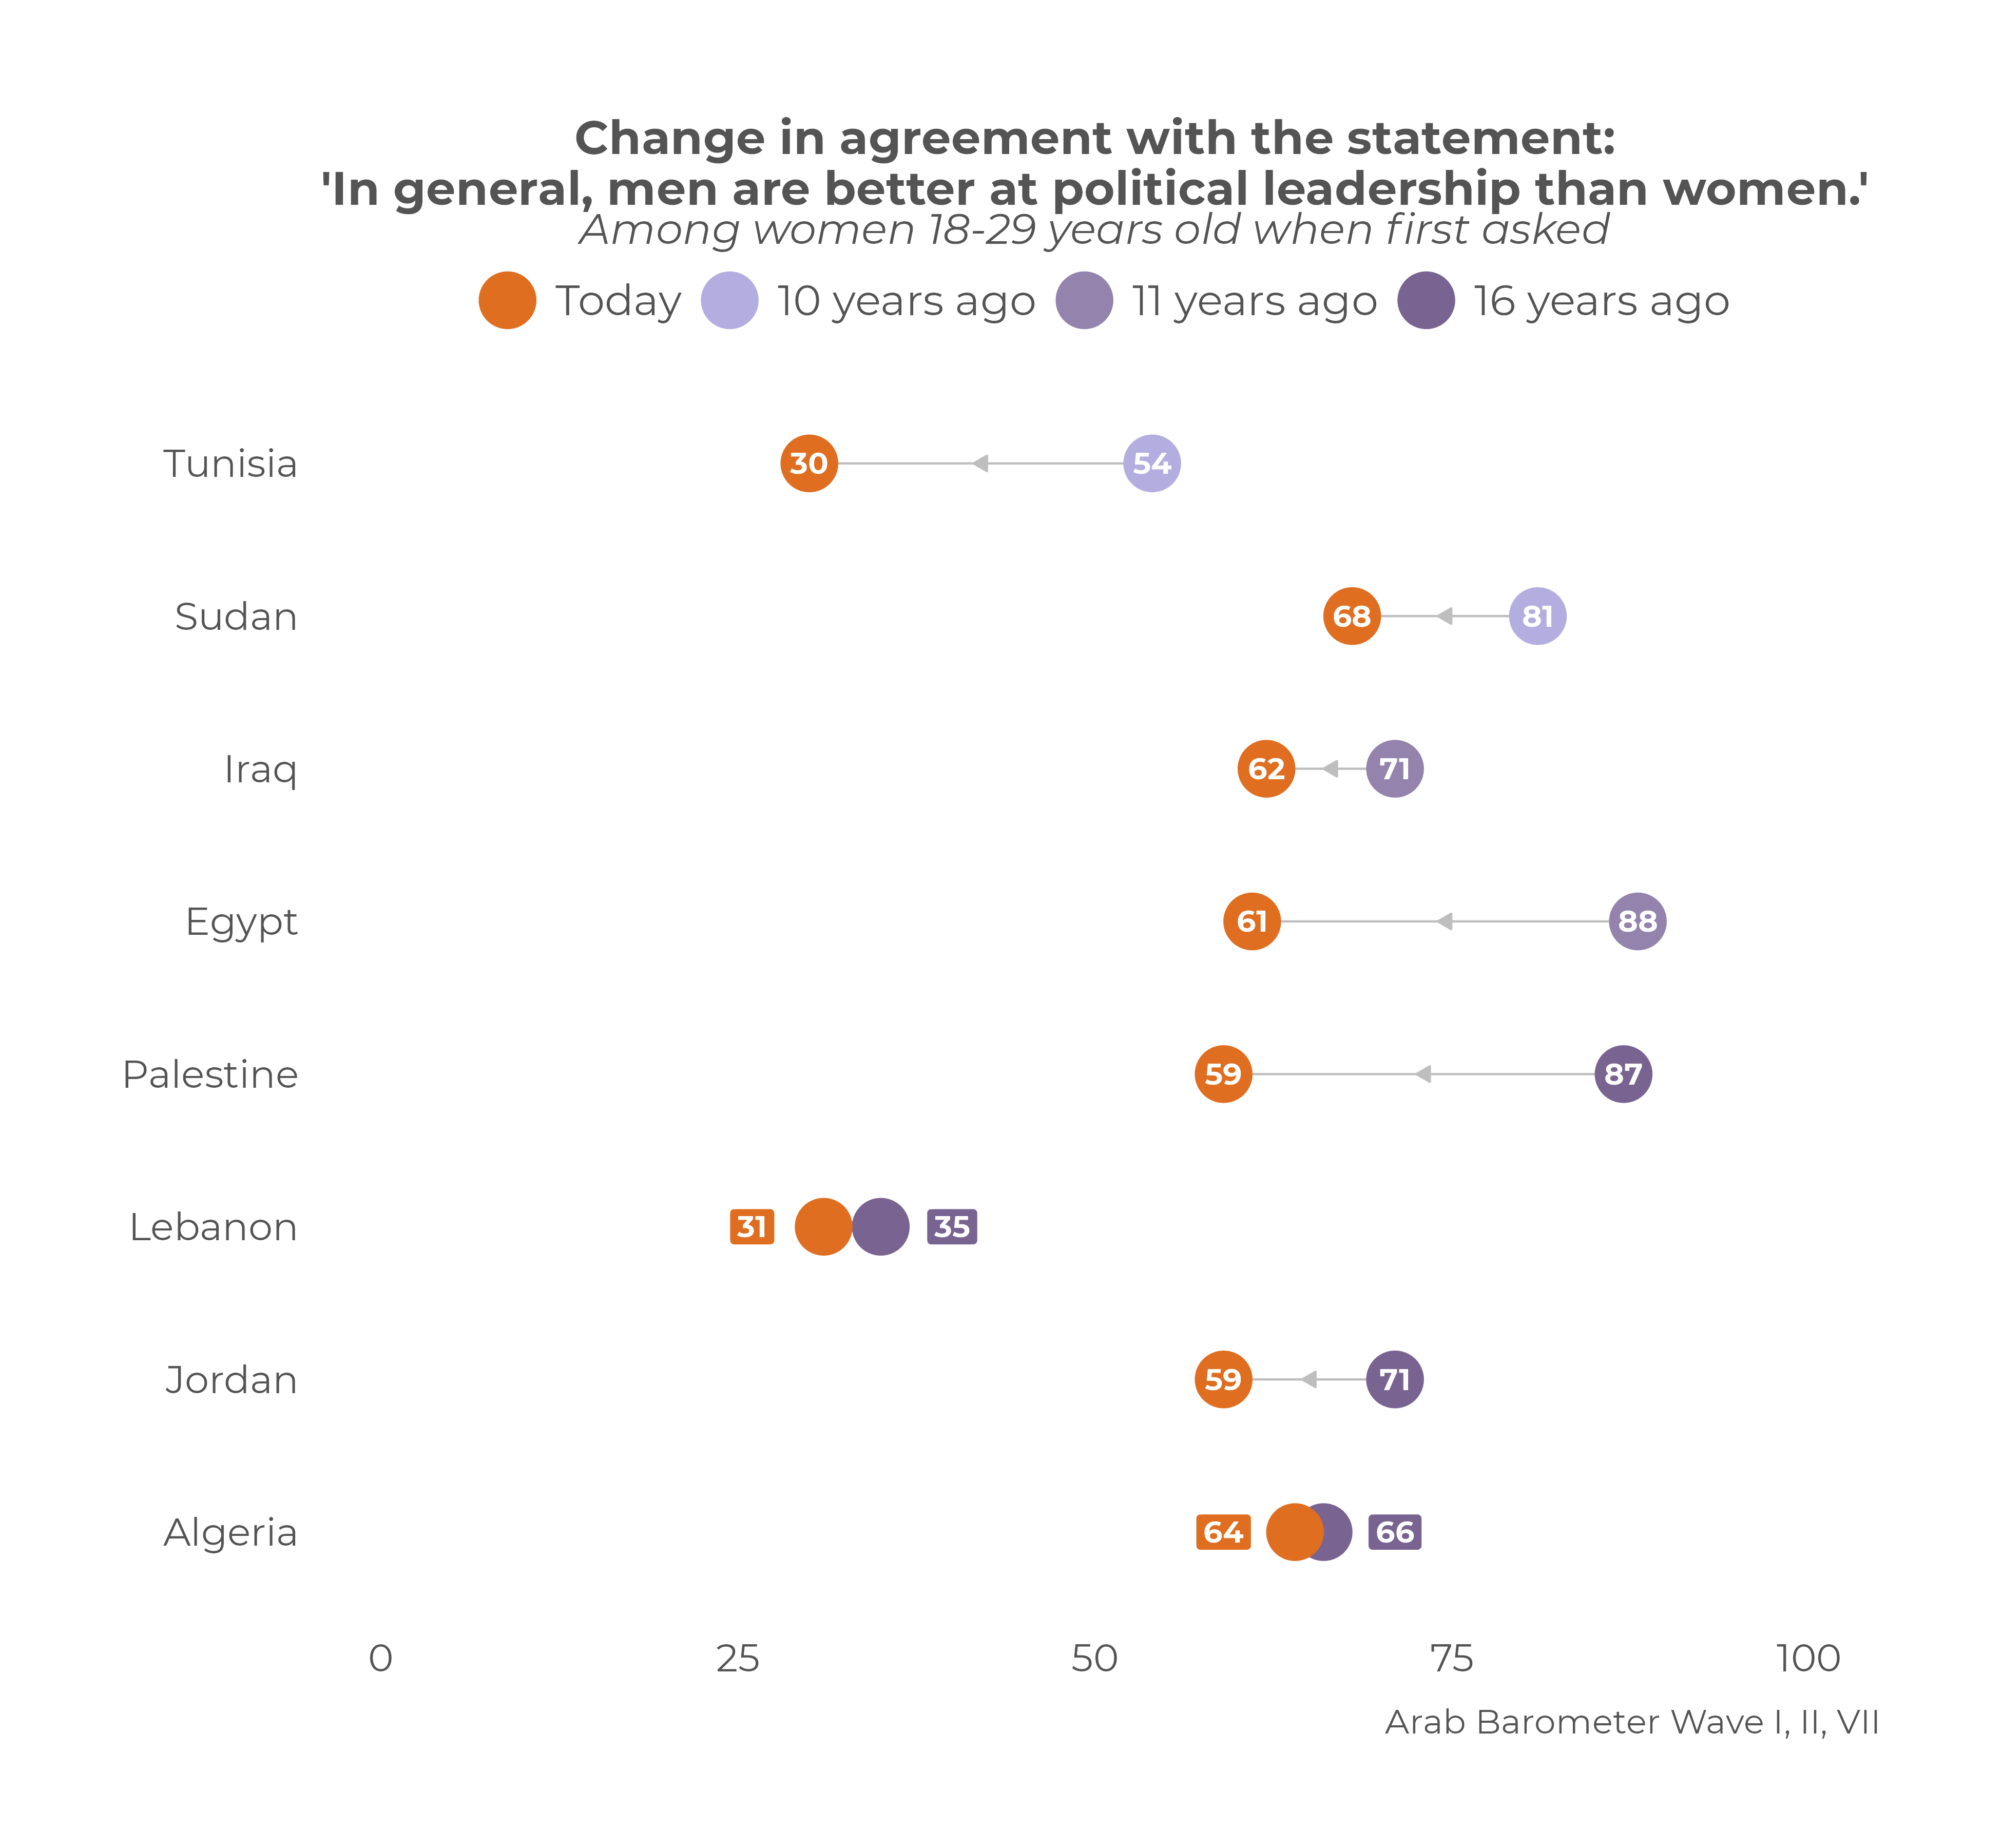
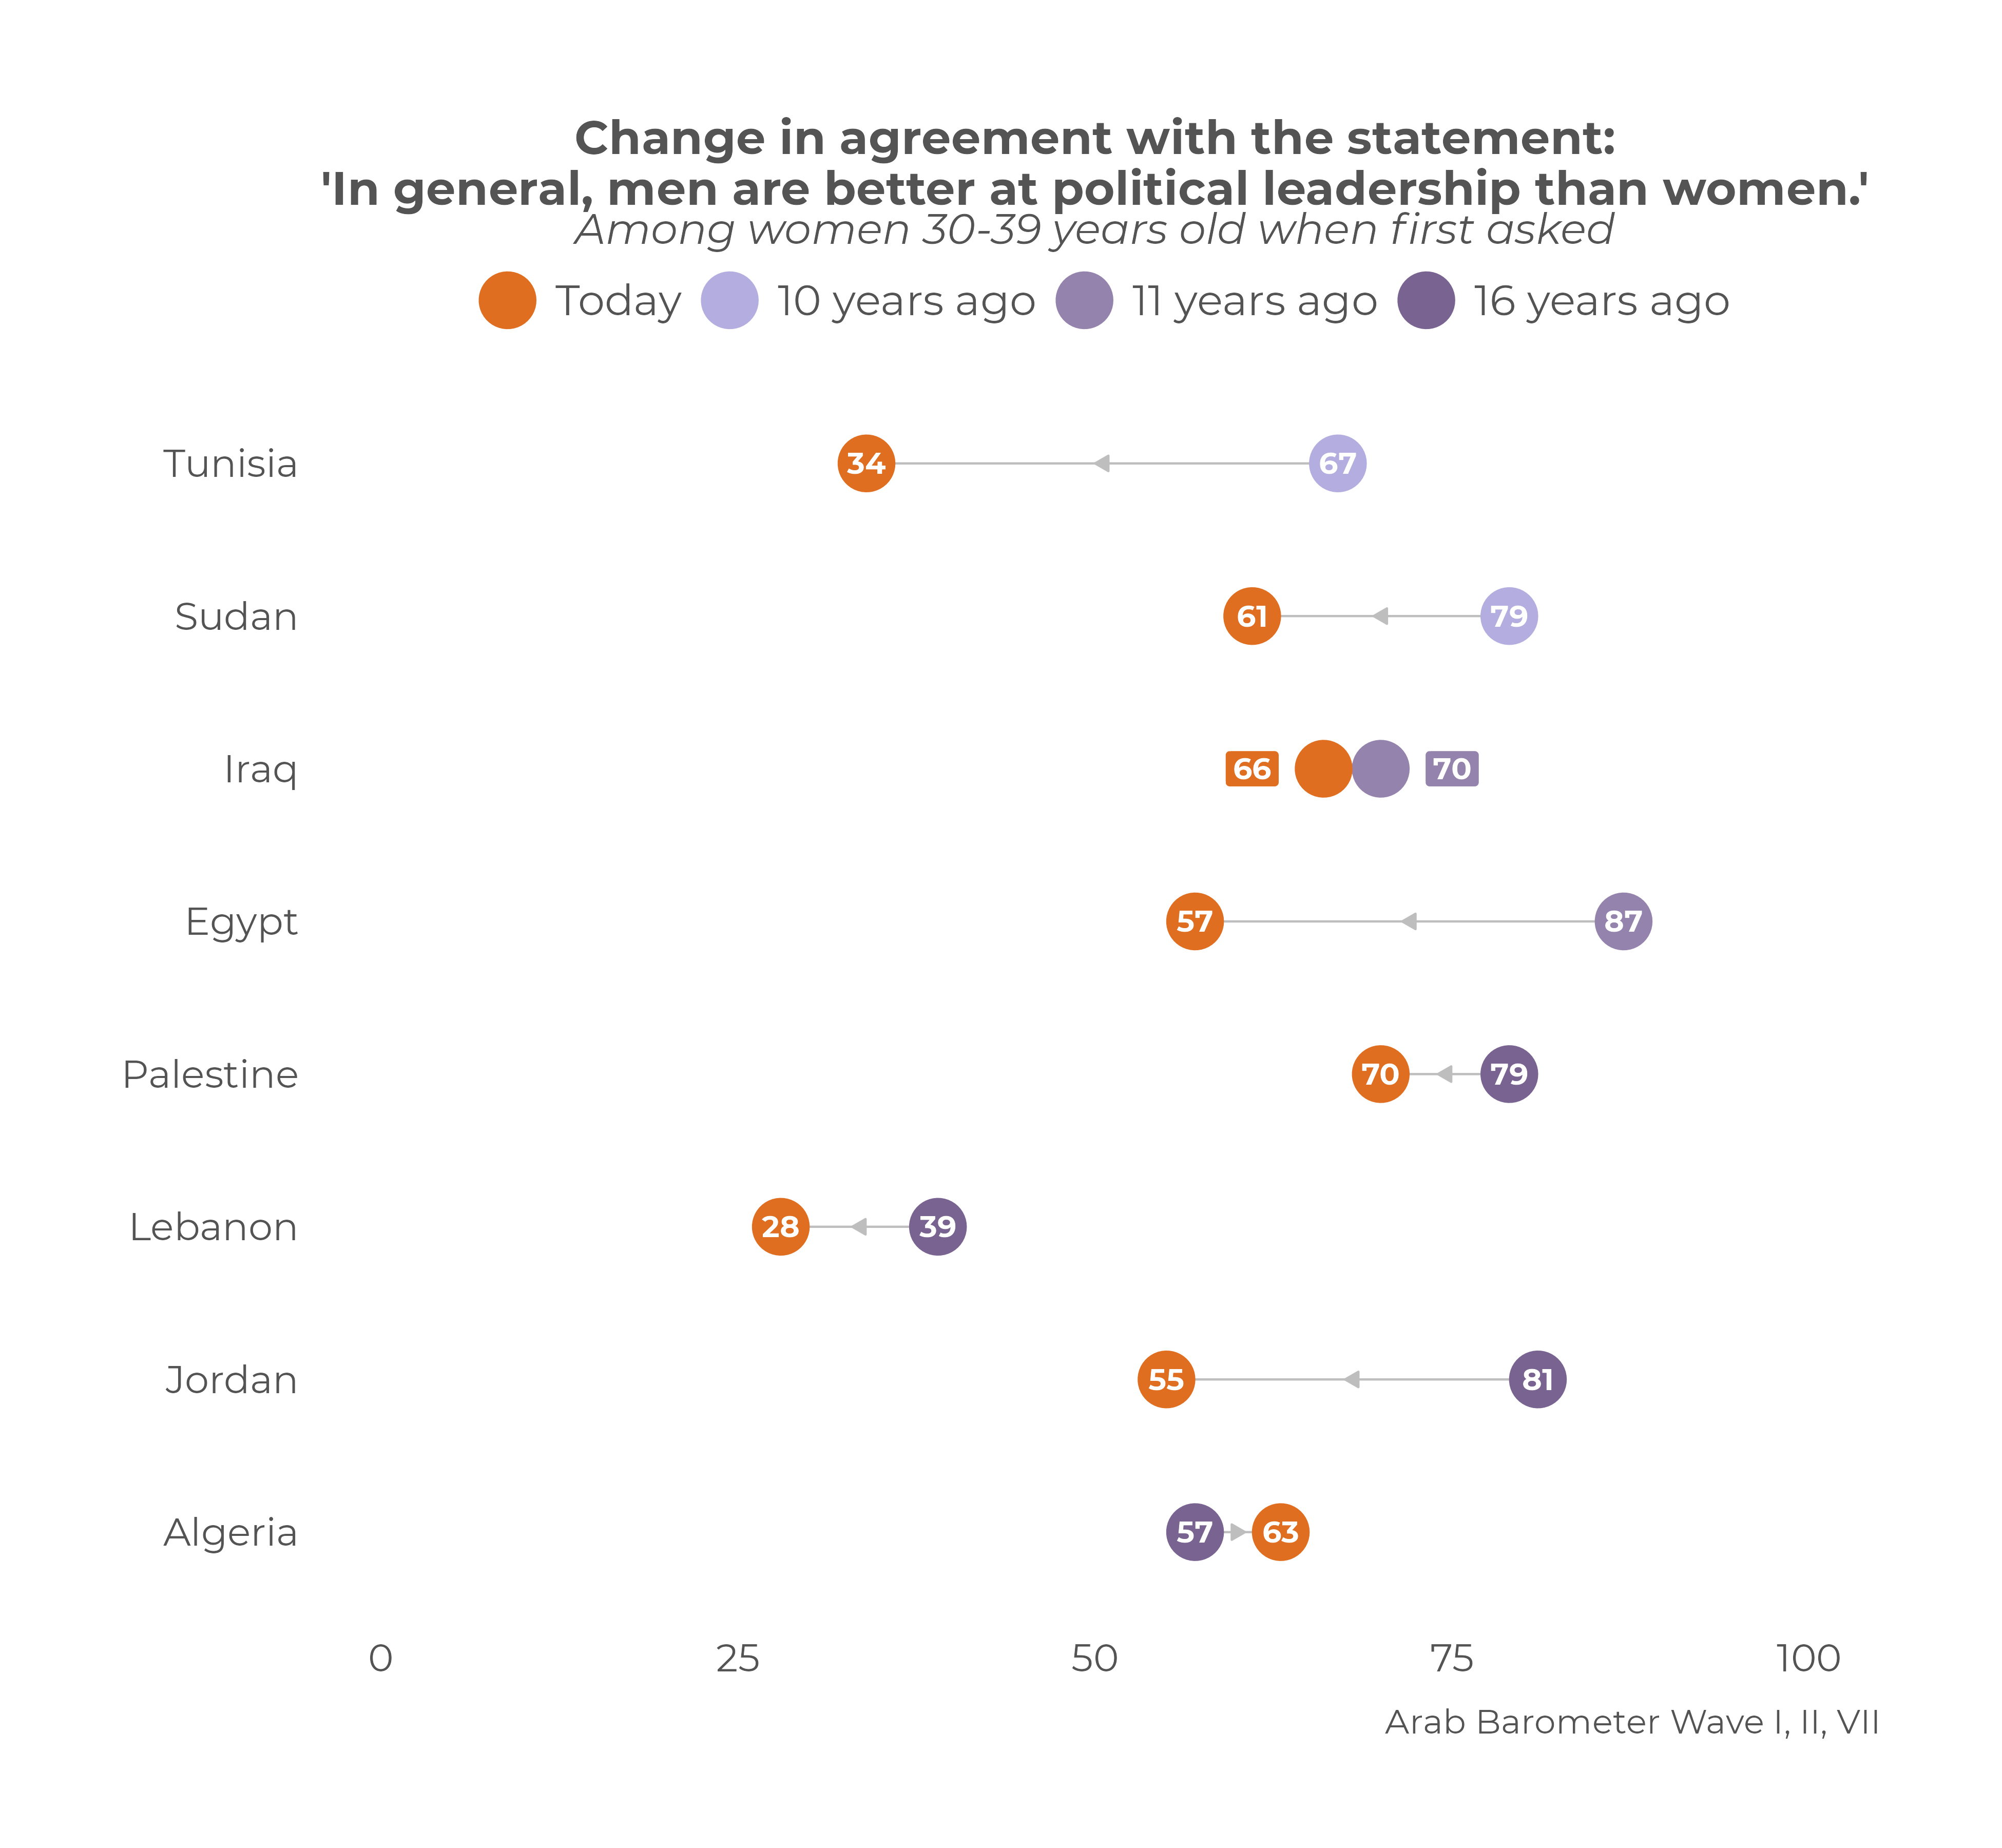
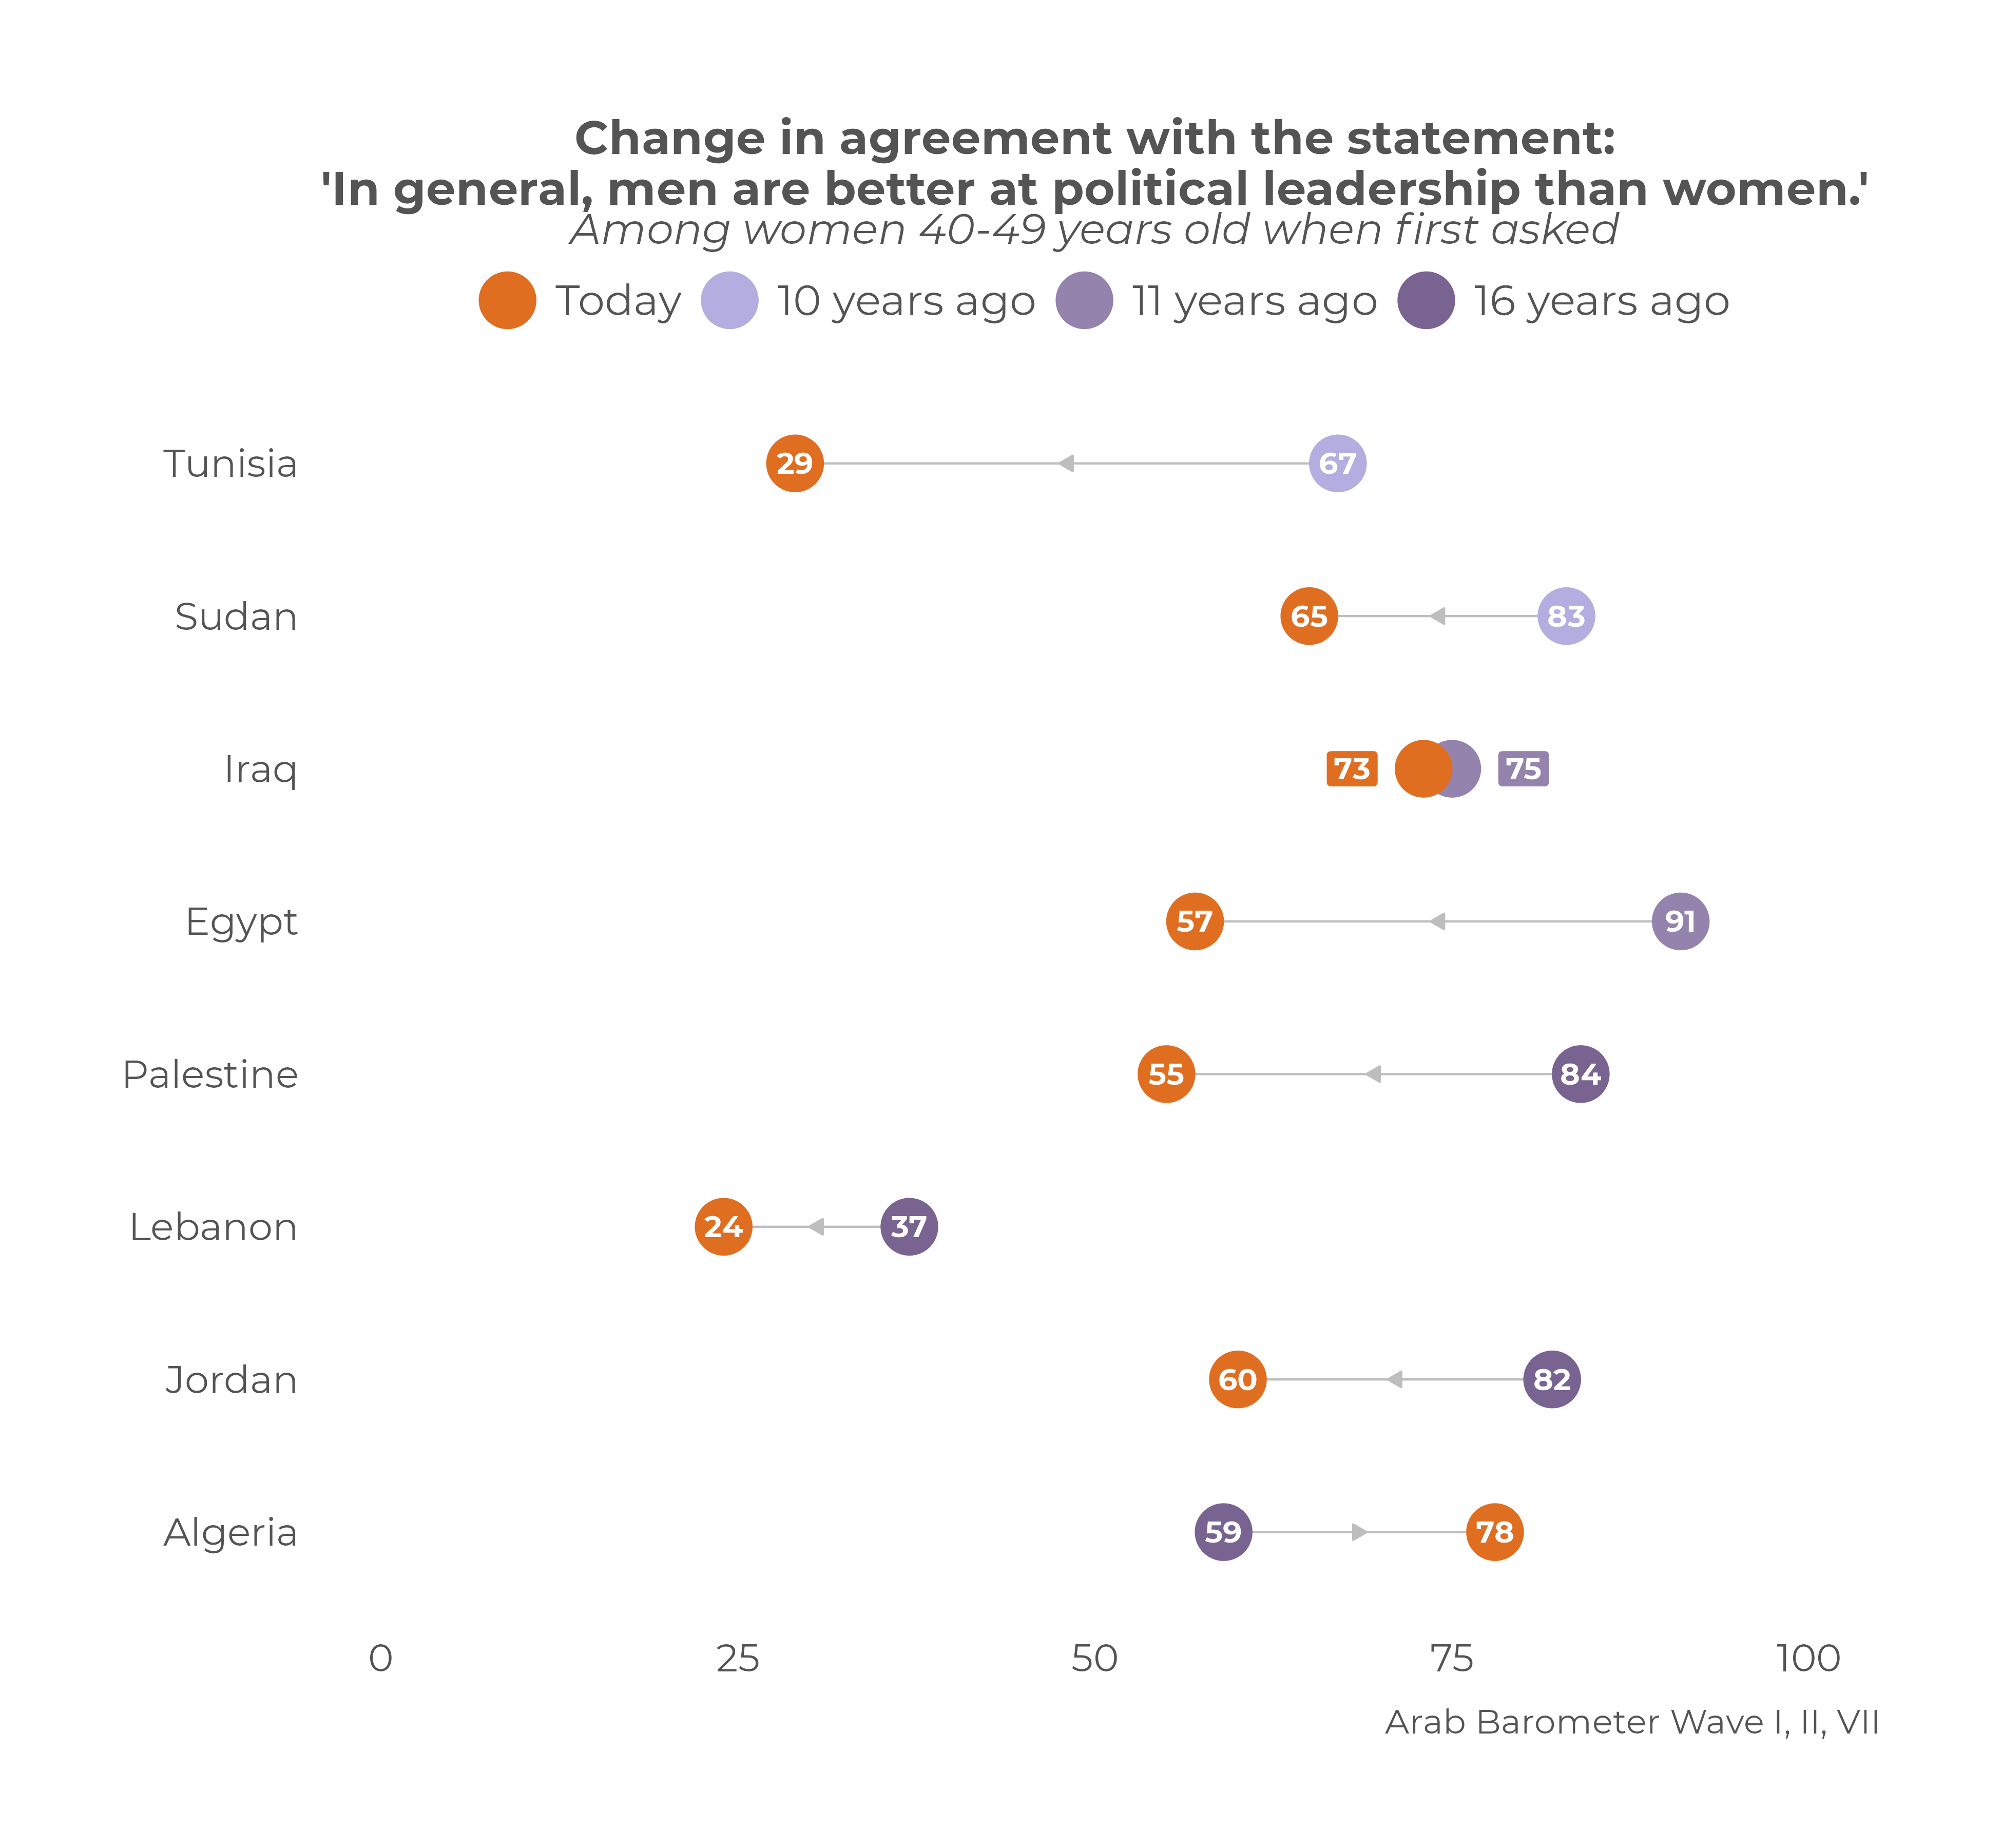
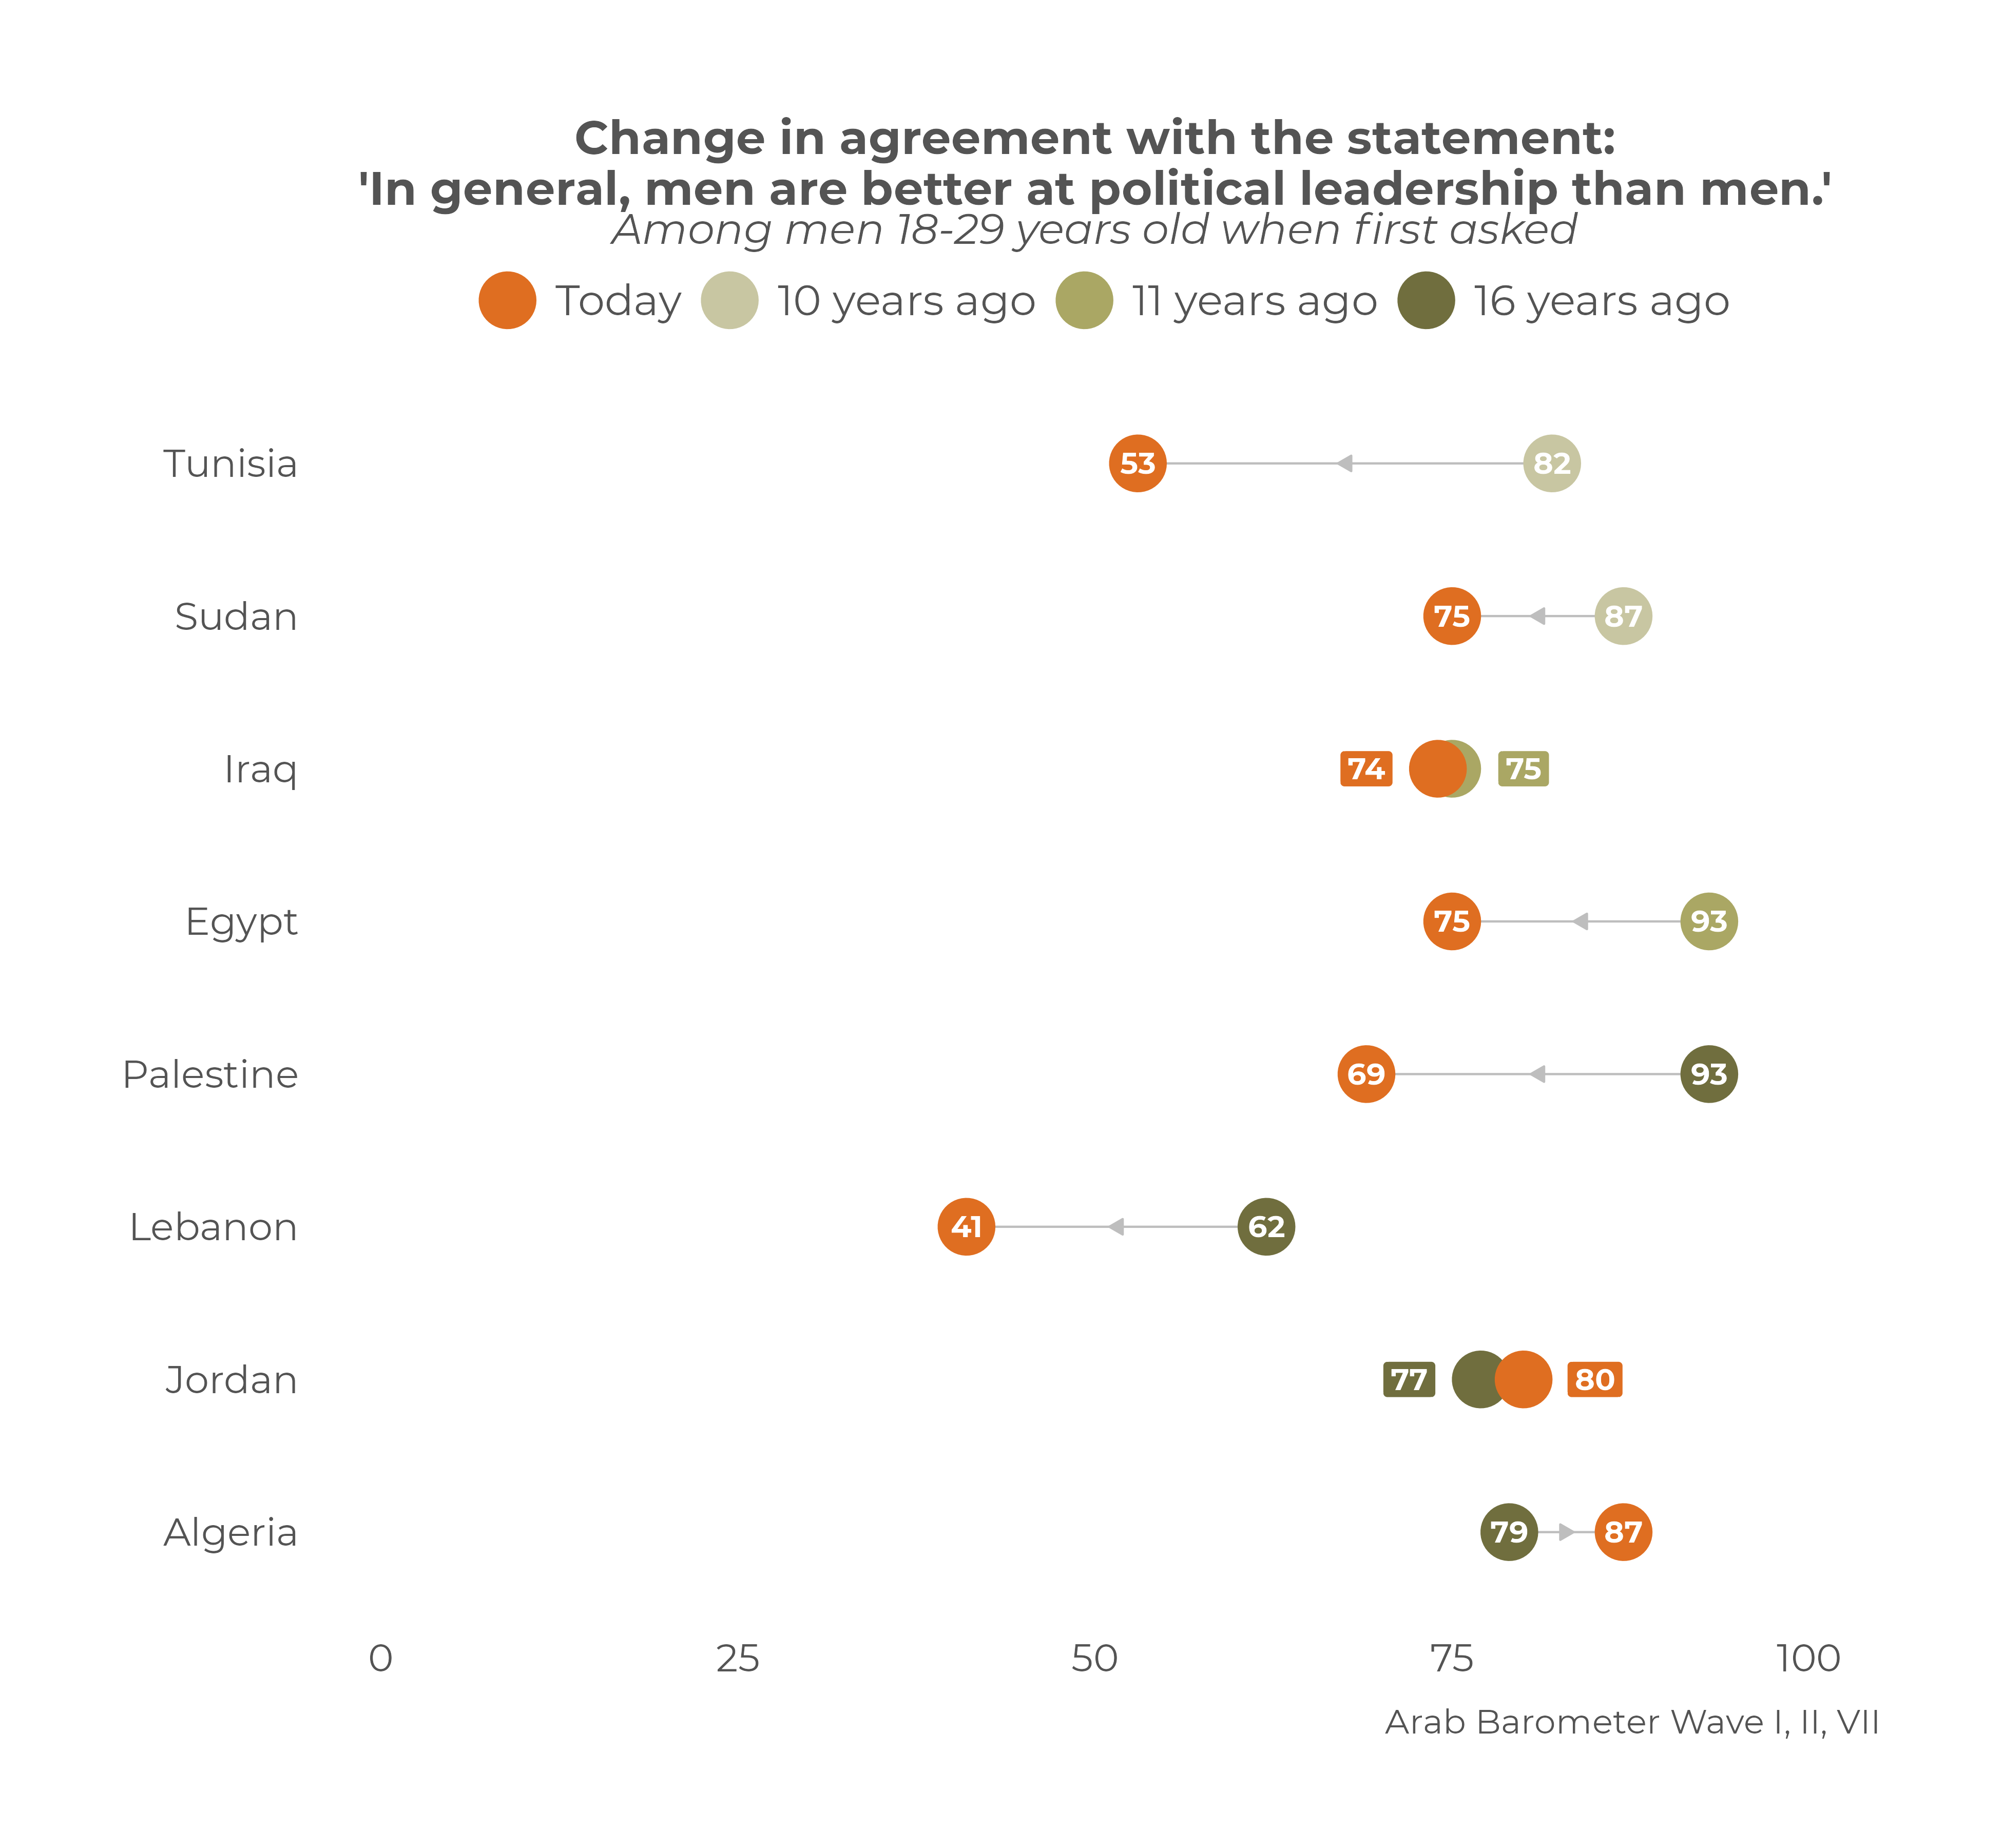
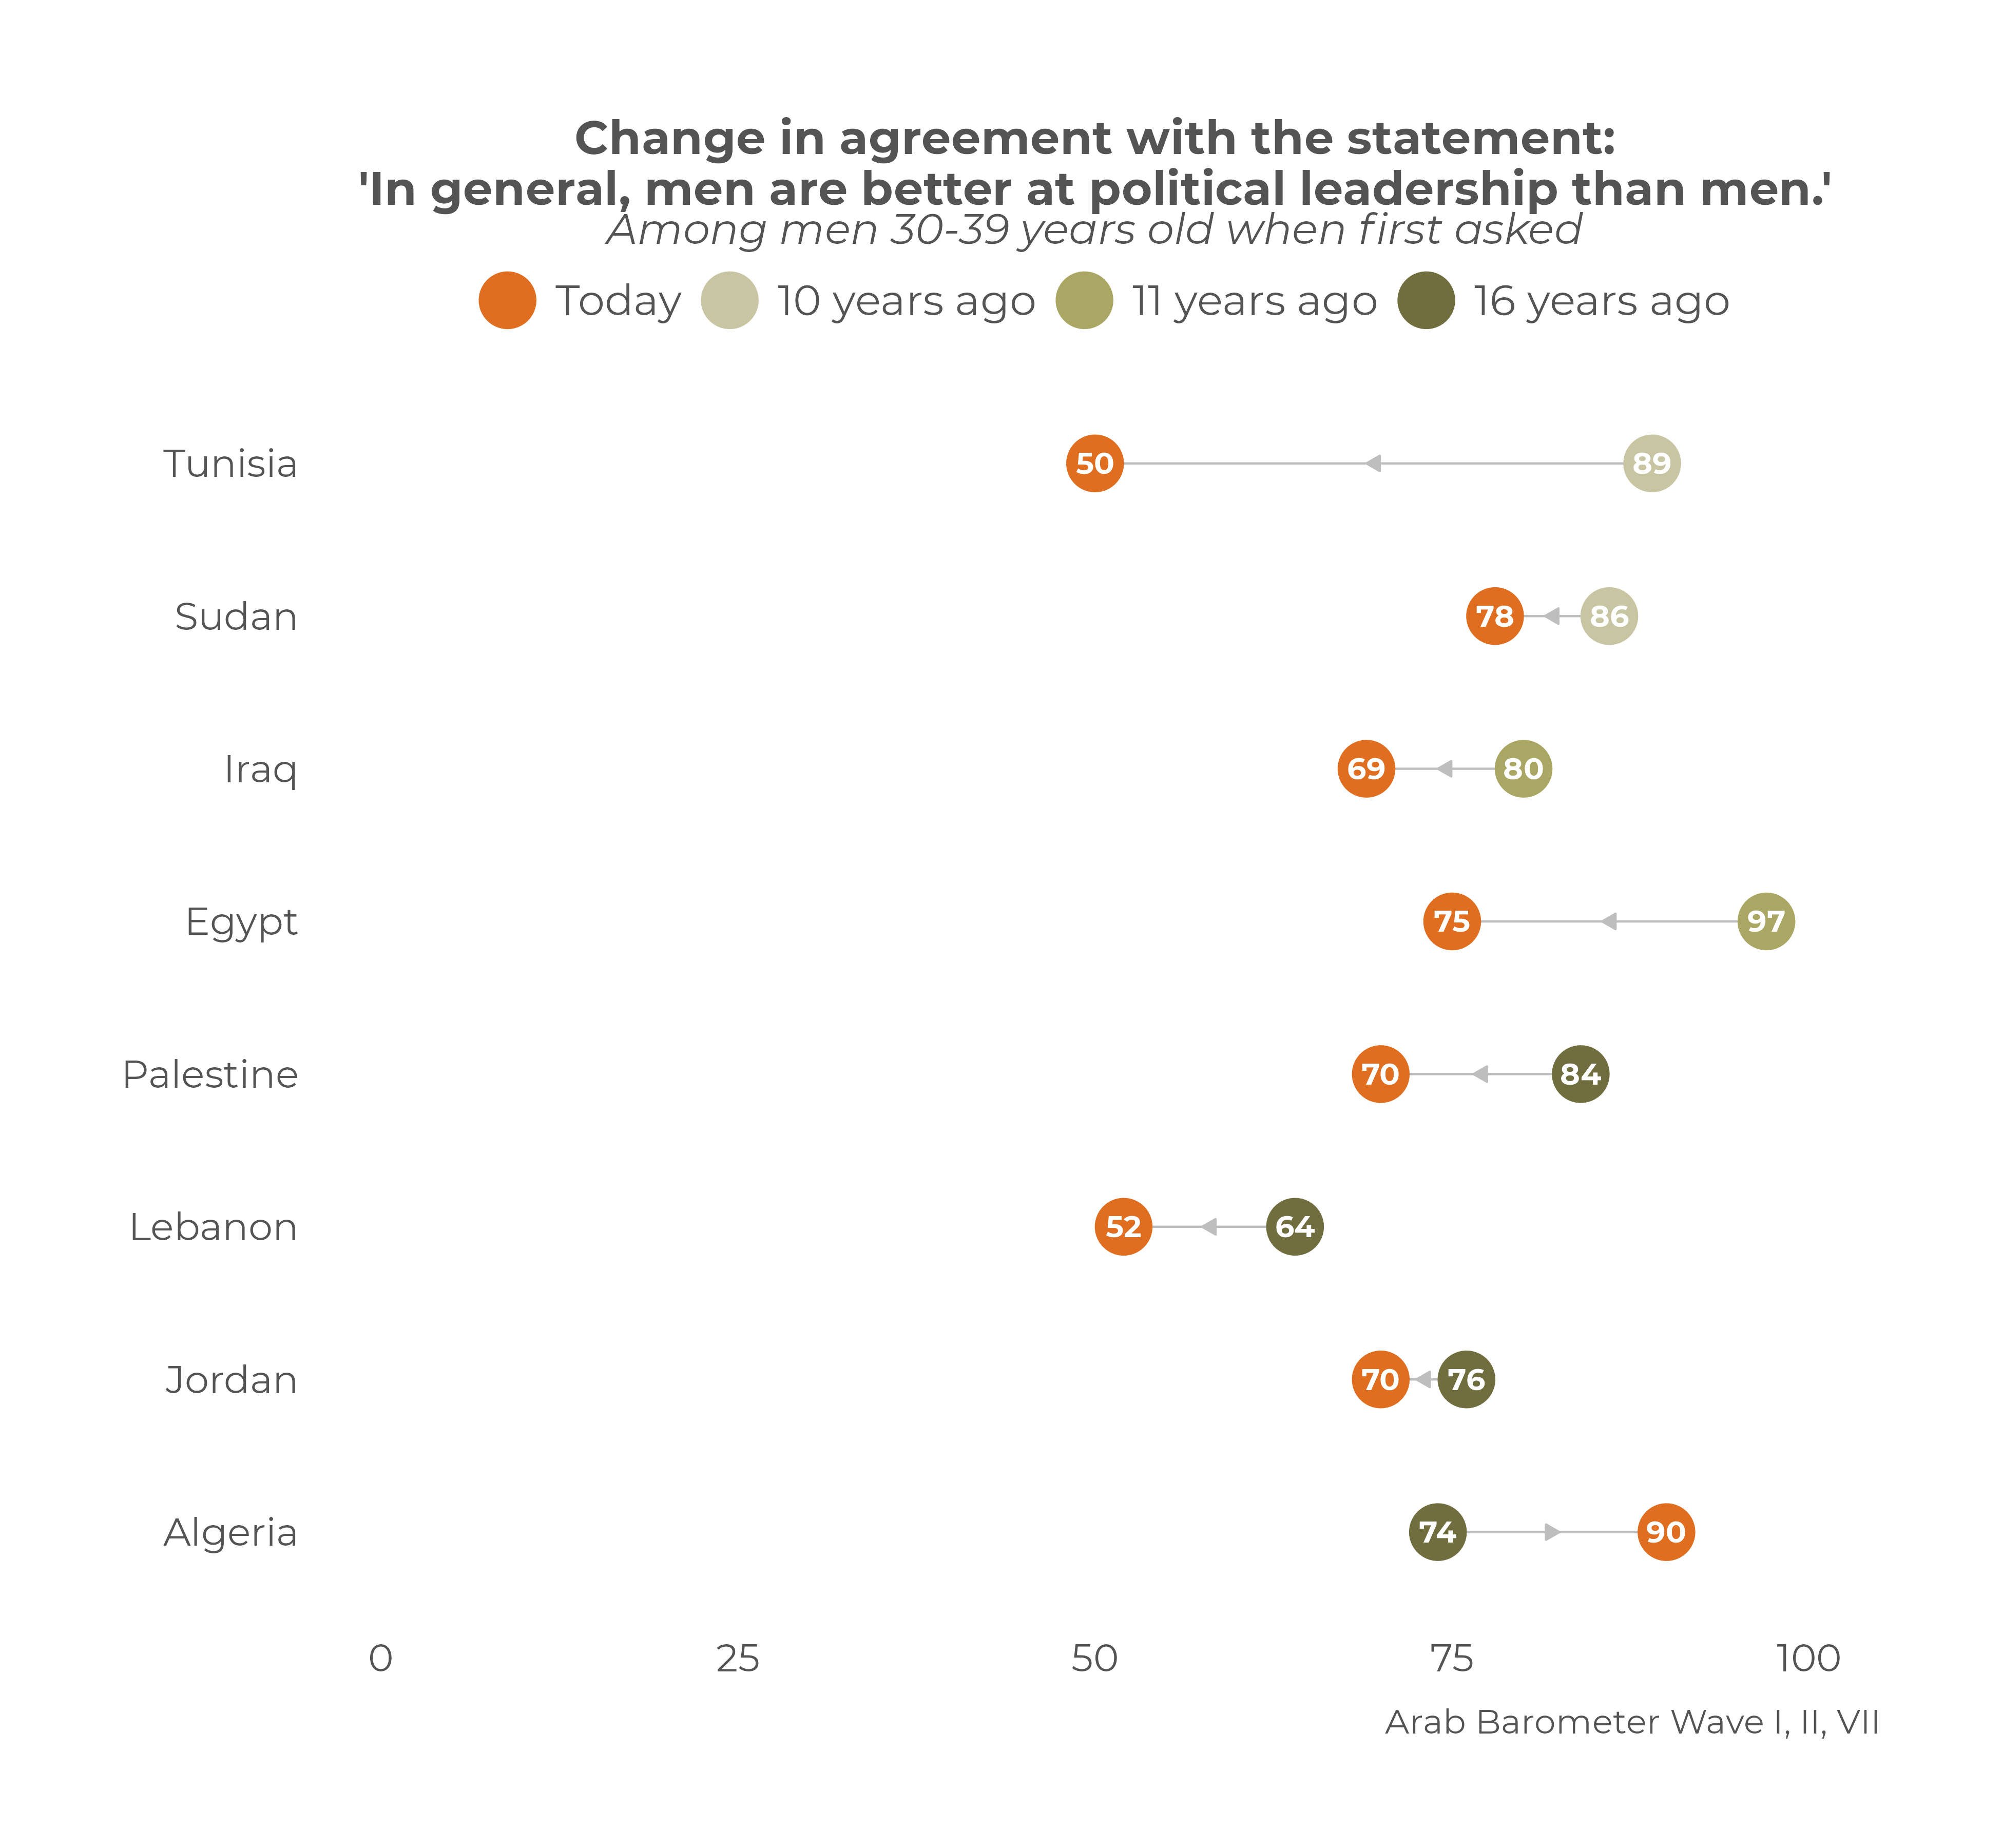
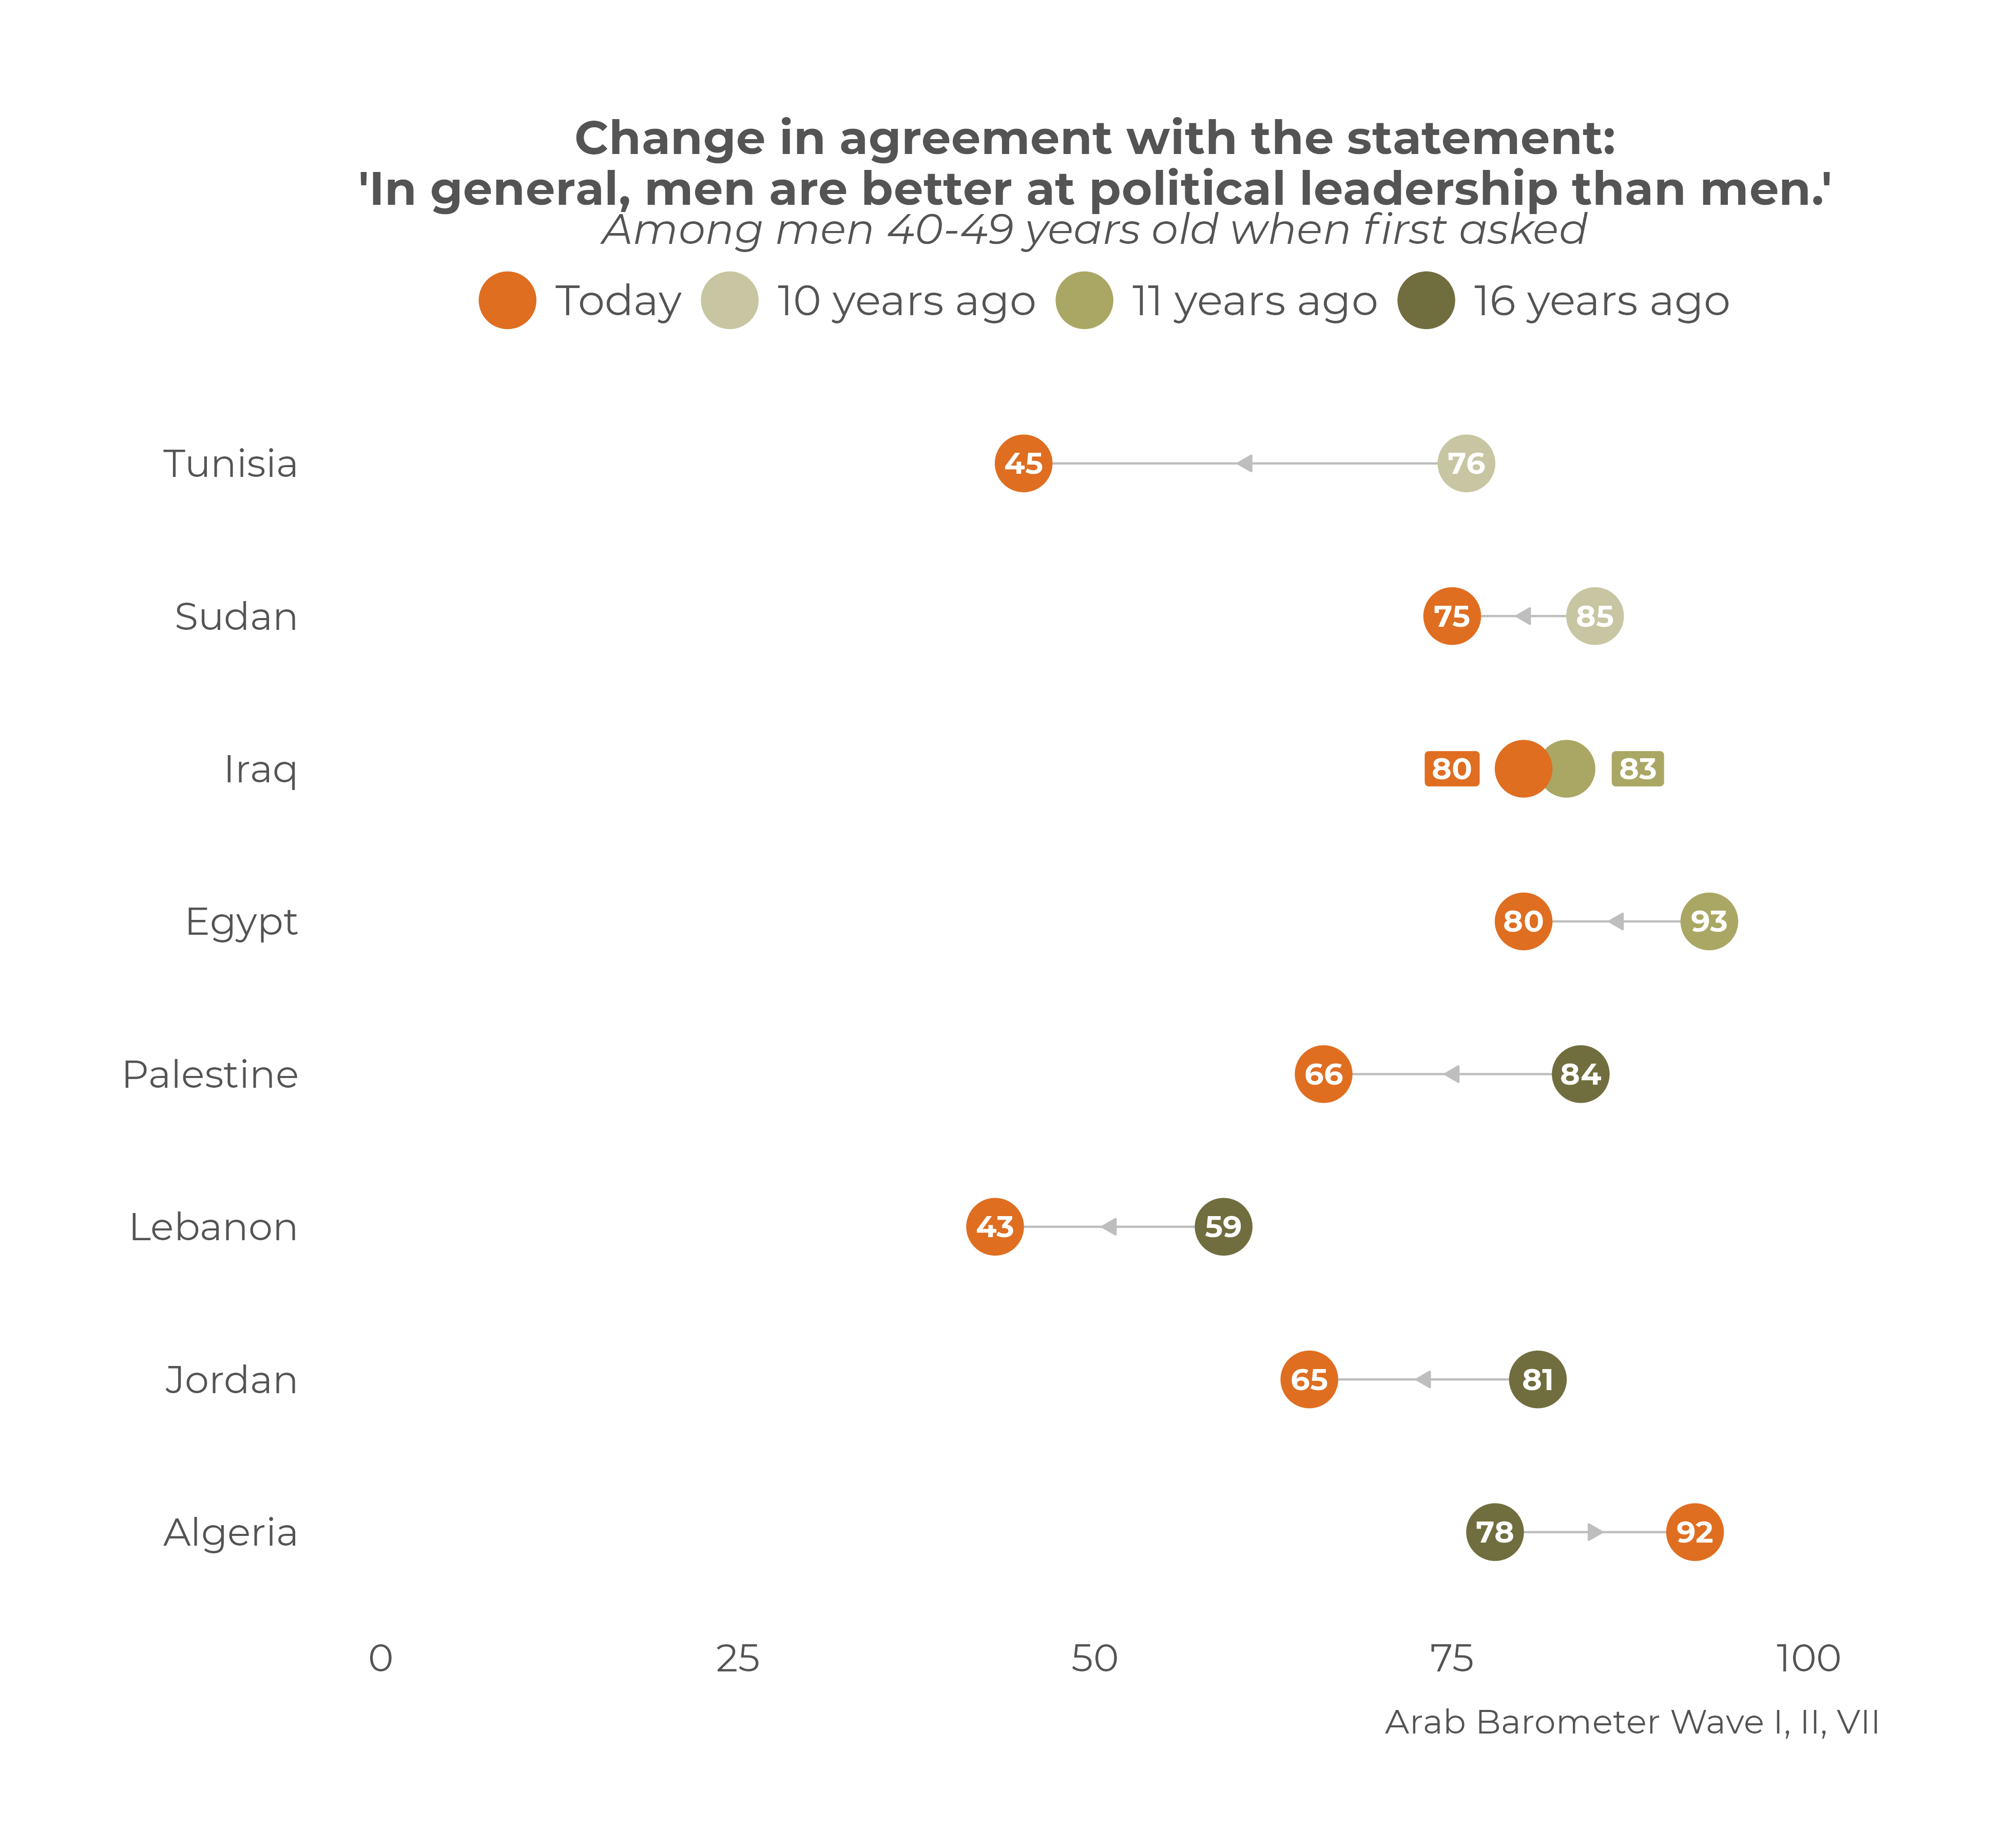
say household heads should be equally responsible for helping children study. (Arabbarometer) March 6, 2023 Female Political
Participation Inspires Confidence In Female Political Leadership In MENA, An
8 Country Survey Eight of the countries Arab
Barometer surveyed during its seventh wave were also surveyed at least ten
years ago during the first or second wave.[2] This allows us to compare a
nationally representative cross-section of different age groups to see how
their opinions have changed since they were first surveyed. For this
analysis, we broke the population up into three age cohorts. Cohort I
consists of citizens who were 18 to 29 the first time they were surveyed;
Cohort II is citizens originally aged 30 to 39; and Cohort III is citizens
originally aged 40 to 49.[3] Except for a small overlap in Cohort I, the
citizens in question have now [4] aged out of their original cohort. (Arabbarometer) March 6, 2023 International Women's Day:
Global Opinion Remains Committed To Gender Equality, But Half Now Believe It
Is Coming At The Expense Of Men, A 32-Country Survey A new global study conducted
in 32 countries by Ipsos in collaboration with the Global Institute for
Women’s Leadership at King’s College London for International Women’s Day
shows that: Two-thirds (68% globally, 63% in the U.S.) agree there is
currently inequality between men and women in terms of social, political,
and/or economic rights in their country, down slightly from 2017. However, 1
in 2 globally (54%) and more than 1 in 3 in the U.S. (37%) say that when it
comes to giving women equal rights with men, things have gone far enough in
their country – proportions that have gradually increased since 2019. (Ipsos USA) 7 March 2023 Out Of The 64
Countries That Were Surveyed, South Korea Tops Security Preference For US,
Pakistan Tops Preference For China, While Serbia Tops The Preference For
Russia And Sweden For EU For Security Partnership: GIA And Gallup &
Gilani Pakistan According to a survey conducted by
Gallup International Association, out of the 64 countries that were surveyed,
South Korea tops security preference for US, Pakistan tops preference for
China, while Serbia tops the preference for Russia and EU for security
partnership. The question asked was “Which of the following would you prefer
your country to partner with for security – the US, China, Russia, or The
EU?” 84% people from South Korea said USA, 54% from Pakistan said China, 53%
from Serbia said Russia and 69% from Serbia said EU. (Gallup Pakistan) March 08, 2023 Source: https://gallup.com.pk/wp/wp-content/uploads/2023/03/08-March-GIA-PR_merged.pdf Reflections On
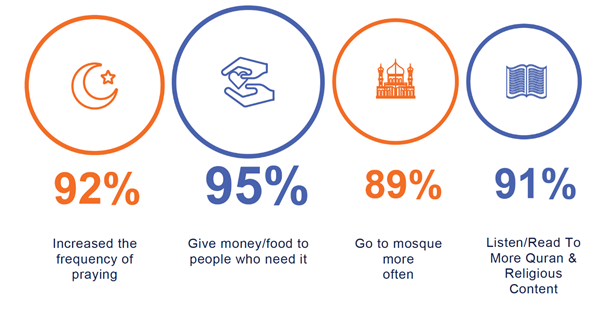
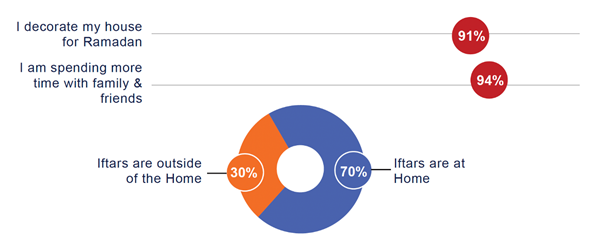
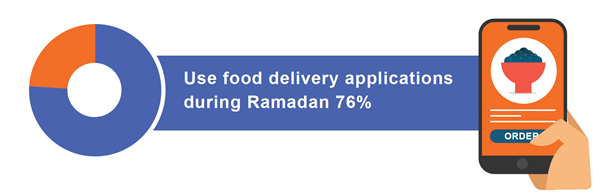
Ramadan, A Look Into Changing Habits Of KSA, UAE And Egypt Ramadan is a significant month for
Muslims in the MENA region, and while it is a time of spiritual reflection
and self-discipline, it is also a time of celebration and community. It’s
touted as a period for personal spiritual growth and development, but it is
also a time to strengthen family and community bonds. In the MENA region,
there has historically been a significant increase in media consumption
during the month of Ramadan. Partly due to the fact that many popular
television shows and dramas are broadcast during this time, and so viewership
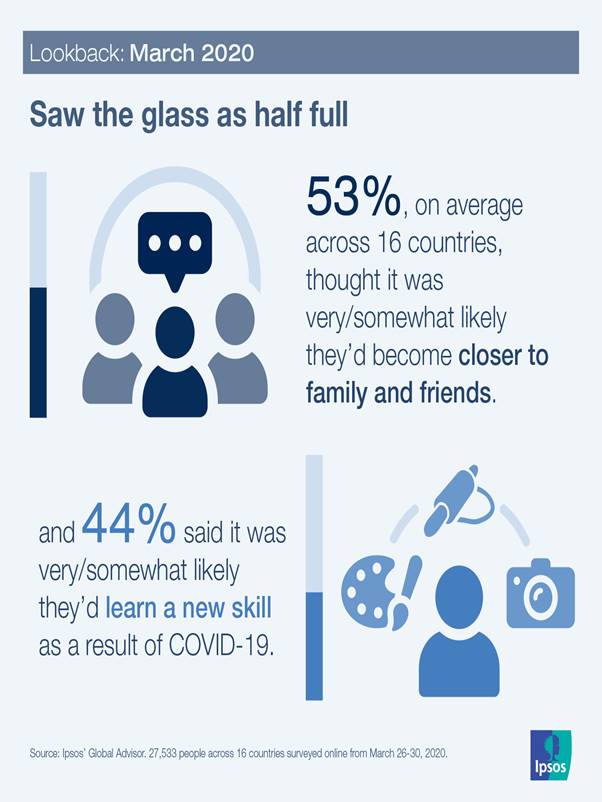
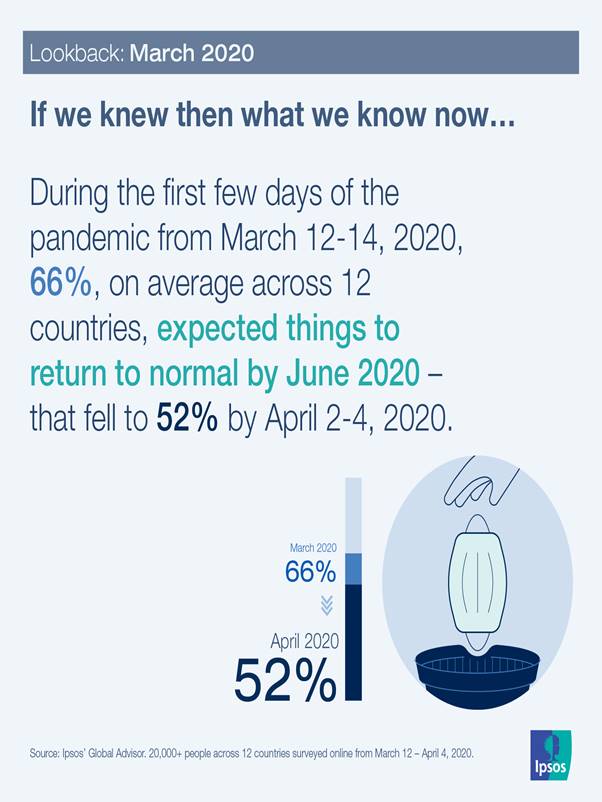
naturally increases. (Ipsos UAE) 8 March 2023 Source: https://www.ipsos.com/en-ae/reflections-ramadan Data Dive: Looking Back At
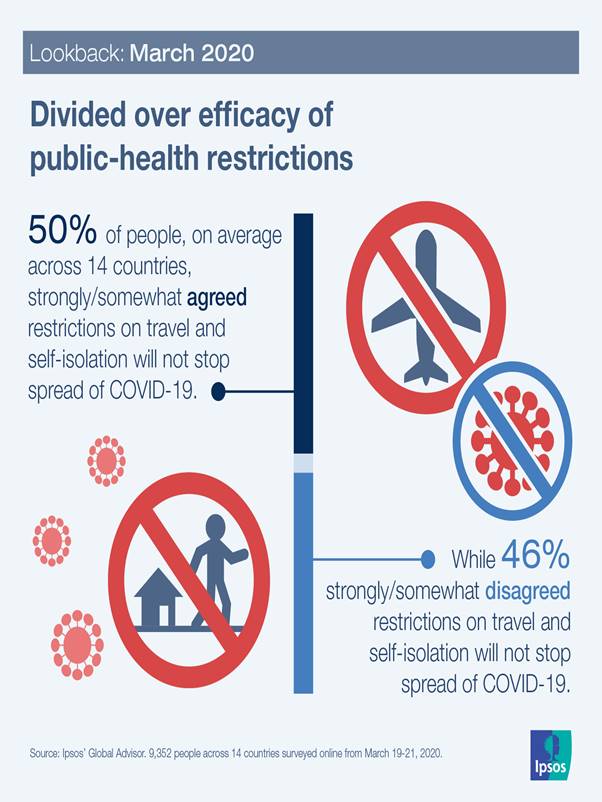
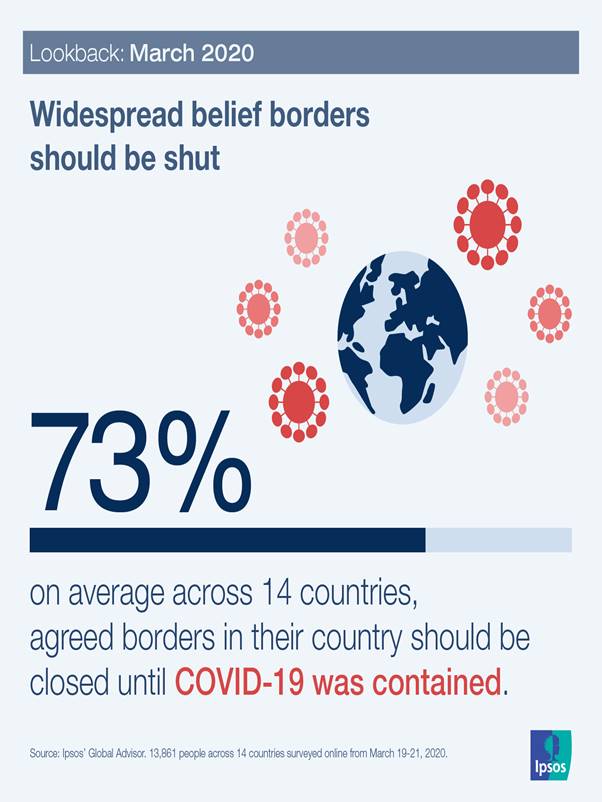
How The World Was Feeling As The COVID-19 Era Dawned, A Survey In 12
Countries The coronavirus crisis seemed small
and contained at first, but like a snowball rolling down a hill it quickly grew
in speed and size. In the days and weeks to come, citizens around the globe
started doing things that only a few months prior would’ve seemed like
something out of a cheesy sci-fi movie. People were wiping down and
quarantining groceries, fighting over dwindling supplies of hand sanitizer
and toilet paper and knocking pots and pans together nightly in honour of
healthcare heroes … not to mention that video of Gal Gadot and other celebs
singing “Imagine.” (Ipsos USA) 10 March 2023 Source: https://www.ipsos.com/en-us/data-dive-looking-back-how-world-was-feeling-covid-19-era-dawned According To Yougov Data,
Around 44% Of The World's Consumers Say They Try To Buy Only From Socially
And Environmentally Responsible Companies, A Survey Across 18 Global Markets According to YouGov data, around
44% of the world's consumers say they try to buy only from socially and
environmentally responsible companies. But how much can consumers trust
a brand's claims, given apparent high-profile shortcomings, such as those
highlighted by recent reports on fast-fashion brand H&M? The survey data
reveals that the majority of respondents globally (60%) are skeptical of
brands' green claims, suggesting that brands need to do better if they are to
earn their trust. While more than a quarter are undecided (28%), the
proportion of consumers who disagree with this statement is less than one in
ten (7%). (YouGov Spain) March 10, 2023 Source: https://es.yougov.com/news/2023/03/10/global-desconfian-los-consumidores-de-las-afirmaci/ Women Worldwide Still Facing
Uphill Battle For Equality And Safety, A 39 Country Survey Only 39% of people globally believe
that women have the same opportunities as men career-wise. This number has
improved from 2021 when an even lower 37% of respondents globally answered
positively. In some countries, the way to equality feels longer than in
others. In Chile, 62% of respondents perceive that women have fewer job
opportunities than men, and generally in the Americas, 46% of people are
feeling the same. Leading the discontent is Europe, where over 52% of
respondents think that women’s opportunities are limited. Italy (67%),
Croatia (64%) and France (58%) feel the most disparity. (WIN) 11 Mar 2023 Source: https://winmr.com/women-worldwide-still-facing-uphill-battle-for-equality-and-safety/ ASIA
784-785-43-01/Polls Japan Activists Demand
Dual-Surname Option On Women’s Day
Women’s rights activists in Japan
renewed their demand Wednesday for the government to allow married couples
the option to keep both of their surnames, saying the current practice in
which most women face social pressure to adopt their husbands’ surnames--a
prewar tradition based on paternalistic family values--widens gender
inequality. At a rally marking International
Women’s Day, representatives from dozens of women’s rights groups delivered a
joint statement to lawmakers urging them to do more to change the
125-year-old civil code, which forces married couples to choose one surname. “We strongly urge the parliament to
face the issue and promptly achieve a revision to the civil code,” the
activists said in a statement they handed to lawmakers who also attended the
rally in Tokyo. Public support for a dual-surname
option has grown, with surveys showing a majority now supports the option for
married couples to keep separate surnames. Some couples have also brought
lawsuits saying the current law violates the constitutional guarantee of
gender equality since women almost always sacrifice their surnames. Under the 1898 civil code, a couple
must adopt “the surname of the husband or wife” at the time of marriage--which
experts say is the only such legislation in the world. Although the law does
not specify which name, 95% of women adopt their husbands’ surnames, as
paternalistic family values persist and women are generally seen as marrying
into their husband’s household. A 1996 government panel
recommendation that would allow couples the option to keep separate surnames
has been shelved for nearly three decades due to opposition by the governing
Liberal Democratic Party. Prime Minister Fumio Kishida’s
conservative governing party faces growing calls to allow more diversity in
family values and marriage. Many in his Liberal Democratic Party support
traditional gender roles and a paternalistic family system, arguing that
allowing the option of separate surnames would destroy family unity and
affect children. Rally organizer Yoko Sakamoto, a
long-time activist calling for the change, said it’s time to push harder. “We
should even think about not voting for candidates who oppose the change in
next elections,” she said. Activists say the one-surname
requirement almost always forces women to compromise and go through the
trouble of changing their names in official documents and identification
cards at work or elsewhere. As more women pursue careers, a
growing number want to keep using their maiden names at work, while using
their registered surnames in legal documents. Some companies and government
offices now allow female employees to use their maiden names at work, but
they are a minority and the measure is voluntary. Because of outdated social and
legal systems surrounding family issues, younger Japanese are increasingly
reluctant to get married and have children, contributing to a low birthrate
and shrinking population. Some experts say Japan’s one-surname-only policy is
among the reasons women hesitate to get married. A 2015 Supreme Court ruling urged
parliament to discuss the surname issue instead of issuing a legal judgement,
but parliamentary deliberation has stalled amid opposition by conservative
members of the governing party. The rights gap between men and
women in Japan is among the world’s largest. Japan ranked 116th in a
146-nation survey by the World Economic Forum for 2022 that measured progress
toward gender equality based on economic and political participation, as well
as education, health and other opportunities for women. (Asahi Shimbun) March 9, 2023 Source: https://www.asahi.com/ajw/articles/14857297 MENA
784-785-43-02/Polls Inflation Is Changing
Consumer Priorities And FMCG Spend In The UAE
Inflation and the resulting price
rises are putting pressure on consumers in the United Arab Emirates (UAE).
Spending has remained high since 2019 and this ongoing financial strain is
leading consumers to change the way they shop. But despite this, the UAE
economy ended 2022 solidly and signs suggest this growth will continue, but
might slow in the first half of 2023. Changing consumer priorities The FMCG market in the UAE continued
to thrive in 2022, partly driven by the expansion of the expatriate
population in the latter part of the year. However, FMCG spend shifted in a
way that suggested a change in consumer priorities and spending behaviour. People are shopping less often, but
spending more, and the gap between the two widened throughout 2022. This was
driven by a rising basket value which was sparked by the global pandemic and
compounded by the war in Ukraine and inflation. At the end of 2022, spend per
trip reached the highest level since COVID.
Shoppers prioritise food and home
care Despite the inflationary pressures,
the FMCG industry grew in 2022. Spend on beverages tumbled by -4% and
personal care by -5% due to shoppers shifting their spend to food and home
care products, which grew by 5% and 7%, respectively. Dairy struggled the
most and also experienced the biggest price rises. But not only are brands in
the personal care and beverage losing out to other segments, they also face
tougher competition and so it’s vital for them to adopt fresh marketing
strategies so they stand out in the market.
It's time to take a fresh look at
the traditional promotional strategy Promotions no longer have the power
they once had. Their impact has dwindled over the past two years leading many
brands to cut their promotional spend. Alternative marketing strategies and
tactics may produce better results, such as improving the in-store
experience, enhancing the product offering, leveraging social media and
influencer marketing, and personalising the customer journey through
data-driven insights. But while promotions declined, the
popularity of online shopping continued to grow in 2022. Consumers purchased
nearly 6% of all FMCG products online, showing a preference for larger pack
sizes and higher purchase quantities compared to offline shopping.
Adapting strategy to changing
shopper behavior and going online is essential for brand growth. As the UAE economy faces a
slowdown, it's becoming increasingly important for retailers and
manufacturers to adapt their strategies to keep pace with the changing
spending patterns of consumers. In particular, the growing popularity of
online shopping is something that cannot be ignored - this trend has only
been accelerated by the COVID-19 pandemic. To succeed in this environment,
better targeting is crucial. This could mean renewing the appeal of premium
brands to affluent segments or offering the right product assortment and
bundles to attract middle-class shoppers. By identifying and responding to
the unique needs and preferences of different customer segments, retailers
and manufacturers can position themselves for growth and success. (Kantar) 09 March 2023 AFRICA
784-785-43-03/Polls Despite Growing Evidence,
Climate Change Is Still Unknown To Many South Africans
In recent years, South Africa has
experienced several catastrophic climate-related events, most notably the
Orange River floods in 2011, the worst drought on record in 2015, the Knysna
fires in 2017 (World Bank, 2021; Khoza, 2019), and the recent floods that
wreaked havoc in the coastal city of Durban and its surrounds, claiming more
than 400 lives and leaving thousands displaced (Ogunmodede, 2022). Climate
change is making its presence felt in the country, impacting South African
ecosystems, economies, and livelihoods (USAID, 2021). Despite the country’s
standing as the most developed economy in the Southern African Development
Community (SADC), it is not insulated from the severe harms that the range of
climate-change impacts adds to its challenges of constrained financial
resources, a sluggish economy, and persistent unemployment (King, 2021). In
response, the national government has approved critical actions that
prioritise climate mitigation and adaptation strategies, emissions
reductions, and waste management. The South African Cabinet has forged ahead
with the creation of a Presidential Climate Change Coordinating Commission, a
Low Emissions Development Strategy, a National Climate Change Adaptation
Strategy, a National Waste Management Strategy 2020, a carbon tax, and a
draft Climate Change Bill (South African Government, 2020). What are South
Africans’ experiences and perceptions of climate change? Findings from the
most recent Afrobarometer survey in South Africa, in 2021, show that popular
awareness of climate change, though increasing, remained relatively low.
Among those who were aware of it, a growing number said climate change is
making life in the country worse. Key findings §
About half (49%) of South Africans said they had heard of climate change, a
7- percentage-point increase since 2018. o Awareness of climate change was
particularly low among citizens with less than a secondary education (36%%),
the poor (37%), and rural residents (42%). o Awareness was slightly above
average among citizens who get daily news from the Internet (58%), newspapers
(56%), and social media (55%). §
Among those who were aware of climate change, more than six in 10 (62%) said
it is making life in South Africa “somewhat worse” (30%) or “much worse”
(32%). § Compared to 2018, the proportion of citizens
who said climate change is making life worse increased by 9 percentage
points. Do South Africans know about climate change? About half (49%) of
South Africans said they had heard of climate change, while the other half
said they were unfamiliar with the concept (43%) or didn’t know how to answer
the question (8%) (Figure 1). Compared to 2018, the proportion of South
Africans who said they had heard about climate change increased by 7
percentage points (Figure 2).
Women were less likely than men to
be familiar with climate change (45% vs. 53%), as were rural residents
compared to their urban counterparts (42% vs. 52%) (Figure 4). The youngest
respondents (53%) were more aware of climate change than their elders.
Awareness of climate change increased with respondents’ education level,
ranging from 36% of those with primary or no formal schooling to 62% of those
with post-secondary qualifications. Similarly, economically better-off
citizens (60%) were far more likely to know about climate change than those
experiencing various levels of lived poverty1 (37%-50%), even though climate
change often affects disadvantaged communities the most (GIZ, 2022).
Awareness of climate change was at above-average levels among daily consumers
of news via the Internet (58%), newspapers (56%), and social media (55%),
though differences were marginal for those receiving daily news from the
radio (51%) and television (52%) (Figure 5).
How is climate change impacting
life in South Africa? Among South Africans who were aware of climate change,
62% said it is making life in the country worse, compared to 16% who said it
is making things better (Figure 6). The share of respondents who saw climate
change as making life worse increased by 9 percentage points compared to
2018, suggesting that people are feeling the effects of climate change
(Figure 7). Similar to awareness of climate change, perceptions of its
negative impact are more common in cities (64%) than in rural areas (57%),
and among the poor (68%) than among the well-off (63%). South Africans with a
post-secondary education (69%) are also more likely to perceive the impact of
climate change as undesirable, as are the youngest respondents (71% of those
aged 18-25 years) (Figure 8).
Most important problems When
respondents were asked what they considered to be the most important problems
that their government should address, climate change ranked very far down the
list – fewer than 1% of respondents cited it among their top three priorities
for government action (Figure 9). Unemployment was far and away the top
concern, cited by 63% of citizens, and 23 other problems outranked climate
change.
Conclusion General awareness of
climate change in South Africa was relatively low, especially among people
with limited education, the poor, and rural residents. This suggests
opportunities for increasing citizens’ knowledge through education and
information campaigns in order to boost support for meaningful, collective
climate action. Most South Africans who were aware of climate change said it
is making life in the country worse. But climate change ranked very low among
the problems they considered most important – a challenge for activists who
consider climate change the existential issue of our times. (Afrobarometer) 9 March 2023 WEST EUROPE
784-785-43-04/Polls A
Quarter Of Britons Say They Have A Phobia Of Heights
According to the Cambridge Dictionary, a phobia is “an extreme fear or dislike
of a particular thing or situation, especially one that is not
reasonable”. The NHS states that severe phobias can cause
a person to “organise their life around avoiding the thing that's causing
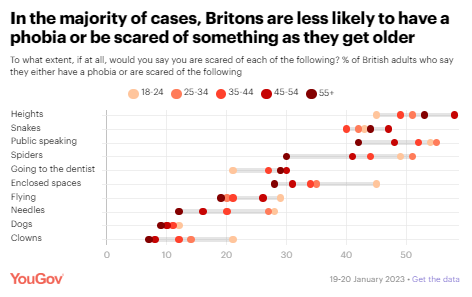
them anxiety.” Now, a new YouGov RealTime survey
has revealed that, of 10 phobias asked about, heights (or acrophobia) is the
one that Britons are most likely to suffer from, with 23% saying it affects
them. Glossophobia, or a fear of public
speaking, also features highly, with 15% of Britons admitting to having an
overwhelming and debilitating fear of having to stand up and speak in front
of people.
What are Britons
scared of? While not going so far as to say
they have a phobia, many Britons also admit to being scared of some of the
items on our list. Including the aforementioned 23%
who say they have a phobia of heights, half of Britons (52%) say they have
some form of fear of being up high, with the further 29% being either “very”
or “somewhat” scared of heights. Overall, half of the British public
(49%) also admit to either having a phobia or being scared of speaking in
front of people. And, although the chances of
encountering one in the wild in Britain are slim, two in five Britons (42%)
say they have some form of fear of snakes.
This expanded fear question reveals
further gender differences. More than half of women (57%) say they have some
form of fear of public speaking, compared to 39% of men. The same proportion
of women also admit to being afraid of heights to some extent, compared to
46% of men. However, the gender gap is at its
largest when it comes to spiders, with half of women (50%) confessing to
having either a phobia or being cared of arachnids, compared to 28% of men. Women are also almost twice as
likely as men to say they are either claustrophobic or scared of enclosed
spaces. Two in five women (42%) say they have some form of fear of enclosed
spaces such as lifts and tunnels compared to 23% of men.
In the majority of cases asked
about, fear diminishes with age. This, according
to psychologist Kevin Gournay, could be a result of producing less
adrenaline as we age, meaning the fears experienced at a younger age are less
of an issue later in life. For instance, half of those aged 18
to 24 (49%) say they either suffer from arachnophobia or are otherwise scared
of spiders (49%) compared to 30% of those aged 55 and over. The youngest age group are three
times as likely to say they have either a phobia or are scared of clowns
(21%) as the oldest generation (7%). Those aged 18 to 24 are also more than
twice as likely to admit to having some form of fear of needles (28%)
compared to those aged 55 and over (12%).
February
27, 2023 Source: https://yougov.co.uk/topics/society/articles-reports/2023/02/27/what-do-britons-say-they-have-phobia
784-785-43-05/Polls Half
Of Britons Say Feminism Is Still Needed In The UK In 2023
Education is where the largest
proportion of Britons believe equality has already been won – but even then,
just 20% say so. Half (52%) say the UK is “very” or
“fairly” close to achieving equality in education, but 17% say it is not yet
close to being achieved.
The area where work is most needed,
according to most Britons, is around crime. Just 7% of the public say women and
girls’ experience of crime is on a par with men’s, while 52% say equality in
this area is not close to being achieved – 20%, however, believe equality is
close. Across every measure asked, men are
notably more likely than women to suggest equality for women and girls has
already been achieved. The most significant gender gaps
are around media representation (24% of men believe equality is achieved
compared to 8% of women), education (28% to 13%) and politics (19% to 7%).
Half of Britons
believe the UK still needs feminism The efforts of feminists are still
needed in the UK, according to half of Britons (50%), including 20% who say
there’s a great deal of need for feminism in the UK at the moment. However, three in ten Britons
believe there’s not very much need (22%) or no need at all (8%) for feminism in
this country.
At 59% to 41%, women are more
likely than men to believe feminism is still needed, with young women most
likely to say so – 69% of 18 to 29-year-old women say feminism is needed,
compared to 47% of women aged 65 and over. Those who are 65 and older are
generally least likely to think the UK needs feminism, with just 32% of men
in that age group saying so compared to between 42% and 45% of men of other
ages. March
08, 2023
784-785-43-06/Polls Four
In Ten Britons Say They’ve Witnessed Drug Deals In Their Neighbourhoods
The government
isn’t doing enough to crack down on neighbourhood drug crime, according to
57% of the public Labour has announced plans to flood
drug dealing hotspots with police officers in a crackdown on
drug crime if elected, news likely to be welcomed by a significant proportion
of Britons who claim to have seen dealers operating in their neighbourhoods. In contrast, a third of those aged
65 and over (33%) suspect they’ve seen drug dealing in their neighbourhood at
least once or twice, with 5% witnessing it on many occasions. Half of Britons (50%) have never
witnessed a suspected deal in their area.
One in eleven
Britons “very regularly” see drug users in their neighbourhood Three in ten Britons (29%) say they
regularly see people they suspect to be under the influence of drugs in their
neighbourhood, with 9% saying they see drug users “very” regularly. Just 24% of the British public say
they never have. Again, young people are more likely
to say they often see drug users in their neighbourhoods – 13% of 18 to
24-year-olds say they see people under the influence of drugs very regularly,
compared to 5% of those aged 65 and over.
Britons believe
the authorities don’t do enough to tackle neighbourhood drug crime Last year, the government set out
plans for a “swift,
certain, tough” approach to drug possession – but according
to more than half of the public (57%), the government is doing too little to
tackle neighbourhood drug crime. In comparison, 17% say the
government’s efforts are about right, while 3% say they do too much. Six in ten people (61%) who voted
Conservative in the last general election are among those who believe the
government isn’t doing enough, with 58% of Labour supporters saying the same. Overall, a quarter of Britons (26%)
believe their local police forces are doing about the right amount of work to
tackle neighbourhood drug crime, though half (49%) say they do too little –
just 2% say police do too much. Half of the public (50%) believe
local councils don’t do enough to address the problem, with 20% saying they
do enough and 1% too much.
March
10, 2023
784-785-43-07/Polls Rising
Energy Costs And Long-Term Price Pressures On UK Farmers Most Likely To Be
Seen As Causes For Fruit And Vegetables Shortages
Just over half say climate
change/weather challenges in the UK have contributed a great deal or fair
amount (54%) while around half believe the Russian invasion of Ukraine (49%),
the repurposing of arable land for other uses in the UK (47%) or haulier
labour shortages (46%) have played their parts in causing the shortages.
Around 4 in 10 say the shortages have been caused by the lack of willingness
from farmers to grow fruits and/or vegetables (42%). People are least likely to say the
Covid-19 pandemic (29%) or supermarket labour shortages (33%) have made a
contribution to the food shortages we are currently witnessing. We see a majority of people in the
UK have been affected by the issue with two-thirds (66%) saying they are
finding it harder now, in comparison to 6 months ago, to find fresh fruits
and vegetables in their local supermarkets. Only 8% say they are finding it
less difficult while almost a quarter say there has been no change (23%).
Samira Brophy,
Research Director at Ipsos, said: Here we see many
have been affected by the recent food shortages in supermarkets, with two in
three saying they have found it more difficult to find fresh fruit and
vegetables in their local store. Most recognise the current food shortages as
being caused by long term price pressures on UK farming, alongside the
current issue of energy prices. This suggests the public are tuned into the
history surrounding the current shortages, alongside more immediate challenges.
We have seen in our Ipsos Global Trends 2023 data, that major challenges
facing people give businesses and institutions a clear mandate to offer plans
and solutions. However only 40% of people surveyed in Great Britain believed
that businesses are good at planning for the long term. This highlights a big
opportunity for government and businesses to win over the public with
transparency and demonstrating action in tackling structural change. 6
March 2023
784-785-43-08/Polls 7
In 10 Britons Do Not Think The Government’s Policies Will Improve Public
Services
Confidence in the government’s
long-term policies for both economy and public services falls since last
March Almost two-thirds think Sunak’s
government has done a bad job managing the economy. Labour has small lead as party with
best policies on the economy The Conservatives and the economy /
budget When asked about different aspects
of the government’s record since Rishi Sunak became Prime Minister,
two-thirds or more think his government has done a bad job handling various
aspects of the economy. 7 in 10 (71%) think his government has done a bad job
dealing with the cost of living and 21% a good job, numbers only marginally
better than Boris Johnson’s government achieved in July (17% good job and 75%
bad job). Meanwhile, 68% think his government has done a bad job handling tax
and spending, 66% say bad job on reducing regional inequalities/levelling-up
and 64% say it has done a bad job managing the economy overall, all either
similar or marginally worse than July. Meanwhile, 32% think a Labour
government with Keir Starmer as Prime Minister and Rachel Reeves as
Chancellor would do a better job managing the economy (+6 pts from last March
when compared to Johnson and Sunak), 22% say they would do worse (-5pts) and
38% say it would not make a difference (+4).
This is Labour’s best score since going into opposition. Detailed party comparison figures
show Labour still ahead of the Tories for having the best policies on the
economy (30% vs 24%), taxation (34% to 21%), poverty/inequality (41% vs 12%),
reducing the cost of living (36% to 17%), unemployment (34% to 19%), and
pensions (26% to 17%), though on most its leads have narrowed since October. In tandem with public criticism of
the government’s performance on the economy is economic optimism – despite
improving somewhat in recent months – remaining weak. 61% expect the state of
the economy to worsen in the next year and 23% say it will improve. Whilst
this compares favourably to November when 72% said it would worsen and 16%
said it would improve, the overall net Economic Optimism Index score of -38
still reflects a wide sense of pessimism in the country. Looking ahead to the budget,
satisfaction with Jeremy Hunt’s performance as Chancellor has fallen since
November. 52% are dissatisfied with the job he is doing (+12 points) and 26%
are satisfied (-3). Whilst these scores are better than his immediate
predecessor, Kwasi Kwarteng, these are otherwise the worst scores for a
Chancellor since March 2016. In terms of what Britons would like
the Chancellor to do next week, 53% believe the Government should increase
spending on public services, even if that means higher taxes or more
borrowing, a slight increase since last July. However, only one in four (27%)
actually expect the government to do this. Voting intention and leader ratings
Latest voting intention trends show
no change in the Labour lead (note most interviewing was done before the
announcement of the new Northern Ireland trading arrangements): Labour 51% (no change since
January) Conservative 25% (-1) Lib Dem 9% (no change) Greens 5% (no change) Other 9% (-1) In terms of Ipsos’ monthly
satisfaction ratings: Only 15% are satisfied with the way
the government is running the country, while 77% are dissatisfied (including
half, 49%, of Conservative supporters), little changed from January. 27% are satisfied with the job
Rishi Sunak is doing as Prime Minister (+1 pt from January) and 59% are
dissatisfied (+4). Among Conservative voters, 65% are satisfied (+4 pts) and
26% dissatisfied (-2). 34% are satisfied with the job Keir
Starmer is doing as Labour leader (-3 pts since January) and 46% are
dissatisfied (+6). Among Labour supporters 56% are satisfied (-2 pts) and 29%
dissatisfied (+7). Gideon Skinner, head of political
research at Ipsos, said: The economy, inflation and the NHS
are the top issues for voters right now, which means Jeremy Hunt has a big
week ahead as he finalises his Budget. There are some signs of recovery from
the lowest points of last autumn, but the government will be concerned that
overall the public mood remains pretty negative about their record so far,
and with even less confidence they will improve things in the future than a
year ago, particularly when it comes to public services. Labour themselves
still have some convincing to do, especially among former Conservative
voters, but they have opened up a small yet persistent lead on the economy -
which is an important difference in Keir Starmer’s favour compared with the
last few elections. 7
March 2023
784-785-43-09/Polls How
Can Advertising Drive Gender Equality
Marketers have a lot on their
shoulders; pricing and supply chain challenges, driving margin, media
fragmentation and digital disruption all around. Then there’s the pressure,
or even the requirement, to embed social purpose and diversity and inclusion
throughout their business. And in the manifestation of this strategy, they
need to ensure that their advertising
at the very least reflects the world around us, or even progresses
it. The UK’s Advertising Standards Association even revised its advertising
code a few years ago to have the ability to rule against gender stereotyping. To mark International
Women’s Day 2023 and the call to #EmbraceEquity, we explore
our ad testing database to look at how progressive advertising to women is. A woman’s world Women had a difficult time during
COVID-19 – more women lost jobs, had to give up income, or handled home
education while continuing to work. And with the current cost of living
crisis, Kantar’s Global Issues Barometer shows that women are more
susceptible to the implications of recession and inflation, and also felt a
lower sense of wellbeing. “With great power comes great
responsibility”, said Voltaire (and Spiderman’s uncle). Marketers should
recognise they have huge power, in the form of their media investment
dollars, giving exposure and airtime to their messages, seeking to influence
attitudes and behaviours. They have a responsibility to do the right thing
for their brand, but also to consider many other factors in their
communications strategy, including how gender roles are represented. Response to advertising When we look at our Link
ad testing database of over 250,000 ads to see how men and
women watching the same ad respond, globally we see very little difference in
the various elements that are enjoyed. The few significant differences we did
see at a global level showed the ads that women enjoyed most contain more
emotional messaging (+3%), music that was well known (+3%) and connected to
the brand (+2%). In terms of content, there were more ads with children
(+5%), slice-of-life advertising (+3%) and holiday ads (+2%). With regards to characters in ads,
women enjoyed ads most that feature caring characters (male +3% and female
+3%), females with diverse body types (+2%), and men in non-traditional roles
(+2%) as well as a greater use of ads featuring people with disabilities
(+2%). Among the ads that men enjoy compared to women
we saw higher numbers of ads with rational messages (+3%) and more use of
continuous voiceovers (+2%) and ads with promotions (+2%). Regionally, North America and
Europe show similar patterns between the genders to those we see at a global
level, whereas Latin America and Asia Pacific show very few differences
between men and women. Differences in advertising between
men and women
As with creative preferences, we
see little difference in which platforms women prefer to see advertising on.
Our Media
Reactions study shows the top five preferred media channels
for women are traditionally offline channels, just like men. There are some differences. Cinema
is the most preferred media channel for women, while it is fourth among men.
One of the reasons for the difference is that women consider cinema ads less
intrusive than men. They also feel more negatively towards advertising on
gaming channels. Driving change I looked at our global Link data
about advertising in the automotive sector, until fairly recently the last
bastion of old-school behaviour. It’s not that long ago that scantily clad
women were draped over car bonnets at automotive shows, presumably to attract
the attention of the mostly male audience. Whatever way you look at that now,
it’s shameful. In fact, our database of global
automotive ads shows that ads that dare to feature women in empowered roles
have greater brand impact. Females with strong personalities and who are
funny make automotive advertising more effective. Women are still few and far
between in automotive ads in these roles, so there’s work to be done here. We see some great examples of ads tackling
gender diversity or challenging gender stereotypes. Heineken’s “Cheers to
all”, our Kantar
Creative Effectiveness Awards winner for TV in 2021, addresses
gender-related drinks stereotypes in a way that is light-hearted rather than
preachy or self-righteous, and for that reason is loved by viewers. Heineken, Cheers to All
Empowering women When brands get the messaging right
it can be truly empowering and even life-changing for women. For our recent
webinar, Harness the power of emotion in digital
advertising, we tested several ads using Link and Facial Coding,
to look at how people responded emotionally. This Kotex Lea Campos ad is a
great example of powerful storytelling. Tested amongst women, it performed in
the top 10% of the database on contribution to brand equity, top 1% for
impact on brand affinity and in the top 25% in terms of emotional engagement
as measured by expressiveness and in the top 5% in enjoyment. Kotex, Lea Campos
5 imperatives for progressive
marketers Based on our analysis and work with
clients around the world, here’s our advice for inclusive and effective
advertising to women… 1. Keep it real As in all matters D&I, we know
that being
authentic helps. It’s not what you do, it’s how you do it. It
doesn’t need to scream ‘LOOK I AM A WOMAN IN A NON-STEREOTYPED ROLE’; it can
be a natural part of communications. 2. Consider humour Emotion enhances the brand impact
of all advertising, including digital. We also know that humour is effective
in advertising, that it’s underused, and that women particularly enjoy humour
in advertising. And there are many types of humour from
belly-laugh to something that raises a wry smile. 3. Avoid stereotypes Here, marketers need to work on
solid insights. In our Link creative testing, we measure whether people think
the ad has progressive
gender portrayals, so we can tell advertisers what works, and what
impact this has on their brand. 4. Technology can help If you use AI, make sure it’s
trained on a big high-quality dataset. Kantar’s AI
creative testing solutions provide results in as few as 15
minutes and are trained on over 250,000 ads in all categories from all over
the world. 5. Getting your creative right
drives profit Our recent analysis of Kantar’s
Link data with WARC’s effectiveness database proves that high-quality
creative drives 4x profit (ROMI). So get all the ingredients
right, test your creative properly, and your advertising will be truly
effective. We are excited to bring you more
great examples of how to get gender right in advertising for our Kantar
Creative Effectiveness Awards launching on Tuesday 18 April. Watch this space
for more insights into progressive advertising that appeals to women and
getting inclusion and diversity right in your campaigns. 07
March 2023 Source: https://www.kantar.com/inspiration/advertising-media/how-can-advertising-drive-gender-equality
784-785-43-10/Polls Romir/M-Holding
Research: Results Of 2022 For The Three Leaders Of The Fast Food Market
Russians spend more money in these
restaurants on weekdays (65.7%). Both in 2021 and in 2022, a large proportion
of buyers are population representatives of the middle-income group (53%).
Also, the majority of respondents (40.5%) are adults aged 45 and older. Their
share remained almost unchanged during the year, but the number of young
people among QSR customers has decreased by 12.6%. The market leader is still
"Tasty", this restaurant chain is visited by 37.4% of Russians. The
chain almost managed to maintain penetration compared to 2021, when the brand
McDonald’s was functioned (38,5%). Meanwhile, KFC (32.9%) and Burger King
(24.3%) have increased their audience amid a difficult year. The main dish in fast food
restaurants is burgers, they account for a third of Russians' expenses in
QSR. At the same time, the most popular in Russia is the classic cheeseburger
and chickenburger. Next in popularity are French fries (12%) and rolls (9%). “Despite the
crisis time, the fast pace of life remains, people are trying to save money,
but are not ready to deny habitual. There is a demand for availability,
service speed, relaxed atmosphere, guaranteed taste and expected quality. Fast food restaurants are just covering these
needs," noted Ksenia Paizanskaya, senior customer
relationship director of Romir. 01
March 2023
784-785-43-11/Polls Almost
Two Out Of Five Germans Use Account Sharing For Their Streaming Subscriptions
Current YouGov
survey with Statista on the subject of account sharing Streaming, whether music or video,
is widespread. Spotify, Netflix and Co. have become indispensable for
many smartphones, tablets or TV sets and are used regularly. When taking
out subscriptions, it is not uncommon for money to be considered, so that
sharing subscriptions, so-called “account sharing”, is not uncommon. Almost two out of five Germans (38 percent) share their
streaming accounts, including 23 percent within their own household, 8
percent outside the household and 7 percent both. Overall, men use
account sharing more frequently than women (40 vs. 35 percent).
Most commonly
shared up to two accounts Those respondents who share their
streaming accounts are most likely to do so with up to two accounts (64
percent), 25 percent do so with three to four accounts, 5 percent with up to
six accounts, and 3 percent with more than six accounts . Respondents
aged 55 and over say sharing up to two accounts most often (81 percent),
while sharing three to four accounts is most common (32 percent) among
respondents aged 18 to 24, the youngest age group surveyed by YouGov .
Half of the
account sharers would cancel their subscription if there were additional
costs 48 percent of those who use video
or audio streaming accounts would not be willing to pay more money for
account sharing in the future than they do now: they would cancel their
subscription if they had to pay more money for account sharing . In this
case, 26 percent would prevent account sharing in order to avoid additional
costs. A good one in six account sharers (16 percent) would accept additional
costs in order to be able to continue sharing the accounts.
March
09, 2023
784-785-43-12/Polls Every
Fourth German Can Imagine A Workation For Himself
YouGov Releases
Potential Workationer Audience Analysis Cologne, March
9th, 2023. The ITB, the world's largest travel and
tourism fair, still takes place in Berlin today. One of many topics at
the fair is "workation". The international data &
analytics group YouGov has dedicated itself to this in a target group
analysis. The term "workation" means the combination of work
("work") and vacation ("vacation"). 25 percent of Germans have not yet
done any workation, but can imagine doing so in the future. The target group
of “potential workationers” – often middle-aged and allergic to stress The “potential workationers” are significantly more common
between the ages of 45 and 54 compared to the general population (25 vs. 20
percent). In this potential group, 36 percent have a university or
technical college degree (vs. 30 percent of the total population). 75
percent of "potential workationers" say that stress makes them ill
(vs. 66 percent), 51 percent like to volunteer for a good cause in their free
time (vs. 44 percent). 88 percent say it's okay to be a father these
days (vs. 78 percent), and 79 percent say it's important to be physically
attractive (vs. 69 percent of the general German population). Half of the
potential group hopes for a better work-life balance through workation 49 percent of those Germans who can
imagine a job hope for an improved work-life balance or more free
time. Spain is their number one choice for a job (24 percent), followed
by Italy (22 percent) and New Zealand (20 percent). The current YouGov target group
analysis "Potential
Workationers" shows, among other things, the demographic
characteristics of those Germans who can imagine doing a workation. The
analysis also sheds light on the target group's attitudes towards work,
leisure and travel and shows what they expect from a workation. March
09, 2023 NORTH
AMERICA
784-785-43-13/Polls Immigrants
And Children Of Immigrants Make Up At Least 15% Of The 118th Congress
There are currently 18 foreign-born
voting members of Congress, including 17 in the House of Representatives and
one in the Senate – Democrat Mazie Hirono of
Hawaii, who was born in Japan. Together, they represent 3% of all
voting members across both legislative chambers. At least 63 additional
lawmakers – 47 representatives and 16 senators – have one or more immigrant
parent. Overall, these children of immigrants make up 12% of the House and
Senate.
Both the number and share of
foreign-born members in the current Congress are the same as in the
previous Congress. The share remains substantially below
historical highs. For example, about
8% of lawmakers were immigrants in the 50th Congress of
1887-88, during a broader wave of immigration from Europe to the United
States. The share of immigrants in the current Congress is also far below
the foreign-born
share of the U.S. population as a whole, which was 13.6% in
2021. Children of
immigrants, though, have increased their representation in Congress in
recent years. Their share has increased from 10% (or 52 members)
in the
115th Congress of 2017-18, when the Center began tracking this
biographical information. Looking at all 81 immigrants and
children of immigrants in the current Congress, Democrats make up a much
larger portion of the group than Republicans. Among the 17 senators who are
foreign born or have an immigrant parent, 12 are Democrats, four are
Republicans (Sens. Marco
Rubio of Florida, Jim
Risch of Idaho, John
Thune of South Dakota and Ted Cruz of Texas)
and one is an independent – Sen. Bernie
Sanders of Vermont, whose father emigrated from Poland.
In the House, 48 of the 64
lawmakers who are immigrants or children of immigrants are Democrats, while
16 are Republicans. The latter group includes New York Republican Rep. George
Santos, who is the son of Brazilian immigrants. However, key aspects of
Santos’ biography have been called
into question. Immigrants and children of
immigrants represent 25 states in Congress. About a quarter of these members
(26%) represent California – the largest share representing any one state.
Smaller shares represent Florida (9%), Illinois (7%) and New York (6%). There are also regional trends.
Almost half of members who are immigrants or children of immigrants (48%)
hail from states in the West – 39 members in all. The South ranks as the
second-most common region represented by this group, with 17 lawmakers,
followed by the Northeast (13) and the Midwest (12).
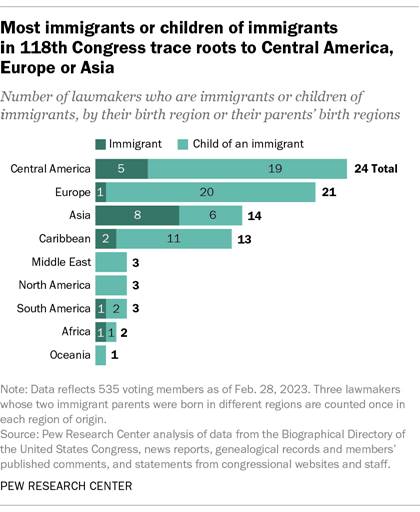
In a change from previous
Congresses, Central America has surpassed Europe as the most common origin
region for lawmakers who are immigrants or the children of immigrants.
Three-in-ten members in this group claim heritage in Central American
countries. About a quarter or fewer have roots in Europe (26%), Asia (17%)
and the Caribbean (16%). Twenty-two lawmakers who are
immigrants or have at least one immigrant parent have roots in Mexico, by far
the largest number from any one country. The next most common countries of
origin are Cuba with nine lawmakers, Germany with six and India with five.
(Some lawmakers in this analysis are tallied under more than one country and
region because their parents emigrated to the U.S. from different nations.)
Of the new members of Congress this
year, Democratic Rep. Becca Balint, whose Hungarian
father survived the Holocaust, is the first
woman and openly gay person to represent Vermont in Congress.
And Democratic Rep. Robert Garcia of California, who emigrated from Peru at
age 5, is the first
openly gay immigrant to serve in Congress. Under the U.S. Constitution, an
immigrant taking office in the House must be a U.S. citizen for seven years
or more, be age 25 or older and live in the state where they are elected.
Nine years of citizenship are required to serve in the Senate, and the member
must be 30 or older and live in the represented state when elected. FEBRUARY
28, 2023
784-785-43-14/Polls Gender
Pay Gap In U.S. Hasn’t Changed Much In Two Decades
The gender gap in pay has remained
relatively stable in the United States over the past 20 years or so. In 2022,
women earned an average of 82% of what men earned, according to a new Pew Research Center analysis of median hourly earnings of both
full- and part-time workers. These results are similar to where the pay gap
stood in 2002, when women earned 80% as much as men.
While the gender pay gap has not
changed much in the last two decades, it has narrowed considerably when
looking at the longer term, both among all workers ages 16 and older and
among those ages 25 to 34. The estimated 18-cent gender pay gap among all
workers in 2022 was down from 35 cents in 1982. And the 8-cent gap among
workers ages 25 to 34 in 2022 was down from a 26-cent gap four decades
earlier. How we did this The U.S.
Census Bureau has also analyzed the gender pay gap, though
its analysis looks only at full-time workers (as opposed to full- and
part-time workers). In 2021, full-time, year-round working women earned 84%
of what their male counterparts earned, on average, according to the Census
Bureau’s most recent analysis. Much of the gender pay gap has been
explained by measurable
factors such as educational attainment, occupational
segregation and work experience. The narrowing of the gap over the long term
is attributable in large part to gains women have made in each of these
dimensions. Related: The Enduring Grip of the Gender Pay Gap Even though women have increased
their presence in higher-paying jobs traditionally dominated by men, such as
professional and managerial positions, women as a whole continue to be
overrepresented in lower-paying occupations relative to their share of the
workforce. This may contribute to gender differences in pay. Other factors that are difficult to
measure, including gender discrimination, may also contribute to the ongoing
wage discrepancy. Perceived reasons
for the gender wage gap
When asked about the factors that
may play a role in the gender wage gap, half of U.S. adults point to women
being treated differently by employers as a major reason, according to a Pew
Research Center survey conducted in October 2022. Smaller shares point to
women making different choices about how to balance work and family (42%) and
working in jobs that pay less (34%). There are some notable differences
between men and women in views of what’s behind the gender wage gap. Women
are much more likely than men (61% vs. 37%) to say a major reason for the gap
is that employers treat women differently. And while 45% of women say a major
factor is that women make different choices about how to balance work and
family, men are slightly less likely to hold that view (40% say this). Parents with children younger than
18 in the household are more likely than those who don’t have young kids at
home (48% vs. 40%) to say a major reason for the pay gap is the choices that
women make about how to balance family and work. On this question,
differences by parental status are evident among both men and women. Views about reasons for the gender
wage gap also differ by party. About two-thirds of Democrats and
Democratic-leaning independents (68%) say a major factor behind wage
differences is that employers treat women differently, but far fewer Republicans
and Republican leaners (30%) say the same. Conversely, Republicans are more
likely than Democrats to say women’s choices about how to balance family and
work (50% vs. 36%) and their tendency to work in jobs that pay less (39% vs.
30%) are major reasons why women earn less than men. Democratic and Republican women are
more likely than their male counterparts in the same party to say a major
reason for the gender wage gap is that employers treat women differently.
About three-quarters of Democratic women (76%) say this, compared with 59% of
Democratic men. And while 43% of Republican women say unequal treatment by
employers is a major reason for the gender wage gap, just 18% of GOP men
share that view. Pressures facing
working women and men Family caregiving responsibilities
bring different pressures for working women and men, and research has shown
that being a mother can reduce
women’s earnings, while fatherhood can increase
men’s earnings.
Employed women and men are about
equally likely to say they feel a great deal of pressure to support their
family financially and to be successful in their jobs and careers, according
to the Center’s October survey. But women, and particularly working mothers,
are more likely than men to say they feel a great deal of pressure to focus
on responsibilities at home. About half of employed women (48%)
report feeling a great deal of pressure to focus on their responsibilities at
home, compared with 35% of employed men. Among working mothers with children
younger than 18 in the household, two-thirds (67%) say the same, compared
with 45% of working dads. When it comes to supporting their
family financially, similar shares of working moms and dads (57% vs. 62%)
report they feel a great deal of pressure, but this is driven mainly by the
large share of unmarried working mothers who say they feel a great deal of
pressure in this regard (77%). Among those who are married, working dads are
far more likely than working moms (60% vs. 43%) to say they feel a great deal
of pressure to support their family financially. (There were not enough
unmarried working fathers in the sample to analyze separately.) About four-in-ten working parents
say they feel a great deal of pressure to be successful at their job or
career. These findings don’t differ by gender. Gender differences
in job roles, aspirations
Overall, a quarter of employed U.S.
adults say they are currently the boss or one of the top managers where they
work, according to the Center’s survey. Another 33% say they are not
currently the boss but would like to be in the future, while 41% are not and
do not aspire to be the boss or one of the top managers. Men are more likely than women to
be a boss or a top manager where they work (28% vs. 21%). This is especially
the case among employed fathers, 35% of whom say they are the boss or one of
the top managers where they work. (The varying attitudes between fathers and
men without children at least partly reflect differences in marital status
and educational attainment between the two groups.) In addition to being less likely
than men to say they are currently the boss or a top manager at work, women
are also more likely to say they wouldn’t want to be in this type of position
in the future. More than four-in-ten employed women (46%) say this, compared
with 37% of men. Similar shares of men (35%) and women (31%) say they are not
currently the boss but would like to be one day. These patterns are similar
among parents. MARCH
1, 2023 Source: https://www.pewresearch.org/fact-tank/2023/03/01/gender-pay-gap-facts/
784-785-43-15/Polls Mental
Health And The Pandemic: What U.S. Surveys Have Found
The coronavirus
pandemic has been associated with worsening mental health
among people
in the United States and around
the world. In the U.S, the COVID-19 outbreak in early 2020 caused
widespread lockdowns and disruptions in daily life while triggering a short
but severe economic recession that resulted in widespread unemployment. Three
years later, Americans have largely returned to normal activities, but
challenges with mental health remain. Here’s a look at what surveys by
Pew Research Center and other organizations have found about Americans’
mental health during the pandemic. These findings reflect a snapshot in time,
and it’s possible that attitudes and experiences may have changed since these
surveys were fielded. It’s also important to note that concerns about mental
health were common in the U.S. long
before the arrival of COVID-19. How we did this At least four-in-ten U.S. adults (41%) have experienced
high levels of psychological distress at some point during the pandemic, according
to four Pew Research Center surveys conducted between March 2020 and
September 2022.
In addition, roughly two-thirds
(66%) of adults who have a disability or health condition that prevents them
from participating fully in work, school, housework or other activities have
experienced a high level of distress during the pandemic. The Center measured Americans’
psychological distress by asking them a series of five questions on subjects
including loneliness, anxiety and trouble sleeping in the past week. The
questions are not a clinical measure, nor a diagnostic tool. Instead, they
describe people’s emotional experiences during the week before being
surveyed. While these questions did not ask
specifically about the pandemic, a sixth question did, inquiring whether
respondents had “had physical reactions, such as sweating, trouble breathing,
nausea, or a pounding heart” when thinking about their experience with the
coronavirus outbreak. In September 2022, the most recent time this question
was asked, 14% of Americans said they’d experienced this at least some or a
little of the time in the past seven days. More than a third
of high school students have reported mental health challenges during the
pandemic. In a survey
conducted by the Centers for Disease Control and Prevention from
January to June 2021, 37% of students at public and private high schools said
their mental health was not good most or all of the time during the pandemic.
That included roughly half of girls (49%) and about a quarter of boys (24%). In the same survey, an even larger
share of high school students (44%) said that at some point during the
previous 12 months, they had felt sad or hopeless almost every day for two or
more weeks in a row – to the point where they had stopped doing some usual
activities. Roughly six-in-ten high school girls (57%) said this, as did 31%
of boys.
On both questions, high school
students who identify as lesbian, gay, bisexual, other or questioning were
far more likely than heterosexual students to report negative experiences
related to their mental health.
Mental health tops
the list of worries that U.S. parents express about their kids’
well-being, according to a fall
2022 Pew Research Center survey of parents with children
younger than 18. In that survey, four-in-ten U.S. parents said they’re
extremely or very worried about their children struggling with anxiety or
depression. That was greater than the share of parents who expressed high
levels of concern over seven other dangers asked about. While the fall 2022 survey was
fielded amid the coronavirus outbreak, it did not ask about parental worries
in the specific context of the pandemic. It’s also important to note that
parental concerns about their kids struggling with anxiety and
depression were
common long before the pandemic, too. (Due to changes in question
wording, the results from the fall 2022 survey of parents are not directly
comparable with those from an earlier Center survey of parents, conducted in
2015.) Among parents of
teenagers, roughly three-in-ten (28%) are extremely or very worried that
their teen’s use of social media could lead to problems with anxiety or
depression, according to a spring
2022 survey of parents with children ages 13 to 17. Parents of
teen girls were more likely than parents of teen boys to be extremely or very
worried on this front (32% vs. 24%). And Hispanic parents (37%) were more
likely than those who are Black or White (26% each) to express a great deal
of concern about this. (There were not enough Asian American parents in the
sample to analyze separately. This survey also did not ask about parental
concerns specifically in the context of the pandemic.)
Looking back, many
K-12 parents say the first year of the coronavirus pandemic had a negative
effect on their children’s emotional health. In
a fall
2022 survey of parents with K-12 children, 48% said the first year
of the pandemic had a very or somewhat negative impact on their children’s
emotional well-being, while 39% said it had neither a positive nor negative
effect. A small share of parents (7%) said the first year of the pandemic had
a very or somewhat positive effect in this regard. White parents and those from
upper-income households were especially likely to say the first year of the
pandemic had a negative emotional impact on their K-12 children. While around half of K-12 parents
said the first year of the pandemic had a negative emotional impact on their
kids, a larger share (61%) said it had a negative effect on their children’s
education. MARCH
2, 2023
784-785-43-16/Polls Black
Americans View Capitalism More Negatively Than Positively But Express Hope In
Black Businesses
Black Americans have long had
significantly lower
wages and household
wealth than White Americans. The roots of these inequities
trace back to the central role slave
labor once played in the nation’s economic system and the
subsequent segregation
and discrimination in labor markets. Today,
most Black adults say the U.S. economic system does not treat Black people
fairly. And though they are increasingly dissatisfied with capitalism, most
Black adults say supporting Black businesses will help achieve equality,
according to recent Pew Research Center surveys.
In an August
2022 survey, 54% of Black adults said they had a very or somewhat
negative impression of capitalism, up from 40% in May
2019. Four-in-ten Black adults held a very
or somewhat positive view of capitalism in 2022, down from 57% in 2019. Views
of capitalism also grew more negative among other racial and ethnic groups
during this period, but the movement was particularly pronounced among Black
Americans. In fact, the 2022 survey found that Black adults were the only
racial or ethnic group more likely to view capitalism more negatively than
positively, and also the only group more likely to view socialism more
positively (52%) than negatively (42%). In that survey, a quarter of Black
adults said the phrase “gives all people an equal opportunity to be
successful” describes capitalism extremely or very well. About twice as many
Black adults (49%) said this phrase does not describe capitalism well. How we did this Earlier Pew Research Center surveys
have also found broad criticisms of the U.S. economic system among Black
Americans. In an October
2021 survey, roughly eight-in-ten Black adults (79%) said economic
inequality is an extremely (54%) or very big problem (25%) for Black people
living in the United States.
In the same survey, the vast
majority of Black Americans said the U.S. economic system does not treat
Black people fairly and that major changes to the system are needed. Roughly
eight-in-ten Black adults (83%) said the economic system either needs to be
completely rebuilt (37%) or needs major changes (46%). Another 11% said the
system requires only minor changes. Yet Black Americans were
pessimistic that such changes would occur in their lifetimes. About
six-in-ten Black adults (62%) said in 2021 that these changes are a little or
not at all likely to occur. A quarter said such changes are somewhat likely
to occur, and just 12% said such changes are extremely or very likely to
occur. Most Black
Americans experience economic insecurity Many Black Americans have
experienced economic insecurity in recent years due to the financial
challenges brought on by the COVID-19 pandemic. The unemployment
rate among Black workers has long been higher than that of
other groups and remains so today, despite some improvement in recent years. In an October 2022 survey, roughly
seven-in-ten Black adults (69%) said their personal finances were in only
fair or poor shape, while just three-in-ten (31%) said their finances were in
excellent or good shape. Regardless of respondents’ age, gender and
educational background, Black adults were more likely than not to say their
personal finances were in only fair or poor health.
In October 2021, most Black adults
also said they were not financially equipped to handle economic uncertainty.
Fewer than four-in-ten (36%) said they had an emergency
fund to cover three months of expenses in case of sickness,
job loss, economic downturn or other emergencies. In the same survey, about a fifth
of Black adults (19%) said they had turned to family for financial
assistance. Instead, Black adults were more likely to have given financial assistance to
family members (39%). Black women were more likely than
Black men (43% vs. 34%) to have given money to family members, but both
groups were still far more likely to have given than received financial
assistance. Black adults with at least a bachelor’s degree (48%) and those
with some college experience and no bachelor’s (45%) were more likely to have
given money to family members than those with a high school diploma or less
education (27%). Black Americans
say supporting Black businesses will help achieve equality
Despite having generally
pessimistic views of capitalism, nearly six-in-ten Black adults (58%) said in
the October 2021 survey that supporting Black-owned businesses is an
extremely or very effective tactic for helping Black people move toward
equality in the U.S. This view was widely shared among Black adults
regardless of age and gender. There were differences by political
party and education, though. Black Democrats and Democratic-leaning
independents were more likely than Black Republicans and GOP leaners to say
supporting Black businesses helps promote equality (63% vs. 41%). Those with
at least a bachelor’s degree (63%) were also more likely than those with a
high school diploma or less education (53%) to say so. MARCH
8, 2023
784-785-43-17/Polls Eight
In Ten (79%) Canadians Believe Acts Of Violence Will Increase In Canada In
The Future
Mental Health
Impacts of COVID Thought to Play a Role in Increased Violence A strong majority (79%) of
Canadians feel that acts of violence will increase in Canada in the future,
though a lower proportion (43%) say they feel less safe where they live than
they did a year ago (with 57% disagreeing with this statement), not including
those who did not provide a response. Younger Canadians are more likely to
say they feel less safe where they live than a year ago (59% 18-34, 40%
35-54, 35% 55+). Thinking about violence in Canada
over the last year, almost six in ten (58%) Canadians feel that there has
been more violence in their community since the COVID-19 pandemic began,
excluding those who did not provide a response. When those who feel there has been
an increase in violence since COVID-19 were asked about the reasons behind
this increase, two-thirds (65%) believe the pandemic has had a negative
effect on people’s mental health, which is higher among women (71% vs. 58%
for men) and those aged over 55 (72% vs. 60%: 18-34; 62%: 35-54). Half (51%)
believe the breakdown of common values and social cohesion is the reason for
the increased violence, while a similar proportion (48%) blame economic
uncertainty (which is higher among women 55% vs. 41% for men). Elsewhere four
in ten (41%) believe unemployment is at the root of the surge in violence
(which is higher in Ontario: 52%, +11 points compared to the national
average). Meanwhile a similar proportion (39%) believe racism and
discrimination to be the problem and three in ten (28%) believe inequality is
the main explanatory factor. While Most Report
Feeling Safe in their Neighbourhood Doing Daily Activities, Some Feel Safer
than Others When asked how safe Canadians feel
with various activities or aspects of life, overall, the majority say they
feel safe walking in their neighbourhood during the day (89%, 34%
somewhat/54% very) and at night (69%), though the latter is driven by a
higher portion say they feel only “somewhat” safe (46%) rather than “very”
safe (23%). Canadians also say they feel safe living where they do in Canada
(85%, 43% somewhat/42% very) and taking a taxi or ride-share (73%, 48%
somewhat/25% very). Unsurprisingly, women are
significantly more likely to say they feel unsafe walking in their neighbourhood at night (36%
vs. 21% men) and taking a taxi or ride-share (20% vs. 12% men). Younger
Canadians (those 18-34) are also more likely to say they feel unsafe with:
Those in different regions in the
country also vary in their feelings of everyday safety. Albertans are
significantly more likely to say they feel unsafe walking in their neighbourhood
during the day (19% vs. 11% SK/MB, 10% ON, 9% QC, 8% BC, 5% ATL), and living
where they do in Canada (21% vs. 16% ON, 14% BC, 10% SK/MB, 10% QC, 8% ATL). Most Canadians
Feel Women and Immigrants Have Become Greater Targets of Violence High portions of Canadians
(excluding “don’t know” responses) agree that women (70%) and immigrants
(64%) have become greater targets of violence in the country over the last
year. Demographically, women are more
likely than men to feel that their gender has become more of a target over
the last year (77% vs. 64% men), that immigrants have also become more of a
target (69% vs. 59% men), and that they would not walk alone at night in
their neighbourhood (55% vs. 31% of men). Younger Canadians are more likely
to say there appears to be more violence in their communities since the
pandemic began (71% 18-34, 55% 35-54, 50% 55+) and that they would not walk
alone at night (54% 18-34, 38% 35-54, 40% 55+). Opinions on perceived level of
safety and changes over the last year vary by region. Those in British
Columbia, Saskatchewan and Manitoba, and Ontario are more likely to say they
feel less safe where they live than they did a year ago than those in other
regions. British Columbians in particular are most likely to feel that there
appears to be more violence in their communities since COVID-19, and Atlantic
Canadians are more likely to feel immigrants have become more of a target of
violence in Canada. By contrast, those in Quebec and
Atlantic Canada are least likely to say they feel less safe now than a year
ago. Those in Alberta are least likely to feel that women have increasingly
become targets over the last year, and that they feel there has been more
violence in their community since the pandemic began. To
what extent do you agree or disagree with the following? By
Region %
Agree, “Don’t know” responses excluded
Amidst Perceived
Increased Violence, Under Half Feel the Government is Taking the Right Steps
to Mitigate Excluding “don’t know” responses,
43% of Canadians feel the government is currently taking the right steps to
mitigate acts of violence in Canada, with 57% disagreeing. Those in Alberta are less likely to feel the government
has a proper handle on mitigating violence, whereas those in Quebec, in line
with their general optimism, are more likely
to feel it is doing so. This suggests that, in light of a sense that there
will be more violence in the future, Canadians aren’t certain the government
will act to help ensure this trend does not continue. 9
March 2023 Source:
https://www.ipsos.com/en-ca/eight-in-ten-canadians-believe-acts-of-violence-will-increase
784-785-43-18/Polls Public
Purists, Privatization Proponents And The Curious: Canada’s Three Health-Care
Mindsets
As the federal government
holds one-on-one
meetings with the country’s premiers to hash out the details
of $46-billion injection of funds into Canada’s health system, the debate
over privatization continues with some jurisdictions increasingly exploring
private care options as the new money becomes within reach. Notably, although the federal
government has been explicit that it wants the new money it releases to go
to “strengthening
the public system,” Prime Minister Justin Trudeau has
praised a move to cut wait times in Ontario by publicly
funding surgeries at private clinics. Evaluating and scoring responses
from 11 different questions about health-care delivery, the Angus Reid
Institute finds that Canadians are of three mindsets about the prospect of
increasing privatization in Canadian health care. In the middle are the Curious but
Hesitant (33%), who are sympathetic to elements of both sides of the debate.
This group finds potential value in concepts such as contracting for-profit
doctors to work in public facilities and paying for operations to be done in
the private network through Medicare. They express deep concern, however,
about just how far to go, citing concerns about the access of low-income
Canadians, and the potential exacerbating of staffing shortages. As this discussion evolves,
definitions are important. Many Canadians are at odds over just what
constitutes “privatization” of health care. Though Ontario is the latest
province to publicly fund surgeries at private clinics to help eliminate the
lengthy wait lists caused by the COVID-19 pandemic, Alberta and Saskatchewan had
previously done the same. Half (51%) of Canadians say this decision by these
three provinces does constitute privatization. However, one-third (33%)
disagree. Where there is more consensus is on
the concept of individuals paying out of pocket for treatment. This is viewed
as privatization seven-in-ten (71%) of Canadians. One-in-five (18%) disagree,
and another one-in-ten (11%) are unsure. On both concepts – publicly funding
surgeries at private clinics and patients paying out-of-pocket for needed
treatments – there is delineation among the three health-care mindsets, but
not complete agreement. Nearly all (89%) of Public Health Purists believe the
latter should be defined as privatization. More than half (55%) of Private
Care Proponents agree, but one-third (36%) say that is not privatization. There is more division among those
groups of Canadians on the issue of publicly funding surgeries at private
clinics. Most Public Health Purists (71%) say this is privatization but
one-in-five (19%) disagree. There is less consensus among the Curious but
Hesitant (39% say it is privatization, 34% not) and Private Proponents (38%,
52%). More Key Findings:
About
ARI The Angus Reid Institute (ARI) was
founded in October 2014 by pollster and sociologist, Dr. Angus Reid. ARI is a
national, not-for-profit, non-partisan public opinion research foundation
established to advance education by commissioning, conducting and
disseminating to the public accessible and impartial statistical data,
research and policy analysis on economics, political science, philanthropy,
public administration, domestic and international affairs and other
socio-economic issues of importance to Canada and its world. INDEX Part One: The
health care debate
Part Two: What is
private care?
Part Three:
Gauging private care options
Part Four: The
arguments for and against privatization
Appendix
Part One: The
health care debate
Click for Full-Size Image After years of challenges and
little sign of abatement, Canadians are clearly
worried about health care. The road to fixing Canada’s health-care
system may be a long one, but many are hoping for improvement as a much-anticipated
$46-billion funding deal from the federal government was
agreed upon by the provinces and territories. But it may only be a
start – the premiers are asking for regular reviews of health-care
funding and say the new money is not
enough to address all of the needs of their health-care
systems. All parties involved will now turn
their attention to finalizing individual
bilateral agreements with the federal government to receive
their additional health transfers. Five
of these deals have been agreed to already. As this unfolds,
provinces continue to explore privately-delivered,
but publicly-funded, health care, leading some to question
just where
this new funding will go. Private care already exists in
Canada in many forms. In British Columbia, a person can pay outside of the
public system for an MRI, CT scan, or ultrasound. In Ontario,
the government has introduced plans to offload more public care into the
already existing private marketplace – though procedures eligible for this
transfer would be covered
by the Ontario Health Insurance Plan. Notably, in
one of the earliest cases of private clinics being allowed to
perform surgeries covered by the public health system, Quebec lifted the ban
on private health insurance for total hip replacement, knee replacement and
cataracts in the wake of the 2005 Supreme Court case Chaoulli
v. Quebec. Debates about health care in Canada
tend to volley back and forth between privatization and public care – one
side or the other. The Angus Reid Institute used responses from 11 different
questions about health-care delivery, scoring respondents on their support or
opposition to private care, and developed three Health-Care Mindsets that go
beyond the black and white. For Index scoring, please view the Appendix. Health Care in
Canada: Three Mindsets: Public Health
Purists, Curious but Hesitant, Private Care Proponents – who are they? Broadly speaking, there are three
groups in Canada when it comes to views of health care and privatization.
There are:
All three mindsets are found across
age, gender, income, education and political demographics. That said, each
mindset is home to unique characteristics: Public Health
Purists
Private Care
Proponents
Curious but
Hesitant
Part Two: What is
private care? The Canadians who championed
universal public health care, Tommy Douglas, Lester B. Pearson, Woodrow
Lloyd, and others are
fondly remembered for the legacy they helped to establish.
But the picture in Canada is changing as the health care crisis persists. Since the landmark Chaoulli
v. Quebec Supreme Court in 2005, Canadian provinces have begun
tapping the private system to provide health-care services historically offered
by the public system. Ontario is the latest province to allow private clinics
to perform surgeries. Premier Doug Ford’s government believes private clinics
can help combat the lengthy waitlists that are a legacy of the early part of
the COVID-19 pandemic. Critics, including the opposition Ontario NDP, have
raised the alarm, warning the province is on a path to a two-tiered, “American-style
model” health-care system, prioritizing
care for the rich at the expense of poor Ontarians. Disagreement over
definitions However, there is a distinct lack
of consensus over what “privatization” means. It’s important that public
health figures and politicians understand and reflect this in discussions. To further this point, researchers
at ARI asked respondents to tell us whether examples of health-care delivery
represent privatization to them or not. See the first example below: “There’s been a
lot of discussion, but less agreement about what it means to “privatize”
health care in Canada. Some people say it means patients paying out of their
own pockets to receive needed treatment. Others say user fees are already
part of the health-care system and this is not what’s meant by privatized
care.” The first question asks about the
concept of paying out of pocket for health care. This concept is perceived as
privatization by most Canadians, including a majority (55%) of Private Care
Proponents. One-in-five (18%) say this doesn’t necessarily represent
privatization, because user fees are already a part of the health-care
system:
A second example asks about the
concept being explored in Ontario currently, using third party private
clinics to perform care which is paid for through the public system. “Some people say
when any third party outside of the provincial health system delivers medical
care – and it is paid for with public funds – that represents privatized
health care, because it’s not being delivered by government. Other
people say using public funds to pay third parties to perform health-care
services, such as diagnostic tests or surgeries – does NOT represent the
privatization of health care.” On this concept, Public Health
Purists and Private Care Proponents disagree, while the Curious but Hesitant
lean slightly toward saying that this represents privatization (39%), but
with significant groups both in disagreement (34%) and unsure (27%).
Half say more
private care will worsen the system; one-in-three say it would help There is no consensus from
Canadians that a shift in approach would help the current conditions.
Overall, close to half (45%) say that more private care will only worsen the
situation. More than one-in-three (36%) feel that increased private delivery
will help. Those who are proponents of either public or private care lean
heavily to their own side of the debate on this question, while the Curious
but Hesitant are most likely to be uncertain:
Questionnaire order is important.
The Angus Reid Institute asked half of respondents this question about
private care helping or hurting their province at the beginning of the
survey, before discussing some prominent examples of privatization in
Australia, Germany, and the United Kingdom. The other half were asked this
question after this discussion took place. Those who went through the foreign
examples first are less likely to feel privatization would worsen care (see
the full questionnaire):
Despite the large part it plays in
the legacy
of Medicare, Saskatchewan is home to the highest levels of
enthusiasm about what privatization could potentially bring to the
health-care system. Much of the rest of the country is deeply divided:
Part Three:
Gauging private care options With so many Canadians evidently
unsure of what constitutes privatization, concrete examples of hybrid systems
in other countries were then presented to gauge support. What if your
province allowed pay-for-access? As wait times continue to increase,
Canadians are seeking private care for operations like knee and hip
replacements. While the price tag can be in the tens of thousands of dollars,
the juice is evidently worth the squeeze for some. While this band of care
already exists in Canada, debate over its expansion continues to occupy many
political leaders, advocates, and policy makers. Canadians themselves are divided.
More than two-in-five (43%) say that allowing patients to pay out of pocket
for faster access to some surgeries is fine with them, while slightly more
oppose this (47%). Notably, however, this idea is supported at higher levels
than it is opposed in every region other than Ontario:
The Public Health Purists are
heavily against the idea of paying to step out of the public queue, while
Private Care Proponents near-unanimously support it. The Curious, are, true
to form, open to the idea, but only so much:
For some, there is a time aspect to
this debate. Two-in-five (40%), the largest group, say that they support an
expansion of private care in the short term only as a tactic to clear the
backlog of surgeries and tests. Just 38 per cent say this is fine either in
the long term or in both the short and long term, while one-in-five (22%),
including half of Public Health Purists (48%) say this is inappropriate at
all times:
Health-Care
Delivery in Other Countries Australia Health care is delivered in myriad
forms, with different financing models, policies, and delivery systems from
country to country. Many countries have incorporated private care into a
hybrid public-private system. The Angus Reid Institute tested several of
these concepts to better understand where exactly Canadians draw the line. Australia is ranked by the
Commonwealth Fund as having among the best health care in the world
across 71
different measurables. That country also utilizes a hybrid system.
The concept of purchasing private health insurance in order to access
services that are not offered by the public system, and to have access to
private hospitals, is something that divides Canadians. Asked if they would
support this model in their own province, 46 per cent say yes and 42 per cent
say no. Another aspect of the Australian
system receives more support. Doctors in Australia who work primarily in the
private sector are eligible to do contract work in public care as well, if
they so choose, allowing governments to increase available care if needed.
Thinking again about their own province, three-in-five (60%) would allow this.
In Canada, this
is currently forbidden – doctors can go private, but have to
opt out of the public system.
United Kingdom The National Health Service in
England has taken a battering in recent years, both in outcomes
and public opinion. That country, too, continues to debate
privatization, though only about seven
per cent of public health expenditures are allocated to the
private sector. (Notably, this
is lower than Canada, where 30 per cent of the money spent on
health goes to the private system.) In the U.K., there are, however, private
hospitals where some services are available. Half of Canadians support this
concept for their own province, including 62 per cent of the Curious but
Hesitant:
Germany Another concept reveals the divide
over perceived unequal access to health care based on income. In Germany,
every citizen must have health insurance – most of which is through the
public care network. That said, Germans who earn above a certain income
threshold are able to opt out and purchase a private option. This latter type
of insurance covers more services and includes access to private hospitals.
As such, those with higher incomes and private insurance tend
to have better health outcomes. This dual system is deeply unpopular
with Public Health Purists – nine-in-ten of whom reject the idea for their
own province. Further, those who are Curious but Hesitant are also more
likely to oppose this, though by a slim margin. Overall, one-in-three (36%)
support the German concept while half (52%) reject it:
Part Four: The
arguments for and against privatization There appear to be two significant
causes of consternation for those who either oppose privatization or are on
the fence about it: access for low-income individuals and the potential
exacerbation of already considerable challenges surrounding staffing
shortages. Low-income access,
staffing shortages At least 62 per cent in every
region say that they worry about access for lower-income Canadians, and
seven-in-ten (71%) say this overall. A similar amount (68%) are worried that
expanding private care will only worsen staffing shortages, which have
plagued the country’s health-care system in recent years:
Herein lies the root of the
“Hesitant” in the group named Curious but Hesitant. While they are generally
more supportive of private solutions than the Public Health Purists, they are
far more worried about the potential consequences of that transition than
Private Care Proponents:
Innovation and
productivity Proponents of private health care
often speak to the potential for innovation and productivity gains
if for-profit actors are allowed to enter the space. While there is some
evidence for efficiency gains in research published
by National Center for Biotechnology Information – part of the
United States Library of Medicine and funded by the U.S. government –
Canadians tend to be less sold on these concepts in their own health-care
system. The majority feel that privatization would not increase productivity
in health care (56%), though 42 per cent do say that they feel medicine would
see greater levels of innovation if private care were increased:
Evidently, many would like to see
their own public system improved, with adequate staffing and investment
levels. The provinces continue to negotiate with the federal government on
the next decade’s worth of health-care funding, all the while a significant
proportion of Canadians feel some are dragging their feet to make
privatization appear a better option. This is a particularly strong opinion
in Ontario and Manitoba, while British Columbians disagree at the highest
levels:
February
27, 2023 Source: https://angusreid.org/health-care-privatization-perspectives/
784-785-43-19/Polls China,
Canada And Challenging Diplomacy: Two-In-Three Canadians Believe Beijing Did
Attempt Election Interference
The latest allegations to strain
an already
challenged diplomatic relationship between Ottawa and Beijing
have a majority of Canadians of the belief the Chinese government did indeed
attempt to interfere in the 2019 and 2021 federal elections, while demanding
a stronger response from the federal government on the issue. These are the latest findings of a
new public opinion survey from the non-profit Angus Reid Institute. Amid allegations Beijing attempted to influence the outcomes of both the 2019 and
2021 elections to ensure the federal Liberal Party formed a minority
government over the opposition Conservatives, two-thirds of adult Canadians
express belief that Beijing “definitely” (32%) or “probably” (33%) tried to
meddle. Past Conservative Party voters are
most likely to view the Chinese government’s attempts as successful, with a
plurality (42%) saying they “feel the election was stolen” in 2021. It should
be noted however, that the allegations of interference involve fewer seats
than could have swayed
the result in parliament. What is less equivocal, however, is
the view the federal government is not doing enough to safeguard Canada’s
security and defence. Two-thirds (64%), including majorities of past
Conservative (88%) and Liberal (52%) voters alike, say Ottawa needs to put
additional focus on this area.
More Key Findings:
About
ARI The Angus Reid Institute (ARI) was
founded in October 2014 by pollster and sociologist, Dr. Angus Reid. ARI is a
national, not-for-profit, non-partisan public opinion research foundation
established to advance education by commissioning, conducting and
disseminating to the public accessible and impartial statistical data,
research and policy analysis on economics, political science, philanthropy,
public administration, domestic and international affairs and other
socio-economic issues of importance to Canada and its world. INDEX Part One: The ‘spy
balloon’ and allegations of election interference
Part Two: Canada’s
response
Part One: The ‘spy
balloon’ and allegations of election interference It has already been an eventful
year for Canada-China relations. On Jan. 28, a Chinese spy balloon was
spotted over Alaska. It eventually flew over the Yukon and B.C. before its
course took it across the United States, where it was eventually
downed off the coast of South Carolina. Recent weeks have also brought
explosive allegations that China’s government in Beijing made attempts to
influence Canadian elections in 2019 and 2021. Global
News reported that in the 2019 election, officials with the
Canadian Security Intelligence Service believe at
least 11 Toronto-area candidates were supported by Beijing,
including sitting Liberal MP Han Dong, who CSIS officials believe
received help to win the Liberal nomination from the Chinese
consulate. Dong has denied
the accusations. As well, in 2021, CSIS
reports viewed by the Globe and Mail allege Beijing attempted
to influence that election with the goal of bringing back a Liberal minority
government and defeating Conservative politicians viewed as unfriendly to
China. Though the details are new, the
broad accusations are not. In December, the
Globe and Mail reported that government was warned in 2020 of
“subtle but effective interference networks” employed by China during the
2019 federal election. In June last year, former Conservative party leader
Erin O’Toole alleged interference from China cost
his party seats in the 2021 election. In response, a CSIS
official told a House of Commons committee in
November that there was “activity of foreign interference”
but it did not meet “the threshold of impacting the overall election
integrity.” Half of Canadians (52%) say they
have been following coverage of allegations of interference by Beijing in
Canadian federal elections closely, while two-thirds say the spy balloon
story is one they have been tracking (see
detailed tables). Two-thirds believe
Beijing likely attempted election interference As details emerge, Canadians are
more likely to believe there was an attempt by China to interfere with recent
Canadian elections than not. Two-thirds (65%) believe that was “definitely”
(32%) or “probably” (33%) the case. Few (6%) reject the concept outright. Those who voted for the alleged
aggrieved party in the 2021 election – the CPC – are more convinced there has
been attempts at election interference by China than those who voted Liberal
or NDP. However, majorities of past Liberal (64%) and NDP (58%) voters say
Beijing likely tried to influence recent elections:
*Smaller sample
size, interpret with caution Those in B.C. (68%) and Ontario
(68%) – two of
the provinces where
the alleged interference supposedly took place – are among the most likely to
believe there “probably” or “definitely” were attempts to interfere with
recent Canadian elections by Beijing. Residents of Alberta (70%) and
Saskatchewan (68%) – two provinces that are typically Conservative
strongholds – are also more likely than other provinces to believe the Chinese
government tried to interfere in Canadian elections:
Canadians who identify as a visible
minority are most likely to push back on the idea that China has interfered
(31% do so) but a majority among this group still say it probably or
definitely took place:
Half say potential
interference ‘a serious threat’ to Canada’s democracy The allegations that Chinese
election interference represents a threat to Canadians’ security and
democracy are not new. Innumerable examples of
this line of reasoning have been published in
recent years, and Prime Minister Justin Trudeau stated in November of last
year that China has been playing “aggressive
games” in its attempts to undermine elections in Canada. One-quarter (23%) say that media
and politicians have been overplaying the potential threat, while more than twice
as many (53%) say they consider Chinese election interference to be a
credible and serious threat to democracy. Past Liberal and NDP voters lean
toward considering the threat serious, but are much more divided than past
CPC and Bloc voters:
Men of all ages are more likely
than women to say that this is a serious threat that must be addressed:
Was the election
‘stolen’? The allegations of Chinese
interference in the last two federal elections have some Canadians
questioning the very integrity of the votes. This sentiment has been
expressed by Canadians prior to many of these allegations coming to light. In
February last year, Angus Reid Institute data found one-third (34%) believed
free and fair elections were getting weaker in Canada, outnumbering those who
instead believe that that part of democracy was growing stronger (23%). One-quarter (23%) of Canadians
believe the 2021 federal election was “’stolen’ because of Chinese
interference.” More than twice as many Canadians, however, disagree (49%).
The belief the election was illegitimate is stronger among past Conservative
voters, who are more likely to agree (42%) than disagree (33%) that the
election was “stolen.” It’s worth noting that after the
votes were counted in the 2021 election, the Conservatives trailed the
Liberals by 36 seats. CSIS is alleging Chinese interference in at
most half a dozen seats in Vancouver and Toronto.
Part Two: Canada’s
response Most Canadians
want stronger federal response NDP leader Jagmeet Singh, whose
party is currently supporting the Liberal minority government through a
supply-and-confidence agreement, called
for a non-partisan public inquiry into the alleged election
interference by China. So far, Trudeau
has ruled out a public inquiry and welcomed the current
examinations by House of Commons committees. More broadly, Canadians would like
to see a stronger response to China from the Liberal government. Relations
between the two governments have been strained in recent years, particularly
after the detention of Michael Kovrig and Michael Spavor by Chinese
authorities in response to the arrest of Meng Wanzhou by Canada at the
request of the United States. Trudeau and Chinese President Xi Jinping spoke
at a G20 meeting in November, where Xi accused Trudeau of leaking details
from their previous conversation to the media. The two had a reportedly
testy exchange in public view. Past Liberal and NDP voters are
most likely to say that the government has responded adequately to recent
security and election concerns, while past CPC and Bloc Québécois voters
disagree, and would like the government to take a more aggressive approach:
*Smaller sample
size, interpret with caution Majority want more
focus on national security, defense With recent examples of alleged interference
fresh in the headlines, and the ever-present concern
of Russian aggression to add to it, Canadians have national
security and defense top of mind. Two-thirds (64%), including majorities of
past Conservative (88%) and Liberal (52%) voters alike, say that the federal
government should put additional focus on this area:
*Smaller sample
size, interpret with caution This sentiment is offered by a
majority of all age and gender groups, with the exception of women aged 18-
to 34-years-old who are most likely to say they “don’t know”:
Seven-in-ten say
Canada is afraid to stand up to China Underlying much of this sentiment –
that the government needs to take a harder line against Chinese interference
– is that many Canadians feel their government is afraid to stand up to the
global economic powerhouse that is China. Exports to China continue to drop
– now
a multi-year trend – and some suggest that the government’s
new Indo-Pacific
strategy designed to target markets in Asia will anger China
further, potentially diminishing the relationship further:
*Smaller sample
size, interpret with caution The economic consequences of
angering the Beijing regime are a source of consternation for any federal
government in Canada. China remains Canada’s second
largest national trading partner and 46 per cent of Canadians
worry about the economic fallout from any direct opposition to Chinese
interests. Those in Quebec (51%), Atlantic Canada (48%) and Ontario (48%) are
more worried about this than those in other provinces. Ontario imported
nearly $50 billion worth of goods from China in
2021, and Quebec more than $12 billion. Both provinces trail
British Columbia when it comes to goods exported to China,
however.
Worry over
economic consequences of standing up to China declines The trend, however, suggests that
Canadians are perhaps less worried about standing up to China now than they
were last year. The Angus Reid Institute notes a 12-point drop in the
percentage of the population voicing this concern between January of last
year and now:
March
1, 2023 Source: https://angusreid.org/china-canada-election-influence-interference-trudeau-spy-balloon/
784-785-43-20/Polls Lacking
The Will: Half Of Canadians Say They Don’t Have A Last Will And Testament,
Including One-In-Five Aged 55+
In 1948, Cecil George Harris
suffered a
tragic mishap while plowing his fields near Rosetown, Sask.
He became pinned under his tractor. Fearing he wouldn’t make it, he etched
“In case I die in this mess I leave all to the wife. Cecil Geo Harris.” He
died the next day, and the tractor etching was accepted as a valid
handwritten will. The case set a famous precedent for lawyers the world over. It appears age is not the only
factor in play when it comes to which Canadians do not have a will. Those
living in lower income households are less likely to say they have taken this
step and a lack of assets to worry about is a much more common reason. Those
whose household incomes are below $100,000 are twice as likely as those above
that mark to say they simply lack the assets that would push them to write a
will. About
ARI The Angus Reid Institute (ARI) was
founded in October 2014 by pollster and sociologist, Dr. Angus Reid. ARI is a
national, not-for-profit, non-partisan public opinion research foundation
established to advance education by commissioning, conducting and
disseminating to the public accessible and impartial statistical data, research
and policy analysis on economics, political science, philanthropy, public
administration, domestic and international affairs and other socio-economic
issues of importance to Canada and its world. INDEX
Who has a will? In Canada, if you die without a
will, it’s called dying “intestate.”
When that happens, your money, assets and debts are put into an estate and a
court-appointed representative closes your financial affairs and distributes
your assets according to the rules and regulations of your province.
This can
vary significantly in each province, though in most cases
assets pass to spouses, partners or along the family tree. Besides a loss of
control over a dispersal of asses, there is also potential significant
tax burdens that can be passed on if individuals die
intestate. Half of Canadians say they do not
have a will, while a further one-in-eight (13%) has one that is out of date.
Approaching two-in-five (37%) Canadians say they have an up-to-date last will
and testament. These figures are near identical to
those seen in
2018, the last time Angus Reid Institute surveyed Canadians on
this issue.
Men (50%) and women (49%) are
equally as likely to say they have a will. Younger Canadians are much less
likely to have a will than older ones. However, half (49%) of Canadians aged
55 to 64 say they have an up-to-date will. That proportion rises to
seven-in-ten (71%) of those aged 65 and older:
*Smaller sample
size, interpret with caution While there is little regional
variation when it comes to whether Canadians have a will, those in Manitoba
(32%) and Saskatchewan (34%) are the least likely to say theirs is up to date
(see
detailed tables). Canadians in lower income
households are less likely than those in higher income ones to say they have
a will. Approaching two-thirds (63%) of those living in the lowest income
households say they do not have a will:
*Smaller sample
size, interpret with caution What’s keeping
Canadians from having a will written? There are myriad reasons to not
have a will written. For Canadians, the top selected reason is they feel they
are simply too young to need one. One quarter (24%) say this, including half
(50%) of those aged 18- to 34-years-old. One-in-six (16%) say they don’t
have any assets worth worrying about. For Canadians over the age of 54
who do not have a will, the most selected reason is that it’s too expensive
to get a will written (26%). It’s worth noting that there are many free
or lower cost services to create simple wills online, though
those with more complicated situations may still require the services of a
lawyer. Finally, for one-in-ten Canadians
over the age of 34 without a will, they don’t want to think about the
inevitability of death:
The time-consuming nature of
writing a will is more of a issue for Canadians living in high income
households (12%) than those living in households earning $50,000 or less
annually (6%). Perhaps that is an issue because higher income households are
likely to have more assets, complicating a potential will. Indeed, a lack of
assets is cited less as a reason for not having a will for those in
households earning six figures annually (9%) than others.
March
7, 2023 Source: https://angusreid.org/canada-will-testament-intestate-dying-without-will/
784-785-43-21/Polls Islamophobia
In Canada: Four Mindsets Indicate Negativity Is Nationwide, Most Intense In Quebec
To clarify the picture further, the
Angus Reid Institute created the “Views of Islam Index”. Respondents were
asked six questions about five religions – Islam, Christianity, Sikhism,
Hinduism, and Judaism. The dimensions measured included:
For the purpose of this analysis
and given the ongoing
discussion about the level of Islamophobia in Quebec and
elsewhere in Canada, responses to this national survey were analyzed
according to the level of positivity or negativity towards Muslims across all
six question areas. Four groups were created, those with Very Positive,
Positive, Negative, and Very Negative views of Islam. A comparison of Quebec with the
rest of Canada reveals stark differences. Outside of Quebec, Very Positive
and universally accepting views of Muslims and their religious symbols are
evident in 37 per cent of the population. A further one-quarter (27%) hold
generally positive views but not in all circumstances assessed in the study.
On the other end of the spectrum 16 per cent of Canadians outside Quebec hold
Very Negative views on Islam and religious practices of this faith in nearly
every circumstance assessed in the survey. In Quebec, positive views are more
muted but still represent almost half the attitudinal landscape with
one-in-five (20%) displaying Very Positive views and a further one-quarter
(25%) on the generally positive side of the index. That said, the largest segment of
the population in Quebec (30%) displays Very Negative views toward Islam. The
level is about twice that observed in the rest of the country (16%). This
“Very Negative” segment in Quebec is similar to the group of the same name in
the rest of Canada with one important exception: among this group in Quebec
there is a distinct level of negativity towards Judaism and Christianity that
is less prevalent elsewhere in the country. Amid this, Quebec’s Bill 21
continues to be supported by more than half in that province (57%). That law,
which prohibits the wearing of religious symbols for individuals in certain
public positions of authority while they are on the worksite, is unpopular in
the rest of the country with one-in-four (25%) supporting the concept for
their own province and two-thirds (65%) opposing it. Cliquez
ici pour lire le rapport complet en français
More Key Findings:
About
ARI The Angus Reid Institute (ARI) was
founded in October 2014 by pollster and sociologist, Dr. Angus Reid. ARI is a
national, not-for-profit, non-partisan public opinion research foundation
established to advance education by commissioning, conducting and disseminating
to the public accessible and impartial statistical data, research and policy
analysis on economics, political science, philanthropy, public
administration, domestic and international affairs and other socio-economic
issues of importance to Canada and its world. INDEX Part One:
Canadians more negative toward Islam than other faiths
Part Two: Views of
Islam Index
Part Three: How
negative views of Islam correlate with other beliefs and opinions
Part One:
Canadians more negative toward Islam than other faiths In late January, Prime Minister
Justin Trudeau announced the
appointment of Canada’s first special representative on combatting
Islamophobia. Journalist and human-rights activist Amira Elghawaby was chosen
for the position to “support and enhance the federal government’s efforts in
the fight against Islamophobia, systemic racism, racial discrimination, and
religious intolerance.” Activists and government officials
have been concerned in recent years as
attacks against Muslims in Canada have risen, including a 71
per cent increase from 2020 to 2021. This violence was most tragically
evident in
2017 when six individuals were killed at a mosque in Quebec
City. While higher profile violent events
gather headlines, many Canadians hold a more muted negative perspective
towards Islam. Across the country Canadians are least likely to hold
favourable views of Islam than five other major religions. In Quebec,
one-quarter (25%) view the Muslim faith favourably, however, nowhere in the
country does this number exceed 37 per cent:
Unfavourable views are also more
common in Quebec for most faiths, but the rest of the country, too, is not
immune from these perspectives, particularly when it comes to Islam:
Using a net favourability score,
those who view each faith positively versus negatively, Canadians’ more
unfavourable perspective of Islam than other religions is clearly delineated:
Religious symbols
in public and at work When it comes to religious symbols
or clothing in public spaces, Canadians are generally permissive. A majority
in all regions are supportive of the Star of David, kippa, nun’s habit,
crucifix, turban, and hijab. That said, Quebec residents are least likely to
support each, and slightly more than half (55%) say they support the wearing
of the hijab in public. This has significant consequences for the hundreds
of thousands of Muslim women living in Quebec and Canada
alike:
But what about in the workplace?
Canadians were also asked if they would be comfortable with a co-worker
wearing these symbols. Quebecers push back on the acceptability of the turban
and hijab most, with two-thirds voicing comfort for each, and show a unique
aversion to the Jewish kippa not noted elsewhere in the country:
Two-thirds would
be comfortable with a mosque in their neighbourhood Canada is home to thousands of
places of worship, so it is perhaps unsurprising that the vast majority of
Canadians are comfortable with churches, synagogues, temples, and mosques in
their own neighbourhood. Quebec residents are least likely to be comfortable
with each of the six examples shown, but a majority say they’re comfortable
with each:
Belief systems and
marriage One of the more pronounced areas of
discomfort for Canadians is evident when considering marriage. Asked if it
would be acceptable for their child to marry a follower of each faith,
responses vary considerably. Canadians are least likely to say they would
accept their child marrying a Muslim:
Part Two: Views of
Islam Index To consolidate some of these
sentiments, Angus Reid Institute researchers created a Views of Islam Index.
This index uses positive and negative scores from six different questions
pertaining to Islam to allocate Canadians into groups holding Very Negative,
Negative, Positive, and Very Positive views. For more details on the
Index click
here. Regional
perspectives Outside of Quebec, close to
two-in-five Canadians (37%) hold a Very Positive view of Islam. In Quebec
this number drops to one-in-five (20%). The number of Quebecers holding a
Very Negative view of Islam is twice as high (30%) as it is in the rest of
the country (16%). Views are most negative outside of Montreal:
Albertans, Ontarians, and Atlantic
Canadians are most likely to view Islam in a Very Positive light:
Bloc Québécois,
CPC supporters most negative Politically, there are two groups
that are vastly more likely to hold negative views of Islam. In Quebec, half
of the Very Negative group is comprised of past Bloc Québécois voters. In the
rest of Canada, three-in-five of the Negative and Very Negative supported the
Conservative Party in 2021. Note that the vote totals here do not match the
Canada-wide federal election totals because of the oversample in Quebec:
Age, gender and
education In Quebec, the distribution between
all groups is near-even between men and women. In the rest of Canada, those
with negative views of Islam are more likely to be male (see
detailed tables). In both portions of the sample – those in Quebec
and those outside – age is a considerable factor. Older residents are much
more common in the negative groups than the positive ones along the Index:
Those with Very Positive views of
Islam in both Quebec and the rest of Canada are twice as likely to have
university education than the Very Negative:
Part Three: How
negative views of Islam correlate with other beliefs Bill 21 Quebec’s “Act respecting the
laicity of the State”, or
Bill 21, is a statute that prohibits the wearing of religious
symbols for individuals in certain public positions of authority while they
are on the worksite. Passed in 2019, recent
research has shown that the law has, in fact, increased
feelings of alienation and discomfort among Muslims in the province. Canadians across the country were
asked how they feel about this type of law in their own province (Quebecers
were asked if they support or oppose the current law). Those who are most
unfavourable to Islam are overwhelmingly in favour of Bill 21, but that
enthusiasm drops off significantly among the Negative, Positive, and Very
Positive in the rest of Canada.
Overall, outside of Quebec the
concept of Bill 21 is unpopular. Two-thirds (65%) oppose it while one-quarter
(25%) offer support. In Quebec, nearing three-in-five (57%) support the act,
while one-in-three (35%) are opposed:
Views of other
faith groups, religious symbols Islam is evidently the most likely
belief system to face criticism in Canada but those who view the faith
disapprovingly are also more likely to view other groups with negativity.
Consider that in both Quebec and the rest of Canada, three-in-five of those
with Very Negative views of Islam also view Sikhism unfavourably. However,
those classified as Very Negative on the index in Quebec are also much more
critical of Judaism and Christianity than those in the rest of Canada:
The Very Negative toward Islam are
much more resistant of public displays of religious symbols than those in the
three other groupings. Notably, the burka and the kirpan are highly opposed
among the Negative and Positive as well, but other symbols like the hijab and
turban cause much less consternation for these latter groups than the Very
Negative:
The Very Negative show much higher
levels of aversion to places of worship in their communities than others,
both in Quebec and in the rest of Canada. Meanwhile, the Very Positive toward
Islam have little to no problem with any faith group building and practicing
in their neighbourhood:
Does Canada have
an anti-Muslim issue? Much of the debate since the
appointment of Amira Elghawaby as special representative on combatting
Islamophobia has centered on whether this is truly a problem in Canada. In
2017, the House of Commons passed
a non-binding motion to condemn Islamophobia and other
religious discrimination. Nearly all NDP and Liberal MPs voted for the motion
while most Conservatives – including current leader Pierre Poilievre – voted
against it. Opinions on this issue are divided
in near exact proportions. Half of Canadians say that Canada has a serious
anti-Muslim problem to reckon with and half say it doesn’t. Notably, those
with the most negative views towards Muslims in Canada are by far the most
likely to say that this is not an issue:
From a purely regional standpoint,
those in Saskatchewan and Manitoba are most likely to say that this issue has
been overblown, while residents in Quebec are closely divided:
Combatting
Islamophobia? While half of Canadians see a
problem with anti-Muslim discrimination in their country, fewer are certain
that the position of a special representative to combat Islamophobia is
necessary. Even for those with the most positive views of Islam are nowhere
near unanimous on this question. Two-in-five (44%) say this is an unnecessary
job to create (see
detailed tables). Nowhere in the country do a
majority of Canadians feel that Canada needs an anti-Islamophobia ambassador.
Outside of Quebec opinions are divided evenly, with one-in-five (21%)
Canadians saying they’re not sure:
March
13, 2023 Source: https://angusreid.org/islamophobia-canada-quebec/ AUSTRALIA
784-785-43-22/Polls Think
News Brands And Roy Morgan Total News Figures Show 20.6 Million Australians Over
The Age Of 14 Engage With News Every Month
Australia’s trusted masthead brands
continue to command large audiences, as demonstrated by the below table. TOP 10 MOST-READ
NEWS BRANDS
ThinkNewsBrands
General Manager Vanessa Lyons said: “The latest Total News readership figures
demonstrate how much of a deeply ingrained daily habit news is in the lives
of Australians; news has a consistent and enduring appeal for most of the
population. The figures underscore the importance of news, particularly
during challenging economic times when trustworthy and reliable information
is crucial.” Demographically, Total News
continues to engage audiences across all age groups including the
hard-to-reach under-40s. READERSHIP DEMOGRAPHICS
February
27, 2023 Source: https://www.roymorgan.com/findings/9171-thinknewsbrands-readership-december-2022 784-785-43-23/Polls Four
In Five Shoppers Believe Buying Australian-Made Is Important
The research also found that buying
Aussie products made shoppers feel good. Roy Morgan CEO Michele Levine said
that buying Australian-made drives a strong emotional response in consumers,
with many Australians saying they feel positive or proud when they buy
Australian-made. “A large majority
of four in five Australians indicated feeling a positive emotion when they
buy Australian-made products. Generally, people feel positive that they are
able to support Australian jobs, with supporting ethical practices also a key
reason Australians feel good about buying Australian-made, particularly for
those aged under 35,” said Levine. Almost all (99%) Australians aged
18 and over are aware of the Australian Made logo, with the logo having the
highest recognition of any certification mark in Australia. Trust in the
Australian Made logo is also high. 93% of Australians are confident products
displaying the mark are made or grown in Australia. Levine advised Australian consumers
trust the Australian Made logo because they know products displaying it have
been made in Australia and are perceived to be of a high quality, safe and
reliable. “Australians
place their trust in the logo because it is well known and has a long history
of representing Australia. They trust the products displaying it have been
independently certified as authentically Australian-made. The high level of
trust in the Australian Made logo compares favourably to other certification
marks and to the most trusted brands in Australia from Roy Morgan’s ongoing
Risk Monitor, which tracks trust and distrust of around 1,000 brands each
year.” In the research, consumers
associated the following attributes with the Australian Made logo -
supporting local jobs and employment (97%), safe (94%), high quality (94%),
reliable (93%), use of ethical labour (90%), good value (85%), sustainable
(80%), expensive (80%) and environmentally friendly (80%). Australian Made Chief Executive,
Ben Lazzaro said these latest results are pleasing but come as no surprise,
with the Australian Made logo long regarded as Australia’s most recognised,
trusted and loved country of origin symbol. Lazzaro said, “The Australian Made logo has a proven 35-year
track record in making the ‘Australian connection’, with more and more brands
choosing it to promote their Australian credentials. Over 4400 companies are
licensed to use the logo on thousands of products sold here and worldwide. When you buy
Australian Made and Grown products, you know what you are getting—products
grown in our clean, green environment and made to the highest of
manufacturing standards. At the same time, you are pumping money back into
the economy, which helps to keep Aussie jobs, strengthen local industries and
supports local communities. So, whether
you’re doing the weekly grocery shopping, buying gifts online, or sourcing
supplies for a major project, look for the trusted Australian Made logo and
make sure it’s authentically Australian.” February
27, 2023 Source: https://www.roymorgan.com/findings/9161-australian-made-feb-2023
784-785-43-24/Polls ‘Mortgage
Stress’ Increases To Its Highest Since April 2012 With 24.9% Of Mortgage
Holders Now ‘At Risk’
New research from
Roy Morgan shows an estimated 1.19 million mortgage holders (24.9%) were ‘At
Risk’ of ‘mortgage stress’ in the three months to January 2023. This period
encompassed two interest rate increases of 0.25% taking official interest
rates to 3.1% in early December. However, despite the sharp increase
in the level of mortgage stress during the last year the overall number
remains well below the high reached during the Global Financial Crisis in
early 2009 of 35.6% (1,455,000 mortgage holders). The number of mortgage holders considered
‘Extremely At Risk’, has now increased to 710,000 (15.4%) in the three months
to January 2023 which is now slightly above the long-term average over the
last 15 years of 659,000 (15.9%). Mortgage Stress –
Owner-Occupied Mortgage-Holders
Source:
Roy Morgan Single Source (Australia), average interviews per 3 month period
April 2007 – January 2023, n=2,719. Base:
Australians 14+ with owner occupied home loan.
Official RBA interest rates are now
at a decade high of 3.35% and widely expected to keep increasing over the
next two months following the highest inflation figures for over 30 years
in December
2022 (7.8%). Roy Morgan has modelled the impact
of two potential RBA interest rate increases of +0.25% in each of the next
two months of March (+0.25% to 3.6%) and April (+0.25% to 3.85%). In January 24.9% of mortgage
holders, 1,185,000, were considered ‘At Risk’ and with expected future
interest rate increases to come this is set to increase to over 1-in-4
mortgage holders by April 2023. If the RBA raises interest rates by
+0.25% in March to 3.6% there will be 27.8% (up 2.9% points) of mortgage
holders, 1,372,000, considered ‘At Risk’ in March 2023 – an increase of
187,000. If the RBA raises interest rates by
a further +0.25% in April to 3.85% there will be 29.5% (up 4.6% points) of
mortgage holders, 1,456,000, considered ‘At Risk’ in April 2023– an increase
of 271,000. It is worth understanding that this
is a conservative model, essentially assuming all other factors remain the
same. And of course we are already seeing an increase in unemployment (Australian
unemployment jumps to 10.7% in January – highest since JobKeeper ended in
March 2021 – February 14,
2023). The greatest impact on an
individual, or household’s, ability to pay their mortgage is not interest
rates, it’s if they lose their job or main source of income. Mortgage Risk at
different level of interest rate increases
Source:
Roy Morgan Single Source (Australia), Nov. 2022 – Jan. 2023, n=3,308. Base: Australians 14+ with owner occupied
home loan. How are mortgage
holders considered ‘At Risk’ or ‘Extremely At Risk’ determined? Roy Morgan considers the risk of
‘mortgage stress’ among Mortgage holders in two ways: Mortgage holders are considered ‘At
Risk’[1] if
their mortgage repayments are greater than a certain percentage of household
income – depending on income and spending. Mortgage holders are considered
‘Extremely at Risk’[2] if
even the ‘interest only’ is over a certain proportion of household income. Michele Levine, CEO
Roy Morgan, says mortgage stress has increased to its highest in over a
decade in January and is set to rise even higher over the next few months if
the RBA continues to lift interest rates in both March and April as expected: “The latest Roy
Morgan data shows mortgage stress in the Australian housing market has
continued to increase with 1.19 million mortgage holders (24.9%) defined as
‘At Risk’ in January 2023, up 486,000 (+7.6% points) on a year ago before the
RBA began hiking interest rates. “The figures for
January 2023 take into account the first eight of the RBA’s interest rate
increases which lifted official interest rates from 0.1% in May last year to
3.1% in January. Since then, the RBA has increased interest rates once more,
up +0.25% to 3.35% - the highest level of official interest rates for over a
decade since October 2012. “The latest ABS CPI figures for the year to December 2022 released in
late January show Australian inflation hitting a 33 year high of 7.8% - the highest since March 1990 (7.8%). The
high, and rising, inflation level prompted the RBA to raise interest rates
for a ninth consecutive meeting in February and is set to lead to further
interest rates increases in both March (+0.25%) and April (+0.25%). “If the RBA does
raise interest rates again in the next two months by a total of 0.5% Roy
Morgan forecasts that mortgage stress is set to increase to over 1.45 million
mortgage holders considered ‘At Risk’ by April 2023 – 29.5% of all mortgage
holders, the highest since September 2011. “Of more concern
is the rise in mortgage holders considered ‘Extremely At Risk’, now estimated
at 710,000 (15.4%) in January 2023 – the highest since October 2016 (15.8%).
The number of mortgage holders considered ‘Extremely At Risk’ in January 2023
remains below the long-term average of 15.9% since mid-2007. “When considering
these figures on mortgage stress it is always important to take into account
that interest rates are only one of the variables that determines whether a
mortgage holder is considered ‘At Risk’. The variable that has the largest
impact on whether a borrower falls into the ‘At Risk’ category is related to
household income – which is directly related to employment. “The latest
figures on mortgage stress show that interest rates are approaching levels
that will cause a significant spike in the number of mortgage holders
considered ‘At Risk’ over the next few months. If there is a sharp rise in
unemployment during his period mortgage stress will rise precipitously
towards the highest levels experienced during the Global Financial Crisis in
2007-08-09. At that time a peak of 35.6% of mortgage holders were considered
‘At Risk’ in May 2008. “The latest Roy Morgan employment estimates show a near-record 13.4
million Australians were employed in January 2023, up by over 500,000 since February 2020 when there
were 12.9 million employed pre-pandemic. The strong growth in the jobs market
has attracted more Australians into the labour force and there are now over
1.6 million unemployed Australians (10.7% of the workforce) compared to 1.17
million pre-pandemic.” These are the latest findings from
Roy Morgan’s Single Source Survey, based on in-depth interviews conducted
with over 60,000 Australians each year including over 10,000 owner-occupied
mortgage-holders. To understand more about mortgages
in the full context of household finances and the uncertainties caused by the
COVID-19 coronavirus and rising interest rates and inflation, ask Roy Morgan. February
28, 2023
784-785-43-25/Polls Australian
Full-Time Employment Hit A Record High Above 8.9 Million In February As
Unemployment Falls 0.6% To 10.1%
In February
unemployment dropped 0.6% points to 10.1%, according to the latest Roy Morgan
employment series data. Unemployment dropped due to the 99,000 new jobs
created in the month with both full-time and part-time work increasing for
the first time since September 2022. Unemployment in February dropped
86,000 to 1.52 million Australians (10.1% of the workforce) and
under-employment was down 59,000 to 1.37 million (9.1% of the workforce).
Overall unemployment and under-employment dropped by 145,000 to 2.89 million
(19.2% of the workforce).
The workforce in February was
15,038,000 (up 13,000 from January) – comprised of 13,517,000 employed
Australians (up 99,000) and 1,521,000 unemployed Australians looking for work
(down 86,000).
In addition to the unemployed, 1.37
million Australians (9.1% of the workforce, down 0.4% points) were
under-employed – working part-time but looking for more work, down 59,000
from January. In total 2.89 million Australians
(19.2% of the workforce) were either unemployed or under-employed in
February, down by 145,000 from January. The movements in February partially
reversed the spike higher during January when combined unemployment and
under-employment increased by 288,000. Compared to early
March 2020, before the nation-wide lockdown, in February 2023 there were more
than 700,000 more Australians either unemployed or under-employed (+3.6%
points) even though overall employment (13,517,000) is over 600,000 higher
than it was pre-COVID-19 (12,872,000). Roy Morgan’s
under-employment figure of 9.1% is 3% points higher than the ABS
estimate of 6.1% for January. However,
the ABS figures for January show there were 435,700 workers who worked fewer
hours than usual (or zero hours) due to illness, personal injury or sick
leave compared to an average of 357,520 for the month of January over the
five years from January 2017 – January 2021. This difference in the numbers of
people who worked fewer hours (or zero hours) due to illness, personal injury
or sick leave, which can be put down to the highly infectious Omicron variant
of COVID-19, equates to a difference of 78,180 in January 2023 above the
pre-pandemic average for the month of January. If these workers are added to
the approximately 876,000 workers, the ABS classifies as under-employed this
creates a total of 954,180 – equivalent to 6.7% of the workforce. When the ABS unemployed (3.7% of
the workforce, 523,200 workers) and this larger than usual level of
under-employed (6.7% of the workforce, approximately 954,180 workers) are
combined these figures add to 1.48 million workers, around 10.4% of the
workforce – just over half of the comparable Roy Morgan figure. Roy Morgan
Unemployment & Under-employment (2019-2023)
Source: Roy Morgan Single Source January 2019
– February 2023. Average monthly interviews 5,000. Michele Levine,
CEO Roy Morgan, says unemployment and under-employment were both down
slightly in February but the combined figure of 2.89 million (19.2% of the
workforce) is over 500,000 higher than a year ago in February 2022 of 2.36
million (16.3%): “The latest Roy
Morgan employment estimates for February show unemployment down 86,000 to
1,521,000 (10.1%, down 0.6% points). The decline in unemployment is good news
but the measure is still significantly higher than a year ago – almost
300,000 more Australians are now unemployed than in February 2022 – 1,227,000
(8.5% of the workforce). “Under-employment
in February was 1,367,000 (9.1% of the workforce), down 59,000 on January,
but more than 200,000 higher than a year ago in February 2022 – 1,130,000
(7.8% of the workforce). These figures show that although there was positive
movement in the underlying figures in February, the longer-term trends show
considerably higher unemployment and under-employment than a year ago. “Compared to a year
ago, the increased immigration and faster population growth than during the
pandemic effected years of 2020-22, is boosting figures across the workforce.
The workforce has grown rapidly over the last year and is up 595,000 to
15,038,000 driven by both an increase in jobs, up 301,000 to 13,517,000, and
a similar-sized increased in unemployment, up 294,000 to 1,521,000. “The biggest
impact has occurred during the last six months as inward immigration to
Australia has increased substantially and almost all COVID-19 pandemic
related restrictions ended in late 2022. Since October 14, 2022, there has
been no mandatory isolation for anyone with COVID-19 and no ‘Pandemic Leave
Disaster Payments’ available to those forced into mandatory isolation. “The ending of
the COVID-19 pandemic restrictions means there is no longer any incentive for
COVID positive people to take time off work due to a positive COVID test and
no requirement for businesses to hire extra workers to cope with the forced
isolation of employees. “Over the last
six months (September 2022 – February 2023), total unemployment and
under-employment has averaged 2.84 million (19.2% of the workforce), a far
higher figure than the six months before that of March – August 2022: 2.49
million (17.1% of the workforce). “The latest Roy
Morgan employment estimates show that although the economy is creating many
new jobs, the large increase in the workforce due to factors such as
increased immigration, and the relaxation of domestic COVID-19 restrictions,
means there has been a clear increase in both unemployment and
under-employment since late last year. “As we head
further into 2023 these issues are set to become more prominent as we deal
with high inflation and rising interest rates that will raise costs for businesses
and consumers alike.” March
06, 2023 Source: https://www.roymorgan.com/findings/9196-australian-unemployment-estimates-february-2023
784-785-43-26/Polls ANZ-Roy
Morgan Consumer Confidence At 79.9 – Virtually Unchanged For Second Straight
Week In Early March
ANZ-Roy Morgan
Consumer Confidence was virtually unchanged at 79.9 this week. However, Consumer
Confidence is a large 20.2pts below the same week a year ago, February 28 –
March 6, 2022 (100.1). Consumer Confidence is now 3.4pts below the 2023
weekly average of 83.3. Views on personal finances were
virtually unchanged this week, but there was a slight improvement for longer
term views of the economy while there was a slight deterioration in whether
consumers considered now a good/bad time to buy a major household item. Current financial
conditions Future financial
conditions Current economic
conditions
Future economic
conditions
Time to buy a
major household item
ANZ Senior
Economist, Adelaide Timbrell, commented: Consumer
confidence remained virtually unchanged – and very low – in the week to 5
March. It was the fourth consecutive week with confidence among the worst 12
results since the COVID outbreak in Australia. Among those paying off their
mortgage, confidence rebounded 2.9pts after a sharp fall the week before.
Confidence among those who own their home outright and those renting declined
2.2pts and 0.4pts respectively, but still ended the week with higher
confidence than indebted owners. Time to buy a major household item declined
to its fifth-lowest result since the COVID outbreak, while current finances
dropped to its fourth-worst result since COVID. Confidence about future
financial and economic conditions rose during the week.
March
07, 2023 Source: https://www.roymorgan.com/findings/9180-anz-roy-morgan-consumer-confidence-march-7
784-785-43-27/Polls Over
Half Of APAC’s Consumers (54%) Say That Better Money Management Is On Their
List Of Goals For This Year
In this article, we explore what
residents in Australia think about the state of their household finances –
how do these perceptions vary across income levels? Additionally, do Australia’s
residents generally expect their household finances to get better or worse
over the next 12 months? And how bullish or bearish are workers from specific
sectors, like real estate or retail, about their future finances? Are household
finances in Australia getting better or worse? Latest data from YouGov
Profiles, as of February 2023, show that close
to half (47%) of all Australian residents say there has been no change in their household
finances compared to one month ago. Data from YouGov Profiles reflect
cumulative responses over the past 52 weeks. Three in ten (31%), however,
report worsening household
finances, while less than one in five (18%) say their financial situation
has improved. Regionally,
Australia has a relatively high percentage of residents who say their household
finances have changed for the worse – compared to other markets like Indonesia, Hong Kong and Singapore –
although Thailand boasts an even
larger proportion.
The reverse is true for lower income households, who are
significantly more likely to report a worsening financial
situation (39%) and significantly less likely to say their finances have
taken a turn for the better (13%). Do Australian
households expect their finances to improve or worsen over the next 12
months? When asked how they anticipate
their household finances to change over the next 12 months, only 28% of
Australian residents expect their situation to remain the same. In comparison, more than a third
(35%) expect their household finances to improve, while over a quarter (26%) of households expect
their situation to worsen.
Regionally, Australia has the
highest proportion of residents who expect their household finances to worsen
in the next 12 months – compared to other APAC markets like Hong Kong, Indonesia and Singapore and Thailand. At the same time,
compared to Singapore and Hong Kong, a larger
percentage of Australia’s residents expect their financial situation to
improve in the near future. In which sectors
are respondents most bullish and bearish about their household finances in
the next 12 months? Australian residents who work
in Construction, IT & Telecoms and
Accountancy are most optimistic about
their household finances in the next 12 months, with half or close to half
expecting an improvement. Additionally, over two in five of
Australian residents who work in the Financial
Services, Hospitality &
Leisure, Legal, Media / Marketing / Advertising / PR &
Sales and Manufacturing sectors
are also bullish about their household finances changing for the better over
the coming year.
On the other hand, those employed
in the Manufacturing and Legal sectors are most pessimistic, with three in ten expecting
their household finances to get worse in the next 12 months. Meanwhile, over a quarter of
Australian residents who work in the Medical
& Health services, Education and IT & Telecoms sector are also
bearish about their household finances changing for the worse over the coming
year.
February
28, 2023 Source: https://au.yougov.com/news/2023/02/28/australia-household-finances-improve-worsen-2023/ MULTICOUNTRY
STUDIES
784-785-43-28/Polls Confounding
And Confirming Expectations On The “Care Economy” In MENA, A Survey In 12
Arab Nations
Written and released before
COVID-19 was declared a global pandemic, a 2020
Oxfam report suggested that if women were to be paid for
their unpaid work, it would be worth nearly US$11 trillion globally. This sum likely
varies based on the proportion of women gainfully employed in any region.
At 18
percent, the 2021 rate of women’s participation in the paid labor
force in the Middle East and North Africa (MENA) is the lowest in the world
and has decreased from a 25-year high of 21 percent in 2016. Women in MENA
spend up 10
times more time on unpaid care work and do 4.7
times more unpaid care work than men. But do citizens believe
women should be doing
so? Arab Barometer findings from 12
countries surveyed in the seventh wave (2021-2022) partially confound
expectations on unpaid care work in the region. Where it is often assumed
that childcare—including help with schoolwork—is relegated exclusively to
women, survey results instead suggest that most citizens believe helping
children study is a responsibility that should be shared by both male and
female household heads, regardless of who currently completes this
responsibility. But patriarchal expectations linger when it
comes to financial decisions: in most countries, the largest share of
citizens believes that the male household head alone should be responsible
for budgeting and spending on household needs.
Beliefs about ownership of these
responsibilities differ significantly (if not expectedly) between men and
women; between more and less educated citizens; and between employed men and
employed women. Women and those with higher levels of education are likelier
than their male and less educated counterparts to opine household heads should
be equally responsible for both tasks. And in comparison to employed
men, employed women strongly voice an expectation of equal say in budgeting
and spending in particular. But perhaps what is most notable
are differences among women themselves. In most countries, housewives are
simultaneously likelier than employed women to say that the female household
head should be responsible for helping children study, while the male
household head should be responsible for budgeting and spending. Meanwhile, employed
women are likelier than housewives on both measures to say responsibility or
these tasks should be divided between household heads. These findings suggest that some
gendered norms are as, if not more, reified among the opinions of women
outside the paid labor force as they are among the opinions of men. Men are
only slightly more likely than women to say helping children study should be
the female household head’s responsibility, and with the exception of Egypt,
only minority shares of men hold this belief. That said, men, like
housewives, are significantly likelier to say the male household head should
be responsible for financial decisions. Notably, this close alignment between
the opinions of housewives and men may not exclusively be interpreted as housewives
lacking choice but might instead indicate exertion of agency and ownership of
roles and responsibilities.
This reaffirmation of views on
divisions of labor is salient in MENA in part because of the gendered impacts
of the COVID-19 pandemic. In a recently published
book chapter, members of Arab Barometer’s research team used
findings from the sixth
wave to highlight how the gendered effects of the pandemic in
MENA, as elsewhere in the world, negatively affected both monetized and non-monetized
work for women. The pandemic calcified expectations of women’s domestic
responsibilities and increased non-paid labor on the one hand while causing
women disproportionate setbacks in the paid labor market on the other. Broadly defined as the services
provided to institute care for different populations like children and the
elderly, the care
economy includes tasks like cleaning houses, shopping for
groceries, and helping with education and healthcare. When done domestically
or in private homes, much of this work is unpaid
and often dismissed as unproductive. It is also largely shouldered
by women. The informality of this sector is deemed a missed
opportunity for economic development, as the care economy is
predicted to create jobs and have a positive significant impact on countries’
GDPs. COVID-19 put significant pressure on this “less
visible” part of the economy, yet the strain of the pandemic on
unpaid care work received less attention than on paid care work (also
mostly shouldered by women). At least one of the COVID-19-driven
trends has continued: majorities of housewives in seven out of 12 countries
in Arab Barometer’s seventh wave report that the amount of housework they
have to do has continued to increase since the beginning of the pandemic. But
in several countries, reports of increased household responsibilities borne
by women are accompanied by decreased agreement on the statement that men
alone should have final say in household decisions. In Egypt, Lebanon, Iraq,
and Jordan, decrease
in support for this statement is significantly more dramatic
among women overall than men.
Housewives are no exception to this
trend. Among this subset of women who are often most responsible for unpaid
care work, support for the idea that men should have final say in household
decisions is markedly down by 22 points in Lebanon, 21 points in Algeria, 14
points in Tunisia, and 10 points in Sudan. The pandemic seems to have had a
paradoxical consequence: while it increased the amount of work for women at
home, it simultaneously raised awareness for the fact that such work, even if
unpaid, merits women having a say in household decisions. Nearly half of citizens or more in
nine out of 12 countries say household heads should be equally responsible
for helping children study. Only in Egypt does the majority
say this task should be the female household head’s exclusively. This
finding varies by gender and education, with more Egyptian men saying it
should be the female head’s responsibility (+12 points), and with those with
higher education being 6 percent less likely to say that it should be the
female head’s responsibility. In contrast, the results reaffirm
preconceived patriarchal expectations when asked about budgeting and spending
household responsibilities. Nearly half or more citizens in nine countries
attribute this responsibility to the male head. Lebanon, Jordan, and Tunisia
stand out, as pluralities in the former two countries and an outright
majority in the latter challenge these patriarchal expectations. Views on ownership of this
financial responsibility significantly vary by gender, but the issue is
notably polarized along gender lines in five countries. Overall, men are more
likely to think the male head of household should be responsible for
budgeting and spending, while women are more likely to believe that the
responsibility should be shared. In Iraq, men are 21 points more likely to
say men should be responsible while women are 17 points more likely to say
the household heads should share responsibility. While there is a 15-point
gender gap in the belief that men should have most responsibility in
financial decisions in each Egypt and Tunisia, women are respectively 10 and
13 points more likely to think household heads are equally responsible.
Jordan (+14 points men, male responsible; +11 points women, equally
responsible) and Morocco (+13 points men, male responsible; +11 points women,
equally responsible) follow the same pattern. More poignant still are differences
between employed men and employed women on attitudes towards financial
decision-making responsibilities. In all countries except for Mauritania,
employed and self-employed women are more likely than employed and
self-employed men to say household heads are equally responsible for
household budgeting and spending. This gender gap ranges from 8 percent in
Sudan to 32 percent in Iraq. These significant differences point to the
possibility that upon entering the paid workforce, women become more
empowered and expect to have an equal say in household responsibilities,
especially with regards to approaching spending and budgeting. While gender norms might be at play
here, other factors may be necessary to consider. Gainfully employed women
simultaneously have less time to dedicate to housework and more financial
freedom to outsource responsibilities. For the affluent, this often is done
by hiring domestic workers through the kafala or
“sponsorship” system in the Arab Gulf, Lebanon, and Jordan. The kafala system
is one where a domestic worker is hired under a sponsor to live and work in
the host country. These workers often live in their employers’ households as
nannies, cooks, or cleaners. They rarely have clear job descriptions and
are predominantly
women. But hiring domestic workers is
potentially a double-edged sword. While the entry of women into the paid
workforce might be changing gendered power relations and challenging gender
norms within a household, hiring domestic workers who are primarily women
reinforces the gender norm at the societal level. Findings from the seventh wave
disrupt patriarchal preconceptions with respect to sharing childcare
responsibilities but reinforce them when it comes to insisting that budgeting
and spending are the responsibilities of the man of the house. Gender,
education, and employment status complicate this overarching pattern further.
The ensuing results, which sometimes confirm and sometimes challenge
expectations, highlight the importance of nuancing approaches to
understanding gender norms in MENA. This calls for further contextualization
of individual and country-specific trajectories. The findings also point to
potential and important future research agendas on the impact of domestic
workers, under kafala or otherwise, on care work and household distributions
of responsibilities. March
6, 2023
784-785-43-29/Polls Female
Political Participation Inspires Confidence In Female Political Leadership In
MENA, An 8 Country Survey
Support for women as political
leaders has dramatically increased inmost MENA countries according to Arab
Barometer trend data. Disagreement with the idea that men make better
political leaders than women is at an all-time high in eight of the eleven
countries for which Arab Barometer has trend data.[1] Not only are these
changes seen at the population level, but also within age cohorts. That is,
citizens who were in their twenties, thirties, or forties ten years ago are
today less likely to think men make better political leaders than women.
In a vast majority of cases, MENA
citizens are changing their minds as they age. Specifically, most cohorts in
most countries become increasingly unlikely to agree that men are better
political leaders than women as they age.
Palestine is an especially
interesting case. Arab Barometer first surveyed Palestinian citizens in 2006.
At that point members of Cohort I (18-29 year-olds) were more likely than any
other cohort to agree that men were better at political leadership than
women. At the time, 90 percent of Cohort I agreed, compared to 81 percent of
Cohort II (30-39 year-olds), and 84 percent of Cohort III (40-49 year-olds).
Now, 16 years later, Cohort I has seen the biggest change. In 2021 Palestine,
only 63 percent of citizens aged 34 to 45 [5] agreed with the statement; a
27-point drop. There was also an 11-point drop in the Cohort II and a 23
point drop in Cohort III. Tunisian citizens experienced the
most dramatic opinion shift across cohorts in the region. Only 41 percent of
Tunisians who are in Cohort II today agree that men are better political
leaders compared to 77 percent of them when they originally surveyed ten
years ago. Similarly, Tunisians in Cohort III today dramatically shifted
their views on women’s political leadership capabilities. Only 37 percent of
them in 2021 think that men are better suitable for political positions
compared to 71 percent of them when they were ten years younger in 2011. Tunisia recently became the first
Arab state to have a female prime minister. Prime Minister Najla Bouden was
appointed by President Kais Saied in September 2021, shortly before Arab
Barometer began surveying Tunisians. The recent sharp decline in agreement
among Tunisian citizens favoring male political leadership from 2018 to 2021
following Bouden’s appointment is similar to the decline Arab Barometer
recorded from 2011 to 2013, during which time legislative gender quotas were
introduced. Egyptians went from having the
highest agreement (91 percent) that men are better political leaders than
women among surveyed countries in 2011 to only the fifth highest agreement
(66 percent) in 2022. Egyptians of all age groups experienced a significant
opinion shift over time. Agreement dropped by 23 points in Cohort I, 26
points in Cohort II, and 22 points in Cohort III. Female political representation in
Egypt has risen dramatically from 2011 to 2022. Just prior to the Arab
Spring, women took up only 1.5 percent of seats in the national legislature.
As of the most recent Egyptian elections, 28 percent of legislative seats
belong to women. Furthermore, the Egyptian constitution reserves 25 percent
of local council seats for women and six women currently hold cabinet
positions. The increase of successful female participation in the political
sphere coincides with the dramatic decrease in Egyptians who think men are
better than women at political leadership. Conventional wisdom might suggest
that the youngest group, Cohort I, would have the most flexible mindset.
Instead, on average Cohort II (ages 30-39) sees the biggest change.
Furthermore, the difference of means of Cohort I and Cohort III is
negligible. This is actually in line with most psychological research which
finds people become more open to new ideas as they age. When the cohorts are broken out by
gender, we see that men and women experience similar levels of opinion shift.
Women tend to have slightly more drastic changes, but not always. For
instance, Lebanese men in every cohort had larger change of opinion than
women. This can be attributed to two reasons.
First, even though Lebanese
citizens overall have arguably the most positive attitudes towards gender
equality in the region, women in every country are much more likely than men
to disagree that men are better political leaders. Lebanon is no exception.
Second, although the change in Lebanese men’s opinion is larger than Lebanese
women, with the exception of Cohort I, the change is not substantial. Even
though agreement in Cohort I dropped only four points for Lebanese women,
compared to 21 points for Lebanese men, the Lebanese women of Cohort I are
still 10-points less likely the Lebanese men of Cohort I to agree that men
are better political leaders than women. Overall, the opinions of men and
women in Lebanon changed in parallel. Finally, Algeria is worth focusing
on. Algeria is the only country where the overall population is more likely
to agree that men make better political leaders than women today than they
were the first time they were surveyed. This is true of both Algerian men and
women. Algerian women in Cohort I are the only group in Algeria to have a
stable position; all other cohorts of both men and women in Algeria agree at
least slightly more in 2022 than they did in 2006.
Just like other countries in the
region, Algeria introduced gender quotes to its national elections in 2011.
The quota increased the proportion of national legislative seats held by
women from eight percent in 2011, prior the quota, to 32 percent after the
2012 election. The drastic increase in women’s political representation
without an increase in fundamental support for women’s rights in education,
the workforce, or the home led to fierce blow-back. The national
discourse dubbed the female parliamentarians unqualified and
the gender quota law was dropped. After the 2021 election, the proportion of
seats held by Algerian women dropped from 26 percent to 8 percent; the same
proportion held prior to 2011. The gender quota failure seems to have caused
Algerians to increase their belief in differential political capabilities due
to gender. However, the 16-year overview
belies more recent trends in Algeria. Although Algerian men seem to be losing
faith in female political leadership, the same cannot be said of Algerian
women. Disparagement of female parliamentarians without any prior experience
led to a spike in agreement that men are better political leaders in 2016;
however, Algerian women have started to have more faith in female political
leaders. Agreement among Algerian women has dropped ten points over the last
six years.
Representation is a key component
in increasing citizen confidence in female political leadership, but it is
not everything. In countries where women were meaningfully allowed to
participate once elected, men and women across generations revised their
biases. Algeria serves as a cautionary tale; even though women were nominally
allowed to participate, a lack of support prevented women from effectively
demonstrating their capabilities. Overall, trend data regarding MENA
citizens’ views on political gender equality is positive. As women across
MENA continue to infiltrate the political sphere, we can expect respect for
female political leadership to continue to grow. March
6, 2023
784-785-43-30/Polls International
Women's Day: Global Opinion Remains Committed To Gender Equality, But Half
Now Believe It Is Coming At The Expense Of Men, A 32-Country Survey
Most agree that
there is inequality between men and women — but differ on whether men benefit
from gender equality Looking at respondents across all
generations globally, the majority
agree that inequality between men and women persists, and that improvements
will require efforts from both men and women. A global country
average of 68% agree there is currently inequality between men and women in
terms of social, political, and/or economic rights in their country. (Looking
at the trend since 2017 across a sub-sample of 22 countries, the proportion
who believe inequality exists has fallen by 5 points since then.) There is a
similar level of agreement that women won’t achieve equality in their country
unless men take action to support women’s rights (64% global country
average), and that there are actions one can take to help promote equality
between men and women (62%).
On average globally, just over half (55%) believe equality between men
and women will be achieved in their lifetime. Optimism that this
will happen is now 5 points higher than it was in 2018 on average across the
25 countries surveyed then and again this year. However, only 45% in the U.S.
are of this opinion today, down 7
points since 2018. Similarly, more people believe young women will have a
better life than their parents’ generation than believe young men will (51%
globally and 48% in the U.S. for young women vs. 42% globally and 31% in the
U.S. for young men). When asked whether gender equality mainly benefits women,
mainly benefits men, or is good for both men and women, half (53%
globally, 54% in the U.S.) say it is good for both genders and another 1 in 6
(18% globally, 15% in the U.S.) say it mainly benefits women. Men are almost
twice as likely as women to agree that gender equality mainly benefits women
– both across the world and in the U.S. Only 8% globally (7% in the U.S.) say
that gender equality mainly benefits men. Where Americans stand out is on
whether things have gone far enough in
their country when it comes to giving women equal rights with men.
This opinion is a lot less prevalent in the U.S. (37% agree) than it is on
average globally (54%). The same applies to whether men are expected to do
too much to support equality (36% in the U.S. agree vs. 54% globally) and
whether we have gone so far in promoting women’s equality that we’re
discriminating against men (40% vs. 48%). There are signs that these views
are held more widely now than they were before the Covid pandemic:
Day-to-day
incidents of sexism persist, but most say they're able to take action —
despite increasing belief that there's risk in doing so Four in 10
globally (43% on average) and 1 in 3 in the U.S. (34%) report having
witnessed at least one of several forms of gender discrimination in the past
year, with the most common being hearing a friend or family
member make a sexist comment (27% globally, 24% in the U.S.), followed by
seeing examples of gender discrimination at work (20%, 14%), and seeing
someone sexually harass a woman (14%, 13%). Three in 5
globally (59%), but notably fewer in the U.S. (42%), say they’ve taken at
least one action to promote gender equality in the past year.
The most common actions taken include talking about gender equality with
family or friends (32% globally, 24% in the U.S.), speaking up when a friend
or family member made a sexist comment (21%, 17%), and talking about gender
equality at work (21%, 12%). Half of Americans (50%) and more than 1 in 3 on
average globally (37%) say they have taken none of eight possible actions in
the last year. However, there is also evidence of
the barriers that are preventing
people from taking action to support gender inequality. On
average, more than 1 in 3 on average globally (37%) and 1 in 4 in the U.S.
(27%) say they are scared to speak out and advocate the equal rights of women
because of what might happen to them. This too has increased over the last 6
years: between 2017 and 2023, the average proportion feeling scared to speak
out has risen by 9 points on average across 22 countries and by 5 points in
the U.S. When asked directly, respondents
also named other barriers: feeling that there’s nothing people can do that
will really make a difference (13% globally), not knowing how to talk about
gender equality/what next steps should be taken (11%), feeling that it’s
irrelevant/unimportant (10%), and feeling concerned about being physically
abused or threatened (10%). More positively, the least commonly selected
responses were that it’s only a women’s issue (asked of men only; 6%), that
people don’t think gender equality exists (6%), and that they don’t want to
promote it (5%). Responses in the U.S. were similar to those gathered across
all countries. Younger
generations are more optimistic about the future than older age groups, but
they are also more cautious about the risk of speaking out and are more
concerned that gender equality negatively impacts men On average across all 32 countries
surveyed, Gen Zers (45%) and
millennials (44%) are more likely to identify as feminists,
compared to Gen Xers (37%) and boomers (36%). The gap is even starker in the
U.S. (46% of Gen Zers and 37% of millennials vs. 29% among both Gen Xers and
boomers). Gen Zers and millennials are also
more likely than their elders to agree there are actions they can take to
promote equality between men and women (65% of both Gen Zers and millennials
vs. 61% of Gen Xers and 52% of boomers globally; 53% and 57% vs. 52% and 48% in
the U.S.). Similarly, younger generations are
more likely to agree that gender equality will be achieved in their lifetime
(60% of Gen Zers and 61% of millennials, vs. 53% of Gen Xers and 44% of
boomers globally; 48% and 50% vs. 40% and 43% in the U.S.). Gen Zers are also those most likely to have taken at
least one of eight listed actions in support of gender equality in the past
year (68% globally and 42% in the U.S.). Reported
action-taking drops steadily with each older generation, with boomers the least
likely to have taken any action (41% globally and only 22% on the U.S). Optimism among younger adults comes
despite a larger share of Gen Zers (48% globally, 45% in the U.S.) and
millennials (43%, 31%) saying they’re scared
to speak out for women’s equal rights because of what might happen to them,
a fear shared by significantly lower proportions of Gen Xers (32%, 21%) and
boomers (23%, 17%). The younger generations are also more likely to say
they’ve seen at least one form of discrimination mentioned in the survey (58%
Gen Zers and 49% millennials compared with 36% Gen Xers and 26% of boomers). At the same time, Gen Zers (52%
globally, 57% in the U.S) and millennials (53%, 43%) are especially likely to
agree that things have gone so far in
promoting women’s equality that men are being discriminated against,
compared to Gen Xers (46%, 28%) and boomers (40%, 15%). Also, while it is a
minority view in all generations, Gen Zers and millennials are more likely to
agree that a man who stays home to look after his children is less of a man
(30% each of Gen Zers and millennials globally, 21% and 24%, respectively, in
the U.S.) than are Gen Xers (22% globally, 10% in the U.S.) and boomers (14%
globally, 9% in the U.S.). 7
March 2023
784-785-43-31/Polls Out
Of The 64 Countries That Were Surveyed, South Korea Tops Security Preference
For US, Pakistan Tops Preference For China, While Serbia Tops The Preference
For Russia And Sweden For EU For Security Partnership: GIA And Gallup &
Gilani Pakistan
According to a survey conducted by
Gallup International Association, out of the 64 countries that were
surveyed, South Korea tops security preference for US, Pakistan tops
preference for China, while Serbia tops
the preference for Russia and EU for security partnership An opinion poll was conducted by
GIA in 64 countries covering over two thirds of the global population (and more than 90% of
those countries which are free to conduct and publish opinion research). This press release sheds
light on the findings of the survey regarding perceptions on strategic partnerships between countries. The question asked was “Which of
the following would you prefer your country to partner with for security
– the US, China, Russia, or The EU?” 84% people from South Korea said USA,
54% from Pakistan
said China, 53% from Serbia said Russia and 69% from Serbia said EU. The top 5 countries, with the
greatest number of people who responded USA were: 1. South Korea – 84% 2. Israel – 79% 3. Kosovo – 77% 4. Japan – 65% 5. Philippines – 63% The top 5 countries, with the
greatest number of people who responded China were: 1. Pakistan – 54% 2. Russian Federation – 50% 3. United Arab Emirates – 36% 4. Thailand – 25% 5. Palestinian Territories – 24% The top 5 countries, with the
greatest number of people who responded Russia were: 1. Serbia – 53% 2. Ethiopia – 46% 3. Syria – 45% 4. Armenia – 42% 5. Ivory Coast – 40% The top 5 countries, with the
greatest number of people who responded EU were: 1. Sweden – 69% 2. Ireland – 62% 3. Slovenia – 58% 4. Portugal – 54% 5. Switzerland – 52% Results by Demography (Security
Partnership): Age Differences in popularity of
Partnership on Security • Younger and middle-aged
populations are more amiable towards US when it comes to striking Security Partnership while the
older aged population prefers US and EU equally. • Across all age groups US was the
top preference across all the different parts of the world. Popularity Gap in terms of security
partnership between China and US • Among different religious groups,
US is ahead of China in preference for security partnership. • Hindu respondents most upbeat
about security partnership with US • After US, Christians and Hindus
prefer EU while Muslims prefer Russia Popularity of Security Partnership
by Per-capita Income. • Interesting to note that just
like economic preference, low-income economies prefer China for security partnership. • High-Income economies prefer EU
for security partnership, this could perhaps be explained by the fact that most high-income
economies belong to the EU while lower-middle income economies have the highest
preference for US as 39% responded so. Results by Region (Security
Partnership): Popularity of Security Partnership
with China • Popularity of security
partnership with China was found to be highest in South Asia followed by MENA region. The least support was
found in EU (with 3% saying they would prefer that) • Interestingly populations among
G7 countries, the support for partnership with China is highest in US where 16% seek security
partnership with China. The lowest in G7 country is Japan in its preference for China for security
partnership • Widespread support for security
partnership with US exists in East Asia and Oceania where 3 in 5 seek partnership. The lowest
support is non-EU Europe East (they seek partnership with EU and Russia) These interesting findings have
emerged out of an annual, 64 country research conducted by Gallup International (founded by the
world-renowned scholar and pollster Dr. George Gallup in 1947). The survey in Pakistan was done by
Gallup Pakistan, Pakistan’s oldest and trusted survey firm, working since 1979.
March
08, 2023 Source: https://gallup.com.pk/wp/wp-content/uploads/2023/03/08-March-GIA-PR_merged.pdf
784-785-43-32/Polls Reflections
On Ramadan, A Look Into Changing Habits Of KSA, UAE And Egypt
A Stronger
Connection to Religion Ramadan is a significant month for
Muslims in the MENA region, and while it is a time of spiritual reflection
and self-discipline, it is also a time of celebration and community. It’s
touted as a period for personal spiritual growth and development, but it is
also a time to strengthen family and community bonds. The
majority practice their faith through higher exposure to religious content,
more prayer and visits to the mosque as well as community engagement through
helping those in need. A trend seen across markets.
A Time for
Community and Gathering While fasting is a significant part
of Ramadan, the month is also a time for community and sharing, and food
plays an important role in bringing people together during this time. Many
families and friends gather together to share an Iftar meal, accordingly they
put the effort to decorate their homes, and invite others or to attend
community iftar events.
Food delivery apps have become
increasingly popular across the year, and the trend is no different during
Ramadan. With many restaurants and cafes offering Iftar and Suhoor menus,
it’s become much easier for people to break their fast and to enjoy
traditional dishes from the comfort of their own homes.
A Less Constrained
Shopper Shopping for groceries during
Ramadan can be a significant part of the preparation for breaking the fast,
it is traditional to prepare special foods, and there’s an increase of eating
at home, and inviting friends and relatives to share meals. Moreover,
charitable giving is an important part of the month, and some people may
choose to donate food to those in need. With many brands offering
discounted price, and bulk purchase deals, promotions are a high motivator to
shop during the month. While a large percentage are
shopping for products through traditional channels, online shopping has
become a corner stone in their purchase journey.
Purchases are split between planned
and unplanned, which indicates a high level of impulsive and last minute
purchasing habits during the month. Unsurprisingly 68% mentioned that they
discover new products during the month, and accordingly, 8 in 10 mentioned
that they spent and purchased more than they originally planned. A Media Content Boost Advertising spend during Ramadan
has traditionally been a significant part of the marketing strategy for many
companies in the MENA region, where Ramadan is an important cultural and
religious observance. Consumer spending during Ramadan tends to increase,
particularly on food, beverages, and clothing. As a result, companies in
these sectors may choose to increase their advertising spend during Ramadan
to take advantage of this increased consumer demand. Many individuals spend more time
watching television and engaging with social media, which presents an
opportunity for advertisers to reach a larger audience. SVOD platforms have gained
significant traction. 6 in 10 are using these platforms with Netflix taking
the lead, and with availability being the biggest driver of this usage.
Arabic series take the lead when it comes to the most watched type of
programming. 8
March 2023 Source: https://www.ipsos.com/en-ae/reflections-ramadan
784-785-43-33/Polls Data
Dive: Looking Back At How The World Was Feeling As The COVID-19 Era Dawned, A
Survey In 12 Countries
It all started with reports of
hospitalizations and deaths related to a pneumonia of unknown origin in
Wuhan, China, in late 2019. Soon, the alarming explosion of what came to be
known as COVID-19 spurred the World Health Organization to officially declare
a global pandemic on March 11, 2020. Then, life as we all knew it came
to a screeching halt. Here’s a look back at some
eye-opening polling via Ipsos’ Global Advisor online platform in
those scary (and, yes, slightly cringey) early days of the once-in-a-century
event.
10
March 2023 Source: https://www.ipsos.com/en-us/data-dive-looking-back-how-world-was-feeling-covid-19-era-dawned
784-785-43-34/Polls According
To Yougov Data, Around 44% Of The World's Consumers Say They Try To Buy Only
From Socially And Environmentally Responsible Companies, A Survey Across 18
Global Markets
To learn how consumers feel about
brands' green claims, we asked people in 18 global markets if they agreed or
disagreed with them: I'm skeptical of most brands' attempts to convince me
they're green and ; I believe more in the advertising claims of small
brands than in those of the big ones. Of all the countries surveyed, the
British are the most skeptical (71%), followed by the Spanish (69%) and the
French (66%). About two-thirds of consumers in
Mexico (66%) and Canada (65%) say they distrust brands when it comes to
environmental claims. However, although more than half of the US
population agrees with this statement (54%), they are considerably below the
world average.
Aside from Australia (63%), all
other APAC markets are less likely than the global public to agree with the
statement: China (57%), Singapore (56%) and India (54%). Hong Kong (43%)
has the lowest agreement rate of all countries, followed by Indonesia
(51%). Although the proportion of consumers who disagree with the
statement in these two countries is similar to the rest of the surveyed
markets, the proportion of unsure consumers is more significant than in other
countries: 47% in Hong Kong and 41% in Indonesia. The large proportion of consumers
choosing "neither agree nor disagree" suggests that if brands play
their cards right, they could convince customers of their green claims. In addition, we look at whether
consumers believe the advertising claims of small brands more than those of
large ones. Looking separately at consumers who
agreed with the first statement and those who disagreed, we find that while
most consumers are skeptical of brands' green initiatives, they are much more
likely to agree that they trust small brands more than big ones.
Among global respondents who say
they are not easily convinced that a brand is sustainable, more than a third
(36%) are more likely to believe the advertising claims of small brands than
big ones. Of the 7% of global consumers who are convinced by brands' green
claims, less than a third (27%) agree they are more likely to believe small
brands. The same trend is observed in the
different markets. What is striking, however, is that consumers in both
groups are more hesitant, suggesting that they are not sure they believe
advertising claims regardless of the size of the brand. (YouGov
Spain) March
10, 2023 Source: https://es.yougov.com/news/2023/03/10/global-desconfian-los-consumidores-de-las-afirmaci/
784-785-43-35/Polls Women
Worldwide Still Facing Uphill Battle For Equality And Safety, A 39 Country
Survey
WIN International, the world’s
leading association in market research and polling has published the Annual
WIN World Survey – WWS 2022 – exploring the views and beliefs of 28702
respondents in 39 countries across the globe. On International Women’s Day,
WIN releases the latest results of the survey about gender equality, violence and sexual harassment,
to understand what are, if any, the improvements around the world in terms of
equal opportunities and rights. Men are more
favored in the workplace according to global perception In Hong Kong, the situation is
looking rosier, with over 61% thinking that women and men have the same job
and career opportunities. But the country where equality seems to be winning
is the Philippines, with only 12% of respondents feeling a disparity.
Mixed feelings
around gender pay gap When talking about salaries the
perception shifts slightly, with almost half of the global population (44%)
thinking that pay is equal between men and women. Probably not surprisingly,
men and women don’t see eye to eye on the matter: 51% of men don’t think
there’s a pay gap, versus 38% of women. Again, Chile scores highly, with
50% of people declaring that women are taking home less than men. While in
Europe only 25% of respondents seem to have the same perception – in contrast
with the outcome from the previous question about career opportunities. Only 1.9% of Finnish respondents
believe that women’s salaries are lower, but overall the MENA region feels
the most positive with 57% of people thinking that remuneration is the same
for men and women. Violence doesn’t
seem to stop At a global level, results about
women experiencing physical or psychological violence are unfortunately slightly on the rise compared to the
previous year, going from 16% in 2021 to 17%. Younger people especially (18
to 24) seem to be suffering more than other age groups with over 21% of
people responding positively. When analyzing data by region, some
improvements can be found in MENA, APAC, and Europe, where the net index of
women experiencing violence in the past year decreased by -5, -2 and -2
respectively. However, in Africa violence is on the rise going from 20% in
2021 to a worrying 27%. Looking at each country, it’s worth
noticing Vietnam with only 2% of people reporting to have suffered from
violence. Positive numbers also come from South Korea and the Philippines
with 3% and 5% declaring to have suffered from violence. Vilma Scarpino,
President of WIN International Association, said: “Numbers
worldwide are still too high when it comes to gender inequality and acts of
violence. At WIN our mission is to shed light on pressuring issues such as
these in the hope that one day we’ll see radical improvements in the findings
of our global survey. While the situation is far from perfect, it’s also
important to appreciate the small but important progress that some countries
or regions made. No step is too short or change too small when facing issues
so big.” 11 Mar
2023 Source: https://winmr.com/women-worldwide-still-facing-uphill-battle-for-equality-and-safety/ |
||||||||||||||||||||||||||||||||||||||||||||||||||||||||