|
BUSINESS & POLITICS IN THE WORLD
GLOBAL OPINION REPORT NO. 810-814
Week:
August 28 – October 1, 2023
Presentation: October 6, 2023
Survey: 70% Of Firms
Supporting Workers’ Fertility Treatments
Survey: Frailty
Increasing Among People In Their 40s, 50s
Church Ties Cited In
40% Of Senior Administrative Positions
Antibody Rate After
COVID Around 70% In Young People
10% Of Japan’s Population
Aged 80 Or Older For First Time
Paternity Leave Remains
Complex, Difficult Decision For Many Fathers
Study: Up To 23% Of
Adults Suffer Post-Infection Symptoms
Companies Seek New
Market For Scallops After China Ban
24% Pakistanis Have A
Device At Home That Runs On Solar Energy
Public Opinion Split If
The New Generation Is Less Or More Religious Than Previous
Generations
Generational
Differences In Digital Platform Usage: A Comparative Analysis
Between Gen Z And Gen Y
Cameroonians Say
Government Must Do ‘Much More’ To Protect The Environment
Moroccans Endorse
Women’s Political Participation But Not Equal Access To Jobs,
Land
Liberians Want Fair And
Competitive Elections, But Mistrust Elections Commission
Britons Concerned About
Climate Change, But Cost Of Living Is A Barrier To Action
Dissatisfaction With
Government On Immigration At Highest Level Since 2015
Almost 9 In 10 Say
Britain Needs A Fresh Team Of Leaders
Most Britons Oppose
Banks And Building Societies Closing Customer Accounts For
Reputational Reasons
Do Student Loan
Repayments Count As ‘Tax’
Sunak Net Favourability
Falls Again To New Low Following Net Zero Announcements
72% Of French People
Think That The Education System Is Deteriorating
65% Of Women Want
Psychological Support In Case Of Personal Or Professional
Difficulties
A Clear Majority Of The
Electorate Considers "The Left" To Be A Weak Party
Only Seven Percent
Germans Very Satisfied With The Federal Government
It Is Becoming More
Widespread, But There Are Still Many Misconceptions About
Temporary Agency Work
Majority Of Americans
Say U.S. Is One Of The Greatest Countries In The World
Why Some Americans
Prefer To Go To Religious Services In Person And Others Prefer
To Watch Virtually
Most Americans Say
Being A Man Helps A Person Get Ahead In The U.S.
Public Has Mixed Views
On The Modern American Family
Americans Are More
Pessimistic Than Optimistic About Many Aspects Of The Country’s
Future
Americans’ Dismal Views
Of The Nation’s Politics
Majority Of Americans
Continue To Favor Moving Away From Electoral College
Black Americans’
Experiences With News
Asian American Voters
Prioritize Candidates’ Policy Positions Over Their Racial
Identity
Trudeau’s Approval
Drops To Three-Year Low; Party Trails By 12-Points In Vote
Intention
Two-In-Five Canadians
Say They Face Discrimination Based On Their Ethnicity Or Race
ANZ-Roy Morgan Consumer
Confidence Down 3.4pts To 76.4 – Lowest Since Mid-August
2.8 Million New
Zealanders Now Read Newspapers And Almost 1.7 Million Read
Magazines
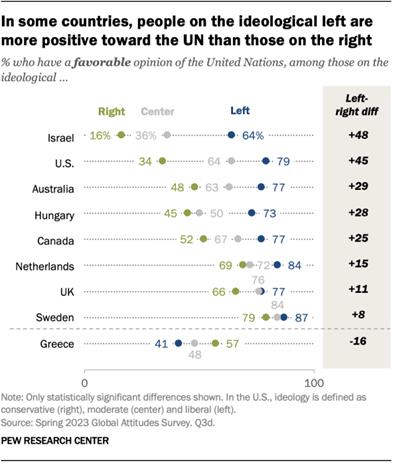
People Across 24
Countries Continue To View UN Favorably
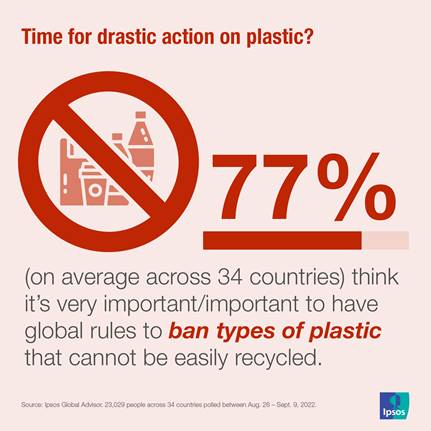
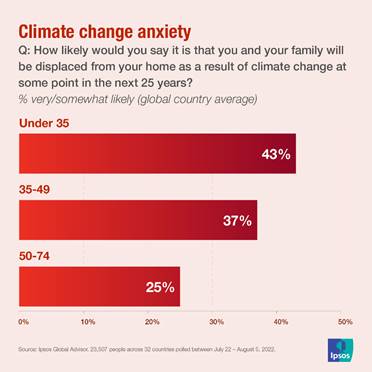
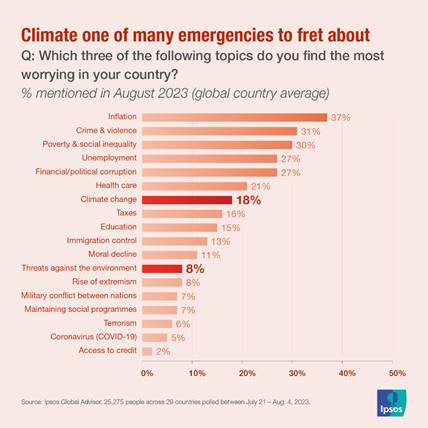
Data Dive: How People
Around The World Feel About Climate Change, A Survey Across 36
Nations
In 29 Countries People
More Likely To Think Their Education System Is Poor Than Good
Buddhism, Islam And
Religious Pluralism In South And Southeast Asia, Survey In 6
Asian Countries
A Quarter Of Global
Consumers Don't Feel Comfortable With Online Banking, A Study
Across 48 Markets
INTRODUCTORY NOTE
810-814-43-51/Commentary:
A Peep Into The Social Life Of The Japanese: Japanese Poll
Themselves On Three Subjects. A Report By Asahi Media Group
Survey:
70% Of Firms Supporting Workers’ Fertility Treatments
More
than 70 percent of 100 major companies in Japan have implemented
systems that facilitate employees taking leave for fertility
treatments, an Asahi Shimbun survey showed.
As
insurance coverage for such treatments expands, more businesses
are taking the initiative to support their employees, but there
are still challenges such as protecting employees’ privacy.
“While
we need to share information among team members to some extent
out of consideration, we must balance that with privacy
protection,” said Masaaki Yajima, the president of Wacoal Corp.
The
Asahi Shimbun conducted the survey of the 100 major businesses
from various industries in July asking how they are supporting
employees undergoing fertility treatments.
The
companies were permitted multiple answers.
The
most selected option, among 75 companies, was having “systems or
initiatives in place to make it easier for employees to take
leave for treatments.”
That
was followed by having “systems or initiatives that allow
flexible working hours and break hours” at 64 companies.
Nomura
Holdings Inc. in 2020 revamped its policy to allow up to 50 days
of medical leave for fertility treatments. It also introduced a
maximum of one-year leave for such treatments to provide
long-term support.
Osaka
Gas Co. has a system in place that allows employees to reduce
their daily work hours by up to four hours and 40 minutes if
they require outpatient treatment, though this is not limited to
fertility treatments.
Twenty-five companies responded that they are providing
“subsidies for fertility treatment costs.”
Kokuyo
Co. offers subsidies of up to 300,000 yen ($2,048) over two
years to cover the cost of the treatments. The employees can
apply to a mutual aid association without reporting it to their
bosses.
When
asked about challenges to supporting employees seeking
treatment, the most selected option was “privacy protection”
with 52 companies, followed by “a lack of understanding about
fertility treatments within the company” from 42 respondents.
Infertility “is a problem that’s hard to bring to light because
it is difficult for companies to recognize employees having such
concerns,” said Koki Sato, the head of the nonprofit
organization Forecia, which supports employees balancing work
and fertility treatments.
He
emphasized the importance of an easily accessible leave system
for workers and having a way to share information within the
company while protecting privacy.
Sato
added that employees may hesitate to give the reasons for their
leave to their bosses.
“Companies can introduce a system where employees don’t have to
specify a reason for needing to take leave by offering leave or
shortened working hours for a variety of purposes, such as a
child suddenly falling ill or caregiving,” he said.
“When
employees report (fertility treatments) to their bosses, it is
important both sides confirm who should be informed and how much
they should know,” Sato added. “Bosses should also have basic
knowledge about treatments as much as possible.”
(Asahi
Shimbun)
29
August 2023
Source:
https://www.asahi.com/ajw/articles/14992434
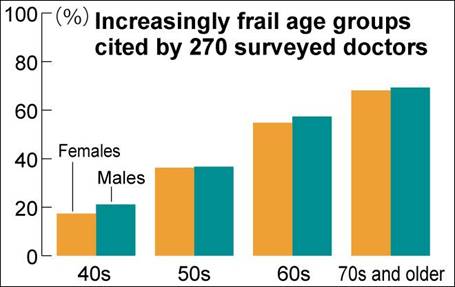
Survey:
Frailty Increasing Among People In Their 40s, 50s
Doctors are urging
people to consume more protein to halt a surge in frailty, a
condition marked by declining muscle strength and weakened
mental and physical vigor.
An online survey
conducted by the Japan Preventive Association of Lifestyle
related Disease (JPALD) in March and April showed that frailty
has increased, particularly among those in their 40s and 50s.
A total of 330 doctors,
consisting of 110 internists, 110 orthopedists and 110
industrial physicians, gave valid responses.
More than 80 percent of
respondents said the number of frail patients has risen, with
11.8 percent citing a “substantial increase,” 31.8 percent
citing an “increase,” and 38.2 percent citing a “slight
increase.”
Asked which age group
they think is increasingly frail, and allowed to give multiple
answers, most respondents picked people in their 60s or older.
Frailty may be
associated with old age, but the survey also showed a rise in
the condition among middle-aged people.
According to the survey,
36.7 percent of respondents cited men in their 50s, 36.3 percent
selected women in their 50s, 21.1 percent picked men in their
40s, and 17.4 percent chose women in their 40s.
And 75.5 percent said
the number of people between 20 and 65 who can be regarded as in
a “pre-frailty” stage has risen.
As for reasons for the
increases, reduced muscle mass was cited by 78.7 percent of
respondents, decreased exercise habits by 77.1 percent, and
going out less frequently by 75.9 percent.
About 90 percent said
the number of frail and pre-frail individuals will increase
further.
Many respondents said
efforts to prevent frailty should start at a relatively young
age, with the 40s cited by 30.5 percent, the 50s by 20.9
percent, and the 30s by 20.6 percent.
To prevent frailty,
those in the prime of their working life should routinely
exercise, increase their walking time, maintain muscle mass, get
enough sleep and follow a balanced diet, the doctors said.
“Protein deficiency
leads to reduced muscle mass and heightened risks of normal
weight obesity and pre-frailty,” said Hiroshi Yoshida, a JPALD
director who also serves as director at the Jikei
University-affiliated Kashiwa Hospital. “I want people to
improve their conditions through dietary habits of consuming
meat, fish and dairy products.”
(Asahi
Shimbun)
12
September 2023
Source:
https://www.asahi.com/ajw/articles/14985739
Church
Ties Cited In 40% Of Senior Administrative Positions
More
than 40 percent of newly appointed senior vice ministers and
parliamentary secretaries have acknowledged past ties with the
Unification Church, formerly known as the World Peace and
Unification Family Federation, or its related organizations.
The
appointments followed the Sept. 13 reshuffle of Prime Minister
Fumio Kishida’s Cabinet.
Twenty-six out of 54 lawmakers admitted to having some
connection with scandal-plagued group through surveys conducted
by The Asahi Shimbun last year and in-house screenings by the
ruling Liberal Democratic Party.
Among
the 26 senior vice ministers, 11 admitted to having had some tie
in the past with the Unification Church, and among the 28
parliamentary secretaries, 15 said the same. Some of the
politicians also received donations or paid to attend functions
hosted by the church or related groups.
One of
the individuals is Lower House member Shuhei Aoyama, newly
appointed senior vice minister of the Ministry of Education,
Culture, Sports, Science and Technology, responsible for
handling issues related to the Unification Church.
He
admitted to having had interactions with related organizations
during the party’s screenings last year following the July 2022
slaying of former Prime Minister Shinzo Abe in Nara city.
The
gunman blamed his mother’s huge donations to the Unification
Church for his lousy childhood and said he targeted Abe because
of the veteran politician’s longstanding ties with the church,
which has long been regarded as a social menace. The revelations
sparked a government investigation into the church that is
expected to result in the government requesting a court order to
disband the organization.
The
Asahi Shimbun conducted the survey from August to September last
year, asking all lawmakers about their connections with the
Unification Church. In September the same year, the LDP also
conducted screenings of its members’ relationship with the
church and its affiliated groups, and publicly disclosed the
results.
The
Asahi Shimbun also contacted newly elected lawmakers this past
January about their connections with the Unification Church.
Among
the newly appointed ministers on Sept. 13, four individuals,
admitted to having had some connection with the Unification
Church. They included Koichi Hagiuda, who retained his position
as chairman of the LDP’s Policy Research Council.
(Asahi
Shimbun)
16
September 2023
Source:
https://www.asahi.com/ajw/articles/15007194
SUMMARY OF POLLS
ASIA
(Japan)
Survey: 70% Of Firms Supporting
Workers’ Fertility Treatments
The
Asahi Shimbun conducted the survey of the 100 major businesses
from various industries in July asking how they are supporting
employees undergoing fertility treatments. More than 70 percent
of 100 major companies in Japan have implemented systems that
facilitate employees taking leave for fertility treatments, an
Asahi Shimbun survey showed. As insurance coverage for such
treatments expands, more businesses are taking the initiative to
support their employees, but there are still challenges such as
protecting employees’ privacy.
(Asahi
Shimbun)
29
August 2023
Survey: Frailty Increasing Among People In Their 40s, 50s
An
online survey conducted by the Japan Preventive Association of
Lifestyle related Disease (JPALD) in March and April showed that
frailty has increased, particularly among those in their 40s and
50s. A total of 330 doctors, consisting of 110 internists, 110
orthopedists and 110 industrial physicians, gave valid
responses. More than 80 percent of respondents said the number
of frail patients has risen, with 11.8 percent citing a
“substantial increase,” 31.8 percent citing an “increase,” and
38.2 percent citing a “slight increase.”
(Asahi
Shimbun)
12
September 2023
Church Ties Cited In 40% Of Senior Administrative Positions
More
than 40 percent of newly appointed senior vice ministers and
parliamentary secretaries have acknowledged past ties with the
Unification Church, formerly known as the World Peace and
Unification Family Federation, or its related organizations.
Twenty-six out of 54 lawmakers admitted to having some
connection with scandal-plagued group through surveys conducted
by The Asahi Shimbun last year and in-house screenings by the
ruling Liberal Democratic Party.
(Asahi
Shimbun)
16
September 2023
Antibody Rate After COVID Around 70% In Young People
The finding by the Ministry of Health, Labor and Welfare was announced
Sept. 15 in response to a survey it carried out. The percentage
of people in Japan who produced antibodies after becoming
infected with the novel coronavirus was found to be around 70
percent among those aged 5 to 29, but only between 20 and less
than 30 percent among elderly patients.
(Asahi
Shimbun)
17
September 2023
10% Of Japan’s Population Aged 80 Or Older For First
Time
The graying of Japanese society seems to have turned a lot grayer.
An estimated 36.23
million people in Japan were aged 65 or older as of Sept. 15.
The percentage of the total population rose to a record 29.1
percent, up 0.1 point from 2022. But the number fell for the
first time since comparable statistics became available in 1950
because the demographic group now reaching the age of 65 is
relatively small. An estimated 20.51 million women were aged 65
or older, unchanged from 2022 and accounting for 32.1 percent of
the female population.
(Asahi
Shimbun)
17
September 2023
Paternity Leave Remains Complex, Difficult Decision For Many
Fathers
While the rate for men who took paternity leave in Japan hit a record
high in the last fiscal year, only about two in 10 eligible took
it as the choice remains complicated. In fiscal 2022, 17.13
percent of men took paternity leave, 3.16 percentage points
higher than the previous fiscal year, according to the welfare
ministry. In comparison, 80.2 percent of women took child care
leave in the last fiscal year. Sept. 19 is dubbed “ikukyu wo
kangaeru hi” (The day to think about child care leave) in Japan.
(Asahi
Shimbun)
19
September 2023
Study: Up To 23% Of Adults Suffer Post-Infection Symptoms
From 11.7 percent to 23.4 percent of adults infected with the novel
coronavirus experienced “post-infection” symptoms, two to four
times the rate for children, a health ministry research team
said. The post-infection rate was around 6.3 percent among
children, the team’s survey found. Both adults and children who
had been vaccinated before infection had a lower rate of
post-infection symptoms than those who were unvaccinated,
according to the survey.
(Asahi
Shimbun)
19
September 2023
Companies Seek New Market For Scallops After China Ban
Seafood suppliers are struggling to get their products to market after
China banned Japanese seafood imports in response to the
discharge of treated radioactive water from the crippled
Fukushima No. 1 nuclear power plant. According to a survey by
the Fisheries Agency, prices of scallops in Hokkaido and three
other prefectures have plunged 11 to 27 percent since China
imposed its ban. Last year, Japan exported seafood worth 83.6
billion yen ($562.9 million) to China. Scallops accounted for
48.9 billion yen, followed by sea cucumbers at 9.8 billion yen.
(Asahi
Shimbun)
25
September 2023
(Pakistan)
24%
Pakistanis Have A Device At Home That Runs On Solar Energy
According to a survey conducted by Gallup & Gilani Pakistan, 24%
Pakistanis have a device at home that runs on solar energy. A
nationally representative sample of adult men and women from
across the country, was asked the question “Do you have any
gadget or device at your home that runs on solar energy?” In
response, 24% said yes, and 76% said no.
(Gallup
Pakistan)
14
September 2023
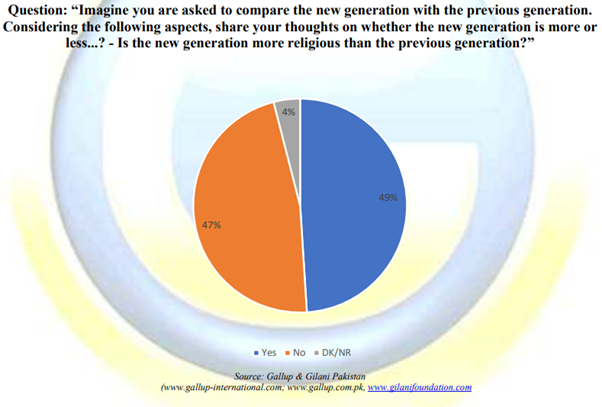
Public Opinion Split If The New Generation Is Less Or More
Religious Than Previous Generations
A
nationally representative sample of adult men and women from
across the country, was asked the question “Imagine you are
asked to compare the new generation with the previous
generation. Considering the following aspects, share your
thoughts on whether the new generation is more or less...? - Is
the new generation more religious than the previous generation?”
In response, 49% said yes, 47% said no and 4% said that they do
not know or gave no response.
(Gallup
Pakistan)
21
September 2023
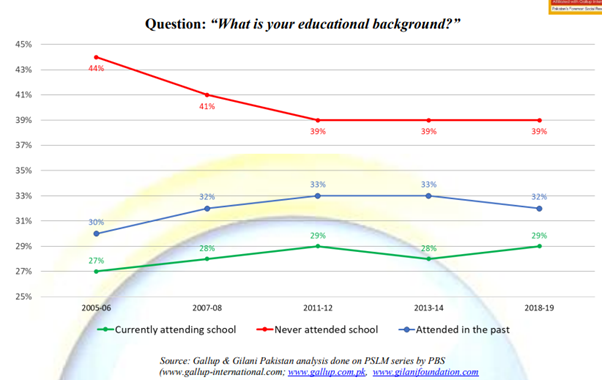
Proportion Of Pakistanis Reporting Never Having Attended School
Decreased By 5%, While Those Currently Attending School To Have
Increased By 2% Between 2005-06 And 2018-19
A
representative sample of Pakistanis over the age of 10 years
from across the country was asked the following question, “What
is your educational background?” In response to this question,
27% responded that they are currently attending school, 30% said
that they have attended school in the past, and 44% responded
that they have never attended school. Comparative Picture: This
question was asked again in 2018-19 to allow a comparison to be
made across the years. In 2018-19, 29% responded that they are
currently attending school, 32% said that they have attended
school in the past, and 39% responded that they have never
attended school.
(Gallup
Pakistan)
22
September 2023
(Indonesia)
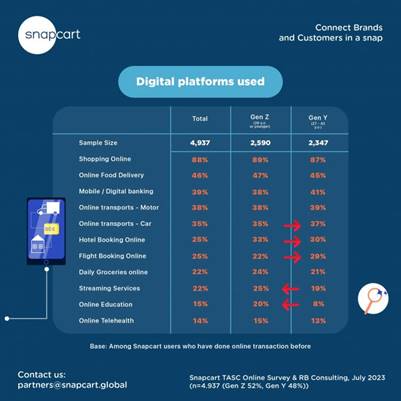
Generational Differences In Digital Platform Usage: A
Comparative Analysis Between Gen Z And Gen Y
Snapcart collaborated again with Iwan Murty, one of
our early angel investors and a seasoned marketing researcher,
to explore the differences in digital platform usage between two
prominent generations: Generation Z and Generation Y. By
understanding their preferences and behaviors, we can uncover
potential business implications for industries aiming to cater
to these distinct consumer segments. The research highlights the
nuanced differences in digital platform usage between Generation
Z and Generation Y.
(Snapcart)
14
September 2023
AFRICA
(Cameron)
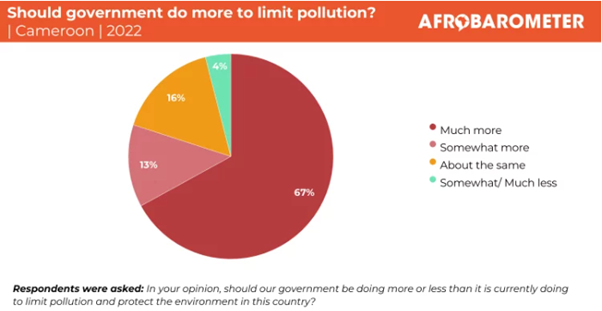
Cameroonians Say Government Must Do ‘Much More’
To Protect The Environment
More than seven in 10 Cameroonians (72%) say pollution is a serious
problem in their community. o Citizens cite deforestation (23%),
human waste management (23%), trash disposal (22%), and
pollution of water sources (19%) as the most important
environmental issues in their community. o Three-fourths (76%)
of respondents say plastic bags are a major source of pollution
in Cameroon. Cameroonians believe the primary responsibility for
reducing pollution and keeping communities clean falls on
ordinary citizens (36%), the national government (26%), and the
local government (21%).
(Afrobarometer)
11
September 2023
(Morocco)
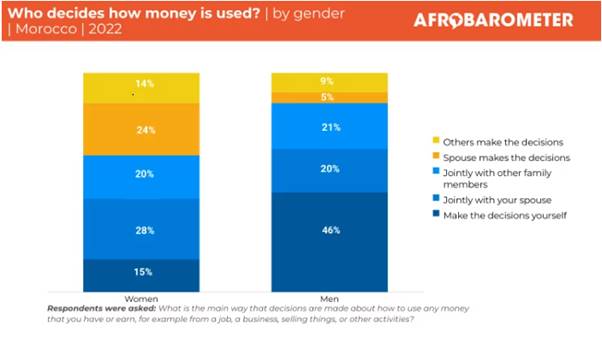
Moroccans Endorse Women’s Political Participation
But Not Equal Access To Jobs, Land
Fewer than four in 10 Moroccans (36%) say women should have the same
rights as men to jobs, and only 42% say women should have equal
rights to own or inherit land. o Women and men differ sharply in
their views on equality in hiring and land ownership. o
Moroccans cite inequality in workplace opportunities or pay as
the most important women’s-rights issue that their government
and society must address.
(Afrobarometer)
21
September 2023
(Liberia)
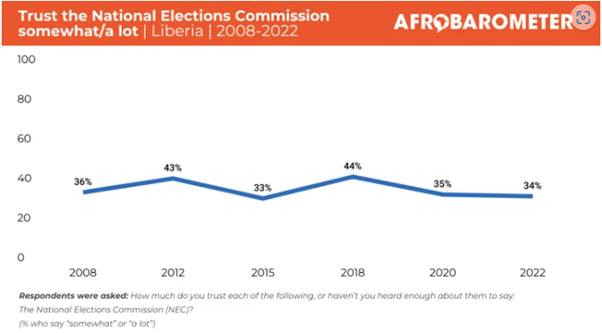
Liberians Want Fair And Competitive Elections,
But Mistrust Elections Commission
An overwhelming majority (92%) of Liberians support elections as the
best way to choose their leaders.
About six in 10 (59%) say
Liberia needs many political parties to ensure that voters have
a real choice, a 9-percentage-point rebound from 2020.
Majorities say elections
do not work well to ensure that members of the House of
Representatives (61%) and senators (60%) reflect the views of
voters. But more than half (55%) say elections do enable voters
to remove from office leaders who do not do what the people
want.
(Afrobarometer)
26
September 2023
WEST EUROPE
(UK)
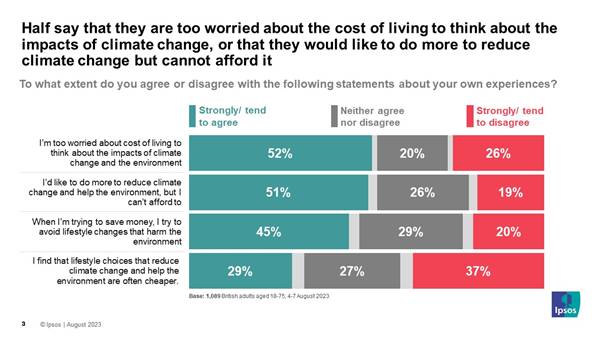
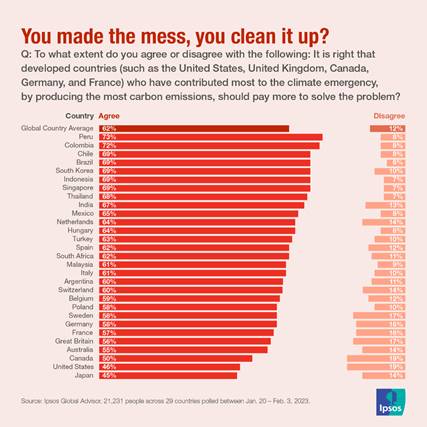
Britons Concerned About Climate Change, But Cost
Of Living Is A Barrier To Action
New polling by Ipsos reveals concern about the impacts of climate change
among Britons, with 2 in 5 (41%) believing the economic costs of
climate change itself will be greater than the cost of measures
to reduce it. By contrast, only 1 in 5 (22%) think
measures to reduce it will be more costly, with an equal share
(19%) saying there will be little difference between the cost of
each. Half of Britons say they are too worried about the cost of
living to think about the impact of climate change (52%) or
would like to do more to reduce climate change but cannot afford
to (51%).
(Ipsos
MORI)
3
September 2023
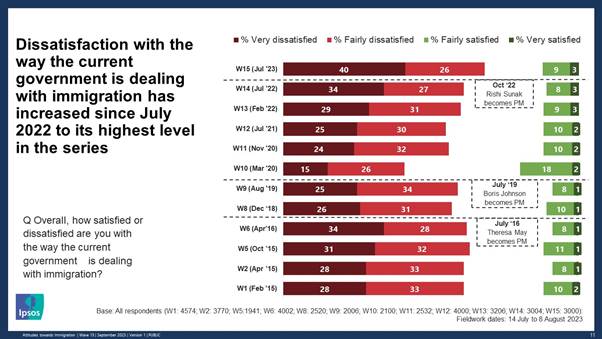
Dissatisfaction With Government On Immigration At
Highest Level Since 2015
Public dissatisfaction with the Government’s handling of immigration is
at its highest level since before the EU referendum, according
to the latest findings of an authoritative survey that has
tracked public attitudes to immigration since 2015. Two-thirds
of the public (66%) are dissatisfied with the way the Government
is dealing with immigration, according to the Immigration
Attitudes Tracker from Ipsos and British
Future –
the highest level in the tracker’s history. Just 12% say they
are satisfied.
(Ipsos
MORI)
12
September 2023
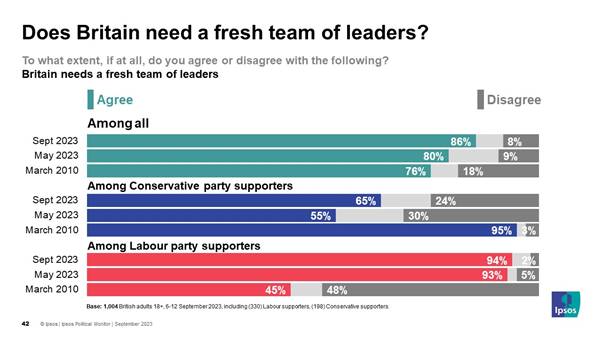
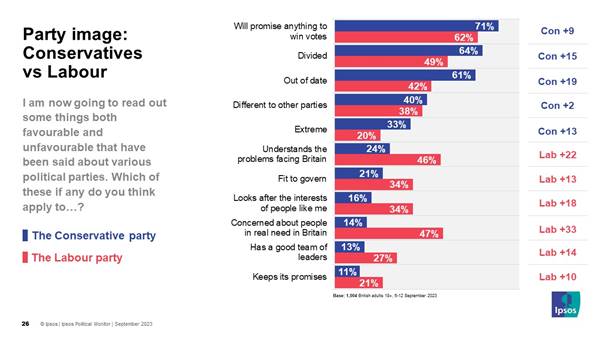
Almost 9 In 10 Say Britain Needs A Fresh Team Of
Leaders
The latest Ipsos Political Monitor, taken 6th to 12th September 2023,
explored public attitudes to the Labour and Conservative parties
and their leaders, when the next General Election should take
place and headline voting intention. Voting intention: Labour
lead stands at 20 points. Labour 44% (-1 from July),
Conservatives 24% (-4), Lib Dems 12% (nc), Greens 8% (+2), Other
11% (+2pts). 46% of those with a voting intention have
‘definitely decided’ who they are going to vote for.
(Ipsos
MORI)
19
September 2023
Just One In Ten Members Of The Public Think The
Government Has The Right Policies In Place For The NHS
The public remain sceptical about the quality of services provided by
the NHS - only a third (33%) of the public think the NHS is
providing a good service nationally. This is consistent with
public opinion recorded in November 2022, but still notably
lower than in May 2022 and November 2021 (43% and 44%,
respectively). Addressing the pressure on or workload of NHS
staff (40%) and increasing the number of staff in the NHS (39%)
are seen as the top priorities.
(Ipsos
MORI)
27
September 2023
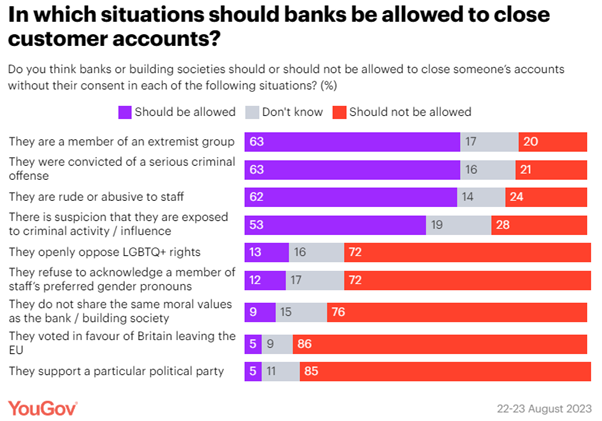
Most Britons Oppose Banks And Building Societies
Closing Customer Accounts For Reputational Reasons
New YouGov data shows that three-quarters of the public (74%) believe
institutions should only close an account if they deem the
holder to pose a clear financial, regulatory, or legal risk –
just 15% think they should be allowed to close an account
to protect their public image. On the question of whether banks
have become too politically motivated, two in five say they have
(40%), and just 4% think they could stand to be more politically
motivated. A quarter (25%) believe they have struck the right
balance.
(YouGov
UK)
5
September 2023
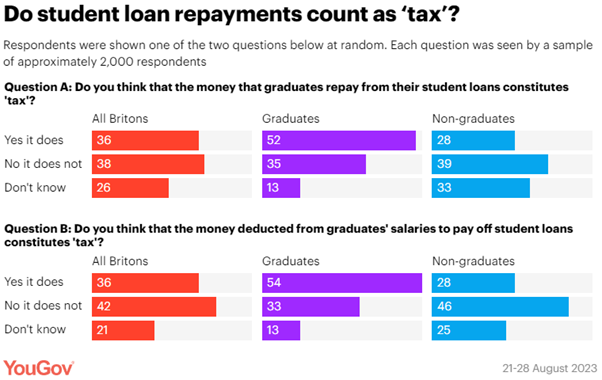
Do Student Loan Repayments Count As ‘Tax’
A recent report on tax
rates highlighted
how a graduate earning Ł35,000 a year pays almost double the
average tax of someone with the same income from rent on
property. YouGov tested two different question wordings, with
both getting similar results.
Asking “Do you think that
the money that graduates repay from their student loans
constitutes 'tax'?” resulted in a very close split, with 36%
saying that it does and 38% feeling that it does not. .
Our other question “Do you
think that the money deducted from graduates’ salaries to pay
off student loans constitutes 'tax'?” resulted in a slightly
wider difference, with 36% again saying that it does but 42%
answering that it does not.
(YouGov
UK)
12
September 2023
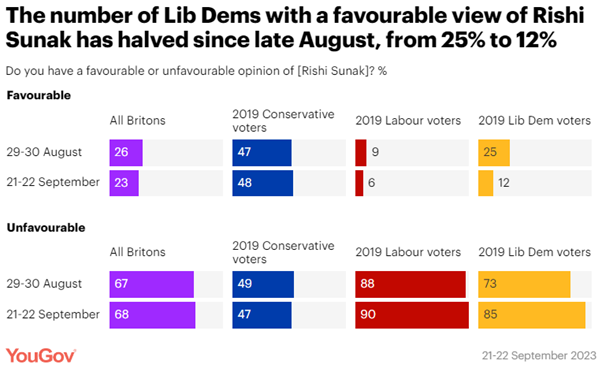
Sunak Net Favourability Falls Again To New Low
Following Net Zero Announcements
YouGov polling on 21-22 September finds Rishi Sunak’s net favourability
rating now stands at -45, his lowest score to date. Some 68% of
Britons currently have an unfavourable view of the prime
minister (from 67% in late August), the highest figure since
becoming prime minister, while only 23% have a favourable view
(from 26%), his lowest to date .
(YouGov
UK)
22
September 2023
(France)
72% Of French People Think That The Education
System Is Deteriorating
Ipsos asked the French about their opinion of the education system in
the country. They judge it quite negatively, 52% of French
people even think it is bad, and only 20% consider it "good",
against respectively 36 and 33% in the world. Nearly one in two
citizens in the world (46%) consider that the situation in which
the education system finds itself is deteriorating compared to
the period when they were in school. The French are among the
most nostalgic and critical, since they are 72% to believe that
the situation has deteriorated, against only 12% to consider it
better.
(Ipsos
France)
4
September 2023
65% Of Women Want Psychological Support In Case
Of Personal Or Professional Difficulties
Nearly 8 out of 10 employees say they are satisfied with their work, a
figure that has been stable since 2011. Their confidence in
their professional future remains high (75%). This figure
continued to increase between 2012 (64%) and 2018 (73%). After a
decline in 2019 (70%), it starts to rise again in 2020. The
assessment of their quality of life at work by employees has
increased from year to year: 32% considered it good in 2012,
they are 41% in 2023. 72% of employees are satisfied with the
level of flexibility offered by their company, a figure up 4
points compared to 2020.
(Ipsos
France)
22
September 2023
(Germany)
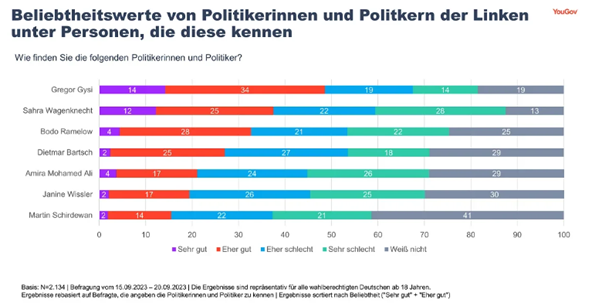
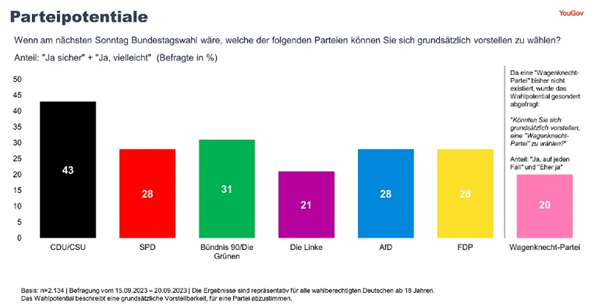
A Clear Majority Of The Electorate Considers "The
Left" To Be A Weak Party
In a recent survey by the international data & analytics group YouGov,
2,134 eligible voters aged 18 and over were interviewed from 15
to 20 September 2023 on topics related to the left. According to
the survey, only 19 percent consider the party to be united,
while almost two-thirds of the electorate (63 percent) consider
it divided. This is significantly more than, for example, the
governing parties SPD (46 percent "rather divided" and "very
divided"), FDP (36 percent), or the Greens (47 percent). Almost
three-quarters (72 percent) of the German electorate say they
are dissatisfied with the work of the federal government.
(YouGov
Germany)
29
September 2023
Only Seven Percent Germans Very Satisfied With
The Federal Government
Only about one in ten Germans (11%) say they are very satisfied with the
work of the Green minister, while more than half (54%) rate his
work very negatively. His net satisfaction, i.e. the difference
between those who are very satisfied and very dissatisfied, is
thus only -43. Economics Minister Robert Habeck, on the other
hand, who lost a total of 21 points on the satisfaction scale in
the last surveys in May and July, was able to stop his downward
trend in September. His net satisfaction increases by five
points, but remains at a low level of -43.
12
September 2023
(Hungary)
It Is Becoming More Widespread, But There Are
Still Many Misconceptions About Temporary Agency Work
In the 12-month period under review, temporary employment was mentioned
about 14,<> times in the Hungarian community space, and the
topic came up most frequently in content related to market
trends, top lists and employment data. However, social internet
content analysis by Ipsos and Neticle also showed that temporary
employment is a divisive topic and can sometimes be associated
with negative emotions. Prohuman is one of the few providers who
came out of the study with a positive opinion rate.
(Ipsos
Hungary)
21
September 2023
NORTH AMERICA
(USA)
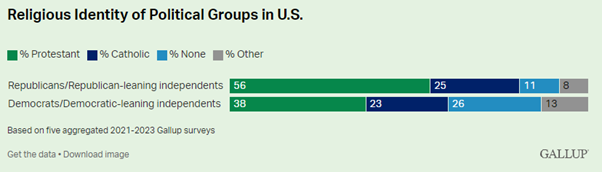
The Politics Of Religion
Americans’ political identity is a powerful correlate of a wide range of
Americans’ attitudes and behaviors, including, in particular, a
wide range of attitudes about hot-button political and social
issues.
One key measure we use in analyzing this politics and religion
relationship is the absence of
religious identity -- those
who, when asked by a survey researcher about their religious
identity, reply that they have none.
“Nones” have risen from essentially zero in some Gallup surveys
in the 1950s to above 20% in recent Gallup surveys (and higher
than that in some other firms’ surveys).
(Gallup
USA)
1
September 2023
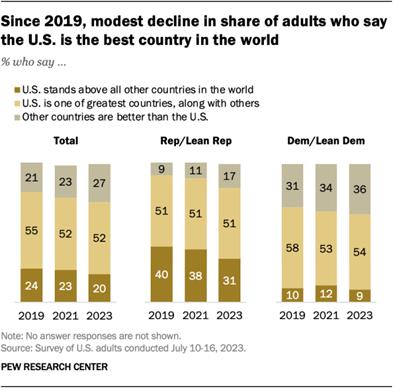
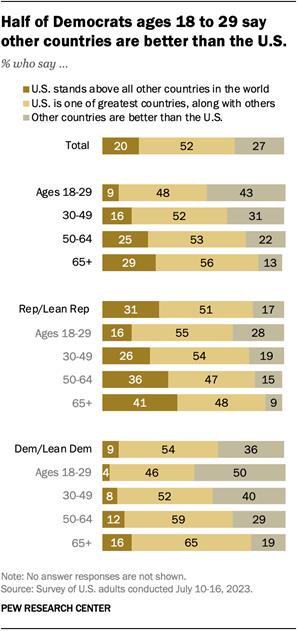
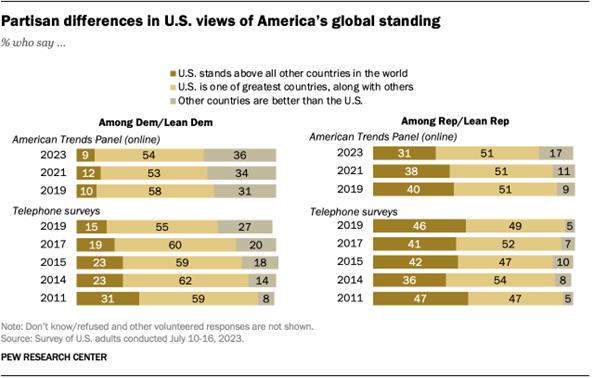
Majority Of Americans Say U.S. Is One Of The
Greatest Countries In The World
Today, two-in-ten Americans say the U.S. “stands above all other
countries in the world.” About half (52%) say the U.S. is “one
of the greatest countries, along with some others,” while 27%
say “there are other countries that are better than the U.S.”
Opinions about the nation’s global standing have changed
slightly since 2019. That year, 24% said the U.S. is the single
greatest nation, 55% said it is one of the best countries, and
21% said other countries are better than the U.S.
(PEW)
29
August 2023
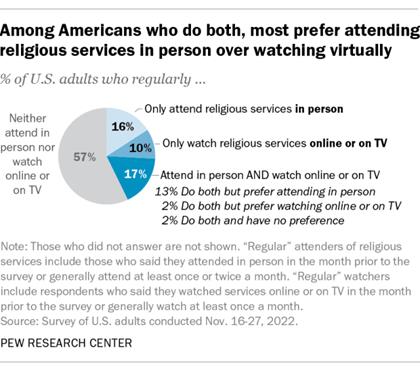
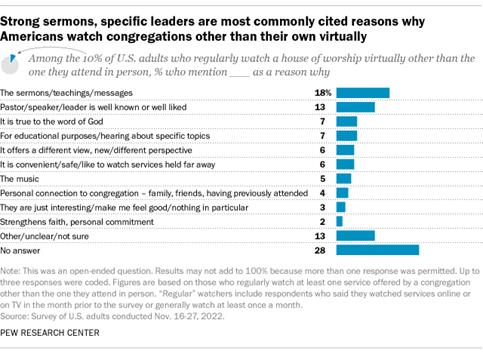
Why Some Americans Prefer To Go To Religious
Services In Person And Others Prefer To Watch Virtually
Some 17% of U.S. adults regularly attend religious services in person and watch
them online or on TV, according to a recent Pew
Research Center survey.
Roughly three-quarters of this group – making up 13% of all U.S.
adults – say they prefer attending in person, while 2% prefer
viewing services virtually and 2% have no preference. Among
those who prefer in-person religious services, the most common
reason respondents give is a stronger sense of connection and
community with fellow participants. About half (52%) say this –
more than three times the share who name any other reason.
(PEW)
6
September 2023
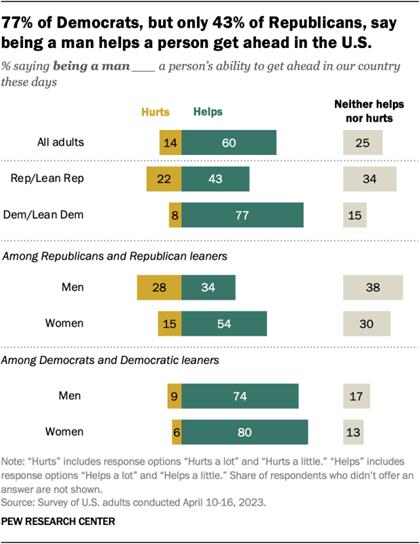
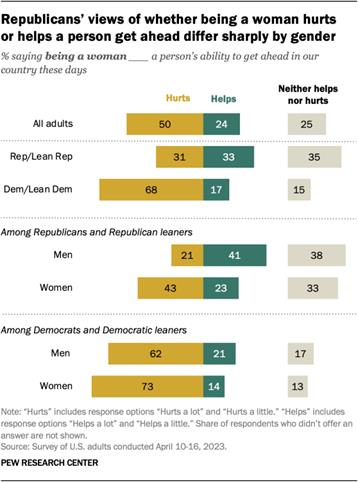
Most Americans Say Being A Man Helps A Person Get
Ahead In The U.S.
Six-in-ten U.S. adults say being a man helps a lot or a little when it
comes to a person’s ability to get ahead in the U.S., compared
with 14% who say it hurts (either a lot or a little). The
picture is very different when it comes to being a woman: Half
of adults say this hurts a person’s ability to get ahead and 24%
say it helps. Some 67% of women say being a man helps a person’s
ability to get ahead at least a little, including 48% who say it
helps a lot. By
comparison, 52% of men say being a man helps, and 28% say it
helps a lot.
(PEW)
12
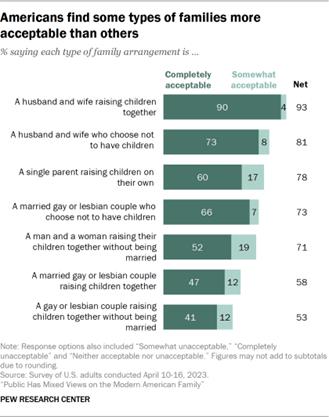
September 2023
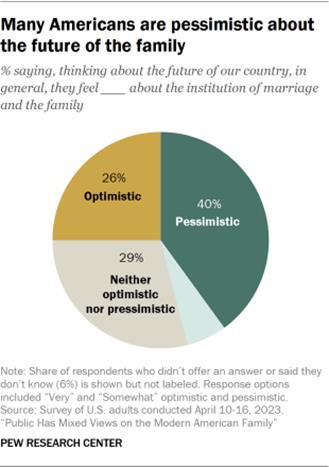
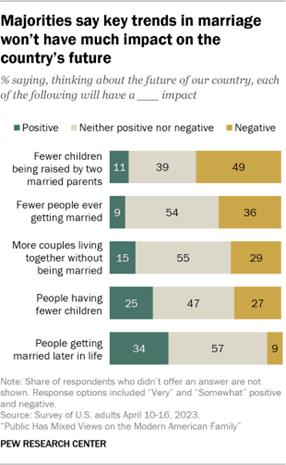
Public Has Mixed Views On The Modern American
Family
Public views of the family are complicated. Americans are more
pessimistic than optimistic about the institution of marriage
and the family. Overall, 40% of Americans say, in thinking about
the future of the country, they are very or somewhat pessimistic
about the institution
of marriage and the family.
Only 25% are very or somewhat optimistic, and 29% say they are
neither optimistic nor pessimistic. Nearly half or more say
other trends – such as people having fewer children or marrying
later in life – will have neither a positive nor negative
impact.
(PEW)
14
September 2023
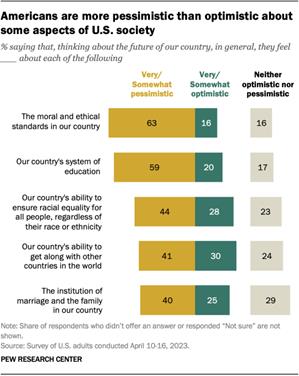
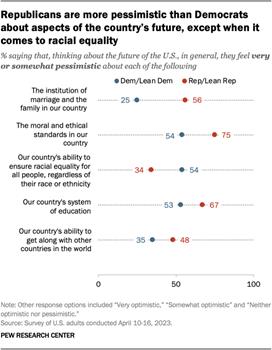
Americans Are More Pessimistic Than Optimistic About Many
Aspects Of The Country’s Future
Americans feel generally pessimistic about the future of the United
States when it comes to several aspects of society, according to
a new Pew Research Center survey. In particular, 63% of
Americans are pessimistic about the country’s moral and ethical
standards, and 59% are pessimistic about its education system.
The United States’ ability to ensure racial equality for all
people, regardless of race or ethnicity (44% are pessimistic,
compared with 28% who are optimistic)
(PEW)
18
September 2023
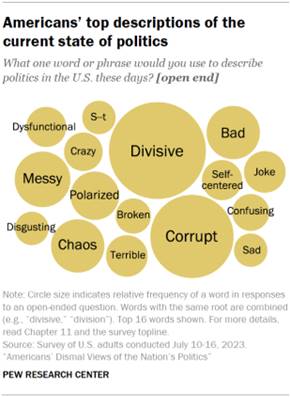
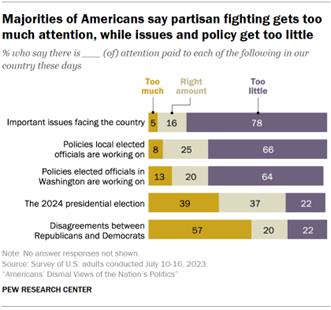
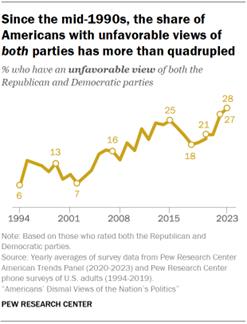
Americans’ Dismal Views Of The Nation’s Politics
A comprehensive new Pew Research Center study of the state of the
nation’s politics finds no single focal point for the public’s
dissatisfaction. Just 4% of
U.S. adults say the political system is working extremely or
very well; another 23% say it is working somewhat
well. About six-in-ten (63%) express not too much or no
confidence at all in the future of the U.S. political system.
Nearly three-in-ten (28%) express unfavorable views of both
parties, the highest share in three decades of polling.
(PEW)
19
September 2023
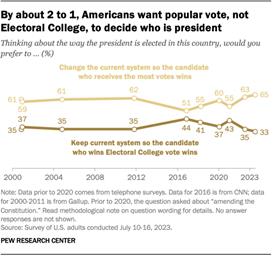
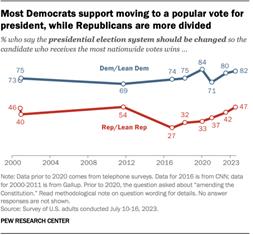
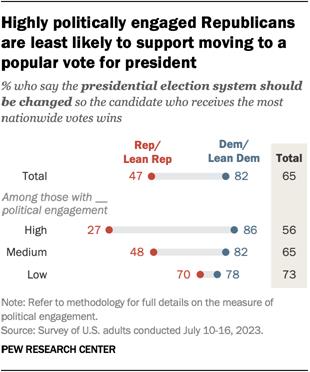
Majority Of Americans Continue To Favor Moving
Away From Electoral College
Nearly two-thirds of U.S. adults (65%) say the way the president is
elected should be changed so that the winner of the popular vote
nationwide wins the presidency. A third favor keeping the
current Electoral College system. Public opinion on this
question is essentially unchanged from last year, though
Americans’ support for using the popular vote to decide the
presidency remains higher than it was a few years ago.
(PEW)
25
September 2023
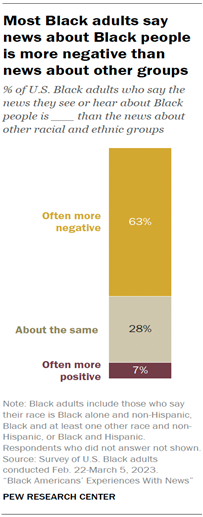
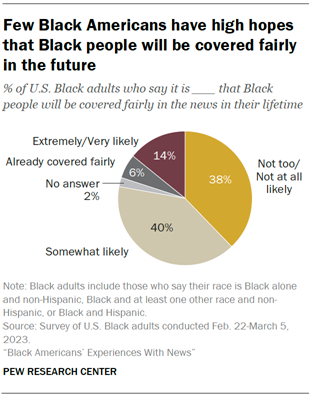
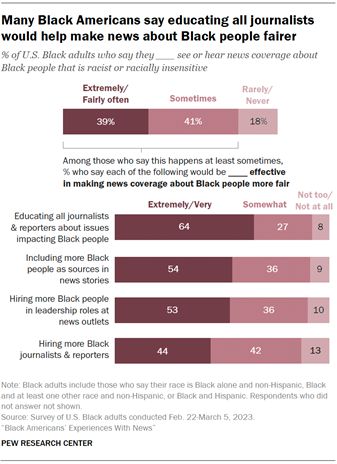
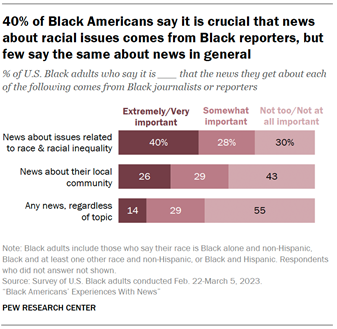
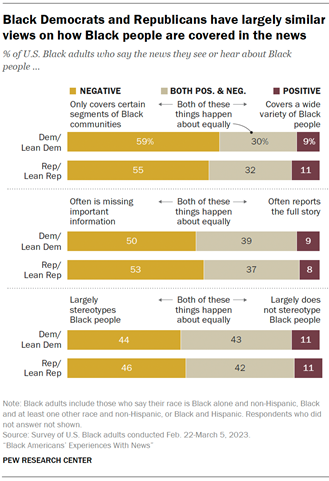
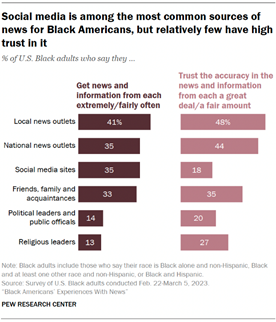
Black Americans’ Experiences With News
Almost two-thirds of Black adults (63%) say news about Black people is
often more negative than news about other racial and ethnic
groups; 28% say it is about equal and 7% say it is often more
positive.
57% say the news only
covers certain segments of Black communities, compared with just
9% who say it covers a wide variety of Black people.
Half say coverage is often
missing important information, while only 9% say it often
reports the full story.
(PEW)
26
September 2023
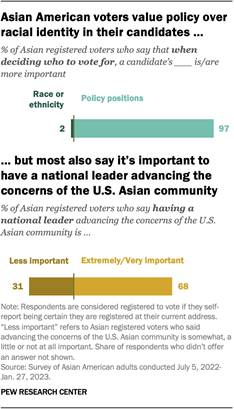
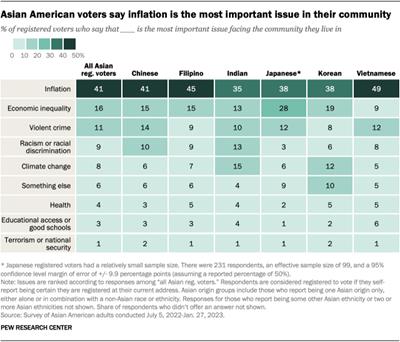
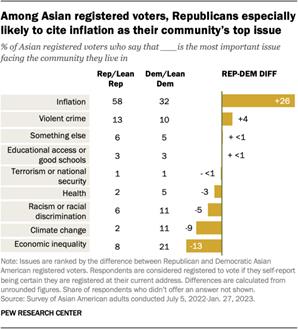
Asian American Voters Prioritize Candidates’ Policy Positions
Over Their Racial Identity
Nearly all Asian American registered voters (97%) say a candidate’s
policy positions are more important than their race or ethnicity
when deciding whom to vote for. This sentiment is widespread
among all major demographic subgroups of Asian registered
voters. At the same time, a 68% majority of Asian registered
voters say it’s extremely or very important to have a national
leader who can advance the concerns of the U.S. Asian community,
according to a nationally representative Pew Research Center
survey conducted from July 2022 to January 2023.
(PEW)
26
September 2023
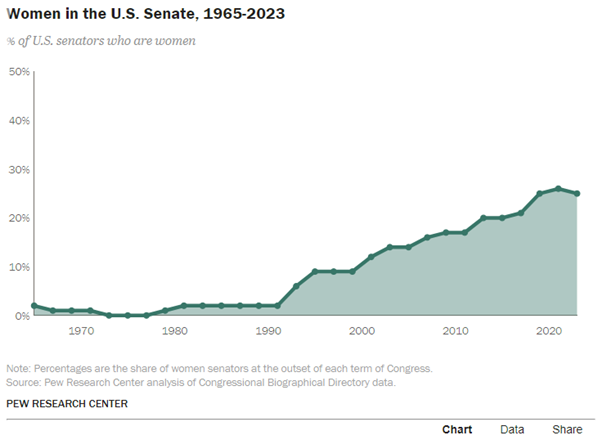
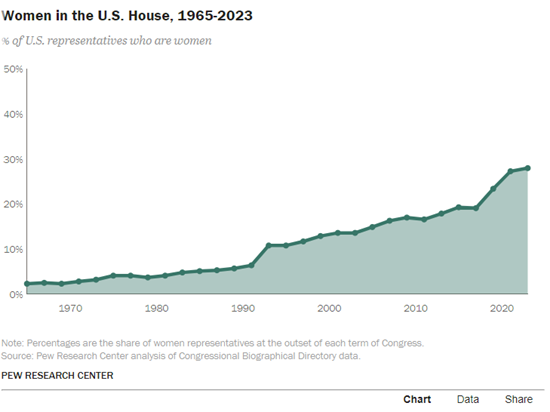
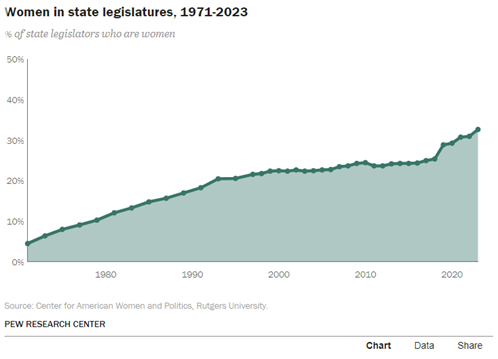
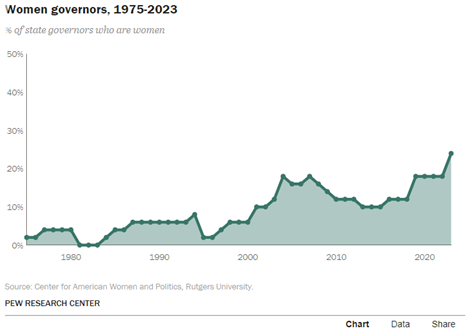
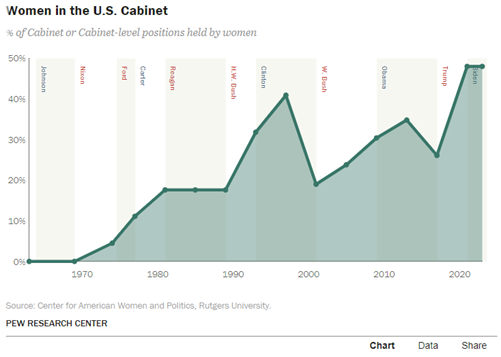
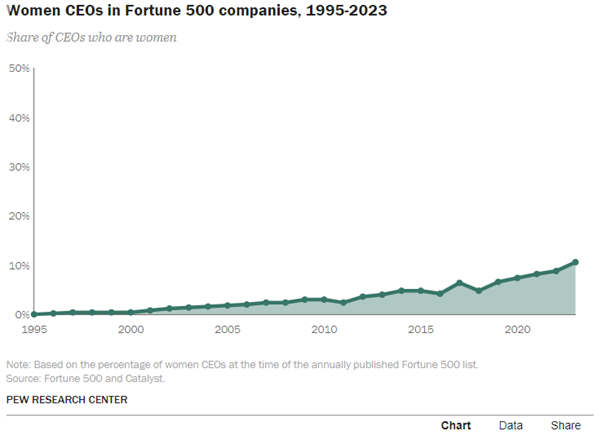
The Data On Women Leaders
As women’s representation in U.S. politics has grown, 53% of Americans
say there are still too few women in high political office in
the United States, and many see significant obstacles for women
candidates. Our 2023
report on women leaders in politics explores
Americans’ views about gender and political leadership, as well
as views about the barriers women face.
(PEW)
27
September 2023
(Canada)
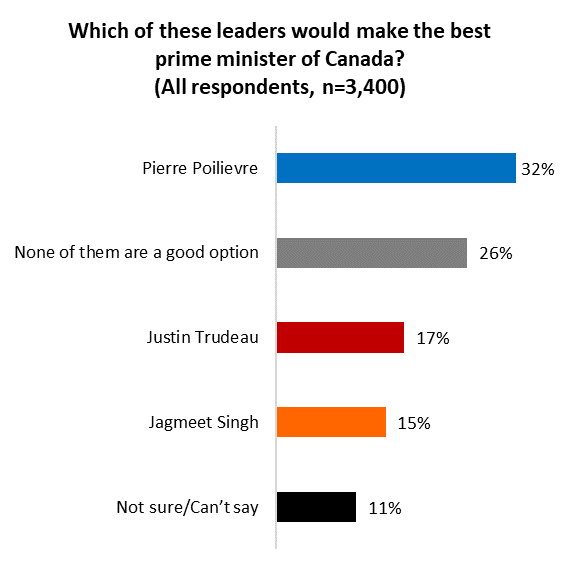
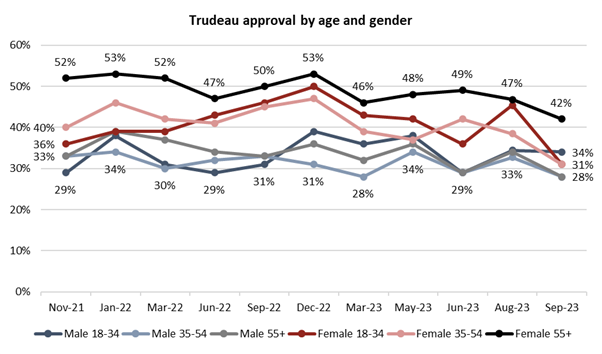
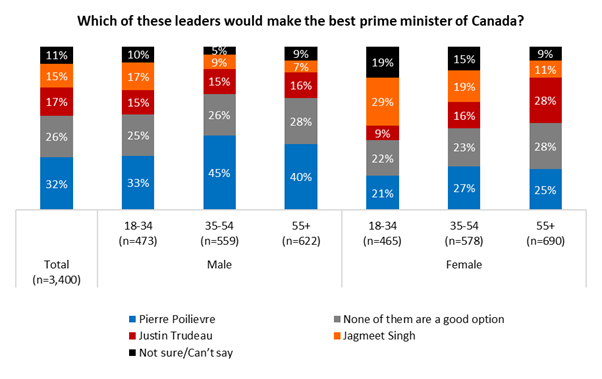
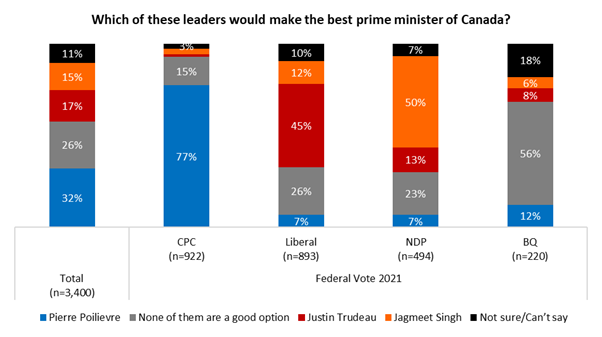
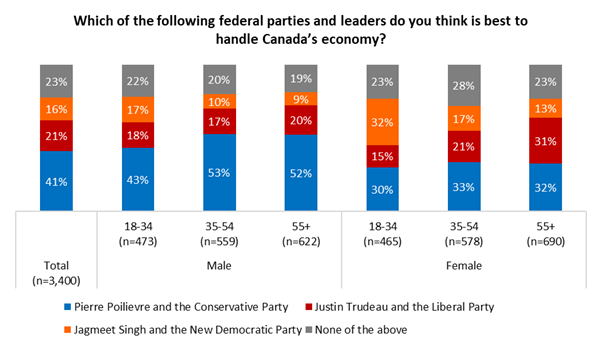
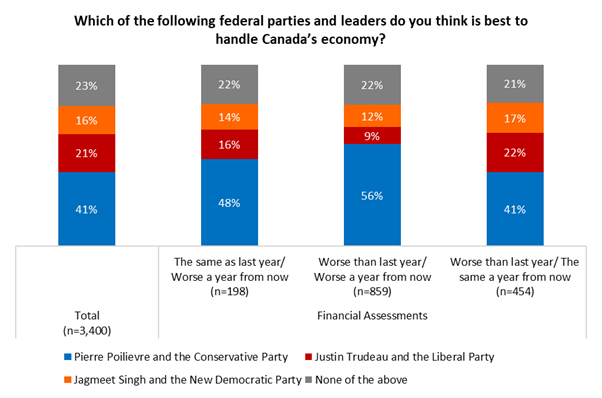
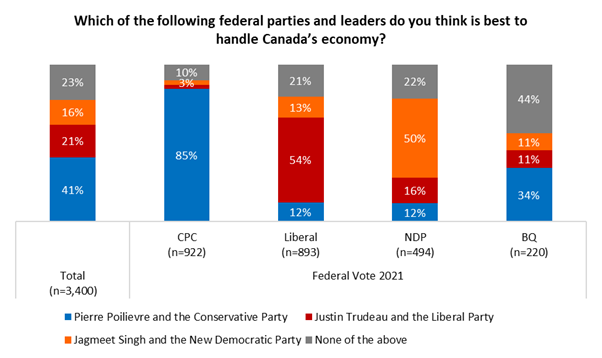
Trudeau’s Approval Drops To Three-Year Low; Party
Trails By 12-Points In Vote Intention
Trudeau’s perceived handling of the ongoing cost-of-living crisis has
sent a significant segment of past LPC voters to both the New
Democrats and opposition Conservatives and sent his personal
approval down to levels unseen since early 2020. This bleeding
of support benefits the Conservative Party directly, with CPC
vote intent now at 39 per cent, a 12-point advantage over the
Liberals. More critically, Conservative leader Pierre Poilievre
is now seen as best prime minister by twice as many as those who
say the same of the actual prime minister (32 versus 17 per
cent) and is additionally viewed by a plurality (41 per cent) as
best to manage the economy.
(Angus
Reid Institute)
7
September 2023
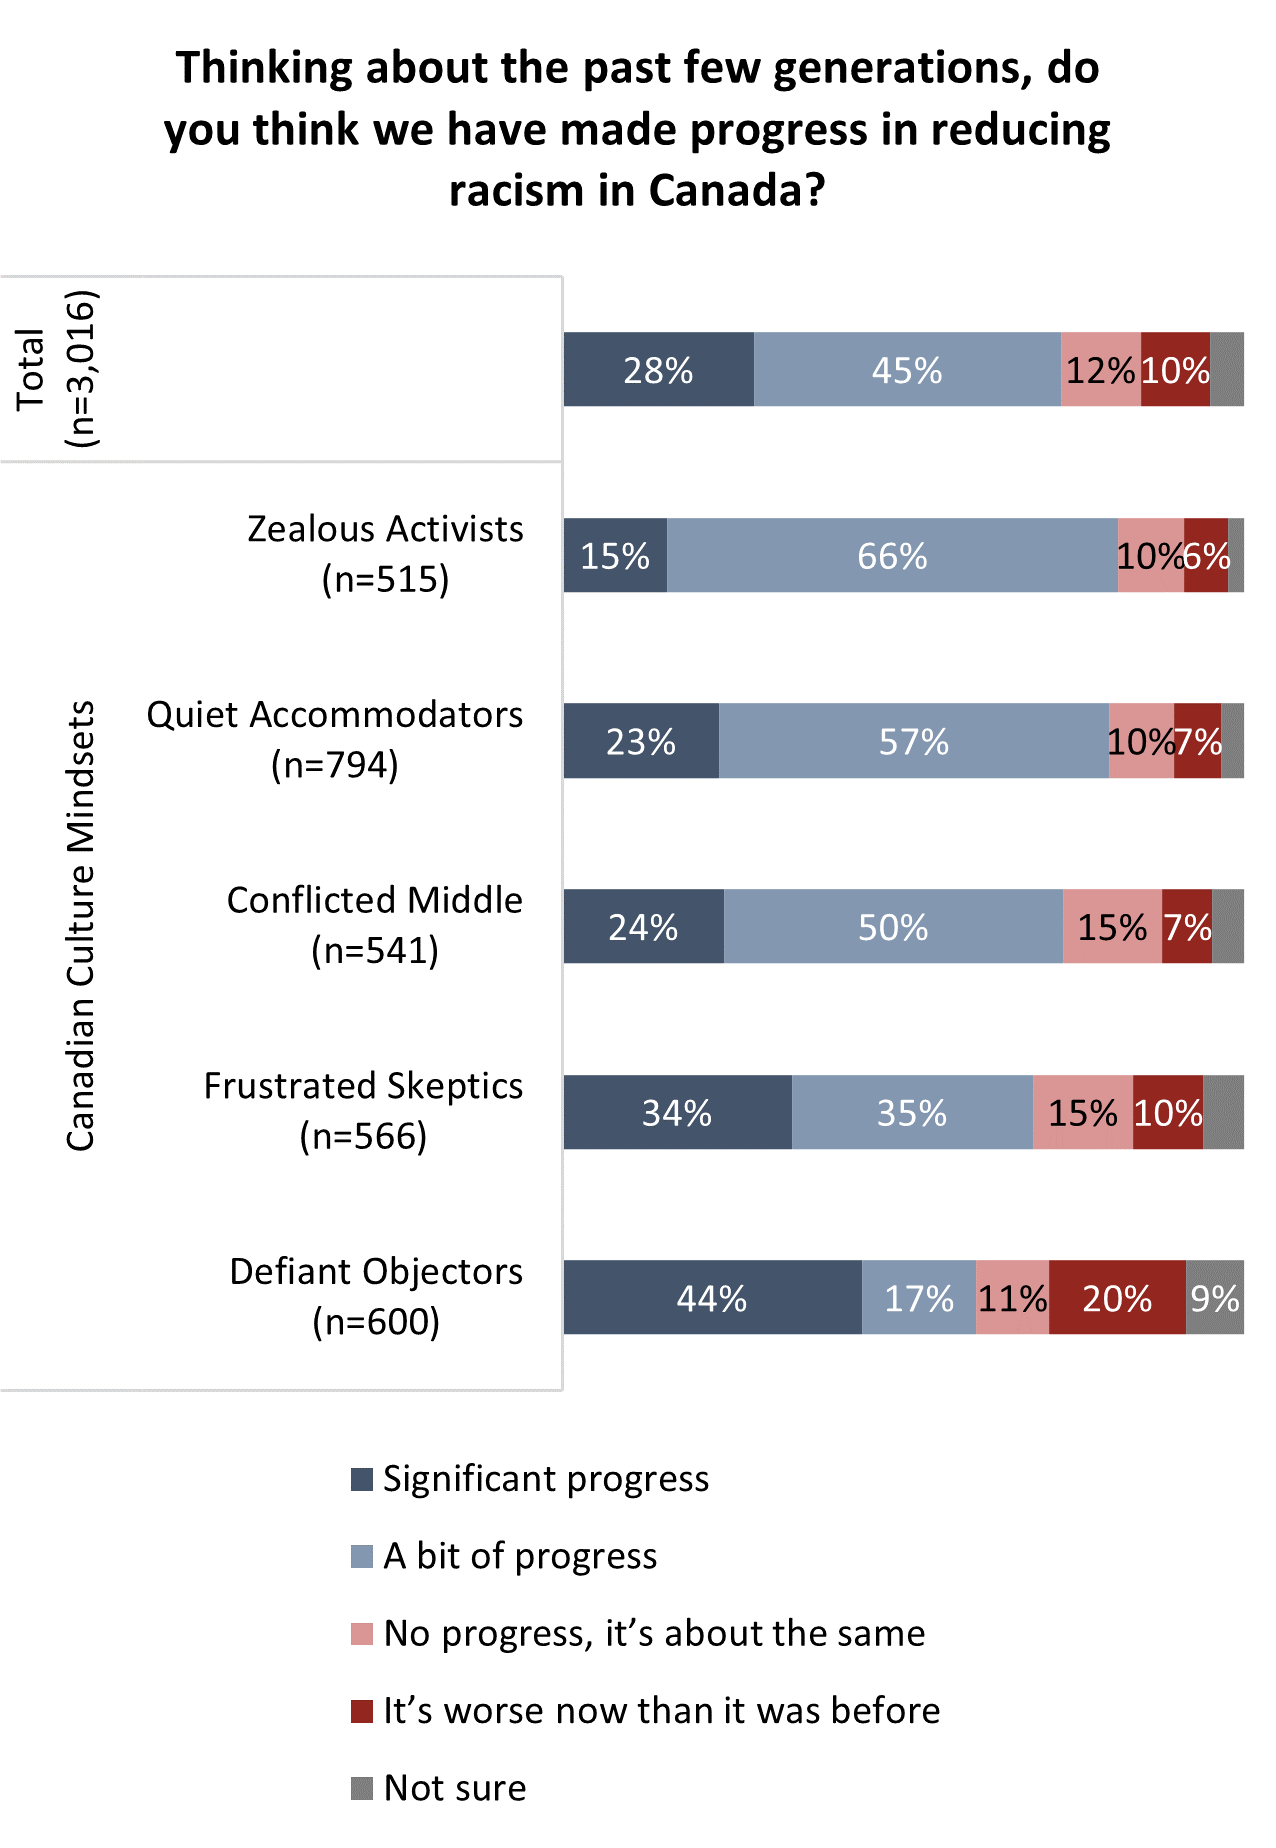
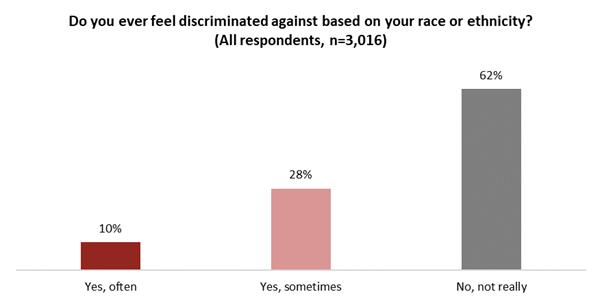
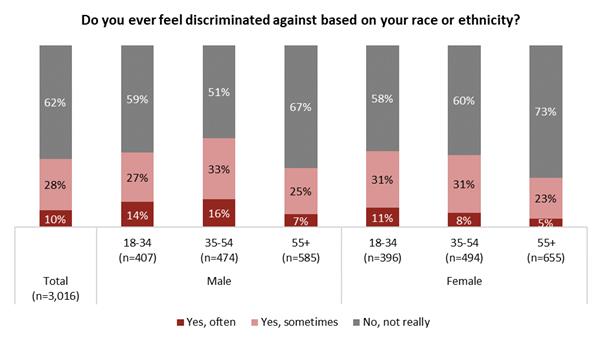
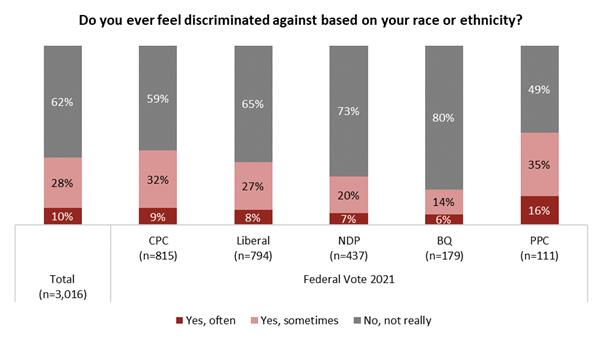
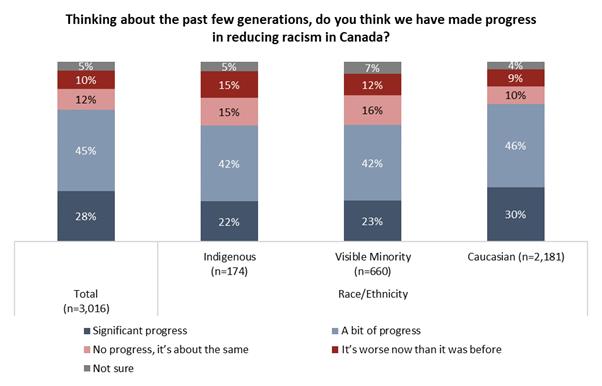
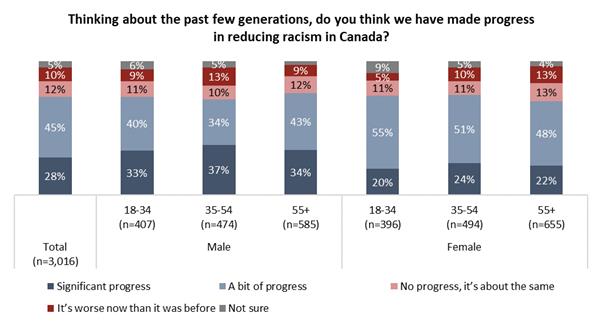
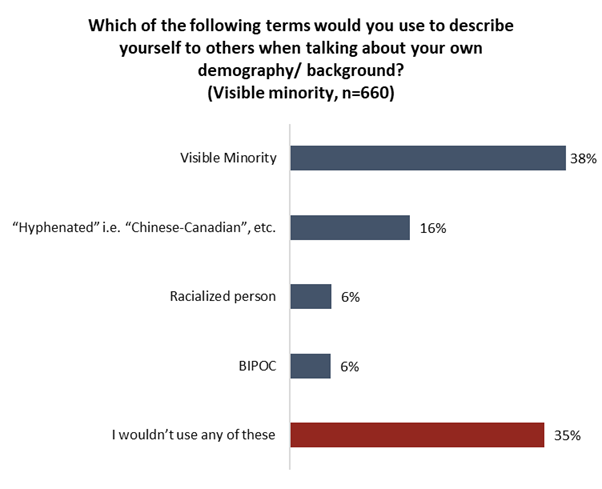
Two-In-Five Canadians Say They Face Discrimination Based On
Their Ethnicity Or Race
Indeed, one-in-five (22%) are of the view that the country is going
backwards – and that racial discrimination is worse than it was
generations ago. Self-identifying Indigenous (30%) and visible
minority (28%) respondents are more likely to say this than
Caucasians (19%). Two-in-five Canadians (38%) say they face
discrimination in Canada at least sometimes (28%) if not often
(10%).
(Angus
Reid Institute)
27
September 2023
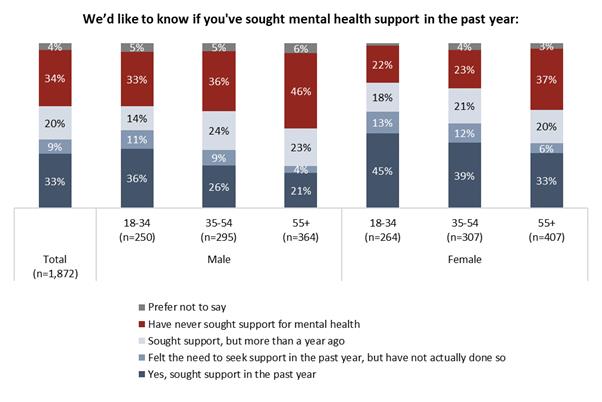
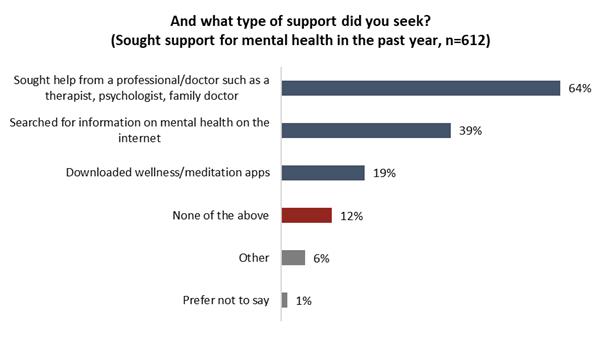
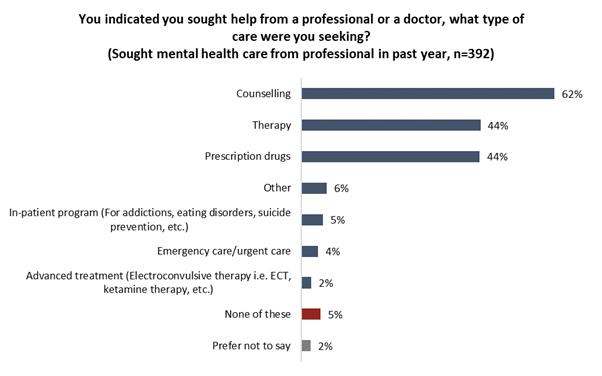
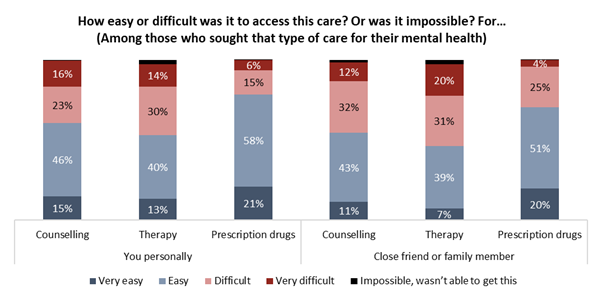
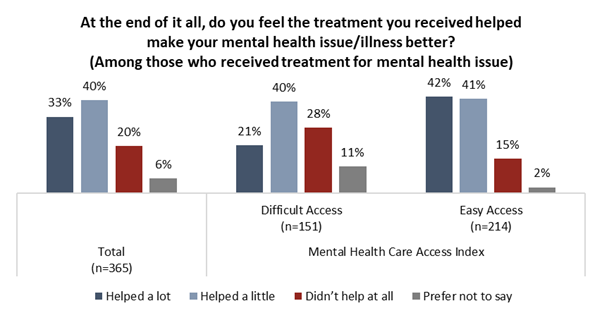
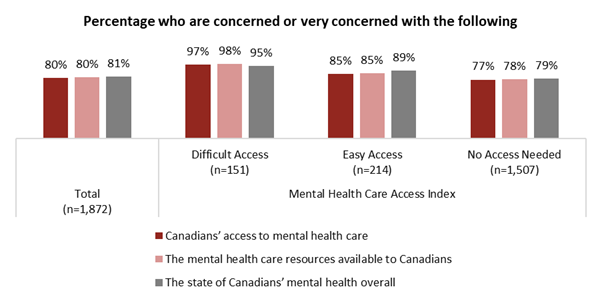
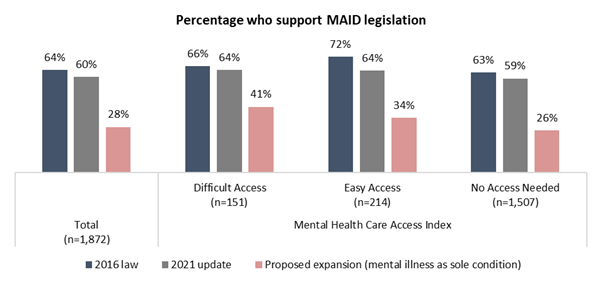
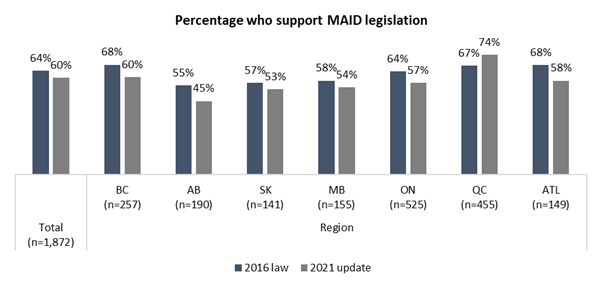
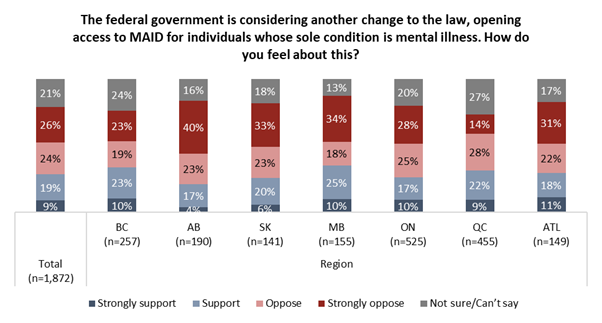
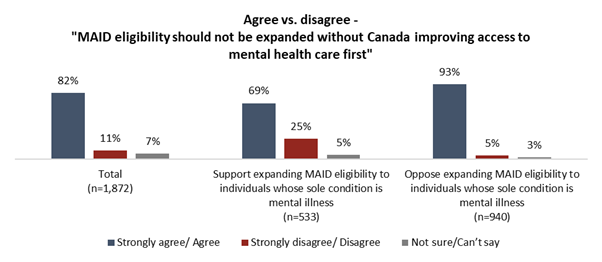
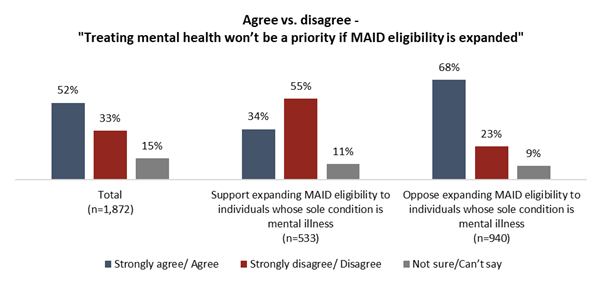
Mental Health And MAID: Canadians Who Struggle To Get Help More
Likely To Support Expanding Eligibility
New data from the non-profit Angus Reid Institute, in partnership Cardus,
finds a vast majority of Canadians concerned with the mental
health care resources available in the country (80%) and the
state of Canadians’ mental health overall (81%). This concern is
more elevated among those who sought care from the country’s
mental health-care system in the past year. Overall, one-in-five
(19%) Canadians say they’ve looked for treatment for a mental
health issue from a professional in the last 12 months.
(Angus
Reid Institute)
28
September 2023
AUSTRALIA
(Australia)
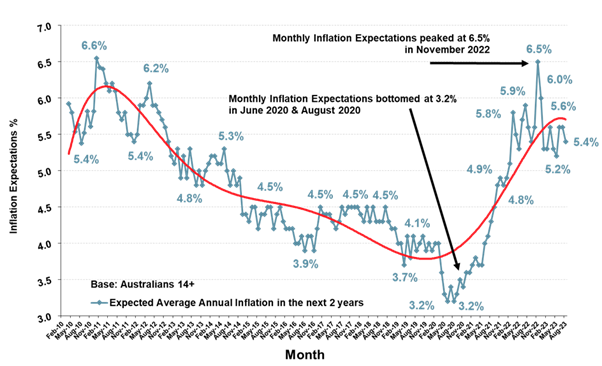
Inflation Expectations Dropped To 5.4% For The
Month Of August – And Have Now Fallen To 4.9% In Mid-September
Inflation Expectations were down in August and have now dropped in
consecutive weeks in September. The latest weekly Inflation
Expectations are now at 4.9% in mid-September – the lowest
weekly Inflation Expectations for 18 months since early February
2022 – before Russia invaded Ukraine. In further good news for
those with a mortgage the RBA has now left interest rates
unchanged for a third straight month in early September.
(Roy
Morgan)
19
September 2023
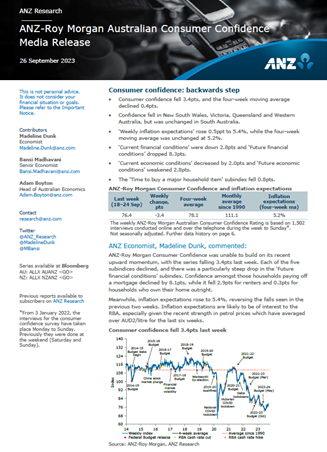
ANZ-Roy Morgan Consumer Confidence Down 3.4pts To
76.4 – Lowest Since Mid-August
For once there was a relatively uniform picture when looking around the
States with Consumer Confidence down in the four largest States
of New South Wales, Victoria, Queensland and Western Australia,
but unchanged in South Australia. Now under a fifth of
Australians, 19% (down 1ppt) say their families are ‘better off’
financially than this time last year compared to a majority of
54% (up 2ppts) that say their families are ‘worse off’
financially.
(Roy
Morgan)
26
September 2023
(New Zealand)
2.8 Million New Zealanders Now Read Newspapers
And Almost 1.7 Million Read Magazines
Nearly two-thirds of New Zealanders aged 14+, 2.76 million (65.8%), now
read or access newspapers in an average 7-day period via print
or online (website or app) platforms. In addition, 1.69 million
New Zealanders aged 14+ (40.2%) read magazines whether in print
or online either via the web or an app. These are the latest
findings from the Roy Morgan New Zealand Single Source survey of
6,524 New Zealanders aged 14+ over the 12 months to June 2023.
(Roy
Morgan)
19
September 2023
MULTICOUNTRY STUDIES
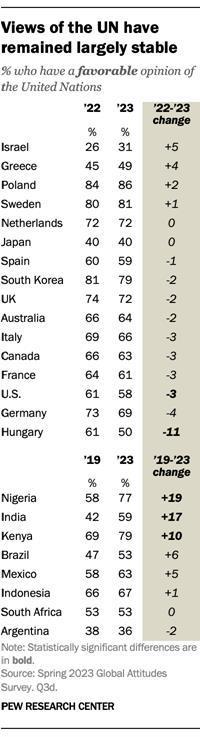
People Across 24 Countries Continue To View UN
Favorably
Views of the UN are especially favorable in Kenya, Poland, South Korea
and Sweden, where about eight-in-ten express positive views.
The United Nations
General Assembly will
open its 78th session on
Sept. 5 against a favorable backdrop. A median of 63% across 24
countries surveyed see the UN in a positive light, according to
a spring Pew Research Center survey. Another 28% see it
negatively. In most countries surveyed, a majority of the public
has a positive opinion of the UN.
(PEW)
31
August 2023
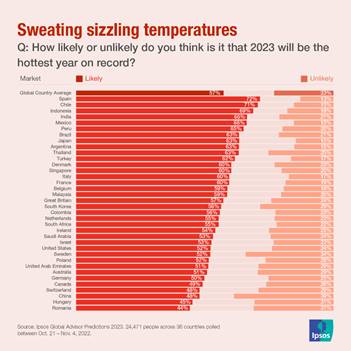
Data Dive: How People Around The World Feel About
Climate Change, A Survey Across 36 Nations
After people everywhere from Australia to India to America saw floods,
fires and furious storms wreak havoc in 2022, Mother Earth is in
for another devastating weather year.
Our polling across 34
countries in August/September 2022 finds
strong support for a global treaty that would ban unnecessary
single-use plastics (75%, on average across 34 countries), as
well as for a ban on plastics that can’t be easily recycled
(77%).
(Ipsos
Global)
31
August 2023
Source:
https://www.ipsos.com/en/data-dive-how-people-around-world-feel-about-climate-change
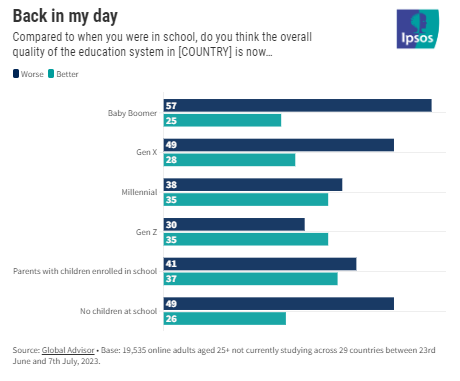
In 29 Countries People More Likely To Think Their
Education System Is Poor Than Good
Across 29 countries, 33% describe the education system in their country
as good, while 36% say it is poor.
However, parents of
children who are at school are more likely to say it is good
than poor. People
are more likely to say they would not recommend (45%) becoming a
teacher than would (43%).
In 28 of the 29 countries
surveyed, people tend to agree that having a degree is very
important to succeed in life.
(Ipsos
Global)
5
September 2023
Source:
https://www.ipsos.com/en/global-education-monitor-2023
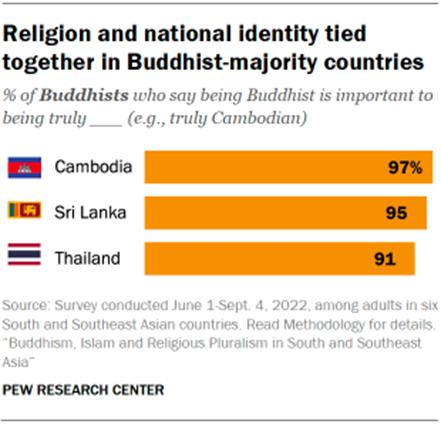
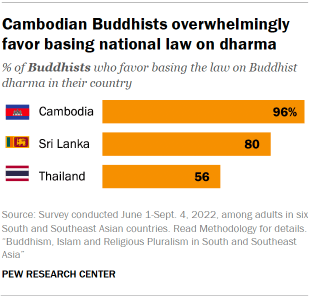
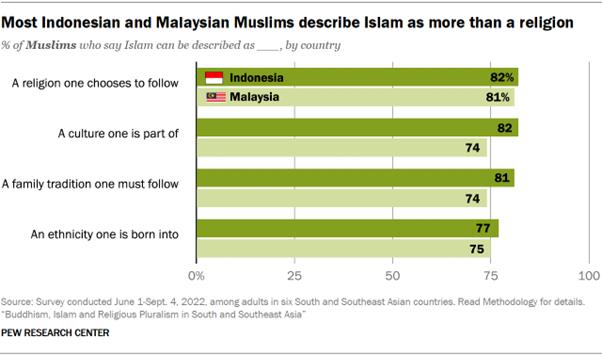
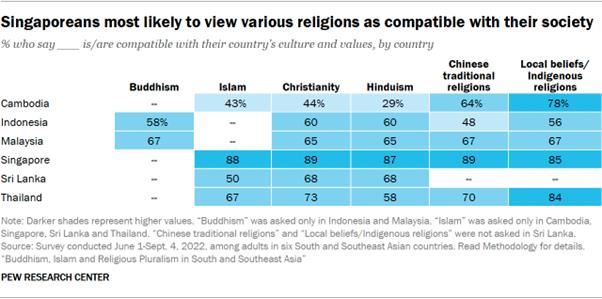
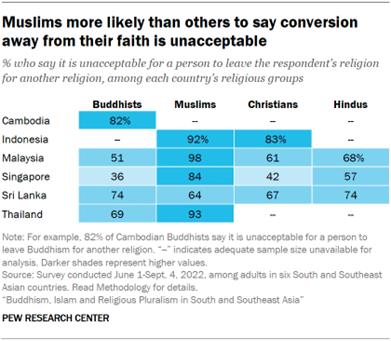
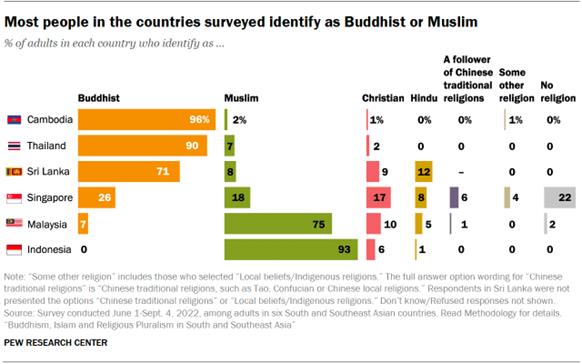
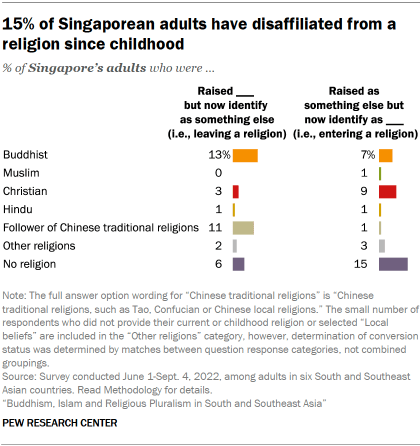
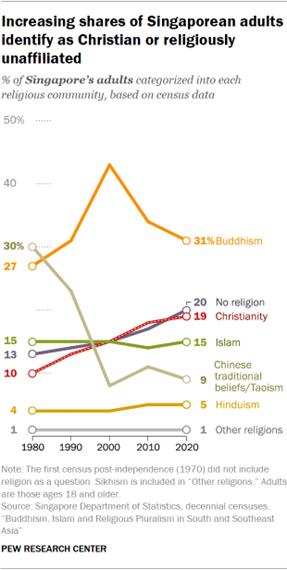
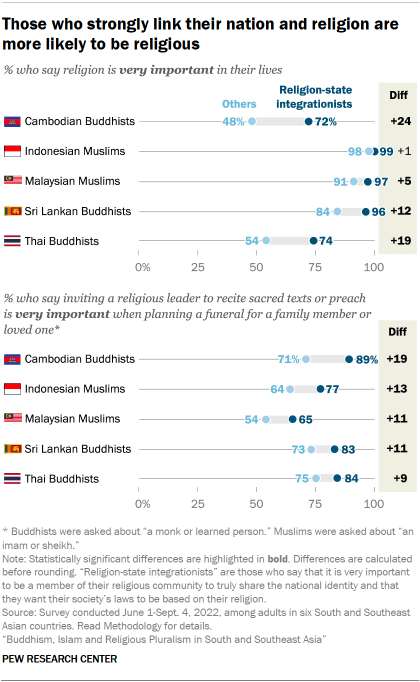
Buddhism, Islam And Religious Pluralism In South
And Southeast Asia, Survey In 6 Asian Countries
According
to a 2022 Pew Research Center survey of six countries in South
and Southeast Asia. In five of the six countries surveyed,
nearly all adults still identify with the religion in which they
were raised. Only in Singapore do a sizable share of adults
(35%) indicate their religion has changed during their lifetime.
(For additional information on religious switching in Singapore,
read “Share
of Singaporeans identifying as Christian or unaffiliated is
increasing.”)
(Ipsos
Global)
12
September 2023
48% Across 31 Countries Say The Quality Of The
Healthcare In Their Country Is Good – But The Picture Is
Inconsistent
Mental health is the top health concern for people across 31
countries, moving ahead of previous years’ top concerns like
cancer and coronavirus. Across 31 countries, people put mental
health as the top health concern facing their country. Since the
beginning of this survey in 2018, mental health worries have
increased by 17 percentage points (pp), with over two-fifths
(44%) worried. Additionally, worries about stress (now mentioned
by 30% as an issue) are on the rise. It is now third in our list
behind cancer (40%).
(Ipsos
Global)
28
September 2023
Source:
https://www.ipsos.com/en/global-health-service-monitor-2023
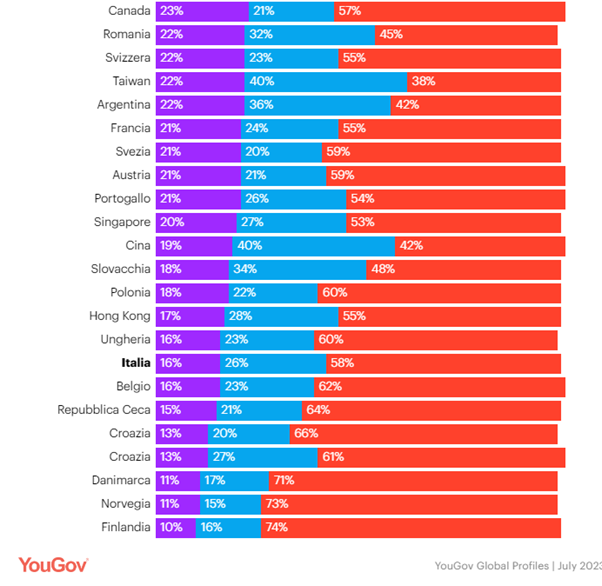
A Quarter Of Global Consumers Don't Feel
Comfortable With Online Banking, A Study Across 48 Markets
More than a quarter of consumers worldwide are uncomfortable using
online banking (27%), according to the YouGov Global Profiles
study, which collects data from 48 international markets. Among
adults aged 18-44, nearly three in ten (28-29%) agree with this
view. Contrary to popular belief, the percentage of people over
55 who do not feel comfortable using online banking is similar
to that of other age groups. In fact, they disagree with this
statement (53%).
(YouGov
Italy)
22
September 2023
ASIA
810-814-43-01/Polls
Survey:
70% Of Firms Supporting Workers’ Fertility Treatments
“While
we need to share information among team members to some extent
out of consideration, we must balance that with privacy
protection,” said Masaaki Yajima, the president of Wacoal Corp.
The
companies were permitted multiple answers.
The
most selected option, among 75 companies, was having “systems or
initiatives in place to make it easier for employees to take
leave for treatments.”
That
was followed by having “systems or initiatives that allow
flexible working hours and break hours” at 64 companies.
Nomura
Holdings Inc. in 2020 revamped its policy to allow up to 50 days
of medical leave for fertility treatments. It also introduced a
maximum of one-year leave for such treatments to provide
long-term support.
Osaka
Gas Co. has a system in place that allows employees to reduce
their daily work hours by up to four hours and 40 minutes if
they require outpatient treatment, though this is not limited to
fertility treatments.
Twenty-five companies responded that they are providing
“subsidies for fertility treatment costs.”
Kokuyo
Co. offers subsidies of up to 300,000 yen ($2,048) over two
years to cover the cost of the treatments. The employees can
apply to a mutual aid association without reporting it to their
bosses.
When
asked about challenges to supporting employees seeking
treatment, the most selected option was “privacy protection”
with 52 companies, followed by “a lack of understanding about
fertility treatments within the company” from 42 respondents.
Infertility “is a problem that’s hard to bring to light because
it is difficult for companies to recognize employees having such
concerns,” said Koki Sato, the head of the nonprofit
organization Forecia, which supports employees balancing work
and fertility treatments.
He
emphasized the importance of an easily accessible leave system
for workers and having a way to share information within the
company while protecting privacy.
Sato
added that employees may hesitate to give the reasons for their
leave to their bosses.
“Companies can introduce a system where employees don’t have to
specify a reason for needing to take leave by offering leave or
shortened working hours for a variety of purposes, such as a
child suddenly falling ill or caregiving,” he said.
“When
employees report (fertility treatments) to their bosses, it is
important both sides confirm who should be informed and how much
they should know,” Sato added. “Bosses should also have basic
knowledge about treatments as much as possible.”
29 August 2023
Source:
https://www.asahi.com/ajw/articles/14992434
810-814-43-02/Polls
Survey:
Frailty Increasing Among People In Their 40s, 50s
Doctors are urging
people to consume more protein to halt a surge in frailty, a
condition marked by declining muscle strength and weakened
mental and physical vigor.
Asked which age group
they think is increasingly frail, and allowed to give multiple
answers, most respondents picked people in their 60s or older.
Frailty may be
associated with old age, but the survey also showed a rise in
the condition among middle-aged people.
According to the survey,
36.7 percent of respondents cited men in their 50s, 36.3 percent
selected women in their 50s, 21.1 percent picked men in their
40s, and 17.4 percent chose women in their 40s.
And 75.5 percent said
the number of people between 20 and 65 who can be regarded as in
a “pre-frailty” stage has risen.
As for reasons for the
increases, reduced muscle mass was cited by 78.7 percent of
respondents, decreased exercise habits by 77.1 percent, and
going out less frequently by 75.9 percent.
About 90 percent said
the number of frail and pre-frail individuals will increase
further.
Many respondents said
efforts to prevent frailty should start at a relatively young
age, with the 40s cited by 30.5 percent, the 50s by 20.9
percent, and the 30s by 20.6 percent.
To prevent frailty,
those in the prime of their working life should routinely
exercise, increase their walking time, maintain muscle mass, get
enough sleep and follow a balanced diet, the doctors said.
“Protein deficiency
leads to reduced muscle mass and heightened risks of normal
weight obesity and pre-frailty,” said Hiroshi Yoshida, a JPALD
director who also serves as director at the Jikei
University-affiliated Kashiwa Hospital. “I want people to
improve their conditions through dietary habits of consuming
meat, fish and dairy products.”
12 September 2023
Source:
https://www.asahi.com/ajw/articles/14985739
810-814-43-03/Polls
Church
Ties Cited In 40% Of Senior Administrative Positions
The
appointments followed the Sept. 13 reshuffle of Prime Minister
Fumio Kishida’s Cabinet.
Among
the 26 senior vice ministers, 11 admitted to having had some tie
in the past with the Unification Church, and among the 28
parliamentary secretaries, 15 said the same. Some of the
politicians also received donations or paid to attend functions
hosted by the church or related groups.
One of
the individuals is Lower House member Shuhei Aoyama, newly
appointed senior vice minister of the Ministry of Education,
Culture, Sports, Science and Technology, responsible for
handling issues related to the Unification Church.
He
admitted to having had interactions with related organizations
during the party’s screenings last year following the July 2022
slaying of former Prime Minister Shinzo Abe in Nara city.
The
gunman blamed his mother’s huge donations to the Unification
Church for his lousy childhood and said he targeted Abe because
of the veteran politician’s longstanding ties with the church,
which has long been regarded as a social menace. The revelations
sparked a government investigation into the church that is
expected to result in the government requesting a court order to
disband the organization.
The
Asahi Shimbun conducted the survey from August to September last
year, asking all lawmakers about their connections with the
Unification Church. In September the same year, the LDP also
conducted screenings of its members’ relationship with the
church and its affiliated groups, and publicly disclosed the
results.
The
Asahi Shimbun also contacted newly elected lawmakers this past
January about their connections with the Unification Church.
Among
the newly appointed ministers on Sept. 13, four individuals,
admitted to having had some connection with the Unification
Church. They included Koichi Hagiuda, who retained his position
as chairman of the LDP’s Policy Research Council.
16 September 2023
Source:
https://www.asahi.com/ajw/articles/15007194
810-814-43-04/Polls
Antibody Rate After COVID Around 70% In Young People
After infection, the body produces antibodies to eliminate the virus,
which lingers for a while.
Antibodies from vaccines and antibodies from natural infection are
easily distinguishable. By examining the antibody retention
rate, it is possible to determine how many people have been
infected with the virus.
Since the previous survey targeted blood donors, no data was available
for children or those over 70 years of age.
In the latest survey, the remaining blood samples taken for testing at
clinics in July and August were used.
Blood samples from 4,235 people in 22 prefectures, mainly in the Kansai,
Chubu, and the Chugoku and Shikoku regions, were examined. The
overall antibody possession rate was 45.3 percent, the same
level as that of the July survey of blood donors (44.7 percent).
A breakdown by age group:
Up to the age of 4 (54.6 percent)
Those aged 5-9 (73.8 percent)
Those aged 10-14 (71.7 percent)
Those aged 15-19 (61.0 percent)
Those in their 20s (67.6 percent)
Those in their 30s (62.8 percent)
Those in their 40s (47.8 percent)
Those in their 50s (36.7 percent)
Those in their 60s (29.8 percent)
Those in their 70s (26.6 percent)
Those aged 80 and older (23.2 percent)
While 70 percent of children of elementary and junior high school age
may have already experienced infection, only about one in four
people over the age of 70 became infected with the virus.
17 September 2023
Source:
https://www.asahi.com/ajw/articles/15007727
810-814-43-05/Polls
10% Of Japan’s Population Aged 80 Or Older For First
Time
The
graying of Japanese society seems to have turned a lot grayer.
Figures published by the internal affairs ministry ahead of Sept. 18,
Respect-for-the-Aged Day, show that those aged 80 and older for
the first time represent 10 percent of the population.
The number of men aged 65 or older fell 10,000 to an estimated 15.72
million, or 26 percent of the male population.
The number of people aged 75 or older increased by 720,000 from 2022 to
an estimated 20.05 million and exceeded the 20 million mark for
the first time. The age group includes many of the baby-boomers
born in 1947 through 1949.
The number of people aged 80 or older rose 270,000 to an estimated 12.59
million, accounting for 10 percent of the total population.
The National Institute of Population and Social Security Research
projects that those aged 65 or older will account for 34.8
percent of the total population in 2040, when the so-called
second-generation baby boomers born in 1971 through 1974 join
the group.
As the ranks of elderly people expand, more of them are now working.
In 2022, a record 9.12 million elderly people held jobs, up 30,000 from
the previous year and breaking the record for 19 consecutive
years, according to the Labor Force Survey.
The elderly accounted for 13.6 percent of all people with jobs, an
all-time high.
By age group, a record 50.8 percent of those between 65 and 69 had jobs,
as did 33.5 percent of those between 70 and 74, another record.
The work force is aging particularly in industries suffering from a
labor shortage.
The agriculture and forestry sector had 1.01 million workers aged 65 or
older, or 52.6 percent of all workers in the sector.
In the medical and welfare sector, the number of workers aged 65 or
older increased nearly 2.7 times to 1.04 million in 2022 from a
decade earlier.
The percentage of elderly workers in the sector more than doubled from
5.5 percent in 2012 to 11.5 percent in 2022.
Social security spending, which represents about one-third of the annual
government expenditure, is ballooning as Japanese society ages.
The Ministry of Health, Labor and Welfare requested 33.73 trillion yen
($228 billion) in the budget for fiscal 2024, up about 587
billion yen from the initial budget for the current fiscal year.
17 September 2023
Source:
https://www.asahi.com/ajw/articles/15007751
810-814-43-06/Polls
Paternity Leave Remains Complex, Difficult Decision For Many
Fathers
In
comparison, 80.2 percent of women took child care leave in the
last fiscal year.
Sept.
19 is dubbed “ikukyu wo kangaeru hi” (The day to think about
child care leave) in Japan.
“Ikyukyu” means “child care leave” in Japanese. The choice of the date
plays on the words: “iku,” which sounds like the number 19, and
“kyu,” which is 9 (September).
The Asahi Shimbun conducted a survey of those who took paternity leave,
those who did not and those who could not and asked respondents
about their thoughts and circumstances.
DIFFICULT DECISION
“You don’t ask women, ‘Why did you decide to take maternity leave?’ do
you,’” said Yuki Mimura, 32, who works in the information
technology operations and planning department at Japan Airlines
Co.
“We are both parents, so I think it is normal for men to take leave,” he
said.
Mimura took paternity leave from July last year until March this year
following the birth of his first child.
One of his senior male colleagues told him, “When I was working, I could
not do anything to help with child care, so I felt out of place
(when I was at home.)”
Other colleagues also recommended Mimura take the leave.
On the other hand, an employee in his 30s who works for a listed company
in the Kanto region did not take the leave.
“If doing so would cause problems for others, it’s better for me to
manage the job myself,” he said.
At the time, the employee was working in public relations on a team
along with several people.
“The absence of even one team member would significantly affect the
others,” he said.
Although his wife, who was on maternity leave, asked him to take one,
too, he apologized, saying, “I have important work to do.”
He said he wanted to work because it was at a crucial time for his
career advancement.
It is common for male employees to take child care leave at his company.
“I would have taken the leave if I had been in a department that does
not handle emergency responses,” he said.
Some wanted to take paternity leave but could not.
A man in his 30s who works in the pharmaceutical industry and lives in
Tokyo became a father this year but was unable to take the
leave.
He was not eligible to do so because he had only joined the company a
few months before.
The Child Care and Family Care Leave Law stipulates that employers
cannot refuse a worker’s request for child care leave. But if a
labor union has reached a labor-management agreement with the
firm, the law says that “workers employed for less than one year
can be exempted.”
NAVIGATING WORK OPTIONS
Taking care of a child continues after parental leave, of course, making
a flexible work style essential.
Ryosuke Fujimaru, 31, is an employee of All Nippon Airways Co. with a
2-year-old and a 1-year-old child. He has been working shorter
hours under the company’s system since April.
After he spoke with his wife, who also works, the couple decided that
she would work full time and that he would work from 10 a.m. to
4 p.m.
“I thought just managing somehow would be too stressful. Besides, I
wanted to be the main parent taking care of our children since
my wife had taken maternity leave,” he said.
Although there were no men around Fujimaru using the shortened working
hours system, he said he had no conflicted feelings at all.
ANA allows employees to use the system regardless of the reason, and the
company says around 10 people are currently utilizing it.
PROMOTING LEAVE
Sekisui House Ltd., a major housing company that promotes paternity
leave, established the “day to think about child care leave” in
2019.
The company registered the day with the Japan Anniversary Association.
About 119 companies and organizations, including The Asahi Shimbun,
support the company’s paternity leave project.
Prime Minister Fumio Kishida set the goal of increasing the rate of male
employees taking child care leave to 50 percent by fiscal 2025
and 85 percent by fiscal 2030.
The government is considering measures such as raising the parental
leave benefits for both men and women from the current 67
percent of wages earned before the leave to about 80 percent
starting in fiscal 2025.
In addition, the government mandated companies with more than 1,000
employees to disclose their paternity leave rates from April.
Of the companies with a fiscal year ending in March that are required to
disclose their rates by the end of June, 86.8 percent, including
those that are planning to make the disclosure, did so.
The average amount of leave taken by men at companies that responded was
46.5 days.
On the other hand, it is said to be harder for employees in small and
midsize businesses to take child care leave compared to those in
large companies.
The Japan Chamber of Commerce and Industry and other organizations
conducted a survey of around 6,000 small and midsize businesses
nationwide last year.
Of the 2,880 companies that responded, 52.4 percent said they did not
have the personnel to replace those taking child care leave.
19 September 2023
Source:
https://www.asahi.com/ajw/articles/15008881
810-814-43-07/Polls
Study:
Up To 23% Of Adults Suffer Post-Infection Symptoms
The
post-infection rate was around 6.3 percent among children, the
team’s survey found.
Most infected people see their symptoms disappear within days or weeks.
But some suffer from certain post-infection symptoms over an
extended period, including fatigue, malaise, joint pain,
shortness of breath, decreased concentration and disturbances in
smell and taste.
These symptoms have been referred to as “long COVID” or “post-COVID,”
but the definition has not been firmly established
internationally, and many things about the symptoms remain
unclear.
In Japan, the health ministry categorizes them as “post-infection
symptoms.”
Hiroyasu Iso, a member of the research team and head of the Institute
for National Center for Global Health and Medicine’s Institute
for Global Health Policy Research, said his team defined the
symptoms as those persisting for at least two of the three
months following infection.
The team conducted online and paper-based surveys on COVID-19 patients
and uninfected people in Tokyo’s Shinagawa Ward, Yao in Osaka
Prefecture, and Sapporo.
The researchers analyzed 53,642 cases (25,736 adults and 27,906
children) after sorting them by city or ward.
The research team also compared the post-infection rates based on peak
infection times in the pandemic.
Among adults who contracted the virus during the outbreak of the Alpha
and Delta variants in spring and summer 2021, 25 percent to 28.5
percent reported having post-infection symptoms.
The rate decreased to 11.7 percent to 17 percent during the peak of the
Omicron variant from early 2022 to summer that year. Omicron
continues to be the dominant strain in Japan.
The health ministry plans to incorporate the findings into treatment
guidelines for post-infection symptoms.
It also intends to conduct further research to clarify how the symptoms
trend over the coming years and what is causing the symptoms.
19 September 2023
Source:
https://www.asahi.com/ajw/articles/15008970
810-814-43-08/Polls
Companies Seek New Market For Scallops After China Ban
Since the ban was announced on Aug. 24, Gen Komori, president of
Tokyo-based seafood trading house Housen Co., has received
inquiries for scallops from overseas but at "incredibly low
prices."
“I feel like (Japanese businesses) are getting ripped off,” said Komori.
At Marui Sato Kaisan Co., a seafood processing company based in
Betsukai, Hokkaido, inventories of frozen scallop abductor
muscles have piled up since orders from China, a major export
market, evaporated in July even before the ban was implemented.
“I am worried about where things go from here,” said Takeshi Ise, the
company president.
China is the largest overseas market for Japanese seafood, followed by
Hong Kong.
The impact of the Chinese ban is not limited to domestic businesses.
An estimated 30,000 to 40,000 tons of shell-on scallops were exported to
China, processed there and then shipped to the United States
annually.
American and European buyers have said it will become difficult to
supply products to North America unless Japanese scallops can be
brought into China.
Komori said he plans to explore the possibilities of exporting Japanese
scallops to other countries where they can be processed for
North America and Europe as well as developing new distribution
channels in Japan.
“We need to support fishermen in sales so that they will not become
dispirited by excessive price declines,” Komori said.
The United States has its own safety and health standards for imported
processed food.
The U.S. Embassy in Japan is introducing processing facilities in
Taiwan, Thailand, Vietnam and other countries that meet the U.S.
standards so that Japanese fisheries businesses can export
scallops to the United States from those facilities.
The government plans to help Japanese businesses if they choose to
process scallops on their own by subsidizing two-thirds of
expenses to introduce equipment for shelling scallops.
Nikko Co., a food machinery maker based in Kushiro, Hokkaido,
manufactures equipment for automatically removing abductor
muscles from shell-on scallops.
A company representative said the number of inquiries has not changed
since the government announced the subsidy program.
The equipment costs about 100 million yen, meaning that companies will
have to shoulder more than 30 million yen apart from the
subsidy.
The equipment is also made to order and takes a year to deliver after
receiving an order,
A lack of manpower is also an obstacle for processing more scallops in
Hokkaido.
“Processing facilities in Hokkaido are chronically short of hands and
rely on foreign technical interns,” said the president of a
seafood processing company in Hokkaido. “They cannot easily
increase the number of workers or raise hourly wages.”
25 September 2023
Source:
https://www.asahi.com/ajw/articles/15013611
810-814-43-09/Polls
24%
Pakistanis Have A Device At Home That Runs On Solar Energy
14 September 2023
Source:
https://gallup.com.pk/post/35237
810-814-43-10/Polls
Public
Opinion Split If The New Generation Is Less Or More Religious
Than Previous Generations
According to a survey conducted by Gallup & Gilani Pakistan,
public opinion split if the new generation is less or more
religious than previous generations. A
nationally representative sample of adult men and women from
across the country, was asked the question “Imagine you are
asked to compare the new generation with the previous
generation. Considering the following aspects, share your
thoughts on whether the new generation is more or less...? - Is
the new generation more religious than the previous generation?”
In response, 49% said yes, 47% said no and 4% said that they do
not know or gave no response.
21 September 2023
Source:
https://gallup.com.pk/post/35270
810-814-43-11/Polls
Proportion Of Pakistanis Reporting Never Having Attended School
Decreased By 5%, While Those Currently Attending School To Have
Increased By 2% Between 2005-06 And 2018-19
22 September 2023
Source:
https://gallup.com.pk/post/35282
810-814-43-12/Polls
Generational Differences In Digital Platform Usage: A
Comparative Analysis Between Gen Z And Gen Y
The rapid evolution of digital technology has
significantly altered the way individuals interact with various
aspects of their lives, including shopping, banking, education,
and entertainment. We all know that the younger generations are
more technologically open and quick to adopt. However,
between the two younger generation: Generation Z (up to 26 years
old) and Generation Y (27 to 42 years old), commonly referred to
as Millennials, are they the same in their preference in using
different digital platforms or there are differences?
The data presented in this report is derived from our
online survey covering across Indonesia from 18 to 24 July 2023.
Total sample of n=4,337 males and females are split into 2,590
individuals from Generation Z and 2,347 individuals from
Generation Y. To be eligible to this survey, these individuals
have to have prior experience using digital platform and at
least has done a transaction only.
The survey encompassed a range of digital platform usage categories,
including online shopping, food delivery, banking,
transportation, travel booking, daily necessities, streaming
services, online education, and telehealth.
Key
Findings
Both generations show a strong adoption of online
shopping, followed by online food delivery, digital banking and
online transports.
The lowest adoption is found for online education and
telehealth.
Very high adoption of online shopping highlights the
growing comfort of the younger generation with e-commerce
platforms and presents opportunities for businesses to create
tailored online shopping experiences to capture their
preferences.
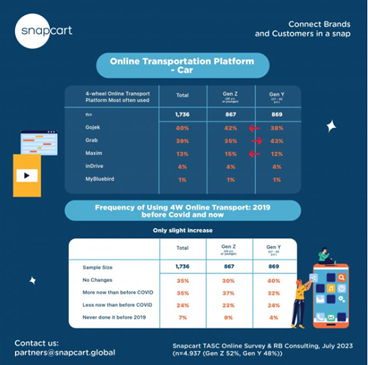
Travel
and Transportation: Interestingly, Gen Z and Gen Y’s preferences diverge in terms of online
transportation services. Generation Z appears to rely more on
motorized transportation (38%) than mobile-based alternatives
(35%), whereas Generation Y displays a more balanced usage
pattern (39% motorized and 37% mobile). This is likely due to
different charges between the two types and these generations’
spending power. This insight may guide transportation
companies in tailoring their services to each generation’s
preferred modes of commuting.
Entertainment and Education: Generation Z demonstrates a more significant inclination towards
streaming services (25%) compared to Generation Y (19%).
Furthermore, the data unveils a notable contrast in the adoption
of online education, with Gen Z embracing it at a rate of 20%,
compared to a mere 8% among Gen Y respondents. These variations
suggest a growing market for digital educational content, along
with a potential for innovative edutainment platforms targeted
at Gen Z.
Online
Travel and Hotel Booking: usage of this digital platform is significantly higher among the Gen Y
which might be driven by more travel for works and higher
purchase power.
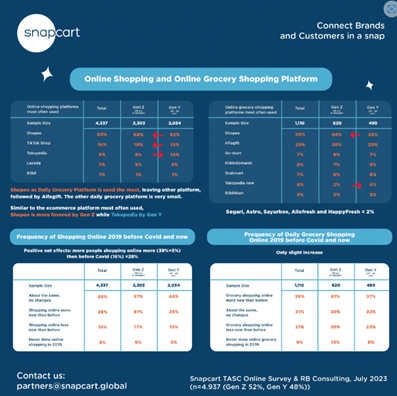
For online shopping most often used by these generations, Shopee leads
the share by wide margin for both online shopping and grocery
shopping; and generation Z is more likely to shop from Shopee
than generation Y. Gen Y also has higher inclination
to shop at TikTok Shop.
Tokopedia seems to be preferred by Generation Y.
Gojek and Grab has 80% of the market, but it seems
their strategy is different. Gojek is appealing more to the
younger generation, while Grab is preferred more by Gen Y.
Maxim is challenging the two main players with 13% share and skews
slightly to the younger generation.
The top two digital banking used – BCA Mobile and
BRImo – have different skews. BCA is used more by
Generation Y, while BRImo by Generation Z. Livin by
Mandiri is also preferred by Generation Y.
Majority of Gen Z (83%) claims that their mobile main
bank is using digital banking, compared to only 67% of Gen Y.
Additional Information – Brand Funnel
Among the Generation Z and Y, the following data show
awareness level, incidence of ever used to main platform used
for online shopping, online grocery shopping and online
transport (car)
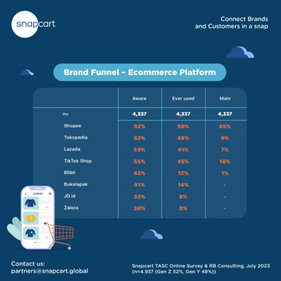
For the online shopping platform:
· Shopee has a good retention rate from aware
to ever used to retain them as main platform. Tiktok Shop
is the other platform that is able to retain about a third of
those who have tried to be their loyal users
· The other platforms show a loss in conversion
from aware to induce trial to try their platform.
For the online grocery shopping platform:
· Again Shopee has the higher awareness with
82% of those aware to try the platform (57% of ever used divided
by 70% awareness) and ability to retain those who tried to make
Shopee as their main online grocery shopping platform 67% (38%
who use Shopee as their main platform divided by 57% of those
who ever)
· The next group of platforms with similar awareness level are
Alfagift, Grabmart, Go-Mart and KlikIndomaret. Alfagift leads
this pack with 20% claiming to use it as their main online daily
grocery shopping platfrom.
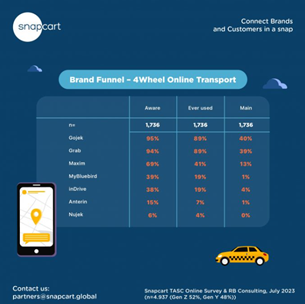
For the online transport shopping platform:
· Both Gojek and Grab has high conversion from
aware to ever try to main.
· Maxim has a good level awareness,
better than MyBluebird, and InDrive among these target markets.
About a third who used Maxim before, they kept using it as their
main online platform transport.
Conclusion
The
research highlights the nuanced differences in digital platform
usage between Generation Z and Generation Y.
By acknowledging and responding to these distinctions, businesses can
tailor their products and services to effectively target these
two vital consumer segments. This will not only enhance customer
satisfaction but also contribute to the growth and innovation of
various industries in the digital era.
14 September 2023
AFRICA
810-814-43-13/Polls
Cameroonians Say Government Must Do ‘Much More’ To Protect The
Environment
Cameroon possesses abundant natural resources, including oil and gas,
mineral deposits, high-quality timber, and an enormous range of
flora and fauna. But if its natural and cultural diversity has
earned it the title of “Africa in miniature,” the country also
shares many of the environmental challenges present elsewhere on
the continent (World Bank, 2023a; UNEP, 2023).
Deforestation claimed more than 1.5 million hectares between 2001 and
2020, threatening the country’s rich biodiversity (World Bank,
2022; Manigha, 2023). Population growth, urbanisation, and
industrialisation drive land degradation and water and air
pollution, exacerbated in the anglophone region by the country’s
ongoing socio-political crisis (Bang, 2022).
Cameroon is also struggling with waste management, in particular plastic
pollution. According to some estimates, the country
generates about 600,000 tonnes of plastic waste every year
(Landfill Solutions, 2022).
In 2012, Cameroon implemented a ban on the production, sale, and use of
non biodegradable plastic bags. However, despite this ban,
significant quantities of plastic bags are smuggled into the
country across its 1,690 km border with Nigeria (Kindzeka,
2023).
This dispatch reports on a special survey module included in the
Afrobarometer Round 9 questionnaire to explore Cameroonians’
experiences and perceptions of pollution, environmental
governance, and natural resource extraction.
Findings show that most Cameroonians are concerned about pollution in
their community. They rank deforestation, human waste
management, and trash disposal as their most important local
pollution problems. They consider environmental protection a
responsibility they share with their national and local
governments but say the government must do “much more” on this
issue.
A majority of citizens say the benefits of natural resource extraction,
such as jobs and revenue, outweigh its costs, such as pollution,
but most also call for tighter regulation of the industry to
limit its negative impacts on the environment.
Key
Findings:
11 September 2023
810-814-43-14/Polls
Moroccans Endorse Women’s Political Participation But Not Equal
Access To Jobs, Land
The Global Gender Gap Index considers Morocco to be among the countries
with the widest gender gaps, ranking it 136th out of 146
countries (World Economic Forum, 2023). While Morocco ranked
90th in political empowerment, it performed worse on the other
indicators: 141st in economic participation and
opportunity, 130th in health and survival, and 115th in
educational attainment.
Article 19 of Morocco’s Constitution highlights the country’s commitment
to ensuring full gender equality (Constitute Project, 2011). The
United Nations (2023) confirms that the country has made
significant progress in gender equality, with a decrease in
child marriages and improvements in girl-child education and
women’s political leadership. However, economic and political
gender gaps persist, fuelled by discriminatory laws and social
norms. For example, women hold only 24% of parliamentary seats,
and only 5.4% of firms have women in top management positions
(Inter-Parliamentary Union, 2023; World Economic Forum, 2023).
This dispatch reports on a special survey module included in the
Afrobarometer Round 9 (2021/2023) questionnaire to explore
Africans’ experiences and assessments of gender equality.
Survey findings show that fewer than half of Moroccans endorse women’s
right to equal opportunity in hiring and land ownership – issues
on which women and men hold very different views. And while a
majority say women should have the same chance as men of being
elected to political office, almost half say women who run for
office are likely to be criticised or harassed.
Even though women are just as educated as men, unequal opportunities and
pay in the workplace is the most frequently cited women’s-right
issue that the country must address. Gender gaps also
persist in ownership of certain key assets and autonomy in
financial decision making.
Women are less likely than men to approve of the government’s
performance on promoting equal rights and opportunities and are
considerably more likely to say the government need to do more.
Key findings
21 September 2023
810-814-43-15/Polls
Liberians Want Fair And Competitive Elections, But Mistrust
Elections Commission
Liberians will head to the polls on 10 October 2023 to elect a
president, 15 senators, and 73 members of the House of
Representatives. This will mark the fourth cycle of presidential
and legislative elections since the end of the country’s
devastating civil war in 2003. The National Elections Commission
(NEC) has granted accreditation to 1,030 individuals to vie for
the 88 seats in the National Legislature (National Elections
Commission, 2023a, b).
Incumbent President George Weah is seeking a second six-year term
(Africanews, 2023). Among the 19 other candidates
competing for the same position, only two are women, even though
women comprise 50% of registered voters (National Elections
Commission, 2023c, d).
While the election promises to be competitive, the campaign has been
largely peaceful. Most political parties have signed the
Farmington River Declaration 2023 committing to a nonviolent
electoral process as the country seeks to strengthen its fragile
democracy through peaceful, inclusive, free, fair, and
transparent elections (United Nations, 2023).
The most recent Afrobarometer survey findings show that Liberians
overwhelmingly support elections as the best way to choose their
leaders even though a majority don’t think they ensure that
their views will be represented. Most citizens describe the last
presidential election as generally free and fair, but few trust
the institution responsible for ensuring a high quality
election.
Key findings
26 September 2023
WEST EUROPE
810-814-43-16/Polls
Britons
Concerned About Climate Change, But Cost Of Living Is A Barrier
To Action
However, the cost of living continues to impact on feelings about taking
action to reduce climate change. Half of
Britons say they are too worried about the cost of living to
think about the impact of climate change (52%) or would like to
do more to reduce climate change but cannot afford to (51%).
Only 3 in 10 (29%) say they often find sustainable lifestyle
choices cheaper.
Looking at steps the UK could take to reduce climate change, three
quarters of Britons support investing more in renewable energy
(77%) or improving the energy efficiency of homes and businesses
(75%) as a way of reducing how much the UK relies on imported
energy. And 3 in 5 would say they would still support these
policies even if they led to an increase in bills or taxes (60%
and 58% respectively). The public is less positive about
investing in nuclear energy, although on balance more support
than oppose it (49% support, 20% oppose). Similarly, 43% support
re-starting or increasing the UK’s own production of fossil
fuels while 29% oppose.
Following Rishi Sunak’s announcement that the Government would be
releasing 100 new licenses for companies to drill for oil and
gas in the North Sea this week, around half think this will have
a positive impact on reducing Britain’s dependence on other
countries for energy (55%) and on Britain’s economy itself
(47%).
More than two in five agree reducing car usage will
positively impact climate change – but support for measures that
make car usage more expensive is limited
With the expansion of the Ultra Low Emission Zone (ULEZ) across all
London boroughs coming into effect next week, new polling by
Ipsos reveals limited support among Britons for measures to make
it more expensive for drivers to use their cars.
More than 2 in 5 (44%) agree that reducing the use of cars will have a
positive impact on climate change (compared to 33% who think it
will not make much difference ). However, looking at policies to
reduce car use, just under half (46%) say they oppose making it
more expensive for people to drive, compared to 31% who support
such measures. By contrast, three quarters (74%) of Britons say
they would support policies to make it easier to travel by
public transport, for example through reduced prices of by
investing in more routes. Fewer than 1 in 10 (7%) oppose the
expansion of public transport.
Rachel Brisley, Head of Energy and Environment at
Ipsos in the UK, said:
Recent polling starkly illustrates the reality of
balancing the energy trilemma of security, affordability and
sustainability. The cost of living crisis remains top of mind
for the British public impacting their ability to take action to
reduce climate change even though most would like to do more.
Incentives like making public transport easier to use are more
popular than penalties such as making it more expensive to
drive. And the importance of energy security is highlighted by
more than half of Britons thinking new oil and gas licenses will
help reduce our dependence on other countries for energy.
Balancing these concerns will continue to be a challenge for
policymakers as well as the public as we transition towards Net
Zero.
3 September 2023
Source:
https://www.ipsos.com/en-uk/britons-concerned-about-climate-change-cost-living-barrier-action
810-814-43-17/Polls
Dissatisfaction With Government On Immigration At Highest Level
Since 2015
Two-thirds of the public (66%) are dissatisfied with the way the
Government is dealing with immigration, according to the
Immigration Attitudes Tracker from Ipsos and British
Future –
the highest level in the tracker’s history. Just 12% say they
are satisfied.
Only a fifth (22%) of Conservative supporters are satisfied with the
Government on immigration while most Conservatives (56%) are
dissatisfied – a quarter (26%) ‘very dissatisfied’. Almost three
quarters (73%) of Labour supporters are dissatisfied with how
the Government is dealing with immigration (8% are satisfied).
The top reason given for dissatisfaction with the Government is the
failure to stop Channel crossings, but responses are divided by
politics. For Labour supporters who are unhappy with the
Government on immigration, ‘Creating a negative or fearful
environment for migrants’ (46%) and ‘Not treating asylum-seekers
well’ (45%) are equally important reasons for dissatisfaction as
‘Not doing enough to stop channel crossings’ (46%). Among
Conservative supporters, however, 82% cite ‘Not doing enough to
stop Channel crossings’ as a reason for their dissatisfaction,
and only 9% ‘creating a negative or fearful environment for
migrants’.
At a time of high net migration, the new tracker survey finds that 48%
of the public now supports reducing immigration (up from 42% in
2022), compared to 44% who would prefer numbers to stay the same
(22%) or increase (22%). Support for reducing immigration is
still nearly 20 points lower than in 2015, the first year of the
tracker, when 67% of the public backed reductions.
Similarly, more people (43%) think that immigration has had a positive
impact on Britain than the 37% who feel its impact has been
negative, though negativity has increased by 8 points from 29%
since 2022.
Attitudes today are divided by politics. Two-thirds of Conservative
supporters (67%) now favour reducing migration, compared to only
38% of Labour supporters who favour reductions. More than half
(56%) of Labour supporters say immigration numbers should
increase (28%) or stay the same (28%), compared to 30% of
Conservatives who say numbers should either increase (16%) or
stay the same (14%).
Sunder Katwala, Director of British Future,
said:
The Government’s approach to immigration,
particularly asylum and small boats, is disappointing everyone –
but for different reasons. Liberals think it is inhumane, while
hardliners think it isn’t achieving what has been promised. What
they all have in common is the feeling that the Government isn’t
doing a good job.
The research finds 7 in 10 people (71%) say they do not trust the
Conservative Party to have the right policies towards migrants
crossing the Channel, with just 21% saying they trust Rishi
Sunak’s party. The Labour opposition is trusted by 32% of the
public to have the right policies on Channel crossings, yet it
is distrusted by 53%.
Some 52% of Conservative supporters say they do not trust their own
party on Channel crossings. But Labour supporters do trust their
own party on the issue: 60% say they trust Labour to have the
right policies, while 28% do not.
Gideon Skinner, head of political research at Ipsos,
said:
Immigration has been rising up the political and
public agenda this year, particularly due to unhappiness with
the government’s handling of channel crossings, which makes
these latest findings timely. We can see that increasing
attention reflected in rising concern about numbers and the
impact of immigration, although it’s still the case that
attitudes remain more positive than before the EU referendum.
The new survey also finds that support for migration for specific jobs
remains largely steady. More than half the public would like to
see the number of migrant doctors (53%) and nurses (54%)
increase, while less than 1 in 7 favour reductions (13% for
doctors and 14% for nurses); for care workers 46% would like to
see numbers increase, 28% would rather numbers stayed the same
and only 17% would like to see them reduced. Nearly
three-quarters of skilled worker visas last year were for health
and care roles1.
For other jobs the picture is similar. Only 18% of the public would like
to reduce the numbers of migrants coming to work as seasonal
fruit and vegetable pickers, while 43% would prefer the number
to increase (30% say numbers should stay the same); 24% want
fewer migrant lorry drivers while 66% would rather numbers
stayed the same (35%) or increased (31%); and 24% would prefer
fewer migrants coming to work in construction, while 66% think
numbers should stay the same (33%) or increase (33%).
The tracker survey also asked about migration for study, as it forms a
large proportion of net migration figures. Some 37% of the
public are happy for international student numbers to stay the
same and 22% would prefer them to increase, while 31% favour
reductions.
12 September 2023
Source:
https://www.ipsos.com/en-uk/immigration-tracker-september-2023
810-814-43-18/Polls
Almost
9 In 10 Say Britain Needs A Fresh Team Of Leaders
Voting intention
Leader satisfaction ratings
Starmer vs Sunak in-depth
Looking deeper, Starmer leads Sunak on a range of leadership traits:
Labour and the Conservatives in-depth
Labour leads on most other positive party image metrics, such as
understanding the problems facing Britain (by 46% to 24%), being
fit to govern (by 34% to 21%), and looking after the interests
of people like me (by 34% to 16%)
Next General Election
Gideon Skinner, Head of Political Research at Ipsos,
said:
There is little sign that the challenges facing the
Conservatives have got any easier over the summer: unhappiness
with the government’s performance remains high, Rishi Sunak’s
ratings are slipping as more see him as out of touch, and the
party’s image as a whole is a long way down from when they were
winning elections over the previous decade. As we enter the
conference season Labour will be much the happier, with a solid
lead and ahead of the Conservatives on most key metrics.
19 September 2023
Source:
https://www.ipsos.com/en-uk/almost-9-10-say-britain-needs-fresh-team-leaders
810-814-43-19/Polls
Just
One In Ten Members Of The Public Think The Government Has The
Right Policies In Place For The NHS
The Health Foundation has
partnered with Ipsos to deliver a programme of public polling
research examining expectations and perceptions of health and
social care. Every 6 months, we poll a representative sample of
the UK public using the UK
KnowledgePanel –
Ipsos’ random probability online panel.
The findings from the fourth survey show:
27 September 2023
810-814-43-20/Polls
Most
Britons Oppose Banks And Building Societies Closing Customer
Accounts For Reputational Reasons
Earlier this year, Nigel Farage’s Coutts account was closed by the bank
after an internal report described him as a “disingenuous
grifter” with “xenophobic, chauvinistic, and racist views”. The
resulting controversy led to the resignation of NatWest CEO
Alison Rose, the launch of an FCA probe into “de-banking” across
the sector, and headlines about whether the ex-UKIP leader is
more deserving of a bank account than
serial killer Rose West.
But do the public think banks and building societies should be allowed
to close customer accounts for reputational reasons?
Along political lines, Conservative voters are more likely to think
banks should not be allowed to close accounts for PR purposes
(89%), with 6% saying the reverse. Labour voters are mostly
agreed (64%) but a quarter believe banks should be allowed to
shut down accounts due to reputational risk (26%). Both Prime
Minister Rishi Sunak and Labour
leader Keir Starmer have criticised NatWest over the closure of
Farage’s account.
Most Tory voters (57%) think banks are currently too political, while
2019 Labour voters are more likely to say they’re getting the
balance right (35%) than to think they’re too political (28%) -
although a third (32%) are unsure either way.
Britons don’t support de-banking customers on
political grounds – unless they’re members of extremist groups
We also asked the public about the specific circumstances where a bank
or building society should be permitted to close an account.
Broadly, people think banks should be allowed to do so if the customer
is a member of an extremist group (63%), has been convicted of
serious crimes (63%), or is suspected of criminal behaviour or
having criminal ties (53%). In each case, Conservative and
Labour voters are more or less agreed.
Beyond fanatics and lawbreakers, three in five (62%) support stripping
accounts from people who are rude or abusive to staff.
So what do Britons consider a poor reason for de-banking someone? Just
5% of the public think institutions should be allowed to remove
accounts from people who support a particular political party,
while the same proportion say they should be allowed to do so
because someone voted to leave the EU.
Tory and Labour voters are mostly agreed on both counts. While 9% of the
public think de-banking a customer who does not share the bank’s
values should be permitted, it’s a tendency, 2019 Labour voters
(13%) are twice as likely to hold this belief as Conservative
voters (6%).
Most of the public think banks should not be allowed to shut an account
because the holder openly opposes LGBTQ+ rights (13% allowed) -
but just 5% of Conservative voters agree, compared to a quarter
of Labour voters (23%). And when Britons are asked if refusing
to use someone’s preferred gender pronouns is a good enough
reason to close a customer’s accounts, it’s a similar
story: 12% of the public think it is, next to 7% of Tory voters
and a fifth of Labour voters (19%).
5 September 2023
810-814-43-21/Polls
Do
Student Loan Repayments Count As ‘Tax’
The public are divided
A recent report on tax
rates highlighted
how a graduate earning Ł35,000 a year pays almost double the
average tax of someone with the same income from rent on
property. However, this finding is predicated on the inclusion
of student loan repayments in a graduate’s effective tax rate.
But do student loan repayments actually constitute tax? For many years
now they have been collected alongside taxes as deductions from
graduates’ payslips, and Martin
Lewis has described the new rules introduced this year as
effectively constituting a graduate tax.
So what do the public think?
As it turns out, they are divided. YouGov tested
two different question wordings, with both getting similar
results.
Asking
“Do you think that the money that graduates repay from their
student loans constitutes 'tax'?” resulted in a very close
split, with 36% saying that it does and 38% feeling that it does
not. (We will hereafter refer
to this question as Question A)
Our
other question “Do you think that the money deducted from
graduates’ salaries to pay off student loans constitutes 'tax'?”
resulted in a slightly wider difference, with 36% again saying
that it does but 42% answering that it does not. (We
will hereafter refer to this question as Question B)
Graduates feel differently on the matter to non-graduates. Depending on
the question asked, 52-54% of Britons with a degree say that
student loan repayments do count as tax, compared to 33-35% who
disagree.
By contrast, among non-graduates, there is a tendency to think that
student loan repayments are not the same as tax, by 39% to 28%
in Question A and 46% to 28% in Question B.
12 September 2023
Source:
https://yougov.co.uk/politics/articles/46055-do-student-loan-repayments-count-tax
810-814-43-22/Polls
Sunak
Net Favourability Falls Again To New Low Following Net Zero
Announcements
While the prime minister will have been hoping to receive some benefit
from his net zero announcements, his reputation among Tory
voters remains effectively unchanged (they continue to be
divided on the party leader, by 48% to 47%) as well as with
Labour voters (who continue to overwhelmingly dislike him, at
90%).
What is notable, however, is that the PM’s recent actions seem to have
taken their toll on his perception among 2019 Liberal Democrat
voters. While already unpopular with this group (prior polls had
only around a quarter thinking positively of him), this figure
has plummeted, with now only 12% of Lib Dem voters holding a
favourable view. Since the last poll, the number with an
unfavourable view has risen from 73% to 85%.
Opinion towards the Conservative party remains unchanged, including
among Liberal Democrat voters, had a negative view of the party
than its leader. This latest poll brings Sunak’s reputation
among the Lib Dems almost into line with their views of his
party.
Keir Starmer has not seen any benefit. Three in ten Britons have a
favourable view of the Labour leader (30%, from 35% at the end
of August), while 55% have an unfavourable opinion (from 54%).
This gives the leader of the opposition a net favourability
rating of -25.
Starmer continues to be less popular than his party, of which 37% of
Britons have a positive view and 52% a negative one (a net score
of -15).
22 September 2023
810-814-43-23/Polls
72% Of
French People Think That The Education System Is Deteriorating
Ipsos asked the French about their opinion of the education system in
the country. They judge it
quite negatively, 52% of French people even think it
is bad, and only 20% consider it "good", against respectively 36
and 33% in the world.
« Parents are somewhat less critical,
but in France those who think that the education system is poor
still outnumber those who consider it to be performing well (43%
against 31%) " says Amandine
Lama, Global Director of Innovation, Ipsos Public Affairs.
The French also doubt that their
education system contributes to reducing social inequalities: only
42% of them think this is the case, compared to 51% for the
overall average of countries.
Nearly one in
two citizens in the world (46%) consider that the situation in
which the education system finds itself is deteriorating
compared to the period when they were in school. The
French are among the most nostalgic and critical, since they are
72% to believe that the situation has deteriorated, against only
12% to consider it better.
When asked about the main challenges
faced by the education system in France, the French
prioritize overcrowded classes (53%), obsolete educational
programs (32%), and security issues (31%).
Moreover, in 28 of the 29 countries studied, respondents tend to think
that having a degree is very
important for success in life. The French are more
divided on this point than the overall average (48% of them
agree, compared to 60% in all countries).
Teaching, a profession insufficiently valued
The French generally think that being a teacher means working hard: 58% of French people think so,
against 33% who disagree with this idea.
The France is also one of the countries where people
would least recommend becoming a teacher (the
second worst score in the EU after Hungary), with 27% of people
recommending it.
A relative majority of French people believe that teachers are not
sufficiently paid (47%), but more generally that they are
not sufficiently respected (73%; worst score in
Europe with Hungary).
Impact of AI and technology
If the impact of new technologies, and in particular AI is considered
rather positive on the education system on a global scale, the
French are much more reluctant.
France is the country where respondents are most likely to think
technological advances will have a negative impact on education
in the future (29% vs. 18% globally), and the country
where citizens are most likely to support banning AI in schools (48% vs. 29% globally). An
opinion that is even shared by the youngest (51% of French
people under 35 in favor of the ban).
Logically and even if this observation instead of surprising, the French
are therefore also the least
convinced by the importance of training teachers in AI,
they are only 43% to consider that it is a necessity, against
65% of the global average. The finding is similar when it comes to
training students in the use of AI: 49% think it is
important, compared to 70% of the global average.
4 September 2023
Source:
https://www.ipsos.com/fr-fr/global-education-monitor-2023
810-814-43-24/Polls
65% Of
Women Want Psychological Support In Case Of Personal Or
Professional Difficulties
Nearly 8 out of
10 employees say they are satisfied with their work,
a figure that has been stable since 2011. Their confidence in
their professional future remains high (75%). This figure
continued to increase between 2012 (64%) and 2018 (73%). After a
decline in 2019 (70%), it starts to rise again in 2020.
The vast majority (65%) of employees (62% of women and 68% of men) say
they are in good health. This figure, which is still high, has
been falling steadily since 2011 (71%). A
slightly more marked decline among women: 70% of them declared
themselves in good health in 2011, 67% in 2018 and 65% in 2022. While
for the same period, this rate among men remained around 70%
(72% in 2011, 70% in 2018 and 69% in 2022).
Female employees are more likely than men to say they
are in poor physical health (41%
vs. 34%), despite better medical follow-up. And nearly half of
them (44% vs. 32% for men) declare themselves in poor
psychological health (+4 pts vs 2022).
A perception of their psychological health
conditioned by a growing concern among women
The female employees surveyed say they are
increasingly worried about the financial situation of
their household (42% vs. 33% for men, and +7 pts vs. 2022), and
are more concerned about the
future of their children (41% vs. 33% for men, and +9
pts vs 2022). They are also more worried about the situation of
the world (82% vs. 71%) and the environment (80% vs. 69%).
More than one in two female
employees (55% vs. 45% of men) say
they have suffered from psychological disorders in the past 12
months: anxiety disorders (37%), mood
disorders/depression (experienced by 30% of female employees),
burnout/burnout (25%), trauma and stress disorders (21%).
One third of the employees concerned (women and men) attribute this poor
state of psychological health to professional origins, a third
to personal origins and a third to both. When it comes to
personal reasons, however,
women stand out very clearly on the financial aspect: 39%
(vs. 26% of men) link their poor mental health to their
financial situation. This situation can be explained by
part-time work, which concerns 17% of women (vs. 7% of men) and
the situation of single parenthood. This situation, which
concerns 25% of families in France is assumed in 85% of cases by
a woman (INSEE). Regarding professional reasons, women
mention the intensity and working time (65% vs. 59%
of men, and +7 points compared to 2022) as well as the deterioration of social relations at work (41% vs. 38%).
Perspectives on the psychological health of employed
women
Women are over-represented in the professions of
Health and Social Action (67%
of employees in the sector are women [2]),
a sector in which employees declare themselves in poorer health
than the average.
Indeed, 47% of them consider their physical health to be poor (vs. 37%
for all sectors combined), and 45%
consider having a poor state of psychological health, compared
to 38% for all employees. Employees in this sector
suffer more from chronic
fatigue (51% vs. 40%), and sleep
disorders (37% vs. 31%), and even speak of "work-related emotional exhaustion" for 45%
of them (vs. 34%).
Finally, this sector is also the one
in which the share of employees who have been prescribed sick
leave is the highest: 63% against 50% all sectors
combined, a figure up 10 points compared to 2022[3].
Psychological support at work: women's expectations
Faced with the increase in psychosocial risks, women are particularly
waiting for support from their employer. 65% of them want psychological support in case of personal or
professional difficulties (vs. 57% of men). Women are
also more interested in stress management solutions (70% vs. 55%
of men). They are also waiting for support in the event of
serious illnesses (71%) and when they return to work after sick
leave (64%, up 6 points compared to 2022).
22 September 2023
810-814-43-25/Polls
A Clear
Majority Of The Electorate Considers "The Left" To Be A Weak
Party
The Left Party won 2021.4 percent of the second votes in the 9 federal
election, narrowly missing the five percent hurdle. The party
was only able to enter the Bundestag thanks to three direct
mandates won. Since then, the Left Party has received an average
of around 5 percent of the vote in polls on voting intentions.
Again and again one hears from the party of disputes over
direction and a possible new party founded around the politician
Sahra Wagenknecht.
A good third (36 percent) of German voters find it rather or very
important that the Left Party is represented in the Bundestag.
With the exception of the AfD (31 percent), the representation
of all other parties is perceived as more important: SPD (61
percent), CDU/CSU (65 percent), FDP (46 percent), the Greens (45
percent). This shows major differences between the voters of the
parties. More than half (53 percent) of Green voters consider it
important that the Left Party is represented in parliament,
while four out of ten (41 percent) of SPD voters do so. In the
FDP electorate, on the other hand, it is only 24 percent and
among AfD voters it is 15 percent.
Against this background, if one asks whether the German electorate would
prefer Sahra Wagenknecht to found her own party or if the Left
Party found a common path, 34 percent would be in favor of Sahra
Wagenknecht founding the party, while 29 percent would prefer
the party to work together. For this question, the proportion of
"don't know" is comparatively high at 37 percent.
Sahra Wagenknecht's popularity is likely to have an influence on the
popularity of the founding of a "Wagenknecht Party": Sahra
Wagenknecht is the best known of all the politicians of the Left
Party surveyed. Only 4 percent say they don't know them. In
addition, she is also one of the most popular politicians of the
Left Party. Other politicians of the Left Party, such as
co-chair Martin Schirdewan, are not known to half of the
electorate (50 percent), and co-chairs Janine Wissler (31
percent), Dietmar Bartsch (25 percent), Amira Mohamed Ali (35
percent), and Bodo Ramelow (16 percent) are also largely
unknown. With 8 percent, Gregor Gysi has similar popularity
ratings to Sahra Wagenknecht.
The popularity ratings of left-wing politicians among those who claim to
know them show Gregor Gysi as by far the most popular left-wing
politician. Among all respondents who say they know Gregor Gysi,
almost half (49 percent) find him rather or very good. Sahra
Wagenknecht is somewhat or very good for 38 percent, closely
followed by Bodo Ramelow (33 percent), followed by Dietmar
Bartsch (27 percent), Amira Mohamed Ali (21 percent), Janine
Wissler (19 percent), and Martin Schirdewan (16 percent).
One in five respondents (20 percent) stated that they could basically
imagine voting for a Wagenknecht party ("Yes, definitely" and
"Rather yes" - this is not a concrete voting intention, but the
basic possibility of voting for a party, also called
"potential". These values cannot be used to predict the success
or failure of the party, especially since neither the party nor
the party program currently exists). 63 percent, on the other
hand, would rule out the election of a "Wagenknecht party" in
principle ("No, definitely not" and "Rather no"). This figure is
lower than for the Left Party: three out of four eligible voters
cannot imagine voting for the Left Party (75 percent).
More than half (58 percent) of those who say they want to vote for the
Left Party in the next federal election can also imagine voting
for a "Wagenknecht party". Among those who say they want to vote
for the AfD in the next federal election, the figure is 37
percent. In this group, far fewer can imagine voting for the
left (12 percent).
Should Sahra Wagenknecht found her own party, 55 percent of eligible
voters in Germany think that the Left Party will be weakened or
completely dissolved, while among Left Party voters this figure
is 56 percent.
When it comes to migration, a "Wagenknecht party" is
perceived as much more right-wing than the Left Party or the
Greens
Furthermore, the survey examined where the German electorate would
position the parties represented in the Bundestag politically
with regard to migration and where a possible "Wagenknecht
party" would be positioned in comparison. Respondents were asked
to rate where they see parties on an 11 scale from "Immigration
has mainly positive influence on Germany" to "Immigration has
mainly negative influence on Germany". On this migration
spectrum, the "Wagenknecht Party" is positioned with a tendency
to the right ("Immigration has mainly a negative impact on
Germany"), with an average value of 6.5. The Left Party (mean:
4.8), the SPD (mean: 4.8) and the Greens (mean: 4.3) are
positioned further to the left, i.e. more migration-friendly, on
the spectrum. With an average score of 9.6, the AfD is perceived
as very far to the right, i.e. critical of migration. The
CDU/CSU (mean value: 6.4) and FDP (mean value 6.1) tend to be
classified more right-wing, similar to a "Wagenknecht party".
29 September 2023
810-814-43-26/Polls
Only
Seven Percent Germans Very Satisfied With The Federal Government
His net
satisfaction, i.e. the difference between those who are very
satisfied and very dissatisfied, is thus only -43. Economics
Minister Robert Habeck, on the other hand, who lost a total of
21 points on the satisfaction scale in the last surveys in May
and July, was able to stop his downward trend in September. His
net satisfaction increases by five points, but remains at a low
level of -43.
Only about one in ten
Germans (11%) say they are very satisfied with the work of the
Green minister, while more than half (54%) rate his work very
negatively.
Pistorius remains by far the most popular minister
As has always been the case since taking office, Defence Minister Boris
Pistorius remains by far the most popular minister in September.
He is the only minister in the traffic light government where
the proportion of the very satisfied (27%) is about the same as
that of the very dissatisfied (28%). His net satisfaction is
therefore only slightly negative with a value of -1, which makes
him stand out strongly from the rest of the cabinet. Across all
the other ministers, the picture of a very dissatisfied
population emerges. After Pistorius, Labour Minister Hubertus
Heil achieved the best score of -26, while the two Green
ministers Lisa Paus (-45) and Steffi Lemke (-47) scored the
worst on the satisfaction scale. Although Health Minister
Lauterbach was able to stop his decline with a slight increase
(3 percentage points) compared to the July wave compared to the
last survey, he still remains in the middle of the ministerial
ranks with a net satisfaction of -34.
12 September 2023
Source:
https://www.ipsos.com/de-de/nur-sieben-prozent-sehr-zufrieden-mit-bundesregierung
810-814-43-27/Polls
It Is
Becoming More Widespread, But There Are Still Many
Misconceptions About Temporary Agency Work
In the second phase of its comprehensive, multi-phase U& Attitude (U&
Attitude) market study, the research company surveyed 3000,<>
people among the Hungarian working age population about their
work-related attitudes, satisfaction and market knowledge. The
national sample represents the target group according to basic
demographic characteristics, such as gender, age, region and
educational attainment. According to the study, one-fifth of
respondents have personal temporary agency experience, and
two-fifths have only heard of this form of employment.
Misconceptions and fears
A quarter (26%) of temporary agency workers would
recommend this form of employment to their acquaintances. There
is a strong misconception about the service that it involves
less pay, high commissions and usually high vulnerability.
– says Csongor Juhász, CEO of Prohuman.
Those engaged in intellectual work are more satisfied
Another important result of Ipsos' market study is that Hungarian
employees typically report positive work experiences, with seven
out of ten satisfied with their work. A significantly better
proportion can be measured among white-collar professionals
(76%).
Work is not just a necessary evil
For Hungarian employees, the feeling of a job well done (87% agree) and
value creation (73%) are of paramount importance. On the other
hand, it is essential to be able to differentiate, separate and
find a healthy work-life balance (85%). Only a quarter of the
Hungarian working population thinks of work as a necessary evil.
The phenomenon of guest work is less accepted for the
time being
In the field of guest work, the third research phase of Ipsos provided
interesting lessons. The B437B survey of a total of 2 HR
decision-makers found that nine out of ten managers had heard
about the possibility of employing third-country workers, but
only one-tenth of positive respondents had personal experience.
39% have not yet considered hiring third-country workers, and
45% would rather not take advantage of this option – even if HR
service providers offer it.
Further challenges in HR
According to managers responsible for personnel and labour decisions,
finding a good workforce is currently the number one challenge
(87% agree), especially in shortage occupations it is difficult
to fill vacancies or replace those leaving. Retaining the
workforce is also a high-energy consumption (84% mention) in the
profession. The difficulties of acquisition and retention are
mainly due to the difficulty of meeting salary expectations, and
it is a great challenge to maintain employee motivation during
this period. In addition to competitive service fees, speed is
the main expectation of HR service providers on the Hungarian
market.
21 September 2023
Source:
https://www.ipsos.com/hu-hu/egyre-elterjedtebb-de-meg-mindig-sok-tevhit-munkaero-kolcsonzes-korul
NORTH AMERICA
810-814-43-28/Polls
The
Politics Of Religion
Everything else being equal, the more religious the individual in the
U.S. today, the higher the probability that the individual
identifies with or leans toward the Republican party. I called
this the “R and R rule” in my 2012
book on religion,
found the phenomenon alive and well in my 2014
review of Gallup data,
and now, nine years later, Gallup’s data confirm that this
religiosity gap is more evident than ever.
Americans’ political identity is a powerful correlate of a wide
range of Americans’ attitudes and behaviors, including, in
particular, a
wide range of attitudes about hot-button political and social
issues.
And we know that political
identity is related to views of the national economy, views of
the nation’s institutions, happiness, perceptions of the
nation’s most important problems, and a variety of other
measures. It is thus not surprising that political identity
would also be related to religion.
One key
measure we use in analyzing this politics and religion
relationship is the absence of
religious identity -- those
who, when asked by a survey researcher about their religious
identity, reply that they have none.
“Nones” have risen from essentially zero in some Gallup surveys
in the 1950s to above 20% in recent Gallup surveys (and higher
than that in some other firms’ surveys).
Not surprisingly,
researchers have zeroed in on this phenomenon, and the term
“nones” has entered the popular vocabulary (as exemplified by
books with titles like The
Nones: Where They Came, From Who They Are, and Where They Are
Going (by Ryan P. Burge), None
of the Above: Nonreligious Identity in the U.S. and Canada (by
Joel Thiessen and Sarah Wilkins-Laflamme) and The Rise of the Nones: Understanding and Reaching the Religiously
Unaffiliated (by James Emery White).
An aggregate of five recent Gallup surveys conducted from May 2021
through May 2023 confirms the extent to which Democrats are much
more likely than Republicans to be nones. Twenty-six percent of
nones identify with or lean toward the Democratic party,
compared with just 11% of nones who identify with or lean toward
the Republican Party.
Looked at differently, across the combined 2021-2023 data, equal
proportions of Americans identified as Democratic or
Democratic-leaning (46%) or Republican or Republican-leaning
(46%). Yet, the group of Americans who are religious nones split
63% Democratic versus 26% Republican -- far different from the
population at large.
Other measures of religiosity Gallup tracks show the same general R and
R relationship. Republicans are more likely than Democrats to
report that religion is important in their daily lives, and
Republicans are more likely than Democrats to report attending
religious services.
Partisan Gap in Nones Increasing Over Time
The magnitude of this religion gap has increased over the years, to the
point where I think it is fair to say that a significant part of
the explanation for the “rise of the nones” lies with changes
among Democrats, not Republicans.
I looked at this relationship on a year-by-year basis using our annual
May GPSS Values surveys, a valuable exercise because the same
questions have been asked in basically the same survey context
every May since 2001. The percentage of Republican nones has
edged up over the last 10 years or so, but the percentage of
Democratic nones has increased significantly more. In short, the
relatively small partisan gaps in none identification seen two
decades ago have increased substantially over the years.
Republicans Less Likely to Be Nones, but Much More
Likely to Be Protestants
Mathematically speaking, if Democrats are more likely to be nones than
Republicans, Democrats have to be less likely
to identify with one or more other religious groups to make up
for it. The two largest religious groups where this could play
out are Protestants (about 46% of all national adults) and
Catholics (about 24% of all national adults). The data are clear
that it is the Protestants who take the brunt of the rise of the
nones among Democrats, not Catholics.
The differences are striking. Fifty-six percent of Republicans identify
as Protestants, compared with just 38% of Democrats. That
compares to the 11% of Republicans and 26% of Democrats who, as
noted above, identify as nones. By contrast, the percentage of
each party identifying as Catholic is roughly equal. Unlike
Protestants, Catholics have maintained a roughly stable
percentage of the American population over time and, as seen
here, have remained largely immune from the partisan divide
evident among Protestants and nones. Explanations for this
phenomenon are tied up with -- among other factors -- the impact
of immigration on the composition of the Catholic population.
Searching for Explanations
Figuring out why the basic
R and R relationship exists provides a fascinating and important
challenge for social scientists. Not surprisingly, we have seen
a cascade of books, papers and other publications focused on
theories and explanations for this aspect of American social and
political life.
As is true with any correlation between two variables, the first
question becomes one of causality (as taught in beginning
statistics classes, correlation is no proof of causation). It
could be that those Americans who -- for whatever reason -- are
personally religious pick and choose a political identification
that best fits their underlying religious beliefs. Or,
conversely, it could be that Americans who -- for whatever
reason -- are either Republican or Democratic in their political
orientation tailor their religious beliefs to their politics. Or
it could be that a third underlying factor -- say, one’s ethnic
or racial background, or the geographic location of one’s
residence, or simply one’s family heritage -- is the underlying
causal factor that causes one to both be religious and to be
Republican, or to be less religious and to be Democratic.
University of Pennsylvania political scientist Michele Margolis, in her
2018 book, From Politics to
the Pews, makes the case that political identity is
the primary causal factor in determining Americans’ religious
identity, more so than the other way around. Her analyses, and
our own Gallup discoveries on the extraordinary power of
political identity in shaping Americans’ worldview, make this a
quite plausible explanation.
This leads to the idea of an antireligion “backlash” -- the hypothesis
that Democrats have moved away from religion in reaction to the
increasing visibility given to the association between religion
and Republican and conservative politics. Sociologists Michael
Hout and Claude Fischer in 2002 concluded a review of the
evidence by saying, “This political part of the increase in
‘nones’ can be viewed as a symbolic statement against the
Religious Right.” University of Connecticut sociologist Ruth
Braunstein has
more recently reviewed in great detail various
manifestations of how this backlash theory could be playing out
in the U.S. today.
The key takeaway is the possibility of a spiral or self-fulfilling
prophecy effect -- the idea that as religion becomes identified
with Republican and conservative politicians and positions, it
will continue to drive Democrats and liberals away from
religion, amplifying the pattern by which Republicans
increasingly dominate the group of those who remain religious.
This, in turn, may mean that we are seeing a general pullback
from religion in part because religion (like so much else in
American life today) has become politicized.
This could work the other way around, as Braunstein points out in her
review. Democrats could, in theory, react to what they see among
those on the Religious Right by organizing their political
beliefs around progressive values (the Religious Left) -- one of
three “narrow backlashes” Braunstein describes. There is not a
lot of evidence supporting the idea that this is occurring. But
this line of thinking raises the possibility of future patterns
different than the increasing defection of Democrats from
religious identity we have been seeing up to this point.
Final Thoughts
One explanation for the connection between Protestant religion and
Republican politics is that it benefits both sides of the
equation. Protestant religious leaders can gain fame, influence
and authority when they are connected to political positions and
political leaders. (Dr. Robert Jeffress, senior pastor of the
very large First Baptist Church of Dallas, begins his online
biography with an explicit reference to his political outreach:
“Dr. Robert Jeffress is Senior Pastor of the 16,000-member First
Baptist Church, Dallas, Texas, and a Fox News Contributor.”)
Politicians, for their part, covet the support of highly
religious Protestants, and Republican political candidates make
repeated pilgrimages to evangelical churches and to religious
events in efforts to gain the support of these highly religious
voters. So, there are compelling reasons why the R and R
connection may continue in the months and years ahead.
But this connection between religion and politics carries within it a
singular paradox. Most religions, including Christianity, the
dominant religion in the U.S., argue for social cohesion and
love for one’s neighbor, while politics carries within it the
fundamental structure of disagreement, conflict, argument, and
castigation of one’s opponents. How this plays out in the future
is a matter of fascinating theological and practical concern.
All of this matters, because religion matters in society. The evidence
is clear that more
religious people have higher levels of wellbeing and happiness.
And religion has a number of other positive functions in
society, including its influence on morality and pro-social
behavior, its influence on charity and giving back to the
community, and its contribution to social cohesion and
solidarity. A continuing decrease in overall religiosity in
American society, like the continuing decrease in faith in other
American institutions, can have significant consequences for the
health and viability of the country going forward.
1 September 2023
Source:
https://news.gallup.com/opinion/polling-matters/510464/politics-religion.aspx
810-814-43-29/Polls
Majority Of Americans Say U.S. Is One Of The Greatest Countries
In The World
The share of Americans who say the United States stands above all other
nations in the world has declined modestly over the past four
years, according to a new Pew Research Center survey. There has
also been an increase in the share who say other countries are
better than the U.S.
Much of this recent change in attitudes has come from Republicans and
Republican-leaning independents. Four years ago, 40% of
Republicans said the U.S. stands above all other nations,
compared with 31% today. And the share of Republicans saying
other countries are better has nearly doubled, from 9% to 17%.
At the same time, Democrats and Democratic leaners have grown slightly
more likely to say there are other countries that are better
than the U.S.: In 2019, 31% said this, compared with 36% today.
Age divides in attitudes about U.S. persist
As has been the case
for more than a decade, views
of how America compares with other countries differ by age.
Roughly four-in-ten adults ages 18 to 29 (43%) say other
countries are better than the U.S. – the highest share of any
age group.
Age differences are evident within both partisan coalitions. Half of
Democrats under age 30 say other countries are better than the
U.S., as do 40% of those 30 to 49. By comparison, just 25% of
Democrats 50 and older say this.
Among Republicans, 28% of adults under 30 say other countries are
superior to the U.S., compared with 12% of those 50 and older.
And younger Republicans are considerably less likely than older
Republicans to say the U.S. is the greatest nation: 16% of those
ages 18 to 29 say this, compared with 26% of those 30 to 49, 36%
of those 50 to 64 and 41% of those 65 and older.
How partisans’ views of U.S. standing have changed
over time
Republicans have long been more likely than Democrats to see the U.S. as
the single greatest nation, while Democrats have been more
likely to say there are other countries that are better. Still,
the most frequent response among both Republicans and Democrats
continues to be that the U.S. is one of the world’s greatest
countries, along with others.
The share of adults saying the U.S. stands above all other countries
dropped significantly in telephone surveys conducted between
2011 and 2019. While the decline in views of the United States’
global standing was concentrated among Democrats during these
years, the decline over the past four years is concentrated
among Republicans.
29 August 2023
810-814-43-30/Polls
Why
Some Americans Prefer To Go To Religious Services In Person And
Others Prefer To Watch Virtually
Some
17% of U.S. adults regularly attend religious services in
person and watch
them online or on TV, according to a recent Pew
Research Center survey.
Roughly three-quarters of this group – making up 13% of all U.S.
adults – say they prefer attending in person, while 2% prefer
viewing services virtually and 2% have no preference.
The survey asked these respondents open-ended questions about why they
prefer one kind of service over another. The responses show that
Americans who prefer in-person services value the sense of
connection, fellowship and community those services provide.
People who prefer virtual services often cite convenience and
health concerns.
Why some Americans prefer in-person religious
services
One respondent puts it this way: “Watching online is a great option when
you are unable to attend – but joining together with other
believers is how we truly fellowship. You cannot get that from
watching from afar.” Another says, “There is something powerful
about being in community with other believers and getting that
personal connection and fellowship. In person is much more
uplifting and impactful.”
An additional 14% of those who prefer in-person services say that those
services are more personal. As one respondent puts it: “It’s
more up close and personal. You can answer questions. You can
participate in the service to get a better understanding.”
Another says, “In-person interaction gives me an opportunity to
ask questions with the visiting scholar, [and] meet community
members, and kids have better interaction with their peers.”
Another 8% of these respondents cite the quality of the worship
practices at in-person services, saying that things like
communion and singing can’t be replicated online:
Smaller shares say they prefer in-person services because there are
fewer distractions (6%), because they are better able to feel
the spirit or presence of God (6%) or because attending
in-person is a divine or scriptural commandment (4%).
Why some Americans prefer virtual religious services
There are too few respondents who prefer virtual religious services to
provide precise data on their reasons for doing so. However,
several respondents allude to the comfort and convenience of
watching services online or on TV. One explains, “It gives me
more freedom and extra time to multitask and do some other
things.”
Others also mention the safety provided by virtual services. For
example, “I don’t have to get dressed to go to the church. I can
watch and listen more than once, and I don’t have to worry about
being infected with others’ germs.”
What draws people to online religious services from
congregations other than their own?
Fully 10% of U.S. adults say they attend religious services both in
person and watch them virtually and say
they watch virtual services offered by a different congregation
than the one they attend in person most often.
The most common reason people in this group cite for watching virtual
services from a different congregation is a preference for
specific sermons, messages or teachings. One respondent points
to “the message. The pastors I follow teach God’s truth. They
don’t doctor, nuance or sugarcoat the parts you don’t like.”
Says another, “The sermon is so uplifting when you’re feeling
down. It gives you a sense of peace.” Another says, “The
services are beautiful and the reflections during the homily are
timely and inspire personal examination.”
Others mention the characteristics of specific pastors, speakers or
other leaders:
Other reasons these respondents mention include that the services they
watch preach the “true word of God” and adhere closely to
scripture, that the services are educational and that it is
enjoyable to listen to a new or different perspective.
6 September 2023
810-814-43-31/Polls
Most
Americans Say Being A Man Helps A Person Get Ahead In The U.S.
More Americans say being a man helps than hurts a person’s ability to
get ahead in the United States these days, according to a recent
Pew Research Center survey. By contrast, more Americans say
being a woman hurts rather than helps.
Views
about whether being a man or a woman helps or hurts have
not changed much since
we asked these questions in 2019 and 2020.
And as in the past, there
are significant differences among key demographic groups in
people’s perceptions of the advantages or disadvantages of being
a man or woman in the U.S. today.
Does being a man help or hurt a person’s ability to
get ahead in the U.S.?
Gender gaps on this question persist among White adults, but there are
no differences between Black or Hispanic women and men on
whether being a man helps. (The number of Asian women and men
surveyed is too small to analyze their responses separately.)
Women younger than 30 are more likely than women ages 30 and older to
say being a man helps a person get ahead (76% vs. 64%). There
are no age differences among men on whether being a man helps or
hurts.
Similarly, women with different levels of education have varying views
of whether men have an advantage based on their gender. Women
with a bachelor’s degree or more education are more likely than
those with some college or less education to say that being a
man helps (79% vs. 61%). Among men, there are no differences in
views by these education levels.
There are also partisan differences on whether being a man helps or
hurts a person’s ability to get ahead. Among Republicans and
independents who lean toward the GOP, 43% say being a man helps,
22% say it hurts and 34% say it neither helps nor hurts. By
comparison, 77% of Democrats and independents who lean toward
the Democratic Party say being a man helps.
There are wide gender gaps on this question among Republicans and
smaller gaps among Democrats. Some 54% of Republican women say
being a man helps a person get ahead, compared with 34% of
Republican men. In turn, Republican men are more likely than
Republican women to say being a man hurts (28% vs. 15%). Among
Democrats, majorities of men and women say being a man helps,
but women are more likely than men to say this.
Does being a woman help or hurt a person’s ability to
get ahead in the U.S.?
There are also large differences across demographic groups in views of
whether being a woman helps or hurts someone’s ability to get
ahead.
A majority of women (58%) say being a woman hurts, but fewer than half
of men (40%) agree.
Among both White and Black Americans, women are more likely than men to
say being a woman hurts a person’s ability to get ahead.
However, there are no differences on this question between
Hispanic women and men. (The number of Asian women and men
surveyed is too small to analyze their responses separately.)
Among women and men alike, younger adults are more likely than older
adults to say that being a woman hurts when it comes to getting
ahead in the U.S. these days.
Some 70% of women younger than 30 say being a woman hurts in this
respect, while 55% of women ages 30 and older say the same. And
half of men younger than 30 say this, compared with 37% of men
30 and older.
Women with more education are also more likely than those with less
education to say that being a woman hurts when it comes to
getting ahead. While 68% of women with at least a bachelor’s
degree say this, 53% of those with some college or less
education say the same. There are no differences by education
level among men.
When looking at party affiliation, Republicans’ views are mixed. Similar
shares of Republicans say being a woman helps (33%) and hurts
(31%) a person’s ability to get ahead, while 35% say it neither
helps nor hurts. Among Democrats, a majority (68%) say being a
woman hurts when it comes to getting ahead.
There are again large gender differences among Republicans and smaller
ones among Democrats. Republican women are about twice as likely
as their male counterparts to say that being a woman hurts (43%
vs 21%). In turn, 41% of Republican men say being a woman helps,
compared with 23% of Republican women. Among Democrats,
majorities of men and women say that being a woman hurts, but
women are more likely than men to say this.
12 September 2023
810-814-43-32/Polls
Public
Has Mixed Views On The Modern American Family
Trends in marriage and fertility along with shifting social norms and
important legal changes have reshaped
the American family.
And there is no consensus on how some of the broad trends that are
driving family change will impact the country in the future.
Majorities say fewer people marrying these days and more couples
living together without being married won’t have a positive or negative
impact.
There’s baseline support for a variety of family arrangements, but the
public still favors some types of families over others. Families
that include a married husband and wife raising children are
seen as the most acceptable. At the same time, relatively few
Americans say marriage and parenthood are central to living a
fulfilling life.
For this report, we surveyed Americans on:
The survey included 5,073 U.S. adults and was conducted April 10-16,
2023, using the Center’s nationally representative American
Trends Panel.1
Views of the future of family life
Overall, 40% of Americans say, in thinking about the future of
the country, they are very or somewhat pessimistic about the institution
of marriage and the family.
Only 25% are very or somewhat optimistic, and 29% say they are
neither optimistic nor pessimistic.
The survey asked about some key trends in family life and what impact
they might have in the future. The one that was viewed most
negatively by far was the trend toward fewer children being
raised by two married parents. About half of adults (49%) say
this will have a negative impact on the country, while 11% say
the impact will be positive.
Related:
For more detail, including demographic data, on views of the future of
family life, refer to Chapter
1 of
this report.
Views of different family types
Many Americans are accepting of a range
of different family arrangements. Most say an opposite-sex
couple raising children, whether married or not, is an
acceptable arrangement. And majorities say the same about single
parents and about gay or lesbian couples with or without
children.
There are differences in the degree of acceptance, however. Nine-in-ten
adults say a husband and wife raising children together is
completely acceptable. In contrast, 60% say a single parent
raising children on their own is a completely acceptable
arrangement. And fewer than half (47%) say the same about a
married gay or lesbian couple raising children.
For more detail on views of family arrangements, refer to Chapter
2 of
this report.
Factors that lead to a fulfilling life
Americans most often point to job satisfaction and close friends –
rather than being married or having children – when asked what
factors contribute to a fulfilling life.
Some 71% say having a job or career they enjoy is extremely or
very important for people to live a fulfilling life, and 61% say
the same about having close friends.
Only about a quarter say having children (26%) or being married (23%) is
equally important.
For more detail on these findings, refer to Chapter
5 of
this report.
How attitudes about family life vary across different
groups
Views of a range of issues related to the modern family vary widely by:
Additional key findings from the survey:
14 September 2023
810-814-43-33/Polls
Americans Are More Pessimistic Than Optimistic About Many
Aspects Of The Country’s Future
Smaller shares are pessimistic about other aspects of the country’s
future. Still, more Americans feel pessimistic than optimistic
about:
Views on these items differ considerably by party and, in some cases, by
race and ethnicity and by age.
By double-digit margins, Republicans and Republican-leaning independents
are more likely than Democrats and Democratic leaners to say
they are pessimistic about:
The only topic Democrats are more pessimistic about than Republicans is
racial equality. More than half of Democrats (54%) are
pessimistic about the United States’ ability to ensure racial
equality for all people. In contrast, 34% of Republicans are
pessimistic about this and 33% are optimistic.
Views about moral and ethical standards and about the institution of
marriage and the family also differ by age. Adults ages 65 and
older are more pessimistic than younger age groups in both
areas.
Across racial and ethnic groups, White adults are the most pessimistic
group when it comes to:
A different pattern emerges when it comes to the country’s ability to
ensure racial equality in the future. About half of Black (51%)
and Asian (49%) adults say they feel pessimistic about this,
while less than half of Hispanic (44%) and White (43%) adults
say the same.
18 September 2023
810-814-43-34/Polls
Americans’ Dismal Views Of The Nation’s Politics
Americans have long been critical of politicians and skeptical of the
federal government. But today, Americans’ views of politics and
elected officials are unrelentingly negative, with little hope
of improvement on the horizon.
Majorities say the political process is dominated by special interests,
flooded with campaign cash and mired in partisan warfare.
Elected officials are widely viewed as self-serving and
ineffective.
A
comprehensive new Pew Research Center study of the state of the
nation’s politics finds no single focal point for the public’s
dissatisfaction.
There is widespread criticism of the three branches of
government, both political parties, as well as political leaders
and candidates for office.
Notably, Americans’ unhappiness with politics comes at a time of
historically high levels of voter turnout in national
elections. The
elections of 2018, 2020 and 2022 were three of the
highest-turnout U.S. elections of their respective types in
decades.
But voting in elections is very different from being satisfied with the
state of politics – and the public is deeply dissatisfied.
The new study of Americans’ views of the state of the political system
is primarily based on a survey conducted July 10-16, 2023, among
8,480 adults, with additional data from a survey conducted June
5-11, 2023, among 5,115 adults. Both were conducted on Pew
Research Center’s nationally representative American
Trends Panel.
A little more than a year before the presidential election, nearly
two-thirds of Americans (65%) say they always or often feel
exhausted when thinking about politics, while 55% feel angry. By
contrast, just 10% say they always or often feel hopeful about
politics, and even fewer (4%) are excited.
The survey also provides people several opportunities to describe in
their own words their feelings about the political system and
elected officials. When asked to sum up their feelings about
politics in a word or phrase, very few (2%) use positive terms;
79% use negative or critical words, with “divisive” and
“corrupt” coming up most frequently.
We also asked people to identify the strengths of the political system, as well as its
weaknesses. Among the positive responses, roughly one-in-ten
point to the structures of U.S. government, including its system
of checks and balances (12%), freedoms and democratic values
(9%) and the opportunity to vote in elections (8%).
Yet it is telling that a majority of Americans are unable or unwilling
to identify strong points of the nation’s political system.
While about a third gave no answer, another 22% write “nothing”
– meaning that in their view, the political system does not have
any strengths.
Explore this report
This overview covers key takeaways from our study of Americans’
attitudes about the political system and political
representation. For more in-depth analysis, we encourage you to
explore the full report. All chapters are listed out in the
table of contents and at the bottom
of the page.
These views and other negative sentiments are widely shared among older
and younger Americans, White, Black, Hispanic and Asian adults,
people who are highly engaged in politics and those who are less
engaged. And in most cases, the partisan differences in these
attitudes are relatively modest.
In an era defined by partisan polarization, the parties share little
common ground politically. But they do share a deep unhappiness
with the current state of politics.
The impact of partisan polarization
Ordinary Americans are more
polarized than in the past.
Partisan divisions on issues are wider than they were a few
decades ago, and many Americans hold deeply
negative views of those on the “other side” of politics.
Yet the public also is highly critical of the impact of partisan
polarization on politics.
More than eight-in-ten Americans (86%) say the following is a good
description of politics: “Republicans and Democrats are more
focused on fighting each other than on solving problems.”
Asked to describe in their own words the biggest problem with the
political system, 22% of Americans volunteer partisan
polarization or lack of partisan cooperation. Only critiques of
politicians (31%) are mentioned more frequently.
Most people (57%) also believe that conflicts between Republicans and
Democrats receive too much attention these days. And 78% say
there is too little focus on important issues facing the
country.
Persistent concerns over money in politics
The public’s belief that special interests and campaign donors have too
much influence on politics is not new. Since the 1970s, large
majorities have said that the
government “is run by a few big interests looking out for
themselves,”
rather than for the benefit for all the people.
Yet money in politics emerges again and again as a major source of
public frustration.
People in members’ own districts, by contrast, are widely viewed as
having too little influence
(70% say this).
A sizable majority (72%) – including comparable majorities in both
parties – support limits on the amounts of money individuals and
organizations can spend on political campaigns. And 58% believe
it is possible to have laws that would effectively reduce the
role of money in politics. (Explore this further in Chapter 5.)
Views of the parties and possible changes to the
two-party system
Neither party is particularly popular with the public. Only about
four-in-ten adults have a favorable view of the Democratic Party
(37%), while about as many (36%) have a favorable impression of
the Republican Party.
An increasing share of Americans express negative opinions of both
parties. Currently, 28% of the public has an unfavorable opinion
of both the Republican and Democratic parties.
That is little changed from a year ago, but nonetheless is the highest
share expressing dislike of both parties in nearly three
decades. In 1994, just 6% of Americans viewed both parties
negatively.
Many people are open to the idea of having more political parties: 37%
say the phrase “I often wish there were more parties to choose
from” describes their views extremely or very well. Nearly half
of independents and those who identify with other parties (47%)
– including 56% of Democratic-leaning independents – say this. (Views
of the two major parties, the party system and support for
additional parties are discussed in more detail in Chapter 4 and Chapter 9.)
However, there is considerable skepticism that having more parties would
make it easier for the country to solve its problems. About a
quarter (26%) say it would make it easier to solve problems,
while nearly as many (24%) say it would make it harder; a
quarter say it would not have much impact.
The survey includes a number of proposals to change the way politics is
run in this country. Some have attracted majority public support
for many years, including ending the Electoral College system,
placing term limits on members of Congress, automatically
registering all citizens to vote and requiring all voters to
show government-issued photo identification to vote. (Opinions
about proposals for changing the political system are covered
in Chapter 10.)
Large majorities of Americans also support:
Another proposal that would dramatically affect the Supreme Court –
increasing the number of justices – attracts considerably less
support from the public.
Slightly more Americans oppose (51%) than favor (46%) increasing the
number 0f justices on the court. There is a wide partisan gap in
these views: Democrats (66%) are more than twice as likely as
Republicans (27%) to favor expanding the court.
Other important findings
Recent presidential campaigns viewed as too long, not
informative. Americans are not just
unhappy about the current state of politics; they also take a
critical view of recent presidential campaigns. Nearly
eight-in-ten (78%) say recent nominees have not been good
candidates, while large majorities also say the campaigns have
not focused on the right issues or been informative, and 72% say
they “lasted too long.” (Chapter 8)
Growing public concerns over different dimensions of
federal-state relations. A
majority of Americans (54%) are extremely or very concerned that
“the rights and protections a person has might be different
depending on which state they are in,” up from 43% just a year
ago. Increasing shares also express concerns about the federal
government doing too much that is better left to the states, as
well as state governments not being willing enough to work with
the federal government. (Chapter 2)
Elected officials are held in extremely low regard. When
asked why local and national elected officeholders run for
office, relatively small shares of Americans say they run to
serve the public or address issues they care about. By contrast,
majorities say all or most politicians are motivated by selfish
reasons, including 63% who say all or most ran for office to
make a lot of money. (Chapter 7)
Majority says voting can affect the country’s
direction. Nearly
six-in-ten (57%) say voting by people like them can affect the
country’s future direction, though just 20% say it can affect
this a lot. Adults younger than 50 are less likely than older
people to say voting can have at least some effect on the
country’s future direction. (Chapter 5)
19 September 2023
Source:
https://www.pewresearch.org/politics/2023/09/19/americans-dismal-views-of-the-nations-politics/
810-814-43-35/Polls
Majority Of Americans Continue To Favor Moving Away From
Electoral College
The Electoral College has played an outsize role in some recent U.S.
elections. And a majority of Americans would welcome a change to
the way presidents are elected, according to a new
Pew Research Center survey.
Explore Americans’ views of the political system
This article draws from our major report on Americans’ attitudes about
the political system and political representation, conducted
July 10-16, 2023. For more, explore:
The current electoral system in the United States allows for the
possibility that the winner of the popular vote may not secure
enough Electoral
College votes
to win the presidency. This occurred in both the 2000 and 2016
elections, which were won by George W. Bush and Donald Trump,
respectively.
Partisan views over time
Democrats and Democratic-leaning independents are far more likely than
Republicans and Republican leaners to support moving to a
popular vote system for presidential elections (82% vs. 47%).
The share of Democrats saying this is nearly identical to last year but
higher than in January 2021, a few weeks before President Joe
Biden was sworn into office after winning both the Electoral
College and the popular vote.
Republicans are fairly divided on this question: 52% support keeping the
current Electoral College system, and 47% support moving to a
popular vote system. GOP support for moving to a popular vote is
the highest it’s been in recent years – up from 37% in 2021 and
just 27% in the days following the 2016 election.
Party and ideology
Nearly nine-in-ten liberal Democrats (88%) and about three-quarters of
conservative and moderate Democrats (77%) say they would prefer
presidents to be elected based on the popular vote.
Ideological differences are wider among Republicans. A clear majority –
63% – of conservative Republicans prefer keeping the current
system, while 36% would change it.
The balance of opinion reverses among moderate and liberal Republicans
(who make up a much smaller share of the Republican coalition).
A majority of moderate and liberal Republicans (63%) say they
would back the country moving to a popular vote for president.
Age
Younger adults are somewhat more supportive of changing the system than
older adults. About seven-in-ten Americans under 50 (69%)
support this. That share drops to about six-in-ten (58%) among
those 65 and older.
Political engagement
Political engagement – being interested in and paying attention to
politics – is associated with views about the Electoral College,
particularly among Republicans.
Highly politically engaged Republicans overwhelmingly favor keeping the
Electoral College: 72% say this, while 27% support moving to a
popular vote system.
Republicans with a moderate level of engagement are more divided, with
51% wanting to keep the system as is and 48% wanting to change
it. And a clear majority of Republicans with lower levels of
political engagement (70%) back moving to a popular vote.
Differences by engagement are much less pronounced among Democrats.
About eight-in-ten Democrats with low (78%) and medium (82%)
levels of engagement favor changing the system, as do 86% of
highly engaged Democrats.
25 September 2023
810-814-43-36/Polls
Black
Americans’ Experiences With News
Black Americans see a range of problems with how Black people are
covered in the news, and few are hopeful that will change in the
foreseeable future, according to a new Pew Research Center
survey of nearly 5,000 Black adults.
On several questions, Black Americans are far more likely to view news
coverage of Black people in a negative rather than positive
light:
These critical views of coverage of Black people are widely shared
within the Black population, regardless of age, gender and even
political party affiliation.
The survey asked Black Americans if they ever come across news
that is racist or racially insensitive about Black
people in some way. About four-in-ten (39%) say they see this
kind of racially problematic news extremely or fairly often, and
an additional 41% say they sometimes see such news.
Those who report coming across racially problematic news coverage of
Black people at least sometimes see a few different reasons for
this. About half (51%) say outlets pushing
agendas is a major factor, and 45% say the same
about journalists not being informed. Others say racist
views among people at the news outlet (42%), the speed
of the news cycle (37%) and a lack
of Black staff at the news outlet (36%) are major
reasons for racist or racially insensitive coverage.
Just 14% of Black Americans are highly confident that Black people will
be covered fairly in their lifetimes, saying that is extremely
or very likely to happen. Far more (38%) think that is not too
likely or not at all likely to happen, while an additional 40%
say it is somewhat likely. (More details on Black Americans’ views
of how Black people are covered in the news are
in Chapter 1.)
How can news coverage of Black people improve?
Black Americans identify a few steps that could improve what they see as
flawed coverage. And one factor consistently stands out – making
sure that journalists are informed about the issues affecting
Black people.
The survey asked about the importance of several practices for
journalists when covering Black people, finding that:
Among those who report at least sometimes seeing racist or racially
insensitive coverage about Black people, nearly two-thirds (64%)
identify educating all journalists
about issues impacting Black Americans as an
extremely or very effective way of making coverage fairer.
Substantial shares also say including
more Black people as sources (54%) and hiring
more Black people as newsroom leaders (53%) and
as journalists (44%) at news outlets would be highly
effective. Details on these findings are in Chapter
2.
These are some of the key findings of the Center’s nationally
representative survey of 4,742 U.S. Black adults conducted from
Feb. 22 to March 5, 2023. We undertook this study to take a
closer look at the relationship between Black Americans and news
in the United States.
In 1967, the Kerner
Commission –
undertaken by President Lyndon Johnson’s administration to
investigate the causes behind urban riots – took a harsh view on
the news media’s stance toward Black Americans. The commission’s
report cited sensationalist and divisive coverage as well as
inaccurate and unfair representations of Black communities,
concluding that “the journalistic profession has been shockingly
backward in seeking out, hiring and promoting” Black people, and
“the press has too long basked in a white world looking out of
it, if at all, with white men’s eyes and white perspective.”
More than half a century later, there
is continued discussion of many
of the themes raised in
the report. This new study asks Black Americans themselves about
their experience with news today, including views around
portrayals of Black people in news stories, representation in
newsrooms, and where they go and whom they trust for
information.
The focus on the Black population allowed the Center to tailor the study
to the experiences of Black Americans rather than comparing them
to other groups. It also provided a greater opportunity to look
deeply at differences and similarities among groups within the
Black population.
To get a deeper understanding of Black Americans’ experiences with and
views about the news, we also held a series of nine online focus
groups of U.S. Black adults, enabling participants to elaborate
on their views. Quotes from these participants are included
throughout this report. The
methodology includes
more details about the survey and focus groups.
Quotes from focus groups on problems in news coverage
of Black people:
“There’s not a lot of African American coverage
unless it’s February or it’s criminal.” –Black woman, 60
“[News about Black people] is not accurate. They
overemphasize the bad, and not some of the good things that are
happening in the community, or if they do talk about the good
things, it’s just a blurb and they want to focus on the one
thing [that] was just terrible.” –Black woman, 55
“I feel like they make us look stupid at times … I
have a feeling that any time that I see [a Black person being
interviewed on the news] it’s always those people that I feel
like that have a hard time speaking correctly or I guess their
vocabulary is very limited. And I feel like they do that on
purpose.” –Black man, 29
Views about newsroom representation
Many Black Americans see instances when it is important for the news
they get to come from Black journalists – particularly in
getting news related to race and racial inequality. And as noted
earlier, many see hiring more Black journalists and newsroom
leaders as ways to improve coverage of Black people. But few
think their news in general needs
to come from Black journalists, nor do they automatically trust
a story because it comes from a Black journalist.
Nearly half of Black Americans think that Black journalists do a better
job than other journalists at covering issues related to race
and racial inequality (45%) and also at understanding them
(44%). Roughly similar percentages say Black journalists do
about as well as other journalists in these areas, while much
smaller shares say Black journalists do a worse job
(5% each).
For many Black Americans, then, it is crucial that the news they get
about issues related to race and racial inequality comes from
Black journalists. Four-in-ten Black Americans say this is
extremely or very important, and an additional 28% say it is
somewhat important.
At the same time, just 14% of Black Americans say it is highly important
that any news they get, regardless of topic, comes from Black
journalists. And a similarly small share (17%) say Black
journalists are better than other journalists at reporting the
news accurately.
Black Americans take a number of factors into account when assessing the
credibility of a news story – but the journalist’s race is not a
dominant one. Relatively few Black adults (15%) say that a
journalist being Black is an extremely or very important factor
in deciding whether a story is trustworthy. That lags well
behind other factors, including the sources cited (53% say this
is extremely or very important in determining a story’s
credibility), whether it is reported by multiple outlets (50%),
and the news outlet itself (46%).
Read Chapter 3 for
detailed views on newsroom representation.
Quotes from focus groups on the importance of getting
news from Black journalists:
“I always love seeing Black journalists do their
thing, but I can get the news from any source, to be honest. It
doesn’t have to be a Black person delivering me the news. … The
news is the news regardless of who delivers it. … Certain topics
you kind of want that perspective of [a Black journalist]. A
traffic accident, you got that, but then if it’s something more
involved like a racial incident I wanna see a Black perspective
of it.” –Black man, 61
“In our local newspaper, like I said, I don’t trust
it and there are definitely not Black writers employed with that
newspaper. … If they were hiring Black people then that would
tell me something more about the newspaper itself and their sort
of values, so I don’t have that.” –Black woman, 40
Similarities and differences within the Black
population
Concerns about how Black people are covered in the news are widespread
across the Black population. For example, Black adults across
age groups largely see coverage in a far more negative than
positive light, and Black men and women view issues around Black
news coverage in very similar ways. There are some differences
by education, with Black adults who have more formal education
expressing more negative opinions about news coverage of Black
people.
But the consensus extends to two groups that typically agree on very
little when it comes to views of the news media – Democrats and
Republicans. While Republicans
in general tend to be much more skeptical of journalists,
Black members of the two party coalitions are largely in
agreement on identifying problems in news coverage of Black
people:
Views about the news media broadly are more reflective of the overall
partisan divide on this issue, with Republicans consistently
less trusting of journalists. Nearly half of Black Democrats
(48%) have a great deal or fair amount of trust in national news
outlets, compared with 32% of Black Republicans. The gap is
similar – 52% vs. 37% – on trust in local news outlets. (Read
Chapter 5 for
more on where Black Americans go and whom they trust for news
and information.)
There is a large amount of consensus across different age groups about
shortcomings in how Black people are covered. And low
percentages across all age groups – including the youngest (ages
18 to 29) and the oldest (65 and older) – say it is highly
likely that Black people will be covered more fairly in their
lifetimes.
Across education and income levels, however, Black adults are less in
agreement about news coverage of Black people. While these
groups are much more negative than positive in their views of
news coverage of Black people, those with more formal education
and higher incomes tend to be particularly negative.
Differences also emerge within the Black population in views about the
role of Black journalists in how people get news. Black
Democrats, younger adults, and those with higher levels of
education and income often see greater value in getting news
from Black journalists.
The importance of Black identity in views about the
news
Some of the largest differences within the Black population are based on
their sense of Black identity – how important being Black is to
how they think about themselves. On a number of issues, wide
gaps emerge between Black
Americans who say their racial identity is extremely or very
important to them and
those who say it is less important.
One example of this divide involves views about what journalists should
do when covering Black people. The vast majority of those who
say being Black is highly important to their identity (82%) say
it is extremely or very important for journalists to understand
the history of the issues in the story when covering Black
people. That number falls to 55% among those who say being Black
is less important to them (i.e., it’s somewhat, a little or not
at all important).
Similarly large differences exist between the two groups over whether
journalists should personally engage with the people they cover
(69% vs. 40%) and whether they should advocate for Black people
(59% vs. 28%). And the same pattern applies to questions about
the role of Black journalists: Those who say being Black is
highly important to how they think about themselves are more
likely to value the impact of Black reporters (read
Chapter 4 for
details).
Sources of news and information
As with the public broadly,
Black Americans stay informed about current issues and events
through a range of sources. At least a third of Black Americans
say they get news extremely or fairly often from local news
outlets, national news outlets, social media sites, and friends,
family or acquaintances. Large majorities get news from each of
these sources at least sometimes.
In addition, about a quarter of Black Americans (24%) say they get news
from Black news outlets extremely or fairly often, with another
40% saying they do so sometimes. In the survey, Black news
outlets were defined as outlets created by Black people that
focus on providing news and information specifically for Black
audiences.
Social media may be one of the most common ways that Black Americans
stay informed, but Black Americans do not trust the news they
get there as much as many other types of sources – a pattern similar
to views among the broader U.S. population.
About one-in-five (18%) say they have a great deal or fair
amount of trust in the accuracy of the information from social
media, far smaller than the shares who say the same about local
and national news outlets (48% and 44%, respectively).
Black Americans who at least sometimes get news on social media are more
likely to say they prefer news outlets over social media for
several specific types of information, including basic facts or
in-depth information about an issue or event (details are in Chapter
5).
Next: 1. Views on how
Black people are covered in the news
26 September 2023
Source:
https://www.pewresearch.org/journalism/2023/09/26/black-americans-experiences-with-news/
810-814-43-37/Polls
Asian
American Voters Prioritize Candidates’ Policy Positions Over
Their Racial Identity
These findings are especially relevant as the 2024 U.S. presidential
election approaches. Two candidates of South Asian ancestry,
Nikki Haley and Vivek Ramaswamy, are running for the Republican
nomination.
Asian Americans continue to be underrepresented among elected officials
in the United States compared with their share of the country’s
population. As of the beginning of the 118th Congress, 16
House members and two senators claim Asian ancestry.
Asian registered voters tend to prefer the Democratic Party: 62% are
Democrats or lean Democratic, while 34% are Republicans or GOP
leaners. Most Asian origin groups are majority Democratic.
However, more
Vietnamese registered voters identify as Republican than
Democratic (51% vs. 42%).
What issues do Asian American voters care about the
most?
About four-in-ten Asian American registered voters (41%) say inflation
is the most important issue facing their local community – by
far the most common issue cited during this extended survey
period, which ended in January.
Economic inequality (16%) is the second-most mentioned issue, followed
by violent crime (11%) and racism (9%). These concerns follow reports
of violence against Asian Americans during the COVID-19 pandemic.
Among the six largest Asian origin groups, inflation is consistently
cited as the biggest issue facing Asian American voters’
communities. In addition, the ranking of issues is largely
similar across origin groups, though some minor differences
emerge:
How do Asian American voters’ views differ by
political party?
Views of top issues diverge sharply by party among Asian American
registered voters:
How do Asian American voters’ views differ by
nativity?
Views of top issues also vary somewhat by nativity among Asian American
registered voters – that is, based on whether they were born in
the U.S. or abroad.
Asian registered voters born in the U.S. are slightly more likely than
immigrants to view economic inequality as the most important
issue facing their community. However, importance of issues
varies less by nativity than by party among Asian Americans.
26 September 2023
810-814-43-38/Polls
The
Data On Women Leaders
As
women’s representation in U.S. politics has grown, 53% of
Americans say there are still too few women in high political
office in the United States, and many see significant obstacles
for women candidates. Our 2023
report on women leaders in politics explores
Americans’ views about gender and political leadership, as well
as views about the barriers women face.
Below, we’ve charted the most up-to-date data on the share of women in
top U.S. political, business and higher education positions over
time.
At the start of the 118th Congress in 2023, there were 25 women serving
in the U.S. Senate, just shy of the record 26 women senators
sworn in on the first day of the previous Congress. (The count
for the previous Congress includes Vice President Kamala Harris
and former Georgia Sen. Kelly Loeffler. Both were sworn in on
the first day and left the Senate shortly after.)
Of the 25 women senators:
The first-ever woman in the Senate was Rebecca Latimer Felton, D-Ga.,
who was appointed to the seat as a political maneuver in 1922
and served just one day. Nancy Kassebaum, R-Kan., who served in
the Senate from 1978 to 1997, was the first woman senator who
was elected for a full term without having a spousal connection
to Congress.
On the first day of the 118th Congress, 124 women were voting members in
the House of Representatives, making up 28% of the chamber’s
voting membership. In addition, four women serve as nonvoting
delegates to Congress, representing American Samoa, the District
of Columbia, Puerto Rico and the U.S. Virgin Islands.
Of the women voting representatives sworn in on the first day of the
session:
Jeannette Rankin, R-Mont., was the first woman to be elected to
Congress, taking office in 1917. Nancy Pelosi, D-Calif., is the
only woman to have served as speaker of the House. She was
speaker from 2007 to 2011, served as the minority leader in the
Republican-controlled House from 2011 to 2019 and was elected
speaker again from 2019 to 2023.
Women make up 29.9% of state senate seats and 33.7% of state house or
assembly seats. Three women serve as state senate president, and
another 13 as senate presidents pro tempore. An additional eight
are speakers of state houses.
In 2019, Nevada became the first state with a majority-women state
legislature. Women
currently hold a 62% majority of the Nevada state legislature –
the largest percentage of any state. West Virginia has the
smallest share, at 11.9%.
The first women to serve in a state legislature were Clara Cressingham,
Carrie C. Holly and Frances Klock, all Republicans who were
elected to the Colorado House of Representatives in 1894.
To date, 49 women have served as governors in 32 states. In 2023, eight
Democratic and four Republican women serve as governors.
Wyoming Democrat Nellie Tayloe Ross was the first woman governor. She
assumed office by a special election in 1924 to succeed her
deceased husband. Ella Grasso, a Connecticut Democrat, was the
first woman governor elected without spousal connections, in
1975.
President Joe Biden’s Cabinet includes 12 women out of the 25 positions
he has designated as Cabinet or Cabinet-level. That is the
highest share of women in history, at 48%. Former President Bill
Clinton’s second-term Cabinet had the second-highest share of
women, at 41%.
Under Biden, three of the top Cabinet posts – the vice president,
secretary of treasury and director of national intelligence –
are each held by women for the first time. Biden’s Cabinet
includes four White women, four Black women, one Asian American
woman, one Hispanic woman, one American Indian woman and one
multiracial woman.
The first woman in a Cabinet-level position was Frances Perkins,
appointed as secretary of labor by then-President Franklin D.
Roosevelt in 1933. To date, seven women have served as labor
secretary, more than in any other Cabinet or Cabinet-level
position.
The share of women CEOs of Fortune 500 companies reached an all-time
high of 10.6% in 2023, with 53 women heading major firms.
Katharine Graham of The Washington Post Co. was the first woman CEO to
make the Fortune 500 list, in 1972.
The share of women sitting on the boards of Fortune 500 companies has
been gradually increasing for decades, from 9.6% in 1995 to
30.4% in 2022.
In 2022, 32.8% of university presidents were women, more than triple the
share in 1986.
Frances Elizabeth Willard became the first woman college president in
1871, heading the Evanston College for Ladies in Illinois, which
later merged with Northwestern University. In 1974, Lorene L.
Rogers was the first woman to lead a major research university
(University of Texas), and Judith Rodin in 1994 became the first
permanent woman president of an Ivy League institution
(University of Pennsylvania).
27 September 2023
Source:
https://www.pewresearch.org/social-trends/fact-sheet/the-data-on-women-leaders/
810-814-43-39/Polls
Trudeau’s Approval Drops To Three-Year Low; Party Trails By
12-Points In Vote Intention
While the Bank of Canada holds steady – for now – on the borrowing rate,
there appears to be little end in sight to a 15-month slump in
Liberal political fortunes. The popularity of both the governing
party and its leader, Prime Minister Justin Trudeau, have been
on a consistent slide, and the latest results of a public
opinion survey from the non-profit Angus Reid Institute do
nothing to reassure a shrinking Liberal base.
As many Canadians consider whether the grass is greener on the blue side
of the fence, given the option, most would prefer a different
arrangement in parliament than the Liberal minority, with NDP
support, that Canada currently has. Two-in-five (38%) say a
Conservative majority would be the best government for Canada
going forward, slightly more than the proportion who prefer the
ongoing NDP-Liberal supply-and-confidence set-up (35%). Equal
numbers prefer a Liberal majority (13%) as a Conservative
minority (15%).
Conversely, though a Conservative majority is the most preferred choice,
it is also the most feared one. When presented with the same
options and asked to evaluate which one would be worst for the
country, more than two-in-five (43%) say a Conservative
majority. A similar number (38%) believe a Liberal majority
would be the worst possible government Canada could have over
the next four years.
More Key Findings:
About
ARI
The Angus Reid
Institute (ARI) was founded in October 2014 by
pollster and sociologist, Dr. Angus Reid. ARI is a national,
not-for-profit, non-partisan public opinion research foundation
established to advance education by commissioning, conducting
and disseminating to the public accessible and impartial
statistical data, research and policy analysis on economics,
political science, philanthropy, public administration, domestic
and international affairs and other socio-economic issues of
importance to Canada and its world.
Note:
Because its small population precludes drawing discrete samples
over multiple waves, data on Prince Edward Island is not
released.
INDEX
Part One: Top issues
Part Two: Federal party leaders
Part Three: What kind of government do Canadians
want?
Part Four: Vote intent
Part One: Top issues
As summer days dwindle and the cooler winds of autumn descend upon
Canada (to the appreciation of many smoke- and fire-ravaged
communities), the Bank of Canada took a break from applying heat
to money markets. The BoC held its key policy rate at
five per cent,
as premiers in two of Canada’s largest provinces appealed
on behalf of their residents for
a halt to interest rate increases. Though inflation continues to
simmer, Ontario premier Doug Ford highlighted the
effect rising interest rates have had on mortgages and other
borrowing costs. B.C. premier David Eby worried another
rate hike could worsen inflation rather than help further.
Related: Canadians react
to a historically brutal fire season
The cost of living and inflation continue to be the given the highest
priority by Canadians, unifying people across the political
spectrum. Health care and housing affordability are also key
priorities. Past Conservative voters emphasize economic issues,
with others point to climate change as the issue they care most
about:
Part Two: Federal party leaders
Trudeau approval drops to three-year low
As many Canadians suffer as a result of the cost-of-living crisis, so
too do Justin Trudeau’s political fortunes. His personal
approval has fallen to a three-year low of 33 per cent.
The prime minister and his government were heavily criticized after
making assurances that housing affordability was a top priority
but offering no new plans to address the issue following a three-day
ministers retreat in
August. Trudeau’s disapproval rises above three-in-five (63%)
this quarter, a nine-point jump since the end of 2022:
Trudeau has seen his approval fall among women over the age of 54, who
typically represent a source of stalwart support for the prime
minister. Since he was re-elected with a minority government in
2021, Trudeau’s approval among all demographics has dropped,
with a notable exception among men aged 18- to 34-years-old.
Given the prime minister’s recent lack of personal popularity
among this latter group, it is too early to tell whether this
represents an anomaly in the trend line, or the beginning of a
recovery among this segment:
Poilievre sees modest gain in personal appeal
Meanwhile, there has been a slow but positive trend this year for the
leader of the Conservative party, Pierre Poilievre. He has
gained favourability to the point where now two-in-five say they
view Poilievre positively. Negative views of the leader of the
opposition have remained consistent in the year since he won the
Conservative leadership election, with approximately half of
Canadians voicing this sentiment:
Singh, Blanchet both more favourably viewed
The leaders of the third- and fourth-most popular parties from the 2021
election are viewed more favourably than the prime minister and
the leader of the opposition. More than two-in-five have a
positive view of NDP leader Jagmeet Singh. In Quebec, half say
they view Bloc Québécois leader Yves-François Blanchet
favourably (see
detailed tables).
Who would make the best prime minister?
As Trudeau begins his third year as the leader of a minority government,
few believe he is the best prime minister available. By a near
two-to-one margin, Canadians choose Poilievre (32%) as the best
option for prime minister over Trudeau (17%). Nearly as many
believe Singh (16%) would be best to lead the country as the
current PM. Notably, “none of the above” (26%) is the
second-most popular option.
No demographic chooses Trudeau as the best prime minister at a plurality
level, though among women older than 54, he (28%) and “no one”
(28%) tie as the top pick. Two-in-five men aged 35 and older
believe Poilievre is the best possible person of the three main
party leaders to hold the country’s top job:
Past supporters of Trudeau’s party seem lukewarm on the man they helped
elect to a third term in office. More than two-in-five (45%) say
Trudeau is the best choice for PM, but that leaves more than
half who are either unsure (10%) or say Singh (12%), Poilievre
(7%) or none of the above (26%) are better options. Past NDP
voters are more likely to believe their current party leader is
the best pick for prime minister (50%), but not by much.
Meanwhile, three-quarters (77%) of those who voted Conservative
in 2021 say Poilievre represents the best choice to lead the
country:
On economic issues, Poilievre preferred
The Bank of Canada took a break this month from its recent cycle of rate
hikes, despite inflation still hovering above its intended
target of two per cent. Recent
economic data showed
that Canada’s economy may be responding to previous rate
increases. Unemployment is up, and Canada’s economy contracted
in the second quarter, the first time it had done so since the
onset of the pandemic. The short-term concern may be Canada is heading
for a recession.
There is also trouble in Canada’s broader economic story. While Canada’s
economy has grown in recent years, much of it has been fueled by
rapid population growth. This has meant that Canadians’ standard
of living, measured by GDP per capita, has declined at the same
time, leaving
Canada lagging behind other advanced economies.
Against this backdrop, and after eight years of Liberal government, just
one-in-five (21%) believe Trudeau and the Liberals are the best
equipped of the major political parties to handle the economy.
Twice as many (41%) instead say it is Poilievre and the
Conservatives.
Majorities of men older than 34, and pluralities of all other
demographics except women aged 18 to 34, would hand the reins of
the economy to Poilievre, given the choice:
Those who are most pessimistic about their own financial situation are
even more likely to say that Poilievre and the CPC are their
preferred leadership on economic issues. More than half (56%) of
Canadians who say they are worse off now than they were at this
point last year, and expect to see things worsen for them in the
coming year, choose Poilievre and the CPC. Just nine per cent
among this group trust Trudeau and the Liberal Party to lead
them out of their challenges:
Liberals, New Democrats voice less confidence in
their leadership on economy
The Liberal and NDP have maintained a minority government through a
supply-and-confidence agreement signed six months after the 2021
election in advance of the new government’s first budget. As
past supporters of those two parties evaluate the results of
this cooperation, they offer perhaps mixed reviews. More than
half of those who voted Liberal (54%) say Trudeau and the
Liberals are the best choice to handle Canada’s economy, leaving
a sizable group who select other options. Half (50%) of past NDP
voters believe Singh and the NDP are the best choice.
Past CPC voters are far more certain. More than four-in-five (85%)
believe Poilievre and the Conservatives are the best option for
economic stewardship:
Part Three: What kind of government do Canadians
want?
Canadians divided between current minority and CPC
majority as best result
Assuming the supply-and-confidence agreement persists, the Liberal
minority government is at its half-life. Looking forward, it
seems however most Canadians would prefer an alternate
arrangement. Given the choice, two-in-five (38%) say a
Conservative majority would provide Canada with its best
government over the next four years, more than who say the same
of the current situation in parliament (35%). Another 15 per
cent would like to see a Conservative minority government, while
13 per cent would prefer a return to a Liberal majority.
Those in Saskatchewan (61%) and Alberta (60%) are more likely than those
in other provinces to believe a CPC majority would be the best
government to lead the country. A plurality in B.C. (38%),
Quebec (40%) and Nova Scotia (39%) support a continuation of the
current NDP-Liberal agreement:
There appears to be reluctance from past Liberal voters to hand over
full control of Canada’s government to their party for a term.
Three-in-ten (30%) who voted Liberal in 2021 believe a Liberal
majority would be the best government for Canada over the next
four years. More (52%) among that group say the current
arrangement, where the Liberals are supported by the NDP, is the
better choice.
Comparatively, there is much less hesitancy from those who voted
Conservative in 2021. Four-in-five (82%) among past CPC
supporters say a Conservative majority would provide the best
government to Canada:
CPC majority most feared result, followed by Liberal
majority
While Conservative supporters heavily prefer their own party winning a
majority government in the next federal election, this
proposition causes heavy consternation for others. Indeed, the
most feared result for a future election is exacly that – a CPC
majority. More than two-in-five (44%) say this, including the
largest proportion of respondents in B.C., Manitoba, Quebec, and
Atlantic Canada. For others (38%) a Liberal majority is most
troublesome. This group is largest in both Alberta and
Saskatchewan:
As one might expect, past Conservatives tend to say a Liberal majority
would be cause for alarm, and past Liberals and New Democrats
say the same of that result for the CPC:
Part Four: Vote intent
These factors result in the continuation of a positive trend for the
opposition Conservatives, with the official opposition party
gaining two more points this quarter, at the cost of Liberal
support. The CPC now hold a 12-point advantage in vote
intention. This is by far the largest lead the party has held
since the previous election in 2021. It is also the highest the
Conservatives have risen in vote intent since March
2018,
in the wake of a trip by Trudeau to India, described as a
political “disaster”.
Trudeau returns to the country for the
first time since 2018 in
the coming week.
Regional results
The CPC advantage has been built in Alberta, Saskatchewan, and Manitoba
in recent years. Now, it extends to Ontario and British
Columbia. A 12-point edge in both of those provinces helps to
produce the 12-point national lead. Compared to last year at
this time, the Liberals are down six points in Ontario and four
in B.C.:
Urban centres
Canada’s urban centres have represented the Liberal Party’s path to
victory in recent elections, with few exceptions. The governing
party is now splitting votes close to evenly in both Metro
Vancouver and the Toronto core, a trend that spells trouble for
its electoral fortunes if it persists. The biggest difference by
far for the Liberals and Conservatives, however, is a swapping
of positions in the Toronto suburbs:
Age and gender
The CPC continues to hold a distinct advantage among male voters.
Perhaps the most difficult group to pin down currently, however,
are young men, who embraced Poilievre early, but appear to have
cooled off compared to last September. The challenge for the
Liberal Party now appears to be a loss of support among women of
all ages. Trudeau’s party is chosen third among young women,
well behind both the NDP and CPC. The Liberals maintain a lead
among older women, though that too has diminished – down nine
points compared to last September:
Vote retention favours CPC
If an election were held at the time of fielding, 86 per cent of past
Conservatives say they would cast the same vote now as they did
in 2021, while few would depart. The same can not be said of
2021 Liberal voters. Two-thirds (65%) among this group say that
they would support their Liberal candidate again, but 16 per
cent say they would switch to the NDP, and approximately
one-in-ten (9%) would vote for the opposition Conservatives.
Similar movement is noted among past NDP voters:
This retention rate of approximately two-thirds represents a persistent
challenge for the Liberals, who have seen a steady erosion of
support since the last federal election. Both the Conservatives
and NDP have chipped away at the government’s past voters:
7 September 2023
Source:
https://angusreid.org/trudeau-poilievre-best-prime-minister-liberals-conservatives-approval/
810-814-43-40/Polls
Two-In-Five Canadians Say They Face Discrimination Based On
Their Ethnicity Or Race
Is Canada a racist country? A country accepting of many cultures and
languages? A country that embraces difference?
As with so many issues confronting the Canadian population in 2023,
answers to these questions depend on who is asked.
The latest data from the non-profit Angus Reid Institute – the third in
a series of reports on Canada
and the Culture Wars –
find that while the vast majority are of the view the country
has made at least some progress reducing racism over the last
few generations (73%) – only a minority (28%) describe that
progress as “significant”.
Take the Canadian Culture
Mindsets Quiz here
These proportions rise to 50 per cent among Indigenous respondents, and
78 per cent among visible minorities, with Caucasians less
likely to say they’ve had this experience. There is, however,
one exception.
Those found in the Defiant Objector group on ARI’s Canadian Cultural
Mindset spectrum, a group that is 78 per cent Caucasian (the
highest level among all five groups), are much more likely than
all other groups to say they face discrimination because of
their race or ethnicity. Half (50%) say this, while no other
group exceeds 36 per cent. This comes as residents in the Lower
Mainland have voiced outrage over posters advertising “whites-only” groups
for children. Organizers stated that the group is for children
who are “tired of being a minority” in the places they live.
Similar sentiments are evident within the Defiant Objector
population. This group is also twice as likely as the rest of
the population to say that being Black, female, or Indigenous
are sources of privilege, while they’re one-quarter as likely to
say the same of being white.
Overall, half of Canadians (51%) say that being white is a source of
privilege in Canada. Perhaps, for this reason, many are
supportive of Employment Equity programs designed to increase
representation among those they’re less likely to see as having
an inherent advantage. This includes majority support for
assisting visible minorities (55%), Indigenous people (56%),
women (59%), and those who have a disability (61%). Three-in-10
(30%) say nobody should receive this type of assistance.
More Key Findings:
About
ARI
The Angus Reid
Institute (ARI) was founded in October 2014 by
pollster and sociologist, Dr. Angus Reid. ARI is a national,
not-for-profit, non-partisan public opinion research foundation
established to advance education by commissioning, conducting
and disseminating to the public accessible and impartial
statistical data, research and policy analysis on economics,
political science, philanthropy, public administration, domestic
and international affairs and other socio-economic issues of
importance to Canada and its world.
INDEX
Part One: Experiences and perceptions of racism
Part Two: Privilege and priority
Part Three: Modern identities and appropriation
Part One: Experiences and perceptions of racism
Who faces discrimination
In a multicultural country like Canada, concerns over racial
discrimination remain ever-present in the national discourse. In
recent years the Angus Reid Institute has studied this in the
form of Islamophobia, anti-Asian
racism, and
challenges faced by Indigenous Peoples living
in Canada.
Related: ARI work on
discrimination in Canada
Broadly, two-in-five Canadians say they face discrimination in their
day-to-day lives at least sometimes based on their race or
ethnicity, with one-in-ten (10%) saying this happens to them
often:
Regular experiences of discrimination are much more common among those
who identify as a visible minority in Canada (73%, see
detailed tables)
and those who self-identify as Indigenous (50%). Nearly
one-in-three Black respondents say they often face
discrimination:
*Smaller sample size, interpret with caution
Note on methodology:
*Please note, while the views of self-described Indigenous people are
reported here to provide valuable context, it should be noted
that this sample is not necessarily representative of the
Indigenous population of Canada as a whole. The Royal
Commission on Aboriginal Peoples has identified systemic
discrimination as
a significant problem in Canada.
There is an exception with the non-visible minority group. Scanning the
Canadian Cultural Mindsets, it is evident that the Defiant
Objectors – a group that is 78 per cent white – are much more
likely to say that they face discrimination based on their race
or ethnicity compared to other groups (see
detailed tables).
This is likely due to their increased likelihood of being men
between the ages of 35 and 54, as well as either past
Conservative or PPC voters. Each of these are correlated with
increased levels of feeling persecuted, as seen in the graphs
below:
Have we made progress?
There was an uproar this week when a poster advertising a “Whites-only
Moms and Tots”
group in Port Coquitlam, B.C. went viral on social media. The
city denounced the posters as “vile garbage” and bylaw officers
were instructed to search for them and remove them. While
anti-racist advocates were encouraged
by the backlash to
the posters, they provide evidence there are still incidents of
racism and discrimination in Canada.
Canadians are largely optimistic about the progress that the country has
made at reducing racism in recent generations. Three-in-ten
(28%) overall, including close to one-quarter of Indigenous
(22%) and visible minority (23%) respondents, say that Canada
has made significant progress, while the largest group across
all demographics say that this progress is being made, but is
slighter:
This sense of progress is not equally distributed. Men are much more
likely than women in all age groups to say that significant
progress has been made, while women are more reserved in their
assessment:
All groups on the Canadian Cultural Mindsets spectrum tend to agree that
progress has been made, but Zealous Activists and Quiet
Accommodators are more muted in this feeling. Defiant Objectors
hold a unique space as the most likely to say that things are
both much better and much worse:
Part Two: Privilege and priority
In recent years there
has been a brighter spotlight put on Canada’s
institutions and societal structures as
awareness in the country has grown of systemic racism and
privilege.
Is being a white an advantage?
In 1988, American women’s studies scholar Peggy McIntosh wrote a paper
titled “White
Privilege and Male Privilege: A Personal Account of Coming to
See Correspondences Through Work in Women’s Studies,”
a launch point in the modern conversation of privilege. Her
paper detailed 46 examples of where she gained an advantage in
society by being white, including “I am never asked to speak for
all people of my racial group” and “I can go shopping alone most
of the time, fairly well assured that I will not be followed or
harassed by store detectives.”
More than three decades later, the concept is
still much debated.
Half (51%) of Canadians feel being white is a source of
privilege, but there are more that believe it is an advantage to
be attractive (58%). Two-in-five say being a man (45%) and being
born in Canada (42%) gives you a leg-up in this country:
Three-in-five (59%) who identify as a visible minority feel being white
is a source of privilege in Canada, a higher proportion than
those who don’t identity this way (49%).
As western societies have explored and analyzed their institutions,
processes and policies for systemic racism, a counter movement
has developed which argues that movements such as affirmative
action in the United States or employment
equity in Canada are
reverse racism against white people. This concept is perhaps
evident in the views of the Defiant Objectors, who are more
likely to say being Indigenous (31%) or Black (22%) is a
privilege than being white (12%). They are also twice as likely
to say women are privileged in society (23%) as to say men
(11%):
Employment equity
Canada’s Employee Equity Act, first passed in 1986, requires federally
regulated employers – such as banks, airlines, railroads, and
crown corporations – to actively attempt to increase
representation among Indigenous People, women, people with
disabilities and visible minorities.
Majorities say the groups designated in the act deserve special
consideration when it comes to employment:
Support for Employment Equity is higher among women compared to men by a
significant margin. This is most true when comparing women’s
views with those of men between the ages of 35 and 54:
Part Three: Modern identities and appropriation
The Employment Equity Act also provides the definition of a visible
minority in Canada. The act defines
visible minorities as
those who are non-Indigenous, “non-Caucasian in race or
non-white in colour”. The term itself is in the process of
being re-evaluated,
as previously “visible minorities” become majority populations
in some Canadian jurisdictions. Some feel it is too generalizing
as it homogenizes disparate racial experiences into one
sub-category.
What would visible minorities prefer to be called?
Though two-in-five (38%) who identify as a visible minority say that is
their preferred term, more would choose something else.
One-in-six (16%) say they prefer to be identified with a hyphen,
i.e. Chinese-Canadian. Emerging terms such as “racialized
person” and BIPOC (i.e. Black, Indigenous, and People of Colour)
are selected by one-in-20 each. More than one-third (35%) eschew
these common terms.
The Angus Reid Institute mirrors Statistics Canada’s use of the term
visible minority, as census data is used to weight samples to
reflect the Canadian population.
Views on cultural appropriation
A CBC documentary titled
“The Pretendians” found
that while Indigenous art has become a valuable market in
Canada, many of pieces sold as Indigenous art are made by
non-Indigenous artists. One study found 75 per cent of the art
in tourist shops in Vancouver’s Gastown neighbourhood appeared
to be inauthentic.
This is just one example of “cultural appropriation”, broadly
defined as
when a cultural group, usually white or Western, takes
practices, dress, art or food from another cultural group,
usually non-Western or non-white, typically in an exploitive
fashion. Cultural appropriation has been discussed in academia
as far back as the the
1980s but
has become a more colloquial term in recent years as Western
countries reckon
with structural racism, historic discrimination and past
colonialism.
There are many areas where some argue that
cultural appropriation does not exist,
saying that throughout human history, cultures have borrowed and
exchanged concepts and practices. However, others point out that
the groups typically having their culture mimicked or borrowed
were historically discriminated against for those same cultural
practices and markers, which makes uses by members outside of
those historical cultures feel like “a
slap in the face.”
Respondents were offered a series of examples which could be viewed as
cultural appropriation and then asked if they found them
acceptable or not. Majorities of Canadians believe it is
acceptable to sell the cuisine of another culture that isn’t
your own (85%), be tattooed in foreign languages as a non-native
speaker (82%), wear a sari as a non-Indian to an Indian wedding
(74%), and for white people to wear their hair in cornrows
(72%).
There is more disagreement over concepts such as non-Indigenous people
profiting from Indigenous art (54% say acceptable) and wearing a
cultural outfit on Halloween (50%), but still at least half of
Canadians find these to be acceptable.
Blackface and brownface is widely viewed (75%) as unacceptable by
Canadians. This comes after a
cultural reckoning in
the wake of Black Lives Matter protests in 2020, when streaming
services removed scenes or whole episodes of sitcoms such as
Golden Girls, The Office, 30 Rock, and Scrubs due to characters
appearing in blackface.
Prime Minister Justin Trudeau apologized
in 2019 after
videos and photos emerged of him wearing blackface and brownface
prior to his career in politics, who said he
“didn’t think it was racist at the time, but now I see it was a
racist thing to do.”
Those who identify as Indigenous or visible minority offer different
views on the examples. Indigenous people are more likely (45%)
than those who don’t identify that way to believe it is
unacceptable for non-Indigenous artists to profit from
Indigenous-inspired artwork though half (49%) disagree.
More who identify as visible minorities (20%) say it is unacceptable for
white people to wear their hair in cornrows than those who don’t
describe themselves that way (16%).
However, it is Canadians who don’t identify as visible minorities who
are most likely to view blackface and brownface unacceptable
(77%):
For nearly all the examples, Zealous Activists are the most likely
Canadian Culture Mindset to believe they are unacceptable. They
are the only group who believe a non-Indigenous artist profiting
from Indigenous-inspired art is unacceptable at a majority
level. Zealous Activists are also the only group who find
themselves divided over whether a white person wearing cornrows
is acceptable. And though majorities disagree, they are more
than four times as likely to feel it is inappropriate for
non-Mexican people to open Mexican restaurants (20%) and
non-Japanese people to have Japanese characters tattooed on
their body (21%) as Defiant Objectors (3% and 5% respectively):
27 September 2023
Source:
https://angusreid.org/canada-culture-race-issues-appropriation/
810-814-43-41/Polls
Mental
Health And MAID: Canadians Who Struggle To Get Help More Likely
To Support Expanding Eligibility
As the debate over expanding eligibility to medical assistance in dying
to include individuals whose sole condition is mental illness
continues, there is much concern among Canadians over the state
of mental health care in the country ahead of this weighty
decision.
New
data from the non-profit Angus Reid Institute, in partnership Cardus,
finds a vast majority of Canadians concerned with the mental
health care resources available in the country (80%) and the
state of Canadians’ mental health overall (81%).
This
concern is more elevated among those who sought care from the
country’s mental health-care system in the past year. Overall,
one-in-five (19%) Canadians say they’ve looked for treatment for
a mental health issue from a professional in the last 12 months.
In that group, two-in-five
say they’ve faced barriers to receive the treatment they wanted.
These obstacles appear to be more of an issue for women (45% of
those who sought treatment say it was difficult to receive) and
young Canadian adults aged 18-34 (51%).
With this in the background, the federal government is continuing
deliberations on expanding eligibility for MAID to include those
whose sole condition is mental illness. Majorities of Canadians
support the previous rules governing MAID, first passed in 2016
(64%) and then updated in 2021 (60%), but there is more
hesitation when it comes to this next step. Three-in-ten (28%)
say they support allowing those whose sole condition is mental
illness to seek MAID, while half are opposed (50%).
However, for those who have sought treatment for their mental health and
found it difficult to access, there is elevated support.
Two-in-five (41%) who have encountered barriers to mental health
care believe those whose sole condition is mental illness should
be able to receive MAID. Comparatively, 26 per cent of those who
have not needed to use the mental health-care system in the past
year say the same.
More Key Findings:
About
ARI
The Angus Reid
Institute (ARI) was founded in October 2014 by
pollster and sociologist, Dr. Angus Reid. ARI is a national,
not-for-profit, non-partisan public opinion research foundation
established to advance education by commissioning, conducting
and disseminating to the public accessible and impartial
statistical data, research and policy analysis on economics,
political science, philanthropy, public administration, domestic
and international affairs and other socio-economic issues of
importance to Canada and its world.
About
Cardus
Founded in 1974, Cardus is a non-partisan think tank dedicated to clarifying
and strengthening, through research and dialogue, the ways in
which society’s institutions can work together for the common
good.
INDEX
Part One: The state of mental health in Canada
Part Two: Mental health and MAID
Part One: The state of mental health in Canada
One-in-three have sought mental health support in
past year
The onset of COVID-19, and the restrictions the virus brought,
challenged Canadians on many fronts. In March 2022, half of
Canadians said their mental health worsened during two years of
the pandemic.
With the public health emergency over, and restrictions removed, most
Canadians have returned to pre-pandemic routines. There has been
a concurrent boost in Canadians’ mood. Canadians are more likely
to say they have felt great (23%) or good (51%) mentally in
recent weeks than
18 months ago.
Still, half (47%) say they feel fatigued, while approaching two-in-five
(38%) say they’ve been feeling anxious in recent weeks (see
detailed tables).
In this environment, one-in-three (33%) Canadians say they have sought
support for mental health in the past year. Another one-in-ten
(9%) say they felt like they needed assistance but didn’t seek
it. A further one-in-five (20%) have looked for help for their
mental health in the past. A minority – one-third (34%) – say
they have never sought support for their mental health.
Men, and older Canadians, are more likely to be in the latter category.
More than half (58%) of 18- to 34-year-old women say they have
either sought support (45%) or felt like they needed to (13%) in
the past 12 months, the most of any demographic.
As well, two-in-five (40%) say they know a close friend or family member
who was looking for help with their mental health in the past
year, providing further evidence of the significant number of
Canadians who feel they need mental health support (see
detailed tables).
While professional support (64%) was the most common mental health care
Canadians sought, many also turned to the internet for more
information (39%) or tried out one of the suite of wellness or
meditation apps available (19%).
For those who turn to the mental health-care system, counselling (62%),
therapy (44%) and prescriptions (44%) are the most common
requested services:
Mental health care access: Many have encountered
barriers to treatment
To better understand the ease of access for Canadians to mental health
care, the Angus Reid Institute developed the Mental Health Care
Access Index. This index separates Canadians who encountered
barriers to mental health care from those who say they found it
easy to access to the services they sought (click
here to see how the index was scored).
One-in-five (19%) Canadians sought support from mental health care
professionals in the past year. Of that group, eight per cent –
or more than three million adults – say they encountered
difficulty to receive the care they needed. The remaining 11 per
cent accessed the mental health care they needed with ease.
Four-in-five (81%) Canadians have not sought out mental health support
from professionals in the public or private system in the past
year:
When looking at just those who sought mental health care in the past
year, two-in-five (41%) found barriers to the help they wanted.
Canadians aged 18- to 34-years-old were more likely to encounter
barriers than older ones, and women more likely to have
difficulty accessing mental health care than men:
Those who report difficulties accessing mental health care are more
likely to be lower income than those who found few barriers to
the care they wanted.
Canadians are more likely to report difficulties accessing counselling
and therapy than prescription drugs.
Few people say they or someone they knew encountered barriers to receive
prescriptions for their mental health issue. That was not the
case for counselling or therapy, where two-in-five say it was
difficult for them, or someone they know, to access this
treatment:
Those with difficulties accessing system report
feeling anxious, depressed at higher rates
Canadians who report difficult access to mental health care are also
more likely than others to describe their mood negatively.
Seven-in-ten (70%) in the Difficult Access group say they’ve
been anxious in recent weeks, while two-in-five (38%) say
they’ve been depressed. Canadians who have had easy access to
mental health care, and those who needed no access at all, are
much less likely to use those terms to describe their recent
feelings:
Majority among those with difficult access say
treatment improved their condition
Regardless of whether their access was difficult or easy, majorities of
Canadians who received treatment for their mental health in the
past year say it made a difference. However, those who
encountered few or no barriers are twice as likely to say it
helped a lot (42%) than those who say it was difficult to get
the mental health care they needed (21%):
High levels of concern with Canadians’ access to
mental health care
Most Canadians – four-in-five – worry over the availability of resources
and access to mental health care in the country and the state of
Canadians’ mental health overall. That includes nearly all who
have struggled to access mental health care in the past 12
months:
Part Two: Mental health and MAID
Health care has been under the microscope in recent years as provincial
and federal governments have looked for solutions to fix a
health-care system described as in
crisis.
Related:
Mental health care in the country has also received intense scrutiny.
During the 2021 federal election, the Liberals promised to
launch a mental health transfer that would provide provinces and
territories with $4.5 billion over five years to “expand
the delivery of high-quality, accessible and free mental health
services.”
However, advocates
worry that
the focus on mental health has been lost, as the Liberals appear
to have rolled the promised boost into the general health
care funding agreement it struck with the provinces and
territories earlier this year.
Against this backdrop, there has been an intensifying conversation
regarding making Canadians whose only medical condition is a
mental illness eligible for medical assistance in dying (MAID).
MAID was first legalized in Canada in 2016. The initial
legislation allowed for MAID for those with a serious, incurable
medical condition whose deaths were reasonably foreseeable. The
latter requirement was removed in a 2021 update to the
legislation.
In the pathway laid out in the 2021 legislation, eligibility was set to
expand in 2023 to allow mental illness as the sole medical
condition for the MAID application. This has been delayed to
2024 as the government looks
to set out guidelines and best practices.
Mental health care access and MAID expansion
There is broad support for the 2016 law and the 2021 update among
Canadians, but more opposition to the proposed expansion of
eligibility to include mental illness as a sole condition. Note,
the survey questionnaire asked Canadians about the eligibility
for MAID as laid out in the 2016. Then it asked about the 2021
update as laid out in the legislation. Finally, it asked about
the potential further expansion of eligibility to include mental
illness as a sole condition. To
read the questionnaire, click here.
Those who have needed professional assistance from the mental
health-care system in the past year are much more likely than
those who have not to support expanding eligibility to allow
mental illness as a sole condition for a MAID application.
Two-in-five (41%) who have encountered barriers to accessing
mental health support they feel they needed say they support
this proposed expansion of MAID eligibility:
This increased support for MAID among those who have encountered
barriers to mental health care is also evident when respondents
are presented with specific scenarios which may engender a
request for MAID. While opposition outweighs support, Canadians
who have had difficulties accessing the mental health-care
system are more likely than others to support someone suffering
from PTSD, depression or anxiety seeking MAID (see
detailed tables for all scenarios presented).
Overall support for original law, trepidation over
mental health elements
Across the country, there is broad support for MAID as it was laid out
in 2016 and with the 2021 expansion to include those whose
deaths are not reasonably foreseeable. Only in Alberta (45%)
does support for either MAID framework fall below half:
There is much more opposition to the proposed expansion to include
mental illness as an eligible sole condition for MAID. At most,
one-third in B.C. (33%), Manitoba (35%) and Quebec (31%) say
they support this change to MAID eligibility. But, in those
three provinces and elsewhere, there are more opposed than in
favour:
Majorities of men of all ages oppose expanding eligibility to include
mental illness as an eligible sole condition for MAID. Women are
more conflicted on the matter, but pluralities are in
opposition:
Two-thirds (67%) of past Conservative voters oppose expanding MAID
eligibility to individuals whose sole condition is mental
illness. Conservative leader Pierre Poilievre said a government
under his party would
repeal MAID for those with a mental illness in
the event a private member’s bill introduced earlier this year
from Conservative MP Ed Fast fails to accomplish that goal. Past
NDP voters are the most divided between support (37%) and
opposition (40%) for this proposed MAID eligibility, while those
who voted Liberal in 2021 are more opposed (42%) than in support
(31%):
Four-in-five (82%) Canadians feel mental health care should be improved
first before MAID eligibility is expanded to include those whose
sole condition is a mental illness. That includes seven-in-ten
(69%) of those who support this expansion of MAID eligibility:
Opponents to eligibility expansion worry over
deprioritization of treatment
Half of Canadians (52%) worry that treating mental health will not be a
priority MAID eligibility is expanded to include individuals
whose sole condition is mental illness. This is a greater
concern for those who oppose this proposed expansion of MAID
eligibility:
28 September 2023
Source:
https://angusreid.org/mental-health-care-access-maid-mental-illness/
AUSTRALIA
810-814-43-42/Polls
Inflation Expectations Dropped To 5.4% For The Month Of August –
And Have Now Fallen To 4.9% In Mid-September
The latest information on weekly Inflation Expectations is available to
view each week in the Roy Morgan Weekly Update
video on YouTube.
The softening in Inflation Expectations in recent weeks suggest the
RBA’s decision to leave interest rates unchanged during their
three meetings in July, August and September may be the correct
decision, however there are still significant pressures in the
economy. Just this week the average retail petrol price in
Australia increased to $2.04 per litre and has now been above $2
per litre for five weeks in a row for the first time in over a
year since July 2022.
The next monthly ABS CPI estimate is set to be released next week on
Wednesday September 27, 2023. The latest
ABS monthly CPI estimate for July 2023 was 4.9%,
down from 5.4% in the year to June 2023.
Monthly Inflation Expectations Index long-term trend
– Expected Annual Inflation in next 2 years
Inflation Expectations were down in every State
except Victoria in August
A look at Monthly Inflation Expectations on a State-based level shows a
mixed bag for August with Inflation Expectations down in five
States from a month ago, but unchanged in Victoria at 5.4% - in
line with the national average.
Inflation Expectations eased slightly in New South Wales, down 0.1%
points to 5.7%, and in Queensland, down 0.1% points to 5.6%, but
were still above the national average in both States.
The measure also declined in the smaller States of Tasmania, South
Australia and Western Australia. In South Australia Inflation
Expectations were down 0.3% points to 5.3% and they were down a
large 1.5% points to 5% in Tasmania – the largest change for any
State during the month of August.
Inflation Expectations in Western Australia remain the lowest of any
mainland State – where they have been for the last 11 months
since October 2022 – and were down 0.7% points to 4.6%.
Inflation Expectations in Country Areas dropped to 5.8% (down 0.2%
points from July) in August. The measure remains significantly
lower in the Capital Cities, down 0.2% points to 5.2%.
Roy Morgan CEO Michele Levine says Inflation
Expectations dropped 0.2% points to 5.4% in August, and the
weekly indicator has continued to drop in the first half of the
month to only 4.9% in mid-September – the lowest for over 18
months since February 2022:
“The ANZ-Roy Morgan Inflation Expectations in
Australia were down 0.2% points in August at 5.4%. This was the
largest monthly fall since April 2023 (down 0.3% points to 5.3%)
and this lowering trend has continued through the early weeks of
September.
“The good news for borrowers is that the RBA has
taken stock of the evolving economic situation in Australia and
has now left interest rates unchanged for three straight months
in July, August, and September at 4.1% and since then the weekly
Inflation Expectations figure has dropped for the last two weeks
to only 4.9% – the lowest since early last year.
“Although the drop in Inflation Expectations during
August and September is good news, there are signs that it may
prove to be short-lived. So far in September the Australian
Dollar has hovered consistently below 65 US cents – including
hitting a low of only 63.6 US cents.
“The immediate impact of the low Australian Dollar is
being felt at the pump with average retail petrol prices
averaging $2.04 per litre last week and above $2 per litre for
the last five weeks. This is the first time since July 2022
petrol prices have been at a sustained high level above $2 per
litre for more than a month.
“Petrol prices are one of the most visible signs of
inflation and if they continue to remain at an elevated level
above $2 per litre, or even rise further in the weeks and months
ahead, this will clearly increase the general inflationary
pressures in the economy.
“If these inflationary pressures in the economy
continue to grow there will be renewed pressure on the RBA to
increase interest rates again despite pausing and leaving
interest rates unchanged at their last three meetings in July,
August, and September.
“The next RBA meeting on interest rates will be new
Governor Michele Bullock’s first in the top job. Although all
the current signs are that the RBA is set to leave interest
rates unchanged, as ANZ economists Adam Boyton and Blair Chapman noted in a
research note today the
RBA opted for a ‘hawkish pause’ in September as they continued
to ‘monitor incoming data and how these alter the economic
outlook and assessment of risks.’”
19 September 2023
810-814-43-43/Polls
ANZ-Roy
Morgan Consumer Confidence Down 3.4pts To 76.4 – Lowest Since
Mid-August
Driving this week’s decrease was less confidence about personal finances
over the next 12 months which was responsible for about half the
weekly decline.
Current financial conditions
Future financial conditions
Current economic conditions
Future economic conditions
Time to buy a major household item
ANZ Economist, Madeline Dunk, commented:
ANZ-Roy Morgan Consumer Confidence was unable to build on its recent
upward momentum, with the series falling 3.4pts last week. Each
of the five subindices declined, and there was a particularly
steep drop in the ‘Future financial conditions’ subindex.
Confidence amongst those households paying off a mortgage
declined by 8.1pts, while it fell 2.9pts for renters and 0.3pts
for households who own their home outright.
Meanwhile, inflation expectations rose to 5.4%, reversing the falls seen
in the previous two weeks. Inflation expectations are likely to
be of interest to the RBA, especially given the recent strength
in petrol prices which have averaged over AUD2/litre for the
last six weeks.
26 September 2023
Source:
https://www.roymorgan.com/findings/9325-anz-roy-morgan-consumer-confidence-september-26
810-814-43-44/Polls
2.8
Million New Zealanders Now Read Newspapers And Almost 1.7
Million Read Magazines
New Zealand Herald read by over 1.7 million while
Southland Times is the big improver
New Zealand’s most widely read publication is again the New
Zealand Herald with a total cross-platform audience
of 1,747,000 in the 12 months to June 2023 – almost five times
as many as the second placed Dominion Post with a readership of 363,000.
There were two top ten titles to grow their total cross-platform
audiences led by the fifth placed Waikato
Times, up 16,000 (+8.6%) to 203,000 and the Taranaki
Daily News, up 6,000 (+5.1%) to 124,000.
Filling out the top five are the Otago
Daily Times in third place with an audience of
264,000 readers just ahead of The
Press in fourth place on 250,000.
Other newspapers to increase their total cross-platform audiences during
2022-23 included the Manawatu
Standard, up 22,000 (+23.4%) to 116,000, the Rotorua
Daily Post, up 8,000 (+8.2%) to 105,000, the Southland
Times, up 27,000 (+35.1%) to 104,000, the Sunday
News, up 17,000 (+22.7%) to 92,000, the Nelson
Mail, up 7,000 (+9.3%) to 82,000, the Gisborne
Herald, up 1,000 (+1.4%) to 71,000 and the Ashburton
Guardian, up 1,000 (+2.5%) to 41,000.
Top 10 Newspapers – Total 7 Day Cross-Platform
Audience (Print & Online)
*Cross-Platform Audience is the number of New
Zealanders who have read or accessed individual newspaper
content via print or online. Print is net readership in an
average 7 days. Online is net readership online in an average 7
days.
Full Newspaper Readership
Results available to view here.
New Zealand Listener, NZ Woman’s Day and Habitat all
increase their print readership in 2022-23
New Zealand’s most widely read magazine is the driving magazine AA Directions which
had an average issue readership of 338,000 during the year to
June 2023.
One of the four magazines to increase their readership in the last year
was the clearly second-placed New
Zealand Listener with an average issue readership of
208,000, up 10,000 on a year ago.
The other three widely read magazines to increase their readership were NZ
Woman’s Day which increased its readership by 25,000
to 145,000, Habitat,
which was up 7,000 to 108,000 and Air New Zealand’s inflight
magazine KiaOra which more than doubled its readership, up by a large
63,000 to 107,000 as New Zealand’s borders re-opened and flights
began to return to pre-COVID conditions.
Other widely read magazines included TV Guide with a readership of 152,000, Australian
Women’s Weekly (NZ Edition) on 127,000, NZ
Gardener on 86,000, Dish on
83,000, Cuisine on
82,000 and NZ House & Garden also
on 82,000.
Other magazines to grow their readership during the year to June 2023
included Fish & Game NZ,
which more than doubling its readership and was up 36,000 to
71,000, NZ Life & Leisure,
up 11,000 to 64,000, Consumer,
up 7,000 to 59,000, Home NZ,
up 17,000 to 58,000, Property
Press, up 8,000 to 53,000, Good,
up 10,000 to 47,000, National
Geographic, up 10,000 to 47,000, Reader’s Digest, up 16,000 to 44,000, Your
Home & Garden, up 8,000 to 43,000, NZ
Fashion Quarterly, up 1,000 to 43,000, Metro,
up 5,000 to 36,000 and Rugby
News, up 11,000 to 31,000.
New Zealand’s Top 10 Magazines by Average Issue Print
Readership
*Roy Morgan has measured additional readership for
this magazine via Cross-Platform Audiences – see next section.
Full Readership Results
for over 50 New Zealand Magazines available to view here.
AA Directions is on top but Fish & Game NZ and New
Zealand Listener lead audience growth
AA Directions is
still easily New Zealand’s most widely read magazine with a
market-leading total cross-platform audience of 418,000– well
over 150,000 ahead of any other magazine.
The second most widely read New
Zealand Listener increased its total cross-platform
audience by 9,000 to 245,000 while the third most widely read NZ
Woman’s Day, up 11,000 to 196,000.
However, the largest increase over the last year was for Fish
& Game NZ which more than doubled its print
readership, and this powered an increase in its cross-platform
audience of 24,000 to 136,000.
Other leading magazines with strong cross-platform audiences of over
130,000 include Australian
Women’s Weekly (NZ Edition) on 170,000, TV
Guide on 169,000, Dish on
158,000, Habitat on
147,000, NZ Woman’s Weekly on
140,000 and NZ House & Garden on
136,000.
Top 10 Magazines – Total Cross-Platform Audience
(Print & Online)
*Cross-platform audience is the number of New
Zealanders who have read or accessed individual magazine content
via print or online. Print is average issue readership. Digital
is average website visitation and app usage (if available) in
last 7 days for weekly titles (New Idea, New Zealand Listener,
NZ Woman's Day, NZ Woman's Weekly, Property Press, That's Life,
Time, TV Guide) and last 4 weeks for all other non-weekly
titles.
Full Newspaper Readership
Results available to view here.
Canvas is easily the most widely read Newspaper
Inserted Magazine in 2023
The New Zealand Herald’s Canvas(North
Island) was clearly the most widely read Newspaper
Inserted Magazine over the past year with a readership of
172,000 – over 25 per cent higher than any other magazine.
In a clear second place is the widely read Sunday
Magazine with a readership of 137,000.
There was not much to separate the next three magazines – only 11,000
between the third most widely read Viva (North
Island) with a readership of 116,000, Weekend (North
Island) with a readership of 110,000 and Your
Weekend with a readership of 105,000.
New Zealand’s Leading Newspaper Inserted Magazines by
Print Readership
Full Readership Results
for over 50 New Zealand Magazines available to view here.
Michele Levine, Chief Executive Officer, Roy Morgan,
says:
“The latest Roy Morgan readership figures for New
Zealand show nearly two-thirds of New Zealanders, 2.76 million
(65.8% of the population aged 14+), now read or access
newspapers in an average 7-day period via print or online
(website or app).
“The leading newspaper is again the New
Zealand Herald with a total cross-platform audience
of well over 1.7 million and is read by almost five times as
many people as the second placed Dominion Post – read by over 363,000.
“The last year has been a challenging one for New
Zealand as the country gradually emerged from pandemic-era
restrictions but soon faced a new challenge of high inflation.
The Reserve Bank of New Zealand (RBNZ) responded to the
challenge of inflation by raising interest rates rapidly between
October 2021 and May 2023 by a total of 5.25% from 0.25% to
5.5%.
“The twin pressures of inflation and rising interest
rates have had an impact as New Zealand’s economy contracted in
both the December
qtr. 2022 (-0.6%) and
the March
qtr. 2023 (-0.1%) –
this is the third straight year New Zealand has experienced at
least one quarter of negative growth.
“However, despite the economic pressures of the last
year there have been bright spots for several newspapers with
nine increasing their cross-platform audiences over the last
year including the Waikato
Times (+8.6%), the Taranaki
Daily News (+5.1%), Manawatu
Standard (+23.4%), Rotorua
Daily Post (+8.2%), Southland
Times (+35.1%), Sunday
Times (+22.7%), Nelson
Mail (+9.3%), Gisborne
Herald (+1.4%) and the Ashburton
Guardian (+2.5%).
“Despite the challenges of the four years the
audiences for New Zealand’s magazines are consistent and in the
year to June 2023 almost 1.7 million New Zealanders (40.2% of
the population aged 14+) read magazines whether in print or
online either via the web or an app.
“The five most widely read magazines dominate both
the print readership and cross-platform audience figures filling
the top five spots in both rankings. AA
Directions with a print readership of 338,000 and a
total cross-platform audience of 418,000 is the most widely read
magazine in New Zealand once again.
“In second spot on both rankings is New
Zealand Listener with a print readership of 208,000
and a cross-platform audience of 245,000. However, the biggest
increase among the top five magazines over the last year was
for NZ Woman’s Day which
increased its print readership by an impressive 25,000 to
145,000 and increased its cross-platform audience by 11,000 to
196,000.
“The other magazines to maintain their leading
positions in the overall market include the TV Guide with a print readership of 152,000 and a total
cross-platform audience of 169,000 and Australian
Women’s Weekly with a print readership of 127,000 and
a cross-platform audience of 170,000.
“There were two standout magazines worth highlighting
that more than doubled their print readership over the last
year. Air New Zealand’s inflight magazine Kia
Ora increased its readership from 44,000 to 107,000 –
an increase of 63,000 (up 143%) as New Zealanders returned to
travel with COVID-19 restrictions easing.
“Fish & Game NZ has
also experienced a rapid increase in print readership, up from
35,000 to 71,000 – an increase of 36,000 (+103%) in a year. The
increase in print readership powered an increase in the total
cross-platform audience for Fish
& Game NZ to 136,000 and into the top ten of New
Zealand’s most widely read magazines for the first time in ninth
position.
“Despite the pressures faced by many so far during
2023 there are significant bright spots with many newspapers and
magazines holding their own and increasing their audiences over
the last year. These magazines and newspapers continue to
provide interesting and relevant content that engages with their
audiences and provides a direct line to hard-to-find consumers.”
19 September 2023
Source:
https://www.roymorgan.com/findings/new-zealanders-newspapers-and-magazines-readership-june-2023
MULTICOUNTRY STUDIES
810-814-43-45/Polls
People Across 24 Countries Continue To View UN Favorably
The
United Nations General Assembly will
open its 78th session on
Sept. 5 against a favorable backdrop. A median of 63% across 24
countries surveyed see the UN in a positive light, according to
a spring Pew Research Center survey. Another 28% see it
negatively. In most countries surveyed, a majority of the public
has a positive opinion of the UN.
In a
few countries, however, negative opinions of the UN are more
common than positive ones. In Israel, for example, 62% have a
negative view of the organization, the highest share across all
countries surveyed. The Israeli public has historically
expressed unfavorable views toward the UN: At least 58% have
viewed the organization negatively since this question was first
asked in 2007.
Similarly, 50% of people in Japan have an unfavorable view of
the UN. Japanese views of the UN have stayed
generally negative since
the summer of 2020, when 55% had an unfavorable view of the
organization.
In a
handful of countries – Argentina, Brazil, Indonesia and South
Africa – about a fifth or more of the public did not provide an
opinion.
Favorable
opinions of the UN over time
The
UN’s favorability has generally remained stable across most
countries surveyed in recent years, with a few exceptions.
In
Hungary, where government leaders have expressed
frustration with international criticism of domestic affairs, positive opinion has dropped 11 percentage points in the last year,
to 50%. And in the U.S., favorable views have ticked down
slightly to 58%. Conservative Americans, as well as adults ages
50 and older, are less likely to see the UN favorably than they
were in 2022.
While
data is available for most countries from 2022, the Center was
unable to survey several middle-income
countries from
2020 to 2022 due to the
COVID-19 pandemic.
However, looking at changes from 2019 to 2023, opinions of the
UN have improved significantly in some of these countries. In
Nigeria, India and Kenya, for example, the shares who have
favorable views of the multilateral organization have increased
by double-digit points since 2019.
The
17-point increase in India may be due, in part, to the rise in
the share who express any opinion. Just 12% did not respond to
the question in 2023, compared with 44% in 2019.
What do people
like about the UN?
In past
surveys, publics have tended to credit the UN for promoting
human rights, peace and economic development,
while fewer have said it cares about the needs of everyday
people or deals effectively with international problems.
In a
2020 Center survey, a median of 76% across 14 countries believed
the UN promoted human rights, while a median of 51% said it
dealt effectively with international problems.
Differing views
of the UN within countries
In some
countries, people who place themselves on the ideological left
are more favorable toward the UN than those on the right. This
pattern was also observed in 2022.
The
divide is particularly stark in Israel, where those on the left
are almost 50 points more likely to hold a positive opinion of
the UN than those on the right. And Israelis on the left have
grown even more favorable toward the organization over the past
year: In 2022, 48% of those on the left had a positive opinion
of the UN, compared with 64% who have the same view this year.
In the
U.S., liberals are also much more likely than conservatives to
see the UN positively (79% vs. 34%).
Only in
Greece is the pattern reversed: 57% of people on the ideological
right view the UN favorably, compared with 41% on the left.
In a
handful of countries, people with more education are more likely
than those with less education to see the UN favorably. In
Germany, for example, 78% of those with at least a postsecondary
education approve of the UN, compared with 64% of those with a
secondary education or less.
31
August 2023
Source:
https://www.pewresearch.org/
short-reads/2023/08/31/people-across-24-countries-continue-to-view-un-favorably/
810-814-43-46/Polls
Data Dive: How People Around The World Feel About Climate
Change, A Survey Across 36 Nations
It’s
happening again.
The
frequency and intensity of climate-change related disasters has
become so commonplace it looks like some are now seeing it as
the new normal.
But
what’s occurring is far from normal.
June 2023 was the hottest June ever
recorded since record-keeping began in 1850, according to the
National Oceanic and Atmospheric Administration.
And as
summer in the Northern Hemisphere wears on, the records just
keep melting away.
July 2023 was recently declared the
hottest month ever recorded, according to the Copernicus Climate
Change Service.
And
while data for August is still being calculated, it’s been yet
another month filled with both oppressive heat and deadly
wildfires.
Forget
global warming, it’s been so sweaty lately the head of the
United Nations warns we’re now in the era of “global boiling.”
Below,
we look at what recent Ipsos Global
Advisor polling
reveals about how worried people are about climate change and
what should be done about it.
Plastic
is everywhere and everything from the making to the disposing of
it emits greenhouse gases which ultimately contributes to
climate change, points
out the Center for International Environmental Law.
Our polling across 34
countries in August/September 2022 finds
strong support for a global treaty that would ban unnecessary
single-use plastics (75%, on average across 34 countries), as
well as for a ban on plastics that can’t be easily recycled
(77%).
“It’s
not unusual to see alignment on attitudes of people around the
world on certain sustainability issues, but the fact that so
many are aligned on the need for strong, co-ordinated
intervention on single-use plastics is a little surprising,”
says Stuart Clark, Director, Public Affairs, Ipsos in Australia.
“It stands out as an issue that many feel is both urgent and can
be tackled successfully if we work together.”
Our
polling conducted during the sweltering summer of 2022 found Gen
Zers and younger Millennials, in particular, are anxious about
the possibility of being displaced from their home as a result
of climate change at some point between 2022-2047.
Despite
the wild weather, worry about climate change and threats against
the environment didn’t budge year over year. The extraordinary
seems to have become ordinary.
Almost
one in five (18%, on average across 29 countries) considered
climate change a top concern for their country in August
2023 (versus
17% who said the same in August
2022). And 8% worried about threats against the environment in August 2023
(vs. 9% in August 2022).
Yet, as
our Earth
Day 2023 polling finds,
that doesn’t mean people are letting governments and companies
off the hook.
Almost
three in five (59%) say that if businesses don’t act now to
combat climate change then they are failing their employees and
customers.
And 62%
believe developed countries should pay more to solve the
problem, with Peruvians and Colombians most in favour of the
idea.
Yet,
after a series of serious weather events in 2022, 57%
on average globally predicted (likely
correctly) that 2023 will be the hottest year on record. And
after coming off a particularly brutally hot summer last year,
it makes sense that people Spain were the most likely to predict
this year will be the hottest yet.
31
August 2023
Source:
https://www.ipsos.com/en/data-dive-how-people-around-world-feel-about-climate-change
810-814-43-47/Polls
In
29 Countries People More Likely To Think Their Education System
Is Poor Than Good
People
across 29 countries are more likely to describe the education
system in their country as poor than good, the Ipsos Global
Education monitor has found.
However, attitudes vary considerably between countries on how
people think their education system is doing.
Singapore and Ireland have the highest proportion of people who
are happy with their schools. While Hungary is the least
satisfied, with two-thirds describing their education system as
poor.
Key findings:
Attitudes to
education
One in three
(33%) describe the education system in their country as good, with
36% describing it as poor.
However, looking at a global picture masks big
differences between countries and regions. Singapore
is the most positive country, with three in four (74%) saying
their education system is good, including 27% who say it is very
good. Ireland is second with 63% believing it is good and
Australia third (57%).
At the
other end of spectrum, Hungary is least satisfied with the level
of education their students are receiving. Less than one in ten
(8%) describe their education system as good and two-thirds
(67%) say the standard is poor. Hungary is also the country most
likely to say political/ideological bias is one of the biggest
challenges facing education.
People
in LATAM also have particularly low levels of positivity on the
education available in their countries. After Hungary, Peru
(10%), Chile (11%) and Argentina (15%) have the lowest number of
people in their country who describe the education as good.
While other LATAM countries in the survey – Brazil, Colombia,
Mexico – have higher levels of satisfaction, people in those
countries are more likely to describe their education systems as
poor than good.
For many, not
only is their country’s education system poor, the standard is
declining. Almost
one in two (46%) feel the education system in their country is
getting worse compared to when they were at school. Three in
four (76%) in Argentina say the country’s education is worse
now, the highest of all 29 countries.
This
sentiment is also particularly strong in Europe. In all but one
of the European countries surveyed people are more likely
to say their education system is worse than when they were at
school. In Hungary, France, Belgium, Netherlands, Sweden,
Germany and Italy more than one in two say this is the case.
Ireland is the only one of the European countries surveyed where
people believe education is getting better, with 56% saying it
is better now than when they were at school.
What do parents
think of the education system?
Parents of
children who are at school are consistently more positive about
the education system in
their country than those who do not have children in school.
While the global public may not think their education system is
performing well, parents are more positive. Four in ten (39%)
parents of school age children say education in their country is
good compared to a third of parents that describe it as a poor.
They
are also more likely to say
their education system was better when they were at school compared
to those without children in school. Almost one in two (49%) of
those who do not have children in school say the education
system is worse than when they were a student (24% better), only
41% of parents say the same and 37% say it is better.
While
on average people across 29 countries said outdated curriculum
was one of the biggest
challenges facing schools, parents said unequal
access to education was the top worry. Parents are also more
likely to cite inadequate infrastructure and insufficient use of
technology as challenges.
Parents also
feel that education can play a role in reducing inequalities. Fifty-eight
per cent of parents think this is the case, while non-parents of
school age children are divided on the issue.
Attitudes to
teachers
Across
29 countries, people are more
likely to say they would not advise someone to become a teacher than
say they would. Majorities in six countries – Hungary, Japan,
Poland, South Korea, France, Germany – say they would not
recommend their children or a young person to take a job
teaching.
Asia
Pacific is, in general terms, the region where people are most
likely to recommend teaching. India (79%), Malaysia (66%), and
Indonesia (58%) are the countries where this sentiment is
highest.
Across
the 29 countries surveyed, there is appreciation
for how difficult the job of teaching is with
two-thirds (67%) saying teachers work hard. This sentiment is
highest in Brazil, the Netherlands and Singapore, with four in
five saying this is the case.
In only
one country (South Korea) are people more likely to say teachers
don’t work hard than do.
While
recognising teachers are hardworking, at a global level people
are divided whether they get a paid enough. Forty-six
per cent say teachers are adequately paid while 46% disagree.
Belief teachers get paid enough is highest in India, Singapore,
and Malaysia. In Argentina and Hungary three in four say
teachers are not adequately paid.
Attitudes to AI
in the classroom
People in 29
countries think technology in the classroom, such as AI, will
have a more positive affect than negative one.
One in
three (35%) think it will be positive while 18% believe it will
have a negative impact. Support for AI in the classroom is
highest in Indonesia, with 54% saying it will be a positive
addition. LATAM is also supportive with many in Argentina (53%),
Peru (49%) and Chile (48%) believing it will have a positive
effect on learning.
In
Canada, US and France, people are more likely to think AI will
have a negative impact on schools. In these countries, people
are also more likely to think AI should be banned in schools.
However, on average, people
across 29 countries do not think AI should be banned from the
classroom. More than four in ten (42%) think it
should not be banned, while 29% do. Turkey (59%) and Malaysia
(54%) are the countries most against a ban.
While
people are more split on attitudes to AI and its role in the
lives of students, there is more agreement that teachers should
receive training on it.
Two-thirds across 29 countries think teachers
should get training on how to use AI in their
teaching methods, and seven in ten feel teachers
should be showing students to use AI and receive
training on how to spot whether students are using AI in school
papers.
Attitudes among
generations to education
Looking
at people across different age groups attitudes to education, older people are more likely to think the education system is worse than
when they were at school. The longer since people
were at school the most likely to say school is worse today than
when they studied. Fifty-seven per cent of Baby Boomers say that
this is case and only one in four (25%) say it is better today.
Forty-nine per cent of Gen X and 38% of Millennials think
today’s education is worse than when they were at school.
Gen Z,
the youngest generation surveyed, were more likely to say the
education system was better today than when they were at school.
Thirty-five per cent say it is better today and 30% worse.
Older
people were the most likely to
think schools do not contribute to reducing social inequalities. Forty-five
per cent of baby boomers felt this was the case, while 46%
thought they do.
The
other generations were less divided with 55% of Millennials and
54% of Gen Z saying education can contribute to reducing
inequalities.
While all age
groups are more likely to feel AI should not be banned in
schools, this feeling declines the older someone is. One
in two (50%) Gen Z think it should not be banned and 35% of Baby
Boomers feel this way.
5
September 2023
Source:
https://www.ipsos.com/en/global-education-monitor-2023
810-814-43-48/Polls
Buddhism, Islam And Religious Pluralism In South And Southeast
Asia, Survey In 6 Asian Countries
As some
practices and philosophies related to Buddhism have become more
commonplace in the United States and other Western countries,
many Americans may associate Buddhism with mindfulness or
meditation. In other parts of the world, however, Buddhism is
not just a philosophy about mind and body – it is a central part
of national identity.
In
Cambodia, Sri Lanka and Thailand – countries where at least 70%
of adults are Buddhist – upward of nine-in-ten Buddhists say
being Buddhist is important to being truly part of their nation,
according to a 2022 Pew Research Center survey of six countries
in South and Southeast Asia.
For
instance, 95% of Sri Lankan Buddhists say being Buddhist is
important to be truly Sri Lankan – including 87% who say
Buddhism is very important
to be a true Sri Lankan.
Although most people in these countries identify as Buddhist
religiously, there is widespread agreement that Buddhism is more
than a religion.1 The
vast majority of Buddhists in Cambodia, Sri Lanka and Thailand
not only describe Buddhism as “a religion one chooses to follow”
but also say Buddhism is “a culture one is part of” and “a
family tradition one must follow.”
Most
Buddhists in these countries additionally see Buddhism as “an
ethnicity one is born into” – 76% of Cambodian Buddhists hold
this view, for example.
Buddhism and
national law in Buddhist-majority countries
The
importance of Buddhism in national identity is reflected in the
prominence that all three countries’ laws give to Buddhism.
Under Cambodia’s
constitution,
Buddhism is the national religion and the state is required to
support Buddhist schools. Sri
Lanka’s current constitution guarantees
Buddhism “the foremost place” and assigns the government
responsibility “to protect and foster” it. And a succession of
Thai constitutions over the last century have increased the
official preeminence of Buddhism,
with the country’s most
recent constitution requiring
the state to “have measures and mechanisms to prevent Buddhism
from being undermined in any form.”
According to the survey, most Buddhists in all three countries
favor basing their national laws on Buddhist dharma – a wide-ranging concept that includes the knowledge, doctrines and practices stemming from
Buddha’s teachings. This perspective is nearly unanimous among
Cambodian Buddhists (96%), while smaller majorities of Buddhists
in Sri Lanka (80%) and Thailand (56%) support basing national
laws on Buddhist teachings and practices.
Religious
leaders’ role in politics
When
asked about the role of religious leaders in public life,
Cambodian Buddhists again stand out as the most likely to favor
an intersection between religion and government. For instance,
81% of Cambodian Buddhists say religious leaders should vote in
political elections, a position taken by smaller proportions of
Buddhists in Sri Lanka (66%) and Thailand (54%). (The
Thai constitution bans Buddhist
monks, novices, ascetics and priests from voting.)
But
even in Cambodia, with its near-unanimous support for basing the
law on Buddhist dharma, no more than half of Buddhists say
religious leaders should participate in political protests
(50%), talk publicly about the politicians they support (47%) or
be politicians themselves (45%).
Islam’s role in
Indonesia and Malaysia
In some
ways, Buddhism’s links to national identity in these countries
parallel the role of Islam in the neighboring Muslim-majority
countries of Indonesia and Malaysia. Nearly all Muslims in both
countries say being Muslim is important to be truly Indonesian
or Malaysian. And Muslims in both countries commonly describe
Islam as a culture, family tradition or ethnicity – not just “a
religion one chooses to follow.” For instance, three-quarters of
Malaysian Muslims say Islam is “an ethnicity one is born into.”
Since
emerging from colonial rule in the 20th century, these two
countries have followed divergent paths for the role of religion
in government, but most Muslims in both nations favor making
sharia the official law of the land. Muslims in Malaysia, where
Islam is
the official religion,
overwhelmingly support using sharia as the national law (86%).
Most Malaysian Muslims also favored making Islamic law the
official law of the land a decade earlier, in a
2011-2012 Pew Research Center survey of
countries with large Muslim populations.2
Support
for sharia is somewhat lower among Muslims in Indonesia, where
the drafters of the
1945 constitution ultimately rejected
proposed language that
would have explicitly favored Islam but included language saying
the state is “based upon the belief in the One and Only God.”
The resulting
compromise is sometimes classified as
“mild secularism” with “relative (not absolute) separation
between state and religion.” Today, 64% of Indonesian Muslims
nevertheless say sharia should be used as the law of the land. A
majority of Muslims in the country likewise supported making
Islamic law the official national law when asked in 2011-2012.
Muslims
in both Indonesia and Malaysia are more likely than Buddhists
surveyed in neighboring countries to favor high-profile roles
for religious leaders in politics. For example, most Muslims in
Indonesia (58%) and Malaysia (69%) say religious leaders should
talk publicly about the politicians and political parties they
support, while roughly half or fewer of Buddhists in Cambodia,
Sri Lanka and Thailand favor this level of religious interaction
in politics.
Attitudes
toward other religions
Alongside these three Buddhist-majority and two Muslim-majority
countries, the survey also included Singapore, which has no
religious majority and by some measures is the world’s
most religiously diverse society.
According to the
most recent census,
31% of Singaporean adults identify as Buddhist, 20% are
religiously unaffiliated (i.e., they say they have no religion),
19% are Christian and 15% are Muslim. The remaining 15% of the
population includes Hindus, Sikhs, Taoists and people who follow
Chinese traditional religions, among others. (For more on
Singapore’s religious composition and how it has changed over
time, read “Singapore’s
changing religious identity.”)
Most
Singaporeans (56%) say that having people of many different
religions, ethnic groups and cultures makes their country a
better place to live, while few Singaporeans (4%) say it makes
their country a worse place to live. (Most other respondents,
37%, say such diversity doesn’t make much difference.) And on
several measures of religious tolerance, Singaporeans express
broadly accepting views toward other groups. For example, nearly
nine-in-ten adults in Singapore say Christianity, Islam,
Hinduism and Chinese traditional religions are all compatible
with Singapore’s culture and values.3
While
Singapore sometimes stands out for the high levels of tolerance
its residents express, adults in Malaysia and Sri Lanka (both
62%) are even more likely than those in Singapore (56%) to say
that religious, ethnic and cultural diversity benefits their
country. In general, tolerance for other religions is widely
espoused in all six countries. Across all major religious
groups, most people say they would be willing to accept members
of different religious communities as neighbors. For instance,
81% of Sri Lankan Buddhists say they would be willing to have
Hindu neighbors, and a similar share of Sri Lankan Hindus (85%)
say the same about Buddhists.
And,
overall, people in most of the countries surveyed tend to see
other religions as compatible with their national culture and
values. In Muslim-majority Malaysia, 67% say Buddhism is
compatible with Malaysian culture and values. And even in Sri
Lanka, where a civil war concluded a little more than a decade
before the survey, 68% of the population says Christianity and
Hinduism are compatible with Sri Lankan culture and values –
including 60% of the country’s Buddhists (the majority
community).
What are
Chinese traditional religions and Indigenous religions?
The
category of “Chinese traditional religions” is a fluid yet
essential one. In several Southeast Asian countries, many people
with Chinese ethnic backgrounds practice traditional ritual
activities in temples that are devoted to Confucian, Mahayana
Buddhist and Taoist deities, without necessarily seeing clear
boundaries between them.
In
other words, although Confucian, Buddhist and Taoist religious
traditions are distinct from one another, the lines between them
are fluid in practice. Furthermore, people who follow these
practices may
not claim a distinct religious identity.
Local
beliefs and Indigenous religions refer to religions that are
closely associated with a particular group of people, ethnicity
or tribe. Such religious traditions may be less
institutionalized than other religions that have a global
presence, and the boundaries between Indigenous
religions and other religions can
be blurry.
Not
only do religious groups largely accept one another as neighbors
and fellow citizens, but in many cases, there also are signs of
shared religious beliefs and practices across religious lines.
For example, sizable majorities in nearly every large religious
community in all six countries say that karma exists, even
though belief in karma (the idea that people will reap the
benefits of their good deeds, and pay the price for their bad
deeds, often in future lives) is not traditionally associated
with all the religious groups surveyed.4
In
addition, many people pray or offer their respects to deities or
founder figures that are not traditionally considered part of
their religion’s pantheon. For example, 66% of Singaporean
Hindus say they pray or offer respects to Jesus Christ, and 62%
of Sri Lankan Muslims do the same to the Hindu deity Ganesh.
“Offering respects” to deities – often through gestures such as
bowing one’s head or putting one’s hands together – is commonly
understood in the region as the act of worshipping or venerating
deities and can include a variety of practices, such as burning
incense, making food offerings or making wishes to the deity.
These are gestures of great respect or veneration, though they
may not align with formal, Western perceptions of prayer or
worship.5 (For
more on the figures people pray or offer their respects to,
read “Praying
or offering respects to figures from other religions.”)
Clear divisions
– and tensions – between religious groups
Despite
these expressions of tolerance and religious mixing, religious
identity also can be a firm line between groups in this part of
the world.
In
fact, many people across the countries surveyed say it is
unacceptable for people to give up their religion or convert to
another faith. In Indonesia, 92% of Muslims say it is
unacceptable for a person to leave Islam, and 83% of Christians
say it is unacceptable to leave Christianity for another
religion.
Overall, Muslims are more likely than other religious
communities to say conversion away from their faith is
unacceptable. But this is also the position taken by two-thirds
or more of Buddhists in Cambodia, Sri Lanka and Thailand – the
study’s three Buddhist-majority nations.
In five
of the six countries surveyed, nearly all adults still identify
with the religion in which they were raised. Only in Singapore
do a sizable share of adults (35%) indicate their religion has
changed during their lifetime. (For additional information on
religious switching in Singapore, read “Share
of Singaporeans identifying as Christian or unaffiliated is
increasing.”)
Moreover, in several countries, substantial shares see other
religions as incompatible with
their national culture and values. For instance, 45% of Sri
Lankan Buddhists say Islam is incompatible with Sri Lankan
values, while 38% of Indonesian Muslims say Buddhism is
incompatible with Indonesian culture.
In some
countries, there are also sizable shares of Muslims who say
Buddhism is not peaceful,
and conversely some Buddhists who say Islam is not peaceful.
Malaysian Muslims are especially likely to see Buddhism as not
peaceful (42%), while 36% of Thai Buddhists say Islam is not
peaceful.
In some
countries, substantial shares express negative feelings about
Christianity and Hinduism. In Indonesia, for example, 21% of
Muslim adults surveyed say Christianity is not peaceful.
These
are among the key findings of a Pew Research Center survey
conducted among 13,122 adults in six countries in Southeast and
South Asia. Interviews were conducted face-to-face in Cambodia,
Indonesia, Sri Lanka and Thailand and on mobile phones in
Malaysia and Singapore. Local interviewers administered the
survey from June to September 2022, in eight languages. (Read the
report’s Methodology for
further details.)
This
study, funded by The Pew Charitable Trusts and the John
Templeton Foundation, is part of a larger effort by Pew Research
Center to understand religious change and its impact on
societies around the world. The Center previously has conducted
religion-focused surveys across sub-Saharan
Africa;
the Middle
East-North Africa region and
many countries with large
Muslim populations; Latin
America; Israel; Central
and Eastern Europe; Western
Europe; India; and the United
States.
The rest of
this Overview covers various topics in more detail, including:
Unique patterns
of belief across a highly religious region
In
general, the countries surveyed are highly religious by a
variety of measures – including affiliation, beliefs and
practices. For instance, nearly all respondents in five of the
six surveyed countries identify with a religious group, and
majorities in these same five countries say religion is very
important in their lives – including 98% in Indonesia and 92% in
Sri Lanka.
The
lone exception on both these measures is Singapore, where 22% of
adults do not identify with any religion, and just 36% of adults
say religion is very important
in their lives.
Even in
Singapore, however, the vast majority of adults surveyed (87%)
say they believe in God or unseen beings, and about seven-in-ten
say they think karma and fate exist. These beliefs are common
across all the countries in the survey, as is the notion that
spells, curses or other magic can influence people’s lives.
Roughly half or more adults in each country hold this view,
including 55% in Singapore and 78% in Cambodia.
Rates
of specific religious practices often are related to the
religious makeup of each country. For example, overwhelming
majorities in Cambodia (96%), Sri Lanka (92%) and Thailand (84%)
say they burn incense; all three are Buddhist-majority
countries, and Buddhists across southern Asia are more likely
than Hindus, Christians or Muslims to burn incense. Meditation
is also highest in the Buddhist-majority countries of Thailand
and Sri Lanka (62% each), although Hindus across the region are
more likely than Buddhists to say they practice meditation.
By
contrast, daily prayer is most common in Indonesia and Malaysia,
the two Muslim-majority countries in the survey. And, across the
region, Muslims are more likely to say they pray at least once a
day than are Hindus, Christians or Buddhists.
By
multiple measures, religiously unaffiliated adults in Singapore
are among the least religious or spiritual people in the region.
But sizable shares of unaffiliated Singaporeans do express some
religious or spiritual beliefs or follow some practices. (For a
more detailed look at Singapore’s unaffiliated population, read “Who
are the people in Singapore who don’t identify with a religion,
and what do they believe?”)
Praying or
offering respects to figures from other religions
In the
countries surveyed, many religious beliefs and practices are
shared by different religious communities. This includes a
propensity to show respect for – or even to pray to – deities or
religious figures commonly associated with another faith.
For
instance, nearly one-in-five Singaporean Buddhists (18%) say
they pray or offer their respects to Allah, while almost half of
Malaysian Hindus (47%) say they pray or offer respects to Jesus
Christ.
In
general, Hindus are the most likely to pray or offer their
respects to deities or founder figures not traditionally
associated with their community, while Muslims are generally the
least likely to do this. For example, in Singapore, 66% of
Hindus and just 9% of Muslims say they pray or offer respects to
Jesus Christ. In fact, Singapore’s religiously unaffiliated
adults (16%) are more likely than the country’s Muslims to say
they pray or offer respects to Jesus Christ.
Sri
Lanka, an island nation south of India, also stands out as a
place where people pray or offer respects to founder figures and
deities – both the ones traditionally associated with their
religion and those from other traditions. For instance, 48% of
Sri Lankan Christians say they pray or offer their respects to
Ganesh, the Hindu god of beginnings who is considered a remover
of obstacles.
But in the other countries surveyed, only about 5% of Christians
do so. And 71% of the island’s Muslims say they pray or offer
respects to Buddha, while very few Muslims in the other
countries surveyed do this.
In
addition to Buddha, Allah, Jesus Christ and Ganesh, the survey
also asked about Mother Mary, Shiva, Guanyin and “protector
spirits” in general. For more about people’s relationships with
deities, spirits and religious founder figures, read Chapter
4.
Religious
funeral practices
Rituals
surrounding death are important to all the major religious
groups in the countries surveyed.
For
instance, most people in the Buddhist-majority countries of
Cambodia (84%), Sri Lanka (80%) and Thailand (80%), as well as
in Muslim-majority Indonesia (72%) and Malaysia (61%), say it
would be very important to invite a religious leader to recite
sacred texts or preach if they were planning the funeral of a
family member or loved one.
Most
people in the Buddhist-majority countries surveyed also say it
would be very important to perform rituals for the relative in a
temple or other house of worship, and to set up a shrine or
altar for the deceased.6 Altars
are especially valued by Buddhists in these countries: For
example, 63% of Thai Buddhists say that setting up an altar
would be very important, compared with just 6% of Thai Muslims
who say the same about a shrine. Many people across religious
groups also say it is very important to offer donations in the
name of deceased relatives, including 71% of Christians in
Indonesia, 61% of Muslims in Malaysia and 70% of Buddhists in
Cambodia.
People
in Singapore generally are less inclined than those in
neighboring countries to say each of the four funerary rituals
is very important, although more than half of Singaporeans say
each ritual would be at least somewhat important if they were
planning the funeral of a loved one.
Across
the countries surveyed, rituals surrounding deceased loved ones
do not end after the funeral. Most people in five of the six
surveyed countries (with the exception of Malaysia) say someone
in their household performs rituals on the anniversary of the
death of a loved one, including 93% in Sri Lanka and 90% in
Thailand. This type of ritual crosses religious lines, with Sri
Lanka as a prime example: Roughly eight-in-ten or more
Buddhists, Muslims, Christians and Hindus in the country say
someone in their household performs rituals on death
anniversaries.
It also
is fairly common across these countries to have a family
gravesite where the remains of family members reside. Roughly
half of respondents in five of the six surveyed countries (this
time, with Sri Lanka as the exception) say this is the case.
Among those who have a family gravesite, most people say they
look after it by sweeping or cleaning it. It is generally less
common for people to pay money to maintain a family gravesite.
By some
measures, older adults are more religious than younger adults
Since
this is the first time Pew Research Center has conducted an
extensive, national survey on religion in most of these
countries, opportunities for looking at how religious beliefs
and practices are changing over time are limited.7 But
differences between older and younger adults may provide clues
into how each country is changing religiously.8
In five
of the six countries surveyed, nearly universal shares of both
younger and older adults identify with a religion. Only in
Singapore are younger adults (ages 18 to 34) slightly more
likely than older adults to be religiously unaffiliated (26% vs.
20%).
Across
the countries surveyed, however, older adults are more likely
than those ages 18 to 34 to be religious by a handful of
standard measures – in line with the broad patterns seen in a
2018 Center analysis of
the age gap in religiosity around the world.
For
example, in Thailand, Cambodia, Singapore and Sri Lanka, people
ages 35 and older are more likely than younger adults to say
religion is very important in their lives. (This is not the case
in the two Muslim-majority countries surveyed, where there is
little difference on this measure between age groups.)
Across
most of the countries surveyed, older adults also are generally
more likely than younger adults to say various religious
activities would be very important for a loved one’s funeral.
For
instance, roughly four-in-ten older adults in Singapore say that
if they were planning the funeral of a family member or loved
one, it would be very important to perform rituals in a temple,
mosque or other house of worship for the soul of the deceased
relative. Just one-third of younger adults in Singapore say
this.
Still,
across many religious activities and beliefs, older and younger
people are largely similar. For example, similar shares of older
and younger adults in all six countries say they use special
objects for blessings or protection.
Moreover, in a few countries, older adults (ages 35 and older)
are slightly less likely
than younger adults to say they believe in unseen beings, like
deities or spirits. For instance, 61% of older Malaysians say
they think there are unseen beings in the world, compared with
67% of younger adults in the same country.
In
several countries, younger Buddhist adults are more likely than
older Buddhists to say it is acceptable for a person to leave
Buddhism for another religion. For example, younger Thai
Buddhists are twice as likely as those who are older to say that
leaving Buddhism is acceptable (46% vs. 22%).
Among
Muslims, only in Singapore are younger adults more likely than
older Muslims to say it is acceptable to leave Islam for another
religion (25% vs. 9%).
Sidebar:
Regional economic growth has not led to widespread loss of
religion
A
theory in the social sciences hypothesizes that as countries
advance economically and science takes a more prominent role in
everyday life, populations tend to become less religious, often
leading to wider social change. Known as “secularization theory,” it particularly reflects the experience of Western European countries
from the end of World War II to the present, though it has its
roots in earlier writings.
Recent
academic research suggests that changes
in religiosity stemming from economic development are more
limited – tied to levels of religious identification or worship service
attendance, rather than to the beliefs people hold – though
others argue that secularization
has increased dramatically in recent years.
Pew Research Center’s previous work found only
minimal support for secularization theory in India.
Data
from Sri Lanka and Southeast Asia finds a bit of a mixed bag –
some cases in which higher economic development seems to go hand
in hand with less religion, but many others where there is no
such correlation. For example, Singapore’s
per capita gross domestic product (GDP)
is about four times as large as any other surveyed country’s
GDP, and it has by far the
largest share of religiously unaffiliated individuals.
Singapore also has the smallest share of adults who
say religion is very important in their lives.
However, adults in Singapore are just as spiritual or religious
as those in neighboring countries by other measures. For
example, 87% of Singaporean adults say they believe in God or
unseen beings – a higher share than in Cambodia (78%) or
Thailand (81%). Meanwhile, nearly identical shares of
Singaporeans (55%), Indonesians (55%) and Sri Lankans (54%) say
that spells, curses or other magic can influence people’s lives.
Moreover, all six countries surveyed have experienced strong
rates of economic growth over the last 30 years. Global
per capita GDP in
2022 is almost triple what it was in 1990, but the six surveyed
countries each have seen their
per capita GDP grow
at a faster rate, nearly quadrupling (or more) over the last
three decades. Even with these rates of growth, very few adults
(except in Singapore) identify as religiously unaffiliated
today.
Those
who live in urban settings are broadly as religious or spiritual
as those in rural locations. In Malaysia, for instance, 74% of
both urban and rural residents say they believe in karma.9 Rural
people are slightly more likely than urban residents to follow a
few funerary practices. In Indonesia, for example, 35% of rural
residents say setting up a shrine is very important when
planning a family member’s funeral, compared with 27% among
urban Indonesians.
There
is a somewhat stronger association between educational
attainment and religion. Several measures of religious
commitment are less common among people who have received more
education. For example, Cambodians who have received at least a
secondary education are less likely than other Cambodians to say
religion is very important in their lives (54% vs. 69%) or to
say a shrine would be very important for a deceased relative’s
funeral (64% vs. 76%).
But,
again, there are a number of beliefs and practices that do not
show a pattern in which more education is associated with lower
levels of belief. For instance, belief in karma is roughly the
same within each country, no matter a person’s level of
education. And people who have more education are more likely
than other adults to say they think there are unseen beings in
the world, like deities or spirits. In Singapore, for example,
76% of college-educated adults believe there are unseen beings,
compared with 65% of other Singaporeans.
Share of
Singaporeans identifying as Christian or unaffiliated is
increasing
Singapore differs from the other countries surveyed in that it
has no majority religion, and thus no single religion that is
clearly associated with Singaporean national identity.
It also
stands out in another way: While nearly all adults surveyed in
the other countries still identify with the religion in which
they were raised, far fewer Singaporeans do (64%). This
“religious switching” has led to declines especially in the
share of Singaporeans who identify as Buddhist or as followers
of Chinese traditional religions, and to increasing shares
who are Christian or religiously unaffiliated.
Among
Singaporean adults, 32% say they were raised Buddhist, which is
significantly more than the share who identify as Buddhist today
(26%). The gap is even bigger when it comes to the share who
identify with Chinese traditional religions, such as Taoism,
Confucianism or Chinese local religions: 15% say they were
raised in these traditions, while just 6% identify with Chinese
traditional religions today.
By
contrast, the share of Singaporeans who identify as Christian
today is higher than the share who say they were raised
Christian (17% vs. 11%). The same is true for adults in
Singapore who do not identify with any religion: 22% of adults
say they are religiously unaffiliated today, compared with 13%
who say they were raised with no religion.
A
similar pattern can be seen in Singapore’s census records over
the last few decades. (Read “Singapore’s
changing religious identity” for
an analysis of this census data.)
Yet the
story of religious change in Singapore is not simply that
Buddhists and followers of Chinese traditional religions are
leaving their childhood faiths for Christianity or to have no
religious affiliation.
For
instance, while 13% of Singapore’s adults were raised Buddhist
but no longer identify as Buddhist, the share in the country who
currently identify as Buddhist has decreased by only 6
percentage points because 7% of Singaporean adults converted
into Buddhism (either from a different childhood religion or
from no religion).
And
while 15% of the country’s adult population has left behind a
childhood religion to become religiously unaffiliated, the share
of Singaporeans who identify with no religion has had a net
increase of only 9 points, because 6% of the adult population
has moved in the opposite direction: They are people who were
raised without a religious affiliation but have since joined a
religion (mostly Buddhism or Christianity).
While
continued religious churn and other factors will also affect
Singapore’s future religious composition, the way in which
current parents say they are raising their children suggests
that Buddhists may continue to decline as a share of the overall
population.
Only
two-thirds of Buddhist parents say they are raising their
children as Buddhist; roughly one-quarter of Buddhist parents
(27%) say their children are being raised with no religion. By
contrast, much higher shares of Singapore’s Muslim (99%) and
Christian (90%) parents say they are raising their children as
Muslims and Christians, respectively. And the survey finds that
85% of religiously unaffiliated parents are raising their
children without a religion.
Sidebar:
Singapore’s changing religious identity
According to the national census, the religious makeup of
Singapore today is markedly different from 40 years ago.10 Alongside rapid
economic growth,
the religiously unaffiliated have increased from 13% to 20% of
the adult population. However, this period has also seen
Christians roughly double as a share of the national population,
from 10% in 1980 to 19% in 2020.
After
increasing between 1980 and 2000 (from 27% to 43%), Singapore’s
Buddhist population has since decreased to 1990 levels (31%).
Meanwhile, the share of Singapore’s adults who identify with
Chinese traditional beliefs (including Taoism) decreased from
30% in 1980 to roughly one-in-ten in 2000 and generally has held
steady since then.11
Since
1980, the percentages of Singaporeans identifying as Muslim,
Hindu and other religions have remained fairly steady.
Who are the
people in Singapore who don’t identify with a religion, and what
do they believe?
In
stark contrast with neighboring populations in which nearly
everyone claims a religious affiliation, roughly one-in-five
Singaporeans do not identify with any religion – a group
sometimes referred to as the “nones.” Singapore’s “nones” are
overwhelmingly of Chinese descent and mostly college educated.
By some
measures, Singapore’s religiously unaffiliated population does
not appear very religious or spiritual. For instance, only 3% of
the country’s “nones” say religion is very important in their
lives, compared with 36% of Singaporean adults overall.
But as
a group, Singapore’s religiously unaffiliated do not completely
disavow religious or spiritual beliefs and practices. Nearly
two-thirds of the “nones” (65%) say they think karma exists, and
43% say that a person can feel the presence of deceased family
members – roughly comparable to the shares of Muslims (47%) and
Christians (43%) in Singapore who say the same.
When
asked about planning a funeral for a family member or loved one,
many of Singapore’s religious “nones” also place importance on
activities that could be considered spiritual or religious.
For
example, 52% of those who claim no religion say it would be
important to perform rituals in temples for the soul of the
deceased relative, and 46% feel it would be important to set up
an altar for the deceased relative.
Everyone who took the survey was asked whether they believe in
God and, separately, whether they think there are unseen beings
in the world, like deities or spirits.
About
four-in-ten religiously unaffiliated Singaporeans (41%) say they
believe in God, and a slim majority (56%) think there are unseen
beings in the world. Roughly six-in-ten Singaporean “nones”
(62%) hold at least one of these beliefs.
“Nones”
who are women are more likely than religiously unaffiliated men
to believe in God and/or unseen beings (68% vs. 57%). Also,
Singaporeans who were raised in a religion but are unaffiliated
as adults are more likely to believe in God or unseen beings
(66%) than Singaporeans who were raised with no religious
affiliation and are still “nones” today (52%).
By
nearly every measure included in the survey, the religiously
unaffiliated who say they believe in God and/or unseen beings
(“believing nones”) are more likely than other “nones” to
connect with spiritual and religious concepts. For instance, the
vast majority of “believing nones” also think karma exists
(84%), but only 36% of Singapore’s other “nones” believe in
karma. And the religiously unaffiliated who believe in God
and/or unseen beings are much more likely than others to say
that it would be important to perform rituals in temples for the
soul of the deceased relative when planning a funeral (63% vs.
36%).
How those who
link religious and national identities differ from others
Some regional
scholars have noted increasing support for nationalistic movements centered on each country’s majority religion.12
As
explained above, many members of the religious majority in each
country (Buddhists in Cambodia, Sri Lanka and Thailand, as well
as Muslims in Indonesia and Malaysia) say it is very important
to be a member of their religious group to truly share their
national identity. Many also say they want their society’s laws
to be based on their religion’s teachings.
People
who take one of these positions are especially likely to take
the other. And those who express both views
are referred to in this section as “religion-state
integrationists.” (Broadly, religion-state
integration can be understood as the opposite of “separation of
church and state,” the principle that the power of the state
should not be used to coerce or promote religion, which is
legally or traditionally followed in
the United States and some
other countries.)
A
majority of Muslims in Indonesia (57%) and Malaysia (69%) are
religion-state integrationists, as are most Buddhists in Sri
Lanka (72%) and Cambodia (75%). A sizable minority of Thai
Buddhists (45%) also fall into this category.
‘Religion-state
integrationists’ are especially religious
Religion-state integrationists stand out from other members of
their religious communities in a variety of ways.
While
the region overall is very religious, religion-state
integrationists generally are even more religious
than other people, across a host of measures.
Among
Cambodian Buddhists, for example, those who say both that it is
very important to be Buddhist to be truly Cambodian and that
Cambodian law should be based on Buddhist dharma are much more
likely than other Buddhists to say religion is very important in
their lives (72% vs. 48%).
Attitudes relating to funerals show a similar divide. For
instance, about three-quarters of religion-state integrationists
in Indonesia’s Muslim community say inviting an imam or sheikh
to recite sacred texts or preach is very important when planning
a family member’s funeral, compared with roughly two-thirds of
other Muslims in the country (77% vs. 64%).
(For
more on this region’s general levels of religiosity, including
among minority communities, read Chapter
3 and Chapter
4. For more on funeral practices, refer to Chapter
5.)
Religion-state integrationists also are:
These
relationships generally hold even when controlling for other
factors, such as level of personal religiosity, age, gender and
education. In other words, correlations between views on the
relationship between religion and state and opinions on these
other issues exist above and beyond the fact that religion-state
integrationists are more religious. Cambodia’s religion-state
integrationists sometimes defy the patterns seen across the
other four surveyed countries.
Religion in
politics
As one
might expect, religion-state integrationists are somewhat more
likely than others in their communities to support religious
leaders’ direct involvement in politics.
In
Thailand, for instance, Buddhists who link Buddhist and Thai
identities and say Thai law should be based on Buddhist dharma
are roughly twice as likely as other Buddhists to say religious
leaders should be politicians (31% vs. 16%).
Even
among Buddhist religion-state integrationists, however, around
half or fewer say religious leaders should be politicians, talk
publicly about the politicians they support, or participate in
political protests. Muslims in Indonesia and Malaysia are more
inclined to favor religious leaders’ involvement in the
political sphere.
Members
of the majority religious community who strongly link their
religion with the national identity also are more likely than
others to say that disrespecting their country disqualifies
someone from being truly part of their religion. Among Sri
Lankan Buddhists, 73% of religion-state integrationists say that
if a person does not respect Sri Lanka, they cannot be truly
Buddhist – significantly more than the share of other Sri Lankan
Buddhists who say disrespecting Sri Lanka disqualifies someone
from being Buddhist (62%).
(For
more on the role of religious leaders in politics, read Chapter
7. For
more on what activities would disqualify someone from being part
of a religious community, refer to Chapter
2.)
Views toward
minority religions
Buddhist nationalism has
been linked with antagonism and violence between Buddhists and
religious minorities in countries dominated by Theravada
Buddhism, including during the Sri
Lankan civil war.
Similarly, some scholars have asserted that there is a
connection between rising “religious
nationalism” and
xenophobia in Muslim-majority Indonesia.
In
general, people who say that it is very important to be a member
of their religious community to truly share the national
identity and that
they want their society’s laws to be based on their religion are
less likely to see other religions as compatible with their
country’s culture and values. They are also less likely to
accept followers of other religions as neighbors – although most
religion-state integrationists say they would be
willing to accept people from other religions as neighbors.
For
example, among Indonesian Muslims, religion-state
integrationists are less likely than other Muslims to say
Christianity is compatible with Indonesian culture and values
(53% vs. 63%) or to say they would accept Christians as
neighbors (64% vs. 77%). This pattern broadly holds when asking
about other religious communities, such as Hindus and followers
of Chinese traditional religions.
However, Cambodian Buddhists stand out. There are no significant
differences between religion-state integrationists and other
Buddhists in Cambodia on any questions about the compatibility
of other religions with Cambodia’s culture and values or
potential neighbors.
(For
more on attitudes toward other religious groups across the
surveyed countries, read Chapter
6.)
Those
who link religion and national identity and say their national
laws should be based on religion are slightly more likely to say
that the growing numbers of various religious minorities are a
threat to Buddhism or Islam in their country.
For
instance, three-in-ten Thai Buddhists who are religion-state
integrationists say the growing number of Christians in Thailand
is a threat to Thai Buddhism – more than the 21% of other Thai
Buddhists who voice this opinion.
(These
questions were designed to gauge demographic anxieties,
regardless of whether or not these minority populations are
actually growing within the countries surveyed.)
In
general, religion-state integrationists also are somewhat more
likely than other Buddhists or Muslims to say that tourists from
other countries and the influence of China are threats to
Buddhism and Islam in their country. However, they are no more
likely to see extremists from their own community as a threat to
Buddhism or Islam in their country. Among Sri Lanka’s Buddhists,
for example, roughly three-quarters of both religion-state
integrationists and others say that Buddhist extremists are a
threat to Buddhism in Sri Lanka (73% and 75%, respectively).
Similarly, there is generally no difference between the groups
within a country when asked whether the influence of the United
States is a threat.
As with
other topics, there are no significant differences on perceived
threats to Buddhism in Cambodia between Buddhists who do or do
not classify as religion-state integrationists. (For more on
attitudes about perceived threats to Buddhism and Islam, refer
to Chapter
6.)
(Ipsos Global)
12 September 2023
810-814-43-49/Polls
48%
Across 31 Countries Say The Quality Of The Healthcare In Their
Country Is Good – But The Picture Is Inconsistent
Mental
health is the top health concern for people across 31
countries, moving ahead of previous years’ top concerns like
cancer and coronavirus.
Drawing
on five years of trend data, the Ipsos Global Health Service
Monitor explores changes in the biggest health concerns, how
people perceive the quality of their country’s healthcare
systems and the biggest challenges facing healthcare providers
around the world.
Key
findings
Top
health problems around the world
Across
31 countries, people put mental health as the top health concern
facing their country. Since the beginning of this survey in
2018, mental health worries have increased by 17 percentage
points (pp), with over two-fifths (44%) worried.
Additionally, worries about stress (now mentioned by 30% as an
issue) are on the rise. It is now third in our list
behind cancer (40%).
In
Sweden and Chile, two-thirds feel that mental health is one of
the biggest health problems facing their country. Canada, Spain
and Australia make up the top five.
Looking
at the other health concerns, India is most worried about cancer
(59%), while South Koreans have the highest level of concern
about stress (44%). In Mexico six in ten (62%) say obesity is a
big problem with Chile second with 49%.
Looking
at the differences between men and women, we find overall
that men are significantly less concerned over mental health in
their country than women (38% vs. 50%). And we see a similar
pattern for cancer and stress. Forty-two per cent of women say
they worry about cancer, compared to 37% of men; 33% of women
highlight stress, while 27% of men say it is an issue.
How do
people around the world rate their healthcare systems?
People
are mostly satisfied with the quality of their country’s
healthcare system. All but four of the 31 countries surveyed –
Poland, Hungary, Peru and Brazil – describe the quality of the
healthcare they receive as very good or good.
Singaporeans are the most positive about their healthcare
system, with 71% saying it is very good/good. Switzerland is
second with 68% happy with the level of service they receive.
However, a majority in 25 countries say their healthcare system
is overstretched. This goes as high as four-fifths in both
France and Great Britain. Brits have always perceived their
system as overworked, however the French have been gradually
becoming more pessimistic, rising 12pp since 2018. France is
also highest for thinking their country’s healthcare system does
not have enough staff.
The
only country that doesn’t think their country’s healthcare
system is overstretched is Poland, where 41% don’t see it as a
problem (vs. 27% who do).
A third
of people globally think their country’s healthcare system does
not provide the same standard of care to everyone. This
sentiment is strongest in 12 countries – Hungary, Poland, Chile,
Colombia, the US, Germany, Peru, Ireland, South Africa, Mexico,
Brazil, Turkey – where people are more likely than not to say
this is the case.
28
September 2023
Source:
https://www.ipsos.com/en/global-health-service-monitor-2023
810-814-43-50/Polls
A
Quarter Of Global Consumers Don't Feel Comfortable With Online
Banking, A Study Across 48 Markets
More
than a quarter of consumers worldwide are uncomfortable using
online banking (27%), according to the YouGov Global Profiles
study, which collects data from 48 international markets. Among
adults aged 18-44, nearly three in ten (28-29%) agree with this
view. Contrary to popular belief, the percentage of people over
55 who do not feel comfortable using online banking is similar
to that of other age groups. In fact, they disagree with this
statement (53%).
Digging
deeper into the data by market, India stands out in the APAC
region, where almost two out of five consumers say they are
dissatisfied with online banking (37%). This is particularly
striking when compared to Singapore (20%), China (19%) and Hong
Kong (17%), where the percentage is almost halved.
In the
MENA region, Morocco (44%) and Lebanon (40%) lead the way, with
nearly two in five consumers saying they don't feel comfortable
using online banking. In wealthy Gulf countries, such as the
United Arab Emirates (36%) and Saudi Arabia (35%), about a third
of consumers do not feel comfortable with online banking.
The
Nordic markets present a more comfortable picture with digital
banking platforms. Denmark and Norway (11% each) show a low
level of discomfort, with only one in ten consumers indicating
it. Among the 48 markets, Finns feel least uncomfortable with
online banking (10%).
In
Western European countries such as Britain, Spain and Greece,
about a quarter of consumers share similar reservations about
digital banking (24-25%). In contrast, Eastern European
countries, such as Slovakia and Poland, show a greater degree of
calmness, with less than a fifth expressing concern (18% each).
Italians are not reluctant to use online banking: only 15% of
the population say they do not feel comfortable using
In the
US, two in five consumers continue to distrust online banking
(38%). Surprisingly, younger demographic groups show greater
discomfort (18-24: 53% and 25-34: 46%). This distrust decreases
with age, with about two-fifths of those aged 35-44 (41%)
expressing discomfort, falling to just three-tenths of those
aged 45-54 (28%) and those over 55 (31%).
(YouGov Italy)
22 September 2023
|
||||||||||||||||||||||||||||||||||||||||||||||||||||||||||||||||||||||||||||||||||||||||||||||||||||||||||||||||||||||||||||||||||||||||||||||||||||||||||||||||||||||||||||||||||||||||||||||||||||||||||||||||||||||||||||||||||||||||||||||||||||||||||||||||||||||||||||||||||||||||||||