|
BUSINESS
& POLITICS IN THE WORLD GLOBAL
OPINION REPORT NO. 865-871 Week: September 16 – November
03, 2024 Presentation: November 08,
2024 Over
60% Of Japanese Can Go A Month Without Reading A Book 33%
Support Ishiba Cabinet, Trailing 39% Non-Supporters Dissatisfaction
With Democracy Is Widespread In Japan Ahead Of Snap Election China
Factory Surveys Show Economy Weakening, As Beijing Steps Up Support Turks
Lean Negative On Erdoğan, Give National Government Mixed Ratings Palestinians
See U.S. Response To Gaza As Failure 51%
Of Citizens Say Nigerians Are Not United Mauritians
Approach Election With Diminished Confidence In The Freedom Of Their Press Ethiopians
Call For Greater Climate Action By Government And Other Stakeholders How
Do Britons Feel About The First 100 Days Of Labour Government? Four
In Ten Renters And A Quarter Of Mortgage Holders Are Still Feeling The Pinch Over
Half Of UK Adults View Racism In Football As A Problem More
Britons Care About Who Wins The US Election Than The Tory Leadership Race No
One Trusts Elections Less Than Bulgarians Most
Americans Back Cellphone Bans During Class, But Fewer Support All-Day
Restrictions Harris,
Trump Voters Differ Over Election Security, Vote Counts And Hacking Concerns Majority
Of Americans Aren’t Confident In The Safety And Reliability Of Cryptocurrency A
Look At The State Of Affordable Housing In The U.S. 17
States Haven’t Had A Female U.S. Senator, And 18 Haven’t Had A Woman Governor Risk
Of Mortgage Stress Eases For Third Straight Month Consumer
Confidence Largely Up Latin American Countries Understanding
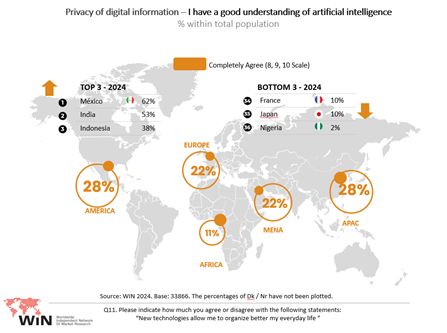
Digital Concerns, A Survey Across 29 Countries 45%
Of The Population Considers Mental Health To Be The Main Challenge Facing
Society INTRODUCTORY NOTE 865-871-43-30/Commentary: Dissatisfaction
With Democracy Is Widespread In Japan Ahead Of Snap Election
Japan’s new prime
minister, Shigeru Ishiba, has called a snap election for Oct. 27, saying he
wants his administration to face a public vote of confidence “as soon as possible.” Ishiba’s Liberal Democratic Party (LDP)
has led Japan for nearly 70 consecutive years, but has been rocked by a slew of recent scandals. Here are key facts about
Japan’s democracy ahead of the election, based on a Pew Research Center
survey of 1,003 Japanese adults, conducted Jan. 5-March 9, 2024. The survey
was fielded amid a slush fund scandal that resulted in the indictment of
several LDP lawmakers. Japan
is unique among highly developed democracies for having had only one
governing party for most of the last seven decades. The
Liberal Democratic Party has held power in Japan for 65 of the 69 years since
the party’s founding in 1955. In all other member states of the Organization
for Economic Cooperation and Development (OECD) – a group of mostly highly
developed, democratic countries – no party has held power for as much of the
last seven decades. Even some of the other
relatively long-serving parties in OECD countries, such as the Christian
Democratic Union in Germany and the Conservative Party in the United Kingdom,
have ruled their countries for fewer than five decades over this same time
period. While the LDP has remained
in power for decades, it often rules in coalition with other parties. For
example, it has relied heavily on its coalition with the Buddhist Komeito party since 1999.
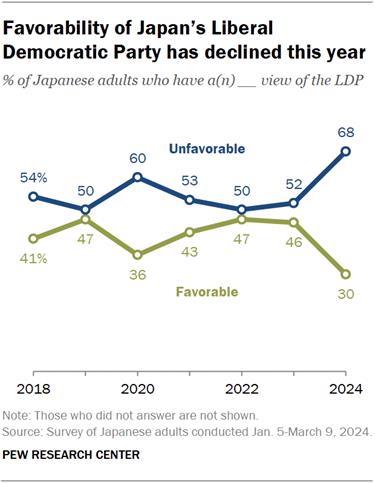
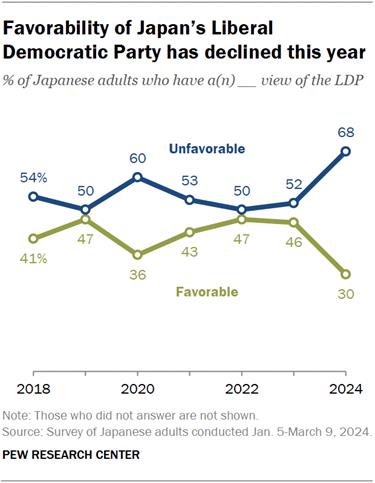
Favorability
of Japan’s Liberal Democratic Party has declined significantly since
2023. As of this past March, only 30% of
Japanese adults had a favorable view of the LDP, while 68% had an unfavorable
view. This represents a sharp decline from 2023 and marks the lowest
favorability rating for the party in our seven years of polling on the topic. Other political parties in
Japan are similarly unpopular today. For example, only 29% of Japanese adults
have a favorable view of the LDP’s main opposition party, the Constitutional
Democratic Party (CDP). Still, views of the CDP
have consistently been fairly negative, while the decline in views of the LDP
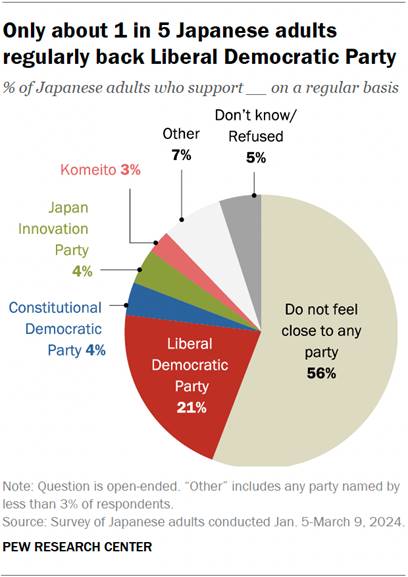
over the past year has been much more pronounced. Most
Japanese adults (56%) say they do not feel close to any political party. This
is far higher than the share of adults who do not identify with any political
party in other countries surveyed, as the Center has reported previously.
In Japan, a large majority
of people who do not feel close to any party also do not lean toward one particular party over
others. Indeed, only 21% of
Japanese adults say they support the LDP on a regular basis. Still, this is
far more support than any other party receives. The next closest are the
opposition Constitutional Democratic Party and Japan Innovation Party, at 4%
each. Low party enthusiasm may
also relate to low turnout. Previous analysis by Pew Research Center shows
that Japan is among the OECD countries with the lowest voter turnout, despite having automatic voter
registration.
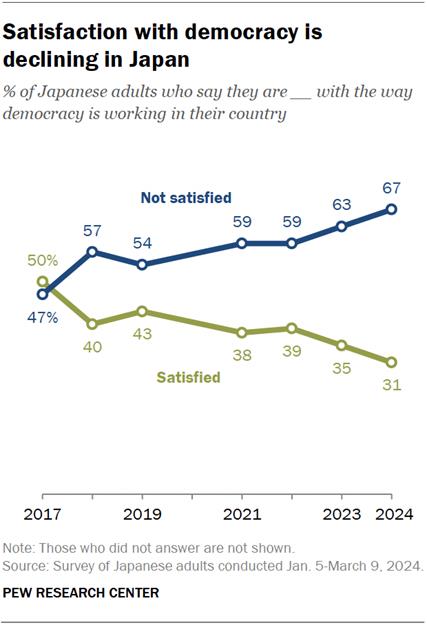
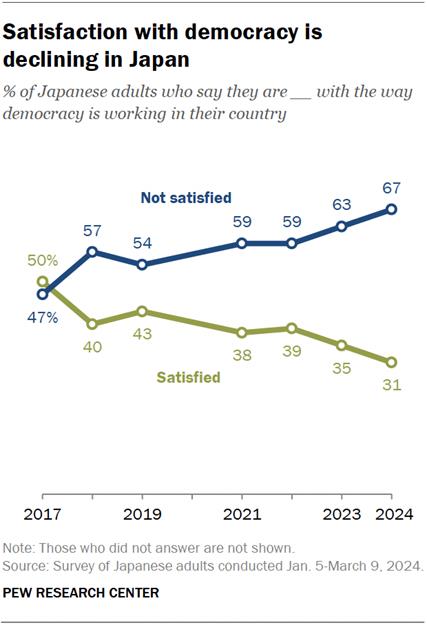
Only
around a third of Japanese adults say they are satisfied with the way
democracy is working in their country today. This
marks the lowest point in a steady downward trend since 2019. Still, those with a
favorable opinion of the governing Liberal Democratic Party are much more satisfied
with democracy than those who have an unfavorable view of the LDP (58% vs.
19%). This has consistently been the case in recent years. (PEW) 22 October, 2024 SUMMARY OF POLLS ASIA (Japan) Over 60% Of Japanese Can Go A
Month Without Reading A Book More than 60 percent of
Japanese do not read a single book over the course of a month, according to
the “public opinion survey on the Japanese language” for fiscal 2023. According
to the survey results, 62.6 percent of respondents answered “no” to the
question of how many books, including e-books, they read in a month. In past
surveys, the percentage had never exceeded 50 percent. In the previous survey
conducted for fiscal 2018, it was 47.3 percent. (Asahi Shimbun) 19 September, 2024 33%
Support Ishiba Cabinet, Trailing 39% Non-Supporters Thirty-three percent of
voters said they support the Ishiba Cabinet, compared with the 39 percent who
do not support it, an Asahi Shimbun survey showed, noticeably lower than the
support rate for the previous Kishida Cabinet in 2021. Prime Minister Shigeru
Ishiba, president of the ruling Liberal Democratic Party, said he will
release “new economic policies” in a speech on Oct. 15, when official
campaigning started for the Oct. 27 Lower House election. (Asahi Shimbun) 21 October, 2024 Dissatisfaction
With Democracy Is Widespread In Japan Ahead Of Snap Election Japan’s new prime
minister, Shigeru Ishiba, has called a snap election for Oct. 27, saying he
wants his administration to face a public vote of confidence “as soon as possible.” Ishiba’s Liberal Democratic Party (LDP)
has led Japan for nearly 70 consecutive years, but has been rocked by a slew of recent scandals. As of this past March, only 30% of
Japanese adults had a favorable view of the LDP, while 68% had an unfavorable
view. (PEW) 22 October, 2024 (China) China Factory Surveys Show
Economy Weakening, As Beijing Steps Up Support Chinese stock markets
surged Monday, reflecting enthusiasm over a barrage of policy measures
announced last week, including lower interest rates and smaller down payment
requirements for mortgages and a cut in required bank reserves. The main
index smaller market in Shenzhen soared 8.2% while the Shanghai Composite
index jumped 5.7%, The downturn in the property sector has rippled throughout
the world’s second-largest economy, hitting many other industries that
depended on booming housing construction, such as appliance makers and
manufacturers of building materials. (Asahi Shimbun) 30 September, 2024 (Pakistan) The Percentage Of Pakistanis
Who "Strongly Agree" That Democracy Is The Best System Of
Governance, Despite Its Flaws, Has Plummeted From 40% In 2007 To 17% In 2024 Gallup Pakistan has asked
nationally representative samples of adult men and women about their views on
democracy for nearly two decades, revealing a growing skepticism toward its
effectiveness as a governing system. Comparative Picture: In 2024, 17% of respondents
said they strongly agree; 21% somewhat agree; 15% neither agree nor disagree;
14% disagree; 19% strongly disagree; and 14% gave no response. (Gallup Pakistan) 17 October, 2024 (Turkey) Turks Lean Negative On
Erdoğan, Give National Government Mixed Ratings In
May 2023, voters in Turkey elected Recep Tayyip Erdoğan to his third
term as president. Less than a year later,
Erdoğan’s Justice and Development party (AKP) suffered its worst-ever
electoral defeat in
local elections. Overall, 55% of Turkish adults have an unfavorable opinion
of Erdoğan, while 43% have a favorable opinion. This marks a 32
percentage point decrease in favorability from 2017, including a 27-point
drop in the share of Turks with a very favorable
opinion of their president. (PEW) 16 October, 2024 MENA (Palestine) Palestinians See U.S. Response
To Gaza As Failure Nearly one year into the
Israel-Hamas war that started with Hamas’ Oct. 7 deadly attack in southern
Israel, Palestinians living in the West Bank and East Jerusalem give the U.S.
low marks for its efforts to protect civilians in Gaza and ensure they receive
crucial humanitarian aid. Approval of U.S. leadership is also at a new low. Seven
in 10 Palestinians surveyed (69%) strongly disagree, while 76% disagree
overall. About one in 10 (11%) agree that the U.S. has done enough to protect
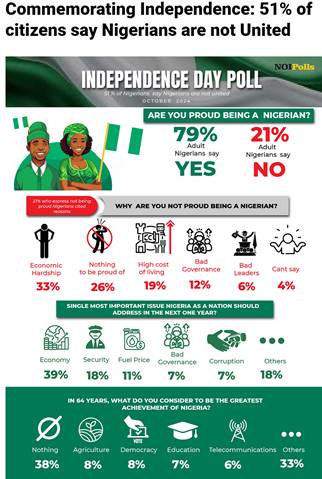
civilians. (Gallup) 03 October, 2024 AFRICA (Nigeria) 51% Of Citizens Say Nigerians
Are Not United A new public opinion poll
conducted by NOIPolls in commemoration of Nigeria’s 64th Independence Day has
revealed that 51 percent of adult Nigerians nationwide stated nigerans are
not united. However, further findings indicated that 79 percent of Nigerians take
pride in being citizens of Nigeria mainly because it is their fatherland (84
percent) and they have nowhere else to call home. On the flipside, 21 percent
lamented they were not proud being Nigerian mainly due to the economic
hardship (33 percent) currently facing the country. (NOI Polls) 02 October, 2024 (Mauritius) Mauritians Approach Election
With Diminished Confidence In The Freedom Of Their Press The vast majority (86%) of
Mauritians say the media should “constantly investigate and report on
government mistakes and corruption.”An equally strong share (86%) of the
population support media freedom, while only one in 10 (11%) think the
government should have the right to prevent the publication of things it
disapproves of. Television and radio are the most popular sources of news in
Mauritius, used at least “a few times a week” by more than nine in 10
citizens (94%-96%). (Afrobarometer) 09 October, 2024 (Namibia) Namibians Support Equal Access
To Jobs But Say More Needs To Be Done To Protect Women And Girls From
Discrimination And Harassment Namibia ranks eighth-best
out of 146 countries on the Global Gender Gap Index 2024, making it the
highest-ranked African country (World Economic Forum, 2024). Three-fourths
(74%) of Namibians support equal access to employment opportunities for men
and women, even when jobs are scarce. Men are less supportive than women of
gender equality in hiring (69% vs. 80%). (Afrobarometer) 15 October, 2024 (Ethiopia) Ethiopians Call For Greater
Climate Action By Government And Other Stakeholders Almost four in 10
Ethiopians (37%) say droughts have become more severe in their region over
the past 10 years, ranging from just 17% in the Benishangul-Gumuz region to
78% in Addis Ababa. Three in 10 (30%) report worsening floods, though this
ranges up to 79% in Addis Ababa. Fewer than half (47%) of citizens say they
have heard about climate change. Awareness is particularly low among women,
rural residents, and the least educated. (Afrobarometer) 21 October, 2024 WEST EUROPE (UK) Israel And Gaza, One Year On A YouGov survey in late
September found 18% of Britons saying they sympathised more with the Israeli
side, 28% with the Palestinian side, and 21% “both sides equally” – with a
further 33% unsure. In mid-2023, prior to the start of the current conflict,
a YouGov survey found 10% of Britons were more on the Israeli side, while 23%
backed the Palestinians more. One in five stood on the fence (19%), while 48%
answered “don’t know”. (YouGov UK) 07 October, 2024 How Do Britons Feel About The
First 100 Days Of Labour Government? Three in ten Britons (30%)
say they had expected Labour to do well in government, but have been left
disappointed by what they have seen so far, with only one in eight (12%)
saying their positive expectations have been met. For a further 37% of
Britons Labour’s poor performance is what they were expecting in the first
place. Nearly half of those who voted Labour in the election (47%) say they
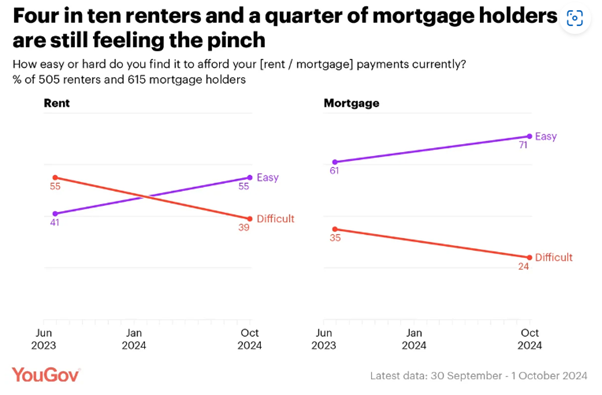
had positive expectations of Starmer’s government but feel let down so far. (YouGov UK) 11 October, 2024 Four In Ten Renters And A
Quarter Of Mortgage Holders Are Still Feeling The Pinch A quarter of Britons with mortgages
(24%) still say they are finding it difficult to afford their payments,
although this is down from 35% last year. However, a greater number are
concerned that housing will be hard to afford in a year’s time, with three in
ten saying so (31%); more than are currently finding it difficult. Two thirds
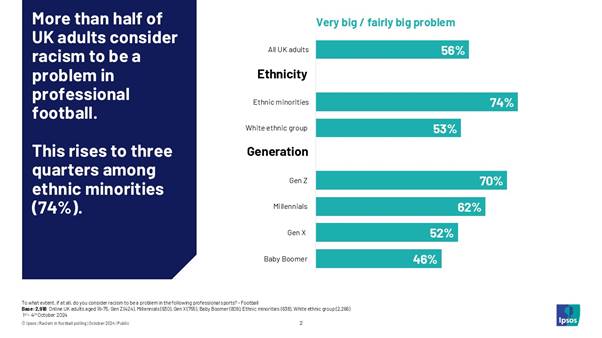
of renters (66%) report that their rent was increased in the past 12 months. (YouGov UK) 17 October, 2024 Over Half Of UK Adults View
Racism In Football As A Problem New polling from Ipsos
explores perceptions of the most serious challenges facing professional
football in Britain today. Amongst ethnic minorities, racism stands out as
the top concern, with over 4 in 10 (47%) citing it as a serious challenge. In
contrast, racism (37%) ranks as the third-most pressing issue for UK adults,
behind rising ticket prices (41%) and the wealth gap between richer and
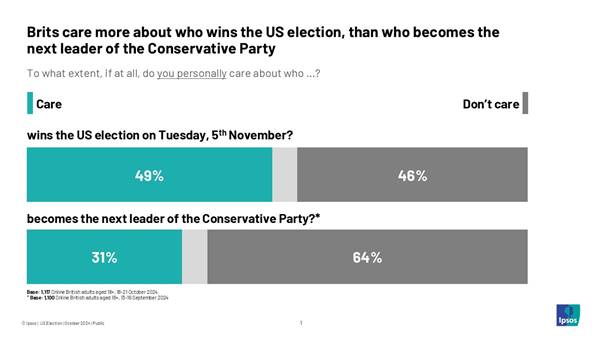
poorer clubs (38%). (Ipsos MORI) 22 October, 2024 More Britons Care About Who
Wins The US Election Than The Tory Leadership Race Almost half of Britons
(49%) say they personally care about the outcome of the US election, slightly
more than those who say they don't care (46%). The proportion of those who
say that they care about the US election (49%) is higher than the percentage
who say they care about the outcome of the Conservative leadership
race (31%). Awareness levels for both Trump and Harris are
significantly higher than for Tory leadership candidates Kemi Badenoch (24%)
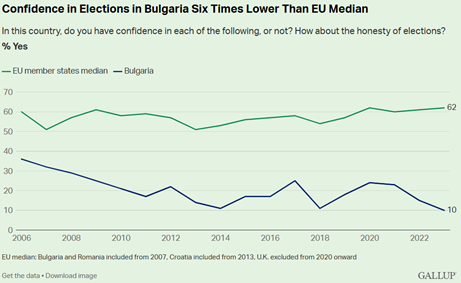
and Robert Jenrick (22%). (Ipsos MORI) 01 November, 2024 (Bulgaria) No One Trusts Elections Less
Than Bulgarians Bulgarians’ lack of
confidence in elections is not new. Gallup World Poll data from 2014 and 2018
highlighted similarly low Bulgarian confidence in the honesty of elections.
Since Gallup started measuring this indicator, the highest it has ever been
in Bulgaria is 36% in 2006. Confidence has ebbed and flowed since then but
has never approached a majority over the past 17 years. It briefly stabilized
between 2020 and 2021, only to dive again after the onset of the political
crisis in 2021. (Gallup) 22 October, 2024 NORTH AMERICA (USA) Most Americans Back Cellphone
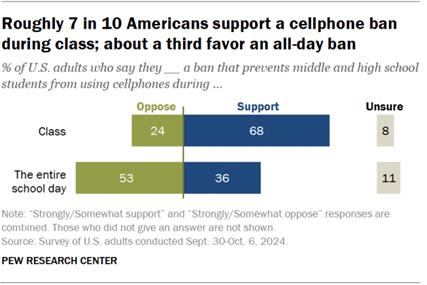
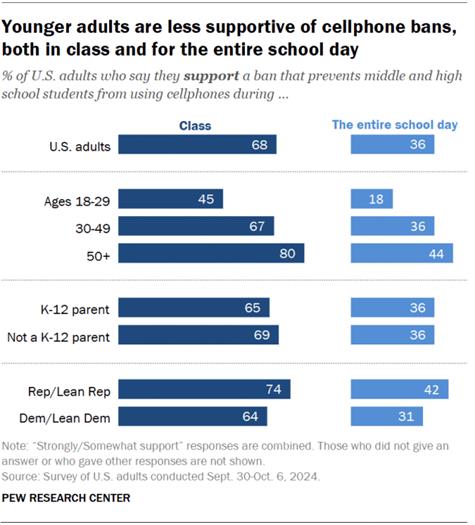
Bans During Class, But Fewer Support All-Day Restrictions Overall, 68% of U.S.
adults say they support a ban on middle and high school students using
cellphones during class, according to a Pew Research Center survey
conducted Sept. 30-Oct. 6, 2024. This includes 45% who strongly support this.
About one-third (36%) support banning middle and high school students from
using cellphones during the entire
school day, including at lunch as well as during and between
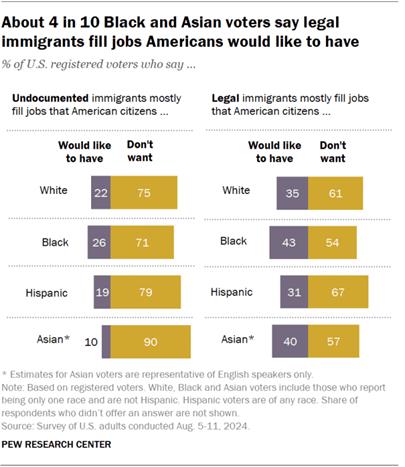
classes. By comparison, 53% oppose this more restrictive approach. (PEW) 14 October, 2024 Most U.S. Voters Say Immigrants
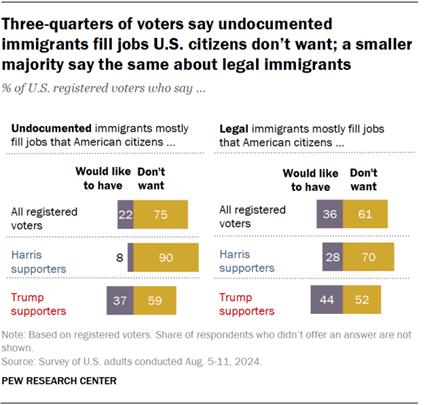
– No Matter Their Legal Status – Mostly Take Jobs Citizens Don’t Want Three-quarters of voters
say undocumented immigrants fill jobs citizens don’t want, while a lower
share (61%) say the same of legal immigrants, according to a Pew Research
Center survey conducted in August 2024. Nine-in-ten Asian voters say
undocumented immigrants mostly fill jobs that American citizens don’t want,
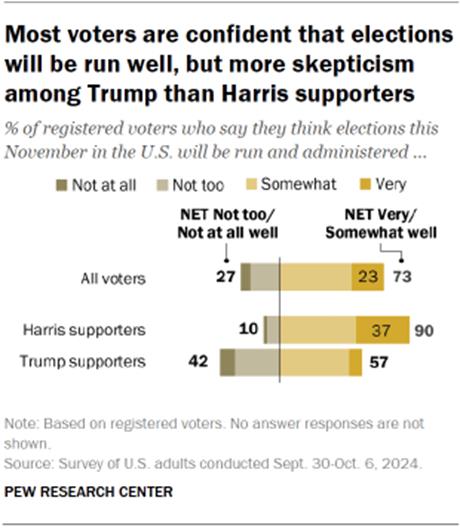
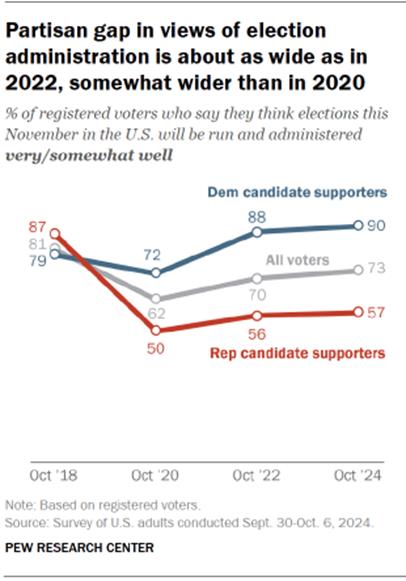
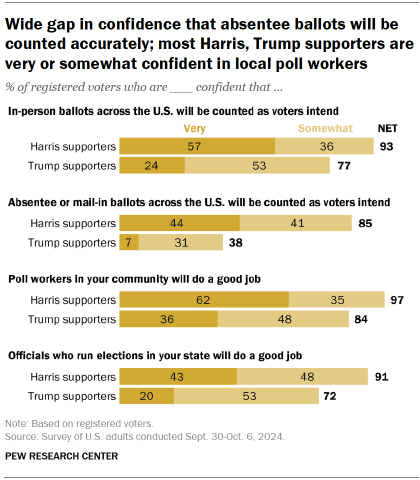
as do large majorities of Hispanic (79%), White (75%) and Black (71%) voters. (PEW) 21 October, 2024 Harris, Trump Voters Differ
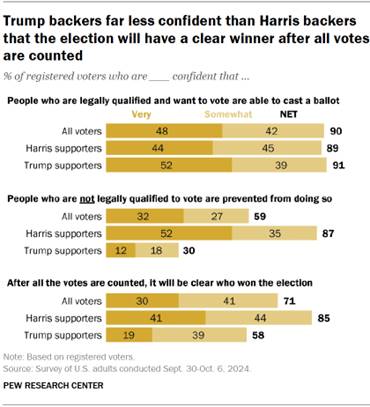
Over Election Security, Vote Counts And Hacking Concerns Harris supporters are more
optimistic about the way the election will be run: 90% say they are at least
somewhat confident that elections across the United States will be
administered well. This compares with 57% of Trump supporters who are
confident the election will be run smoothly. Harris supporters are more
confident than Trump supporters that, after all the votes are counted, it will be clear who won (85% vs.
58%). (PEW) 24 October, 2024 Majority Of Americans Aren’t
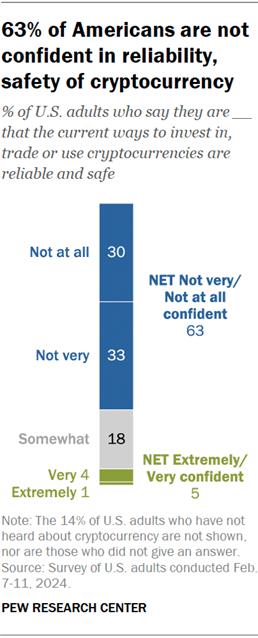
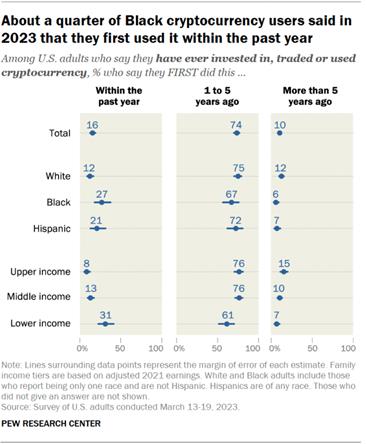
Confident In The Safety And Reliability Of Cryptocurrency Roughly six-in-ten
Americans (63%) say they have little to no confidence that current ways to
invest in, trade or use cryptocurrencies are reliable and safe. This includes
three-in-ten adults who say they are not at all confident, and a third who
say they are not very confident. Some groups of Americans are more concerned
than others about cryptocurrency. For instance, adults ages 50 and older are
more likely than younger adults to say they are not very or not at all
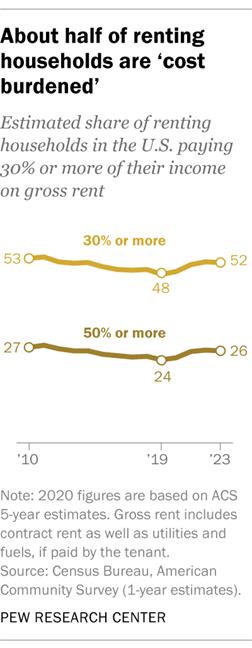
confident in its reliability and safety (71% vs. 55%). (PEW) 24 October, 2024 A Look At The State Of
Affordable Housing In The U.S. One commonly used (though also criticized) benchmark for housing affordability is
that no more than 30% of household income should go toward housing costs.
Households that spend more than that are considered “cost burdened” by the U.S. Department of Housing and
Urban Development. By that standard, 31.3% of American households were cost
burdened in 2023, including 27.1% of households with a mortgage and 49.7% of
households that rent, according to 1-year estimates from the Census Bureau’s
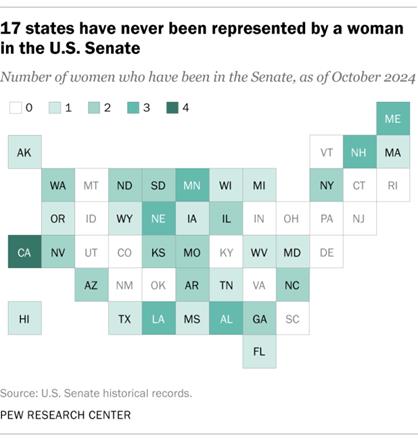
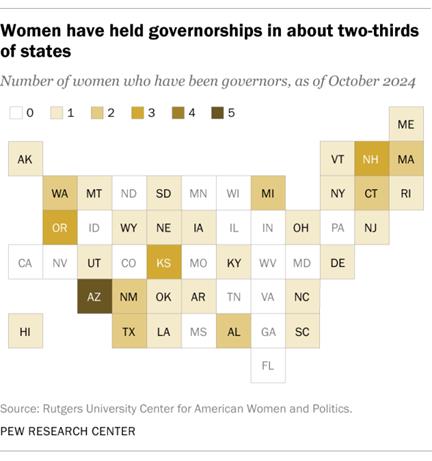
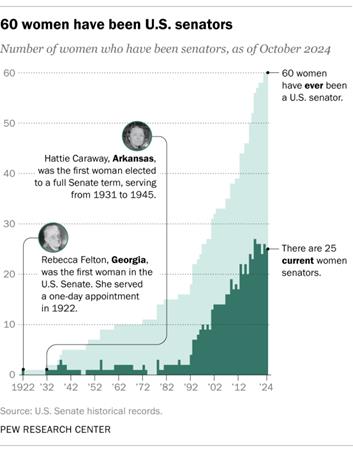
American Community Survey (ACS). (PEW) 25 October, 2024 17 States Haven’t Had A Female
U.S. Senator, And 18 Haven’t Had A Woman Governor If Kamala Harris wins the
presidency this November, she will be the first woman ever elected to the
highest political office of the United States. Overall, 17 states have never
had a female senator, according to a Pew Research Center analysis of Senate
historical records. This fall, Senate races in Delaware, Indiana, New Mexico,
Rhode Island and Utah each feature a woman nominee who could become the
state’s first. Among the 18 states that have never had a woman governor, two
– Indiana and Missouri – have a woman on the ballot in this year’s general
election. (PEW) 01 November, 2024 AUSTRALIA Risk Of Mortgage Stress Eases For Third Straight
Month The number of Australians
‘At Risk’ of mortgage stress has increased by 917,000 since May 2022 when the
RBA began a cycle of interest rate increases. Official interest rates are now
at 4.35%, the highest interest rates have been since December 2011, over a
decade ago. The number of Australians considered ‘Extremely At Risk’, is now
numbered at 1,082,000 (18.3% of mortgage holders) which is significantly
above the long-term average over the last 10 years of 14.6%. (Roy Morgan) 22 October, 2024 ANZ-Roy Morgan Consumer Confidence Jumps 4.1pts
To 87.5 – Highest Since January 2023 After Negative Sentiment Subsides Now nearly a quarter of
Australians, 24% (up 3ppts), say their families are ‘better off’ financially
than this time last year compared to 45% (down 4ppts) that say their families
are ‘worse off’. Views on personal finances over the next year have improved
this week with over a third of respondents, 34% (up 1ppt), expecting their
family to be ‘better off’ financially this time next year while only 29%
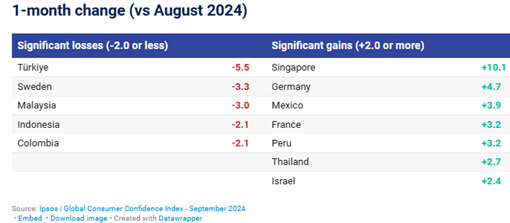
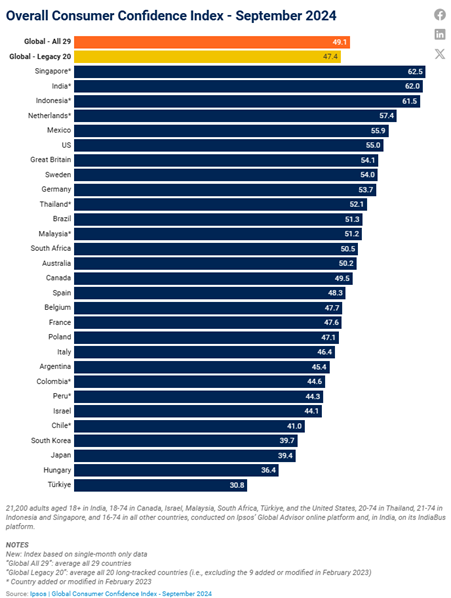
(down 2ppts), expect to be ‘worse off’. (Roy Morgan) 22 October, 2024 MULTICOUNTRY STUDIES Consumer Confidence Largely Up Latin American
Countries Among 29 economies
measured, seven show significant gains in consumer sentiment, and five show a
notable decline. Based only on the “legacy 20 countries” tracked since March
2010, the Index would read at 47.4, virtually unchanged (+0.1 point) from
August. The “legacy 20” index remains about two points higher than its
reading from this time last year. Sentiment is largely up in Latin America.
Mexico (+3.9 points) and Peru (+3.2 points) both show significant gains this
month. (Ipsos Global) 20 September, 2024 Source:
https://www.ipsos.com/en/september-2024-consumer-confidence-largely-latin-american-countries Understanding
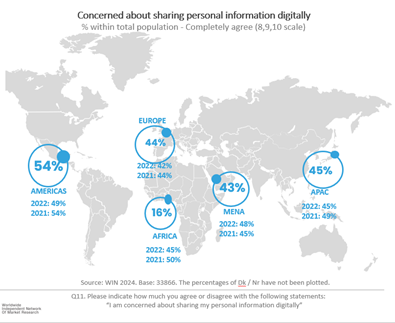
Digital Concerns, A Survey Across 29 Countries As digital connectivity
becomes increasingly integrated into daily life, concerns about privacy and
data security are on the rise. The survey reveals that 45% of respondents are
worried about sharing personal information online, while half of those surveyed
believe that social networks have become overwhelming. These statistics
underscore a significant global unease with the digital footprint we leave
behind. In Africa, only 16% of respondents feel they know what happens to
their data, while awareness is slightly higher in Europe at 25%. (WIN) 29 September, 2024 Source:
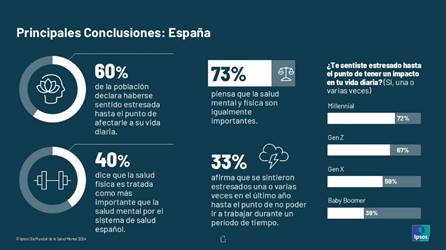
https://winmr.com/understanding-digital-concerns/ 45% Of The Population Considers Mental Health To
Be The Main Challenge Facing Society Mental health has
established itself as the world's greatest health concern for the third
consecutive year, surpassing even diseases such as cancer. Globally, 45% of
the population considers mental health to be the main challenge facing
society, a figure that rises to 59% in Spain, being the second European
country that most perceives it as such, only behind Sweden (68%). (Ipsos Global) 07 October, 2024 Source:
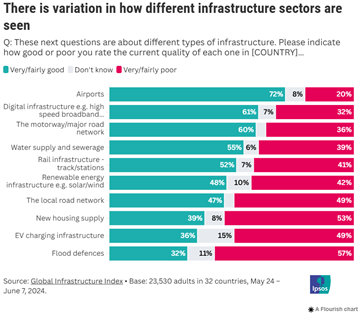
https://www.ipsos.com/es-es/informe-ipsos-dia-mundial-de-la-salud-mental More Than One In Two Feel Their Country Needs To
Do More On Its Infrastructure Needs; A Survey Across 32 Nations Overall ratings of
infrastructure and of specific sectors have improved over the past 12 months
according to the Ipsos/Global Infrastructure Investor Association (GIIA)
Global Infrastructure Index. But across 32 countries, an average of 56%
of citizens think their country is not doing enough to meet its
infrastructure needs. 68% agree that investing in infrastructure will create
new jobs and boost the economy. The Index finds considerable variation
in sentiment and priorities across the world, between and within
regions. (Ipsos Global) 14 October, 2024 Source:
https://www.ipsos.com/en/more-one-two-feel-their-country-needs-do-more-its-infrastructure-needs ASIA
865-871-43-01/Polls Over 60% Of Japanese Can Go A Month Without Reading A Book
From a funny online post
to a brief for work, it would be strange to go a day without reading
anything. However, books are no longer part of the norm for most
people. The Agency for Cultural
Affairs released the results on Sept. 17. The survey was conducted
from January to March with questionnaires mailed to people 16 and older
throughout Japan. Of 6,000 recipients, 3,559 responded. The previous surveys—all
before the COVID-19 pandemic—were conducted through face-to-face interviews.
Therefore, the results cannot be simply compared. Even so, “This is a
noteworthy figure,” a representative of the agency said, Those who answered they
read books were asked how they select which books to read. To the question, 57.9
percent (66.7 percent in the previous survey) said they selected books while
picking them up at a bookstore, while 33.4 percent (27.9 percent in the
previous survey) selected titles based on information from the internet. When asked about the
amount of reading, 69.1 percent said it has decreased. The most common reason for
the decrease was “Information devices (such as smartphones and game consoles)
take up my time” at 43.6 percent (36.5 percent in the previous survey). In previous surveys, many
respondents chose, “I am too busy with work or study and have no time to
read.” But in this survey, only 38.9 percent (49.4 percent in the previous
survey) chose this reason. Kaho Miyake, a literary
critic and author of “Naze hataraiteiruto honga yomenakunarunoka” (Why
working makes you unable to read books) noted another hurdle, this one
related to how media is formatted. “With the explosion of
social networking services for posting short videos and images, we have
become accustomed to getting information from short sentences, videos and
images without context on our smartphones," she said. "As a result,
I think the Japanese people as a whole have become disconnected from
long-form writing.” 19 September, 2024 Source:
https://www.asahi.com/ajw/articles/15432421
865-871-43-02/Polls 33% Support Ishiba Cabinet, Trailing 39% Non-Supporters
According to the
nationwide telephone survey conducted on Oct. 19-20, 53 percent of
respondents said they do not have high expectations for Ishiba’s economic
policies, below the 24 percent who said they have high expectations. The Asahi Shimbun
conducted a survey at a similar juncture before the previous Lower House
election in 2021, soon after Fumio Kishida became prime minister. In that survey, 42 percent
of voters said they supported the Kishida Cabinet, more than the 31 percent
who said they did not support it, and 45 percent of respondents said they did
not have high expectations for Kishida’s economic policies. In the latest survey,
taken only weeks after Ishiba took office on Oct. 1, respondents were asked
which party they would vote for in the proportional portion of the Lower
House election. Twenty-eight percent of
voters who do not support the Ishiba Cabinet chose the main opposition
Constitutional Democratic Party of Japan. Eleven percent selected
the Democratic Party for the People, and 10 percent picked Nippon Ishin
(Japan Innovation Party). Even among voters who do
not support the Ishiba Cabinet, 22 percent said they would vote for the LDP. Meanwhile, 30 percent of
voters who said they do not have high expectations for Ishiba’s economic
policies said they would vote for the LDP in the proportional representation
portion. The CDP was chosen by 25
percent of those respondents, while Nippon Ishin and the DPP were selected by
9 percent each. Sixty-three percent of
voters who support the Ishiba Cabinet and 61 percent of voters who have high
expectations for Ishiba’s economic policies said they would vote for the LDP. Thirty-two percent of
voters said they are greatly interested in the Oct. 27 election, and 66
percent said they will definitely go to the polls. Both figures are at low
levels, compared with results of similar surveys between 2005 and 2021,
although simple comparisons are difficult due to different survey methods and
targets. In the survey before the
2021 Lower House election, 32 percent of respondents, the same percentage as
this year, said they were greatly interested in the ballot. Sixty-eight percent, or
two points higher than this year, said they would definitely cast their
votes. In that election, voter
turnout in single-seat constituencies was 55.93 percent. The ratio of voters who
said they will definitely go to the polls this year was higher in upper age
brackets and lower in lower age brackets. Seventy-nine percent of
respondents in their 70s or older and 76 percent of those in their 60s said
they will cast their votes, compared with 53 percent of those in their 30s
and 39 percent of those between ages 18 and 29. 21 October, 2024 Source:
https://www.asahi.com/ajw/articles/15474042
865-871-43-03/Polls Dissatisfaction With Democracy Is Widespread In Japan Ahead
Of Snap Election
Japan’s new prime minister, Shigeru Ishiba, has
called a snap election for Oct. 27, saying he wants his administration to
face a public vote of confidence “as
soon as possible.”
Ishiba’s Liberal Democratic Party (LDP) has led Japan for nearly 70
consecutive years, but has been rocked by a
slew of recent scandals. Here are key facts about
Japan’s democracy ahead of the election, based on a Pew Research Center
survey of 1,003 Japanese adults, conducted Jan. 5-March 9, 2024. The survey
was fielded amid a slush fund scandal that resulted in the indictment of
several LDP lawmakers. Japan
is unique among highly developed democracies for having had only one governing
party for most of the last seven decades. The
Liberal Democratic Party has held power in Japan for 65 of the 69 years since
the party’s founding in 1955. In all other member states of the Organization
for Economic Cooperation and Development (OECD) – a group of mostly highly
developed, democratic countries – no party has held power for as much of the
last seven decades. Even some of the other
relatively long-serving parties in OECD countries, such as the Christian
Democratic Union in Germany and the Conservative Party in the United Kingdom,
have ruled their countries for fewer than five decades over this same time
period. While the LDP has remained
in power for decades, it often rules in coalition with other parties. For
example, it has relied heavily on its coalition with the Buddhist Komeito party since 1999.
Favorability
of Japan’s Liberal Democratic Party has declined significantly since
2023. As of this past
March, only 30% of Japanese adults had a favorable view of the LDP, while 68%
had an unfavorable view. This represents a sharp decline from 2023 and
marks the lowest favorability rating for the party in our seven years of
polling on the topic. Other political parties in
Japan are similarly unpopular today. For example, only 29% of Japanese adults
have a favorable view of the LDP’s main opposition party, the Constitutional
Democratic Party (CDP). Still, views of the CDP
have consistently been fairly negative, while the decline in views of the LDP
over the past year has been much more pronounced. Most
Japanese adults (56%) say they do not feel close to any political party. This
is far higher than the share of adults who do not identify with any political
party in other countries surveyed, as the Center has reported previously.
In Japan, a large majority
of people who do not feel close to any party also do not lean toward one particular party over
others. Indeed, only 21% of
Japanese adults say they support the LDP on a regular basis. Still, this is
far more support than any other party receives. The next closest are the
opposition Constitutional Democratic Party and Japan Innovation Party, at 4%
each. Low party enthusiasm may
also relate to low turnout. Previous analysis by Pew Research Center shows
that Japan is among the OECD countries with the lowest voter turnout, despite having automatic voter
registration.
Only
around a third of Japanese adults say they are satisfied with the way
democracy is working in their country today. This
marks the lowest point in a steady downward trend since 2019. Still, those with a
favorable opinion of the governing Liberal Democratic Party are much more
satisfied with democracy than those who have an unfavorable view of the LDP
(58% vs. 19%). This has consistently been the case in recent years. 22 October, 2024
865-871-43-04/Polls China Factory Surveys Show Economy Weakening, As Beijing
Steps Up Support
China’s economy weakened
further in recent weeks, surveys released Monday showed, signaling the need
for support as the government ratchets up stimulus. The Caixin purchasing
managers’ survey showed new manufacturing orders fell at the fastest pace in
two years in September. An official measure
released by the National Bureau of Statistics showed a less drastic decline
but it marked a fifth straight month of contraction. The purchasing managers
index was at 49.8 in September, up from a six-month low of 49.1 in August.
The index is on a scale where figures above 50 indicate expansion. The survey showed that
factory output rose while new orders fell. The main index smaller market in Shenzhen soared
8.2% while the Shanghai Composite index jumped 5.7% “The stimulus package
announced last week should help shore activity over the coming months,”
Gabriel Ng of Capital Economics said in a report. But he noted that
imbalances between excess supply of many products versus weak demand persist.
And trade measures against China, such as higher tariffs on electric vehicles
and other goods, also will weigh on the economy. “In this environment, a
meaningful cyclical recovery would require sizeable fiscal stimulus,” he
said. “There has yet to be any official announcement on fiscal support,
though some media reports suggest that one could come soon.” Over the weekend, Beijing
moved forward with the measures announced last week to support the property
industry and revive languishing financial markets. The central bank announced
on Sunday that it would direct banks to cut mortgage rates for existing home
loans by Oct. 31. Meanwhile, the major southern city of Guangzhou lifted all
home purchase restrictions over the weekend, while both Shanghai and Shenzhen
revealed plans to ease key buying curbs. Property developers have
struggled after the government cracked down on excessive borrowing for
projects several years ago. Housing prices have continued to fall and the
government has moved to ensure that developers deliver apartments that were
paid for but not yet built. The economy expanded at a
4.7% pace in the last quarter, slightly below the government’s target for
about 5%. 30 September, 2024 Source:
https://www.asahi.com/ajw/articles/15446724
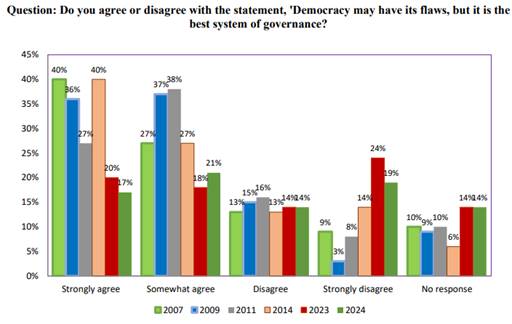
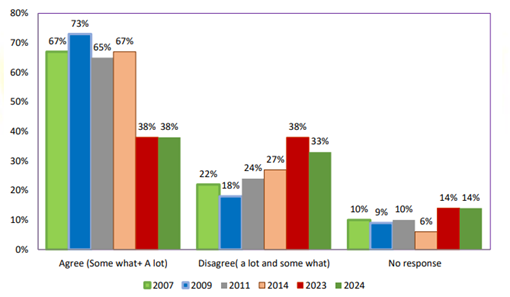
865-871-43-05/Polls The Percentage Of Pakistanis Who "Strongly Agree"
That Democracy Is The Best System Of Governance, Despite Its Flaws, Has
Plummeted From 40% In 2007 To 17% In 2024
According to a survey
conducted by Gallup & Gilani Pakistan, trust in democracy as the best
form of governance has declined significantly, with only 17% of respondents
strongly agreeing in 2024 in response to the question, "Do you agree or
disagree with the statement, 'Democracy may have its flaws, but it is the
best system of governance?' When asked the same question in 2007, as high as
40% had expressed a similar opinion. Gallup Pakistan
has asked nationally representative samples of adult men and women about
their views on democracy for nearly two decades, revealing a growing
skepticism toward its effectiveness as a governing system. Comparative
Picture: In 2024, 17% of respondents said they strongly agree; 21% somewhat
agree; 15% neither agree nor disagree; 14% disagree; 19% strongly disagree;
and 14% gave no response. Trend Analysis: The survey data reveals notable
changes over the years. In 2007, 40% of respondents strongly agreed, while
27% somewhat agreed; 13% disagreed, and 9% strongly disagreed, with 10%
giving no response. By 2009, those who strongly agreed dropped to 36%, and
somewhat agreeing increased to 37%, while 15% disagreed and 3% strongly
disagreed; 9% did not respond. In 2011, support continued to decline, with
only 27% strongly agreeing and 38% somewhat agreeing; 16% disagreed, and 8%
strongly disagreed, with 10% not responding. The trend saw a temporary return
in 2014, where 40% strongly agreed and 27% somewhat agreed; however, 13%
disagreed and 14% strongly disagreed, with 6% giving no response. By 2023,
support for democracy significantly declined, with only 20% strongly agreeing
and 18% somewhat agreeing; 10% chose neither agree nor disagree, 14%
disagreed, 24% strongly disagreed, and 14% did not answer. In 2024 the trend
continued, with 17% strongly agreeing, 21% somewhat agreeing, 15% neither
agreeing nor disagreeing, 14% disagreeing, and 19% strongly disagreeing,
while 14% did not respond. This data suggests growing skepticism about
democracy as the best governance, reflecting a shift in public perception
over time. The fluctuating responses indicate a need for further exploration
of the factors influencing these opinions, as confidence in democratic
governance appears to wane.
17 October, 2024 Source:
https://gallup.com.pk/wp/wp-content/uploads/2024/10/17.10.24.History-poll-1.pdf
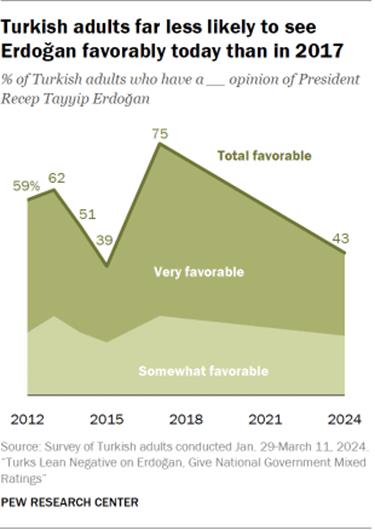
865-871-43-06/Polls Turks Lean Negative On Erdoğan, Give National
Government Mixed Ratings
In May 2023, voters in
Turkey elected Recep Tayyip Erdoğan to his third term as president. Less than a year later,
Erdoğan’s Justice and Development party (AKP) suffered its worst-ever electoral defeat in local elections. In
the time between these two elections, Pew Research Center surveyed 1,049
Turkish adults. The results show negative opinions of Erdoğanand mixed
views of the national government he leads. Overall, 55% of Turkish
adults have an unfavorable opinion of Erdoğan, while 43% have a
favorable opinion. This marks a 32 percentage point decrease in favorability
from 2017, including a 27-point drop in the share of Turks with a very favorable opinion of their
president. The 2017
survey was conducted eight months after Erdoğan and his government
survived a coup attempt by a
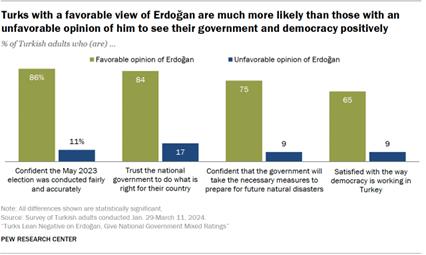
faction of the military. Support for Erdoğan is a key factor in Turkish public
opinion on domestic and international topics alike. Compared
with those who have an unfavorable opinion of the president, Turkish adults
who see Erdoğan favorably are:
Age is another key indicator of public opinion on several
topics. For
example, adults ages 50 and older are more positive toward Erdoğan and
the national government when compared with adults ages 18 to 34. Frequency of prayer among the 98% of Turks who are Muslim is also tied to views of multiple
issues. Muslim adults who pray
more frequently (one of the Center’s measures of
religiosity) have more confidence that the 2023 election was
conducted fairly and accurately, for instance. Below
are some other key findings from the survey, which marks the first time since
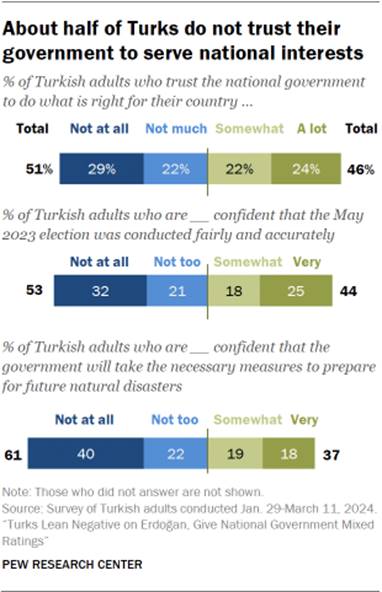
2019 that Pew Research Center has polled in Turkey. Confidence in the government
Overall,
Turkish adults express limited
confidence in their national government. Roughly
half (51%) say they do not trust the government to do what is right for the
country. A similar share (53%) is not confident that the May 2023
presidential election was conducted fairly and accurately. And about a year
after a 7.8 magnitude earthquake hit Turkey – leaving more than
50,000 dead – 61% of Turks are not confident that the
government will take the necessary steps to prepare for future natural
disasters. Jump to Chapter 1 for more on how people in Turkey view their
government. Views of democracy Is Turkey a democracy? Turkey
is a parliamentary
democracy, according to its constitution. In practice, the
government is classified as a “hybrid regime” by the Economist
Intelligence Unit, an
“electoral autocracy” by the Varieties of
Democracy project, and “not free” by Freedom
House. Two-thirds
of Turks are dissatisfied with the way democracy is currently working in
their country. But democracy itself – in both representative and direct form
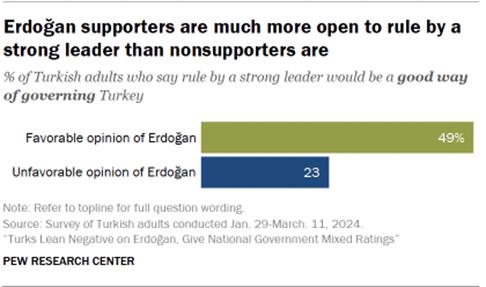
– is still a popular idea. Majorities of Turks say representative and direct democracy
would be good ways to govern Turkey (80% and 79%, respectively). And 59% say rule
by experts, sometimes called technocracy, would be a good system of
government.
Much
smaller shares say rule by a strong leader (34%) or by the military (14%) are
good options. However, Turks with a positive view of Erdoğan are
significantly more likely than nonsupporters to say each of these
nondemocratic systems would be a good way to govern Turkey. Jump to Chapter 2 for more on how people in Turkey view democracy. Views of institutions and societal conflicts
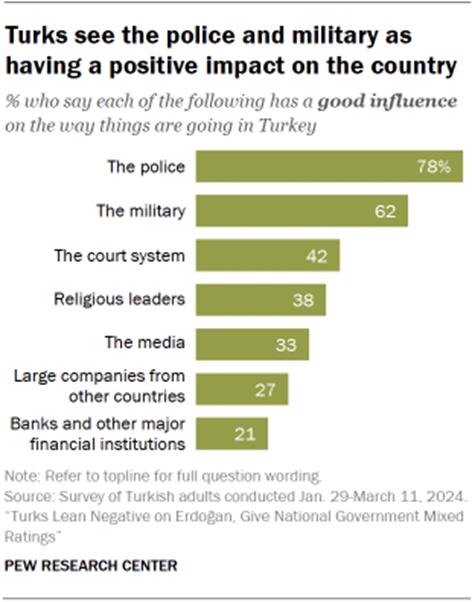
In
Turkey, majorities say the police and
the military have a positive impact on Turkish society (78%
and 62%, respectively). On
the other hand, a third of adults or fewer say the media, large international
companies, and banks and other financial institutions have a positive
influence. When
it comes to tensions within their society, Turks see especially strong
conflicts between people who support different political parties. Fewer Turks
– though still a majority – say there are strong conflicts between people
with different ethnic identities. Notably, in a country where a vast
majority of people are Muslim, about half
of adults (47%) say there are strong conflicts between Turks who practice
different religions. Jump to Chapter 3 for more on how people in Turkey view institutions
and conflicts in their society. Views of international affairs
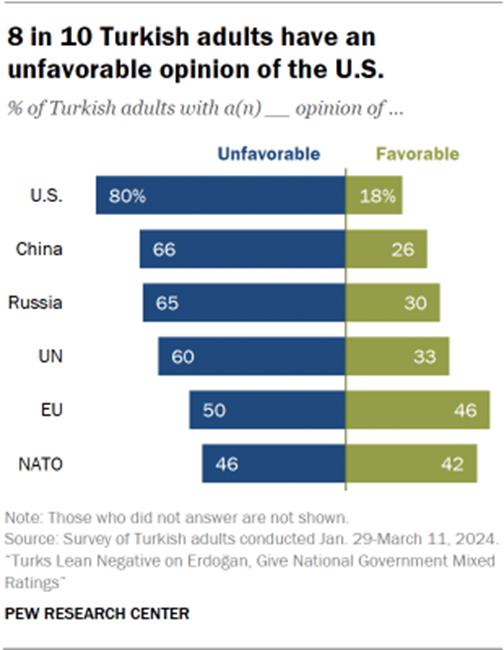
When
it comes to foreign relations, Turks
give mostly negative ratings to other countries and their leaders. Majorities
have unfavorable opinions of the United States, China and Russia, and most
lack confidence in their respective presidents. Turks also report low trust
in other international political leaders – including former U.S. President
Donald Trump. Turks
have somewhat more positive opinions of NATO and the European Union. Since
our last survey of Turkey in 2019, the share of adults with a positive view
of NATO has doubled, though
overall opinions of the alliance are still mixed. The share of Turks with a
favorable view of the EU is up 12 points since 2019. And a majority of Turks
(56%) favor their country becoming a member of the EU.
Views
of several countries and international organizations are related to support
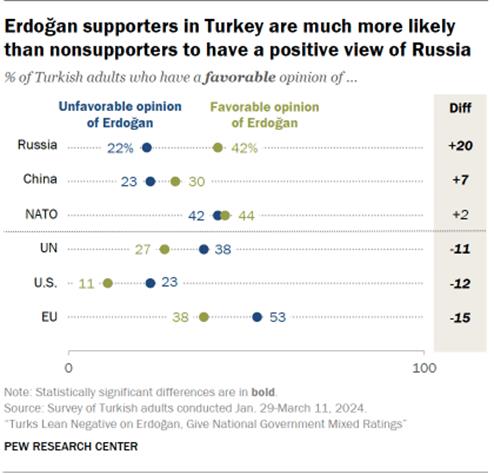
for Erdoğan. For example, Turks with a favorable opinion of Erdoğan are more likely
than those with an unfavorable opinion of him to see Russia and China
positively. In turn, Turks with an unfavorable opinion
of Erdoğan are more likely than those with a favorable opinion of him to
see the EU, U.S. and United Nations positively. 16 October, 2024 MENA
865-871-43-07/Polls Palestinians See U.S. Response To Gaza As Failure
Palestinians
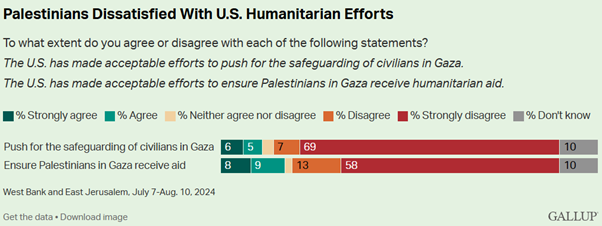
View U.S. Efforts to Safeguard Civilians as Insufficient In surveys conducted in
July and August, Palestinians living in the West Bank and East Jerusalem were
asked to what extent they agree that “the U.S. has made acceptable efforts to
push for the safeguarding of civilians in Gaza.” Seven
in 10 Palestinians surveyed (69%) strongly disagree, while 76% disagree
overall. About one in 10 (11%) agree that the U.S. has done enough to protect
civilians. Despite the Biden
administration’s efforts to ensure humanitarian aid reaches Gazans, including
via a now dismantled floating pier the U.S. military completed in May,
Palestinians view these efforts only slightly more favorably. Asked if the
U.S. has done enough to ensure that Palestinians in Gaza receive humanitarian
aid, 71% disagree, including 58% who strongly disagree. A United Nations Office
for the Coordination of Humanitarian Affairs report released roughly at the
same time as the survey showed that more than 1 million in southern and
central Gaza received no rations at all.
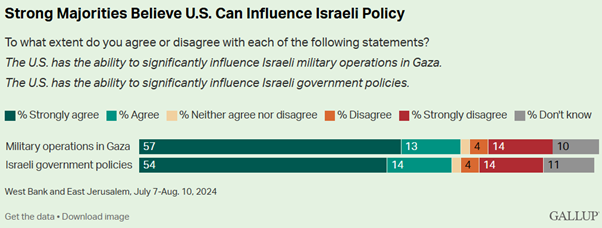
Palestinians
Believe U.S. Can Significantly Influence Israeli Policies Two in three Palestinians
in the West Bank and East Jerusalem (68%) agree with the statement that “the
U.S. has the ability to significantly influence Israeli government policies,”
including 54% who strongly agree. Further, 70% believe the
U.S. holds significant influence over Israeli military operations, including
57% who strongly agree. Fewer than one in five Palestinians in the two
territories surveyed disagree to some extent that the U.S. has major
influence over Israeli policies (18%) or military operations (18%).
That the U.S. has not been
able to negotiate a permanent ceasefire in the conflict, despite its
influence, is likely only compounding Palestinians’ frustration with the U.S.
for not doing more to safeguard civilians or the delivery of humanitarian
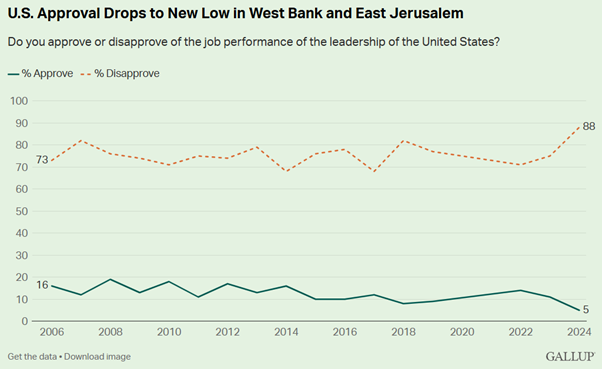
aid. Record
Few Approve of U.S. Leadership Amid this context,
Palestinian views of U.S. leadership -- which were already poor -- have hit
rock bottom. Just 5% of Palestinians in the West Bank and East Jerusalem now
approve of U.S. leadership, the lowest in Gallup’s annual trend dating back
to 2006. The 88% of Palestinians in the West Bank and East Jerusalem who
disapprove of U.S. leadership marks a new high. Since 2006, Palestinians
in these two areas have been among the bottom six of 140 countries or areas
each year for U.S. approval. And Palestinians’ 5% approval of the U.S. in
2024 ranks among the 10 lowest U.S. approval ratings that Gallup has ever
recorded anywhere in nearly two decades.
Bottom
Line With the war in Gaza
nearing the one-year mark, the conflict increasingly carries implications for
both U.S. domestic politics and U.S. diplomacy as the two intertwine in a
presidential election year. Record-low U.S. approval
ratings among Palestinians highlight the challenge for U.S. credibility and
influence in the Muslim world, where the Palestinian cause remains both a
popular and emotional issue. The perceived failure of
the United States to improve the humanitarian situation in Gaza has the
potential to undermine its diplomatic efforts and alliances, as well as cost
Vice President Kamala Harris crucial votes in the presidential election. 03 October, 2024 Source:
https://news.gallup.com/poll/651359/palestinians-response-gaza-failure.aspx AFRICA
865-871-43-08/Polls 51% Of Citizens Say Nigerians Are Not United
A new public opinion poll conducted by NOIPolls in
commemoration of Nigeria’s 64th Independence Day has revealed that 51 percent
of adult Nigerians nationwide stated nigerans are not united. However,
further findings indicated that 79 percent of Nigerians take pride in
being citizens of Nigeria mainly because it is their fatherland (84 percent)
and they have nowhere else to call home. On the flipside, 21 percent lamented
they were not proud being Nigerian mainly due to the economic hardship (33
percent) currently facing the country. Other reasons
mentioned include there is nothing to be proud of (26 percent), high cost of
living (19 percent), bad governance (12 percent) as well as bad leadership (6
percent). Subsequently, the survey
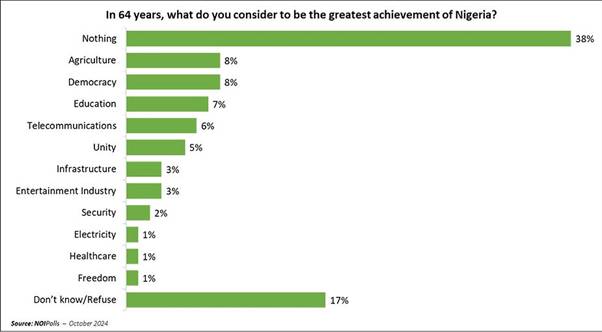
sought to know respondents’ opinion on what they consider to be the greatest
achievement of Nigeria since it attained the status of Independence in 1960.
Findings showed that 38 percent of adult Nigerians lamented that Nigeria as a
nation has not achieved anything in the past 64 years. However, a few
respondents were still able to pinpoint some achievements the country has
made since her Independence. The top four achievements include agriculture (8
percent) and democracy (8 percent), education (7 percent), and
telecommunications (6 percent) amongst others. When asked about the
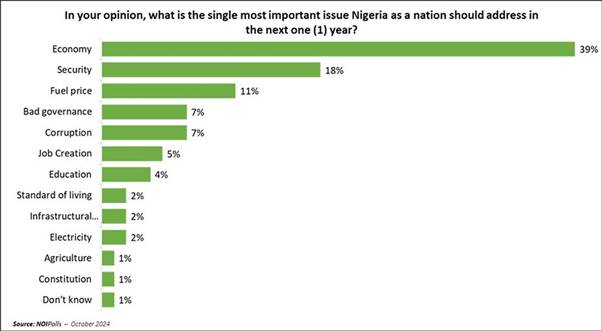
single most important issue Nigeria as a nation should address in the next
year, 39 percent of Nigerians mentioned the economy, closely followed by
insecurity (18 percent). Other issues mentioned are fuel price (11 percent),
bad governance (7 percent), corruption (7 percent), job creation (5 percent),
education (4 percent), standard of living, infrastructural development, and
electricity (2 percent each). Similarly, when
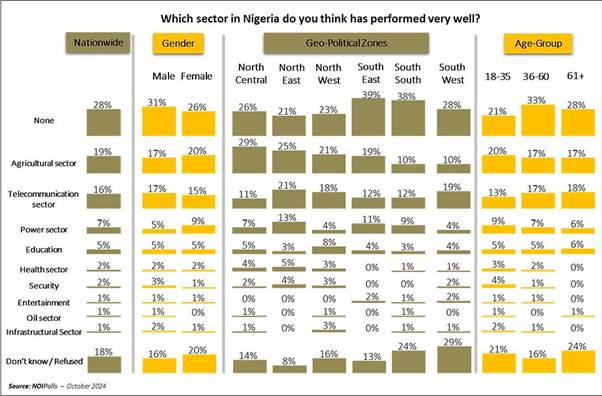
respondents were asked, which sector they think has performed well,
unfortunately, 28 percent stated none. However, agriculture (19 percent),
telecommunication (16 percent), power sector (7 percent), and education
(5 percent) sector were given a thumbs up on performing well. These are some
of the key findings from the Independence Day poll conducted in the week
commencing 23rd September 2024. Survey
Background Independence Day, known
colloquially as October First, is an official national holiday in Nigeria,
celebrated on 1 October and it marks Nigeria's proclamation of independence
from British rule on 1 October 1960[1]. The holiday is celebrated
annually by the government of Nigeria. The festivities begin with the
President's address to the nation, which is broadcasted on radio and
television, celebrations across sectors including the Nigerian Armed Forces,
the Nigeria Police Force, the Ministry of Foreign Affairs, the workforce[2]. The streets are filled with celebrations
by individuals and groups wearing green-white-green. In recent years public
disillusionment has led to muted celebrations, due to the state of the
economy and lingering ethnic tensions and insecurity[3]. As observed by Sheriffdeen Adewale Tella,
a Nigerian academic economist and Professor of Economics at the Olabisi
Onabanjo University, reported in the punch newspaper publication of September
30th, 2024, with the caption ‘’Shall we celebrate?’, Nigeria will be
celebrating her flag independence tomorrow in low key as usual[4]. Adewale noted that the last five years
have been tougher than the five before it[5]. It is difficult to remember when the
independence ceremony was held with fanfare[6]. The previous two decades have been years
of mixed feelings[7]. Similarly, the Coalition
of United Opposition Political Parties, CUPP, in a Press release issued by
its National Spokesperson, Comrade Mark Adebayo, on the celebration of the
country’s 64th Independence anniversary says “It is difficult to congratulate
Nigerians on this occasion of the 64th Independence Anniversary because there
is really nothing to celebrate. Independence is not an end in itself but was
supposed to be a means to an end that translates into development, security,
peace, and unity. But on all these indices, Nigeria is a crawling giant due,
fundamentally, to the unfortunate succession of crude, heavily corrupt,
unpatriotic, incompetent, and myopic leadership that has bedevilled this
country since flag independence[8]. He lamented that each administration is
worse than the last one[9]. In 1960 at Independence, Nigeria held a
huge promise as the giant of Africa and the light of all blacks globally with
enormous potentials to be among the most developed in the comity of nations.
But alas, the foster elites that took over from the colonialists, plus the
military and civilian politicians that followed them made looting of the
country’s resources a fundamental policy of government[10]. Nigeria’s current Senate
President, Godswill Akpabio, speaking on Sunday, the 29th of September
2024, at an inter-denominational church service held at the National
Christian Centre, Abuja, to mark the country’s 64th Independence Anniversary
reported by ThisDay Newspaper publication of September 30th, said despite the
increasingly bumpy times, Nigeria will triumph definitely[11]. Akpabio urged citizenry to be patient and
hopeful, saying Nigeria’s brightest days are ahead[12]. Against this backdrop on the Independence
Day Anniversary, NOIPolls conducted a survey to gauge the opinions of
Nigerians regarding Nigeria’s progress since independence. Survey
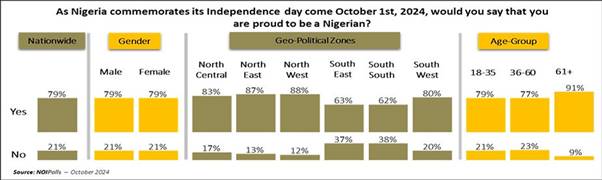
Findings The first question sought
the opinion of adult Nigerians about being proud Nigerians as the country
commemorates its 64th independence come October 1st, 2024. The survey result
showed that majority of respondents (79 percent) revealed they are proud being
Nigerians. This assertion cuts across gender, age groups and geo-graphical
locations with at least 62 percent representation. On the flipside, only 21
percent said they were not proud of being a citizen.
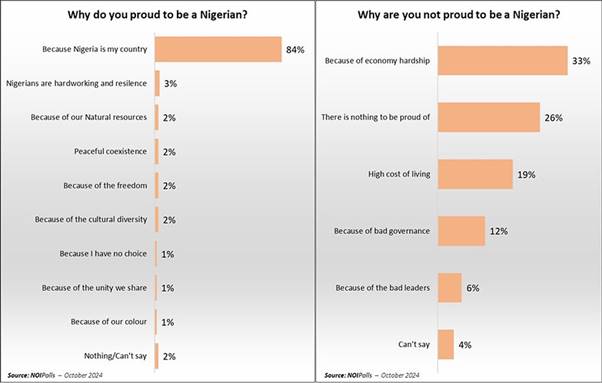
Patriotism in Nigeria
Subsequently, respondents
(79 percent) who stated they are proud being Nigerian were further probed on
why they are proud being Nigerians and 84 percent said it is because Nigeria
is their country amongst other reasons. Similarly, respondents (21 percent)
who expressed not being proud to be Nigerian were also probed for why and 33
percent mentioned economic hardship (33 percent) as a top reason. This is
followed by 26 percent who said there is nothing to be proud of, 19 percent
who pointed out high cost of living and 12 percent who cited bad governance
amongst other reasons.
Reasons for patriotism
In addition, the survey
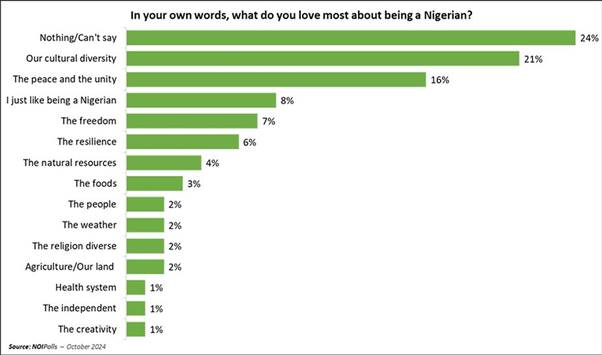
also sought to know what respondents love most about being Nigerian.
Unfortunately, findings showed that 24 percent of respondents said there is
nothing to love about being a citizen of Nigeria. On the other hand, 21
percent mentioned cultural diversity as what they love the most about being
Nigerian amongst other reasons.
What citizens love most
about Nigeria
Furthermore, in gauging
the opinion of Nigerians on the single most important issue the country needs
to address in the next one year. The findings showed 39 percent of the
respondents mentioned the economy, insecurity (18 percent), fuel price (11
percent), bad governance (7 percent), corruption (7 percent), job creation (5
percent), and education (4 percent) amongst others important issues
mentioned.
Top issues to be addressed Interestingly, survey
result showed that 38 percent of respondents polled affirmed that Nigeria has
not achieved anything since her Independence 64 years ago. On the contrary,
some respondents believe the country has recorded some great achievements
around agriculture (8 percent), democracy (8 percent), education (7 percent)
and telecommunication (6 percent) amongst other achievements mentioned. More
findings also revealed that 17 percent of Nigerians interviewed do not
know/refused to disclose their stance.
Nigeria's greatest achievement
Consequently, when asked
which sector in Nigeria they think has performed very well, the result showed
that 28 percent of Nigerians said none. However, agriculture (19 percent),
telecommunication sector (16 percent), power sector (7 percent) were the top
mentioned sectors respondents believe to have performed well.
Performance across sectors
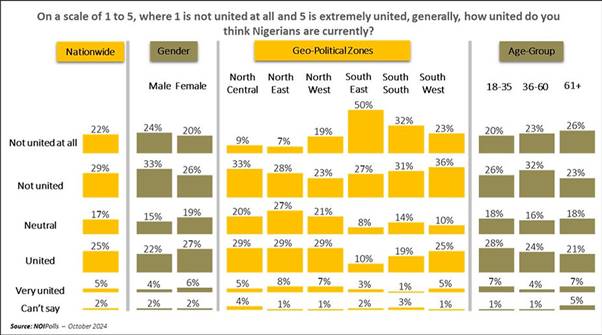
Finally, the survey sought
to know how united Nigerians are using a scale of one to five, and findings
showed that slightly more than half of the respondents surveyed (51 percent)
believe that Nigerians are not united as opposed to 27 percent who believe
citizens are united.
Unity in Nigeria Conclusion In conclusion, the survey
result showed that 24 percent of adult Nigerians have revealed that there is
nothing to love about being Nigerian. Although most Nigerians (79 percent)
are proud being Nigerians mainly because Nigeria is their
country/fatherland. More so, findings revealed 38 percent of respondents
do not consider that the country has achieved anything in the past 64 years
since her Independence. Nigerians want the government to tackle
important issues such as economy (39 percent), security (18 percent), fuel
price (11 percent), bad governance (7 percent) and corruption (7 percent)
within the next one year. 02 October, 2024 Source:
https://www.noi-polls.com/post/independence-day-poll
865-871-43-09/Polls Mauritians Approach Election With Diminished Confidence In
The Freedom Of Their Press
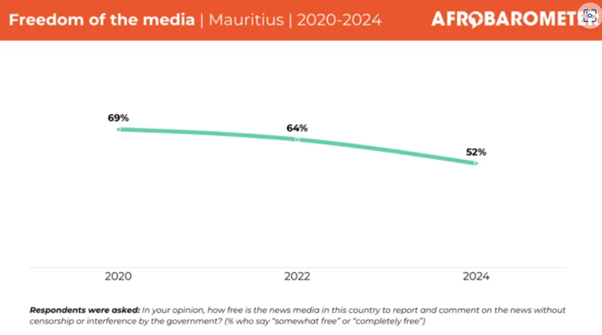
Mauritius ranks 57th out
of 180 countries in the 2024 World Press Freedom Index – still among the top
10 (at No. 9) in Africa, but a far cry from its glory days atop the
continent’s rankings in 2007 (Reporters Without Borders, 2024; Okafor, 2024;
News Moris, 2022). Over the past three years,
the V-Dem Institute (2024) has been warning of democratic backsliding in
Mauritius, specifically highlighting concerns about press freedom and freedom
of expression (News Moris, 2024). Crackdowns on media freedom are evidenced by
the arbitrary arrest of journalists, changes to broadcasting and digital
legislation that impede investigative journalism, sanctions against some
private radio stations that don’t toe the government line, and the
weaponisation of the police for political ends (Kasenally, 2022). In addition, the country’s
long-awaited Freedom of Information Act has yet to see the light of day
(Ramsamy, 2023). Media activists argue that the adoption of this act would
enhance transparency, improve government accountability, disincentivise the
spread of fake news and disinformation, strengthen the fight against
corruption, boost the functioning of state institutions, and promote ethical,
investigative journalism (Bunwaree, 2020). As the campaign for the
November general election intensifies, how do ordinary Mauritians see the
role and realities of their media? The latest Afrobarometer
survey findings show that Mauritians overwhelmingly want their media to act
as a watchdog over the government, constantly investigating and reporting on
government mistakes and corruption. Citizens value media freedom and reject the
notion that the government should be able to prevent publications it
disapproves of. And while more than half of citizens believe that media
freedom exists in practice in their country, a growing minority see the media
as not free. Television and radio are
the most popular news sources in Mauritius, but social media plays an
important role, too, regularly providing news to more than eight in 10
citizens. Key findings
09 October, 2024
865-871-43-10/Polls Namibians Support Equal Access To Jobs But Say More Needs
To Be Done To Protect Women And Girls From Discrimination And Harassment
Namibia ranks eighth-best out of 146 countries on
the Global Gender Gap Index 2024, making it the highest-ranked African
country (World Economic Forum, 2024). It shares the
No. 1 spot globally for educational attainment and health/survival and ranks
17th for economic participation and opportunity and 21st for political
empowerment. But despite its impressive performance, meaningful gender gaps
exist in wage equality (ranked 90th), ministerial positions (46th), and
number of years with female head of state (17th). In this election year,
public attention in Namibia will be on women’s participation in the country’s
political processes, both as candidates and as voters. After the 2014
National Assembly elections, the ruling SWAPO Party implemented a
“zebra-style” party list alternating male and female candidates, which
increased the number of women in the National Assembly. Only three of the 10
opposition parties have women MPs, including the largest, the Popular
Democratic Movement (PDM), with women in 44% of its 16 parliamentary seats
(Institute for Public Policy Research, 2020). These developments have given
Namibia gender parity (50% women) in Parliament, with the fifth-highest
proportion of women in legislative positions in the world, behind Rwanda,
Cuba, Nicaragua, and Mexico (Inter-Parliamentary Union, 2024). Although men continue to
dominate the leading positions on most party lists, the SWAPO Party has
elected Netumbo Nandi-Ndaitwah as its first female presidential candidate,
paving the way for Namibia to possibly have its first woman president. She is
joined in the race for State House by four women running as independent
candidates – Lisbeth Kaumbi, Rosa Namises, Lydia Kandetu, and Ally Angula
(Matheus, 2024). Despite progress in the
political sphere, gender disparities persist in the labour force, with women
experiencing significantly lower levels of full-time employment than men
(Kalimbo, 2018). The labour force participation rate for women is notably
lower than for men, and women are underrepresented in the formal sector. Even
controlling for educational attainment and occupation, men continue to earn
considerably more than women across most industries. According to UN Women
(2021), Namibia has made great strides in developing legal frameworks to
promote, enforce, and monitor gender equality. Yet only about one-third of
the indicators needed to monitor the Sustainable Development Goals (SDGs)
from a gender perspective are available. As a result, the exact extent of
gender imparity in Namibia remains unknown. The latest Afrobarometer
survey in Namibia shows that most citizens support gender-equal opportunity
in politics and employment, though some Namibians say it is common for
spouses or other family members to be unsupportive of women taking paid
employment. Minorities also report
that girls in their communities frequently face discrimination, harassment,
and requests for sexual favours from teachers and that women are often
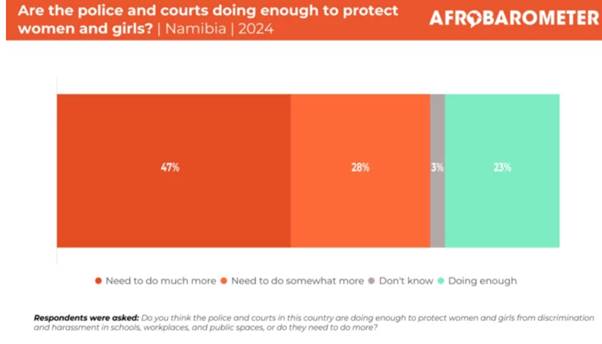
sexually harassed in markets, public transport, and other public spaces. Only half of Namibians say
that women and girls who complain about being discriminated against or
harassed are likely to be believed, and most say the police and courts should
do more to protect them against such treatment. Key findings
15 October, 2024
865-871-43-11/Polls Ethiopians Call For Greater Climate Action By Government
And Other Stakeholders
Ethiopia is highly
susceptible to climate-related disasters. Cumulatively, the impact of its
2021- 2023 drought on the country’s arid and pastoral regions ranks among the
most severe in the past four decades (World Bank, 2024; United Nations
Office for the Coordination of Humanitarian Affairs, 2023). Effects of
the drought were compounded by conflicts in certain regions,
complicating humanitarian aid and access to resources (Yibeltal &
Kupemba, 2023). Concurrently, heavy rains triggered flooding in some
regions, exacerbating the vulnerabilities of communities already
grappling with the effects of the prolonged drought (Davies, 2023;
Demisse, 2022). Climate-induced shocks
pose risks to public health, livelihoods, infrastructure, and
agricultural productivity. Ethiopia’s annual gross domestic product
losses due to climate impacts are projected to rise from 1%-1.5% to
5%-10% by the 2040s, underscoring the urgent need for resilient climate
strategies and sustainable development practices (World Bank, 2010,
2024). Through its
Climate-Resilient Green Economy strategy, Ethiopia aims to transition to a
green economy and achieve middle-income status by prioritising
climate-smart agriculture, forest restoration, renewable energy expansion,
and energy-efficient industries. Further, under its updated Nationally
Determined Contributions to the Paris Agreement, Ethiopia has committed
to reducing greenhouse gas emissions by 68% by 2030, up from its initial
target of 64%, reaffirming its commitment to tackling climate change
(World Bank, 2021). This dispatch reports on a
special survey module included in the Afrobarometer Round 9 (2021/2023)
questionnaire to explore Africans’ attitudes and perceptions related to
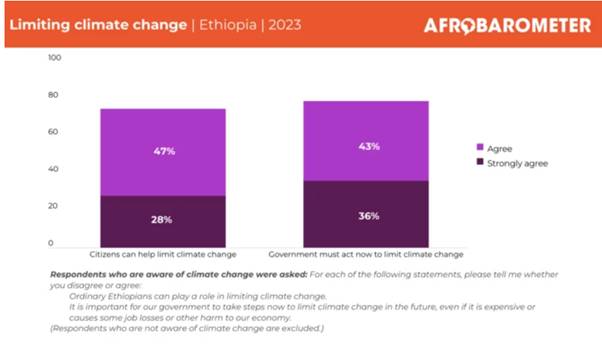
climate change. Findings show that fewer
than half of Ethiopians have heard of climate change. Among those aware
of climate change, a majority say the government is doing a good job of
addressing the threat. Nonetheless, there is a broad consensus that stronger
action is needed, with large majorities calling for greater engagement
by the government, business and industry, developed countries, and
ordinary citizens. Key findings
21 October, 2024 WEST EUROPE
865-871-43-12/Polls Israel And Gaza, One Year On
12
months into the current conflict, YouGov looks at how sentiments have
changed, whether either side is seen as being in the right, and what should
happen now Today marks one year since
Hamas fighters launched a surprise attack on Israel, killing approximately
1,200 civilians and taking a further 250 hostages. In response, Israel
launched retaliatory strikes on Gaza, followed by a ground invasion. The
fighting is estimated to have killed more than 40,000 Palestinians to date,
with the conflict having recently expanded into Lebanon. This study draws on YouGov
data from the past year, as well as a new survey for the Sunday Times, to
explore where attitudes to the conflict stand 12 months on. How
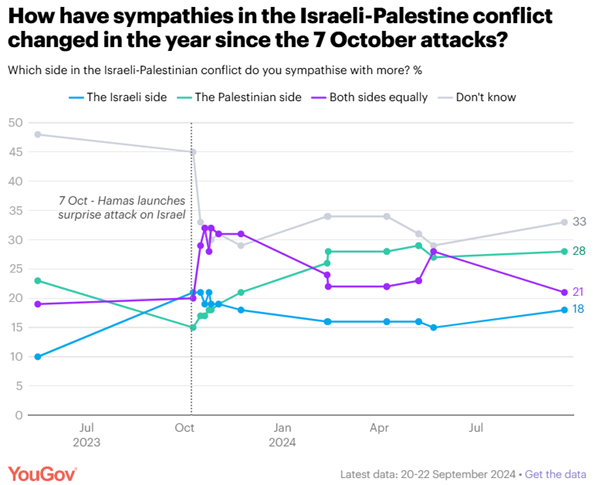
have sentiments changed over the course of the Gaza conflict?
In the immediate aftermath
of the 7 October attacks, greater sympathy for the Israeli side rose to 21%,
a least at which it roughly maintained for the rest of the month, before
declining slightly. Meanwhile, the number more
sympathetic with the Palestinian side declined eight points to 15% following
the attacks, but steadily grew over the following months as the conflict wore
on, reaching its current levels in February. The
more recent survey for the Sunday Times uses a slightly different question
that shows the same levels of sympathy on the Israeli and Palestinian sides,
but a different split between “don’t know” and “neither”. See bottom of
article for wording experiment results. While some Britons come
down more clearly on one side of the debate than others, many have at least
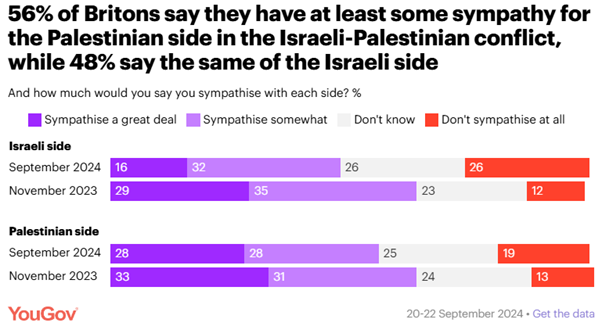
some sympathy for both sides. Most (56%) say they sympathise at least
somewhat with the Palestinian side, and 48% say the same of the Israeli side.
This does, however,
represent a decline in sympathy, for both sides – but more for the Israelis,
for whom sympathy is down 16pts compared to 8pts for the Palestinians. A quarter (26%) now have
no sympathy for the Israelis, up from 12% in November, while 19% are
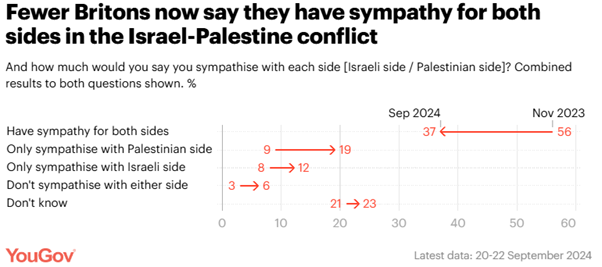
unsympathetic to the Palestinians, up from 13%. Looking at combined
sympathies shows that the number of people who express sympathy for both
sides in the conflict has fallen to 37%, from 56% last year.
Public
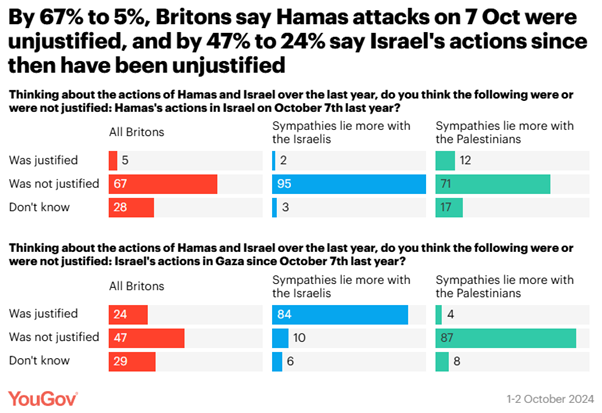
opinion on the initial 7 October attacks, and Israel’s response While many Britons have
sympathy for the Palestinians, this does not translate into a belief that
Hamas’s attacks on Israel on 7 October was justified. Just 5% of the public
feel this way, including 12% of those who say their sympathies lie more on
the Palestinian side. Two thirds instead say
that they think the 7 October attacks were unjustified (67%) – a figure which
includes 71% of those who sympathise more with the Palestinians. There is also a tendency
to see Israel’s response in the 12 months since as being unjustified, with
47% saying so – although 24% do consider the ongoing operations by Israel to
be justified. These figures are effectively unchanged since we last asked in March.
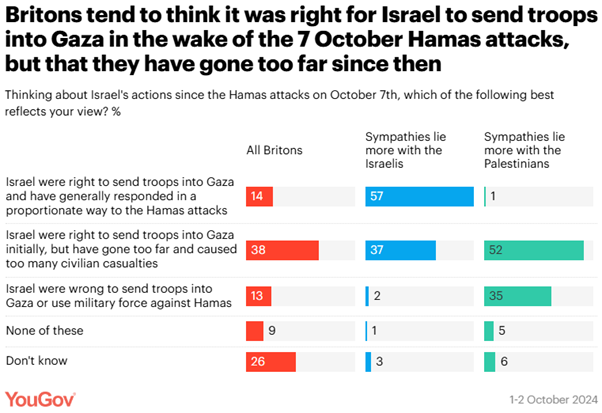
Digging more closely into
this topic, we find that 38% of Britons believe that Israel was right to send
troops into Gaza initially, but have gone too far and caused too many
civilian casualties – the most common view expressed.
A further 14% think Israel
was right to send troops into Gaza and that their actions have generally been
proportionate. On the other hand, 13% say that Israel were wrong to use
military force against Hamas at all. One
year after the start of the Gaza conflict, what do Britons think should
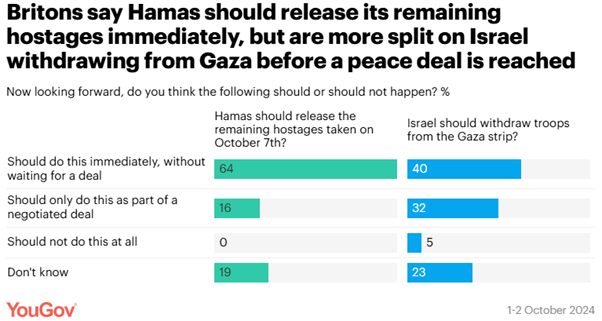
happen now? A major remaining sticking
point for the Israeli government has been the hostages that Hamas took at the
beginning of the conflict, with 97 reportedly still being kept as of
the start of September. Almost two thirds of
Britons (64%) say that Hamas should immediately return the hostages, without
waiting for a negotiated deal to end the conflict. Only 16% of Britons think
they should only do this as part of a negotiated deal, with the rest unsure
(19%).
On the other hand, only
40% of Britons say that Israel should withdraw its forces from the Gaza strip
immediately, with 32% instead saying that they should only do this as part of
a negotiated deal. A further 5% don’t think they should withdraw at all, with
the remainder answering “don’t know” (23%). Attitudes
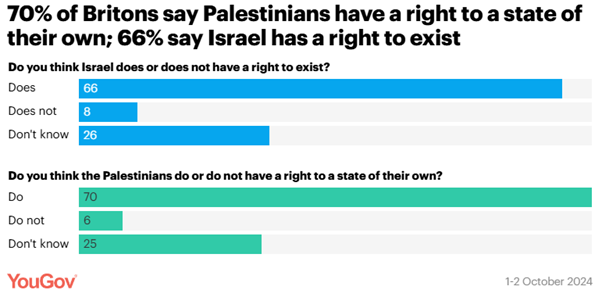
to Palestinian statehood and Israel’s right to exist Over the course of the
current conflict, several countries have decided to recognise Palestinian
statehood, including Ireland, Norway and Spain. YouGov research has shown
that, even before the conflict, more people said the British government
should recognise Palestine as an independent state than were opposed. A survey in June found that 47% of Britons said the
government should recognise Palestinian statehood, up from 40% prior to the
fighting – only 8% took the dissenting view. A less technical version
of this question on our Sunday Times survey shows that 70% of Britons think
the Palestinians have a right to a state of their own, with the majority of
people in every demographic and voting group in agreement. Just 6% of Britons
deny that Palestinians have a right to a state of their own.
By the same token, about
as many Britons also believe that Israel has a right to exist, at 66%, with
only 8% disagreeing. Public
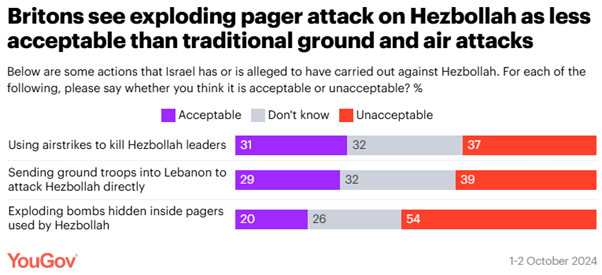
opinion on Israel’s recent attacks on Hezbollah While the Lebanon-based
Hezbollah militant group and Israel have been trading blows over the course
of the Gaza conflict, and for years before, this fighting has increased
significantly in recent weeks, with Israel now having launched an invasion into south Lebanon. One of the first signs of
a major escalation came on 17 September, when thousands of people in
Lebanon were wounded by booby-trapped pagers
exploding. Asked whether
it is acceptable for Israel to have carried out attacks by “exploding bombs
hidden inside pages used by Hezbollah”, only 20% think it is, compared to 54%
who say it is not.
This is, in fact, seen as
less acceptable than “using airstrikes to kill Hezbollah leaders” – which 31%
see as acceptable and 37% unacceptable – or “sending ground troops into
Lebanon to attack Hezbollah directly”, with 29% seeing this as ok compared to
39% who do not. Wording
experiment YouGov
has provided different answer options at various stages on the questions of
sympathy in the Israel-Palestine conflict. The Sunday Times survey, as well
as our automated website tracker, gives a ‘neither’ response
choice, whereas our manual tracker (depicted above in the article) gives a
‘both sides equally’ option. As noted earlier, while sympathy for the Israeli
and Palestinian sides remains unchanged whichever wording is used, the number
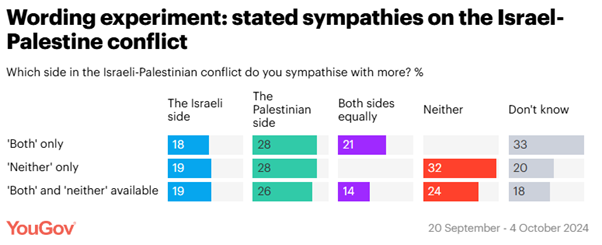
of people choosing the third option or ‘don’t know’ can differ dramatically. To
test underlying sentiment, we ran an additional survey that included both the
‘neither’ and ‘both sides equally’ options. This gave 14% for ‘both’, 24% for
‘neither’ – between two thirds and three quarters of the figure either got in
the questions where only one or the other was shown – and 18% for ‘don’t
know’. Given
this don’t know figure closely matches that generated by the neither-only
question format, this does suggest that those who answer ‘both equally’ when
only that option is provided are more inclined to say ‘neither’ in its
absence than vice versa. This suggests some of the ‘sympathise with both
sides equally’ sentiment is not particularly strongly held, perhaps not
surprising given the nature of the topic, with those having stronger views
being more likely to have picked one side or the other in the conflict.
07 October, 2024 Source:
https://yougov.co.uk/politics/articles/50641-israel-and-gaza-one-year-on
865-871-43-13/Polls How Do Britons Feel About The First 100 Days Of Labour
Government?
Half
of Labour voters are disappointed by Starmer’s government, with four in ten
Britons feeling the country is in a worse state than before the election This Sunday, it will have
been 100 days since Keir Starmer became prime minister and formed the first
Labour government in over 14 years. While still only a fraction of the way
through this parliament, it has been an eventful few months and a period that
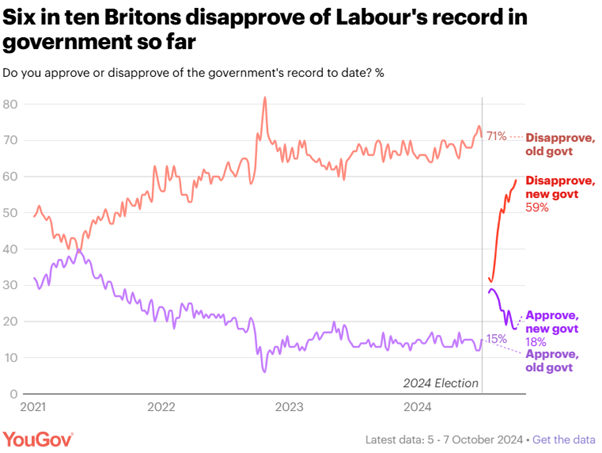
has taken its toll on Labour’s popularity. After just three months in
power, six in ten Britons (59%) disapprove of the
government’s record so far,
with only one in six approving (18%).
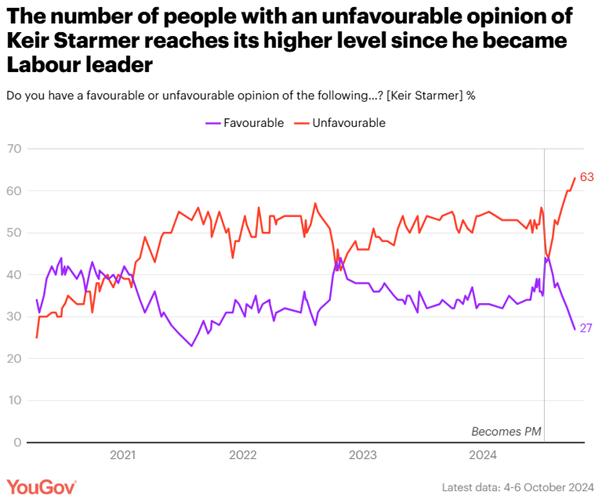
Keir Starmer’s popularity
has also sunk, with 63% of Britons seeing him unfavourably and just over a
quarter (27%) still holding a positive view of the prime minister, making him as unpopular as Nigel Farage.
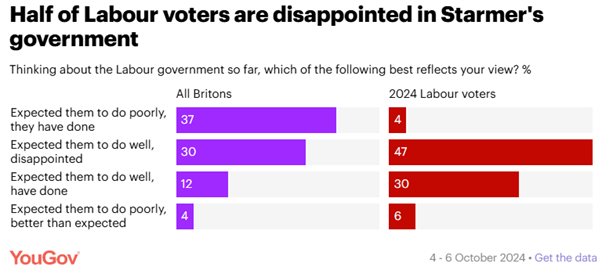
Perhaps most alarmingly
for the government, nearly half of those who voted
Labour in the election (47%) say they had positive expectations of Starmer’s
government but feel let down so far, with only three in ten (30%) feeling
Labour has done as well as they had hoped.
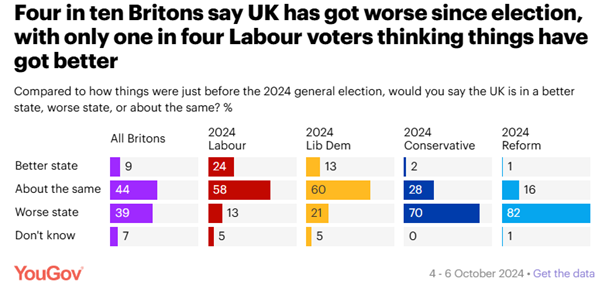
Few Britons (9%) believe
the country is in a better state for Labour having taken the reins of power,
including only a quarter of Labour voters (24%). The public are predominantly
split between those who see no real change so far (44%) and those who believe
things have become worse (39%).
While this latter view is
unsurprisingly most common to Labour’s right, with 70% of Conservatives and
82% of Reform UK voters saying the UK has gotten worse in the last 100 days,
one in eight Labour voters (13%) agree. Britons
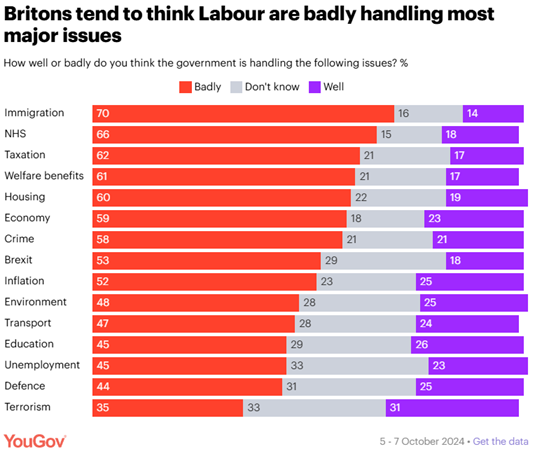
tend to think Labour have performed badly on every issue... This perception that
Labour are not doing well is true pretty much across the board, with more
Britons thinking the government are doing badly than well on every policy
area covered by YouGov’s trackers. The only issue that is particularly close
is terrorism, where three in ten Britons (31%) see the government as doing
well, against 35% who feel they are handling the issue badly. The areas that the
government are most seen to be being handling poorly are immigration, which
seven in ten Britons (70%) think Labour is doing badly on, and the NHS, where
two-thirds of the public (66%) feel so.
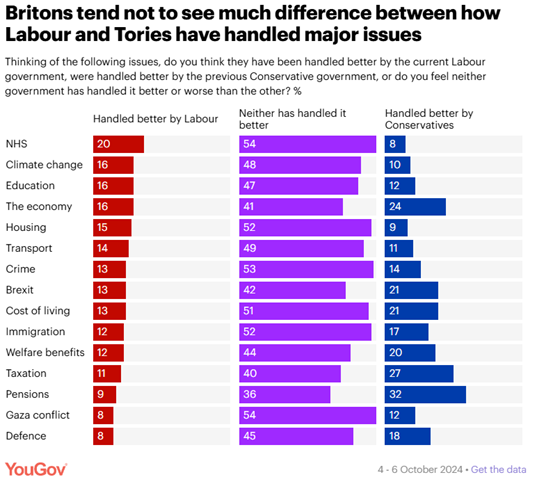
...and
most say they have been no better on key issues than the Tories With the country seen as in a state of disrepair, it might always have been too much to
expect Labour to have turned things around so quickly. But Labour will at
least want to have at least convinced people that they have been an
improvement in office than their Conservative predecessors. In this, they will be
disappointed, with only 8-20% of Britons seeing Labour as an improvement on
the previous Conservative government across any of the 15 issues polled – and
on only five of these issues is that figure noticeably higher than the number
who think the Tories did better than Labour. The most common view across each
issue polled (36-54%) is that neither party has outshone the other. The most notable
difference between the current and previous government is on pensions, which
one in three Britons (32%) see the Conservatives as having done the better
job on, against only 9% who feel it is Labour who have handled the issue
better. Labour’s best relative
performance is on the NHS, which one in five Britons (20%) see Labour as
having done the better job on, compared to 8% who see the Conservatives’
recent stewardship of the NHS as superior.
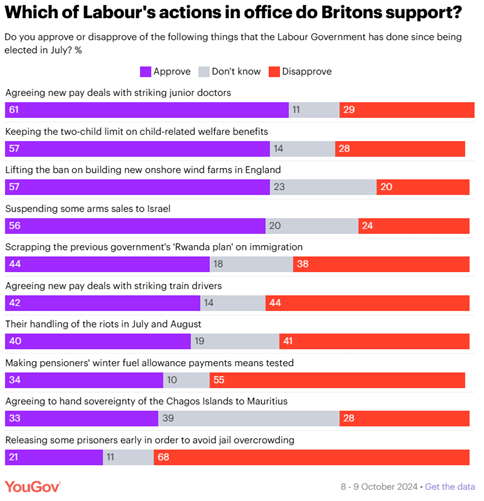
What
are Labour’s most and least popular actions so far? Although the new
government’s overall record tends to be judged negatively by the public when
viewed in general terms, Labour’s specific actions in office get a more
varied reception. At the top of the list, 61% are supportive of the
government for having agreed new pay deals with striking junior doctors,
while clear majorities (56-57%) approve of suspending arms sales to Israel,
lifting the ban on building onshore wind farms, and maintaining the two-child
cap on certain welfare benefits. Britons are more evenly
divided on scrapping the Rwanda plan (44% approving vs 38% disapproving), the
new pay deals with train drivers (42% vs 44%) and the handling of the
summer’s riots (40% vs 41%), although among Labour voters themselves these
measures are popular, with between two-thirds and three-quarters (65-75%)
approving.
Only two of Labour’s major
actions in office get a clearly negative reception from the public – the
plans to make winter fuel allowances means tested are seen negatively by 55%
of people, while two-thirds of Britons (68%) disapprove of the government’s decision
to release some prisoners early to avoid prison overcrowding. It is only on releasing
prisoners, though, where more Labour voters disapprove (49%) of the
government’s actions than approve (38%). On means testing the winter fuel
allowance, Labour voters are the only key political or social group to give
the policy a net positive approval rating, with 57% approving of the policy,
against 38% who do not. For
now, Britons are willing to give Labour the benefit of the doubt While the report card for
the new government is largely negative, Labour will be able to find a degree
of solace in that, at just 100 days, there was limited expectation of the
government being able to make major improvements, with many still willing to give
them at least the benefit of the doubt. Before the election, only one in ten Britons (10%) felt a
government could make even a fair amount of progress on fixing the state of
the UK in the first 100 days, with only 43% feeling such an achievement was
possible within a year of the election. Asked this week, only 28%
think it reasonable to expect Labour to have made much progress by now, with
57% considering this an unrealistic expectation. Crucially, this includes 77%
of those who backed the party in July, suggesting that the government still
has some time to convince their voters that they made the right choice. Indeed, most Britons are
still willing to give the new government at least the benefit of the doubt.
Our new poll finds that 17% of Britons say “I have high hopes for the Labour
Government, and I am sure they are going to do a good job”, while a further 37%
more begrudgingly state “I do not have high hopes for the Labour Government,
but I am willing to give them the benefit of the doubt”.
This sentiment remains
largely unchanged from an equivalent question we asked during the election
campaign, although slightly more do now say “I do not have high hopes for the
Labour Government, and I am sure they are going to do a bad job” (39%, up
from 33% in mid-June). 11 October, 2024
865-871-43-14/Polls Four In Ten Renters And A Quarter Of Mortgage Holders Are
Still Feeling The Pinch
One in nine renters say they are finding it “very
difficult” to afford housing While the cost of living
crisis may be abating, a new YouGov study finds that many Britons are still
struggling with their housing costs.
When it comes to renters,
four in ten (39%) are struggling to pay the rent, down from 55% last year.
This includes one in nine (11%) who are finding it “very hard” to afford
their rent. The proportion who think
it will be hard to pay in a year’s time does not rise by as much as it does
among mortgage-holders, with 42% anticipating challenges affording their rent
this time next year. Two thirds of renters (66%) report that their rent
was increased in the past 12 months. Among those who
saw cost increases because their landlord put the rent up (rather than other
reasons like moving house), the median rent increase has been 10%; when we
asked the same question last year rents had increased on average by 9% in the
preceding 12 months. (YouGov UK) 17 October, 2024
865-871-43-15/Polls Over Half Of UK Adults View Racism In Football As A Problem
How
is football viewed in comparison to other sports? Over half (58%) of UK
adults view racism in football as a very big or fairly big problem. This is
higher than the other sports polled. However, it is worth noting that
football is a higher profile sport so this should be taken into consideration
when digesting these findings.
Worryingly, almost 3 in 10
(28%) UK adults who attend live football nowadays report hearing racist
chanting at matches. This figure rises to 4 in 10 (43%) amongst ethnic minorities
attending. Additionally, 3 in 10 (31%) say they hear racist comments towards
football players at football matches they attend, compared to more than 4 in
10 (48%) amongst ethnic minorities attendees. Do
UK adults believe efforts to tackle racism in football have gone too far or
not far enough? Over two fifths (44%) of
UK adults say that efforts to tackle racism in football have not gone far
enough, rising to more than half (53%) of ethnic minorities. Supporters/fans
(45%), the official bodies who run the game (42%) and social media companies
(40%) are identified most often as the groups doing too little to tackle
racism in professional football. Just under half (48%) of
UK adults think players are doing the right amount. Ethnic minorities are
more likely than those with a White ethnic background to say players are
doing too little (30% ethnic minorities vs 22% White ethnic groups). Respondents were provided
with a list of possible sanctions if a club's supporters engaged in racist
chanting or racist behaviour and asked whether they supported or opposed
each.
More than three-quarters
(76%) of UK adults say that people with a White ethnic background are well
represented in professional football. This drops to two-thirds (66%) for
people with a Black ethnic background, 62% for people with a Mixed ethnic
background, and only 34% for people with an Asian ethnic background. How
likely is that that the England men’s football team will be managed by
someone from an ethnic minority background? Views are divided on
whether there will be a manager from an ethnic minority background within the
next five years, with equal proportions of UK adults predicting that it’s
likely (37%) and unlikely (36%). Ethnic minorities are more
pessimistic with just under half (48%) rating it as unlikely, compared to one
third (33%) of UK adults from White ethnic groups. Those with an interest in
football are also less hopeful with over 4 in 10 (43%) saying certain not to
/ unlikely compared to 2 in 10 (21%) UK adults with no interest in
football. Younger generations,
however, are more optimistic that there could be an England manager that is
Asian, Black or of a Mixed ethnic background in the next 5 years, with over
four in ten saying this (Gen Z: 47%, Millennials: 43%) compared to older
generations (Gen X: 29%, Baby Boomer: 32%). 22 October, 2024 Source:
https://www.ipsos.com/en-uk/over-half-uk-adults-view-racism-football-problem
865-871-43-16/Polls More Britons Care About Who Wins The US Election Than The
Tory Leadership Race
Awareness
Who
do Britons want to win?
Who
do Britons think would make the better Prime Minister?
Commenting on the
findings, Keiran Pedley, UK Director
of Politics at Ipsos said: It
says a lot about the level of interest in all things Americana this side of
the Atlantic when Britons are more interested in who the next US president is
than the next leader of the Conservative Party – or maybe it says more about
how far the Conservative Party has fallen. Regardless, the public prefer a
Harris victory and think it would be better for the UK than a Trump win, even
if they are split on who they actually think will emerge victorious. 01 November, 2024 Source:
https://www.ipsos.com/en-uk/more-britons-care-about-who-wins-us-election-tory-leadership-race
865-871-43-17/Polls No One Trusts Elections Less Than Bulgarians
As Bulgaria prepares to
hold its seventh parliamentary election in three years this Sunday, Gallup
surveys show only 10% of Bulgarians trust the integrity of their elections.
This dismal level of confidence is the lowest not only in the European Union,
but also in the world. In the nearly 20 years
that Gallup has been asking Bulgarians about their trust in elections, they
have never been particularly confident. But in 2022 and 2023, although
Bulgaria tied statistically with other countries like Mongolia for the least
confidence, no other country had less confidence.
The current challenges
with forming a stable government in Bulgaria date back to the eruption of
daily anti-government protests in 2020 during the final year of former Prime
Minister Boyko Borissov’s government. Since then, various government
formations and new political coalitions have attempted to take the reins, but
no political force has managed to maintain power for any significant
duration. Distrust
in Honesty of Elections Is the Norm In comparison with its EU
peers, the current level of confidence is one-third that of the next-lowest
EU country, Romania (30%), and more than six times lower than the EU median
(62%).
Bulgarians’
Confidence in Their Judicial System Lowest in the EU The disillusionment with
democratic institutions in Bulgaria is also reflected in the nation’s
persistently low confidence in its judicial system and courts, the lowest in
the EU and second-lowest in the world last year. Trust in judicial
institutions is pivotal in shaping public perceptions of governmental
integrity. When citizens view their judicial system as corrupt or
ineffective, it erodes their faith in the rule of law and the fairness of
governmental processes.
The systemic distrust that
Bulgarians have in their electoral process and judiciary applies to other key
institutions as well. Gallup’s National Institutions Index is a composite
measure of the confidence a country's residents have in four key national institutions:
the military, judicial system, national government and the honesty of
elections. In 2023, Bulgaria ranked last in the world on the index (scoring
18/100), well below the next-lowest country (Peru, which scored 26). This also represents one
of the lowest scores on the National Institutions Index ever measured in the
Gallup World Poll. Only Chad in 2006 has recorded a statistically lower score
than Bulgaria last year. Bulgarians’
Approval of EU Leadership Among Lowest in the EU While the EU has enjoyed
higher approval than Bulgaria’s fragmented governments over the past three
years, Bulgarians’ approval of EU leadership has also begun to erode. It is
now at an all-time low -- 42% -- since Gallup started measuring it in 2006. Although Bulgarians’
approval of EU leadership had closely paralleled the EU average, that changed
in 2022. Their approval has dipped for two consecutive years and has joined
the bottom of the rankings, along with Hungary, Greece and Slovakia. This is significant
because the EU has historically been seen as a democratic club by all
post-communist EU states that joined it in 2004 and 2007. Entering the EU was
viewed as a sign of being accepted back into the European family of nations
after the challenging years of communist dictatorship. If Bulgarians are
losing faith in the EU, they could also be losing faith in the larger
democratic project that the EU represents.
Bottom
Line The persistent distrust in
key national institutions and skepticism about EU leadership underscore a
systemic challenge within Bulgarian society. The cyclical nature of political
crises and the inability of successive governments to establish lasting stability
can exacerbate the broader disillusionment with key national institutions. The most recent Bulgarian
parliamentary election, on June 9, 2024, showed record-low voter turnout
since the fall of communism, a potential sign that election fatigue and
disillusionment with the electoral process are growing. As Bulgaria continues
to grapple with these challenges, restoring faith in the electoral process
and the country’s institutions remains a formidable task. 22 October, 2024 Source:
https://news.gallup.com/poll/652433/no-one-trusts-elections-less-bulgarians.aspx NORTH AMERICA
865-871-43-18/Polls Most Americans Back Cellphone Bans During Class, But Fewer
Support All-Day Restrictions
As lawmakers and educators crack down on cellphone use in schools, most
Americans back bans on using phones in classrooms but are less supportive of
full-day restrictions.
Another 24% oppose this,
while 8% say they aren’t sure. How
we did this Some school districts have called for banning cellphone use entirely, not just
during class. Our survey finds the public is far less supportive of a
full-day ban on cellphone use than a classroom ban. Jump
to read more about why Americans support or oppose classroom
cellphone bans. Views by age Young adults are less
likely than older age groups to support a cellphone ban in middle or high
school, either during class or the entire school day.
Less than half of adults
under 30 (45%) say they support banning students from using cellphones during
class. This share rises to 67% among those ages 30 to 49 and 80% among those
ages 50 and older. There are similar age
differences in views about daylong cellphone bans. Only 18% of adults under
30 support preventing students from using cellphones throughout the school
day. By comparison, 36% of those ages 30 to 49 and 44% of those 50 and older
favor this type of ban. Views by whether someone
is a K-12 parent While some media headlines
focus on parents’ resistance to cellphone bans, our survey shows few differences in views
between those who have school-age children and those who don’t. For example, 65% of
parents with a K-12 child support banning students from using their cellphone
during class. This compares with 69% of those without children in these
grades. And identical shares (36% each) support a ban for the entire school
day. Views by party Majorities of Republicans
and Democrats – including independents who lean toward either party – favor
banning students from using cellphones during class. Still, support is
somewhat higher among Republicans than Democrats (74% vs. 64%). A similar pattern exists
for views on bans that span the entire school day. While 42% of Republicans
back full-day restrictions, 31% of Democrats do. Why
Americans support cellphone bans during class We also asked people about
possible reasons they support or oppose a cellphone ban.
Among those who support a
ban during class, nearly all (98%) say a reason they back it is because students would have fewer distractions in
class. This includes a whopping 91% who say it’s a major reason. Previous Center
findings show that most U.S. high school teachers say
cellphone distractions are a major problem in their class. Majorities of supporters
also point to each of the other reasons we asked about. But fewer describe
each as a major reason.
Among those who support a ban:
There are only modest
differences by age and political party in the shares of people who cite each
of these as major reasons. Views by whether someone
is a K-12 parent The only reason where
parents of K-12 students differ from those who are not K-12 parents is
bullying. Among cellphone ban supporters, 44% of K-12 parents say a major
reason they favor it is that it would reduce bullying in schools, compared
with 37% of those who are not K-12 parents. Why
Americans oppose cellphone bans during class
Of those who oppose a ban,
majorities cite each of the four reasons we asked about. Six-in-ten – the
highest share for any reason we asked about – say a major reason they oppose a ban is
because parents should be able to
reach their child when needed. Another 26% say this is a minor
reason they oppose cellphone bans during class. Looking at the three other
reasons we asked about:
Views by whether someone
is a K-12 parent Parents of K-12 students
are especially likely to stress a parent’s ability to reach their child.
Among opponents of a ban, most K-12 parents (70%) say this is a major reason.
This share drops to 57% among those who are not K-12 parents. K-12 parents are also more
likely than their peers to say that a major reason they oppose a cellphone
ban is that parents should be the ones who decide (41% vs. 30%). Views by age Among those who oppose a
ban, older Americans are less likely
than younger adults to cite three of the reasons we asked about:
Views by party Democrats are more likely
than Republicans to point to parents being able to reach their child as a
major reason for opposing a ban. Among opponents of a ban, 65% of Democrats
say this, compared with 52% of Republicans. Democrats are also more likely to
cite cellphones being a useful teaching tool as a major reason (35% vs. 27%). 14 October, 2024
865-871-43-19/Polls Most U.S. Voters Say Immigrants – No Matter Their Legal
Status – Mostly Take Jobs Citizens Don’t Want
Majorities of U.S.
registered voters say immigrants – both undocumented and legal – mostly fill
jobs American citizens don’t want, as opposed to jobs citizens would like to
have.
The impact of immigration
on the U.S. job market has come up regularly in the 2024 presidential
election. Supporters of
Democratic presidential candidate Kamala Harris and her Republican opponent
Donald Trump have points of agreement and disagreement
on this issue. How
we did this Notably, majorities of Harris and Trump supporters say that
undocumented immigrants mostly fill jobs that Americans don’t want. Even
so, substantial differences exist: 90% of Harris supporters hold this view,
compared with 59% of Trump supporters. Large
shares in both coalitions also say legal immigrants mostly take jobs that
U.S. citizens don’t want. Seven-in-ten Harris
supporters say this, compared with around half of Trump supporters (52%). Overall, views have changed little since May 2020, the last time we asked these questions.
At that time, 77% of U.S. adults said undocumented immigrants mostly fill
jobs that U.S. citizens don’t want, while 64% said the same about legal
immigrants. Partisan differences in views have also not changed much since
2020. Views
by race and ethnicity Voters differ somewhat by
race and ethnicity over whether undocumented and legal immigrants take jobs
that U.S. citizens don’t want.
There are insufficient
sample sizes to show results by race and ethnicity among Trump supporters in
this analysis. When it comes to legal
immigrants, 67% of Hispanic voters overall say these immigrants mostly fill
jobs that American citizens don’t want, as do smaller shares of White (61%),
Asian (57%) and Black (54%) voters.
How
many immigrants are in the U.S. labor force? Over 30 million
immigrants were in the U.S. workforce as of 2022, accounting for 18% of all
U.S. workers.
What
kinds of jobs do immigrants in the U.S. hold? By industry When looking at industries – the kind of business that employers
do – immigrants accounted for about a
quarter of workers (27%) in the agriculture, forestry, fishing and hunting
sector in 2022. This was followed by construction (26%),
according to a Center analysis of U.S. Census Bureau data. There are no major
U.S. industries in which immigrants outnumber those born in the country. The largest shares
of unauthorized immigrant
workers were in the construction (13%), agriculture, forestry, fishing and
hunting (12%), and leisure and hospitality (7%) industries in 2022. Legal immigrant workers accounted
for the largest shares in the transportation and utilities (15%) and other
services sectors (15%), followed by professional and business services (14%)
and agriculture, forestry, fishing and hunting sector (14%) – only slightly
above their share of the overall workforce. By occupation When looking at occupations – the kind of work that people do on
the job – immigrants overall accounted
for the largest share of workers in farming, fishing and forestry (43%) in
2022, followed by construction and extraction (29%).
Immigrants outnumbered U.S.-born workers in some jobs, such as
manicurists/pedicurists (73%), taxi drivers (57%) and drywall/ceiling
installers (53%). Unauthorized immigrant
workers accounted for the largest shares in occupations such as
drywall/ceiling tile installers and tapers (33%), roofers (32%), painters and
paperhangers (28%), other agricultural workers (24%), construction laborers
(24%), and maids and housekeeping cleaners (24%). Legal immigrant workers accounted
for the largest shares in jobs such as manicurists/pedicurists (60%), taxi
drivers (44%), interpreters and translators (38%), other life scientists
(35%), and physical scientists (34%). 21 October, 2024
865-871-43-20/Polls Harris, Trump Voters Differ Over Election Security, Vote
Counts And Hacking Concerns
With voting underway in
the 2024 presidential race, majorities of American voters are at least
somewhat confident that the election will be run smoothly, that votes will be
counted accurately and that ineligible voters will be prevented from casting
ballots.
But supporters of Kamala Harris
and Donald Trump have sharply different expectations for how this year’s
election may unfold. In many cases, these differences are as wide as they
were in the lead-up to the 2020 election. This pattern in views
extends to other aspects of the presidential race:
The latest national survey
by Pew Research Center, conducted among 5,110 U.S. adults (including 4,025
registered voters) from Sept. 30 to Oct. 6, 2024, finds that voters who
support Harris are more confident in the way the 2024 election will unfold
than President Joe Biden’s supporters were four years ago. And those who support
Trump are deeply skeptical about the way the election will be conducted –
expressing even less confidence on some election issues than his supporters
did four years ago. Wide
partisan gaps in election confidence since 2020 In 2018, Republican
candidate supporters were 8 percentage points more likely than Democratic
candidate supporters to say that year’s midterm election would be run well.
By 2020, Biden’s supporters were 22 points more likely than Trump’s to expect
the election to run smoothly. The gap this year is even wider: 33 points
between Harris and Trump supporters. Harris,
Trump supporters differ on whether votes will be counted accurately As was the case four years
ago, Trump supporters are particularly skeptical that absentee and mail-in ballots will
be counted as voters intend. Harris supporters are more
than twice as likely as Trump supporters to say they are very or somewhat
confident that absentee and mail-in ballots will be counted accurately (85%
vs. 38%).
By contrast, sizable
majorities of both coalitions (93% of Harris supporters, 77% of Trump
supporters) are at least somewhat confident that in-person votes will be counted
accurately. However, far more Harris
(57%) than Trump (24%) supporters are very confident
this will happen. There is broad confidence
among voters overall that local poll workers and state election officials
will do a good job during the upcoming election. Yet Harris supporters are
more likely than Trump supporters to express a high degree of confidence in
these administrators. Read
more on views of election administration and vote counting in Chapter 1 Related: Key
facts about U.S. poll workers Voters’
views of illegal voting, access to voting
Roughly nine-in-ten among
both Trump and Harris supporters are confident that eligible voters will be
able to cast a ballot if they want to. But there are bigger
divisions on whether people who are ineligible to
vote will be prevented from doing so. Today, 87% of Harris
voters are at least somewhat confident that ineligible voters will be
prevented from casting ballots. Just 30% of Trump supporters say this. Most voters are at least
somewhat confident that it will be clear which candidate won the election
after all the votes are counted. But here again, Harris backers (85%) are
much more likely than Trump supporters (58%) to express confidence that the
winner will be clear. Do
voters think election systems in the U.S. are safe from hacking?
Overall, 52% of voters are
at least somewhat confident that U.S. election systems are secure from
hacking and other technological threats. Nearly as many voters (47%)
are not confident
about this.
Other
findings: Voters’ plans for casting ballots, confidence in Supreme Court to
be politically neutral if it must resolve 2024 election challenges
A
smaller share of voters plan to cast ballots by mail compared with
2020. Four years ago, during the COVID-19
pandemic, a record share of voters cast ballots by mail
in the presidential election.
Today, a much smaller share of voters plan to vote by mail (39% then, 28%
today). But as in 2020 amid the Biden-Trump matchup, Harris supporters are about twice as
likely as Trump supporters to say they plan to cast a ballot via mail. Read
more on voters’ expectations around voting in Chapter
3 Trump
backers who plan to vote by mail are more confident that mail-in ballots will
be counted accurately. Though most Trump
supporters plan to cast a ballot in person, 17% say they plan to vote
absentee or by mail. These voters express far more confidence in the accuracy
of mail-in ballots than do those who plan to vote in person (67% vs. 31%).
Most
voters are not confident the Supreme Court would be politically neutral if it
had to resolve legal challenges related to the 2024 election. Overall,
just 20% of voters are extremely or very confident the court would remain
politically neutral if it had to resolve any legal challenges that stemmed
from the 2024 election. But Trump voters express more confidence than Harris
voters do (34% vs. 6%). 24 October, 2024
865-871-43-21/Polls Majority Of Americans Aren’t Confident In The Safety And
Reliability Of Cryptocurrency
Cryptocurrency markets
continue to face challenges. The currency’s value has dropped, lawsuits are mounting and Congress is mulling regulations. Meanwhile, Americans remain skeptical
about cryptocurrency, and the share who’ve used it has not grown in the past three years, according to a Pew Research Center survey
conducted Feb. 7-11. How
we did this
Just 5% of adults are
extremely or very confident in cryptocurrencies, and 18% are somewhat
confident. These findings are largely
similar to what the Center found in March 2023. By age and previous
investments There are also differences
based on whether people have personally invested in cryptocurrency. Among
those who are familiar with but have not invested in it, 82% say they are not
very or not at all confident in it. That compares with 39% among those who have invested in cryptocurrency. On the other hand, 19% of
adults who have invested in cryptocurrency say they are extremely or very
confident in its reliability and safety. Who
uses cryptocurrency? Overall, 17% of U.S.
adults say they have ever invested in, traded or used a cryptocurrency. This
share is statistically unchanged since 2021. By age and gender
As was true in past
surveys, men under 50 are more likely than both men 50 and older and women of
all ages to have ever used cryptocurrency. For example:
By race and ethnicity Cryptocurrency use also
differs by race and ethnicity. Among Asian adults, 28% say they have ever
invested in, traded or used a cryptocurrency. About one-in-five Black and
Hispanic adults say the same. White adults (14%) are least likely to say they
have used crypto. By
income Among adults in
upper-income households, 23% have ever invested in, traded or used
cryptocurrency. This share decreases to 18% among middle-income Americans and
further to 14% among those with lower incomes. By party Use of cryptocurrency is
statistically equal between Republicans and Democrats. Roughly two-in-ten
Republicans and Republican-leaning independents (18%) and Democrats and
Democratic leaners (17%) say they have invested in, traded or used
cryptocurrency. Some
past cryptocurrency users no longer have it While only a minority of
Americans have invested in cryptocurrency, a majority of those who have done
so still have it. Among those who have ever
invested in, traded or used cryptocurrency:
By
income Roughly half (51%) of
adults in lower-income households who’ve used cryptocurrency say they no
longer have any, outpacing those in middle-income (32%) or upper-income (36%)
households who say the same. These shares are similar
to those measured in 2023. The only significant change is among upper-income
cryptocurrency users: 36% have given up the currency, an increase from 21% in
2023. Cryptocurrency
investments and personal finances
The financial impact of
cryptocurrency is still a concern for many users. When asked about their own
investments, the largest shares say they’ve done worse (38%) or about as
expected (37%). In comparison, 20% say their investments have done better
than expected and 4% are unsure. In 2023, a slightly larger
share (45%) said their cryptocurrency investments had done worse than
expected. Still, most users said in 2023 that these investments had not
impacted their finances:
College graduates (25%)
and those with some college experience (20%) were more likely than those with
a high school education or less (10%) to say their cryptocurrency investments
had hurt their personal finances in 2023. When
did Americans start using cryptocurrency?
We also asked Americans in
2023 when they first used
cryptocurrency. About three-quarters (74%) said they did so for the first
time one to five years earlier. Smaller shares said they first did this
within the previous year (16%) or more than five years ago (10%). By race and ethnicity,
income In 2023, Black users (27%)
were more likely than White users (12%) to say they first invested in, traded
or used cryptocurrency within the previous year. Roughly two-in-ten Hispanic
users (21%) said the same. (There were not enough Asian American cryptocurrency
users to look at their responses separately.) In addition,
cryptocurrency users living in lower-income households were particularly
likely to have first invested in it during the previous year. About
three-in-ten users from lower-income households reported first investing in
cryptocurrency within the past year, compared with about one-in-ten adults
from middle- or upper-income households. 24 October, 2024
865-871-43-22/Polls A Look At The State Of Affordable Housing In The U.S.
Housing affordability has
emerged as a key issue in this year’s U.S. presidential election. Both Democrat
Kamala Harris and Republican Donald Trump have talked about what they would
do to increase the supply of affordable homes and
people’s ability to buy them,
though their plans have little in common. It’s an important issue
for the public, too: In a recent Pew Research Center survey, 69% of Americans said they were “very
concerned” about the cost of housing, up from 61% in April 2023. But what counts as an
“affordable” home, and how many Americans are struggling to afford a place to
live? This analysis tries to answer those questions, using data from U.S.
Census Bureau surveys and other sources. How
we did this What
makes a home affordable? One commonly used (though
also criticized) benchmark for housing affordability is
that no more than 30% of household income should go toward housing costs.
Households that spend more than that are considered “cost
burdened” by the U.S. Department of Housing and
Urban Development. How
the U.S. Census Bureau defines ‘housing costs’ and ‘gross rent’ The bureau’s American
Community Survey defines “housing costs” as including rent or mortgage payments,
property taxes, utilities, homeowners insurance, condominium or mobile-home
fees and the like. “Gross rent” includes the contract rent on the
property as well as utilities and fuels, if paid by the tenant.
By that standard, 31.3% of American households were
cost burdened in 2023, including 27.1% of households with a mortgage and
49.7% of households that rent, according to 1-year estimates from the Census
Bureau’s American Community Survey (ACS). (Many more
people own than rent: In the second quarter of 2024, 65.6% of occupied
housing units were owned while 34.4% were rented, according to the most
recent estimates from the Census Bureau’s Current Population Survey/Housing
Vacancy Survey.) We can also look at
affordability for renters, specifically, over time using a slightly different
standard: the share who spent 30% or
more of their income on gross rent, rather than the share who
spent more than 30% on
total housing costs. In 2023, about half (51.8%) of renting households paid
that much in gross rent, ACS estimates show. By comparison, 53.4% of renting
households paid that much in 2011. The share of renters reaching that
threshold hovered around 50% for the entire 2011-2023 period. How
has the housing market changed in recent years? The U.S. housing market,
as measured by the number of active for-sale properties on local multiple
listing services (MLS), shrank dramatically during the COVID-19 pandemic but has since partially rebounded. On any given day in
September 2019, according to Realtor.com, there were more than 1.2 million active
MLS listings. By September 2023, that number had fallen 42.7%, to about
702,000. But as of September 2024, there were about 941,000 active listings
on a given day, 34.0% more than a year earlier. (These totals exclude pending
listings when that data is available.) Similar patterns are found
across the country. In September 2024, 78.9% of the 900-plus local markets
Realtor.com tracks had fewer active
listings than they did in September 2019, but 92.2% had more active listings than in
September 2023. Meanwhile, home prices
continue to rise. The Federal
Housing Finance Agency’s national
House Price Index, a gauge of how selling prices for single-family homes have
changed over time, was 57.8% higher in July than it was in July 2019. For
comparison, the Consumer Price Index – which measures price changes for a
broad range of consumer goods and services – rose 22.8% overall between
September 2019 and September 2024. Related: Prices
are up in all U.S. metro areas, but some much more than others How
does housing affordability vary geographically? Like much else involving
real estate, “location, location, location” plays a key role in how housing
cost burdens are distributed. That’s especially true in California, according
to our analysis of 2023 ACS estimates. The federal government
identifies more than 900 metropolitan and “micropolitan” areas in the United States and Puerto Rico,
based on the population of an area’s core city or town. Many of the
metropolitan and micropolitan areas with the highest shares of cost-burdened
households (i.e., those that spend more than 30% of their income on housing
costs) are in California. Smaller micro- and
metropolitan areas, as well as largely rural states, generally tend to have
lower shares of cost-burdened households. Looking at the metro- and micropolitan
areas where the smallest shares of households spend more than 30% on housing,
most have populations smaller than 250,000, and the majority are located in
Wisconsin, Alabama or North Carolina. Some states have
especially high shares of households spending more than 30% of their income
on housing. For example, 40.6% of California households meet this threshold –
including more than half (54.1%) of renters. Roughly similar shares of
households in Hawaii (38.2%) and Florida (37.2%) also spend this much on
housing costs, according to the 2023 ACS estimates. At the other end of the
spectrum, much smaller shares of households meet the “cost burdened”
threshold in West Virginia (21.0% of households), North Dakota (22.0%), South
Dakota and Iowa (23.6% each).
In every state, a greater
share of renting households than homeowning ones are cost burdened when it
comes to their housing costs. And homeowning households that carry a mortgage
are more likely to be cost burdened than those that don’t. At the same time,
the Federal Housing Finance Agency’s state-level house price indices
have increased for every U.S. state and the District of Columbia, by anywhere
from 22.6% (D.C.) to 82.3% (Maine) between the second quarters of 2019 and
2024. Among the nation’s 100 largest metro areas, Miami-Miami Beach-Kendall
in Florida had the biggest five-year increase in its house price index
between the second quarters of 2019 and 2024: 95.0%. In terms of actual
dollars, Edwards, Colorado (near the Vail and Beaver Creek ski areas)
tops Zillow’s list of 716 local markets: The median
selling price there in August 2024 was $1.56 million. But of the 604
localities for which Zillow has five years of price data, another Centennial
State ski town was top of the mountain: Between August 2019 and August 2024,
the median selling price in Steamboat Springs rose 155.5%, from $433,500 to
$1,107,500. What
factors contribute to housing being unaffordable? A lack of housing
affordability is the product of multiple factors intersecting in sometimes
unpredictable ways. Interest rates, new home construction, population growth,
population shifts, rising home prices and rents, disposable incomes, and
local economic conditions all affect how easy or difficult it can be to find
a home you can afford in a place you want to live. Let’s take a closer look
at a few of these factors. Interest
rates Almost four-in-ten
households (39.3%), or 51.6 million, carry mortgages on their homes,
according to 2023 ACS estimates. Soon after the COVID-19 pandemic began, the
average interest rate on a 30-year fixed mortgage fell dramatically – from
3.72% at the start of 2020 to as low as 2.65% by the start of 2021, according
to data from Freddie Mac. That prompted millions of homeowners
to refinance their mortgages, locking in low rates and lowering their
monthly payments. (A similar refinancing wave followed the collapse of the 2000s
housing bubble.)
Since then, the average
30-year rate has soared as high as 7.79% (in late October 2023) and fallen
to, as of late October
2024, 6.54% – roughly tracking investor expectations on inflation and
the path of Federal
Reserve interest-rate policy. Still, according to a recent analysis by Federal Housing
Finance Agency economists,
most homeowners with fixed-rate mortgages are sitting on interest rates well
below what they’d get if they took out a new mortgage today – limiting their
ability, or willingness, to put their existing homes on the market. In that
working paper, the economists estimate that this “lock-in” effect led to 1.33
million fewer home sales between the second quarter of 2022 and the end of
2023. New
home construction
Another way to increase
the inventory of homes for sale is to build more of them. But the
homebuilding industry took a deep dive during the Great Recession – falling
from 2.07 million privately owned housing unit “starts” in 2005 to 554,000 in
2009 – and still has a way to go before returning to pre-crisis levels. In
September 2024, housing starts were running at a seasonally adjusted annual
rate of 1.35 million, according to the Census Bureau’s Survey of
Construction. The decline has been
especially pronounced in entry-level single-family homes, defined as those smaller than 1,400
square feet. The peak year this century for new homes of that size was 2004,
when 186,000 were built (12.1% of all single-family homes built that year).
In 2023, however, only 87,000 new single-family homes (8.7%) were under 1,400
square feet, according to the Census Bureau. Meanwhile, 23.5% of new
single-family homes in 2023 were 3,000 square feet or larger, compared with
20.3% in 2004. Multifamily housing, such
as apartment and condo buildings, may offer some relief. Coming out of the
Great Recession, buildings with five or more units were completed at a
steadily rising pace until rising significantly in 2023, according to the Census Bureau’s Survey of
Construction. That year,
438,300 such privately owned housing buildings were completed, more than in
any year since 1987. And as of September 2024, completions of buildings with
five or more units were running at a seasonally adjusted annual rate of
671,000. 25 October, 2024
865-871-43-23/Polls 17 States Haven’t Had A Female U.S. Senator, And 18 Haven’t
Had A Woman Governor
There could also be
similar firsts in political contests around the country: Five races for U.S.
Senate and two for governor feature a major-party nominee who, if elected,
would be the first woman in their state to hold the office. And in Minnesota,
a woman will ascend to the governorship for the first time if current Gov.
Tim Walz is elected as Harris’ vice president. How
we did this
Three of these candidates
(Lisa Blunt Rochester of Delaware, Valerie McCray of Indiana and Caroline Gleich of Utah) are Democrats, and two (Nella Domenici of New Mexico and Patricia Morgan of Rhode Island) are Republicans. Blunt Rochester and McCray
would also be the first Black senators to represent their respective states.
Among the 18 states that have never had a woman
governor, two – Indiana and Missouri – have a woman on the ballot in this
year’s general election. Jennifer McCormick of Indiana and Crystal Quade of Missouri are both Democratic
nominees. And in Minnesota, Lt.
Gov. Peggy Flanagan will take over as governor if Walz is
elected vice president. That would make her the first woman and the first
Native American person to hold the office. Five states have not had a
woman senator or a
woman governor: Colorado, Idaho, Indiana, Pennsylvania and Virginia. Women have served in
numerous statewide executive and legislative offices over the decades, including in all
the states where they have not yet held Senate seats or governorships. And
every state has sent at least one woman to either the U.S. House of
Representatives or the Senate. Women
in the 118th Senate In the current Congress,
women hold 25 of 100 Senate seats – a record high. They represent a total of 21 states. In
Minnesota, Nevada, New Hampshire and Washington, both senators are women. Fourteen of the 25 current
senators are the first women to represent their state in the Senate. Their
tenures vary: Washington Democrat Patty Murray has served in the Senate since 1993,
whereas Wyoming Republican Cynthia Lummis took office in 2021. Fifteen current women
senators are Democrats, nine are Republicans and one (Kyrsten Sinema of
Arizona) is an independent. Looking at the Senate as a whole, women make up a
larger share of the Democratic caucus (31%) than the Republican caucus (18%). A
century in the Senate Women have served in the
Senate for over a century. In 1922, Rebecca Latimer
Felton, a suffragist from
Georgia, became the first woman senator. She was appointed to a vacant seat
and served for just one day.
Since then, a total of 60
women have represented 33 states in the Senate, and most of them have served
in recent decades. About three-quarters (46) first took office after 1980. A little over half (19) of
the states that have ever been represented by a woman in the Senate have sent
more than one. Four women have
represented California in the Senate, the most from any state. In addition to
Harris, who represented the state from 2017 to 2021, this group
includes two long-serving senators. Democrat Dianne Feinstein took office in 1992 and served until
her death in 2023, and Barbara Boxer, also a Democrat, was in office from 1993
to 2017. Alabama, Louisiana, Maine,
Minnesota, Nebraska and New Hampshire have each sent three women to the
Senate. Related: 22
states have ever elected a Black woman to Congress Women
in the governor’s mansion
Overall, 49 women have
held the governorship in 32 states since 1925, when two women took the oath
of office for the first time. That year, Nellie Tayloe Ross of Wyoming was nominated in a special
election and won the governorship following the death of her husband, Gov.
William Ross. Miriam “Ma” Ferguson of Texas, the first woman ever chosen
for the office in a general election, was sworn in just 15 days later. Women currently serve as
governors in 12 states. Eight are Democrats and four are Republicans. Five of the current
governors are the first women elected in their state: Democrats Janet Mills
of Maine and Kathy Hochul of New York; and Republicans Kim Reynolds of Iowa,
Kristi Noem of South Dakota and Sarah Huckabee Sanders of Arkansas. In Arizona, five women
have held the governorship since 1988 – by far the most from any state. In
fact, three women served consecutively over a 17-year stretch, from
Republican Jane Hull’s ascension in 1997 until
Republican Jan Brewer left office in 2015. 01 November, 2024 AUSTRALIA
865-871-43-24/Polls Risk Of Mortgage Stress Eases For Third Straight Month
New
research from Roy Morgan shows 28.3% of mortgage holders are now ‘At Risk’ of
‘mortgage stress’. The research was conducted in the three months to
September 2024, and is 2% lower than the June figures prior to the Stage 3
tax cuts that increased household income for millions of Australians. The level of mortgage
holders ‘At Risk’ of ‘mortgage stress’ in September (28.3% of mortgage
holders) is set to stabilise over the next few months unless the Reserve Bank
board decides to raise interest rates later this year in November and
December. The record high of 35.6%
of mortgage holders in mortgage stress was reached in mid-2008. 917,000
more ‘At Risk’ of mortgage stress more than two years after interest rate
increases began Mortgage
Stress – % of Owner-Occupied Mortgage-Holders
Mortgages
‘At Risk’ will increase to new record highs in November and December if the
RBA raises interest rates Roy Morgan has modelled
the impact of potential RBA interest rate increase in November 2024 of +0.25%
to 4.6% and another interest rate increase of +0.25% to 4.85% in December
2024. In September, 28.3% of
mortgage holders, 1,724,000, were considered ‘At Risk’ and this figure is
projected to increase by 27,000 in November to 1,751,000 (28.8% of mortgage
holders, up 0.5% points) if the Reserve Bank raises interest rates by +0.25%
to 4.60% on Melbourne Cup Day in early November. Looking forward into
December, if the RBA raises interest rates by a further +0.25% to 4.85% Roy
Morgan projects an increase in the number of mortgage holders considered ‘At
Risk’ from 1,751,000 in November, up 34,000 to a new record high of 1,785,000
(29.3% of mortgage holders); and up 61,000 from current figures. Mortgage
Risk projections based on interest rate increases of +0.25% to 4.60% in
November 2024 and +0.25% to 4.85% in December 2024
How
are mortgage holders considered ‘At Risk’ or ‘Extremely At Risk’ determined? Roy Morgan considers the
risk of ‘mortgage stress’ among Mortgage holders in two ways: Mortgage holders are
considered ‘At Risk’[1] if their mortgage repayments are greater than a certain
percentage of household income – depending on income and spending. Mortgage holders are
considered ‘Extremely at Risk’[2] if even the ‘interest only’ is over a certain proportion
of household income. Unemployment
is the key factor which has the largest impact on income and mortgage stress It is worth understanding
that this is a conservative forecasting model, essentially assuming all other
factors apart from interest rates and the recent Stage 3 income tax changes
remain the same. The latest Roy Morgan
unemployment estimates show nearly one-in-five Australian workers are either
unemployed or under-employed – 2,964,000 (18.7% of the workforce); (In September Australian unemployment
increased to 9.5% as workforce grew to a record high; but not enough new jobs
created). Although all eyes will be
on the Reserve Bank’s interest rate decision in early November, the fact
remains that the greatest impact on an individual, or household’s, ability to
pay their mortgage is not interest rates, it’s if they lose their job or main
source of income. The recent income tax
cuts, which have boosted disposable income for working Australians and eased
mortgage stress in recent months, will be nullified by further interest rate
cuts in the months ahead. Michele
Levine, CEO Roy Morgan, says mortgage stress was down again in September as
the Stage 3 income tax cuts eased the burden for many Australians – 28.3% of
Australians with a mortgage (down 1.2% points since August and down 2% since
June) considered ‘At Risk’: “The
latest Roy Morgan data shows 1,724,000 Australians were ‘At Risk’ of mortgage
stress in September 2024. Despite the fall in the share of mortgage holders
‘At Risk’ (28.3%) this is the sixth month this year over 1.6 million were
considered ‘At Risk’. “The
figures for September 2024 represent an increase of 917,000 considered ‘At
Risk’ since the RBA began raising interest rates in May 2022. The figures
take into account 13 rate increases which raised interest rates by a total of
4.25% points to 4.35%. “The
latest ABS
quarterly inflation figures for June 2024 showed
annual inflation at 3.8% – up 0.2% points from March 2024, although the most
recent monthly figures have shown further indications that inflation has
softened in July and August. However, over the last 12 months, since
September 2023, the ABS monthly inflation figure has averaged at a similar
level of 3.8%. “Although
there are signs that inflation is moderating, key inflation indicators such
as petrol prices remain high – for the first time in history average retail
petrol prices have been above $1.70 per litre for over two years – a record
total of 108 straight weeks since late September 2022. “For
these reasons we have modelled the impact on mortgage stress of interest rate
increases of +0.25% to 4.6% on Melbourne Cup Day, in early November, and an
additional increase of +0.25% to 4.85% in early December. “Two
additional interest rate increases of +0.25% would increase the level of
mortgage stress by 61,000 from current levels to a total of 1,785,000. This
would leave the share of mortgage holders considered ‘At Risk’ at 29.3%, up
1% point from the latest figure for September. “The
crucial September quarter inflation figures are due out next week. These
figures are expected to have a significant influence on the Reserve Bank’s
decisions relating to interest rates over the remainder of the year and at
their meetings in early November and December. “Finally,
it is important to appreciate that interest rates are only one of the
variables that determines whether a mortgage holder is considered ‘At Risk’ –
the largest impact on whether a borrower falls into the ‘At Risk’ category is
related to household income – which is directly related to employment. “The
employment market has been strong over the last year (the
latest Roy Morgan estimates show 550,000 new jobs created compared to a year
ago) and this has provided support to household
incomes which have helped to moderate levels of mortgage stress over the last
year.” 22 October, 2024 Source:
https://www.roymorgan.com/findings/9697-mortgage-stress-risk-september-2024
865-871-43-25/Polls ANZ-Roy Morgan Consumer Confidence Jumps 4.1pts To 87.5 –
Highest Since January 2023 After Negative Sentiment Subsides
ANZ-Roy
Morgan Consumer Confidence increased 4.1pts to 87.5 this week and has finally
broken out of the sub-85 range for the first time in 90 weeks – and now at
its highest since January 2023. Consumer
Confidence is now 9.3 points above the same week a year ago, October 16-22,
2023 (78.2), and 5.2 points above the 2024 weekly average of 82.3. A look at Consumer
Confidence by State shows increases in all five mainland States this week
with the largest increases in New South Wales, Queensland and South
Australia. A look across the index
shows most of the increase was driven by a fall in negative sentiment – all
five indicators showed negative sentiment falling to multi-year lows. Current
financial conditions Future
financial conditions Short-term
economic confidence
Medium-term
economic confidence
Time
to buy a major household item
ANZ
Economist, Madeline Dunk, commented: ANZ-Roy
Morgan Australian Consumer Confidence jumped 4.1pts last week to reach its
highest level since January 2023. All subindices improved, with households’
confidence in their current and future financial conditions reaching a
90-week high. The ‘time to buy a major household item’ subindex also rose to
its highest level since January 2023. The boost in confidence may be linked
to last week’s stronger than expected labour
market data which
showed employment grew 64.1k in September and the participation rate was at a
record high. Inflation
expectations continued trending downwards. The measure dropped 0.1ppts last
week to 4.5%, its lowest reading since late 2021. RBA Assistant Governor
Sarah Hunter noted last week that the RBA are “not currently concerned that
[inflation] expectations could become de-anchored in the near term”.
22 October, 2024 Source:
https://www.roymorgan.com/findings/9595-anz-roy-morgan-consumer-confidence-october-22 MULTICOUNTRY STUDIES
865-871-43-26/Polls Consumer
Confidence Largely Up Latin American Countries
Ipsos’ Global Consumer Confidence Index shows no
significant change since last month (+0.4 point) and is now at 49.1. The
index shows stability for the sixth consecutive month and is more than a
point higher than its reading from this time last year. The Expectations index is the only sub-index to show
a significant gain this month. The Current, Investment, and Jobs indices all
remained stable. Consumer confidence is mixed among European
countries. Sentiment is up in both Germany (+4.7 points) and France (+3.2
points). Both countries have risen to their highest point in more than two
years. In contrast, sentiment is down in Sweden (-3.3 points). The Global Consumer Confidence Index is the average
of all surveyed countries’ Overall or “National” indices. This month’s
installment is based on a monthly survey of more than 21,000 adults under the
age of 75 from 29 countries conducted on Ipsos’ Global Advisor online
platform. This survey was fielded between August 23 and September 6, 2024.
Consumer sentiment in 29
countries Among the 29 countries, Singapore (62.5) now holds
the highest National Index score. Singapore, along with India (62.0) and
Indonesia (61.5) are the only countries with a National Index score of 60 or
higher.
Eleven other countries now show a National Index
above the 50-point mark: the Netherlands (57.4), Mexico (55.9), the U.S.
(55.0), Great Britain (54.1), Sweden (54.0), Germany (53.7), Thailand (52.1),
Brazil (51.3), Malaysia (51.2), South Africa (50.5), and Australia (50.2). In contrast, just four countries show a National
Index below the 40-point mark: South Korea (39.7), Japan (39.4), Hungary
(36.4), and Türkiye (30.8). Compared to 12 months ago, just three countries show
a significant drop in consumer sentiment. In contrast, eleven countries show
a significant increase, most of all in Argentina (+12.3), and Germany
(+8.7).
Trends Ipsos’ Global Consumer Confidence Index (based on
all 29 countries surveyed) currently reads at 49.1, up an insignificant 0.4
point since August. Based only on the “legacy 20 countries” tracked since
March 2010, it would read at 47.4. The Current sub-index, reflecting consumers’
perceptions of the economic climate and their current purchasing, jobs, and investment
confidence, is relatively unchanged (+0.2 point) and sits at 40.0. Nine countries
show a significant month-over-month gain (at least 2 points) in their Current
sub-index, and seven countries show a significant loss. The Investment sub-index, indicative of consumers’
perception of the investment climate, is up an insignificant 0.4 point and
now sits at 42.4. In total, eight countries show a significant gain in their
Investment sub-index this month while seven countries show a significant
loss. The Expectations sub-index, indicative of consumer
expectations about future economic conditions, is up 0.7 point this month and
sits at 57.7. Seven countries show significant gains in their Expectations
sub-index, compared to just three that show a significant loss. The Jobs sub-index, reflecting perceptions about
jobs security and the jobs market, is nearly unchanged (+0.1 point) and is
now at 57.5. Seven countries show significant gains in their Jobs sub-index,
and five countries show significant losses. Of note, Türkiye is the only country to show
significant losses (of at least 2 points) across all four sub-indices. In
contrast, Mexico and France both show significant month-over-month gains
across all four sub-indices. 20 September, 2024 Source:
https://www.ipsos.com/en/september-2024-consumer-confidence-largely-latin-american-countries 865-871-43-27/Polls Understanding
Digital Concerns, A Survey Across 29 Countries
The Worldwide Independent Network of MR (WIN), the
world’s leading independent association in market research and polling, today
reveals findings from the Annual WIN World Survey on data collection, misuse
and AI. The WIN annual survey explores the views and beliefs of 33,866 people
in 39 countries across the globe. Concerns over the data
shared online Countries such as Brazil, South Korea, and Indonesia
exhibit the highest levels of concern regarding digital privacy. Conversely,
Malaysia, Palestine, and the Ivory Coast report the lowest levels of concern.
Awareness of Data Handling
Practices The survey also uncovers varying
levels of awareness regarding what happens to personal data once it is
shared. Globally, the understanding of data handling practices remains
relatively low, with notable regional differences. In Africa, only 16% of
respondents feel they know what happens to their data, while awareness is
slightly higher in Europe at 25%. The MENA region and APAC
countries report awareness levels of 31% and 33%, respectively. The Americas
show the highest confidence, with 36% of respondents expressing an
understanding of data practices. On a national scale, Nigeria shows the highest level
of misunderstanding, with 67% of participants expressing confusion and only
5% claiming to understand the fate of their personal data. In contrast,
Indonesia demonstrates the highest level of understanding, with 55% of
respondents confident in their knowledge of data handling. AI Understanding Varies by
Age The level of understanding of AI is
fairly low across the globe. The countries with higher levels of
understanding are the Americas and APAC at 28%, followed by Europe and the
MENA region at 22% and lastly Africa at 11%. Understanding of artificial intelligence appears to
decline with age, showing a negative correlation between age and confidence
in AI knowledge. Among 18–24-year-olds, 30% of respondents report having a
good understanding of AI. However, this confidence gradually decreases with
each successive age group: 28% for those aged 25-34, 26% for 35-44, 22% for
45-54, and 21% for 55-64. The lowest level of confidence is found among those
aged 65 and older, with only 16% feeling they have a good understanding of AI.
Globally Overwhelmed by
Social Media Half of the people globally
surveyed believe that social networks overwhelm their lives, with notable
differences based on gender and education level. Women are more likely to
feel this way, with 52% agreeing, compared to 48% of men. The sentiment is
also stronger among those with higher education: 54% of respondents with a
university degree and 51% of those with a master’s or PhD agree that social
networks have an overwhelming impact on their lives. Meanwhile, those with no
education (41%) or lower levels such as primary (44%) or secondary (49%) report lower
levels of concern. Europe and the MENA region are the most overwhelmed
with 57% of people feeling that way, followed by 51% in the Americas, 45% in
APAC and 18% in Africa. Richard Colwell, President
of WIN International Association, states “These findings highlight the diverse perspectives
and concerns that are shaping our relationship with technology in 2024. As we
navigate this digital landscape, understanding these global sentiments is
crucial for fostering a more informed and secure online environment.” 29 September, 2024 Source:
https://winmr.com/understanding-digital-concerns/ 865-871-43-28/Polls 45% Of
The Population Considers Mental Health To Be The Main Challenge Facing
Society
The World Health Organization (WHO) has classified
stress as the "health epidemic of the 21st century." The constant
demands of work, personal life, and technology have generated chronic stress
levels in a large part of the population, especially in urban and developed
societies. On the occasion of World Mental Health Day, which is celebrated on
October 10, Ipsos presents once again its study "World Mental Health
Day" in which it analyzes the population's perceptions of mental health
and how it is addressed by the health system. Mental health at the
forefront of health concerns In this context, it is normal that there is a
consensus among the population that mental health and physical health are
equally important, an idea shared both globally (76%) and in Spain (73%); But
it is appreciated how people still say that they think more often about their
physical well-being than about their mental well-being. 57% of the Spanish
population says they often think about their mental health compared to 74%
who say they think about their physical health. This trend is shared at the level of gender and age,
but with great differences. Women (63%) think more (63%) than men (52%) about
their mental health, as well as younger generations, where Z (61%) and
Millenials (62%) are the ones who are more aware of their mental well-being
compared to Baby Boomers (46%), who think much more about their physical
health, with 77%. Stress, a conditioning
factor in daily life and work Stress has established itself as one of the main
factors affecting mental health globally. Modern life, characterized by the
constant demands of work, social pressures and economic uncertainty, has
caused 62%, on average, of the world's population to experience episodes of
stress that impacted their daily lives. In Spain, this figure is very
similar, reaching 60%. The impact of stress is more evident among women
than men, but without great contrasts in the case of Spain. While 62% of
women say they have felt stressed in the last year, we find that this
percentage drops 5 points in men (57%). Where we find the greatest difference
between genders is when stress makes them feel overwhelmed, with a difference
of 9 points, 44% of men declare that they have felt this way compared to 53%
of women. At the age level, we do find important differences
in terms of the impact of stress on daily life. In Spain, it is the younger
generations who report having suffered it one or more times in the last year,
72% among Millennials (25-40 years old) and 62% among Z (18-24 years old),
figures far removed from the 39% of Baby Boomers (56-74 years old). Likewise, the effects of stress are not limited to
personal life, but are also reflected in the work environment. Globally, an
average of 25% of Gen Z youth report missing work due to stress in the past
year. In Spain, this phenomenon affects 51% of Millenials and 50% of Z
Millenials, pointing to this generation as the most vulnerable to the effects
of stress. At the gender level there are no significant differences, both men
(33%) and women (34%) have been absent from their jobs due to stress. How does the health system
act in the face of mental health? Despite the fact that mental health is the greatest
health concern for the population, many feel that it does not receive the
same attention as physical health in the health system. In Spain, 40% of
society perceives that physical health is treated as more important than
mental health.
07 October, 2024 Source:
https://www.ipsos.com/es-es/informe-ipsos-dia-mundial-de-la-salud-mental 865-871-43-29/Polls More
Than One In Two Feel Their Country Needs To Do More On Its Infrastructure
Needs; A Survey Across 32 Nations
In the third Global Infrastructure Index people are
more satisfied with their country’s infrastructure, but there is one in two
that think greater work is needed. Key findings:
The latest Global
Infrastructure Index finds a moderate improvement in
citizens’ ratings of infrastructure around the world since the last survey in
2023. There is also a continued sense that further
investment in infrastructure is necessary, that it will create jobs and boost
the economy, and help to combat climate change. The survey - carried out in early Summer 2024 in 32
countries by Ipsos in collaboration with the Global Infrastructure Investor Association (GIIA) - finds a
majority in most countries, and a global country average of 68%, agree that
investing in infrastructure will create
new jobs and boost the economy. In most countries, a majority - 57% on average -
think infrastructure can also make an important
contribution to combating climate change. More than half of citizens. 56%, think their country
is not doing enough to meet its
infrastructure needs. They are mostly unsure about their country’s record
of delivering national infrastructure
projects – while 33% are positive and 26% are negative, 41%
are neither positive nor negative or say they don’t know. A higher proportion agree (40%) than disagree (26%)
that spending should be increased to
improve infrastructure even if it means higher taxes or costs
for consumers, but 34% are unsure or say they don’t know. Some infrastructure
sectors are rated better than others Overall satisfaction with infrastructure has
improved within most regions of the world including APAC and Europe, as well
as in G7 countries. The global country average level of satisfaction
with infrastructure overall is higher at 40% (up two points since 2023) than
the average level of dissatisfaction at 27% (down three points), but many
people are unsure with a third (33%) neither satisfied nor dissatisfied or
answering don’t know. There is considerable variation in ratings of
individual infrastructure sectors. Ratings range from a global country
average of 72% for airports as
very or fairly good, to an equivalent 32% for flood defences.
In all cases, ratings
of sectors have improved since 2023 (when 31 countries were
involved). Ratings of airports, rail infrastructure, renewable energy and EV
infrastructure have improved the most, by four percentage points. On average, 42% rate the ten infrastructure sectors
covered by the survey as being fairly or very poor, down slightly on 44% last
year. The average positive rating has improved by a
similar margin – three points – up from 47% in 2023 to 50% this year. There is considerable
variation in sentiment between countries The survey finds a gap of 59 percentage points
in overall levels of satisfaction with
infrastructure across the 32 countries. As in 2023, citizens in Singapore, India, Indonesia
and Netherlands are among the most
positive, with Peru, Italy, Hungary and Romania among the most negative. There is a large range in terms of ratings of
infrastructure sectors with Indonesia and Singapore vying for top spot for
most sectors and a mix of LATAM and European countries having the lowest
proportion of positive citizens. Citizens prioritise flood
defences, water supply and sewerage, more than anything else, but this is not
a uniform picture As in previous Global Infrastructure Index surveys,
there is strong competition for the top infrastructure investment priorities.
Solar energy had
featured prominently in the past - chosen on average by 42% from a list of 14
sectors in 2023 – and while selections are down five points this year, it
remains in the top four. It has been there with flood defences, water supply and sewerage and new housing supply for several
years. There is some variation in
infrastructure investment priorities among the 32 countries, (shown in the
appended table):
Also notable:
|