|
BUSINESS
& POLITICS IN THE WORLD GLOBAL
OPINION REPORT NO. 872-879 Week: November 04 – December
29, 2024 Presentation: January 03, 2025 872-879-43-29/Commentary:
Nearly 88% Of Chinese View Japan In A Negative Light Nearly
88% Of Chinese View Japan In A Negative Light South
Korea’s Parliament Votes To Impeach President Yoon Suk-Yeol Over His Martial
Law Order The
Impact Of AI Technology On Indonesia’s Job Market And Economy Only
19 In 100 Nigerians Have Health Insurance, New Poll Reveals Majority
Of Nigerians Have Considered Emigration In Search Of Opportunity 7
In 10 Nigerians Are Dissatisfied With 2024 In All Aspects What
Bothers Britons Most About Donald Trump Becoming President Again? As
2025 Approaches, What Do Britons Say Has Been The Biggest Event Of The Last
25 Years 57%
Of The UK Public Think There Will Always Be Significant Levels Of
Homelessness 53%
Of French People Want The Barnier Government To Be Censured Are
Americans Concerned About Global Warming Public
Narrowly Approves Of Trump’s Plans; Most Are Skeptical He Will Unify The
Country Wide
Partisan Divisions Remain In Americans’ Views Of The War In Ukraine Roughly
Half Of Americans Are Knowledgeable About Personal Finances Most
Americans Feel Good About Their Job Security But Not Their Pay Teens,
Social Media And Technology 2024 Americans
Lean Toward Keeping Legal Immigration Steady, See High-Skilled Workers As A
Priority 34%
Of Canadians Believe The Development Of AI Technologies Is A Bad Thing; 30%
Think It’s Good 25%
Say Interest Rates And Inflation Are Top Concern While
Trudeau’s Future Is Unclear, All Three Major Federal Leaders Failing To
Connect With Canadians Global
Elections In 2024: What We Learned In A Year Of Political Disruption INTRODUCTORY NOTE 872-879-43-29/Commentary: Nearly 88% Of
Chinese View Japan In A Negative Light
Chinese people’s
perceptions of Japan have sharply declined, possibly due to a rising reliance
on social media for information, a joint Japan-China opinion poll released on
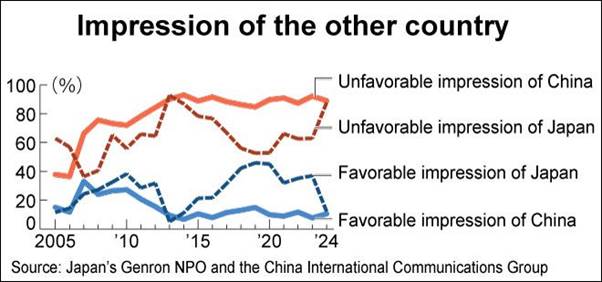
Dec. 2 showed. An overwhelming 87.7
percent of Chinese respondents expressed a negative impression of Japan, a
substantial increase from 62.9 percent in the previous year’s poll. Meanwhile, an even greater
90 percent of Japanese have consistently held an unfavorable view of China in
the surveys over the past decade. The annual survey began in
2005. This year’s was conducted in October and November by Japan’s Genron NPO
and the China International Communications Group. It collected responses from
1,000 people in Japan and 1,500 in China. The survey found that the
Chinese perception of Japan this year is at its second-lowest point since
2013, the year following the Japanese government’s purchase of the Senkaku
Islands in Okinawa Prefecture. Among the Chinese
respondents, 77.6 percent said their impression of Japan had worsened or
somewhat worsened over the past year in particular. The results also shed
light on the increasingly significant role of online sources, including
social media, in shaping these views. With multiple answers
allowed, 53.9 percent of Chinese respondents cited social media as a key
source of information. In addition, 75.2 percent mentioned China’s news
media, and among them, 55.5 percent gained information via the internet on
their mobile devices. Posts critical of Japan
tend to spread easily on China’s online platforms, possibly contributing to
the worsening impression of the country in the latest survey. The issue most frequently
cited, by 35.5 percent of Chinese respondents, as an obstacle to the
development of the two countries’ relations was the release of treated
radioactive water from the Fukushima No. 1 nuclear power plant into the
ocean. Even before the release,
the Chinese government called it “nuclear-contaminated water,” claiming it
was unsafe. While many Chinese
tourists visiting Japan now enjoy sushi and sashimi, a Chinese government
official said, “In China, many people remain hesitant and avoid eating either
due to safety concerns.” This hesitation is likely
influenced by information disseminated by Chinese authorities and media. The proportion of Chinese
people who believe that “Japan-China relations are not important” has surged
from just under 20 percent last year to 60 percent this year. These developments need to
be carefully assessed in consideration of future survey results. TRAVEL
IMPROVES VIEWS Two decades of surveys
have shown one clear finding: 80 to 90 percent of respondents in both
countries have never traveled to the other country or made personal
connections there, fueling negative perceptions. In this year’s survey,
55.6 percent of Chinese respondents who had visited Japan held a favorable
view, while 97.2 percent of those who had never been to Japan viewed it
unfavorably. Since around 2014, the
number of Chinese tourists visiting Japan has increased. In the 2019 survey,
the ratio of those with a favorable view of Japan had recovered to 45.9
percent. Many Japanese expatriates
living in China also tend to have a positive view of locals, rather than the
Chinese government. However, the number of
Japanese travelers to China has also decreased over the past decade, and the
deterioration in relations between the two countries appears to be the result
of stagnating dialogue and exchanges. (Asahi Shimbun) 03 December, 2024 Source:
https://www.asahi.com/ajw/articles/15534487 SUMMARY OF POLLS ASIA (China) Nearly 88% Of Chinese View
Japan In A Negative Light Chinese people’s
perceptions of Japan have sharply declined, possibly due to a rising reliance
on social media for information, a joint Japan-China opinion poll released on
Dec. 2 showed.An overwhelming 87.7 percent of Chinese respondents expressed a
negative impression of Japan, a substantial increase from 62.9 percent in the
previous year’s poll.Meanwhile, an even greater 90 percent of Japanese have
consistently held an unfavorable view of China in the surveys over the past
decade. (Asahi Shimbun) 03 December, 2024 (South Korea) South Korea’s Parliament Votes
To Impeach President Yoon Suk-Yeol Over His Martial Law Order South Korea’s parliament
voted Saturday to impeach President Yoon Suk-yeol over his short-lived
martial law decree, a historic rebuke that was cheered by jubilant crowds who
described the outcome as another defiant moment in the nation’s resilient
democratic journey.The National Assembly passed the motion 204-85 in a floor
vote. Yoon’s presidential powers and duties will be suspended and Prime
Minister Han Duck-soo, the country’s No. 2 official, will take over his
authority once copies of a document on the impeachment are delivered to Yoon
and to the Constitutional Court. (Asahi Shimbun) 14 December, 2024 (Pakistan) Internet Use In Pakistan On The
Rise: More Than Half (51%) Of The Population Is Now Online, With Men And
Urban Residents Outpacing Others In Usage According to a survey
conducted by Gallup & Gilani Pakistan, more than half (51%) of the
Pakistani population is now online, with men and urban residents outpacing
others in usage. A nationally representative sample of adult men and women
from across the country was asked the question, “Please tell if you engaged
in any of the following yesterday. Even if it was for a short time? - Used
the internet” In response, 51% said ‘Yes’, 49% said ‘No’. (Gallup Pakistan) 13 December, 2024 41% Pakistani Household Report
Having One Person With An Undergraduate Or Higher Degree, Including 38% Of
Rural Residents And 35% Of Those With Less Than An FA Qualification According to a survey
conducted by Gallup & Gilani Pakistan, 41% Pakistani household report
having one person with an undergraduate or higher degree, including 38% of
rural residents and 35% of those with less than an FA qualification. A
nationally representative sample of adult men and women from across the
country was asked the question, “Please tell me if anyone in your family has
completed Bachelors (BA) or a higher educational degree?” In response, 41%
said ‘Yes’, 57% said ‘No’ and 2% said they don’t know or gave no response. (Gallup Pakistan) 27 December, 2024 (Indonesia) The Impact Of AI Technology On
Indonesia’s Job Market And Economy Artificial Intelligence
(AI) technology has become a transformative force in global economies. And as
Southeast Asia’s largest economy, Indonesia is absolutely included in this
phenomenon. According to a report by McKinsey in 2023, AI could contribute up
to USD 366 billion annually to
Indonesia’s GDP by 2030, provided the country adopts AI across
sectors such as manufacturing, agriculture, and services. (Snapcart) 09 December, 2024 AFRICA (Nigeria) Only 19 In 100 Nigerians Have
Health Insurance, New Poll Reveals A new public opinion poll
conducted by NOIPolls has revealed that only a handful of adult Nigerians (19
percent) are covered by health insurance policies in the country.
Unfortunately, most adult Nigerians (79 percent) are not covered by the
scheme as they pay out of pocket for healthcare. This corroborates
Dataphyte’s publication of December 24, 2021, which reports that Health
insurance has barely scratched the surface in Nigeria with regards to
percentage coverage of the population as 97% of Nigeria’s population is not
covered by any health insurance. (NOI Polls) 26 November, 2024 Majority Of Nigerians Have
Considered Emigration In Search Of Opportunity More than half (56%) of
Nigerians say they have considered leaving Nigeria, a 20- percentage-point
increase compared to 2017 (36%). The share who say they have given “a lot” of
thought to the idea has tripled, from 11% to 33%. Thoughts of emigrating are
particularly common among the most educated citizens (71% of those with
post-secondary qualifications), urban residents (63%), and youth (60% of 18-
to 35-year-olds). Two-thirds (66%) of citizens who are unemployed and looking
for work say they have thought about leaving Nigeria, while many full-time
(58%) and part-time workers (56%) have also considered emigration. (NOI Polls) 19 December, 2024 7 In 10 Nigerians Are
Dissatisfied With 2024 In All Aspects A new public opinion poll
conducted by NOIPolls revealed that most adult Nigerians nationwide (71
percent) disclosed that they are dissatisfied with the year 2024 mainly due
to increased inflation and economic hardship in the country. This is not
surprising as the National Bureau of Statistics recently announced that
Nigeria’s inflation further rose by 0.72 percent on a month-on-month basis to
34.60 percent in November 2024. Analysis by geopolitiical zones indicated
that the 43 percent of residents in the North-West zone were very
dissatisfied with 2024, the highest proportion across all zones who made this
assertion. (NOI Polls) 25 December, 2024 WEST EUROPE (UK) What Bothers Britons Most About
Donald Trump Becoming President Again? Donald Trump’s election
victory at the beginning of November was not what many Britons were hoping
for. A pre-election study found that 61% of Britons had wanted
Kamala Harris to win, with just 16% backing Trump, and a YouGov poll in the
immediate aftermath of the election similarly found 60% unhappy about the
result and 16% happy.Britons gave a long and varied list of reasons why they
were unhappy with Donald Trump (and many gave more than one reason), but the
criticism that came up in answers the most often is that Trump is a criminal. (YouGov UK) 04 December, 2024 56% Of Britons Identify As
Working Class, While Seeing Job And Income As The Most Important Factors In
Identifying Class In terms of how Britons
see themselves, 56% of the public consider themselves to be working class,
while 36% would describe themselves as middle class. Less than 1% of the
public identify as ‘upper class’. This represents a small increase in working class identity
since 2019,
when 51% of Britons described themselves as working class, compared to 39%
identifying as middle class.Notably, this differs from more formal social
classifications, such as NRS social grade, which divides Britain into ABC1s,
the 57% of Britons who are said to live in middle class households, and
C2DEs, the 43% considered to live in working class households. (YouGov UK) 12 December, 2024 As 2025 Approaches, What Do
Britons Say Has Been The Biggest Event Of The Last 25 Years The end of the year is
always a moment to look back and reflect on the events of the last 12 months,
but as we approach the year 2025, now provides an opportunity to reminisce
over the first quarter of the 21st Century.Pedants will point out that the
beginning of the century was actually the start of 2001, not the start of
2000. But few of the public think this way (13%), with the overwhelming
majority considering the millennium to have begun at the start of 2000 (79%)
– certainly that is when all of the celebrations took place! (YouGov UK) 19 December, 2024 57% Of The UK Public Think
There Will Always Be Significant Levels Of Homelessness The new Ipsos poll
commissioned by St. Mungos, a leading homelessness charity in the country,
highlights that 57 per cent of surveyed people think that there will always
be significant levels of homelessness in the UK.The survey also highlights
that people’s worries around homelessness (27%) are overshadowed by broader
concerns around the cost-of-living crisis, with 70% of respondents worried
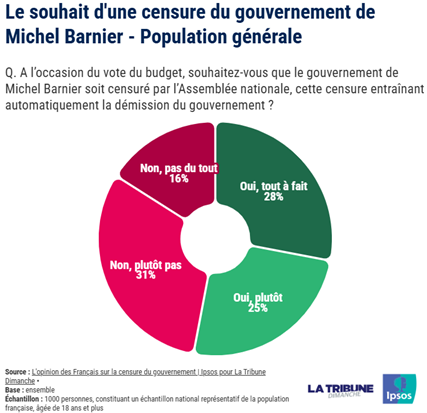
about inflation. (Ipsos MORI) 12 December, 2024 (France) 53% Of French People Want The
Barnier Government To Be Censured The Ipsos survey for La Tribune in November 2024 reveals that a majority of French people (53%) want Michel Barnier's government to be censured when the
budget is voted. However, this figure hides significant disparities according to political sympathies.While
censorship is desired by a large majority of supporters of the New Popular Front (88% among
supporters of France Insoumise,
73% of the PS, 55% of EELV), it is much less popular among
supporters of the majority parties (15% among those of Renaissance, Horizons and Modem, 17%
among LR and UDI). RN supporters are also in favour of
censorship (67%). (Ipsos France) 28 November, 2024 NORTH AMERICA (USA) Are Americans Concerned About
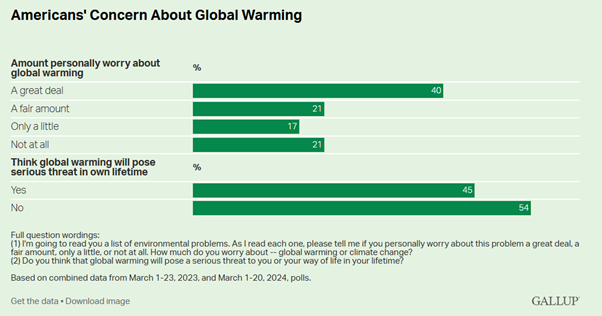
Global Warming Nearly two-thirds of U.S.
adults are concerned about global warming or climate change, with 61%
worrying about it “a great deal” (40%) or “a fair amount" (21%). Separately,
nearly half of Americans (45%) believe global warming will pose a serious
threat to themselves or their way of life in their lifetime. While less than
half of Americans say climate change will pose a serious threat to their way
of life in their lifetime, about six in 10 every year since 2016 have
said the effects of global warming have already
begun. (Gallup) 13 December, 2024 Public Narrowly Approves Of
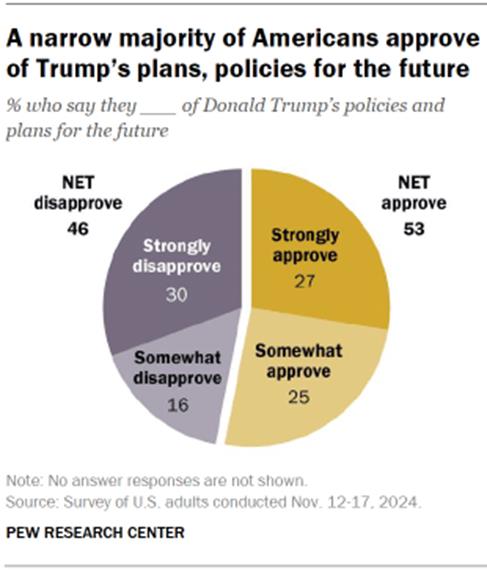
Trump’s Plans; Most Are Skeptical He Will Unify The Country Following Donald Trump’s
victory in the Nov. 5 presidential election, Americans narrowly approve of
the president-elect’s plans and policies for the future. Roughly half of U.S.
adults (53%) approve of his plans, while 46% disapprove.Nearly six-in-ten Americans
(59%) say they are very or somewhat confident in the president-elect to make
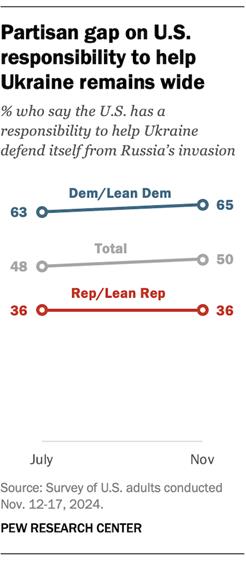
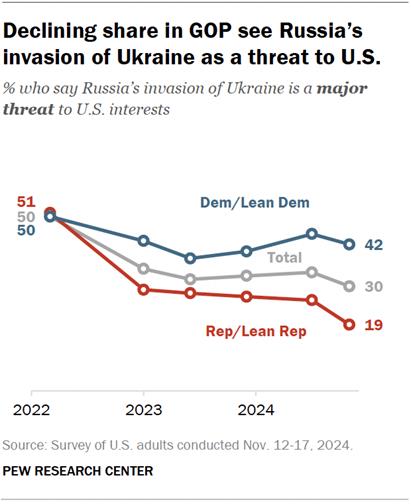
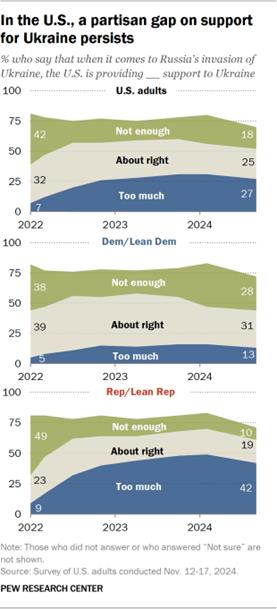
good decisions about economic policy. (PEW) 22 November, 2024 Wide Partisan Divisions Remain
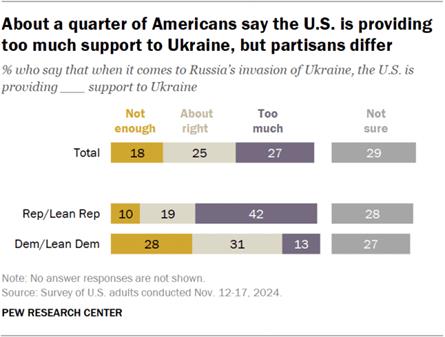
In Americans’ Views Of The War In Ukraine Nearly three years into
the war in Ukraine, President-elect Donald Trump has been promising a swift end to the conflict when he takes office. Americans’
views about U.S. support for Ukraine have shifted little in recent months,
but there continue to be wide partisan differences, according to a Pew
Research Center survey conducted Nov. 12-17. Republicans are far more likely
than Democrats to say the United States is providing too much support to
Ukraine (42% vs. 13%). (PEW) 25 November, 2024 Roughly Half Of Americans Are
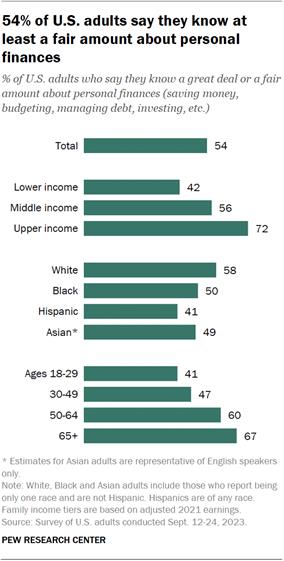
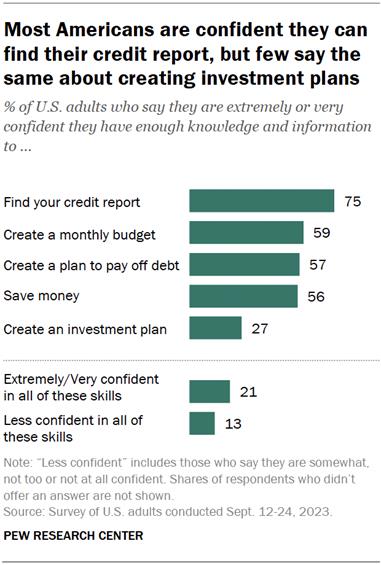
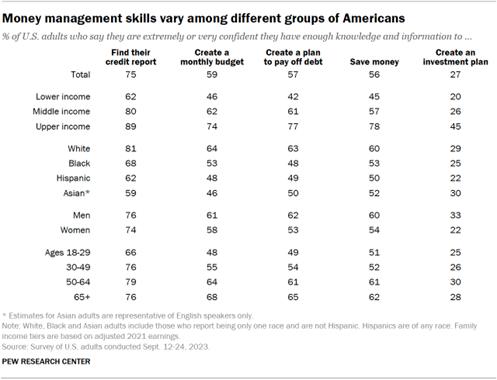
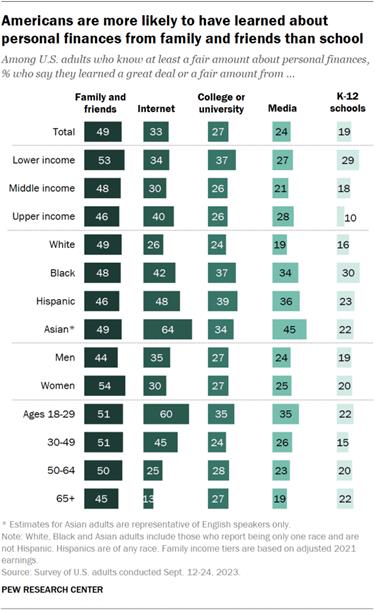
Knowledgeable About Personal Finances About half (54%) of U.S.
adults say they know a great deal or a fair amount about personal finances.
Another 33% say they know some about personal finances, while 13% say they
don’t know much or know nothing at all, according to a 2023 Pew Research
Center survey.Knowledge about personal finances can refer to several
strategies for managing money, including saving, budgeting, managing debt or
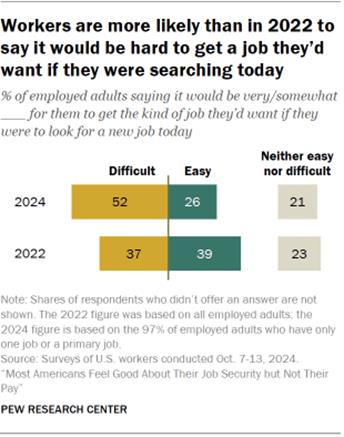
investing. (PEW) 09 December, 2024 Most Americans Feel Good About
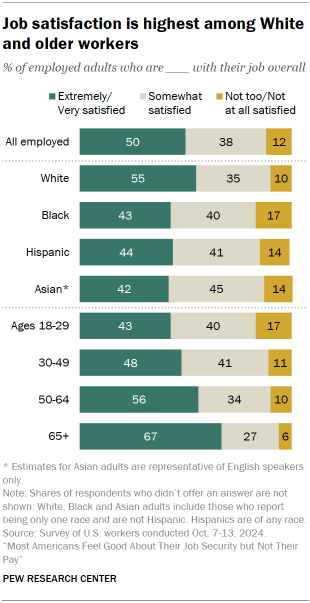
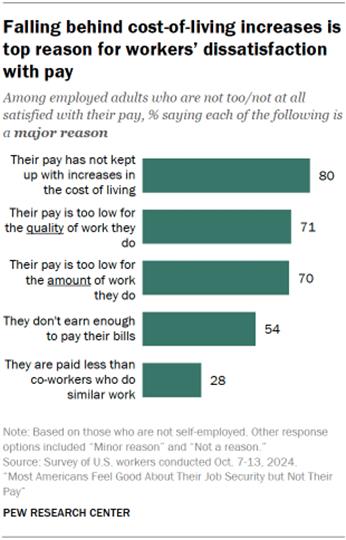
Their Job Security But Not Their Pay Amid low unemployment
nationwide, U.S. workers are feeling good about their level of job security,
and relatively few expect to look for a new job in the coming months,
according to a new Pew Research Center survey. At the same time, only half of
workers say they are extremely or very satisfied with their job overall. And
a much smaller share are highly satisfied with their pay – 30%, down from 34%
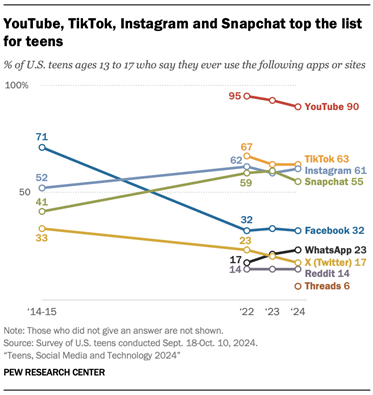
last year. (PEW) 10 December, 2024 Teens, Social Media And
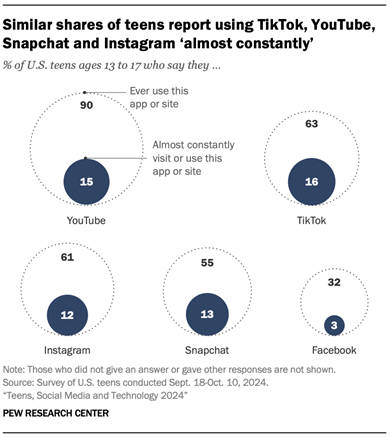
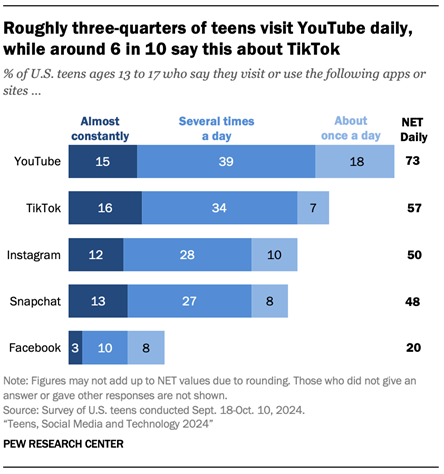
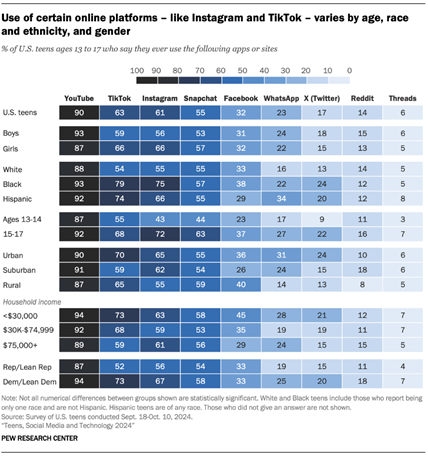
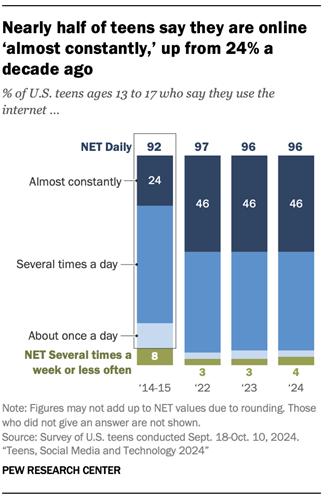
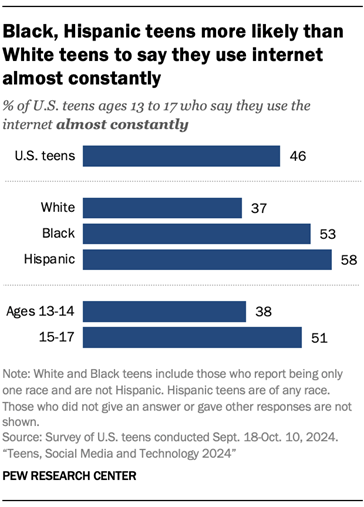
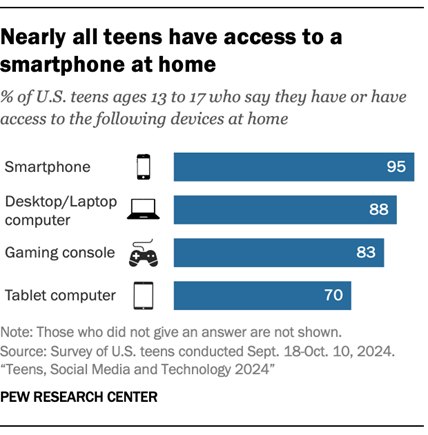
Technology 2024 Debates about teen social
media use often center on how much time teens spend on these platforms. As
lawmakers explore potential regulations, our 2023 survey found a majority of
Americans support time limits for minors on social media.Our current survey
asked teens how often they use five platforms: YouTube, TikTok, Instagram,
Snapchat and Facebook. Overall, 73% of teens say they go on YouTube daily,
making YouTube the most widely used and visited
platform we asked about. This share includes 15% who describe their use as
“almost constant.” (PEW) 12 December, 2024 Americans Lean Toward Keeping
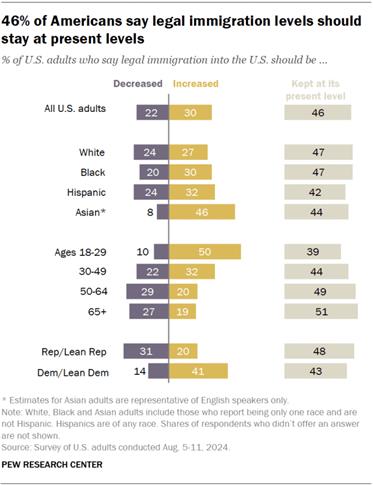
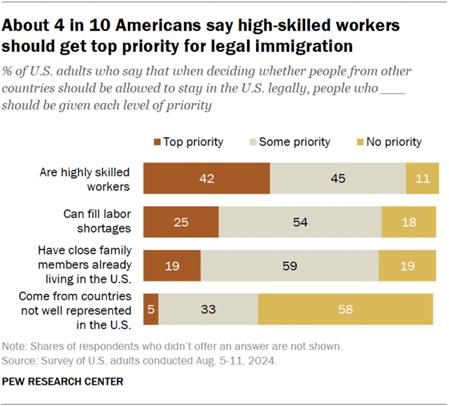
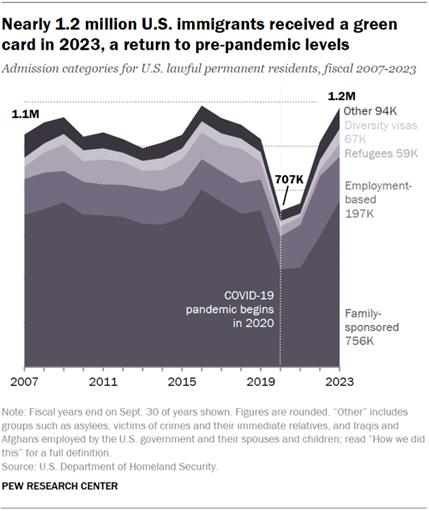
Legal Immigration Steady, See High-Skilled Workers As A Priority Nearly half of U.S. adults
say legal immigration into the United States should be kept at present
levels. Fewer say it should be increased or decreased, according to a Pew
Research Center survey conducted in August 2024. Each year, about 1 million
immigrants receive legal permanent residence (a green card) and are legally
admitted to the U.S. Most of them are eligible because they have family
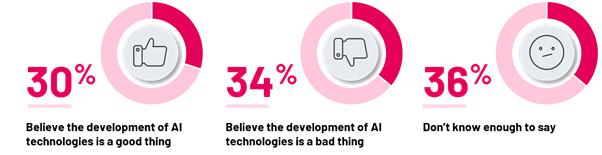
already in the country. (PEW) 19 December, 2024 (Canada) 34% Of Canadians Believe The
Development Of AI Technologies Is A Bad Thing; 30% Think It’s Good Canadians are divided on
whether the development of AI technologies is a good or bad thing, with three
in ten (30%) saying it is good, particularly those aged 18-34 (37%) vs those
aged 55+ (24%) and men (34%) compared to women (26%). Those with children in
their household (37%) also think it is a good thing compared to those without
children in their household (28%).
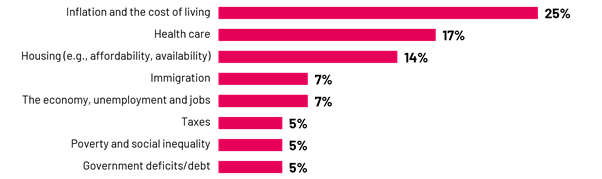
20 December, 2024 25% Say Interest Rates And
Inflation Are Top Concern Interest rates and
inflation are the top concerns for Canadians, with a quarter (25%;+5pts
since November 2023) ranking it as the most important issue facing Canada
today. Health care (17%; +3pts) and housing (14%; +1pt) round out the top
three most pressing concerns for Canadians. Other top issues include
immigration (7%), the economy (7%), taxes (5%), and poverty and social
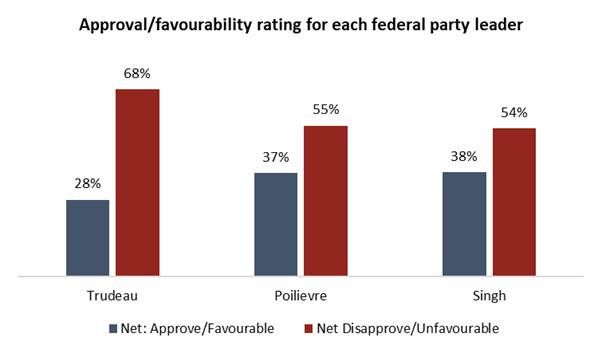
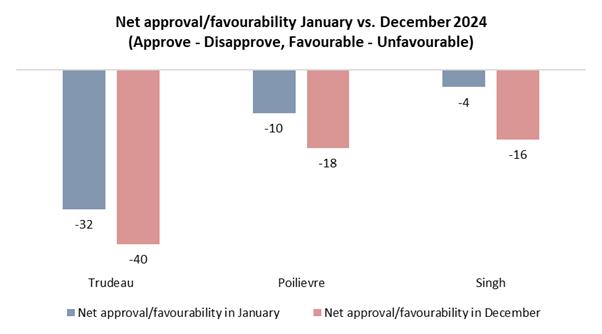
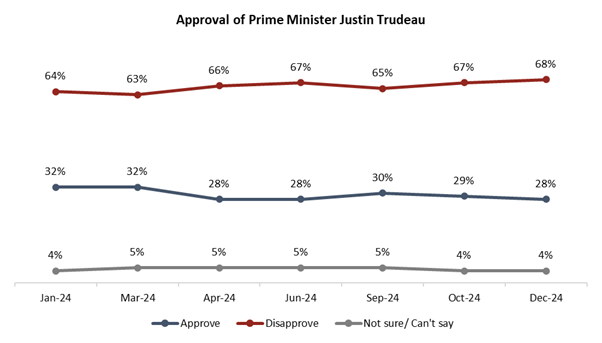
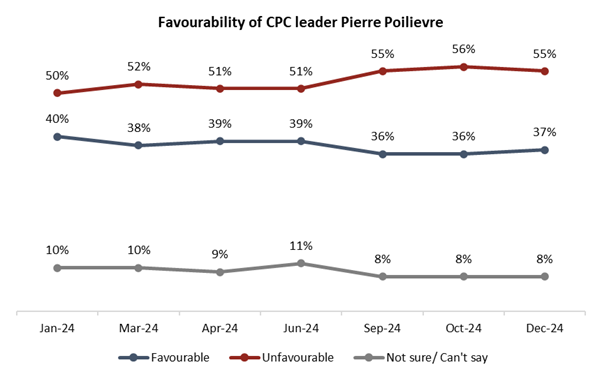
inequality (5%) and government deficits/debt (5%). (Ipsos Canada) 27 December, 2024 While Trudeau’s Future Is
Unclear, All Three Major Federal Leaders Failing To Connect With Canadians New data from the
non-profit Angus Reid Institute finds that Trudeau endured a difficult 2024
in the public eye, seeing his approval rate fall four points between January
and December to just 28 per cent. This is tied for his lowest point in public
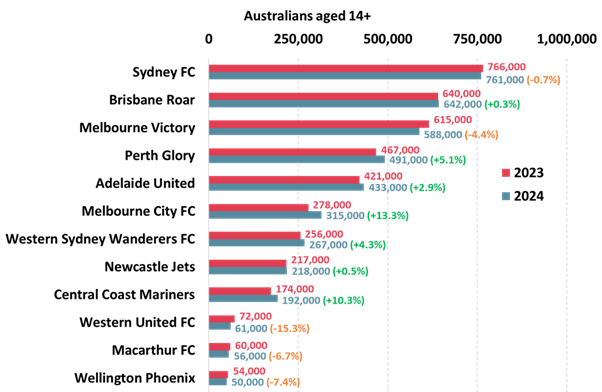
opinion, after more than nine years in the nation’s top job. (Angus Reid Institute) 20 December, 2024 AUSTRALIA Sydney FC Is Again The Most
Widely Supported A-League Club Ahead Of The Brisbane Roar And Melbourne
Victory The Brisbane Roar is clearly in second place with 642,000
supporters, virtually unchanged on a year ago. The Roar has also been amongst
the most successful clubs in the history of the A-League and has won 3
Championships – although their last victory was over a decade ago in 2014.In
a clear third place is the Melbourne Victory with 588,000 supporters,
representing a significant decrease of 27,000 (-4.4%) on a year ago – the
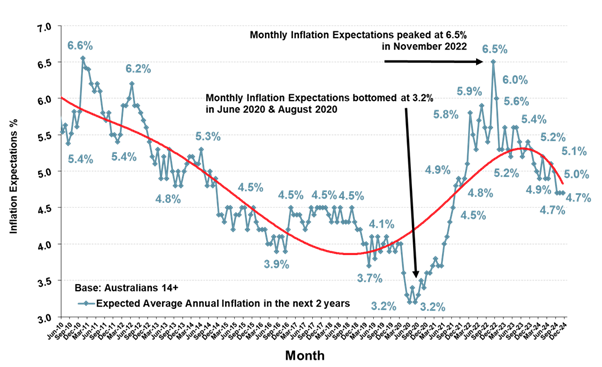
largest decline of any club in the competition. (Roy Morgan) 17 December, 2024 ANZ-Roy Morgan Inflation Expectations Are At
4.8% In Mid-December – Up From 4.7% For The Month Of November A look at monthly
Inflation Expectations for November 2024 shows the measure at 4.7% for the
month – unchanged from the last two months of September and October and below
the average so far this year of 4.9%.Looking back over the year, weekly
Inflation Expectations have moved in a narrow band of 4.5% - 5.3% and
averaged 4.9%. In addition, the latest information on weekly Inflation
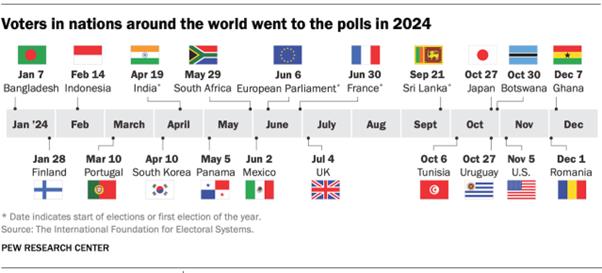
Expectations is available to view each week in the Roy Morgan Weekly Update video on YouTube. (Roy Morgan) 17 December, 2024 MULTICOUNTRY STUDIES Global Elections In 2024: What We Learned In A
Year Of Political Disruption 2024 was a remarkable year
for elections as voters in more than 60 countries went to the polls. It also turned out
to be a difficult year for incumbents and traditional political parties.
Rattled by rising prices, divided over cultural issues and angry at the political status quo, voters in many countries sent a message
of frustration.While every election is shaped by local factors, economic challenges were a consistent theme across
the globe. That included the U.S., where the economy was the top issue for registered voters – especially
for those who supported Trump. (PEW) 11 December, 2024 2024
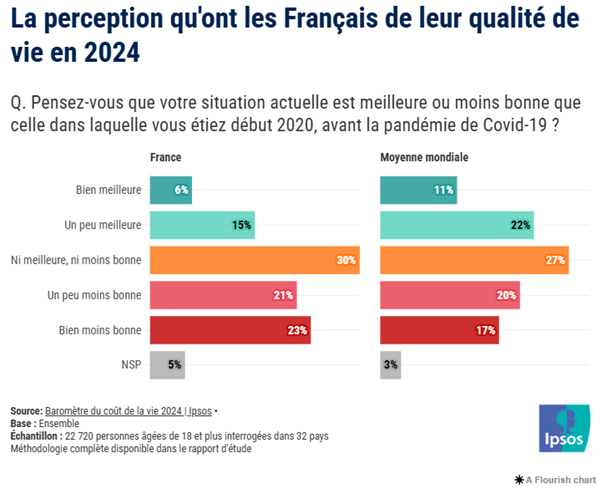
Cost Of Living Barometer: 41% Of French People Anticipate A Drop In Their
Purchasing Power, A Global Study Across 32 Nations The new edition of the
Ipsos barometer on the "Cost of Living" reveals a striking duality: on the one hand,
economists and political decision-makers are delighted with the trend towards deflation, used as a
justification to reduce the return on the Livret A, a popular savings
product. On the other hand, 68% of
French people think that prices will continue to rise and 44% say that their
quality of life has declined since the Covid-19 pandemic. (Ipsos France) 05 December, 2024 December
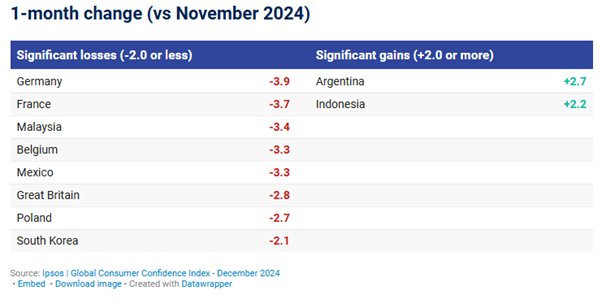
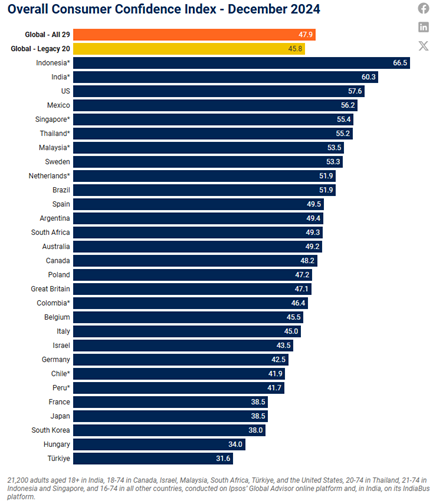
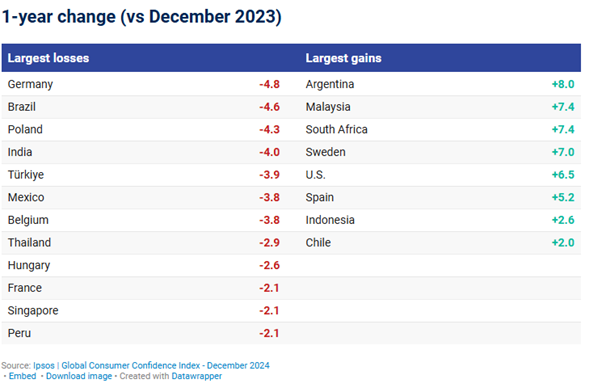
2024: Consumer Confidence Down Globally For The Second Consecutive Month, 29
Countries Surveyed Ipsos’ Global Consumer
Confidence Index is down 0.7 point since last month and sits at 47.9. The index
has declined for the second consecutive month and is now 1.5 points lower
than its reading to begin 2024. Among 29 economies measured, just two
countries show significant gains in consumer sentiment, while eight countries
show a notable decline. (Ipsos Global) 20 December, 2024 Source:
https://www.ipsos.com/en/ipsos-consumer-confidence-december-2024 ASIA
872-879-43-01/Polls Nearly 88% Of Chinese View Japan In A Negative Light
Chinese people’s
perceptions of Japan have sharply declined, possibly due to a rising reliance
on social media for information, a joint Japan-China opinion poll released on
Dec. 2 showed. An overwhelming 87.7
percent of Chinese respondents expressed a negative impression of Japan, a
substantial increase from 62.9 percent in the previous year’s poll. Meanwhile, an even greater
90 percent of Japanese have consistently held an unfavorable view of China in
the surveys over the past decade. The annual survey began in
2005. This year’s was conducted in October and November by Japan’s Genron NPO
and the China International Communications Group. It collected responses from
1,000 people in Japan and 1,500 in China. The survey found that the
Chinese perception of Japan this year is at its second-lowest point since
2013, the year following the Japanese government’s purchase of the Senkaku
Islands in Okinawa Prefecture. Among the Chinese
respondents, 77.6 percent said their impression of Japan had worsened or
somewhat worsened over the past year in particular. The results also shed
light on the increasingly significant role of online sources, including
social media, in shaping these views. With multiple answers
allowed, 53.9 percent of Chinese respondents cited social media as a key
source of information. In addition, 75.2 percent mentioned China’s news
media, and among them, 55.5 percent gained information via the internet on
their mobile devices. Posts critical of Japan
tend to spread easily on China’s online platforms, possibly contributing to
the worsening impression of the country in the latest survey. The issue most frequently
cited, by 35.5 percent of Chinese respondents, as an obstacle to the
development of the two countries’ relations was the release of treated
radioactive water from the Fukushima No. 1 nuclear power plant into the
ocean. Even before the release,
the Chinese government called it “nuclear-contaminated water,” claiming it
was unsafe. While many Chinese
tourists visiting Japan now enjoy sushi and sashimi, a Chinese government
official said, “In China, many people remain hesitant and avoid eating either
due to safety concerns.” This hesitation is likely
influenced by information disseminated by Chinese authorities and media. The proportion of Chinese
people who believe that “Japan-China relations are not important” has surged
from just under 20 percent last year to 60 percent this year. These developments need to
be carefully assessed in consideration of future survey results. TRAVEL
IMPROVES VIEWS Two decades of surveys
have shown one clear finding: 80 to 90 percent of respondents in both
countries have never traveled to the other country or made personal
connections there, fueling negative perceptions. In this year’s survey,
55.6 percent of Chinese respondents who had visited Japan held a favorable
view, while 97.2 percent of those who had never been to Japan viewed it
unfavorably. Since around 2014, the
number of Chinese tourists visiting Japan has increased. In the 2019 survey,
the ratio of those with a favorable view of Japan had recovered to 45.9
percent. Many Japanese expatriates
living in China also tend to have a positive view of locals, rather than the
Chinese government. However, the number of
Japanese travelers to China has also decreased over the past decade, and the
deterioration in relations between the two countries appears to be the result
of stagnating dialogue and exchanges. (Asahi Shimbun) 03 December, 2024 Source:
https://www.asahi.com/ajw/articles/15534487
872-879-43-02/Polls South Korea’s Parliament Votes To Impeach President Yoon
Suk-Yeol Over His Martial Law Order
South Korea’s parliament
voted Saturday to impeach President Yoon Suk-yeol over his short-lived
martial law decree, a historic rebuke that was cheered by jubilant crowds who
described the outcome as another defiant moment in the nation’s resilient
democratic journey. The National Assembly
passed the motion 204-85 in a floor vote. Yoon’s presidential powers and
duties will be suspended and Prime Minister Han Duck-soo, the country’s No. 2
official, will take over his authority once copies of a document on the
impeachment are delivered to Yoon and to the Constitutional Court. The court has up to 180
days to determine whether to dismiss Yoon as president or restore his powers.
If he’s thrown out of office, a national election to choose his successor
must be held within 60 days. It was the second National
Assembly vote on Yoon's impeachment motion. Last Saturday, Yoon survived an
impeachment vote after most ruling party lawmakers boycotted the floor vote.
Some People Power Party lawmakers had since announced their intentions to vote
for Yoon's impeachment in a second vote, as public protests against Yoon
intensified and his approval rating plummeted. National Assembly Speaker
Woo Won Shik said Yoon’s impeachment was an outcome driven by “the people’s
ardent desire for democracy, courage and dedication.” Hundreds of thousands of
people gathered near the parliament roared in jubilation, waved banners and
brandished colorful K-pop glow sticks, as a lead activist shouted on stage
that “We have preserved the constitutional order!” In a central Seoul plaza,
another huge crowd of people supporting Yoon gathered, but they grew subdued
after hearing Yoon had been impeached. Both rallies have largely been
peaceful. Yoon issued a statement
saying he would “never give up” and calling for officials to maintain
stability in government functions during what he described as a “temporary”
pause of his presidency. “Holding in my heart all
the criticism, encouragement, and support directed at me, I will do my best
for the country until the very last moment,” he said. Yoon’s Dec. 3 imposition
of martial law, the first of its kind in more than four decades in South
Korea, lasted only six hours, but has caused massive political tumult, halted
diplomatic activities and rattled financial markets. Yoon was forced to lift
his decree after parliament unanimously voted to overturn it. After declaring martial
law, Yoon sent hundreds of troops and police officers to the parliament to
try to impede its vote on the decree, before they withdrew after the
parliament rejected it. No major violence occurred. Opposition parties and
many experts accuse Yoon of rebellion, citing a law that categorizes as
rebellion the staging of a riot against established state authorities to
undermine the constitution. They also say that a president in South Korea is
allowed to declare martial law only during wartime or similar emergencies and
has no right to suspend parliament’s operations even under martial law. The impeachment motion
alleged that Yoon “committed rebellion that hurts peace in the Republic of
Korea by staging a series of riots.” It said Yoon’s mobilization of military
and police forces threatened the National Assembly and the public and that
his martial law decree was aimed at disturbing the Constitution. In a fiery speech on
Thursday, Yoon had rejected the rebellion charges, calling his order an act
of governance. The conservative Yoon said he aimed to issue a warning to the
main liberal opposition Democratic Party, calling it “a monster” and
“anti-state forces” that he argued has flexed its legislative muscle to
impeach top officials and undermine the government’s budget bill for next
year. He claimed the deployment of troops was meant to maintain order, rather
than disrupt it. Democratic Party leader
Lee Jae-myung called Yoon’s speech a “mad declaration of war” against his own
people. Observers say Yoon’s
speech suggested a focus on legal preparations to defend his martial law
decree at the Constitutional Court, even as opinion surveys showed more than
70% of South Koreans supported his impeachment. A survey released Friday put
Yoon’s approval rating at 11%, the lowest since he took office in 2022. Some of Yoon's claims
don't align with testimony by some military commanders whose troops were
deployed to the Assembly. Most notably, Kwak
Jong-keun, commander of the Army Special Warfare Command, said that after
martial law was announced, Yoon called him and asked for his troops to
“quickly destroy the door and drag out the lawmakers who are inside.” Kwak
said he didn’t carry out Yoon’s orders. Yoon is the third South
Korean president impeached while in office. In 2016, parliament impeached
Park Geun-hye, the country’s first woman president, over a corruption
scandal. The Constitutional Court upheld her impeachment and dismissed her
from office. In 2004, President Roh
Moo-hyun was impeached at parliament over an alleged election law violation
but the court later overturned his impeachment and restored his presidential
powers. Roh jumped to his death in 2009, after he had left office, amid a
corruption scandal involving his family. Yoon has been banned from
leaving South Korea, as law enforcement authorities are investigating whether
he and others involved in the martial law declaration committed rebellion,
abuse of power and other crimes. If convicted, the leader of a rebellion plot
can face the death penalty or life imprisonment. Yoon has the presidential
privilege of immunity from criminal prosecution but that doesn’t extend to
allegations of rebellion or treason. Subsequently, Yoon could be
investigated, detained, arrested or indicted over his martial law decree, but
many observers doubt that authorities will forcefully detain him because of
the potential for clashes with his presidential security service. Yoon’s defense minister,
police chief and the head of Seoul’s metropolitan police agency have been
arrested over their roles in the martial law case. Other senior military and
government officials also face investigations. (Asahi Shimbun) 14 December, 2024 Source:
https://www.asahi.com/ajw/articles/15550516
872-879-43-03/Polls Internet Use In Pakistan On The Rise: More Than Half (51%)
Of The Population Is Now Online, With Men And Urban Residents Outpacing
Others In Usage
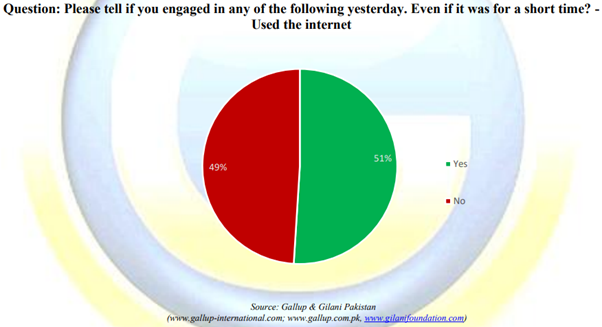
According to a survey
conducted by Gallup & Gilani Pakistan, more than half (51%) of the
Pakistani population is now online, with men and urban residents outpacing
others in usage. A nationally representative sample of adult men and women
from across the country was asked the question, “Please tell if you engaged
in any of the following yesterday. Even if it was for a short time? - Used
the internet” In response, 51% said ‘Yes’, 49% said ‘No’.
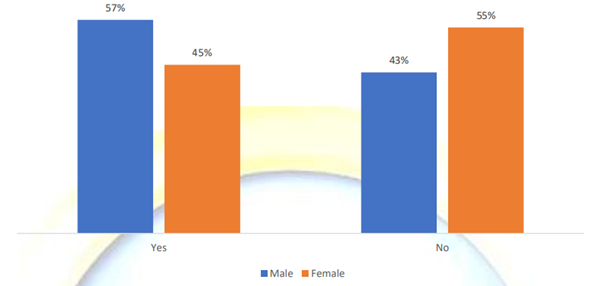
Across gender: A higher
percentage of men (57%) reported using the internet, compared to women (45%).
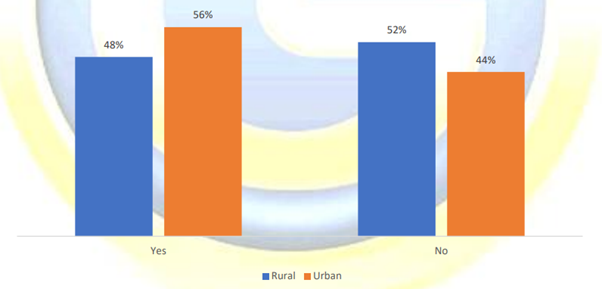
Across rurality: Urban
residents (56%) connected to the internet at an 8% higher rate than their
rural counterparts (48%).
(Gallup Pakistan) 13 December, 2024 Source:
https://gallup.com.pk/wp/wp-content/uploads/2024/12/13.12.2024.Daily-pollEnglish-1.pdf
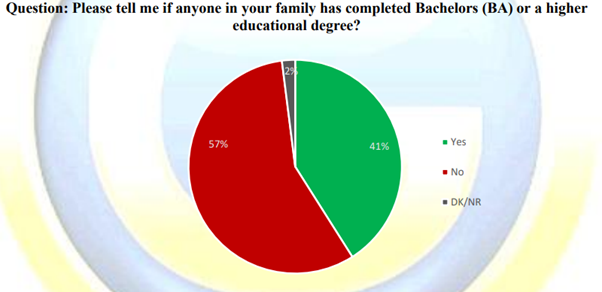
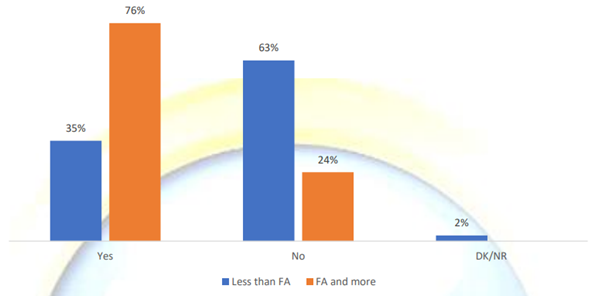
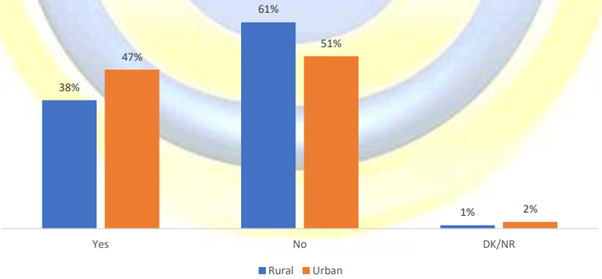
872-879-43-04/Polls 41% Pakistani Household Report Having One Person With An
Undergraduate Or Higher Degree, Including 38% Of Rural Residents And 35% Of
Those With Less Than An FA Qualification
According to a survey
conducted by Gallup & Gilani Pakistan, 41% Pakistani household report
having one person with an undergraduate or higher degree, including 38% of
rural residents and 35% of those with less than an FA qualification. A
nationally representative sample of adult men and women from across the
country was asked the question, “Please tell me if anyone in your family has
completed Bachelors (BA) or a higher educational degree?” In response, 41%
said ‘Yes’, 57% said ‘No’ and 2% said they don’t know or gave no response.
Across education: 76% of
those with an FA have someone in the family with an undergraduate degree,
compared to 35% of those with less than an FA qualification.
Across rurality: A higher
percentage of urban residents (47%) have a someone in family with an
undergraduate degree, compared to rural residents (38%).
(Gallup Pakistan) 27 December, 2024 Source:
https://gallup.com.pk/wp/wp-content/uploads/2024/12/27.12.2024.Daily-pollEnglish.pdf
872-879-43-05/Polls The Impact Of AI Technology On Indonesia’s Job Market And
Economy
Artificial Intelligence
(AI) technology has become a transformative force in global economies. And as
Southeast Asia’s largest economy, Indonesia is absolutely included in this
phenomenon. As Indonesia strives to
achieve its goal of becoming one of the world’s top five economies by 2045,
AI technology plays a significant role in shaping this country’s job market
and overall economic landscape. AI’s
Role in Indonesia’s Economy Indonesia’s economy has
seen a significant digital transformation, with AI being a key driver. According to a report by
McKinsey in 2023, AI could contribute up to USD 366 billion annually to Indonesia’s GDP by 2030,
provided the country adopts AI across sectors such as manufacturing,
agriculture, and services. Key
Sectors Impacted by AI
Impact
on Indonesia’s Job Market However, meanwhile AI
brings economic opportunities, it also disrupts traditional job roles. The World Economic Forum
predicts that automation and AI could
displace up to 23 million jobs in Indonesia by 2030. But
these losses are likely to be offset by the creation of new roles requiring
digital skills such as data analysts, machine learning engineers, and AI
ethicists. Furthermore, it has also been proven by LinkedIn’s 2023 Jobs on
the Rise report which shows that some positions like AI specialists and cloud
engineers have seen a year-over-year
growth of over 35% in Indonesia. On the other hand, in
order to mitigate job displacement risks, Indonesia has launched programs
such as Prakerja and
partnerships with tech companies to enhance digital literacy. The government
aims to equip 9 million Indonesians
with digital skills by 2030, ensuring the workforce is prepared
for AI-driven transformations. Challenges
in AI Adoption Despite its potential, AI
implementation in Indonesia faces hurdles:
Future
Outlook AI’s integration into
Indonesia’s economy is not merely about automation but also about fostering
innovation. With continued investment in education, infrastructure, and
regulatory frameworks, Indonesia can position itself as a leader in AI
adoption within Southeast Asia. Indonesia can ensure a
balanced approach that fosters economic growth, creates quality jobs, and
narrows the digital divide if the government, private sector, and educational
institutions collaborate to harness AI’s potential while addressing its
challenges. Overall, AI technology is
a double-edged sword for Indonesia’s job market and economy. While it poses
challenges such as job displacement and skill gaps, it also offers immense
opportunities for economic growth and innovation. The key lies in proactive
policies, upskilling initiatives, and strategic investments to maximize AI’s
benefits for Indonesia’s future. By leveraging AI wisely,
Indonesia has the potential to emerge as a technological powerhouse in the
global economy, driving prosperity for its 275 million citizens. (Snapcart) 09 December, 2024 Source:
https://snapcart.global/the-impact-of-ai-technology-on-indonesias-job-market-and-economy/ AFRICA
872-879-43-06/Polls Only 19 In 100 Nigerians Have Health Insurance, New Poll
Reveals
A new public opinion poll
conducted by NOIPolls has revealed that only a handful of adult Nigerians (19
percent) are covered by health insurance policies in the country.
Unfortunately, most adult Nigerians (79 percent) are not covered by the
scheme as they pay out of pocket for healthcare. This corroborates
Dataphyte’s publication of December 24, 2021, which reports that Health
insurance has barely scratched the surface in Nigeria with regards to
percentage coverage of the population as 97% of Nigeria’s population is not
covered by any health insurance; the alternative to health insurance is huge
out-of-pocket spending on health, and in 2018, Nigeria ranked the third
highest country with the highest out-of-pocket health spending. 76.6% of
health spending in the country was out-of-pocket. The poll further revealed
that a large proportion of Nigerians (86 percent) visit the hospital when ill
with public hospitals (67 percent) being the most accessed facilities, while
32 percent of Nigerians use private hospitals. Furthermore, a percentage slightly
above average (55 percent) disclosed that they are aware of the National
Health Insurance Scheme while 32 percent revealed they are not aware of the
scheme. While most adult Nigerians (72 percent) use the National Health
Insurance Scheme (NHIS), 26 percent are covered by private Health Maintenance
Organizations (HMOs). With regards to service delivery, 69 percent of adult
Nigerians disclosed they are satisfied with the service provided by the
health insurance provider, and 31 percent revealed their dissatisfaction
citing complaints bothering “the services they provide” (29 percent), “they
don't usually have drugs available” (26 percent), “poor service rendered” (25
percent), “low quality drugs” (14 percent), as well as “the amount they
charge” (14 percent). On the flip side, amongst
Nigerians who do not visit the hospital when ill, 31 percent go to the
pharmacy, 24 percent resort to self-medication, 22 percent go to a chemist,
12 percent go to traditional doctors, 5 percent call family doctors, while 4
percent pray or do nothing. Interestingly, 2 percent disclosed that they do
not fall sick. With regards to
recommendations on how the Federal government can improve the National Health
Insurance Scheme (NHIS), several suggestions were offered with the provision
of good quality drugs (34 percent) as top mentioned. This is followed by
“render good service” (15 percent), “attend to people on time” (11 percent),
“proper monitoring by the government” (10 percent), and “reduction of
charges” (7 percent). Interestingly, 59 percent of Nigerians interviewed
expressed their willingness to pay a small amount to get enrolled into the
health insurance scheme when asked if they would be willing to pay monthly or
yearly for health insurance to access care when ill. These are some of the
key findings from the Health Insurance Poll conducted in the week commencing
15th of January 2024. Background Health Insurance is a
scheme that protects your health and gives you access to quality healthcare
services for free. It covers your medical expenses for an agreed period while
you pay monthly or annual premiums as a commitment. It is one of the
mechanisms for providing financial protection from the costs of using
healthcare services. This is a key pillar of universal healthcare. The
protection it affords is extremely important as research from the World Bank
and the WHO showed that 100 million people are pushed into extreme poverty on
an annual basis due to healthcare expenses. While health insurance has been
operational in Nigeria for over 15 years, the uptake has remained low. As of
2016, only 3% of healthcare expenditure in Nigeria was paid for using health
insurance. According to the leadership of the National Health Insurance
Scheme (NHIS), the scheme covers less than 5% of Nigerians. The enrolee
population in the scheme is largely made up of Federal Government employees
and their dependents. To bridge the coverage gap, The Nigerian government
signed into law the new National Health Insurance Act (NHIA) 2022 on 19 May
2022. The NHIA replaced the National Health Insurance Scheme Act of 1999,
which failed to enroll more than 10% of the population. The NHIA seeks to promote,
regulate, and integrate health insurance schemes. It aims to secure mandatory
health insurance for every Nigerian and legal resident and establishes a fund
for the vulnerable groups, which will provide ‘subsidy for health insurance
coverage for vulnerable persons and payment of health insurance premiums for
indigents. The inclusion of vulnerable groups will increase health-seeking
behaviour and access to quality healthcare among this group. Furthermore, NHIA seeks to
create health insurance schemes in states that do not have them and the
accreditation of primary and secondary healthcare facilities that are more
accessible to the population. These healthcare facilities are imperative in
achieving Universal Health Coverage (UHC), given their proximity and easy
accessibility by people living in rural and semi-urban areas, with most of
these facilities owned by the government. They provide comprehensive,
good-quality care that meets patients’ needs and covers basic health services
for disease prevention, health promotion, and health maintenance, including
offering basic diagnostic tests, supplying safe, affordable medicines and
vaccines, and so aiding in the attainment of UHC. Currently, the National
Health Insurance Scheme (NHIS) and private Health Maintenance Organizations
(HMO) operate side by side in Nigeria. There are 58 HMOs registered with the
NHIS, of which 49 (77.6%) of them have a nationwide presence. Considering this,
NOIPOlls surveyed to gauge the perception of Nigerians on health insurance
schemes in the country. (NOI Polls) 26 November, 2024 Source:
https://www.noi-polls.com/post/only-19-nigerians-have-health-insurance-new-poll-reveals
872-879-43-07/Polls Majority Of Nigerians Have Considered Emigration In Search
Of Opportunity
Infographics News
release A majority of Nigerians
have considered leaving the country, usually in search of better economic
opportunities, according to the latest Afrobarometer survey. The proportion of citizens
who have given emigration “a lot” of thought has tripled since 2017. The most
common reasons among potential emigrants are the search for work
opportunities and the wish to overcome economic hardship. Highly educated,
unemployed, urban, and young citizens are most likely to consider emigration.
Their most popular destinations are North America, Europe, and the Middle
East. As the world observes
International Migrants Day, Nigeria and other African countries contend with
“brain drain,” high-risk irregular migration, and other emigration-related
challenges. Key
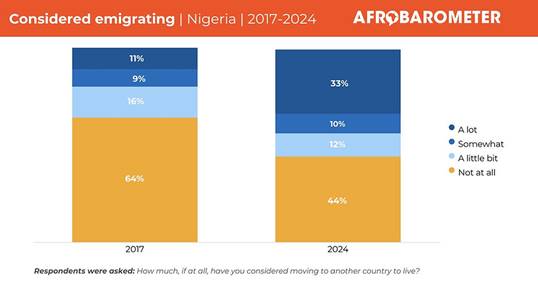
findings ▪ More than half
(56%) of Nigerians say they have considered leaving Nigeria, a 20-
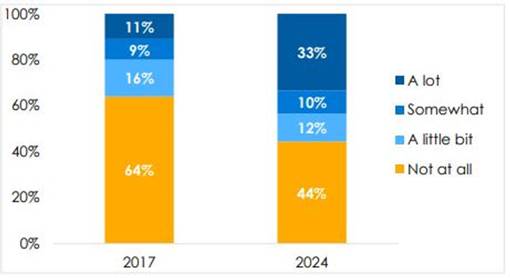
percentage-point increase compared to 2017 (36%) (Figure 1). The share who
say they have given “a lot” of thought to the idea has tripled, from 11% to
33%. o Thoughts of emigrating
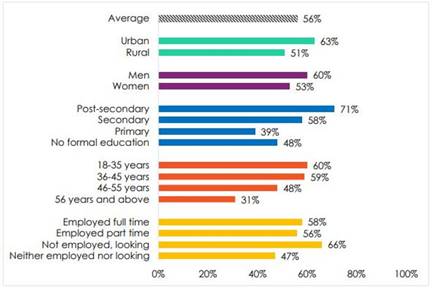
are particularly common among the most educated citizens (71% of those with
post-secondary qualifications), urban residents (63%), and youth (60% of 18-
to 35-year-olds) (Figure 2). o Two-thirds (66%) of
citizens who are unemployed and looking for work say they have thought about
leaving Nigeria, while many full-time (58%) and part-time workers (56%) have
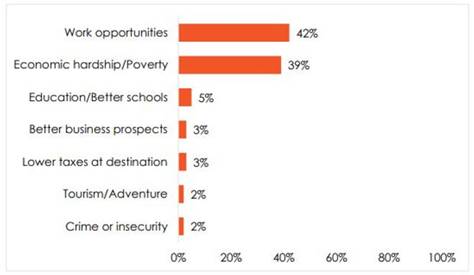
also considered emigration. ▪ The most common
reasons cited for potential emigration are finding work opportunities (42%)
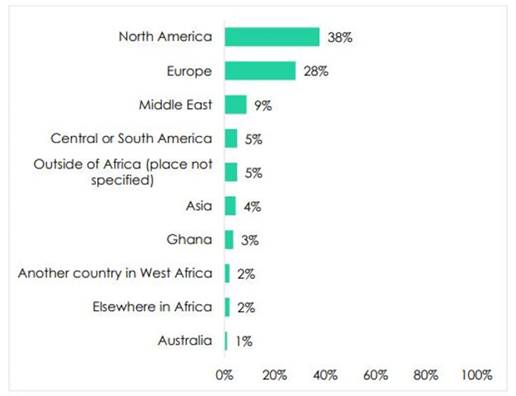
and escaping economic hardship or poverty (39%) (Figure 3). ▪ The most popular
destinations among potential emigrants are North America (38%) and Europe
(28%) (Figure 4). Charts
Figure
1: Considered emigrating | Nigeria | 2017-2024
Nigerians willingness to
emigrate Respondents
were asked: How much, if at all, have you considered
moving to another country to live? Figure
2: Considered emigrating | by demographic group |
Nigeria | 2024
Demographic Representation Respondents
were asked: How much, if at all, have you considered
moving to another country to live? (% who say “a little bit,” “somewhat,” or
“a lot”) Due to rounding,
percentages for combined categories reported in the text may differ slightly
from the sum of sub-categories shown in figures (e.g. 33% “a lot,” 10%
“somewhat,” and 12% “a little bit” sum to 56%). Figure
3: Main reason to consider emigration | Nigeria |
2024
Reasons for Emigration Respondents
who say they have considered emigrating were asked:
What is the most important reason why you would consider moving from Nigeria?
(Respondents who say they have not considered emigrating are excluded.) Figure
4: Preferred destination for emigration | Nigeria |
2024
Destination Preference Respondents
who say they have considered emigrating were asked:
If you were to move to another country, where would you be most likely to go?
(Respondents who say they have not considered emigrating are excluded.) (NOI Polls) 19 December, 2024 Source:
https://www.noi-polls.com/post/nigerians-considering-emigration-for-opportunity
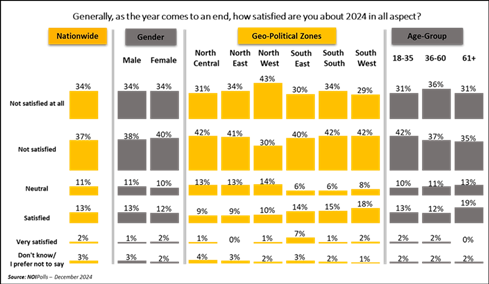
872-879-43-08/Polls 7 In 10 Nigerians Are Dissatisfied With 2024 In All Aspects
A new public opinion poll
conducted by NOIPolls revealed that most adult Nigerians nationwide (71
percent) disclosed that they are dissatisfied with the year 2024 mainly due
to increased inflation and economic hardship in the country. This is not
surprising as the National Bureau of Statistics recently announced that
Nigeria’s inflation further rose by 0.72 percent on a month-on-month basis to
34.60 percent in November 2024[1]. Analysis by geopolitiical zones indicated
that the 43 percent of residents in the North-West zone were very
dissatisfied with 2024, the highest proportion across all zones who made this
assertion. According to the poll,
respondents highlighted other reasons for being dissatisfied with the
current year. The reasons include those that stated that nothing works for
them as planned (13 percent), business not expanding (7 percent), and
increased poverty (6 percent) amongst others. These are some of the key
findings from the end-of-the-year
special Poll conducted in the week commencing December 9, 2024. Background Decembers are usually
dotted with concerts, parties, beach outings with friends, family/school
reunions, carnivals, other forms of social activities, and festive
events. To some Nigerians, it is a time to reflect on what they have
achieved thus far and what to expect in the coming year. Against this
backdrop, NOIPolls surveyed to gauge the perceptions and opinions of
Nigerians regarding the year 2024 as a whole and hereby presents its
findings. Survey
Findings The first question gauged
the level of satisfaction of respondents. The poll result revealed that most
Nigerians (71 percent) asserted that they were not satisfied with the year
2024. Analysis by geopolitical zones indicated that the 43 percent of residents
in the North-West zone were very dissatisfied with 2024, the highest
proportion across all zones who made this assertion.
Level of satisfaction for
Nigerians in all aspects for 2024 On the other hand, the
poll result indicated that 15 percent of adult Nigerians nationwide mentioned
that they are satisfied with the year 2024 as a whole. Interestingly,
Nigerians residing in the South-East zone had more respondents who made this
assertion. Further probe revealed
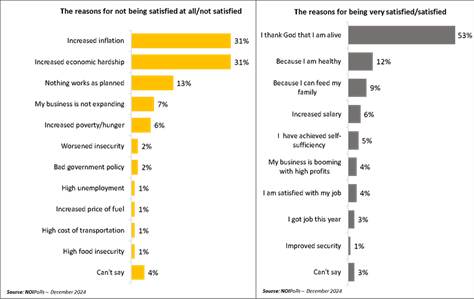
that out of the 71 percent who stated that they are not satisfied with the
year 2024, 31 percent stated that it is due to the increased inflation, as
well as those that attributed it to increased economic hardship (31 percent).
Other reasons include those that stated that nothing works for them as
planned (13 percent), business not expanding (7 percent), and increased
poverty (6 percent) amongst others. Similarly, out of
the 15 percent of the respondents who stated that they were satisfied with
the current year, the analysis showed that more than half of the respondents
(53 percent) only found being alive as the major reason for their contentment
with 2024. Other reasons mentioned are that I am healthy (12 percent), I can
feed my family (9 percent), increased my salary (6 percent), and achieved
self-sufficiency (5 percent) amongst other reasons.
Reasons why Nigerians are
dissatisfied with 2024 Conclusion In conclusion, the poll
revealed that most Nigerians (71 percent) are dissatisfied with 2024.
Interestingly, among those that were statisfied with 2024, 53 percent of them
stated being alive as their major reason for being satisfied while 62 percent
of respondents that were not satisfied mentioned increased inflation and
economic hardship as their major reason. To alleviate these concerns going
into the new year, the government must focus on strengthening the economy
through impactful economic policies and efforts in the coming year[1]. (NOI Polls) 25 December, 2024 WEST EUROPE
872-879-43-09/Polls What Bothers Britons Most About Donald Trump Becoming
President Again?
Donald Trump’s election
victory at the beginning of November was not what many Britons were hoping
for. A pre-election study found that 61% of Britons had wanted
Kamala Harris to win, with just 16% backing Trump, and a YouGov poll in the
immediate aftermath of the election similarly found 60% unhappy about the
result and 16% happy. But why is that? While it
is well established that Donald Trump is unpopular in the UK, what is the
biggest reason driving Britons’ dissatisfaction with the Republican’s
re-election? To find out, in the aftermath of the election result, we asked
the public to tell us in their own words the main or biggest reason they were
unhappy (or happy) to see Trump elected again. Why
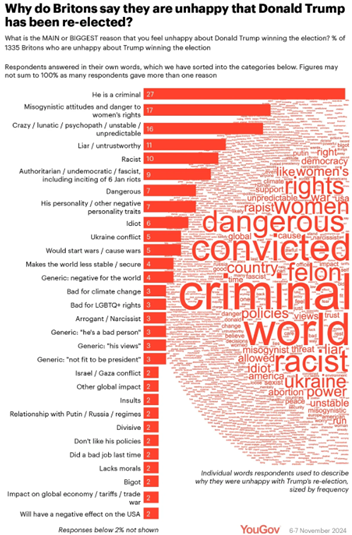
are Britons unhappy that Donald Trump won the 2024 US presidential election? Britons gave a long and
varied list of reasons why they were unhappy with Donald Trump (and many gave
more than one reason), but the criticism that came up in answers the most
often is that Trump is a criminal. A quarter (26%) of those unhappy with
Trump’s re-election brought up criminal wrongdoing on the part of the
president-elect. "I
am not 'unhappy' I am angry and worried. He is a misogynist, lying, racist,
convicted criminal who tried to overthrow democracy in the US. He should be
in jail not in the White House." "He
is facing or has faced several criminal trials some of which are still
pending. A president of the USA should not be a potential convicted
criminal." "He
is a loose cannon and a convicted criminal. Not someone I would trust with
anything." Why
are Britons unhappy to see Donald Trump re-elected? (Criminality) Trump was found guilty earlier this year on 34 counts
of falsifying business records,
although some respondents also accused the former US president of being a
rapist or sexual abuser. While Trump has been found liable for sexual abuse in a
civil case, he has no
criminal conviction for any sex crime.
The second most common
concern about Trump’s return to office is the impact that it might have on
women. One in six (17%) cited misogynistic attitudes from the incoming US
president and/or the threat he poses to abortion and other women’s rights.
This was raised substantially more frequently by younger Britons who are
unhappy about Trump (27% of 18-24 year olds and 22% of 25-49 year olds) than
their elders (6% of the over-65s). "He
is a convicted criminal. He lies and seemingly gets away with it. He is a
terrible role model for children and young people. He is dangerous and
deranged and mentally ill. He has some awful views about women and women's
rights and sets women's rights backwards." "His
hatred of anyone who isn’t a rich white man. His dismissal of women’s rights
and banning abortion and threatening doctors that facilitate abortion (even
to save the mother’s life) should be imprisoned IS DISGUSTING." "He
is thoroughly unsuitable for the position; his policies on women’s and
fertility rights are backwards looking. His stance is extreme and
distasteful, his public speeches are unfiltered and unprofessional, his
demeanour is offensive." "He
creates an unsafe environment of racism, misogyny and division and is
dangerous as a leader of such a global power." Why
are Britons unhappy to see Donald Trump re-elected? (Misogyny and women's
rights) In a similar vein, 10%
branded Trump a racist in their responses, and 3% expressed concern over the
new president’s impact on LGBTQ+ people; since the survey was conducted, it
has been reported that the Trump administration would kick approximately 15,000 transgender
personnel out of the military. Another top concern is the
state of Trump’s mental health. One in six (16%) labelled the president terms
like “crazy”, “psychopath”, “unstable” and “unpredictable”. This was a more
notable worry among older Britons who are upset to see Trump re-elected (25%
of over-65s and 21% of 50-64 year olds) than younger Britons (1% of 18-24
year olds). "Concern
about his mental health and his mood swings. His behaviour is erratic and
unsuited for politics. Concern what he might do." "I
think he is actually insane, dangerous and he should be in prison for
starting the Capitol riot." "He
is not mentally stable and he has no moral compass." "Because
he is a seriously crazed psychopath." Why
are Britons unhappy to see Donald Trump re-elected? (Trump's mental health) Other criticisms about
Trump personally include that he is a liar or untrustworthy (11%), dangerous
(7%) and an idiot (6%). Some respondents (9%) also
brought up concerns about what Trump’s election meant for American democracy,
suggesting that he undermines the rule of law, might become a dictator, or
otherwise elevate the far right. "He’s
a narcissistic criminal and has set a precedent that you can get away with
ANYTHING even the attack he instigated on the Capitol. This would be
described by the US as a coup if it happened anywhere else." "I
think he's a terrible person with no real morals and is going to twist the
laws and systems in the US to make himself a dictator, and a lot of people
are going to suffer and even die because of it." "A
convicted criminal and proven liar who has openly promised the deconstruction
of the democratic processes and institutions of the USA is nought but a
threat to the stability of the whole world." "His
authoritarianism and contempt for democracy and the rule of law." Why
are Britons unhappy to see Donald Trump re-elected? (Concerns for democracy) The US president is probably
the most powerful person in the world, and about a quarter of those unhappy
about Trump’s victory (24%) mentioned some form of international impact in
their responses. The most common, at 5%,
was trepidation over how Trump will handle the conflict in Ukraine, while 2%
said the same over the Israel-Gaza conflict – another 5% worry that Trump
could start or cause the outbreak of further conflict globally. "He
doesn’t care about the rest of the world. I fear he is too close to Russia
and wants to break up NATO. He will stop funding Ukraine leading to a Russian
victory. He doesn’t care about climate change as he is old and won’t be
around to deal with the consequences." "Increased
isolationism of America allows countries like Iran, China and Russia to go
unchecked. A convicted criminal leading the free world is embarrassing.
Ukraine will now likely fall." "He
does not listen to the US people but has his own personal agenda, which is
influenced by both his personal prejudices and flattery from other powerful
states such as China, North Korea and Russia." "I
feel he will negatively impact world decision making, impose tariffs, not
help Ukraine and boost Israel, not protect minority groups." Why
are Britons unhappy to see Donald Trump re-elected? (International impact) Why
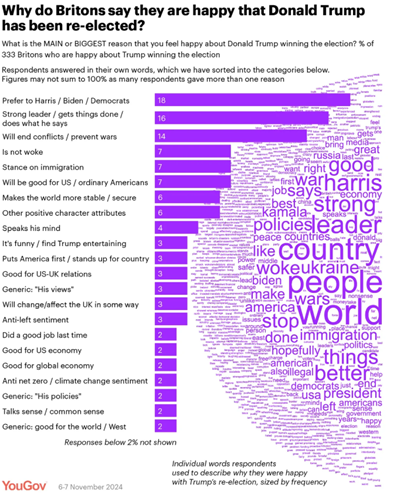
are Britons happy that Donald Trump won the 2024 US presidential election? The most common theme to
emerge from the 16% of Britons who were pleased to see that Trump had won was
their dissatisfaction with his opponents. One in six (18%) include in their
answers their disapproval of Kamala Harris, Joe Biden, or the Democrats more
widely.
When it comes to Trump
himself, a common praise (16%) is that he is a strong leader who gets things
done. Other positive views of Trump’s character included that he speaks his
mind (4%) and talks sense or has common sense (2%). "Not
a Trump fan, but a Republican win was very much needed to restore some common
sense to the West. We need people in power that have the balls to make the
necessary tough decisions." "It's
good for the USA and good for the world to have a strong leader with
principles and one who will get things done. He is the best man for the
job." "I
think he is a forceful leader who isn’t afraid to speak his mind and gets
things done." Why
are Britons happy to see Donald Trump re-elected? (Strong leader) One in seven (14%) are
pleased because they expect Donald Trump to bring current wars to a close
(most notably that in Ukraine) or will prevent future conflicts from breaking
out. A further 6% also expressed a less specific belief that Trump will make
the world more stable or secure. "He
seems to be the only one that wants to open peace negotiations with Russia
where the rest of Europe, UK and Biden seem to want to drag us all into a war
which will kill millions of people." "I
believe that Donald Trump's no nonsense approach when it comes to dealing
with other countries will put countries such as Russia and China back in line
and lead to a more peaceful world." "He
was promising to end the wars around the world, which was true while he was
president previously." Why
are Britons happy to see Donald Trump re-elected? (Stopping war) Others are pleased at
Trump’s re-election because he is not ‘woke’ or will put a stop to woke-ness
(7%), for his stance on immigration (7%) and a belief that he will be good
for America and/or ordinary Americans (7%), including of course that he will
‘make America great again’. "He
is everything the established media hate and even after 4 years of
persecution he's won and will remove all this woke anti patriotic nonsense
from the US." "He
has the balls to say he will stop illegal immigration... it's what we need in
the UK and it sends out a strong message to other countries." "He
is the best person to make America great again and fix the problems the
Democrats have made, pity it will only be for 4 years." Why
are Britons happy to see Donald Trump re-elected? (Other) 04 December, 2024
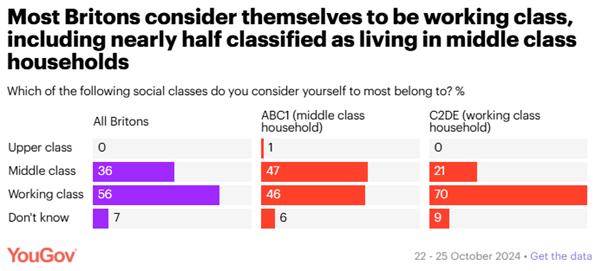
872-879-43-10/Polls 56% Of Britons Identify As Working Class, While Seeing Job
And Income As The Most Important Factors In Identifying Class
George Orwell once
described Britain as “the most class-ridden society under the sun”. While
class has been said to be less meaningful in modern society, it remains a
topic of political debate. So how do the public see social class in Britain
today? How
do Britons see class? In terms of how Britons see themselves, 56% of the
public consider themselves to be working class, while 36% would describe
themselves as middle class. Less than 1% of the public identify as ‘upper
class’. This represents a small
increase in working class identity since 2019,
when 51% of Britons described themselves as working class, compared to 39%
identifying as middle class. However, of those classed
as ABC1s, there is an even split between the 47% who consider themselves to
be middle class and the 46% who see themselves as working class. C2DEs more
align with expectations, with 70% saying they are working class, although 21%
identify as middle class.
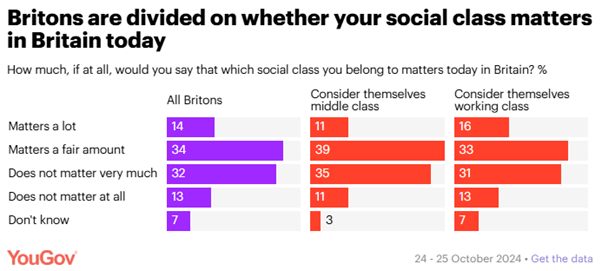
But while almost all
Britons consider themselves to belong to one class or another, they are split
on whether belonging to a class actually matters, with 48% of Britons saying
it does at least a fair amount, against 45% who feel that which class you
belong to either does not matter much in today’s Britain.
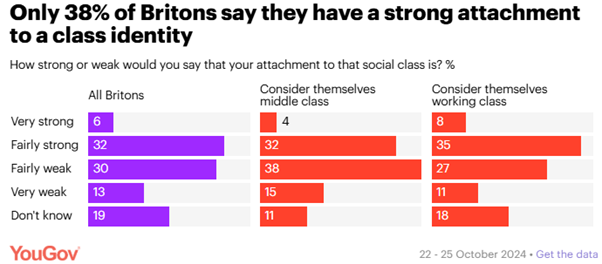
Similarly, just 38% of
Britons say they have a strong attachment to their class identity, compared
to 43% who describe their attachment as weak. Attachment is a little higher
among those who consider themselves to be working class (43%) than those who
see themselves as middle class (36%).
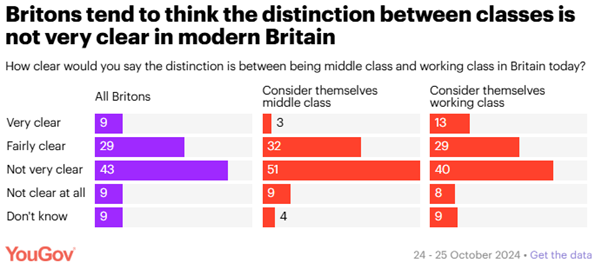
Perhaps key to this
ambivalence towards class among many Britons is that around half (52%) feel
that the distinction between being middle class and working class is not
clear in modern Britain. This compares to 38% who feel that the distinction
between classes is clear, including just 9% who see the difference as very
clear. There is, though, a class
divide as to whether the class divide is clear or not. While those who
identify as middle class see the class boundaries as being not clear by 60%
to 35%, those who see themselves as working class are more evenly split
between the 48% who feel the divide is unclear and the 42% who see it as
clear.
How
do Britons distinguish between classes? Although most Britons
might feel the distinction between classes is no longer obvious, there are
still some factors that are seen as indicating which class somebody belongs
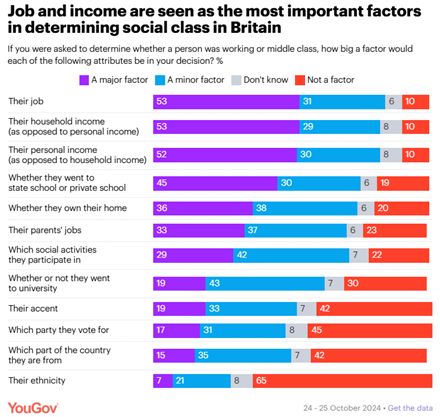
to. Just over half of Britons
(52-53%) say that someone’s job or income are a major factor in telling
whether they are middle or working class. A further three in ten (29-31%) say
they are minor factors, while only 10% of Britons would not use either as an
indicator of class. For 45% of Britons,
whether somebody went to private or state school is also a major factor in
identifying someone’s class, while whether they own their own home is seen as
a key factor for 36% of the public. A third of Britons (33%) see the job
someone’s parents did as being a major influence on their class, while 29%
say the same of which social activities someone participates in. Whether or not somebody
went to university is only seen as a major factor by 19% of Britons, the same
as the number who would use someone’s accent to identify whether they were
middle or working class. Few see ethnicity as important here, with only 7% of
Britons viewing it as a major factor in determining whether a person was
middle or working class, against 65% who see it as not a factor.
But regardless of whether
something is or is not a factor in determining class, how do Britons use
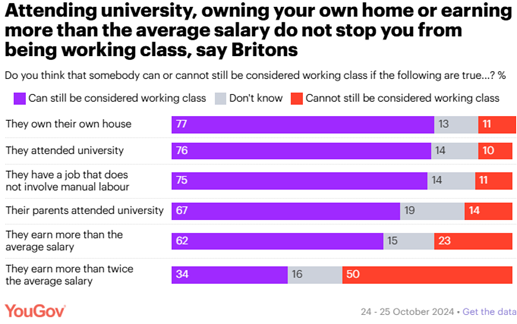
those factors to draw distinctions? Around three quarters of
the public (75-77%) believe you can still be considered working class if you
own your house, it you attended university or if you have a job that does not
involve manual labour, with only around one in ten Britons (10-11%) believing
any of these qualities disqualify you from being working class. Six in ten Britons (62%)
say somebody can still be considered working class if they earn more than the
average salary, though this falls to just one in three (34%) if they are
earning more than double the average salary, with half of Britons (50%) then
believing you cannot be considered working class.
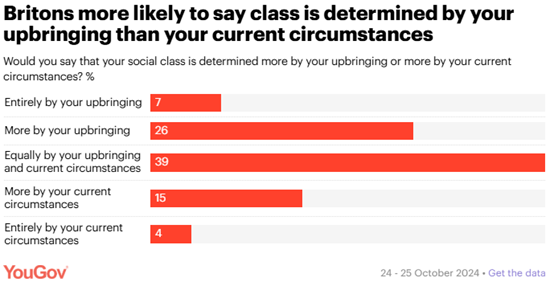
Britons’ tendencies to see
multiple factors as influencing class can also be seen when it comes to the
enduring debate of whether class is determined by upbringing or your current
circumstances. Four in ten Britons (39%) say that your class is equally determined
by your past and your present, more than the 33% who feel it is shaped more
or entirely by your upbringing or the 19% who believe class is more or
entirely a reflection of your current circumstances.
Which
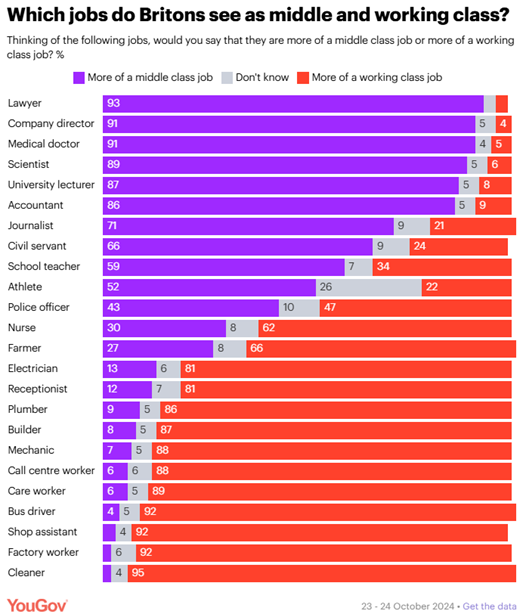
jobs do Britons see as middle or working class? With most Britons
considering someone’s job to be a major factor in identifying someone’s
social class, what do they see individual jobs as indicating? There is little
disagreement on professions like lawyer, company director and doctor, which
over nine in ten Britons (91-93%) see as middle class jobs. Nearly as many
see being a scientist (89%), university lecturer (87%) or accountant (86%) as
also being more middle class than working class. Similarly, the
overwhelming majority of Britons (92-95%) agree that bus driver, cleaner,
factory worker and shop assistant are working class jobs. Being a builder,
call centre worker, care worker, mechanic or plumber are likewise identified
as being working class by nearly nine in ten Britons (86-89%).
The job polled that
Britons were most divided on was police officer, which 43% of the public see
as more of a middle class job, against 47% who see it as more of a working
class job. Other jobs where the
perception is not entirely clear-cut include teacher, which 59% of Britons
see as middle class and 34% as working class; nurse, which is seen as more
working class by a margin of 62% to 30%; and farmer, a job perceived as
working class by 66% of Britons and middle class by 27%. But it is being an athlete
that perhaps has the most curious perception. More Britons (26%) are unsure
how to classify it than with any of the other jobs polled, with a noticeable
age curve among those who could pigeonhole it. Among 18-24 year olds, being
an athlete was seen as a middle class job by a margin of 66% to 13%, while
those aged 65 and over were evenly split 31% to 32% on whether it was middle
or working class. Which
activities do Britons see as middle or working class? While the social
activities somebody participates in are seen as less important in identifying
their class, with just 29% of Britons seeing it as a major factor, some
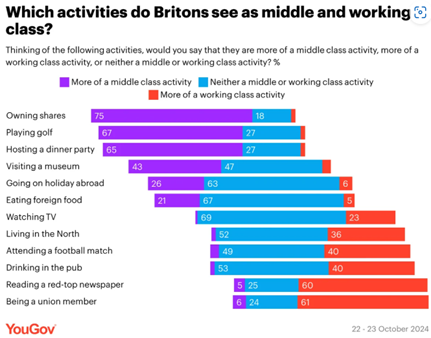
activities do still hold clear class connotations for the British public. Three quarters of Britons
(75%) see owning shares as more of a middle class activity, with around
two-thirds feeling the same of playing golf (67%) or hosting a dinner party
(65%). At the other end of the scale, six in ten Britons (60%) feel that
reading a red-top tabloid newspaper is something more for working class
people. Nonetheless, some
activities that may once have held class connotations are seen as somewhat
universal today. For instance, 69% of Britons feel that watching TV is
neither a middle nor working class activity, although 23% of the public do
associate it more with the working classes. Similarly, going on holiday
abroad and eating foreign food are primarily seen as classless activities
(63-67%), though with a minority (21-26%) still associating them more with
the middle class. Where Britons are more
divided is on living in the North of England, attending a football match or
drinking in the pub, which around half of the public (49-53%) see as neither
middle nor working class, though with between 36-40% of Britons associating
them more with the working class.
One case where historic
stereotypes arguably clash with modern reality is with trade union
membership. Six in ten Britons (61%) associate it more with the working
classes, compared to 24% who see it as classless and just 6% who link it more
to the middle class. This is despite union members today being largely non-manual workers who
are more likely than the wider population to hold a university degree. Which
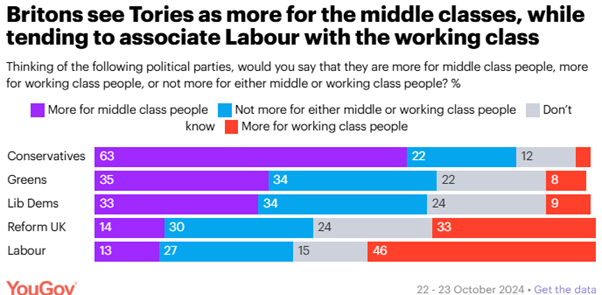
political parties do Britons associate with each class? The British party system
was historically seen as a class-based party system, with the Conservatives
associated with middle class interests and Labour founded as a vehicle for
the working classes. In recent years, this has been diluted by Tory appeals
to the working class and Labour’s increasingly middle class voter base, yet
such historical allegiances do still tend to hold in the minds of the public. The Conservatives are seen
as more for middle class people by 63% of Britons, compared to 22% who see
them for both main classes. Meanwhile, nearly half of the public (46%) see
Labour as more for the working classes, against 27% who see them as classless
and 13% who view them as a party more for middle class people.
More Britons see Reform UK
as more for working class people (33%) than see them as a party for the
middle classes (14%). The opposite is true of the smaller left-of-centre
parties, with around a third (33-35%) seeing the Lib Dems and Greens as
parties for the middle class, versus 8-9% who see them as mainly for the
working classes. How
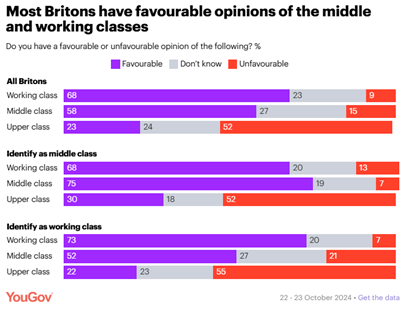
do Britons view the different classes? Regardless of how the
British public define being middle or working class, their perceptions of
each other are not driven particularly by animosity. Two thirds of Britons
(68%) have a favourable opinion of the working class, against just 9% with an
unfavourable view, while 58% of the public have a favourable opinion of the
middle class, versus just 15% who see them in an unfavourable light. Majorities having
favourable opinions of the two main classes isn’t just true of all Britons,
but within both classes. Two-thirds of those who identify as middle class
(68%) have a positive view of the working class, while half of people who see
themselves as working class (52%) have a favourable opinion of the middle
class, against just one in five (21%) with an unfavourable view. The upper classes, though,
are seen less positively, with only 23% of Britons having a favourable
opinion of them, against 52% who have an unfavourable opinion.
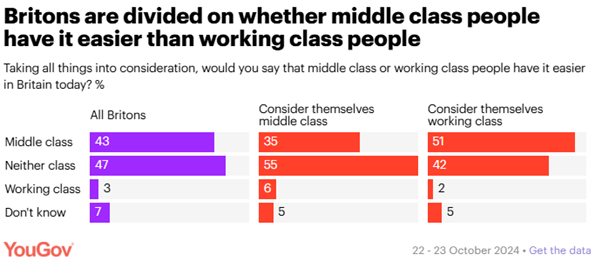
Ultimately, one of the key
questions raised by class is the relative advantage being from certain
classes can bring you. But Britons are split on whether the middle classes in
fact have an easy life, with 47% of the public feeling that neither class
actually has it easier than the other in Britain today, compared to 43% who
believe the middle classes do indeed have it easier than the working classes.
While those who identify
as middle class are more likely to say neither class has it easier (55%,
versus 42% among those who identify as working class), only 51% of those who
consider themselves to be working class say middle class people have it
easier in Britain today. 12 December, 2024 Source:
https://yougov.co.uk/society/articles/51105-how-do-britons-define-social-class
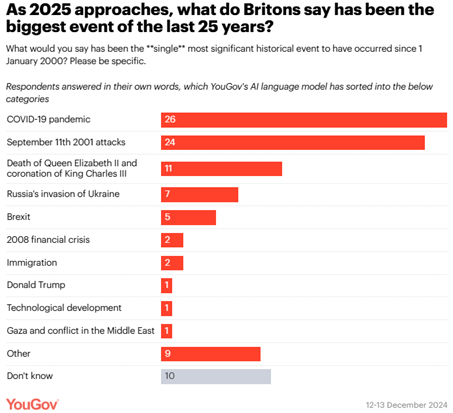
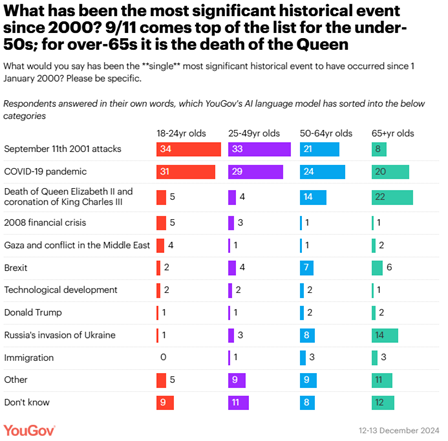
872-879-43-11/Polls As 2025 Approaches, What Do Britons Say Has Been The
Biggest Event Of The Last 25 Years
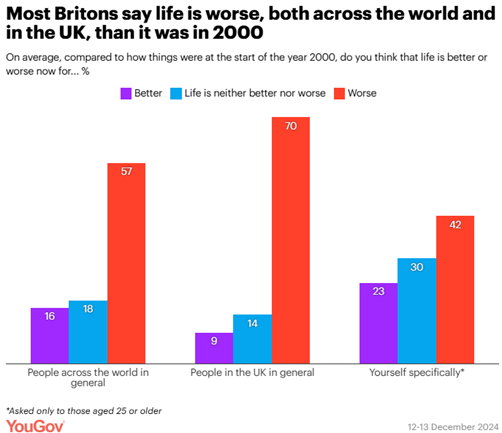
The
large majority of the public say things are worse now than they were in 2000 That being the case, what
do the British public think has been the most significant historical event of
the past 25 years? Rather than providing a
list of options, we asked respondents to answer in their own words, which we
have sorted into the below categories using YouGov AI Topic Quantifier. Two events score similarly
at the top of the public’s list, one towards the end of the time period and
the other towards the beginning: the COVID-19 pandemic (26%) and 9/11 (24%).
The passing of the British
crown for the first time in 70 years is listed as the most significant
historical event to have taken place in the last quarter-century by 11% of
Britons, putting it third overall. In fact, among the over-65s, the death of
Queen Elizabeth II and/or the accession of King Charles III tops the list of historical events,
at 22%, fractionally ahead of the pandemic on 20%. Older Britons are far less
likely to list 9/11 as the most significant historical event (8%) than
younger generations (21-34%).
In fourth place, on 7%, is
the Russian invasion of Ukraine. The conflict in the easternmost reaches of
Europe is also a more common response among Britain’s elders, with 14% of the
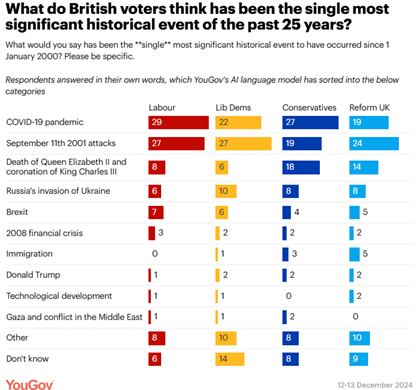
over-65s listing it as their choice. Brexit comes in fifth
place, on 5%, with Leave and Remain voters about equally likely to name it
the big event of the quarter-century (5-7%). Likewise, among voters for the
main four UK parties, only 4-7% name Brexit as the most consequential event
of the last 25 years.
Other major events like
the 2008 financial crisis (2%) and the election(s) of Donald Trump (1%)
hardly feature at all. Britons
review the last 25 years in gloomy terms… The public take a
pessimistic view of how life has changed over the last quarter-century, with
the majority (57%) saying that life for ‘people across the world in general’
is worse now than it was at the start of the year 2000. Around one in six (18%)
see life globally as about the same now as it was 25 years ago, while only
16% think things have actually got better. Attitudes are more gloomy
still when it comes to life in the UK, which 70% of people believe is now
worse than in 2000 compared to only 9% who think it has improved. But when it comes to
Britons’ own lives*, attitudes are less bad. While 42% say their own life is
worse now than 25 years ago, most say it is either no better or worse (30%)
or has improved (23%). *this
question was only asked to those aged 25 and older
Younger Britons tend to be
more likely than their elders across the questions to see improvement over
the past quarter-century, while Reform UK voters are the most likely to think
things have become worse. …and
are not optimistic for the next 25 years If the last 25 years have
been bad, there is little optimism that the next quarter-century will be any
better. Just 17% say they are optimistic that the state of the world will be
better over the next 25 years, including a mere 1% who are “very” optimistic. Instead, 72% are
pessimistic about the coming decades, including 26% who are “very”
pessimistic.
Younger Britons – who of
course stand the greatest chance of making it through the full 25 years – are
only marginally more optimistic than their elders (20-21 of under-50 age
groups versus 14-15% of over-50s). Likewise, Reform UK voters
are once again notably more likely than those for other main parties to be
negative about how the next 25 years will go. 19 December, 2024
872-879-43-12/Polls 57% Of The UK Public Think There Will Always Be Significant
Levels Of Homelessness
The survey results also
point to some gaps in understanding around the role of Outreach workers. Some
79% of respondents said they have heard of ('I knew a great deal about them/
I knew a fair amount about them/ I knew just a little about them/ I have heard
of them, but knew nothing about them') Outreach workers who work with people
experiencing homelessness. Of these, some 56% knew
that Outreach workers can help to access secure housing or shelter for people
who need it, such as shelters and temporary accommodation. According to St
Mungo’s, this is the main responsibility in frontline workers role. Secure housing
and shelter in places like hostels are the best places for those experiencing
homelessness to begin rebuilding their lives. However, the majority
(57%) said they were aware of the role of Outreach workers in distributing
essential items, such as food, water, and clothing. Technical
Notes On behalf of St. Mungo’s,
Ipsos ran two surveys:
For the purpose of this
survey, when referring to ‘homelessness or people experiencing homelessness’
we mean people who do not have a home to live in. This may be:
There was a pre-coded list
of 15 issues which was asked to UK adults to understand issues the people in
the UK may be facing currently, and which worries them the most:
12 December, 2024 Source:
https://www.ipsos.com/en-uk/57-uk-public-think-there-will-always-be-significant-levels-homelessness
872-879-43-13/Polls 53% Of French People Want The Barnier Government To Be
Censured
More
than one in two French people say they are in favour of a motion of censure The Ipsos survey for La
Tribune in November 2024 reveals that a majority of French people (53%) want Michel
Barnier's government to be censured when the
budget is voted. However, this figure hides significant disparities according to political sympathies.
What
are the prospects in the event of the resignation of the Barnier government? In the event of the
resignation of the government, the study explores the preferences of the
French regarding President Emmanuel Macron's decision. 29% of those polled
want Michel Barnier to be reappointed
Prime Minister, 33% want a new Prime Minister to be appointed from among the political parties
that make up the "common base" that currently supports Michel
Barnier's government, and 38% want a Prime Minister from the New Popular Front to be appointed. Here
again, preferences vary greatly according to political affinities.
28 November, 2024 Source:
https://www.ipsos.com/fr-fr/53-des-francais-souhaitent-la-censure-du-gouvernement-barnier NORTH AMERICA
872-879-43-14/Polls Are Americans Concerned About Global Warming
These results are based on
the average for these questions in Gallup’s 2023-2024 Environment surveys,
and show attitudes that are fairly stable. Americans' concern about climate
change is about average for the trend that dates back to 1989, though it has been as high as 72% in 2000
and as low as 50% in 1997. Perceptions of climate change’s effects in their
lifetime are currently higher than the historical average of 39%, as they
have been since 2016. While less than half of Americans say climate change
will pose a serious threat to their way of life in their lifetime, about six
in 10 every year since 2016 have said the
effects of global warming have already begun. Currently, 62% of
Americans believe increases in the Earth's temperature over the past century
are due mainly to "the effects of pollution from human activities."
The remaining 35% ascribe them to "natural changes in the environment
that are not due to human activities." Attitudes about the cause
of climate change have been fairly flat since 2016, while from 2008 to
2015, fewer than six in 10 each year believed
humans were responsible. Views
About Global Warming Among U.S. Subgroups Public concern about
climate change -- the percentage worried a great deal or fair amount --
exceeds 50% among most major demographic subgroups of Americans. Republicans
are the only exception, with 28% worried. Still, the level of concern varies
significantly by gender, age, education, race/ethnicity and region, with
women, younger adults, those with postgraduate education, non-White adults
and residents outside of the South expressing greater worry than their
counterparts.
13 December, 2024 Source:
https://news.gallup.com/poll/355427/americans-concerned-global-warming.aspx
872-879-43-15/Polls Public Narrowly Approves Of Trump’s Plans; Most Are
Skeptical He Will Unify The Country
As
was the case during the presidential campaign, Trump draws broad confidence
for his handling of the economy. Nearly six-in-ten Americans (59%) say they are very or
somewhat confident in the president-elect to make good decisions about
economic policy. Majorities also express confidence in Trump on law
enforcement and criminal justice (54%), immigration (53%) and foreign policy
(53%), while fewer (45%) are confident in Trump’s handling of abortion
policy. Jump
to Chapter
1 for more on Americans’ views of Trump Following a divisive
presidential contest, 41% are confident in Trump to bring the country closer
together; 59% express little or no confidence that Trump can do this. And
Americans give Trump low marks for his efforts to date to reach out to those
who supported Kamala Harris in the election. Roughly half of Americans
(52%) say it is extremely or very important for Trump to reach out to Harris’
supporters to try to unify the country. Another 30% say this is somewhat
important. Only 17% say this is not too or not at all important.
Just
31% of Americans say Trump has done an excellent or good job reaching out to
the vice president’s supporters to try to bring the country together; more
than twice as many (66%) say he has done only a fair or poor job. Jump
to Chapter 2 for
more on expectations of the transition and Trump’s conduct The latest national survey
by Pew Research Center, conducted among 9,609 adults from Nov. 12 to 17,
2024, finds that Trump’s personal image is more positive than it was shortly
after the 2020 or 2016 elections. (Note:
Most interviews were completed before Trump announced several of his nominees
for Cabinet positions, including Robert F. Kennedy Jr. for secretary of
Health and Human Services, and his initial selection of Matt Gaetz for
attorney general)
When asked to indicate
their feelings toward Trump on a “feeling thermometer” ranging from 0 to 100,
43% give Trump a “very warm” or “warm” rating (between 51 and 100 on the
0-100 scale). Somewhat more (48%) give Trump a “cold” rating (below 50),
including 40% who rate him “very cold” (between 0 and 24). Still, the share of
Americans rating Trump warmly today (43%) is higher than it was after the
2020 (34%) or the 2016 (36%) elections. Fewer
than four-in-ten describe Trump as even-tempered and a good role model. In
evaluating Trump’s personal traits and characteristics, a 55% majority say
the phrase “mentally sharp” describes Trump very or fairly well, while nearly
as many (51%) say he keeps his promises. Fewer than half describe
the president-elect as caring about the needs of ordinary Americans (45%) or
honest (42%). And as was the case during the presidential
campaign, Trump draws
relatively low ratings for being even-tempered (37%) and a good role model
(34%). How
Americans feel about the country after the election The share of Americans who
are satisfied with the way things are going in the country has increased
since October, from 23% to 29%. As has been the case for the past several
years, a large majority (70%) remains dissatisfied with national conditions. Jump
to Chapter
3 for more on Americans’ feelings about the
state of the nation Republicans and Democrats
have traded places in their views of the country since Trump’s victory:
Fear
and anger are dominant emotions among Democrats. Nearly
three-quarters of Democrats (73%) say they are “fearful” about the state of
the country, while 54% say they feel “angry.” Just 29% of Democrats feel
“hopeful” and even fewer (14%) feel “proud.” Republicans
are more hopeful, less fearful. Most
Republicans (76%) say they feel hopeful about the state of the country, while
nearly half (46%) say they are proud. Fear and anger are less widespread
among Republicans than Democrats. Related: After
Trump’s victory, Democrats are more pessimistic about their party’s future Other
findings: Presidential transition, emotional reactions to Trump’s win, the
state of partisan relations Smooth
presidential transition anticipated, in contrast with 2020. A
sizable majority of Americans (70%) say they are very or somewhat confident
that the transition to the Trump administration will go smoothly. Republicans
(79%) are more likely than Democrats (64%) to say the transition will go
well. At a similar point four years ago, when Trump was contesting the
election results, just 26% expected the transition to go smoothly. Trump’s
post-election conduct viewed much more positively than four years ago. Shortly
after the 2020 election, only about a quarter of Americans (28%) viewed
Trump’s post-election conduct as excellent or good. Today, nearly twice as
many (53%) view his conduct positively. A comparable share (56%) rate Harris’
post-election conduct as excellent or good. Reactions
to Trump’s victory. Republicans are reacting to
the election results with a mixture of relief (46% say they are relieved by
Trump’s victory) and excitement (43%). A majority of Democrats (56%) express
disappointment at the outcome, while 31% say they are angry. For the most
part, reactions to Trump’s victory are comparable to his election win in
2016.
Just
14% expect partisan relations to improve. Most
Americans expect relations between Republicans and Democrats in Washington to
get worse (45%) or stay about the same (41%) in the coming year. In
post-election surveys over the past decade, no more than about one-in-five
(21% in 2020) have predicted improvement in partisan relations. 22 November, 2024
872-879-43-16/Polls Wide Partisan Divisions Remain In Americans’ Views Of The
War In Ukraine
Nearly three years into the war in Ukraine,
President-elect Donald Trump has been promising
a swift end to the conflict when he takes office. Americans’
views about U.S. support for Ukraine have shifted little in recent months,
but there continue to be wide partisan differences, according to a Pew
Research Center survey conducted Nov. 12-17.
How
we did this In addition, Republicans
and Republican-leaning independents have long been less likely than Democrats
and Democratic leaners to see Russia’s invasion as a major threat to U.S.
interests. But this partisan gap has grown. Just 19% of Republicans now say the
invasion is a major threat, compared with 42% of Democrats. Note:
The survey was fielded before the Biden administration allowed Ukraine
to use U.S.
long-range weapons to hit targets inside Russia and provided
anti-personnel mines to Ukraine. U.S.
support for Ukraine
Today, 27% of Americans
say the U.S. is providing too much assistance to Ukraine. Another 25%
characterize U.S. support as “about right,” and 18% say the U.S. is not
providing enough support. These shares are similar to views in July, though Americans are now somewhat more
likely to say they are not sure than they were four months ago (29% vs. 25%
then).
U.S.
responsibility to help Ukraine
Americans are also split
on whether the U.S. has a responsibility to help Ukraine defend itself from
Russia’s invasion. Half of Americans say the U.S. has this responsibility,
while 47% say it does not. These views are largely unchanged over the last
several months. Partisans’ opinions are
also essentially the same as they were in July:
Russia’s
invasion as a threat to U.S. interests
Three-in-ten Americans now
say Russia’s invasion of Ukraine poses a major threat to U.S. interests.
These views have been relatively stable over the last few years – though
Americans were considerably more likely to say this in the early weeks of the
conflict in 2022. Since 2023, Republicans
have been far less likely than Democrats to view the Russian invasion of
Ukraine as a threat to the U.S. But the share saying this is now at a low
point: Today, 19% say this, down from 26% in July. About four-in-ten
Democrats (42%) see Russia’s invasion as a major threat. This is slightly
lower than the 45% who said this in July but on par with Democrats’ views
since 2023. 25 November, 2024
872-879-43-17/Polls Roughly Half Of Americans Are Knowledgeable About Personal
Finances
Financial literacy has been associated with greater
financial well-being. There have long been economic gaps between Americans of
different backgrounds, and
our survey also finds gaps in financial literacy:
On the other hand, about
one-in-five Americans with lower incomes (22%) say they don’t know much or know nothing at all about
personal finances. That’s a notably higher share than among those with upper
incomes (4%). About a quarter of Hispanic adults (27%) say the same, higher
than among Asian (17%), Black (14%) or White adults (8%). Money
management skills
U.S. adults have mixed
confidence in their ability to perform various financial skills. Most Americans (75%) say
they are extremely or very confident in their ability to find their credit
report. Smaller majorities say the same about creating a monthly budget to
manage their finances (59%), creating a plan to pay off debt (57%) or saving
money (56%). By contrast, just 27%
express confidence in their ability to create an investment plan to build
wealth. Americans’ confidence in
these skills varies by income, race and age:
In addition, about
one-in-five U.S. adults (21%) are confident in their ability to execute every financial skill we asked
about. Americans with upper incomes (40%) are more likely to say this than
those with middle (20%) or lower incomes (13%). Meanwhile, 13% of
Americans are not confident in their ability to do any of these money management
skills. Hispanic (21%), Asian (21%) and Black adults (17%) are more likely
than White adults (8%) to say this. And 22% of those with lower incomes say
this, compared with fewer than 10% of those with middle or upper incomes (9%
and 5% respectively).
Where
do Americans learn about personal finances?
In recent years, more
experts have called for greater financial education during high school to help students
prepare for their futures. Relatively few Americans have learned about this
in school, our survey finds. Among U.S. adults who are
knowledgeable about personal finances, 49% say they learned a great deal or a
fair amount about personal finances from family and friends. That is the
highest share for any source we asked about. About a third or fewer learned about
personal finances from other sources such as:
Learning about personal
finances from family and friends is a relatively common experience across all
major demographic subgroups. But there are notable differences for some other
sources. Internet
Media
K-12
schools
09 December, 2024
872-879-43-18/Polls Most Americans Feel Good About Their Job Security But Not
Their Pay
The survey, conducted Oct.
7-13 among 5,273 employed U.S. adults, explores how workers see various
aspects of their jobs, including how they assess the importance of certain
skills and their own opportunities for further training.1 Key
findings White
and older workers are among the most satisfied with their job overall.
Among
the 29% of workers who are not too or
not at all satisfied with their pay, the top reason given is
that their wages haven’t kept up with increases in cost of living.
Half
of workers think of their current job as a career, while 15% say it’s a
stepping stone to one. About a third (35%) say it’s just a job to get them
by.
Most
workers (69%) feel that they have a great deal or a fair amount of job
security. Another 17% say they have
some job security, and 13% say they have little or none.
Workers
are now much more
likely than in 2022 to say it would be difficult for them to get
the kind of job they’d want if they were to look for a new one.
Most
workers (70%) say they currently have the education and training they need to
get ahead in their job or career, while 30% say they need more education and
training.
Among
workers who need training but didn’t get any in the last year, many point to
time and resource constraints as major reasons for not doing so.
About
four-in-ten workers (42%) say most Americans have a great deal or a fair
amount of respect for people who do the type of work they do.
What
work looks like today In addition to the survey
findings, the report uses government data to examine labor market changes in
recent decades. Among
the key trends:
10 December 2024
872-879-43-19/Polls Teens, Social Media And Technology 2024
Amid national concerns
about technology’s impact on youth, many teens are as digitally connected as
ever. Most teens use social media and have a smartphone, and nearly half say
they’re online almost constantly, according to a new Pew Research Center
survey of U.S. teens ages 13 to 17 conducted Sept. 18-Oct. 10, 2024.
YouTube
tops the list of the online platforms we asked
about in our survey. Nine-in-ten teens report using the site, slightly down
from 95% in 2022. TikTok,
Instagram and Snapchat remain widely used among teens. Roughly
six-in-ten teens say they use TikTok and Instagram, and 55% say the same for
Snapchat. Facebook
and X use have steeply declined over the past decade. Today,
32% of teens say they use Facebook. This is down from 71% in 2014-15, though
the share of teens who use the site has remained stable in recent years. And
17% of teens say they use X (formerly Twitter) – about half the share who
said this a decade ago (33%), and down from 23% in 2022. Roughly
one-quarter of teens (23%) say they use WhatsApp, up
6 percentage points since 2022. And
14% of teens use Reddit, a share that has
remained stable over the past few years. We asked about Threads, launched by parent company Meta in 2023, for the first time this
year. Only 6% of teens report using it. More
on teens and tech:
How
often do teens visit online platforms?
Debates about teen social media use often center on
how much time teens spend on these platforms. As lawmakers explore potential
regulations, our 2023 survey found a majority of Americans support
time limits for minors on social media. Our current survey asked teens how often they use
five platforms: YouTube, TikTok, Instagram, Snapchat and Facebook. Overall, 73% of teens say they go on YouTube daily,
making YouTube the most widely used and visited
platform we asked about. This share includes 15% who describe their use as
“almost constant.” About six-in-ten visit
TikTok daily. This includes 16% who report being on it almost constantly.
Roughly half of teens say
they go on Instagram or Snapchat every day, including about one-in-ten who
say they’re on each of these platforms almost constantly. The share of teens who say
they use Instagram almost constantly has increased slightly, from 8% in 2023
to 12% today. Relatively few teens
report using Facebook daily (20%). Across all five
platforms, one-third of teens use at
least one of these sites almost constantly. These findings are largely
similar to what we’ve found the past two years. By
gender
As in previous surveys,
teen girls are more likely than boys to say they use TikTok almost constantly
(19% vs. 13%). Inversely, teen boys are
more likely than girls to use YouTube this often. While 19% of boys say they
use it almost constantly, that share drops to 11% among girls. Unlike last year, similar shares of boys (13%) and girls
(12%) today say they use Snapchat almost constantly. There are also no gender
differences in the shares of teens who report using Instagram and Facebook
almost constantly.
By
race and ethnicity Roughly one-quarter of
Black (28%) or Hispanic (25%) teens say they visit TikTok almost constantly.
This share drops to 8% among White teens.1 Black and Hispanic teens
are also more likely than White teens to say they constantly use YouTube or
Instagram. There are few to no racial
or ethnic differences in the shares visiting Snapchat and Facebook on a near
constant basis. How
does the use of online platforms differ across demographic groups? While many teens engage
with online platforms, usage varies by gender, race and ethnicity, age, and
household income.
By
gender Instagram and TikTok are
used more widely by teen girls than teen boys. For example, 66% of girls say
they use TikTok, compared with 59% of boys. Instagram use follows a similar
pattern (66% vs. 56%). On the other hand, boys
are more likely than girls to say they use YouTube (93% vs. 87%). By
race and ethnicity Among teens, a larger
share of those who are Black (79%) or Hispanic (74%) than White (54%) say
they use TikTok. Black and Hispanic teens also stand out compared with White
teens in their use of Instagram and X. When it comes to the
messaging platform WhatsApp, Hispanic teens are more likely than Black or
White teens to say they use it. By
age Older teens are more
likely than younger teens to use each of the platforms we asked about.
Notably, teens ages 15 to 17 are more likely than those ages 13 to 14 say
they use Instagram (72% vs. 43%) or Snapchat (63% vs. 44%). Differences are more
modest for platforms like YouTube, which most older (92%) and younger (87%)
teens use. By
household income As was true in prior studies, Facebook remains more commonly used
among teens in lower-income households. For example, 45% of teens in
households earning less than $30,000 a year say they use Facebook. This drops
to 35% among teens in households earning $30,000 to $74,999 a year and 29%
among teens with household incomes of $75,000 or more. Teens in lower-income
households are more likely than those in the highest-income households to say
they use TikTok (73% vs. 59%). By
partisanship Teens who identify as
Democrats and Democratic leaners are more likely Republicans and GOP leaners
to say they use TikTok, Instagram, YouTube, Reddit and WhatApp. TikTok stands out for its
partisan difference: 73% of Democratic teens versus 52% of Republican teens
say they use the platform.
How
much time are teens spending online? We also asked teens about
how often they go online in general. Nearly
half of teens say they are online almost constantly, up
from 24% a decade ago. This share has stayed consistent over the past few
years. Overall, nearly all teens
– 96% – report using the internet daily. By
race and ethnicity
Hispanic and Black teens
stand out in their screen time. About half or more Hispanic (58%) or Black
(53%) teens say they use the internet almost constantly. That share drops to
37% among White teens. These findings are consistent with previous Center surveys. By
age Being online almost
constantly is more common among older teens than younger ones. About half of
15- to 17-year-olds report that they are online this often, compared with 38%
of those ages 13 to 14. What
devices do teens have access to at home? There’s no one way that
today’s teens go online.
Our latest survey shows
that large shares of teens have or have access to a smartphone (95%), desktop
or laptop computer (88%), gaming console (83%), or tablet computer (70%) at
home. Overall, smartphone,
computer and gaming console ownership has remained stable over the past few
years. But the share of teens who say they have access to tablets has risen
from 65% in 2023 to 70% today. By
age Most teens say they have
or have access to a smartphone. But older teens (98%) are slightly more
likely than younger teens (90%) to say this. Older teens are also more
likely than younger teens to have or have access to a desktop or laptop
computer (91% vs. 85%). There are no differences
by age when it comes to having a gaming console or tablet computer. By
household income Access to a home computer
or a tablet is most common among teens in high-income households.
By
gender Majorities
of boys and girls have access to a gaming console, but boys stand out. Nine-in-ten
teenage boys say they have access to a gaming console at home, while about
three quarters of girls say this (76%). 12 December, 2024 Source:
https://www.pewresearch.org/internet/2024/12/12/teens-social-media-and-technology-2024/
872-879-43-20/Polls Americans Lean Toward Keeping Legal Immigration Steady, See
High-Skilled Workers As A Priority
Each year, about 1 million immigrants receive legal
permanent residence (a green card) and are legally admitted to the U.S. Most
of them are eligible because they have family already in the country. Other immigrants receive
temporary visas to work in sectors such as technology and agriculture. The incoming Trump
administration’s approach to legal immigration policy remains to be seen. Meanwhile, the technology sector is lobbying for the country to admit more
high-skilled immigrant workers. How
we did this Some Americans are more
likely than others to support increasing legal immigration:
What
do Americans think about illegal immigration? A majority of
Americans support enforcing mass deportations. However, most also say undocumented
immigrants should have a way to stay in the country legally if certain
requirements are met. Read more on how Americans view undocumented immigrants. Americans’
views on legal immigration priorities Americans say high-skilled
workers should get priority over other immigrants for legal admission:
By contrast, only 5% say
people who are not well represented in the U.S. population should be given
top priority to legally immigrate. In fact, most Americans (58%) say this
group should not be given any priority. Legal
immigrants in the U.S.
Overall, 47.8 million immigrants lived in the U.S. in 2023, with the
vast majority living in the country legally. About 1.2 million
immigrants received a green card in 2023. This was up by about 155,000 from
2022. Since 2007, about 1 million or more immigrants have received a green
card every year, except during the coronavirus pandemic. Most immigrants receive a
green card through family ties. In 2023, about 756,000 immigrants got their
green cards through family sponsorship, which typically requires them to have
a close family member with U.S. citizenship. Another roughly 197,000 received
employment-based green cards, which generally go to foreign workers who are
highly skilled or fill labor shortages. And about 67,000 were admitted on
diversity visas from countries that aren’t well represented in the U.S. 19 December, 2024
872-879-43-21/Polls 34% Of Canadians Believe The Development Of AI Technologies
Is A Bad Thing; 30% Think It’s Good
Canadians are divided on whether the development of
AI technologies is a good or bad thing, with three in ten (30%) saying it is
good, particularly those aged 18-34 (37%) vs those aged 55+ (24%) and men
(34%) compared to women (26%). Those with children in their household (37%)
also think it is a good thing compared to those without children in their
household (28%).
Four in ten (40%)
Canadians have used AI technologies in the last three months, rising to
six in ten (63%) among those aged 18-34 (vs 42% 35-54, 19% 55+). Use in
Ontario and Quebec is higher than other provinces, with almost half (46%) of
those in Ontario and over a third (36%) in Quebec compared to one in five
(21%) Saskatchewan/Manitoba. Use of AI varies by education level, with over
half of University graduates (53%) having used AI in the past three months,
compared to post secondary (34%), high school educated (39%), less than high
school educated (32%). Over half (54%) have not used AI technologies in the
last three months while 7% are not sure. 20 December, 2024
872-879-43-22/Polls 25% Say Interest Rates And Inflation Are Top Concern
Pierre Poilievre and the
Conservative Party are viewed as best able to deal with inflation/the cost of
living, housing, the economy, taxes, immigration, while Jagmeet Singh’s NDP
is seen as best to handle health care and poverty and social inequality. Canadians
don’t see the current Liberal government as best to handle any of the top
issues and over a third say they believe none of the leaders are best to deal
with the top three issues of inflation (36%), health care (33%) and housing
(33%). 27 December, 2024 Source:
https://www.ipsos.com/en-ca/25-percent-say-interest-rates-and-inflation-are-top-concern
872-879-43-23/Polls While Trudeau’s Future Is Unclear, All Three Major Federal
Leaders Failing To Connect With Canadians
The holidays are often a
season of reflection, but for Prime Minister Justin Trudeau, the scale of
personal deliberation is reportedly going to be gargantuan, as he will decide whether or not to lead his party into
an expected election this fall (or earlier) or to step aside for a new
Liberal leader. Trudeau’s steadfast position that he would lead the party for
one more election was evidently shaken by the resignation of Finance Minister
Chrystia Freeland earlier this week. His fellow major federal
party leaders are faring better, but not by much. Both CPC leader Pierre
Poilievre and NDP leader Jagmeet Singh are viewed unfavourably by more than
half of Canadians and have the favourable opinion of fewer than two-in-five:
While Trudeau sunk to his
lowest point in 2024, generating a -40 in net approval (approval minus
disapproval), both of his competitors endured attrition as well. Though his
party enjoys a significant vote intention advantage to end the year,
Poilievre holds a -18 net favourability. This mark grew by eight points
throughout the year. In a year where he ended his party’s Supply and
Confidence Agreement with the governing Liberals, Singh saw his net
favourability drop from -4 to -16, the largest negative movement of any
leader:
Continued
decline for Trudeau “Like most families,
sometimes we have fights around the holidays,” Prime Minister Justin Trudeau
said in a speech to the Liberal Party’s holiday event in what might be the
understatement of the Canadian political year. The year-end gathering had
inauspicious timing – it came the day after Deputy Prime Minister and Finance
Minister Chrystia Freeland had quit her post on
what was supposed to be the day she delivered the federal government’s Fall
Economic Statement. The sudden departure triggered what would be a chaotic
day on Parliament Hill that ended with Trudeau staying on – despite speculation he was considering stepping
down himself in
response – and taking the holidays to decide how to proceed. The calls for
Trudeau to resign from within his party grew louder after Freeland’s
resignation. His party remains more than 20-points behind the opposition
Conservatives in vote intention,
and views of him remain overwhelmingly negative. Fewer than three-in-ten
(28%) Canadians approve of Trudeau’s performance as prime minister, tying
what is a
low of his tenure.
Trudeau’s approval has not reached higher than one-third since September
2023.
Women are less critical of
Trudeau than men, who have grown more negative of the prime minister this
year. However, at most 35 per cent of any single demographic approve of
Trudeau – women older than 55:
A majority of 2021 Liberal
voters (56%) approve of Trudeau, but two-in-five (40%) do not. And views of
the group who helped elect him to a third term in government have declined by
six points during 2024. He does fare better (78% approval) among those who
say they would vote Liberal if the election was held today, but as the vote
intention picture shows, this group of supporters is much smaller than it has
been throughout his entire tenure.
Trudeau
and his predecessors Using data compiled from
the ODESI archive, we can compare Trudeau’s current nadir with that of his
predecessors. Trudeau’s low point is just one point higher than that of his
father, who served as prime ninister for more than 15 years in two
non-consecutive stints. His lowest approval rate came with approximately two
years remaining in his second run. The lowest point for any leader was
recorded for Brian Mulroney during his second majority government, when he
was approved of by just 12 per cent of Canadians. This, during the year that
his government implemented the GST, which led to anger and confusion. The younger Trudeau’s low point comes as his GST holiday has
proven to be perceived as an “entirely political” endeavour:
CPC
climbs but Poilievre trails behind in public sentiment The Conservatives under
leader Pierre Poilievre have lapped their rivals when it comes to voter
support, but views of Poilievre himself remain more negative than positive.
Fewer than two-in-five (37%) say they have a favourable view of the CPC
leader, outnumbered by the majority of Canadians (55%) who do not. And the
latter proportion has grown throughout 2024, despite the Conservatives’
popularity among the electorate currently. Poilievre’s favourability
has stayed at a similar level since he was first elected as Conservative leader.
Poilievre’s main issue
continues to be a significant gender gap in appraisal. However, he made
slight gains among 18- to 34-year-old women in 2024, but those were offset by
larger declines among men that age over the same period.
Poilievre remains very
popular among 2021 Conservative voters, with more than four-in-five (83%)
saying they have a favourable view of him. The opposite is true among other
political groups, and he’s lost ground among those who voted Liberal, NDP and
Bloc Québécois in the 2021 election:
Singh
finishes the year down There have been signs of
improvement over the past few months for NDP leader Jagmeet Singh when it
comes to public opinion. Indeed, he has enjoyed a five-point bump from his
nadir of 33 per cent in September, but still ends the year down six points.
Singh and his party ended the Supply and Confidence Agreement with Trudeau’s
Liberals in September, but have continued to support legislation, including
the Liberal’s GST holiday. That said, he also pushed the government to split off a $250
rebate cheque into a
separate bill after he claimed too many people would be exempted from the
cheque as originally proposed. Singh has recently stated that Trudeau “has to go”, though this statement was made after this survey was
conducted:
The main source of Singh’s
drop in favourability is among young people. He lost 14 points among young
men and 11 among young women in 2024. These are groups he will hope to win
back ahead of a pivotal election for himself and his party:
Singh’s favourability
among his own 2021 voters dropped five points this year from 80 to 75 per
cent. This puts him well ahead of Trudeau’s mark with past voters (56%) but
behind where Poilievre sits with 2021 CPC voters (83%). Notably, Singh has
the same favourability among 2021 Liberals as Trudeau has approval:
20 December, 2024 Source:
https://angusreid.org/approval-favourability-trudeau-poilievre-singh-2024-polling/ AUSTRALIA
872-879-43-24/Polls Sydney FC Is Again The Most Widely Supported A-League Club
Ahead Of The Brisbane Roar And Melbourne Victory
New
research from Roy Morgan shows Sydney FC topping the 2024 Roy Morgan A-League
club supporter ladder with 761,000 fans, virtually unchanged on a year ago,
and well over 100,000 more fans than any other club in the league. Sydney FC has been the
most successful club in the A-League Men winning 5 Championships – although
only one Championship victory in the last five years in 2019-20. In a clear third place is the Melbourne Victory with
588,000 supporters, representing a significant decrease of 27,000 (-4.4%) on
a year ago – the largest decline of any club in the competition. The
Victory have been the second most successful club in the A-League Men winning
4 Championships. The current back-to-back
A-League Men Champions the Central Coast Mariners increased their support by
18,000 (+10.3%) in the last year to 192,000 and have more than doubled their
support since the low of 2020 (84,000). The Mariners won back-to-back
Championships in 2023 and 2024. A-League
Club Supporter Ladder 2024
Over
4 million Australians now support an A-League club, up over 1.4 million
(+52.5%) on 2020 Support for the A-League
as a whole has increased over 50,000 (+1.3%) from a year ago and is up over
1,400,000 (+52.5%) on four years ago. Since 2020 two new clubs
have joined the A-League Men. Macarthur FC joined the A-League Men for the
2020-21 season and now has 58,000 supporters and Auckland FC joined the
A-League Men this season and sits on top of the ladder undefeated after the
first seven rounds of the season. Auckland FC debuted in the A-League Men
after the interviewing dates for this research. In total, over 1.6 million
Australians (7.2%) watch the A-League on TV. However, a much larger 6.1
million (27.2%) have watched any soccer match on TV. This large audience
includes 5.3 million (23.6%) who watched at least part of the FIFA World Cup
– last held in Qatar in November and December 2022. This means a significant
untapped market of around 4 million Australians is available for the
A-League, in the shape of those who exclusively watch international leagues
or international tournaments such as the FIFA World Cup. A look at who engages with
the A-League shows TV viewership is highest for Generation X* (7.8%) and
Millennials (7.6%) and Generation X (7.1%). When it comes to attending a
soccer match the younger generations leads the way with Generation Z in front
at 7.5% ahead of Millennials at 7.4%. Roy
Morgan Industry Communications Director Julian McCrann says: “An
impressive seven out of the 12 continuing A-League clubs have increased their
supporter bases over the last year – and new club Auckland FC
currently sits on top of the A-League ladder undefeated after seven rounds. “Now
over 4 million Australians support an A-League club, an increase of 50,000
(+1.3%) from a year ago and a massive increase of over 1.4 million (+52.5%)
from four years ago since 2020. “Unsurprisingly,
the most widely supported clubs are the most successful clubs located in
Australia’s three largest cities of Sydney, Brisbane, and
Melbourne. Sydney FC is again in front with 761,000 supporters,
well in front of the Brisbane Roar on 642,000 and Melbourne
Victory on 588,000. “Sydney
FC has won five A-League Men’s Championships (2006, 2010, 2017, 2019
& 2020) ahead of Melbourne Victory with four (2007, 2009, 2015
& 2018) and Brisbane Roar in third place with three (2011, 2012
& 2014). “The
most successful club of the last two seasons, the Central Coast
Mariners, have experienced a surge in support over the last four years – more
than doubling and up by 111,000 (+137%) since 2020 – the largest percentage
increase of any long-standing club. The Mariners have won the
A-League Men’s Championships three times – including the last two (2013, 2023
& 2024). “Melbourne
City have also experienced a stunning increase in support in recent
years with support for the club increasing by 37,000 over the last year to
315,000 – the largest increase of any club compared to a year ago. Looking
back further, City’s support has almost doubled compared to four years
ago up by 150,000 (+90.9%). “The
increase in support for City in recent years is no surprise given
the club won its first A-League Men’s Championship in 2021 and won three
straight A-League Men’s Premierships in 2020-21, 2021-22 and 2022-23 –
the only club to finish on top of the table in three consecutive years. “Although
the A-League has increased its support base rapidly in recent years there
remains a large untapped market of millions of Australians who consume the
sport played overseas rather than the local product available around
Australia. Bringing these two markets together remains the leading challenge
for those leading the sport in this country.” 17 December, 2024 Source:
https://www.roymorgan.com/findings/9778-a-league-supporter-ladder-2024
872-879-43-25/Polls ANZ-Roy Morgan Inflation Expectations Are At 4.8% In
Mid-December – Up From 4.7% For The Month Of November
The latest weekly ANZ-Roy Morgan Inflation Expectations are
4.8% for the week of December 9-15, 2024. This figure is below the average
this year of 4.9%, but up 0.1% points from the month of November. Looking back over the year, weekly Inflation
Expectations have moved in a narrow band of 4.5% - 5.3% and averaged 4.9%. In
addition, the latest information on weekly Inflation Expectations is
available to view each week in the Roy Morgan Weekly
Update video on YouTube. Monthly
Inflation Expectations Index long-term trend – Expected Annual Inflation in
next 2 years
Source:
Roy Morgan Single Source: Interviewing an average of 4,900 Australians aged
14+ per month (April 2010 – Nov. 2024). Petrol
prices increased by five cents per litre in November to the highest since
August 2024 The month of November saw
average retail petrol prices increase by five cents per litre to $1.80 per
litre. During November, average retail petrol prices dropped to a low of
$1.73 in late November. However, after the month of November ended average
retail petrol prices have subsequently increased to back over $1.80 per litre
during the first two full weeks of December while weekly inflation
expectations also inched higher in December compared to their average for the
month of November. Looking back, average
retail petrol prices have now been above $1.70 per litre for a record 117
straight weeks since mid-September 2022 – over two years. Average retail
petrol prices hit a low of $1.73 per litre in late September, again in
mid-October and for a third time in late November. Looking longer-term,
average retail petrol prices have now averaged $1.89 per litre since late
February, but this has dropped to an average of $1.79 per litre since early
August over the last four months. The persistently high
petrol prices are clearly a key factor putting upward pressure on Inflation
Expectations, which have increased marginally in December, but the overall
trend is for lowering inflation. The latest official ABS Quarterly annual CPI estimate at 2.8%
for the September quarter 2024,
was a decrease of 1% point from the 3.8% recorded for the June quarter 2024. The official inflation
estimate of 2.8% for the 12 months to September quarter 2024 is now within
the Reserve Bank’s inflation target of 2-3% over the course of the economic
cycle and has led to increasing discussion of when the RBA might commence an
interest rate cutting cycle early in 2025. The
next ABS Monthly CPI figure for November 2024 is due to be released early
next month (January 8). Australian
average retail petrol prices (cents per litre) weekly: 2021 – 2024
Source: Australian Institute of Petroleum (AIP) weekly
reports: https://www.aip.com.au/pricing/weekly-prices-reports. Inflation
Expectations are highest in Queensland, lowest in Tasmania A look at Monthly
Inflation Expectations on a State-based level shows Queensland has the
highest Inflation Expectations for a second straight month at 4.9%, despite
dropping 0.4% points from a month ago – the largest monthly fall of any
State. Offsetting the decrease in
Queensland, there were small increases in other States including New South
Wales, up 0.1% points to 4.8%, Victoria, up 0.3% points to 4.8%, Western
Australia, up 0.1% points to 4.7% and South Australia, up 0.4% points to 4.7%
- the largest monthly increase of any State. For a second straight
month Inflation Expectations remained lowest in Tasmania at only 4.1%,
unchanged on a month ago. Inflation Expectations in
Country Areas were unchanged at 4.9% and remain clearly higher than in
Capital Cities at 4.6%, also unchanged on a month ago. Roy
Morgan CEO Michele Levine says weekly Inflation Expectations were at 4.8% in
mid-December, up 0.1% points from the monthly estimate of 4.7% for November,
indicating inflationary pressures in the economy remain sticky despite having
dropped from earlier in the year: “ANZ-Roy
Morgan Inflation Expectations in Australia have increased slightly in
December and are now at 4.8%, up 0.1% points from the month of November
(4.7%). Inflation Expectations for the month of November were unchanged from
both October (4.7%) and September (4.7%). “Average
retail petrol prices hit lows of $1.73 in each of late September, mid-October
and again in the last week of November. Importantly, since reaching that
level average retail petrol prices have steadily increased in December and
are now again above $1.80 per litre and putting upward pressure on Inflation
Expectations and broader inflation. “However,
over the longer-term petrol prices have been above $1.70 per litre for 117
straight weeks since mid-September 2022 – well over two full years above this
mark. In addition, so far this year average weekly petrol prices have
averaged $1.89 per litre since late February. “Looking
forward, the ABS is set to release the November 2024 monthly CPI estimates in
early January. The estimates will be keenly watched to see if the monthly
estimate continues at its low rate. The ABS
estimated monthly annual inflation was only 2.1% in the both the year to
September 2024 and the year to October 2024 –
at the bottom of the Reserve Bank’s preferred target range. “The
latest results from the weekly ANZ-Roy Morgan Inflation Expectations suggest
the upward pressures on inflation were muted during November but have
increased marginally during the first few weeks of December as average retail
petrol prices resumed their climb. “The
volatility in energy prices, and Inflation Expectations, shows how sensitive
Australians are to changes in the prices of essential everyday goods – like
petrol.” 17 December, 2024 Source:
https://www.roymorgan.com/findings/9783-australian-inflation-expectations-november-2024 MULTICOUNTRY STUDIES
872-879-43-26/Polls Global
Elections In 2024: What We Learned In A Year Of Political Disruption
2024 was a remarkable year for elections as voters in more than 60 countries went to the polls. It also turned
out to be a difficult year for incumbents and traditional political parties.
Rattled by rising prices, divided over cultural issues and angry at the political status quo,
voters in many countries sent a message of frustration. How we did this In this essay, we analyze four major themes that
emerged from this year’s busy slate of elections around the world:
A tough year for
incumbents South Africa’s general election results come in at
the Gallagher Convention Center in Midrand on June 2, 2024. The African
National Congress failed to win a majority of National Assembly seats for the
first time since the end of apartheid. (Phill Magakoe/AFP via Getty Images) In one of the year’s highest-profile elections,
Democrats in the United States lost
the presidency, with Donald Trump, the Republican former president, defeating
Vice President Kamala Harris. Republicans also won majorities in both houses
of Congress. It was the third straight U.S. presidential election
in which the incumbent party lost. And it was one of many notable losses for
incumbents around the world in 2024:
Elsewhere, incumbent parties held on to power but
still suffered significant setbacks:
What made 2024 such a tough year for incumbents? While every election is shaped by local factors, economic challenges were a consistent theme across
the globe. That included the U.S., where the economy was the top issue for registered voters – especially
for those who supported Trump. A survey we conducted in 34 countries earlier this
year illustrated the
extent of global economic gloom. Across these nations, a median of 64% of
adults said their national economy was in bad shape. In several nations that
held elections in 2024 – including France, Japan, South Africa, South Korea
and the UK – more than seven-in-ten expressed this view. Inflation was an especially
important issue in this year’s elections, although economic concerns
were prevalent in many countries before the post-pandemic wave of global
price increases. The past two decades have seen financial crises, the Great
Recession, the COVID-19 economic downturn, inflation and ongoing economic
inequality, all of which may have shaped the mood in nations around the
globe. But the economy wasn’t the only thing driving voter
discontent. Our global surveys over the past few years have highlighted
a broader frustration with the
functioning of representative democracy. Across 31 nations we
surveyed in 2024, a median of 54% of adults were dissatisfied
with the way democracy is working in their country. And in several
high-income nations, dissatisfaction has increased significantly over the
past three years. Our surveys have shown that many people feel
disconnected from political leaders and institutions. Large majorities in
many nations believe
elected officials don’t care what people like them think. Many say
there is no
political party that represents their views well. And large shares
say people like them have
little or no influence on politics in their country. The staying power of
right-wing populism Supporters of the Alternative for Germany (AfD)
political party gather at a campaign rally in Erfurt, Germany, on Aug. 31,
2024. AfD went on to win in Thuringia, becoming Germany’s first far-right
party to win a state election since World War II. (Sean Gallup/Getty Images) Frustrations with the political class have created
opportunities for right-wing populists and other challengers to traditional
parties and the political status quo. Several elections this year in Europe
highlighted this trend:
Over the past decade, commentators have regularly
debated whether right-wing populism in Europe is rising
or falling, based on the results of the most recent election. But the
larger story is that right-wing
populist parties have become embedded in Europe’s political landscape,
significantly disrupting the continent’s politics. In some cases, right-wing parties have won the most
votes, as in the Netherlands in 2023 and Italy in 2022. Sometimes they
have lost power, as in Poland’s late 2023 elections. But
they are now consistently competitive in ways they were not until relatively
recently. Populists have had success outside of Europe as
well. In the United States,
Trump’s “Make America Great Again” movement has become the dominant
force within the Republican Party. The party has moved in a populist
direction that looks very different from the pre-2015 GOP. With Republican electoral victories this year, the
party will soon control the executive and legislative branches of government.
Republican presidents have also appointed six of the nine current Supreme
Court justices. Trump appointed three of these in his first term and may have
the opportunity to appoint more in his second. Different varieties of right-wing leaders have found
success in other regions as well. In India, Narendra
Modi may have suffered a setback in this year’s elections, but he
still dominates the nation’s politics. In Indonesia, Prabowo
Subianto won the presidential election amid concerns about his human
rights record. Right-wing leaders in Latin America offer an
eclectic mix of ideologies. But as
The Economist has noted, several share an opposition to abortion, women’s
rights and LGBTQ+ rights; an opposition to social democracy; and a hard-line
view on crime. This group includes Javier
Milei, who won the presidential election in Argentina in December 2023,
and El Salvador’s Nayib Bukele, who won
reelection as president with over 80% of the vote and was buoyed by strong
support for his crackdown on criminal gangs. Populism has had some success on the left, too. One
example is Mexico’s Morena
party, which has only been in existence for about a decade but now dominates
the nation’s politics. Building on the popularity of outgoing President
Andrés Manuel López Obrador and the country’s relatively positive economic
mood, Morena
won outright majorities in both chambers of the Congress. And
Morena’s Claudia Sheinbaum is now Mexico’s
first female president. Whether on the right or left, populist parties have
been able to capitalize on voters’ frustrations with elites – and the belief,
shared by many, that establishment parties and leaders are out
of touch with ordinary citizens. Polarized battles over
tradition and change Abortion-rights supporters stage a counterprotest
during the 50th annual March for Life rally on Washington, D.C.’s National
Mall on Jan. 20, 2023, several months after a U.S. Supreme Court ruling ended
the federal right to abortion. (Chip Somodevilla/Getty Images) The spread of populism has coincided with deepening
political divides over culture and identity in many nations. In France,
Le Pen and her National Rally party regularly make arguments about defending
French culture and civilization from immigrants and outsiders. The
Freedom Party of Austria, Alternative for Germany, the Party for Freedom in
the Netherlands and the Brothers of Italy also have made concerns about
immigration – especially immigration from predominantly Muslim nations –
central to their platforms.
Additionally, Austria’s
Freedom Party has
opposed LGBTQ+ rights. Its platform includes a constitutional
determination that there are only two genders, and the party opposes same-sex
relationships. Similar issues have appeared in other
2024 elections as well. More broadly, surveys have found sharp ideological
divides over the value of tradition in society. A 2022 cross-national Pew Research Center
survey included
a question exploring tradition and change. It asked respondents whether
they believe their country will be better off in the future if it sticks to
its traditions and ways of life, or if it is open to changes regarding its
traditions and ways of life. In 15 of the 16 nations where we measured ideology,
there was a significant difference between the ideological right and left.
The gap was largest by far in the United
States, where 91% of liberals say the country will be better off
if it embraces change, compared with just 28% of conservatives. And our cross-national polling has consistently
shown that the U.S. is more ideologically divided than most, with especially
wide gaps on issues including abortion and climate
change. America’s two-party system has a tendency to
exacerbate ideological differences. And as Ezra
Klein, Lilliana
Mason and other writers have described, polarization has intensified
in recent years as various types of identities have become “stacked”
on top of people’s partisan identities. Today, race, religion and
ideology are often more aligned with partisanship than was the case when the
two major parties were relatively heterogenous coalitions. Often, this
results in identity-based conflicts and seemingly existential arguments over
different conceptions of American identity. International conflicts
with political implications A Ukrainian gunner stands guard in an infantry fighting
vehicle on Dec. 7, 2023, in the Donetsk province of Ukraine. (Roman
Chop/Global Images Ukraine via Getty Images) Voters almost always prioritize domestic issues over
international challenges. But international conflicts – especially the
Russia-Ukraine and Israel-Hamas wars – nonetheless played an important role
in the global election year of 2024. In many nations, there are ideological divisions over how to deal with Russia’s
invasion of Ukraine, with support for Kyiv often lower
among those on the ideological right. Just days before elections in the United Kingdom, Farage, the leader of the
Reform UK party, reiterated previous claims that Russia’s invasion of
Ukraine had been “provoked” by “the ever-eastward expansion of NATO
and the European Union.” In France,
Le Pen has been critical
of EU sanctions against Russia and has called for restrictions
on French aid to Ukraine. And she has had kind
words in the past for Russian President Vladimir Putin and his
policies.
In Slovakia, voters
chose as their new president Peter Pellegrini, a close ally of the
country’s pro-Russia Prime Minister Robert Fico. And right-wing populist
parties in Austria and Germany have expressed
reservations about support
for Ukraine. Many on the ideological right in the United States are also skeptical
about supporting Ukraine. When a Ukraine
aid bill passed the House of Representatives in April, Republicans were
divided, with 101 voting in favor and 112 opposing the legislation. At the Munich Security Conference in February, JD
Vance – now the vice president-elect – said the
U.S. should provide less aid to Kyiv. And as a Senate candidate in 2022,
he said, “I
don’t really care what happens to Ukraine one way or another.” Pew Research Center polling has documented declining
support among Republicans for providing aid to Ukraine since
Russia’s invasion. Meanwhile, the
Israel-Hamas war has generated tensions within the ideological left. Take the United
Kingdom. While the Labour Party won
an overwhelming victory this year, some of its few losses were
to candidates
on the left who were critical of Prime Minister Keir Starmer’s
support for Israel. In the United
States, polling highlights sharp divisions among the supporters of
the Democratic Party, especially
young liberals, many of whom opposed the Biden administration’s approach
to the Israel-Hamas war. It was also an issue in France, where many have accused
leaders of France Unbowed – which has been strongly critical of
Israel – of antisemitism. Looking ahead The list of nations set to hold national
elections in 2025 includes Canada, Chile, Germany, Jamaica, Norway and Singapore.
The results will show whether incumbents – and those who are seen as
representing the political status quo – continue to be targets of voter
discontent. 11 December, 2024 872-879-43-27/Polls 2024
Cost Of Living Barometer: 41% Of French People Anticipate A Drop In Their
Purchasing Power, A Global Study Across 32 Nations
Key trends to remember
The gap between the
announcements of a reduction in inflation and the experience of the French
has reached a very high level
Political choices, the
main cause of the decline in purchasing power according to the French A very large majority of French people (77%) believe
that political choices are primarily
responsible for price increases (a clear increase with +9
points compared to November 2023). This is one of the highest figures among
the thirty-two countries in the survey, with a global average of 69%. The weight of the
global economic situation remains one of the main causes of
price increases for 74% of French people. A consideration down 1 point
compared to November 2023.
While they pointed to excessive corporate profits as a
major reason for price increases in June 2022, the French are a little less
critical today: 71% blame them compared to 75% at the time. On the other hand, immigration seems to have a significant impact on price
increases for more than 1 in 2 French people (55%), i.e. +4 points compared
to November 2023, while wage increases requested by workers are pointed out
by 46% of French people. Interest rates are regularly covered in the news and
are responsible for nearly 7 out of 10
French people (67%) of the decrease in their purchasing power, however rates
are starting to decrease, this figure is down compared to November 2023 with
-2 points. This year, the French are giving less weight to exogenous factors: the
Russian invasion of Ukraine accounts for 66% in November 2024 compared to 82%
in June 2022 – a trend that is confirmed worldwide (58% today vs. 76% in
April 2022) – as well as the Covid-19 pandemic (55% vs. 74% in April 2022). Despite a drop in
inflation, public opinion is not optimistic in France and around the world 41% of French people
predict a decrease in their available cash flow or "arbitrable
purchasing power" (i.e. what remains once
all daily living expenses and charges have been paid). Nevertheless, this
statement is down 2 points compared to November 2023. A large majority of
French people think that food
prices will increase in the next 6 months (70%) compared to
72% globally.
Despite a slight decrease of 1 point compared to
November 2023, the French remain largely convinced that energy costs will continue to rise,
with 77% of them sharing this opinion. In the same way, the cost of rent or mortgage, which
represents a significant expense in household budgets, is expected to
increase in the next 6 months. They are 1 in 3 French people to consider it
(+4 points vs. November 2023). Leisure and outings (bars,
restaurants, cinemas, clubs, etc.) are not to be outdone, 60% of French
people believe that the price will be higher in the coming months (+2 points
vs. November 2023). The hot topic of taxes is
present in the minds of a large part of the French: 74%
think that their taxes will increase (to the highest since April 2022), 58%
see unemployment worsening and 37% expect to see their standard of living
fall. Attached to public services, the
French are aware of the complexity of the equation between reducing taxes and
reducing spending on public services or vice versa. They seem to prefer
solutions that relieve them financially in the short term, with more than 1
in 3 French people (34%) choosing the first hypothesis and 23% the second. 05 December, 2024 872-879-43-28/Polls December
2024: Consumer Confidence Down Globally For The Second Consecutive Month, 29
Countries Surveyed
Based only on the “legacy 20 countries” tracked
since March 2010, the Index would read at 45.8, down 0.7 point since
November. The Current and Investment indices both show
significant declines for the second consecutive month. The Expectations index
is also down, while the Jobs index shows stability this month. Sentiment is generally down among European
countries. Germany (-3.9 points) and France (-3.7 points) show the largest
declines among all countries this month. Belgium (-3.3 points), Great Britain
(-2.8 points), and Poland (-2.7 points) also show significant losses. In contrast, consumer confidence is mixed in Asia.
Malaysia (-3.4 points) and South Korea (-2.1 points) are down significantly
this month, while sentiment is up in Indonesia (+2.2 points). The Global Consumer Confidence Index is the average
of all surveyed countries’ Overall or “National” indices. This month’s
installment is based on a monthly survey of more than 21,000 adults under the
age of 75 from 29 countries conducted on Ipsos’ Global Advisor online
platform. This survey was fielded between November 22 and December 6, 2024. 1-month change (vs
November 2024) Sentiment is generally down among European countries.
Germany (-3.9 points) and France (-3.7 points) show the largest declines
among all countries this month. Belgium (-3.3 points), Great Britain (-2.8
points), and Poland (-2.7 points) also show significant losses. In contrast,
consumer confidence is mixed in Asia. Malaysia (-3.4 points) and South Korea
(-2.1 points) are down significantly this month, while sentiment is up in
Indonesia (+2.2 points).
Among the 29 countries, Indonesia (66.5) holds the
highest National Index score. Indonesia and India (60.3) are the only
countries with a National Index score of 60 or higher. Overall Consumer
Confidence Index - December 2024 Ipsos’ Global Consumer Confidence Index is down 0.7
point since last month and sits at 47.9. The index has declined for the
second consecutive month and is now 1.5 points lower than its reading to
begin 2024.
In contrast, five countries now show a National
Index below the 40-point mark: France (38.5), Japan (38.5), South Korea
(38.0), Hungary (34.0), and Türkiye (31.6). Of note, consumer confidence in France has fallen to
its lowest point since November 2020. Compared to 12 months ago, twelve countries show a
significant drop in consumer sentiment. In contrast, eight countries show a
significant increase from December 2023, most of all in Argentina (+8.0),
Malaysia (+7.4), and South Africa (+7.4). 1-year change (vs December
2023) Compared to 12 months ago, twelve countries show a
significant drop in consumer sentiment. In contrast, eight countries show a
significant increase from December 2023, most of all in Argentina (+8.0),
Malaysia (+7.4), and South Africa (+7.4).
Ipsos’ Global Consumer Confidence Index (based on
all 29 countries surveyed) currently reads at 47.9, down 0.7 point since
November. Based only on the “legacy 20 countries” tracked since March 2010,
it would read at 45.8. The Current sub-index, reflecting consumers’
perceptions of the economic climate and their current purchasing, jobs, and
investment confidence, shows the largest drop among the sub-indices for the
second consecutive month (-1.1 points) and is now at 38.0. Just three
countries show a significant month-over-month gain (at least 2 points) in
their Current sub-index, while nine countries show a significant loss. The Investment sub-index, indicative of consumers’
perception of the investment climate, is down significantly for the second
consecutive month (-1.0 point) and now sits at 40.5. In total, only four
countries show a significant gain in their Investment sub-index this month,
while ten countries show a significant loss. The Expectations sub-index, indicative of consumer
expectations about future economic conditions, is down 0.8 point and is now
at 56.3. Just three countries show significant gains in their Expectations
sub-index, compared to eleven countries show a significant loss. The Jobs sub-index, reflecting perceptions about
jobs security and the jobs market, is the only sub-index to not show a loss
this month (+0.1 point) and is now at 58.0. Five countries show significant
gains in their Jobs sub-index, while four countries show a significant loss. Of note, Germany shows significant losses (of at
least 2 points) across all four sub-indices. In contrast, no countries show
significant month-over-month gains across all four sub-indices. 20 December, 2024 Source:
https://www.ipsos.com/en/ipsos-consumer-confidence-december-2024 |