|
BUSINESS
& POLITICS IN THE WORLD GLOBAL
OPINION REPORT NO. 885-890 Week: 3 February, 2025- 16
March, 2025 Presentation: 21 March
2025 Amid
climate change, LED-lit ‘plant factories’ enter spotlight Trump’s
freeze on foreign aid could give China an opening on the world stage The 2025 Ramadan Handbook – Lebanon Edition The 2025 Ramadan Handbook – Egypt Edition The 2025 Ramadan Handbook – Saudi Arabia Edition Spotlight*KSA: Views on Brand Engagement Nigerians oppose removal of fuel subsidies, want them reinstated Sudanese
reject domestic violence but see it as a private matter to be handled within
the family Patients struggling with NHS admin The Power of Product Testing with Synthetic Data War in Ukraine: 66% of French people believe that European
support for Ukraine must continue Valentine's Day: Money and love go hand in hand Trump,
Meta and power – what does this mean for Sweden? The
Complex Landscape of Public Opinion on Deportation Obama
Best Liked Among Living Presidents; Biden, Least LGBTQ+
Identification in U.S. Rises to 9.3% A
look at Black-owned businesses in the U.S. Americans
Continue to View Several Economic Issues as Top National Problems Beyond the Buzz: How Canadians are Embracing a Sober Tomorrow Comprehensive
Analysis of Television Consumption in Colombia Ipsos New Zealand Valentine's Day - Love Life Satisfaction 2025 What Worries the World – February 2025 INTRODUCTORY NOTE
885-890-43-30/Commentary:
Beyond
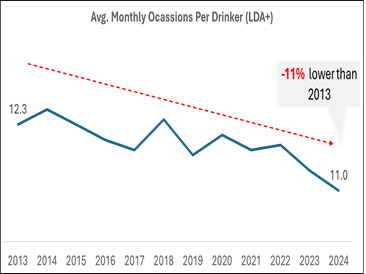
the Buzz: How Canadians are Embracing a Sober Tomorrow
To understand the motivations
behind this shift, the Ipsos Behavioral Science team developed the Ipsos ALC
Framework to help brands address drivers of reduced alcohol consumption. This
framework is based on Self-Determination Theory, which posits that intrinsic
motivation arises when a behavior is perceived as worthwhile, controllable,
and socially connected. Consequently, the ALC framework
consists of three pillars focusing on intrinsic motivation to reduce alcohol
consumption: 1.
Attitudes: Focuses on individuals' health knowledge and attitudes
toward alcohol and alcohol substitutes 2.
Locus of Control: Focuses on a person's perceived control over their
drinking habits and decisions 3.
Connectedness: Focuses on the robust relationship between social
relationships and drinking behaviors Attitudes Previously, moderate alcohol
consumption was believed to be beneficial (e.g., “red wine is good for the
heart”). However, today, there are increasing questions about the impact of
alcohol on health. Nearly two in every five legal drinking age individuals in
ACT express concern about alcohol's health effects, and half report reducing
their intake in 2024. The emphasis on health and wellness in the media has
underscored the negative impact of alcohol — even in moderation.
Non-alcoholic beverages are gaining popularity, with 34% of ACT respondents
also consuming non-alcoholic options. Brands should capitalize on this trend
by promoting low-to-no alcohol beverages that align with consumer health
goals. Considerations for your
business: ·
Do you know if your consumer
base is taking active steps to stay healthy? ·
Are you aware of specific
occasions where health is prioritized over alcohol consumption? Are you
poised to win there? ·
Have you considered the impact
of GLP-1 usage on your business? Locus of Control The rise of alcohol substitutes
has provided consumers with more choices, allowing them to redefine their
drinking habits. The Sober Curious movement marks a departure from older
norms: In 2024, 40% ACT drinkers claimed to set intentional limits on their
alcohol intake; 15% of 18- to 34-year-olds take extended breaks from alcohol
beverages, nearly double from that done by Canadians over 55. When drinking
at bars or parties was the norm, abstaining was often seen as breaking the
norm. However, the Sober Curious movement and the availability of low-to-no
alcohol options at social events have created a new norm where consumers feel
empowered to decide whether to drink. Considerations for your
business: ·
Do you understand your current
consumers' beverage repertoire and alternative options? ·
Does your portfolio cater to
the Sober Curious? ·
Have you developed a strategy
to communicate, engage and win with the Sober Curious effectively? Connectedness Consumers tend to invest in
relationships with like-minded people, often mirroring their behaviors. The
motivation to reduce alcohol consumption is linked to social interactions and
where these interactions occur. Peer groups typically influence drinking
habits; when a group reduces alcohol intake, individuals often follow suit to
fit in or gain acceptance. This shift may lead to shared interests in
low-to-no alcohol beverages. While alcohol is often viewed as a social
lubricant, data suggests younger generations are less likely to frequent bars
and clubs compared to older generations. This change may reduce the perceived
need for alcohol as an aid to socialization, motivating individuals to choose low-to-no-alcohol
options. Nearly 1 in every 5 of 18 to 34 years old drinker in ACT
switch between alcohol and non-alcoholic alternatives. As social dynamics
evolve, mindful and moderate drinking practices are likely to become more
prevalent. Considerations for your
business: ·
Are you clear on the emotional and functional benefits
consumers seek from your brand? ·
What information sources do your consumers use to explore new
offerings? ·
Are you aware of how the on and off premise social occasions
of consumption are evolving? (Ipsos Canada) 14 February, 2025 Source:
https://www.ipsos.com/en-ca/beyond-buzz-how-canadians-are-embracing-sober-tomorrow SUMMARY OF POLLS ASIA (Tokyo) Amid climate change,
LED-lit ‘plant factories’ enter spotlight Japan's plant
factories are rising as climate change impacts farming.
Companies like Itoya Ltd. and Leaf Factory Tokyo grow
vegetables indoors using artificial lighting for stable production. Despite high costs,
demand is growing, making plant factories a potential future for
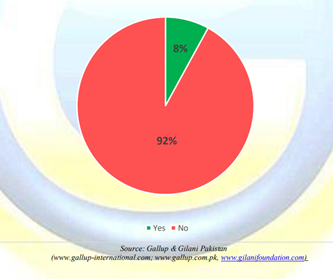
urban agriculture. (Asahi Shimbun) 22 February, 2025 (Pakistan) A Gallup
& Gilani survey found that 8% of
Pakistanis have carried a knife, gun, or weapon
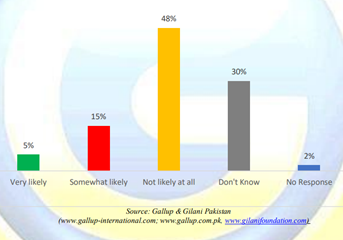
for security, while 92% have not. (Gallup Pakistan) 19 February, 2025 (Pakistan) A Gallup
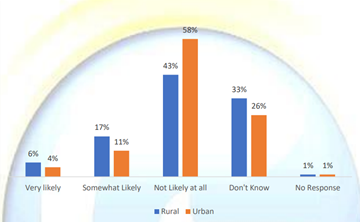
& Gilani Pakistan survey found that 20% of
Pakistanis see war with India as somewhat or very likely,
with rural residents (21%) more convinced than urban
residents (15%). Meanwhile, 48% believe war is not likely at all,
with urban respondents (58%) more confident than rural ones. (Gallup Pakistan) 20 February, 2025 (China) Trump’s freeze on foreign
aid could give China an opening on the world stage Trump’s foreign aid
cuts and targeting of USAID have raised
concerns about the U.S. ceding global influence to China,
which invests heavily in infrastructure and energy projects
abroad. While U.S. aid focuses on public health and humanitarian efforts,
China's loans fund megaprojects like Peru’s
Chancay port. Experts warn that reducing U.S. aid
weakens alliances and boosts China’s image as a reliable
partner, despite differences in funding approaches. The shift
may lead to more militarized diplomacy, with China
gaining strategic openings in global development. (Asahi Shimbun) 20 February, 2025 (India) The Maha Kumbh
Mela 2025 in Prayagraj is a once-in-144-years
Hindu pilgrimage, drawing 500+ million visitors. Key
reasons for attendance include spirituality (64%) and culture
(53%). The event is expected to generate
₹2 trillion ($23B), but faces challenges like overcrowding
(69%) and sanitation (49%).
Environmental concerns are mixed (40% worried). The
festival peaks on key dates like Makar Sankranti and Maha Shivaratri. (Ipsos India) 20 February, 2025 MENA (Lebanon) The 2025 Ramadan Handbook
– Lebanon Edition 90%
of Lebanese prefer in-store shopping during Ramadan over online. Ads, despite being
overwhelming, influence 30% of shoppers.
The dominant "Content Explorer"
persona (26%) actively engages with Ramadan content on social media. (Ipsos Lebanon) 12 February, 2025 (Egypt) The 2025 Ramadan Handbook
– Egypt Edition 75% of Egyptians prefer
in-store shopping during Ramadan
over online. Ads influence 60% of shoppers despite
overload. The "Content Explorer" persona (35%)
dominates, actively engaging with Ramadan content on social media. (Ipsos Egypt) 12 February, 2025 (Saudi
Arabia) The 2025 Ramadan Handbook
– Saudi Arabia Edition 67% of KSA shoppers prefer
in-store shopping during Ramadan.
Ads influence 55% despite overload. The "Passionate
Shopper" (29%) dominates, enjoying bustling
markets and Ramadan deals. (Ipsos Saudi Arabia) 12 February, 2025 (UAE) Spotlight*KSA: Views on
Brand Engagement Digital platforms drive
consumer-brand interactions, led by mobile apps and social media.
Younger consumers feel empowered, with 4 in 5
believing they influence brands. 7 in 10
avoid brands lacking social responsibility, and over half
expect brands to engage in social issues. (Ipsos UAE) 4 February, 2025 AFRICA (Nigeria) Majority of Nigerians
oppose fuel subsidy removal, with 58% demanding reinstatement even at the
cost of health and education. Public
dissatisfaction is at a record high, with 93% believing the country is headed in
the wrong direction and 88% rating the economy as bad.
Rising
cost of living, crime, poverty, and unemployment are top
concerns. (NOI
Polls) 21
February, 2025 (Sudan) Sudanese reject domestic
violence but see it as a private matter to be handled within the family Gender-based violence
(GBV) in Sudan has more than doubled since the war began in April 2023, with
6.9 million at heightened risk. Common abuses include rape as a war tactic, intimate partner violence, and
forced marriage. Despite government efforts, weak infrastructure
and conflict hinder accurate reporting and support. While most Sudanese oppose domestic violence, many
still view it as a private matter, and survivors face stigma when reporting.
(Afrobarometer)
13 February, 2025 WEST EUROPE (UK) Patients struggling with
NHS admin Ipsos polling reveals NHS
admin issues impact patient trust and care-seeking behavior.
While 52% think NHS communication on appointments and test results is
good, only 43% feel supported in ongoing care. 64% of
patients faced admin problems in the past year, with many chasing
test results or unclear wait times. These issues lead to
perceptions of wasted NHS resources (61%) and discourage 45% from seeking care. (Ipsos UK) 17 February, 2025 (Denmark) The Power of Product
Testing with Synthetic Data Ipsos highlights the
potential of synthetic data in market research, especially for product
testing. While synthetic data
enhances simulations and data augmentation, its accuracy depends on high-quality training data. AI-generated
data cannot fully replicate human
experiences but can augment
insights when strategically used. When accurate, it improves product testing efficiency, cutting
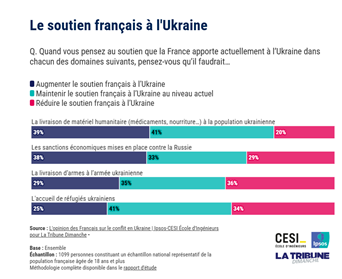
costs and enabling detailed analysis. (Ipsos Denmark) 10 February, 2025 (France) War in Ukraine: 66% of
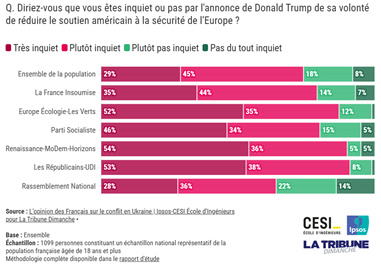
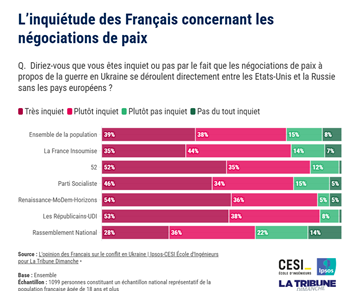
French people believe that European support for Ukraine must continue A majority of French
people are increasingly concerned about the Ukraine conflict, with 74% worried
about Trump reducing U.S. support for European security and 77% uneasy
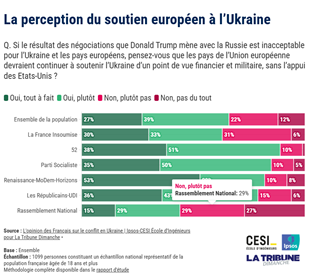
about U.S.-Russia peace talks excluding Europe. Despite this, 66% believe
the EU should continue supporting Ukraine militarily and financially, even
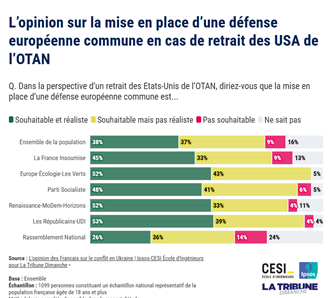
without U.S. backing. However, only 38% see a common
European defense as both desirable and realistic. The nation remains divided
on sending European troops, with 49% in favor and 51% opposed.
Support for Ukraine has grown, with rising approval for humanitarian
aid (+7%), weapons (+8%), refugee reception (+6%), and stronger sanctions on
Russia (+10%). (Ipsos France) 22 February, 2025 (Spain) Valentine's Day: Money and
love go hand in hand Spain ranks among the top
European countries in love and sexual satisfaction, with 83% feeling loved and 66% satisfied with their sex lives,
leading Europe in the latter. Millennials report the highest satisfaction in
both aspects (71%). Higher
income correlates with greater love and sexual fulfillment, as 89% of high earners feel loved compared
to 80% of low earners. The Love Life Satisfaction Index places Spain
at 78%, just behind the
Netherlands (79%). While Spain
excels in love and sex, it lags in relationship satisfaction compared to the
Netherlands (92%) and the UK (87%). (Ipsos Spain) 12 February, 2025 (Germany) Hybrid research combines
qualitative and quantitative methods, enhanced by AI, for deeper consumer
insights and innovation. Ipsos’ five-phase approach
includes social media analysis, self-ethnography, interviews, AI-human data
analysis, and workshops. The future lies in AI-driven
personalization, automation, and integrating real and synthetic data,
ensuring adaptability and competitive advantage despite
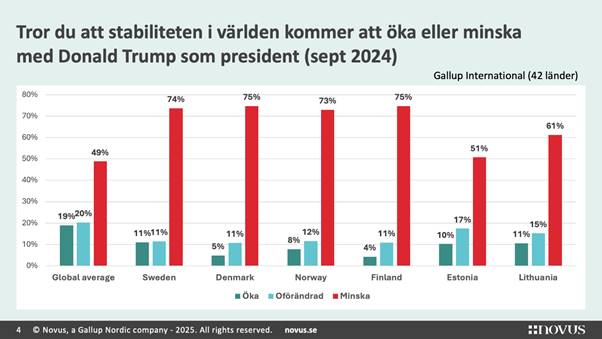
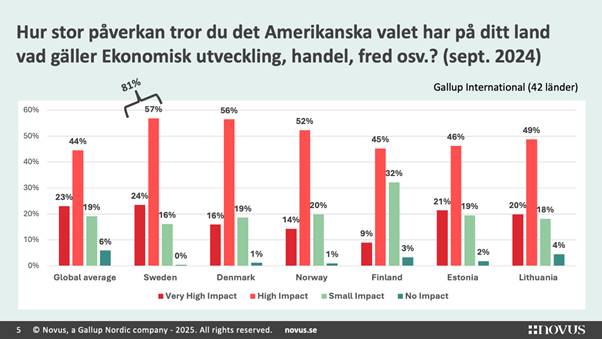
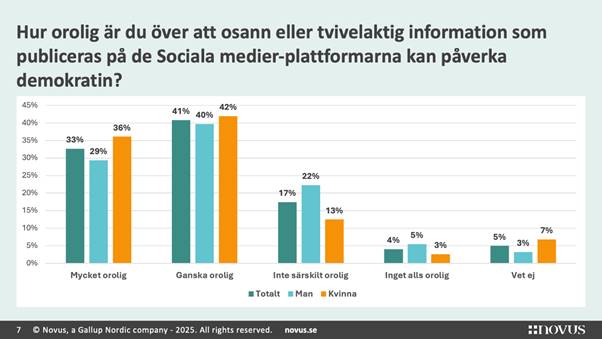
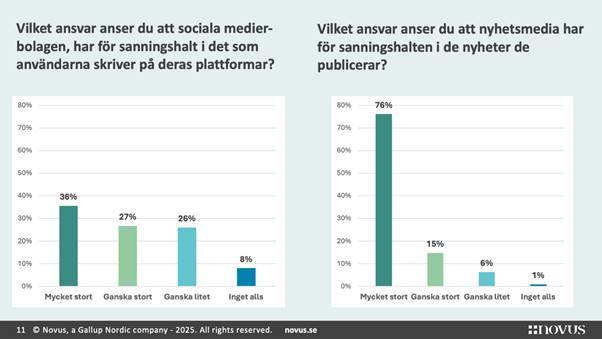
requiring more expertise. (Ipsos Germany) 17 February, 2025 (Sweden) Trump, Meta and power –
what does this mean for Sweden? A Novus and Gallup International survey
found that most Swedes view Trump's presidency as destabilizing, with 81%
believing the U.S. election affects Sweden’s economy and security. Social
media is seen as a key driver of polarization, though traditional media and
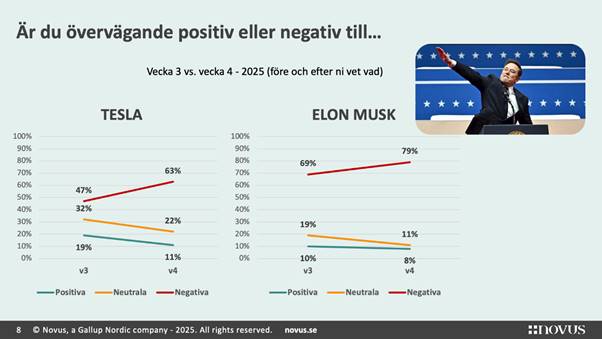
politicians also share responsibility. Elon Musk’s actions have damaged
Tesla’s reputation, while concerns over social media’s role in spreading hate
and misinformation remain high. Older Swedes demand more accountability from
platforms, and half believe laws should be tightened to curb harmful
rhetoric, reflecting frustration over the misuse of free speech and declining
media responsibility. (Novus)
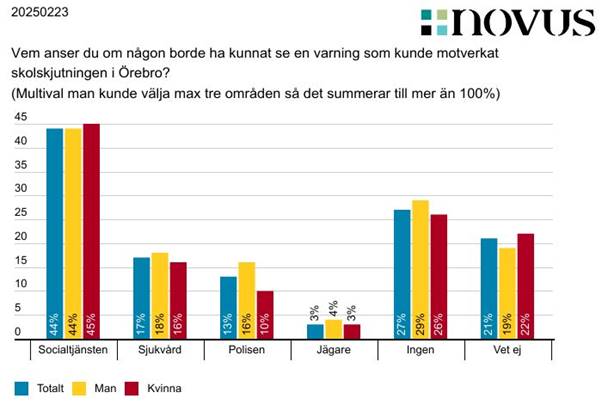
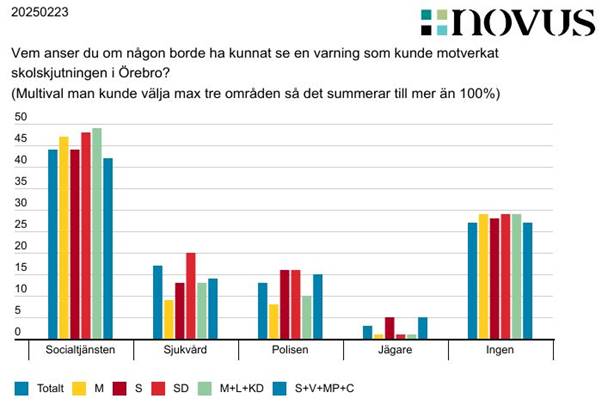
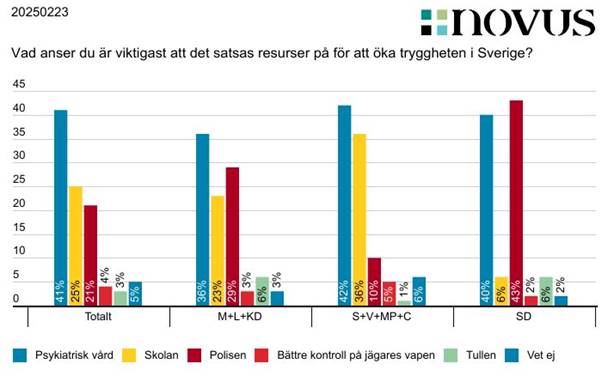
19 February, 2025 (Sweden) A Novus survey on the
Örebro school shooting reveals that 44% of Swedes believe social services
could have identified warning signs, while 27% think no one could have.
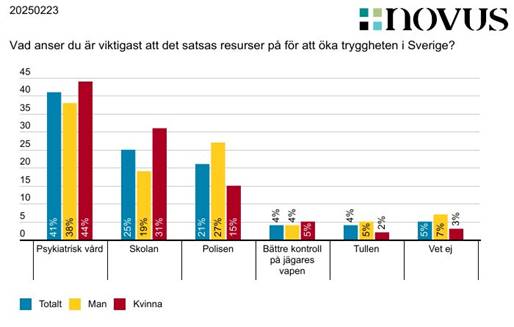
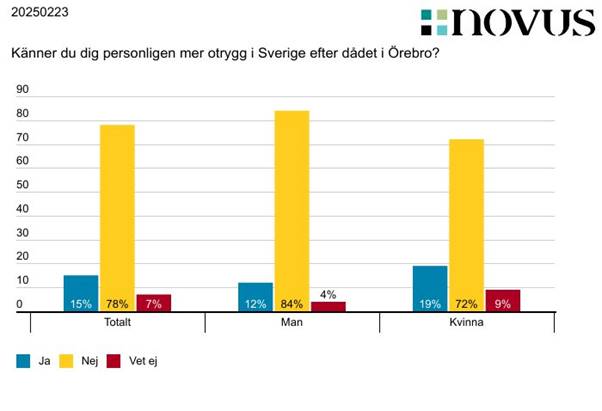
Despite the attack, 78% do not feel more unsafe. However, broader concerns
persist, with 35% feeling more insecure overall and 41% advocating for better
psychiatric care over increased policing. Swedes prioritize healthcare and
education to address root causes of crime rather than just law enforcement.
The focus is less on banning weapons and more on societal failures in
identifying and supporting those at risk before violence occurs. (Novus) 24 February, 2025 NORTH
AMERICA (USA) The Complex Landscape of
Public Opinion on Deportation Public opinion on
deportation in the U.S. is highly complex and varies based on how the issue
is framed. While 70% support a pathway to citizenship for undocumented
immigrants, 47% also support deportation, with opinions shifting based on
specific circumstances. Polls show stronger support for deporting those with
criminal records but much lower support for deporting long-term residents,
families, or those brought illegally as children. Differences in survey
results highlight the impact of question wording and context. Overall,
Americans favor a selective approach over mass deportation and recognize the
economic and logistical challenges involved. Policymakers must consider these
nuances when shaping immigration policies. (Gallup USA)
14 February, 2025 Obama Best Liked Among
Living Presidents; Biden, Least A recent Gallup poll shows
Barack Obama as the most favorably viewed living U.S. president (59%), while
Joe Biden has the lowest rating (39%). George W. Bush and Bill Clinton are
viewed more positively than negatively, while opinions on Donald Trump are divided.
Favorability trends follow a typical pattern: high ratings at inauguration,
decline during presidency, low points at exit, and eventual improvement.
Obama is an exception, maintaining strong post-presidency ratings. Trump’s
favorability, currently split, may decline over time, while Biden’s could
improve. Party affiliation significantly influences opinions, with the
sharpest divide seen in Trump’s ratings. (Gallup USA) 11 February, 2025 LGBTQ+ Identification in
U.S. Rises to 9.3% Gallup’s 2024 survey finds
9.3% of U.S. adults identifying as LGBTQ+, nearly double the 2020 figure and
up from 3.5% in 2012. Younger generations drive this increase, with over 22%
of Gen Z adults identifying as LGBTQ+, compared to just 1.8% of the Silent
Generation. Bisexuality is the most common identity, especially among younger
LGBTQ+ individuals. LGBTQ+ identification is
higher among women, liberals, urban residents, and younger generations.
Women, especially in Gen Z and millennials, are more likely to identify as
bisexual. Political and ideological differences are significant, with 21% of
liberals identifying as LGBTQ+ versus 3% of conservatives. Rural areas report
lower LGBTQ+ identification (7%) compared to urban (11%) and suburban (10%)
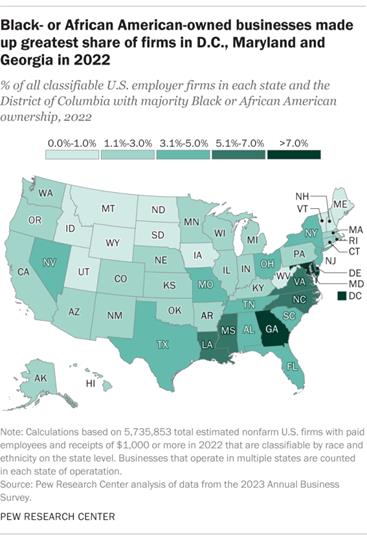
areas. (Gallup USA) 20 February, 2025 A look at Black-owned
businesses in the U.S. A 2023 Pew survey found
that over 20% of Black U.S. adults see business ownership as key to financial
success. Black-owned businesses have grown significantly, rising from 124,004
in 2017 to 194,585 in 2022, with revenue increasing 66% to $211.8 billion.
However, they still make up only 3% of all U.S. firms and 1% of total
business revenue.Most Black-owned businesses (90%) are in urban areas, with
Florida, Georgia, Texas, and California having the highest numbers. The most
common sector is health care and social assistance (26%), followed by
professional services (14%) and transportation (9%).Black business owners are
more often men (54%), middle-aged (50% between 35-54), and well-educated (61%
have at least a bachelor’s degree). Key motivations include financial
independence, work-life balance, and flexibility. For 71%, their business is
their primary income source. (PEW)
12 February, 2025
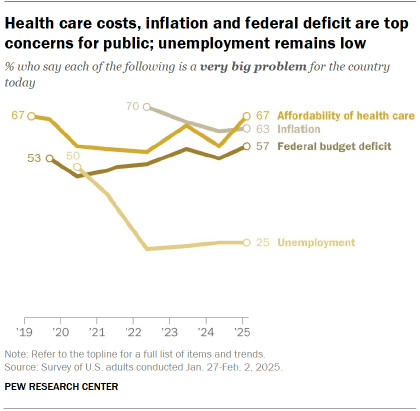
Americans Continue to View
Several Economic Issues as Top National Problems Americans see inflation
(63%), health care costs (67%), and the federal deficit (57%) as top national
problems. While both parties agree on issues like money in politics and
health care affordability, they differ sharply on immigration, gun violence,
climate change, and racism. Republicans prioritize illegal immigration (73%)
and inflation (73%), while Democrats focus on money in politics (78%), health
care (73%), and gun violence (69%). Concerns over moral values and agreement
on basic facts have grown among Democrats but declined among Republicans.
Unemployment remains a low concern for both parties. (PEW)
20 February, 2025 (Canada)
Beyond the Buzz: How
Canadians are Embracing a Sober Tomorrow Consumers are increasingly
reducing alcohol intake for health reasons, with 20% of Canadians avoiding it
and 50% cutting back in 2024. The Ipsos ALC Framework highlights three key
factors driving this shift: Attitudes, as rising health
concerns and media coverage fuel demand for non-alcoholic options (34%
consumption rate); Locus of Control, with 40%
setting drinking limits and younger generations embracing the Sober Curious
movement; and Connectedness, where changing social dynamics and
declining bar visits reduce alcohol’s role in socializing. Businesses must
adapt by catering to evolving consumer preferences and expanding low-to-no
alcohol offerings. (Ipsos Canada) 14 February, 2025 (Colombia) Comprehensive Analysis of
Television Consumption in Colombia In January, Colombian
television remained dominated by national channels, which held 61.43% of
the total share, up from 57.48% in December, despite international
channels comprising 94% of the total offer. Private national
channels took 96.38% of the national audience, with Caracol
(65.88%) and RCN (28.93%) leading. Public channels had a
minor share, with Teleantioquia (27.52%) as the most watched. International
channels held 36.16% of the total audience, with Cliente
Claro, CITYTV, and ESPN leading in cable, while Win Sports
Premium dominated premium channels. Time-slot analysis showed
national
TV peaking at 73% during prime time, while international
channels led during late-night hours. Popular programs like Yo me llamo
and La
casa de los famosos played a key role in national TV’s strong
performance. (CNC) 7 February,
2025 AUSTRAILIA
(New
Zealand) Ipsos New Zealand
Valentine's Day - Love Life Satisfaction 2025 Ipsos’ 30-country study
shows New Zealanders report high love satisfaction,
with 82% feeling loved and 87% of
those in relationships satisfied—close to the global average
but lower than Thailand and the Netherlands (92%). However, romantic/sex
life satisfaction (57%) lags behind countries like Colombia
(74%) and Mexico (72%). Income disparities impact satisfaction,
with 68% of high earners content in their love lives
versus 56% of middle- and 40% of low-income earners.
Generational differences are minimal, though Gen Z and Millennials report slightly
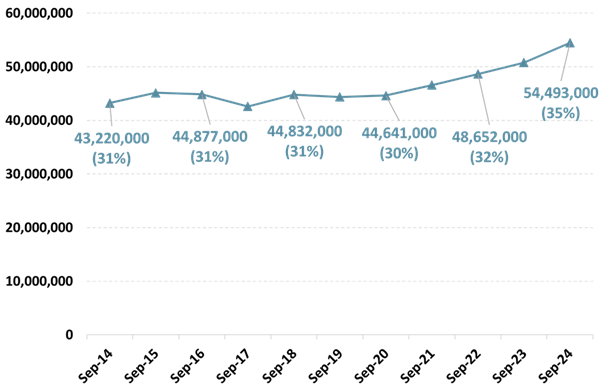
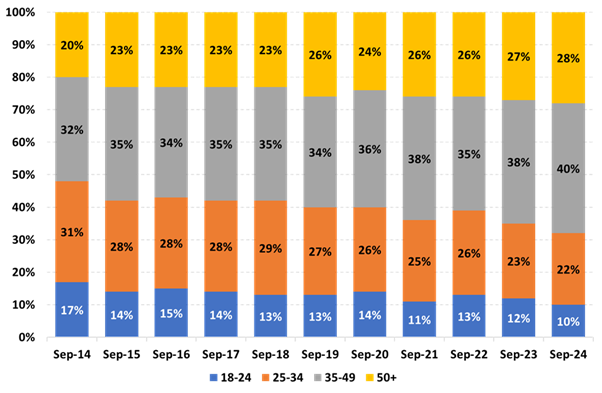
higher sex life satisfaction than older generations. (Ipsos New Zealand) 12 February, 2025 The Roy Morgan
survey (Sept 2024) shows a rise in smoking in Indonesia,
with smokers increasing from 43.2M in 2014 to 54.5M today (35% of the
population). However, fewer young people (under 35) smoke,
dropping from 48% to 32% of total smokers over the decade. In
contrast, smoking among those aged 35+ has surged, now
making up 68% of smokers, with the biggest rise in the 35-49 (40%)
and 50+ (28%) age groups. While fewer young people smoking is
a positive shift, the increase among older age groups raises concerns about
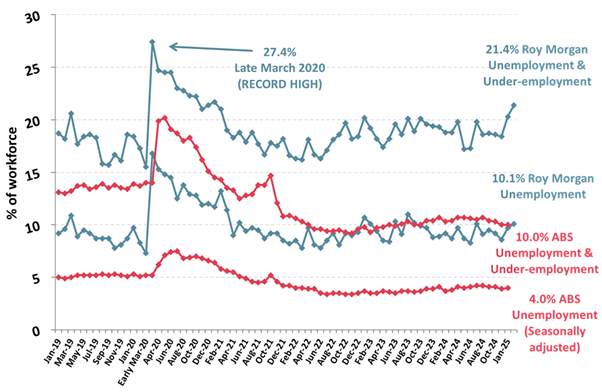
long-term health and rising healthcare costs. (Roy Morgan) 4 February, 2025 In January 2025, Australia's 'real' unemployment rose by 78,000 to 1.62M (10.1%), driven by more
people seeking work. The workforce hit a
record 16.1M, with employment
rising by 219,000 due to a jump
in full-time jobs (+306,000) despite part-time declines (-87,000).
Under-employment also surged,
reaching 1.81M (11.3%), bringing
the total unemployed/under-employed to
3.43M (21.4%), the highest since January
2021. Compared to two years ago,
the workforce has grown by 1.09M,
fueling employment gains. Roy Morgan’s 10.1%
unemployment rate contrasts with the ABS’s 4.0% but aligns with their combined unemployment/under-employment figure of 10.0%. (Roy Morgan) 17 February, 2025 MULTICOUNTRY
STUDIES What Worries the World –
February 2025 Crime and inflation (both
32%) are now the top global concerns, with crime rising in 17 countries,
particularly in Latin America (Argentina
49%, Peru 66%) and Europe (France
38%, Germany 36%). Inflation remains stable, though concerns
increased in Canada (49%) after
new tariffs, while Britain’s worry dropped
to 28%. Unemployment concern (27%) has declined, hitting a record
low in Spain (28%), while rising
in South Korea (40%). Health
care (24%) remains a key issue, with Poland
(39%) and Belgium (25%)
seeing increased concern. Immigration control (17%) has risen slightly, with Germany (44%) experiencing the largest
increase. Economic optimism is highest in Singapore
(80%), India (77%), Malaysia (69%), while Germany’s confidence remains at a record low (25%). (Ipsos
Global) 20 February,
2025 Source: https://www.ipsos.com/en/what-worries-world ASIA
885-890-43-01/Polls:
Amid climate change, LED-lit ‘plant factories’ enter
spotlight
On a main street in
Tokyo’s posh Ginza district, alongside the glittering storefronts of Tiffany,
Bulgari and other luxury brands, the flagship store of stationery retailer
Itoya Ltd. tends a very unusual “farm.” A roughly 60-square-meter
hydroponic farm was installed on the 11th floor when the Itoya building was
rebuilt in 2015. Up to 200 heads of lettuce
are grown pesticide-free, and then made into a fig and blue cheese salad. The
salad is served in a cafe in the building for 1,750 yen ($11.30), including
tax. The company harvests about
20 kilograms of lettuce a day while foreign tourists with shopping bags watch
curiously through the windows and take pictures. “It is one of our goals to
make the shop a comfortable place for customers to spend time at, not just
buy stationery,” a representative said. Itoya’s farm is one
example of “plant factories” that grow vegetables indoors for on-site
consumption regardless of the outside weather. Lighting and temperature
in plant factories are carefully controlled. Plant factories have
attracted attention as the prices of vegetables grown outdoors rise due to
climate change, with new entrants from different industries throwing their
hats in the ring. Leaf Factory Tokyo Co.
grows vegetables inside a four-story building in a residential area of the
capital’s Ota Ward near Haneda Airport. Its parent company is
Otsuka Tekko Co., an iron factory that manufactures auto parts. It started growing
vegetables at its head office on a trial basis in 2020 before going on a
full-scale basis in 2023. It currently grows
lettuce, basil, spinach and five other varieties of vegetables, harvesting up
to 2,000 heads. Many colors of LED lights
are used to grow the vegetables, and changing the light colors, from blue to
red for example, will change the bitterness and color of the produce. After harvesting, the
vegetables are shipped to nearby restaurants or sold in the company’s shop on
the first floor. In Ota Ward, there are
only two hectares of farmland—about half the size of a baseball stadium. “I want to create a model
case for young people to work in agriculture in metropolitan areas with
little farmland,” said President Akihiro Otsuka. In 2020, Plants Laboratory
Inc. provided Seiyu Co., a supermarket chain, with a plant factory system
jointly developed with the University of Tokyo. The Tokyo-based startup
has founded vegetable factories at two Seiyu outlets in the capital, and
the harvested produce is sold at 133 stores in the Kanto region. According to Plants
Laboratory, it has partnered with Tohoku Electric Power Co., Hokkaido
Electric Power Co. and other companies to set up plant factories around the
country. Vegetables are shipped to
supermarket stores and hotels in nearby areas. DEMAND
EXPANSION EXPECTED According to the
agriculture ministry, the number of plant factories in Japan has risen from
93 in March 2011 to 432 in February 2024. Those that use LED lights
and other artificial light sources make up the largest group at 195. While
194 facilities harness natural sunlight, 43 use both natural sunlight and
artificial sources. According to an estimate
by Yano Research Institute Ltd., a market research company in Tokyo, the
market for lettuce plant factories using only artificial lighting peaked at
22.3 billion yen in the business year ending in March 2022. Since then, the
market has faced difficulties in growing further as operators withdraw their
businesses and the industry is restructured. There are also challenges
to overcome. While utility bills are
soaring, large-scale plant factories are located far from urban areas,
leading to increased transportation costs. However, prices of
vegetables grown outdoors have fluctuated rapidly in recent years because of
the severe summer heat and unseasonable weather. Demand for plant
factory-grown vegetables has been growing since the supply and quality is
easier to control. The market is expected to
be worth 24 billion yen in the business year ending in March 2029, according
to the Yano Research Institute. FUTURE
OF AGRICULTURE Hiroyuki Watanabe, a
professor at Tamagawa University specializing in plant environment control
studies who is well-versed in plant factories, said they are unsuitable to
grow wheat, rice and other grain crops that require large spaces. However, plant factories
can steadily produce some kinds of vegetables even with limited space. “It is becoming difficult
to grow vegetables because of global warming and extreme weather events,” he
said. “Although there are
challenges to generating profits, growing vegetables at plant factories can
be a form of agriculture in the future.” 22 February, 2025 Source:
https://www.asahi.com/ajw/articles/15609996 885-890-43-02/Polls:
8% of Pakistanis have carried a knife, gun, or other weapon
due to a lack of safety: Gallup and Gilani Pakistan
According to a survey
conducted by Gallup & Gilani, 8% of Pakistanis have carried a knife, gun
or other weapon due to a lack of safety. A nationally representative sample
of adult men and women from across the country was asked the question, “Which
of the following things have you done for reasons of security? [Carried a
knife, gun or other weapon]” In response, 8% said ‘Yes,’ and 92% said ‘No.’
19 February, 2025 Source:
https://gallup.com.pk/wp/wp-content/uploads/2025/02/19.02.2025.daily-pollEnglish-1.pdf 885-890-43-03/Polls:
Nearly 1 in 2 Pakistanis (48%) believe that war with India
is not likely at all, 15% more urban residents (58%) than rural residents
(43%) hold a similar opinion: Gallup & Gilani Pakistan Poll
According to a survey
conducted by Gallup & Gilani Pakistan, 1 in 5 (20%) Pakistanis believe
that war with India is at least somewhat likely, with rural residents more
convinced (21%) than urban residents (15%). A nationally representative
sample of adult men and women from across the country was asked the question,
“In your opinion, how likely is a war with India these days??” In response,
5% said ‘Very likely’, 15% said ‘Somewhat likely,’ 48% said ‘Not likely at
all,’ 30% did not know and 2% did not respond.
20 February, 2025 Source:
https://gallup.com.pk/wp/wp-content/uploads/2025/02/20.02.2025.daily-pollEnglish-1.pdf 885-890-43-04/Polls:
Trump’s freeze on foreign aid could give China an opening
on the world stage
WASHINGTON--President Donald
Trump’s restrictions on foreign aid and targeting of a key
agency funding programs around the world may be offering an opening to
America’s biggest adversary — China. From
the dismantling of the U.S. Agency for International Development
to quitting international groups, Trump’s drastic “America First” moves
have raised concerns among some lawmakers and experts about whether the U.S.
is ceding global influence to its rivals, especially at a time when
Washington is fretting over Beijing’s growing clout at the cost to American
interests. Foreign assistance offered the
U.S. a source of “soft power” — allowing it to cultivate goodwill, build
alliances and counter adversaries in a bid to shore up national security
without having to dispatch troops, weapons or other more coercive measures. In Cambodia, the contrast
could not be sharper than China sending $4.4 million to support demining
operations, as Trump halted a $6.3 million grant from the State Department’s
Office of Weapons Removal and Abatement partly meant to clear “U.S.-origin
unexploded ordnances as the remnants of war.” Administration officials say
it’s past time to review how America spends money abroad. Asked if the U.S. was giving
China and Russia an opening for greater global influence, national security
adviser Mike Waltz denied that, telling NBC’s “Meet the Press” recently that
“all too often, these missions and these programs ... are not in line with
strategic U.S. interests like pushing back on China.” In Panama, the Trump
administration got the government to quit the Belt and Road Initiative,
Beijing’s flagship overseas development program, prompting condemnation
from China. Experts and lawmakers disagree
on the impact of the U.S. taking a step back from foreign aid. Lawsuits are
challenging the administration’s freeze on foreign assistance and
moves against USAID, with temporary holds on some of those efforts. “The second Trump
administration will deliver the goal for China” of wielding greater global
influence, Feng Zhang, a visiting scholar at Yale Law School’s Paul Tsai
China Center, said at a recent debate in Washington. Sen. Andy Kim, a Democrat from
New Jersey, was worried for the same reason. “China doesn’t even need to
fight for their influence around the world now because of our own effort,”
Kim said recently on “Meet the Press.” Rep. John Moolenaar, a
Republican from Michigan who chairs the House Select Committee on the Chinese
Communist Party, said it could be time for change on foreign assistance. “I think as we dig into this,
we’re going to find out what’s been working and what hasn’t been working,” he
said. “And then how do we innovate to a new way of promoting American
interests, American values and being clear on what those values are.” Dennis Wilder, a senior fellow
at the Initiative for U.S.-China Dialogue on Global Issues at Georgetown
University, said global influence goes beyond foreign aid, with the U.S.
commanding the world’s most powerful military and its dollar dominating the financial
system. Let’s not “accept at face value
that China is ready or able to step in where the U.S. may be leaving a
vacuum,” Wilder said. The Chinese embassy in
Washington said Beijing is “willing to work with all countries and parties,
including the U.S., to strengthen exchanges and cooperation in the field of
development, so as to promote common development and prosperity among all
countries.” The two countries — the primary
players in global development — are spending foreign assistance differently.
Most Chinese money is issued as debt and typically spent on energy and
infrastructure projects. Most U.S. funds were disbursed
as grants or loans with low or no interest rates in areas like public health
and humanitarian aid, said AidData, an international development research lab
at William & Mary University’s Global Research Institute. In Peru, Chinese money helped
build the $1.3 billion megaport in Chancay, which opened in November
during a visit by Chinese President Xi Jinping. U.S. foreign aid in Peru, by
contrast, was used to finance coffee and cacao as alternatives to cocaine
production. Elsewhere, American dollars
helped fight HIV/AIDS in Africa, treated malnourished children in South
Sudan and provided medical services at an immigrant shelter in Mexico. Acknowledging that the U.S.
should fund tangible foreign projects like ports and factories, Congress in
2018 established an institution to combine government funding with private
investments for projects such as the trans-Africa rail project in Angola. Overall, China spent $1.34
trillion on nearly 18,000 overseas development projects between 2000 and
2021, averaging about $61 billion a year, AidData said. The U.S. disbursed $1.24
trillion in foreign aid, including military assistance, between 2001 and
2023, the research lab said. USAID, created during the Cold
War to counter Soviet influence, is the single largest U.S. government player
in foreign aid. It paid out $43.8 billion in 2023, AidData said. That is
equivalent to less than 1% of total annual government spending. Because of the differences in
the types of projects funded, China is unlikely to step in as the U.S.
retreats, but Beijing still wins because foreign aid is about building
relationships and goodwill, said Samantha Custer, director of policy analysis
at AidData. “These countries are watching
the U.S. and how it engages with its partners and its workers, and they’re
making determinations as to whether the U.S. is a reliable economic and
security partner, and increasingly there are concerns that we are not,” Custer
said. That will feed into Beijing’s
narrative that it’s a responsible partner and global leader while sowing
doubt about the U.S., she said. New York-based China Labor
Watch, which monitors labor conditions and investigates practices such as the
use of forced labor in China, relies on U.S. funding for about 90% of its
budget, and the aid freeze has forced the group to lay off or put on unpaid
leave most of its U.S. staff, group founder Li Qiang said. China now has a strategic
opening as the go-to alternative for countries seeking investments without
political conditions, said Salvador Santino Regilme, an associate professor
of international relations at Leiden University in the Netherlands. “The broader implication of the
U.S. aid freeze is a return to militarized diplomacy, where soft power is
sidelined in favor of hard-power coercion,” he said. 20 February, 2025 Source:
https://www.asahi.com/ajw/articles/15633947 885-890-43-05/Polls:
Maha Kumbh Mela seen as symbol of preserving cultural and
religious traditions: Ipsos IndiaBus Maha Kumbh Mela 2025 Survey
The Prayag Maha Kumbh Mela 2025, underway in Prayagraj,
Uttar Pradesh, a Hindu pilgrimage festival is perceived as a symbol
of preserving cultural and religious traditions, by at least 74% of urban
Indians polled. This is also significant as while the Kumbh Mela is
held every 12 years, Maha Kumbh Mela marks the completion of a 12 Kumbh Mela
cycle – a once in 144 years occurrence, celebrated over 45 days. Interestingly, familiarity about the Maha Kumbh Mela
was seen to be high among citizens with 42% being familiar and 32% claiming
to be somewhat familiar. Though 26% were unfamiliar about the religious mega
event. “Government has gone all out to build
awareness around the Maha Kumbh Mela, given its once in 144 years occurrence
and the religious significance of purifying one’s soul through the holy dip
at the confluence of the holy rivers of the Ganges, Yamuna and Saraswati –
the Triveni ghat, for attaining moksha/ liberation, through the Amrit Snan
and Shahi Snan. And to encourage devotees to visit Prayagraj, govt has made
elaborate arrangements through setting up of a temporary city over 4000
hectares, accommodating the pilgrims, with 1,50,000 tents for lodging and
1,50,000 toilets. Supplemented with mobile health units, emergency medical
services, underwater drones, mobile app and other accoutrements. Prayagraj in
Uttar Pradesh is hosting the Maha Kumbh Mela 2025, the world’s largest
peaceful religious gathering,” said Parijat
Chakraborty, Group Service Line Leader, Public Affairs, Corporate Reputation,
CSR and ESG, Ipsos India. Though Maha Kumbh Mela has already surpassed 500
million visitors, the survey shows that the citizens were in different frames
of mind: 13% claimed to have already visited the
Maha Kumbh Mela, 26% were seen to be in the planning
mode, 22% were unsure, 23% were uninterested and 16% were undecided. Despite all the
uncertainties, the event has witnessed a large turnout. Visitors enamoured with Maha Kumbh Mela,
for different reasons The heightened interest among revellers to visit the
Maha Kumbh Mela 2025, has been for several reasons. The key motivations
emerging in the survey included: for religious/ spiritual experience (64%), for cultural experience (53%), to meet the holy men – the sadhus and
gurus (50%), to witness the large-scale social
gathering (41%), 34% are visiting out of curiosity or for
tourism and 18% claimed to be visiting the holy event
to experience the grand scale of the extravaganza. Economic impact of Maha Kumbh Mela 2025 At least 56% of urban Indians expect a positive
economic impact of the Maha Kumbh Mela on the local community. “Events of such magnitude, and since it is
a rare holy occurrence, has drawn visitors in droves, from across the country
and from overseas, benefiting the local economy. While govt had budgeted a
cost of INR 63.82 billion (USD 740 mn), it is estimated to generate a revenue
of 2 trillion (USD 23 bn) and boosting the local economy,” added Chakraborty. Large scale events come with their own
challenges despite impeccable planning Citizens expect a few challenges emerging due to the
huge influx of citizens in Prayagraj at the Maha Kumbh Mela – the challenges
like overcrowding (69%), sanitation and hygiene (49%), safety and security concerns (49%), transportation and traffic control (46%), environment impact (37%), medical and emergency services (29%) and cultural and religious
sensitivities (16%). At the same time, at least 4 in 10 citizens polled,
expressed their concern about the Maha Kumbh Mela and huge crowds, impacting
the environment negatively. Though the views were largely divided, with 3 in
10 being neutral, 17% expecting no detrimental impact, while 11% were
undecided. “Some of these auspicious dates have seen a
steady rise in the number of visitors. Especially during Makar Sankranti (14
January), Mauni Amavasya (29 January), Vasant Panchami (3 February), Magha
Purnima (12 February) and now Maha Shivaratri (last day of the Maha Kumbh
Mela), and it marks the culmination of the 45-day religious festival,”
stated Chakraborty. 20 February, 2025 MENA
885-890-43-06/Polls
The 2025 Ramadan Handbook – Lebanon Edition
The report reveals that 9 in 10 Lebanese choose in-store
shopping during Ramadan over online shopping. Despite the perception of ad
overload, advertisements contribute to brand memorability and influence the
purchasing decisions of 3 in 10 shoppers. When it comes to Ramadan personas,
the “Content Explorer” (26%) makes up the largest persona in Lebanon. People
who fit this persona are digital enthusiasts who engage deeply with
Ramadan-related programs and content on social media. 12 February, 2025 Source:
https://www.ipsos.com/en-lb/2025-ramadan-handbook-lebanon-edition 885-890-43-07/Polls
The 2025 Ramadan Handbook – Egypt Edition
The report reveals that 75% choose in-store shopping during
Ramadan over online shopping. Despite the perception of ad overload,
advertisements contribute to brand memorability and influence the purchasing
decisions of 3 in 5 shoppers. When it comes to Ramadan personas, The “Content
Explorer” (35%) makes up the largest persona in Egypt. People who fit this
persona are digital enthusiasts who engages deeply with Ramadan-related
programs and content on social media. 12 February, 2025 Source:
https://www.ipsos.com/en-eg/2025-ramadan-handbook-egypt-edition 885-890-43-08/Polls
The 2025 Ramadan Handbook – Saudi Arabia Edition
The report reveals that 67% choose in-store shopping during
Ramadan over online shopping. Despite the perception of ad overload,
advertisements contribute to brand memorability and influence the purchasing
decisions of 55% of shoppers. When it comes to Ramadan personas, The
“Passionate Shopper” (29%) makes up the largest persona in KSA. People who
fit this persona are shopping lovers who indulge in the busy markets and
attractive deals during Ramadan. 12 February, 2025 Source:
https://www.ipsos.com/en-sa/2025-ramadan-handbook-saudi-arabia-edition 885-890-43-09/Polls
Spotlight*KSA: Views on Brand Engagement
The Spotlight report shows that digital platforms are at
the heart of consumer-brand interactions, where mobile apps and social media
are at the forefront, providing effortless ways to connect. This trend is
especially driven by the younger generation. With the abundance of digital
touchpoints, consumers now feel more in control, with 4 in 5 convinced they
can influence brands. This sense of empowerment is shifting consumer
expectations, as people today demand more from brands. Over half think brands
should be involved in social issues, not just business, and 7 in 10 would
avoid brands that aren’t socially responsible, even if they like them. These
expectations are especially strong among younger consumers, who are calling
for more accountability and ethical practices. 4 February, 2025 Source:
https://www.ipsos.com/en-ae/spotlightksa-views-brand-engagement AFRICA
885-890-43-10/Polls
Nigerians oppose removal of
fuel subsidies, want them reinstated
A large majority of Nigerians
disapprove of the government’s decision to remove fuel subsidies, with more
than half calling for their reinstatement even at the expense of other key
sectors such as health and education, the latest Afrobarometer survey shows. Almost two years after the
elimination of the subsidies, public dissatisfaction with the country’s
economic direction has reached record levels. More than nine in 10 Nigerians
say the country is heading in the wrong direction. Nearly as many citizens say
the economy is in bad shape, while three-fourths report poor personal living
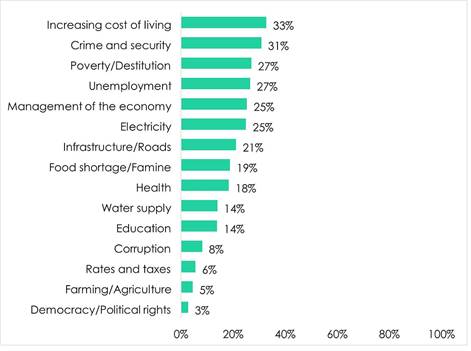
conditions. The most important problem
that Nigerians want the government to address is the increasing cost of
living, followed by crime and security, poverty, unemployment, management of
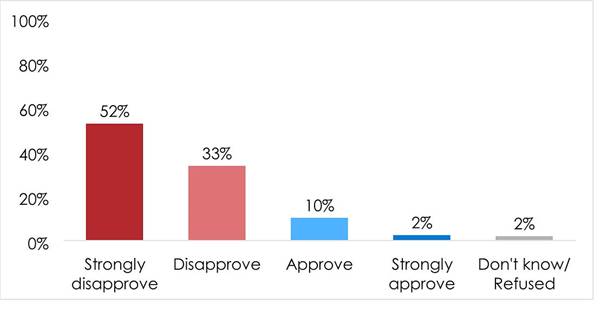
the economy, and electricity. Key findings ▪ A large majority of
respondents “disapprove” (33%) or “strongly disapprove” (52%) of the
government’s decision to remove fuel subsidies. Only 12% approve of their
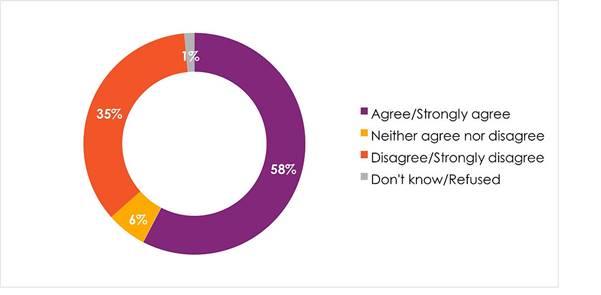
removal (Figure 1). ▪ Almost six in 10 (58%) say
the government should reinstate fuel subsidies even if this means reducing
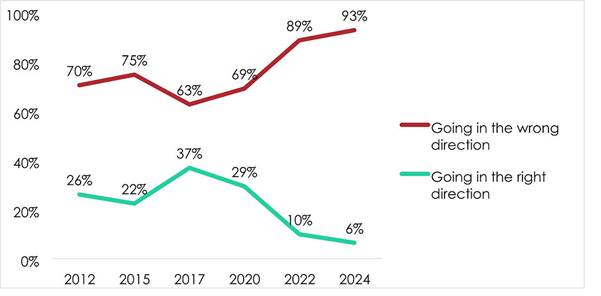
other important expenditures such as health or education (Figure 2). ▪ More than nine in 10
Nigerians (93%) say the country is going in “the wrong direction.” This
represents increases of 30 percentage points since 2017 (63%) and 4 points
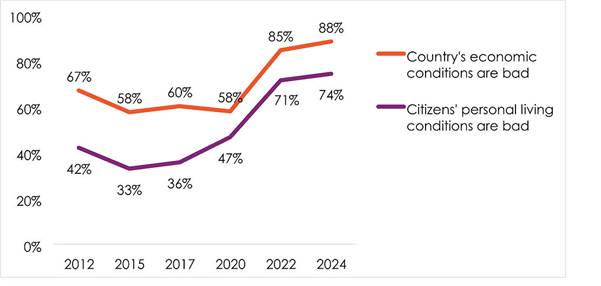
since the most recent survey in 2022 (89%) (Figure 3). ▪ Nearly nine in 10 citizens (88%) say the country’s economic
condition is “fairly bad” or “very bad,” up 30 percentage points from 2020
(Figure 4). o And three-fourths (74%) report poor personal living
conditions. The increasing cost of living
(33%) is the most frequently cited problem that Nigerians want the government
to address, followed by crime and security (31%), poverty (27%), unemployment
(27%), management of the economy (25%), and electricity (25%) (Figure
5). Figure 1: Views on government's decision to remove fuel
subsidies | Nigeria | 2024
Perceptions on fuel subsidy removal Respondents
were asked: Do you approve or disapprove of the government’s decision to
remove fuel subsidies, or haven’t you heard enough to say?
Support for reinstating subsidy removal Respondents
were asked: Do you agree or disagree with the following statement: The
Nigerian government should reinstate fuel subsidies even if this means
reducing other important expenditures such as health or education? Figure 3: Overall direction of the country | Nigeria | 2012-2024
Perception on the overall direction of Nigeria Respondents
were asked: Would you say that the
country is going in the wrong direction or going in the right direction?
Figure 4: Negative
assessments of the country’s economic condition and personal living
conditions | Nigeria | 2012-2024
Assessment of Nigeria's economic/personal living condition Respondents
were asked: In general, how would you describe: The present economic
condition of this country? Your own present living conditions?
Figure 5: Most important
problems | Nigeria | 2024
21 February, 2025 Source: https://www.noi-polls.com/post/nigerians-oppose-removal-of-fuel-subsidies-want-them-to-be-reinstated 885-890-43-11/Polls
Sudanese reject domestic violence but see it as a private
matter to be handled within the family
As of October 2024, 6.9
million Sudanese were considered at heightened risk of gender based violence
(GBV), more than twice the number (3.1 million) estimated before the
war between the Sudanese Armed Forces and the Rapid Support Forces
began in April 2023 (UNFPA, 2024; UN Women, 2024). The most common
types of reported GBV cases include rape as a war tactic, intimate
partner violence, forced marriage, and forced prostitution (UNFPA,
2024). However, obtaining accurate statistics on GBV in Sudan is nearly
impossible because of the country’s poor infrastructure and health-care
system and the protracted conflict, which has restricted communication
and displaced millions (Widaatalla, 2024; World Health Organization,
2023). In collaboration with
international partners, the Sudanese government has taken steps to
address the scourge of GBV in the country. In March 2020, it signed a
Framework of Cooperation on the Prevention and Response to Sexual
Violence in Conflict (United Nations, 2020; Stop Rape Now, 2024). The
country’s National Action Plan for the Implementation of UN Security
Council Resolution 1325 on Women, Peace & Security 2020-2022 aims to
protect women and girls against all forms of GBV (Sudan Ministry of
Labour and Social Development, 2020). Domestic laws directly and
indirectly address GBV, such as the Criminal Act of 1991 (Human Rights Watch,
2009). In April 2021, after years of
pressure from rights activists. the government ratified the Convention
on the Elimination of All Forms of Discrimination Against Women
(Mohiedeen, 2021). However, while Sudan has signed the Protocol to the
African Charter on Human and Peoples’ Rights on the Rights of Women in
Africa (also known as the Maputo Protocol), it has yet to ratify it (African
Union, 2022) as a step toward ensuring key legal safeguards, access to
justice, GBV-related support services, and international
accountability. This dispatch reports on a
special survey module included in the Afrobarometer Round 9 (2021/2023)
survey to explore Africans’ perceptions of gender-based violence. In Sudan, GBV ranks as the
second-most-important women’s-rights issue that citizens say their government
and society must address. Even though a majority say it is “never justified”
for a man to use physical force to discipline his wife, most see domestic
violence as a private matter that should be resolved within the family.
And while most Sudanese think the police take GBV cases seriously, many
also consider it likely that a woman reporting an incident of GBV will
be criticised, harassed, or shamed by other members of the community. 13 February, 2025 WEST EUROPE
885-890-43-12/Polls
Patients struggling with NHS
admin
New Ipsos
polling for the King’s Fund, National Voices and Healthwatch England has
explored people’s experiences of NHS admin, and the impact of that on their
views of the NHS. Read more in the King’s Fund, National Voices and
Healthwatch England long read, Lost in the System: the need
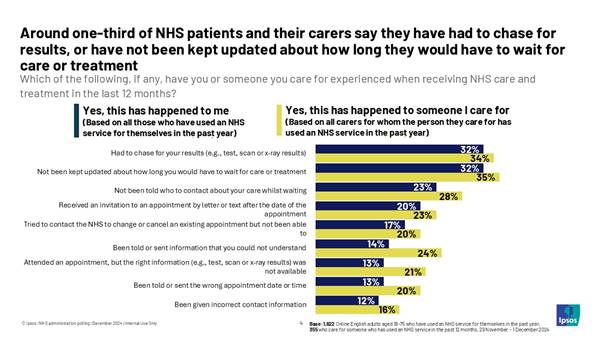
for better admin. Around
half (52%) think the NHS is good at communicating with patients about things
like appointments and test results. However, just 43% think the NHS is good
at ensuring there is someone for patients to contact about their ongoing care
and 28% think it is poor at this, and while 42% think the NHS is good at
keeping people informed about what is happening with their care and
treatment, 32% think it is poor at this. Nearly
two in three patients (64%) have experienced at least one NHS admin problem
in the last year (for themselves or someone they care for). This includes
around one-third of those who have used an NHS service in the last year (for
themselves or for someone else) having had to chase for their results, and
not been kept updated about how long they would have to wait for care or
treatment.
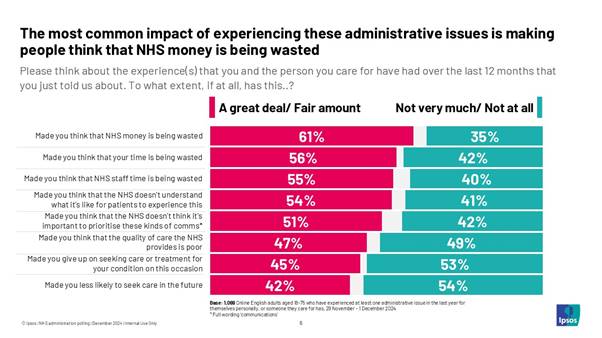
Among
people who have experienced one of these issues, the most common impact of
the experience is making them think that NHS money is being wasted (61%),
that their time is being wasted (56%) and that NHS staff time is being wasted
(55%). It also impacts on patients’ likelihood to seek care, with 45% saying
it made them give up on seeking care or treatment for their condition on that
occasion and 42% that it made them less likely to seek care in the future.
Technical information 1,888
English adults aged 18-75 were asked (online) by Ipsos about how good or poor
the NHS was at communicating on a range of things like appointments and test
results. The research was carried out between 29 November – 1 December 2024.
Quotas were set by age within gender, region and working status. Data are
weighted by age within gender, region, working status, social grade and
education to match the profile of the population. 17 February, 2025 Source:
http://ipsos.com/en-uk/patients-struggling-nhs-admin 885-890-43-13/Polls
The Power of Product Testing with Synthetic Data
Synthetic
data is revolutionizing industries from healthcare to financial services to
automotive, by enabling simulations and data augmentation. At Ipsos, we believe
synthetic data opens up brand new possibilities for market research,
particularly in the area of product testing. However, many businesses remain
uncertain about the quality of synthetic data or how to evaluate it. In this
Ipsos Views paper, our experts provide recommendations for generating and
evaluating high-quality synthetic data and explore how synthetic data can be
applied specifically to product testing. Generating
and evaluating synthetic data To generate synthetic data that effectively mimics
real-world data, an artificial intelligence (AI) model must first be trained
on relevant, real-world data. As discussed in our first paper in the Humanizing AI series, AIs are simply algorithms; they
have no intelligence of their own, until they are trained. It is through
learning from training data that AIs acquire the intelligence we associate
with them. The
evaluation process is also straightforward. Synthetic numerical data should,
at minimum, mirror real-world data on common statistical measures. The closer
synthetic data is to human data, the less risk we assume when using it, but
there is always some risk because synthetic data can never perfectly mimic
real-world data in every aspect. Approaches
to generating synthetic data fall into two categories: LLMs (Large Language
Models) and non-LLMs, distinguished by their textual and numerical nature,
respectively. We explore both approaches in this paper. The
product experience is inherently human How
humans react to products, or life in general, is not captured solely in the
brain as factual or semantic knowledge, our bodies and sensory experiences
play a significant role, too. This
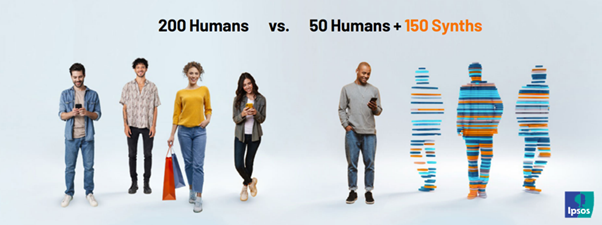
paper presents the findings from our two research streams carried out aiming
to establish the minimum number of human respondents needed to test products
alongside synthetic data to ensure viable results. To discover the key
findings from the research, you can also download our useful infographic.
If an AI has not been
trained on real-world data that is relevant to your business, it will not be
able to generate synthetic data that shares the same properties as real-world
data. It’s as simple as that! Key
takeaways: 1. Synthetic data will never be human. 10 February, 2025 Source:
https://www.ipsos.com/en-dk/humanizing-ai-2-the-power-of-product-testing-with-synthetic-data 885-890-43-14/Polls
War in Ukraine: 66% of French people believe that European
support for Ukraine must continue
French
people concerned about the latest developments in the conflict in Ukraine 74% of French people say they are worried by Donald Trump's
announcement of his desire to reduce American support for
European security.
Two
out of three French people believe that European support for Ukraine should
continue Faced
with these announcements of reduced American support, the French believe that
European support for Ukraine must continue: 66% believe that the
countries of the European Union should continue to support Ukraine from a
financial and military point of view, without the support of the United
States if the result of the negotiations that Donald Trump is conducting with
Russia is unacceptable for Ukraine and European countries – a proportion that
varies from 44% among RN supporters to 89% among EELV supporters.
Thus, the
sending of European soldiers to enforce a peace agreement in Ukraine divides
the French: while 49% say they are in favour, 51% say they are opposed. How
do the French view the country's level of support for Ukraine? However, this does not mean a lack of
support for Ukraine. Compared to February 2024, more French people
think that it is necessary to increase the delivery of humanitarian equipment
to Ukraine (39%, +7 pts), the delivery of weapons to the Ukrainian army (29%,
+8
Similarly,
the economic sanctions put in place against Russia are more well received,
with 38% of French people thinking that they should be increased (+10
points). This desire to increase the various forms of support for Ukraine is
particularly strong among EELV, PS, Renaissance and LR-UDI supporters. 22 February, 2025 885-890-43-15/Polls
Valentine's Day: Money and love go hand in hand
Main
findings ·
People with higher incomes are
more satisfied with their love and sex lives. 83% of people in Spain feel
loved. ·
Spain leads the European
ranking in terms of the level of satisfaction with their sexual life: 7 out
of 10 people say they are satisfied with their sexual relationships. ·
Millennials are the most
satisfied with love and sex. Valentine’s Day is approaching
and, to paraphrase John Paul Young in his historic song, “Love is in the
air”. February 14 is the date par excellence to celebrate love and, once
again, Ipsos has published its study “Love life Satisfaction 2025”, which
analyses how people perceive their love and sexual lives. In this edition, Ipsos has
incorporated the Love Life Satisfaction Index, which measures the level of
satisfaction in three aspects: feeling loved, sexual life and relationship.
Latin American and Asian countries have the highest data in this index, while
European countries are conspicuous by their absence, although Spain and the
Netherlands do manage to sneak into the global top 10. Spain, with an index
of 78%, is positioned as the second European country most satisfied with its
love life, just one point behind the Netherlands (79%). But let's look separately at
the three aspects that this index brings together. The majority of Spaniards
say they feel loved, with 83%, again surpassed at European level only by the
Netherlands (85%). Spaniards also show themselves to be highly satisfied with
their relationship with their partner, with 85%. In this aspect, although the
figure is very high, Spain falls in the European ranking. Countries such as
the Netherlands (92%) and the United Kingdom (87%) have higher figures than
Spain. It is in sexual life where people in Spain lead the European ranking,
with 66% saying they feel satisfied with their sexual relations. The
Netherlands with 62% is in second place and Ireland with 59% closes the
European top 3. More
money, more love It is scientifically proven
that being loved, or loving and being loved in return, increases serotonin in
the brain and, therefore, happiness. However, if we add purchasing power to
the equation, we see that the relationship between money and love is directly
proportional. That is, as the study confirms, the higher the income, the
greater the likelihood of feeling loved and sexually satisfied. Thus, 89% of the population in
Spain with high incomes declares that they feel loved, while among people who
earn low incomes this percentage drops to 80%. A similar trend occurs with
romantic and sexual life. People with higher incomes have greater
satisfaction, as stated by 74% of people with higher purchasing power; while
this percentage drops to 60% of Spanish citizens with lower incomes. Love
and sex for generations In general, all generations say
they feel loved in Spain. Baby boomers and millennials feel most loved, with
85%, while generations X and Z, with four points less, remain at 81%. It is in sexual life where the
greatest differences between generations are appreciated, with millennials
being the most satisfied with their romantic and sexual life (71%) compared
to 64% of X, 63% of baby boomers and 62% of Z. 12 February, 2025 Source:
https://www.ipsos.com/es-es/actitudes-amor-relaciones-y-sexo 885-890-43-16/Polls
The Power of Combination: Hybrid Research as the Key to
Substantial Insights and Groundbreaking Innovations
In today's complex world, where
we are flooded with information, it is no longer enough to rely on a single
research method. Hybrid approaches that integrate qualitative and
quantitative methods are not a luxury, but a necessity. They open up new
horizons, especially through the use of artificial intelligence (AI). This
development enables companies to gain indispensable consumer insights and
thus decisively influence the innovation process. Modern
research needs hybrid approaches The question is no longer
whether hybrid approaches should be used, but how they should be optimally
designed. The aim is to efficiently manage the increased effort and the need
for diverse methodological expertise that hybrid research undoubtedly
requires. A full-service institute like Ipsos can do this like no other:
hybrid research approaches, delivered seamlessly from a single source, are
our USP. Hybrid research combines the
best of both worlds: the depth of qualitative approaches and the breadth of
quantitative data. Through the skillful integration of offline and online
methods, data collection in real time or at the participants' own pace, AI-supported
data analysis and activation, a comprehensive understanding of consumer needs
is possible. Why
should I rely on a single method that is sure to miss something when hybrid
approaches offer a full spectrum of deep insights?
A hybrid, multi-stage research
project for a shampoo manufacturer that was carried out in three countries
shows how this can be achieved. Phase 1: Netnography –
Feeling the Pulse of Social Media AI-supported social media
analysis to identify trends. AI was used to examine social media posts on the
topic of hair care. This enabled current trends and opinions to be recorded -
the perfect basis for the further research and innovation process. Phase 2: Mobile
Self-Ethnography – Gaining Authentic Insights Consumers document their daily
use of hair care and shampoo. This gave us an authentic insight into people's
habits and preferences. Phase 3: Online Interviews –
Conducting Deep Conversations and Understanding Diversity Subsequently, individual
interviews deepened the previous data and revealed consumers' wishes,
problems and preferences when using hair care products. Phase 4: Analysis –
intelligently evaluate data for action-oriented insights Here, human and artificial
intelligence work together to analyze all data, identify hidden patterns and
generate valuable insights. This helped the customer make decisions based on
solid data. Phase 5: Workshops –
creatively implementing results The results were presented in
two workshops and used collaboratively: classic and AI-supported. The AI
workshop brought fresh product ideas and claims that were
evaluated by human experts and aligned with the brand strategy. It offered the customer new
opportunities to better understand and interpret consumer needs and to be
creative based on that. This resulted in pioneering products that really meet
the market. This is a clear competitive advantage and helps the shampoo manufacturer
to secure growth for years to come. Hybrid research approaches show
how consumer insights and product innovations go hand in hand. The
combination of different methods enables us to master market complexity and
optimally support innovation processes. Also because the results have a
higher validity. The integration of AI expands the possibilities immensely
and underlines the importance of hybrid methods as the key to success. Hybrid research turns 'what
if' into 'what comes next' and enables us to move forward with confidence. The
Future of Hybrid Research: Automation and Personalization In the future, it will also be
important to combine 'real' and 'synthetic' data in a meaningful way. For
example, a company could acquire its own persona bot based on market
segmentation. This can be used to chat 'personally' with the identified
target groups in order to bring them to life with their needs and attitudes. In the future, the power of the
combination of methods will also lie in the long-term activation and greater
personalization of insights. With the help of AI, research results can be
tailored more closely to the individual needs of companies. For example,
marketing strategies and product developments can be aligned more precisely
in the future.
·
Advantages of hybrid
approaches: They provide more
comprehensive insights and higher validity because they can be flexibly
adapted to different research questions and business challenges. ·
Challenges: Hybrid approaches require
greater effort in planning, coordination and implementation as well as expert
knowledge in different methods. ·
Tools and technologies: Examples such as mobile
ethnography apps, online platforms and AI software demonstrate the effective
combination of tools for data collection. ·
Future prospects: Expanded integration of
data from a variety of sources, including social media, customer feedback,
market research and synthetic data, as well as further automation of
processes and greater personalization of results will further impact
research. 17
February, 2025 885-890-43-17/Polls
Trump, Meta and power – what does this mean for Sweden?
The survey consists of a global study conducted by Novus in
collaboration with Gallup International on world stability with Donald Trump
as president. It has been complemented by a Swedish survey on concerns about
polarization and populism, Elon Musk's statements and their impact on his
company, and the role and responsibility of social media compared to
traditional news media. The majority of the survey was conducted in Sweden from February
6–11, 2025, while the global questions were asked in 40 countries during
September 2024. Novus CEO Torbjörn Sjöström has analyzed the results. Stability in the world with Donald Trump as president of the
United States
According to a Novus and Gallup Nordic survey, conducted in
collaboration with Gallup International ahead of the 2024 US election, the
overwhelming majority of the Swedish people, like our Nordic and Baltic
neighbors, believe that the world would be more unstable with Trump as
president. The fact that this is happening now does not come as a surprise to
citizens. Many remember his previous presidency, and the fact that a second
term would mean even greater instability was unfortunately expected.
81% of Swedes believe that the US election has a major impact on
Sweden's economic development, trade and peace. Therefore, what is happening
now in Ukraine and Gaza, as well as trade issues such as tariffs, is no
surprise to the Swedish people, nor to our Nordic and Baltic neighbors. Many
saw this coming even before Trump won the US election.
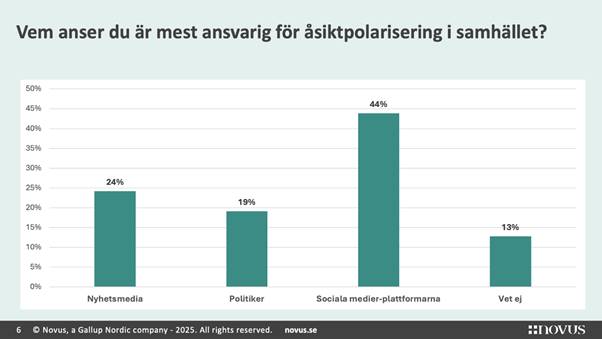
Responsibility for opinion polarization in society
Polarization is the driving force behind the populism that is
spreading in the Western world. According to the survey, Swedes primarily
believe that social media is responsible, but traditional media and politics
also have a great responsibility. The rise of social media, which politicians
and news media are also adapting to. The here-and-now reporting and
provocative posts on social media mean that politicians get to get to the
point and debate, which creates a dynamic where politics is rewarded by the
logic of social media. However, this does not mean that politicians and the media are
free from responsibility. They still have their own responsibility, even if
the disruptive effect of social media has changed the public discourse. This survey was conducted during the period February 6–11, 2025,
unlike the previous questions that were asked in approximately 40 countries
globally during September 2024.
The Swedish people are well aware of the effects that social
media platforms have on society, and the concern for democracy is palpable,
something Novus has reported on for over five years through various surveys.
Fake posts on social media have sometimes also been spread further in
traditional news media. At the same time, this reflects how the media and politicians
themselves talk about the role of social media, often without reflecting on
their own responsibility in the development.
Elon Musk's impact on companies linked to him
Elon Musk's provocative gesture was truly provocative and
immediately damaged both Tesla's reputation and his own. We have found in
other recent surveys that Musk is considered a burden to both Tesla and X. This reputational loss is due to his arm waving and shows that
there is no doubt at all about how the Swedish people perceived the gesture.
They saw exactly what it looked like, and how it was interpreted. It was not
something positive for Tesla or Musk.
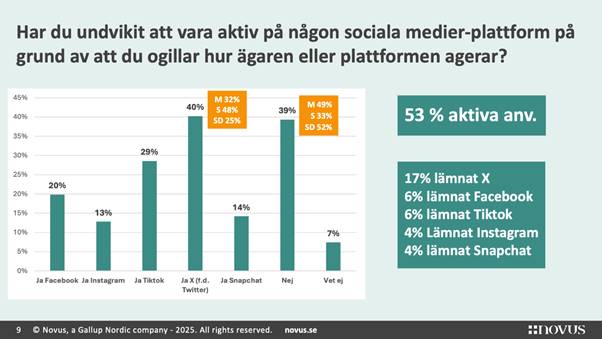
47% of Swedes are not active on social media, an important
aspect to keep in mind when describing these platforms as democratic arenas.
With a voter turnout of over 80% in Sweden, it is clear that more people
participate in the democratic system than in the debate on social media. Previous Novus surveys show that many people refrain from
expressing themselves on social media for fear of hate and threats. But it is
also about wanting to stay updated on the activities of friends and
acquaintances, rather than participating in discussions themselves. The silent majority is a force that is often underestimated.
They stand up when needed, they react to what is happening, but they have no
interest in standing on a stage and trumpeting it. If this silent majority is
marginalized or intimidated into passivity, society loses a central part of
the democratic conversation. Silence is often misinterpreted as acceptance,
when in fact it is more often about distancing.
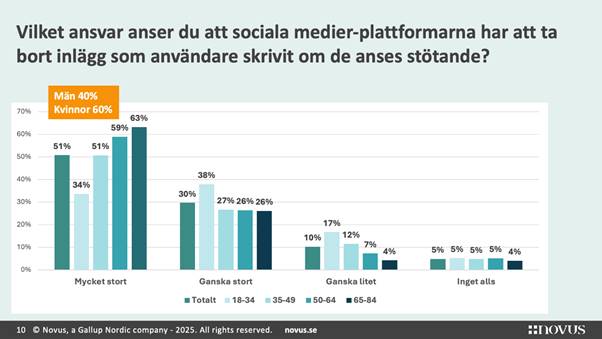
Social media responsibility
Social media is considered to have a great responsibility, but
it is worth noting that the responsibility is greatest among the older
generation, which is less digital; the younger generation understands more
and places fewer demands on the platforms than the older generation.
It is clear that many believe that social media has a great
responsibility for what they publish, but compared to editorial news media,
the difference is striking, as it should be. One in three Swedes believes
that social media has little or no responsibility, since they understand that
it is private individuals who write. Compared to what news media produces,
only 7% believe that the media has little or no responsibility. The difference between editorial media and social media is
something that citizens understand to a fairly large extent.
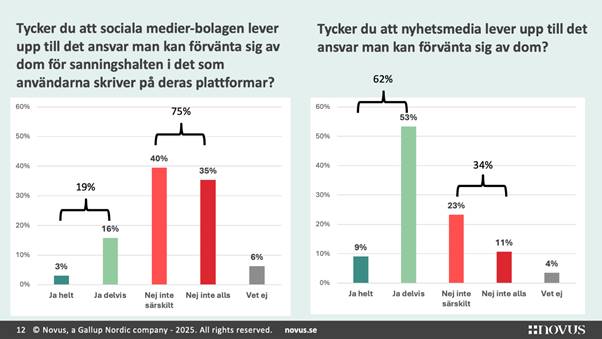
While there is a difference between social media and editorial
media, many believe that social media does not take responsibility. This is
probably where knowledge of algorithms comes in, where the platforms can
reward falsehoods, hatred and threats. However, the low level of trust in
editorial news media's responsibility should be a wake-up call. Only 9%
believe that news media fully take the responsibility that can be expected.
One in three Swedes believes that the media does not take very much or no responsibility
at all in relation to what should be expected. Given that it is believed that the responsibility that editorial
media has for what is published is much greater than what is expected of
social media, it is a reminder for editorial media to reflect on what they
themselves do, not just criticize social media's shortcomings.
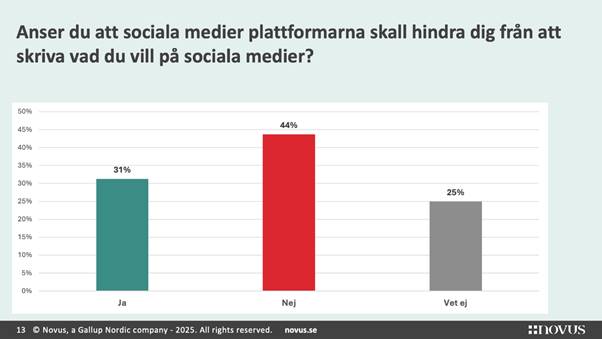
One in three Swedes believes that social media should prevent
users from writing whatever they want. This is a bit of a philosophical
question, we may all have written something we regret, but here it is more
about people not wanting to see hate and threats on social media. The Swedish
people do not appreciate that kind of tone in the public space. In connection with the Koran burning, our surveys showed that a
large proportion of Swedes wanted to ban demonstrations that could be
perceived as provocative or offensive to someone. Which is, after all, the
very essence of demonstrations and freedom of expression. At the same time,
there is great resignation and frustration over how much space unacceptable
behavior is given in the public sphere, and that the state often protects the
one who provokes, rather than the one who is provoked. This also has consequences
for Sweden's national interests, as in the case of the Koran burning, which
threatened to destroy Sweden's chances of becoming a member of NATO. Behind this, a misinterpretation of freedom of expression is
also beginning to emerge that the Swede does not stand behind. A perception
that you have the right to say anything without having to bear the
consequences. Provoking an entire religion and then demanding protection from
the police by invoking freedom of expression is an example of this. To put this in a more everyday context, imagine someone walking
up to the biggest man in the pub and saying something incredibly offensive,
then hiding behind the guards when he justifiably gets angry. It is not
illegal to say what you want in Sweden, but you have to be prepared for the
consequences, even though no one has the right to break the law in response
to what someone says. It is extremely un-Swedish to openly provoke someone
and then demand protection against your own actions. This is an important
aspect to consider when looking at these figures that emerge from the
surveys.
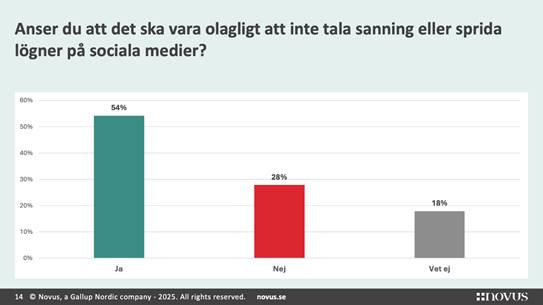
We asked the following question to further demonstrate what the
previous question indicated. We do not want hatred, threats and lies to take
up such space in the public sphere. Most Swedes would never even think of
expressing themselves in the way that leading figures in power and public
figures suddenly do, and we see the damage it causes. Since this is now
happening and leading to negative consequences, there is a growing feeling
that it may have to be banned. The reason is that constitutional laws, including
freedom of expression, are perceived to be abused for personal gain. We do
not want rights-grabbing or anti-democratic behavior to be allowed to occur
under the protection of our democratic principles. At the same time, the solution is not prohibition. Rather, this
is an expression of resignation, where every second Swede feels that
legislation seems to be the only solution. Previously, this type of norm has
been maintained by the collective conscience, where news media acted as a
yardstick and questioned the behavior of public figures. But today, behaviors
that were previously held accountable are rewarded by giving those who act in
this way even more space in the media. It is this development that underlies why every second Swede now
thinks that the laws need to be tightened. Because the public conscience that
was previously maintained primarily by the news media has disappeared.
The majority of the survey was conducted in Sweden from February
6–11, 2025, while the first two global questions were asked in 40 countries
during September 2024. Novus CEO Torbjörn Sjöström has analyzed the results. (Novus) 19 February, 2025 Source: https://novus.se/egnaundersokningar-arkiv/trump-meta-och-makten/ 885-890-43-18/Polls
After the Örebro incident
The Swedish people believe that if someone could have identified
a warning that prevented the school shooting in Örebro, almost every second
Swede (44%) would say social services. 17% believe that the healthcare system
should have seen something and 13% say the police. Almost every third Swede
(27%) believes that no one could have seen any warnings. 21% do not know, and
3% believe that the hunting corps should have seen warning signs. 15% of Swedes feel more unsafe after the Örebro attack. 78% do
not feel more unsafe. This is a relatively expected level, since this attack
was different from the shootings and explosions that have occurred. However,
this does not mean that the population feels safe, something we have
noted recently. In January, one in five Swedes stated that they wanted access
to a firearm to defend themselves, and 35% stated that they felt more unsafe.
Only 19% believed that the police would arrive in time to help if someone
themselves were the victim of a crime in their home. It is clear that the Swedish people see a mentally ill person
who has committed a terrible act. 41% of Swedes believe that resources for
psychiatric care are what is needed to increase security in Sweden. Schools
come in second place, with 24% stating that it is important to invest
resources, and third, 21% stating that the Police are the most important to
invest more in. The fact that it comes in third place in this survey should
also be seen from the perspective that politicians have invested resources in
the Police for a long time, but psychiatric care and schools have been
overlooked. A reminder that the Swedish people do not see issues as
one-dimensional. They now wish to prioritize healthcare and education over
law and order, which may seem somewhat surprising if results such as these
are excluded from the analysis. The police are crucial during an ongoing
violent crime and in preventing crime and protecting the citizen, but are
limited in preventing the mechanisms that drive people to commit crime, just
as laws do not prevent someone who has decided to commit a crime. It is also interesting that politicians were quick to
immediately agree on banning a hunting weapon, the tool that was used
completely in conflict with existing laws. Just because you have a weapon for
hunting does not mean you have the right to use it for anything else. This survey clearly shows that the Swedish people wonder where
society was, where the agencies that are expected to catch people who are so
clearly mentally ill that they do not hesitate to kill others have been. When
that part fails, it is up to the police to stop ongoing or suspected planning
of violent acts. The Swedish people are not fixated on the tool that was used,
which politics and the media revolved around. But more: Where did society go
that would pick up on this? It is not only about batons and weapons, but at
least as much about a functioning welfare society, which actually minimizes
the risk of acts and violent crimes occurring, regardless of which tool a
perpetrator chooses to use. Otherwise, society has already failed on several
levels. Another aspect that is also identified in the survey is that the
Swedish people do not consider the hunting corps to be responsible. It is
clear that few Swedes blame these organizations and the approximately 600,000
hunters in Sweden. Torbjörn Sjöström See below for more information about the survey.
24 February, 2025 Source:
https://novus.se/egnaundersokningar-arkiv/efter-orebro-dadet/ NORTH AMERICA
885-890-43-19/Polls
The Complex Landscape of Public Opinion on Deportation
Gallup's July
update on American attitudes toward the deportation of immigrants who
are in the U.S. illegally provides a great example of the complexity of
public opinion on the issues of the day. Our polling found that 70% of
Americans favored providing such immigrants the chance to become U.S.
citizens if they meet certain requirements. At the same time, a substantial
proportion of the population (47%) also favored deporting this group of
immigrants.A number of polls conducted since
then confirm a basic conclusion: Public opinion on a complex issue like
deportation defies simple summarization. I’ve been looking at six recent
polls asking a general question about deportation, all using
probability-based sampling. The polls framed the issue in slightly different
ways: “mass deportation of undocumented immigrants,” “deporting all
immigrants who are here illegally,” “deporting immigrants who are in the
country illegally,” “deporting all immigrants living in the United States
illegally,” and so on.
All of these surveys were conducted in January 2025 and measured
opinions among either national adults or national registered voters.
Obviously, policymakers (and interested citizens) contemplating these results
could be excused for wondering just what they tell us about public opinion on
this important and timely topic. An analyst could isolate two of the polls
and conclude that Americans’ support for deportation is divided, while
another analyst could isolate two different polls and conclude there is
strong support for deportation. The range of responses is large enough that
it clearly suggests the public has not come to a unified judgment on the
issue. Explanations for Variations in
Responses When Asking About the Same Issue Surveys are designed to provide an estimate of the attitudes of
the underlying sampled population (in this case, either all national adults
or all registered voters). In general, we would expect routine survey samples
conducted at roughly the same time to provide similar estimates of attitudes
about a specific topic. That is not what we observe in the case of
deportation.
Overall, the ease with which Americans’ opinions can shift
across surveys underscores the complexity of the issue and cautions us to put
any single question result into context. Questions That Provide More
Detail About Deportation As I noted above, polls whose questions include details about
the circumstances of deportation produce significant differences in support.
Clearly, when Americans think about deportation, they can
variously take into account the range of characteristics of such immigrants,
variations in their circumstances, and the varying ways in which they could
be sent home. The public thus holds a set of differing views about
deportation based on circumstances. (This is similar to Americans’ views on another hot-button
issue, abortion, which are highly complex and
variable, depending on how the specific circumstances involved are described
to them.) Support for Allowing Those in the
U.S. Illegally to Remain by Meeting Certain Requirements Gallup and other organizations have consistently over the years
found support for allowing this group of immigrants to remain in the country
if they meet certain requirements. This support is evident whether the
question is asked independently, as Gallup did last summer, or in a
forced-choice scenario, where Americans consistently favor a pathway to legal
status over immediate deportation. My analysis of Gallup data last year showed that a not-insignificant proportion of Americans
can hold both of these attitudes simultaneously -- support for deporting
such immigrants and support for allowing them
to have a way to remain in this country. While Americans want some of these
immigrants deported, they just as clearly favor allowing others to remain by
following a well-defined process to gain new legal status. Summarizing Public Opinion on
Deportation As we have seen in this review, Americans have quite variable
reactions when asked a general question about deporting immigrants who are in
the U.S. illegally. Some surveys show that the public supports the general
idea that such people should be sent back, while others show more divided
opinions. Americans appear to favor a selective or “surgical” approach to
deportation, with clear support for sending back immigrants with criminal
records, and much lower support for deporting those with families who would
be left behind. These attitudes are coupled with clear majority support for
developing a practical pathway for certain immigrants to remain if they meet
specific requirements. The wide range in American attitudes toward deportation reflects
an apparent recognition that the situations of the estimated 11 million
immigrants who are in the U.S. illegally vary widely and that not all can be
or should be treated in the same way. Additionally, Americans may recognize the practical issues
involved in attempting to identify, detain and deport all of these estimated
11 million immigrants. Americans may also be taking into account the economic
consequences of reducing available workers in industries where such
immigrants provide a crucial part of the labor force. (Previous research
shows that the majority of Americans want stronger efforts to stop immigrants from coming into this country illegally to begin with,
including hiring more border patrol agents and building a wall along the
border.) In any case, public opinion on deportation is as complicated as
the underlying challenges of deportation itself. The public is in essence
saying, “Tell me more about the specifics” when asked a general question
about deportation. And it is clear that such specifics can shift Americans’
views dramatically in the direction of stronger support and, in other
instances, in the direction of stronger opposition. Public opinion on this issue is particularly important at this
time in our nation’s history as the Trump administration ratchets up its
efforts to deport immigrants. If the administration, Congress and other
policymakers take public opinion into account (as they should), they will
have to develop a series of policies that come at the issue in different ways
and from multiple angles. 14 February, 2025 885-890-43-20/Polls
Obama Best Liked Among Living Presidents; Biden, Least
The results are from a
Jan. 21-27 Gallup survey taken shortly after Trump’s Jan. 20 inauguration to
a second term as president. The four other living presidents attended the
inaugural ceremony. All five also attended the Jan. 9 funeral of former
president Jimmy
Carter. Trump’s and Biden’s ratings are essentially unchanged from those
from a survey after the 2024 election, indicating neither has gotten an image
boost from the news surrounding the presidential transition. Although Trump’s
ratings are about equally split between positive and negative ratings, they
are among his best since Gallup first measured opinions of him in 1999. He
has had only one net-positive rating to date -- 50% favorable and 38%
unfavorable -- in 2005, when he was featured in the reality television show
“The Apprentice” and before he entered Republican politics. Opinions of Trump
were generally poor during his 2015-2016 presidential campaign, with an
average of 33% of U.S. adults viewing him positively. After he won the 2016
presidential election, his image improved, with 42% having a positive opinion
of him, and this climbed further to 46% shortly after his first inauguration.
Opinions of Biden -- now 39% favorable and 57% unfavorable --
are barely better than his worst evaluation since he became a well-known
political figure. In June 2024, the favorable/unfavorable split for Biden was
37%/61%, given concerns about his issue positions and his age as polls showed him trailing Trump in a rematch of the
2020 election. Concerns about his age only intensified in the days after a
poor performance in the first presidential debate with Trump on June 27. The
high point in Biden’s favorability was 61% in January 2017, near the end of
his vice presidency. He nearly matched that in January 2021 with a 59%
favorable rating immediately after being inaugurated as president.
Obama’s image has generally been stable since late 2016, near
the end of his presidency. A survey conducted in the days after the 2016
election found that 62% of U.S. adults had a favorable opinion of Obama,
within the 58% to 63% range recorded since that time.
Bush Favorability Down Slightly
as Fewer Hold Opinions of Him Gallup last measured opinions of George W. Bush in 2017. At that
time, 59% viewed him favorably, 37% unfavorably, and 5% did not have an
opinion. Since then, his favorable score has dipped to 52% because more
Americans (14%) are not familiar enough with him to offer an opinion. His
unfavorable score of 34% is also down slightly. The 2017 favorability rating has been the highest for Bush after
his presidency. His highest favorable rating while president was 87% in
November 2001 after the 9/11 terrorist attacks, a rating exceeded only by 88%
scores for Tiger
Woods in 2000 and Colin Powell in 2002.
Clinton Image Improves as
Negative Ratings Fall
Americans have evaluated Clinton more positively than negatively
for much of the time since the 1992 Democratic National Convention, where he
was first nominated for president. There have been exceptions, including a
39%/59% favorable/unfavorable division shortly after he left office in a
cloud of controversy
over pardons and keeping gifts intended for the White House. Later that
year, opinions
of Clinton were back to an even split, and by 2003, they had returned to being positive on balance.
In August 2012, before that year’s Democratic National Convention, 69%
of Americans rated Clinton positively, his personal best. Bush Ratings Least Divided by
Party All five presidents are rated significantly better by supporters
of their own party (Republicans for Trump and Bush; Democrats for Biden,
Obama and Clinton) than by those of the opposition party. The 86-percentage-point party gap in favorable ratings for Trump
is the largest, with 93% of Republicans versus 7% of Democrats having a
positive opinion of him. Ratings of Biden and Obama differ by at least 70
points between Democrats and Republicans, while for Clinton, the gap is 54
points. Bush’s ratings are the most similar by party, with 15 points
separating favorable ratings from Republicans (63%) and Democrats (48%).
Those scores represent the lowest rating from a president’s own party and the
highest from the opposition.
Bottom Line Presidential image trends tend to follow a similar pattern --
generally positive ratings around the time of their inauguration, subdued
ratings while in office, usually poor ratings when their presidency ends, and
improved favorability after having been out of office for some time. Obama’s
trend has been an exception, with him having positive ratings near the end of
his presidency that have held during his postpresidency years. If the typical
historical pattern holds, Trump’s favorability rating could be expected to
drop over the next four years, while Biden’s may improve. 11 February, 2025 Source:
https://news.gallup.com/poll/656330/obama-best-liked-among-living-presidents-biden-least.aspx 885-890-43-21/Polls
LGBTQ+ Identification in U.S. Rises to 9.3%
LGBTQ+ identification rates among young people have also
increased, from an average 18.8% of Gen Z adults in 2020 through 2022 to an
average of 22.7% over the past two years. Gallup has observed smaller growth in the percentage of LGBTQ+
identifiers in some older generations over the same time period. This
includes a nearly two-point increase among millennials (from 10.3% to 12.0%)
and a one-point increase among Generation X (from 3.8% to 4.8%). There has
not been meaningful change among baby boomers or the Silent Generation. The latest results are based on interviews with more than 14,000
U.S. adults across all 2024 Gallup telephone surveys. Each respondent is
asked whether they identify as straight or heterosexual, lesbian, gay,
bisexual, transgender or something else. Overall, 85.7% say they are
straight, 5.2% are bisexual, 2.0% are gay, 1.4% are lesbian and 1.3% are
transgender. Just under 1% mention some other LGBTQ+ identity, such as
pansexual, asexual or queer. Five percent of respondents decline to answer
the question.
One reason for higher LGBTQ+ identification among younger
generations of adults is that they are much more likely to consider
themselves bisexual than are older people. In fact, more than half of Gen Z
(59%) and millennial (52%) LGBTQ+ people are bisexual. That drops to 44%
among LGBTQ+ people in Generation X, and is less than 20% among baby boomers
(19%) and Silent Generation (11%) LGBTQ+ adults. Older LGBTQ+ people are most
likely to identify as gay or lesbian. LGBTQ+
Identification Higher Among Women, Liberals, Urban Residents Beyond generation and age, LGBTQ+ identification differs by
gender, political orientation and urbanicity.
20 February, 2025 Source:
https://news.gallup.com/poll/656708/lgbtq-identification-rises.aspx 885-890-43-22/Polls
A look at Black-owned businesses in the U.S.
More than one-in-five Black adults in the United States say
owning a business is essential to their personal definition of financial
success, according to a 2023 Pew Research Center survey. While Black-owned businesses
have grown significantly in the U.S. in recent years, they still make up a
small share of overall firms and revenue, according to our analysis of
federal data. How we did this
In 2022, there were 194,585 U.S. firms with majority Black or
African American ownership. That’s up from 124,004 in 2017, according to the latest
estimates from the Annual Business Survey (ABS), conducted by the
U.S. Census Bureau and the National Science Foundation. Black-owned firms’
gross revenue soared by 66% during this time span, from an estimated $127.9
billion in 2017 to $211.8 billion in 2022. Despite this growth, majority Black-owned businesses made up
only about 3% of all U.S. firms in 2022 that were classifiable by the race
and ethnicity of their owners. And they accounted for just 1% of gross
revenue from all classifiable companies that year. By comparison, in
2022, roughly 14% of all Americans were Black. A note on classifiable
companies As has long been the case, White majority-owned
businesses made up the greatest share of classifiable firms (84%) and their
revenue (92%) in 2022. About one-in-ten classifiable firms (12%) had Asian
American majority owners, and no more than 8% had majority owners from another
racial or ethnic group. How
many workers do Black-owned businesses employ? Black or African American majority-owned firms employed
roughly 1.6 million workers in 2022. The firms’ annual payrolls were
estimated at $61.2 billion. About seven-in-ten Black-owned firms (71%) had between one and
nine employees in 2022. Much smaller shares had
10 to 49 (13%) or 50 or more (3%) workers that year. Another 13% had paid
employees at some time during the year but reported having none at the time
the survey was conducted. (The ABS determines employment size by the number
of paid workers during the March 12 pay period.) What’s
the most common sector for Black-owned businesses? By far, health care and social assistance. Nearly 50,000 of
the roughly 195,000 U.S. companies with majority Black or African American
ownership, or 26% of the total, were part of this sector in 2022. Looked at a different way, 8%
of all classifiable U.S. businesses in the health care and
social assistance sector were majority Black-owned that year. Other common sectors included:
Where
are Black-owned businesses located?
Most Black or African American majority-owned businesses (90%)
are located in urban areas. Just 5% are in rural areas – that is, places with
fewer than 5,000 inhabitants, under the Census Bureau’s definition. The remaining 5% could not be
classified by community type. Some of the most populous states also have the greatest number
of Black majority-owned businesses. Florida had 21,064 such businesses in
2022, Georgia had 16,973, Texas had 16,849 and California had 16,826. Black majority-owned businesses made up the greatest share of all classifiable firms
in the District of Columbia (16%), Maryland (10%) and Georgia (10%). Who
are Black business owners?
What
motivates Black entrepreneurs? The ABS also asked Black or African American majority owners
about nearly a dozen potential reasons why they own a business. About nine-in-ten of those who responded said a very or
somewhat important reason was the opportunity for greater income; a desire to
be their own boss; or wanting to balance work and family life. Seeing
business ownership as the best avenue for their ideas, goods and services
(88%) and having flexible hours (87%) were also commonly cited reasons. For most Black or African American majority owners, their
business is their primary source of income. Of those who
reported primary income information in 2022, 71% said this was the case.
(PEW)
12 February, 2025
Source: https://www.pewresearch.org/short-reads/2025/02/12/a-look-at-black-owned-businesses-in-the-us/ 885-890-43-23/Polls
Americans Continue to View Several Economic Issues as Top
National Problems
At the start of President Donald Trump’s second term, Americans
see a host of economic issues – from inflation to the affordability of health
care and the federal budget deficit – as top problems facing the country.
With most adults continuing to say the nation’s economy is in only fair (45%) or
poor (31%) shape, large shares of the public – including majorities of
Republicans and Democrats – see multiple economic considerations as very big
national problems. Today, 63% say inflation is a very big problem for the
country. This is comparable to last May and down from a high of 70% in 2022. At the same time, the share of adults who say the
affordability of health care is a very big national problem has risen 10
percentage points since last year: Today, 67% say this, up from 57% in 2024.
There has also been an uptick in the share of Americans who see the federal
deficit as a very big problem (53% then, 57% today), driven mostly by rising
deficit concern among Democrats. One exception is unemployment. As has been the case for the
last three years, only about a quarter say it is a very big problem for the
country. How
Americans rank national problems
The affordability of health care (67%), inflation (63%), the
federal budget deficit (57%) and the number of Americans living in poverty
(53%) are also among the public’s top concerns. About half or more see the ability of Republicans and
Democrats to work together (56%), drug addiction (51%) and the state of moral
values (50%) as very big problems in the country today. Far smaller shares of the public see terrorism, racism or
climate change as very big problems for the nation – though Republicans and
Democrats disagree about the severity of some of these problems. Note: Refer to the topline for a full list of the
24 items asked about. The lowest four items are not shown here. Republicans
less worried about partisan cooperation, political system
The
ability of Republicans and Democrats to work together
The
way the U.S. political system operates
Democrats
increasingly concerned about agreement on basic facts, state of moral values
Republicans and Democrats are moving in different directions
when it comes to whether Americans’ level of agreement on the basic facts and
the state of moral values in the country today are big problems for the
nation. Americans’ level of agreement on basic facts
The
state of moral values
Partisans’
views of the nation’s problems
Republicans and Democrats generally agree on the severity of
several issues facing the country – including the role of money in politics
and the affordability of health care. But Republicans and Democrats see other issue areas
differently: Among
Republicans
Among
Democrats
There are particularly wide partisan gaps on the extent to
which climate change and illegal immigration are seen as problems. There are also at least 20-point gaps on each of the following
issues:
Republicans and Democrats are more closely aligned in their
views on the severity of the following issues:
Large
gaps between Democrats, Republicans on immigration, gun violence, climate,
racism
Illegal
immigration For instance, 73% of Republicans say illegal immigration is a
very big problem in the nation, while just 23% of Democrats say the same. The
partisan gap on this question has ranged between 40 and 50 points for most of
the last decade. Gun
violence While 69% of Democrats see gun violence as a very big problem,
just 26% of Republicans say the same. This 43-point gap is typical of the
past decade. Climate
change There is a 54-point gap in the share of Democrats (67%) and
Republicans (13%) who rate climate change as a very big problem facing the
nation, also similar to previous years. Democrats are also more likely than
Republicans to see “the impact of natural disasters” as a very big problem,
though the partisan gap on these views is more modest (54% of Democrats vs.
33% of Republicans). Racism Democrats have also consistently been much more likely than
Republicans to say racism is a very big problem in the country. Today, 55% of
Democrats say this, compared with 15% of Republicans. Smaller
gaps among partisans on schools, drug addiction, infrastructure Though there are wide partisan differences on many key
national problems, Republicans and Democrats are more aligned on some other
issues. Drug
addiction Today, 54% of Republicans say drug addiction is a very big
problem and 46% of Democrats view this as a major problem.
Quality
of public K-12 schools Identical shares of Republicans and Democrats now say the
quality of public K-12 schools is a very big problem (45% each). Republicans’ views are relatively unchanged since last year.
Democrats’ concern for the quality of public K-12 schools is up 6 points from
last year, closing what had been a small partisan gap in recent years. Condition
of roads, bridges and other infrastructure
Partisans’
views of economic issues Inflation Inflation remains among the top concerns for Americans, with
63% describing it as a very big problem. The share saying this is roughly on
par with 2024, and down from 70% in 2022. Republicans remain more likely than Democrats to name
inflation as a very big problem (73% vs. 53%) – though the gap is narrower
than it was a year ago. Federal
budget deficit Throughout President Joe Biden’s administration, Republicans
were consistently about twice as likely as Democrats to describe the federal
budget deficit as a very big problem. Today, this gap has narrowed. The share of Democrats saying
the deficit is a very big problem is 12 points higher today (47%) than last
May (35%). In contrast, the share of Republicans saying the deficit is a very
big problem has dropped 5 points over this period (from 71% to 66%). Affordability
of health care Majorities of both Democrats
(73%) and Republicans (61%) see the affordability of health care as a very
big problem. Unemployment
Few in either partisan
coalition see unemployment as a very big problem today: only 27% of Democrats
and 21% of Republicans say it is.
(PEW)
20 February, 2025
Source: https://www.pewresearch.org/politics/2025/02/20/americans-continue-to-view-several-economic-issues-as-top-national-problems/ 885-890-43-24/Polls
Beyond the Buzz: How Canadians are Embracing a Sober Tomorrow
To understand the motivations
behind this shift, the Ipsos Behavioral Science team developed the Ipsos ALC
Framework to help brands address drivers of reduced alcohol consumption. This
framework is based on Self-Determination Theory, which posits that intrinsic
motivation arises when a behavior is perceived as worthwhile, controllable,
and socially connected. Consequently, the ALC framework
consists of three pillars focusing on intrinsic motivation to reduce alcohol
consumption: 4.
Attitudes: Focuses on individuals'
health knowledge and attitudes toward alcohol and alcohol substitutes 5.
Locus of Control: Focuses on a person's perceived control over their
drinking habits and decisions 6.
Connectedness: Focuses on the robust relationship between social
relationships and drinking behaviors Attitudes Previously, moderate alcohol
consumption was believed to be beneficial (e.g., “red wine is good for the
heart”). However, today, there are increasing questions about the impact of
alcohol on health. Nearly two in every five legal drinking age individuals in
ACT express concern about alcohol's health effects, and half report reducing
their intake in 2024. The emphasis on health and wellness in the media has
underscored the negative impact of alcohol — even in moderation.
Non-alcoholic beverages are gaining popularity, with 34% of ACT respondents
also consuming non-alcoholic options. Brands should capitalize on this trend
by promoting low-to-no alcohol beverages that align with consumer health
goals. Considerations for your
business: ·
Do you know if your consumer
base is taking active steps to stay healthy? ·
Are you aware of specific
occasions where health is prioritized over alcohol consumption? Are you
poised to win there? ·
Have you considered the impact
of GLP-1 usage on your business? Locus of Control The rise of alcohol substitutes
has provided consumers with more choices, allowing them to redefine their
drinking habits. The Sober Curious movement marks a departure from older
norms: In 2024, 40% ACT drinkers claimed to set intentional limits on their
alcohol intake; 15% of 18- to 34-year-olds take extended breaks from alcohol
beverages, nearly double from that done by Canadians over 55. When drinking
at bars or parties was the norm, abstaining was often seen as breaking the
norm. However, the Sober Curious movement and the availability of low-to-no
alcohol options at social events have created a new norm where consumers feel
empowered to decide whether to drink. Considerations for your
business: ·
Do you understand your current
consumers' beverage repertoire and alternative options? ·
Does your portfolio cater to
the Sober Curious? ·
Have you developed a strategy
to communicate, engage and win with the Sober Curious effectively? Connectedness Consumers tend to invest in
relationships with like-minded people, often mirroring their behaviors. The
motivation to reduce alcohol consumption is linked to social interactions and
where these interactions occur. Peer groups typically influence drinking
habits; when a group reduces alcohol intake, individuals often follow suit to
fit in or gain acceptance. This shift may lead to shared interests in
low-to-no alcohol beverages. While alcohol is often viewed as a social
lubricant, data suggests younger generations are less likely to frequent bars
and clubs compared to older generations. This change may reduce the perceived
need for alcohol as an aid to socialization, motivating individuals to choose low-to-no-alcohol options. Nearly 1 in every 5 of 18 to
34 years old drinker in ACT switch between alcohol and non-alcoholic
alternatives. As social dynamics evolve, mindful and moderate drinking
practices are likely to become more prevalent. Considerations for your
business: ·
Are you clear on the emotional and functional benefits
consumers seek from your brand? ·
What information sources do your consumers use to explore new
offerings? ·
Are you aware of how the on and off premise social occasions
of consumption are evolving? (Ipsos Canada) 14 February, 2025 Source:
https://www.ipsos.com/en-ca/beyond-buzz-how-canadians-are-embracing-sober-tomorrow 885-890-43-25/Polls
Comprehensive Analysis of
Television Consumption in Colombia
In January, the Colombian television landscape was marked by the
predominance of national channels in most time slots, while international
television maintains a relevant presence. Using data from CNC Ratings
collected in 700 municipalities, with a representative sample of more than
200,000 households, an exhaustive study was conducted on the tuning of
television consumption. The study revealed distinctive consumption patterns
in different time slots, as well as a clear preference for certain channels. In Colombia, the offer of international channels is wide, having
almost 94% of the total offer. Even so, national channels reach 61.43% of the
total share; indicating that, despite international competition, local
television maintains a solid audience share and significant relevance in the
country's television market. This also represents an increase compared to
December of last year, when they only reached 57.48% of the total share. National
Channels Consumption In the context of national television (Private + Public without
international channels), the data show that 96.38% of the total rating is
concentrated by private channels, where of this percentage, Canal Caracol
takes 65.88%, Canal el RCN 28.93% and Canal 1 1.57%. This share shows the
solid position of private channels in the preference of the Colombian public. On the
other hand, the remaining 3.62% of the national share corresponds to public
channels, where of this percentage, Canal Teleantioquia takes 27.52%,
Telepacifico 16.70%, Señal Colombia 15.07% and Telecaribe 12.97%. Although to
a lesser extent, these public channels still have a space in the national
television market. International
Channel Consumption Within the total audience of the day, international channels
achieve 36.16% of the share. Of this percentage, in cable channels (96.96% of
the share), Cliente Claro takes 12.91%, CITYTV 6.37%, ESPN 4.87%, TNT 2.73%
and Space 2.60%, as the most popular in January. Premium
channels capture 3.04% of the rating among international channels, with Win
Sports Premium dominating the segment with 47.73% and followed by HBO Family,
HBO and HBO 2 in order as the most prominent in this category. These channels
offer select programming that attracts a specific audience willing to pay for
exclusive content.
Analysis
by Time Slots The
analysis by time slots reveals interesting consumption patterns that reflect
the preferences of the Colombian public at different times of the day. ·
In the 'Over' time slot
(12:00am - 5:59am), international television accounts for 56.54% of the
rating, while national channels reach 43.46%. ·
During the day ('Day', from
6:00am to 11:59am), there is an increase in national television to 61.82%,
while international channels maintain a 35.08% share. ·
In the 'Early' time slot
(from 12:00pm to 6:59pm), national television remains above with a 60.68%
share. International programming has a 39.18%. ·
During prime time ('Prime',
from 7:00pm to 10:30pm), national channels (73%) strongly surpass
international television (26.93%). ·
In the 'Late' slot (from
10:30pm to 11:59pm), international television regains a slight lead with
50.64% share, national television remains with 49.2%. The
analysis of television consumption in Colombia reveals a clear preference for
national channels. This is surely due to the broadcast of popular programs
such as Yo me llamo and La casa de los famosos, as well as the broadcast of
matches, in this case the South American Under-20 Cup. Even so, the diverse
panorama reflects the variety of tastes and preferences of the Colombian
audience, as well as the importance of offering varied and attractive
programming to satisfy the demands of the constantly evolving public. (CNC) 7 February, 2025 AUSTRALIA
885-890-43-26/Polls
Ipsos New Zealand Valentine's Day - Love Life Satisfaction 2025
New Zealanders report high
levels of love satisfaction in Ipsos’ 30-country study According to Ipsos’ recent
Global Love Life Satisfaction poll across 30 countries, New Zealanders report
high levels of love satisfaction. The poll brings together how people feel
about love, romance and relationships. 82% of New Zealanders feel
loved. Furthermore, 87% of those in committed relationships express
satisfaction with their partner, a figure comparable to the global average,
but lower than in Thailand and the Netherlands, where satisfaction reaches
92%. New Zealand's romantic/sex life satisfaction (57%) is lower than leading
countries like Colombia (74%) and Mexico (72%) While the majority of New
Zealanders feel content with their love lives, income disparities reveal some
differences. The study indicates that 68% of high-income earners enjoy
satisfaction in their romantic/sex lives, in contrast to 56% of middle-income
and just 40% of low-income earners. This trend continues when it comes to
feeling loved, with 90% of high earners feeling satisfied, compared to 81%
and 63% for middle and low-income earners, respectively. There's little difference in
satisfaction with feeling loved across generations in New Zealand. Over four
in five Baby Boomers feel satisfied with the love in their lives, mirroring
the sentiment among Gen Z, Millennials, and Gen X. Gen Z and Millennials’
report slightly higher satisfaction with their sex lives compared to older
generations. (Ipsos New Zealand) 12 February, 2025 Source:
https://www.ipsos.com/en-nz/ipsos-new-zealand-valentines-day-love-life-satisfaction-2025 885-890-43-27/Polls
The number of smokers in Indonesia has surged since the
pandemic, but fewer are coming from younger age groups
The latest Roy
Morgan Indonesian survey from September 2024 shows that although the
prevalence of cigarette smoking in Indonesia has been steadily increasing,
and especially since the pandemic, these new smokers are not coming from
younger age groups. The Roy Morgan survey shows that
over the last decade the overall number of smokers has risen from 43.2
million (30% of Indonesians aged 18+) in 2010 to 44.6 million in 2020 (31%).
Over the last four years the smoking population has surged by nearly 10
million to almost 54.5 million people today – equivalent to 35% of the
population, an increase of 4% points compared to only four years ago. The current share of smokers in
the Indonesian population is clearly higher than the share of Indonesians who
were smokers in the pre-pandemic years of 2014-2019. Number (and
share) of Indonesians aged 18+ who smoke by year
Source: Roy Morgan Single Source
Indonesia: October 2013 – September 2024. Older age groups
(35+) now comprise a larger majority of Indonesian smokers than ever before Over two-thirds of smokers in
Indonesia (68%) are now aged 35+ - equivalent to 36.8 million people. This is
a stunning increase over the last decade since 2014 when roughly half of
smokers (52%, and equivalent to 22.6 million people) were aged 35+. The largest group of smokers are
in the middle age group of Indonesians aged 35-49 years old. This group contributed to under a
third of smokers, 32% (13.9 million people), a decade ago in 2014, but this
share has steadily increased, reaching 36% (16.2 million people) of all
smokers in 2020, and has now increased to 40% (21.8 million people) - up 8%
points from 2014. The same increase can be seen
among the oldest age group of Indonesians aged 50 years and above. They
accounted for 20% (8.7 million people) of all smokers a decade ago in 2014,
but this had increased to 24% (10.6 million people) of all smokers in 2020 and
has now reached 28% (15 million people) of all smokers – up 8% points since
2014. In contrast, the share of
Indonesian smokers aged under 35 have significantly dropped from a decade
ago. Now only 22% (12.2 million people) of Indonesian smokers are aged 25-34
years old compared to nearly a third, 31% (13.3 million people), a decade ago
– a decline of 9% points since 2014. The same trend is evident with
younger Indonesians aged 18-24 years old who now comprise only 10% (5.5
million people) of Indonesian smokers, down 4% points from 2020 and down 7%
points from 2014 when they comprised 17% (7.4 million people) of all Indonesian
smokers. Overall, now under a third of
Indonesian smokers, 32% (17.7 million people), are aged under 35 compared to
almost half, 48% (20.6 million people), a decade ago. Share of
Indonesians smokers by age: 2014-2024
Source: Roy Morgan Single Source
Indonesia: October 2013 – September 2024. Roy Morgan CEO
Michele Levine says the composition of Indonesia’s 54 million smokers has
changed significantly over the last decade with fewer young people smoking
but far more people aged 35+ taking part in the unhealthy habit: “Smoking is
experiencing a rise in popularity in Indonesia. Over the last decade the
number of Indonesians smoking has increased from 43.2 million in 2014 to 54.4
million today – a significant increase of more than 11 million people (+26.1%
on a decade ago). “However, there
is ‘good news’ hidden within this broader trend. Fewer younger people aged
under 35 are smoking now compared to a decade ago. Now 12.2 million people
aged 25-34 are smokers, down over 1 million (-8.3%) from a decade ago, and
just 5.5 million people aged 18-24 are smokers, down over 1.8 million
(-25.2%). As a share of the overall smoking population people aged under 35
have fallen from almost half (48%) to under a third (32%). “It is good to
see that fewer and fewer young people are smoking cigarettes today. This
could be seen as a positive lifestyle shift given increased awareness of the
health concerns of smoking. “However, it is
interesting, and concerning, to also see that more and more older people are
smoking which suggests that once one takes up the habit of smoking it becomes
an incredibly difficult ‘habit to kick’. “These trends
are set to lead to significant health problems for millions of Indonesians,
and escalating healthcare costs, over the years and decades to come with over
a third of Indonesians now smoking compared to under 15% of people in
Australia who now smoke.” (Roy Morgan) 4 February, 2025 Source:
https://www.roymorgan.com/findings/9776-cigarette-smoking-in-indonesia-press-release 885-890-43-28/Polls
In January Australian unemployment increased to 10.1% due
to a growing workforce with not all new entrants finding jobs
In January 2025, Australian ‘real’ unemployment increased 78,000
to 1,620,000 (up 0.4% to 10.1% of the workforce) with more people looking for
both part-time and full-time work. The Australian workforce increased by 297,000 to a record high
of 16,115,000 in January with both unemployment, up 78,000 to 1,620,000, and
employment, up 219,000 to 14,495,000. The January Roy Morgan Unemployment estimates were obtained by
surveying an Australia-wide cross section of people aged 14+. A person is
classified as unemployed if they are looking for work, no matter when. The
‘real’ unemployment rate is presented as a percentage of the workforce
(employed & unemployed).
Australian employment increased 219,000 to 14,495,000. This
increase was driven by a jump in full-time employment as the new year
started, up 306,000 to a new record high of 9,629,000 while part-time
employment fell for a second straight month, down 87,000 to 4,866,000.
In January 1,620,000 Australians were unemployed (10.1% of the workforce, up 0.4%), an increase of 78,000 from
December. The increase in unemployment was driven by similar rises in people
looking for part-time work, up 36,000 to 837,000, and also people looking for
full-time work, up 42,000 to 783,000.
In addition to the unemployed, a further 1.81 million
Australians (11.3% of the workforce) were under-employed, i.e. working
part-time but looking for more work, up 137,000 from December – a new record
high level of under-employment. In total 3.43 million Australians (21.4% of
the workforce) were either unemployed or under-employed in January – the
highest combined figure since June 2020.
The workforce in January was a record high 16,115,000 (up
297,000 from December, and up a large 1,090,000 from two years ago) –
comprised of a record high 14,495,000 employed Australians (up 219,000 from a
month ago, and up a large 1,077,000 from two years ago). ABS Comparison
Roy Morgan’s unemployment figure of 10.1% is clearly more than
double the ABS estimate of 4.0% for December and is in line with the combined
ABS unemployment and under-employment figure of 10.0%. The latest monthly figures from the ABS
indicate that the people working fewer hours in December
2024 due to illness, injury or sick leave was 530,700. Significantly, this is
over 140,000 higher than the pre-pandemic average of the six years to
December 2019 (383,850) – a difference of 146,850. If this higher than pre-pandemic average of workers (146,850)
who are working fewer hours due to illness, injury or sick leave is added to
the combined ABS unemployment and
under-employment figure of 1,523,000 we find a total of 1,669,850 people
could be considered unemployed or under-employed, equivalent to 11.0% of the
workforce. Roy Morgan Unemployment & Under-employment (2019-2025)
(Roy Morgan) 17 February, 2025 Source:
https://www.roymorgan.com/findings/9816-australian-unemployment-estimates-january-2025 MULTICOUNTRY STUDIES
885-890-43-29/Polls
What Worries the World –
February 2025
Crime & violence is
now the joint number one issue with inflation across 29 countries Key findings: ·
Across 29 countries worry for
crime & violence rose to 32%, equal to inflation concern. This is due to
inflation staying the same and crime rising slightly from last month. ·
All LATAM countries on our list
put crime as their primary issue. Notably, the proportion of Argentinians
expressing worry has risen 10pp to 49%, its highest level since October 2023
(when it was 50%). ·
Worry about crime &
violence is also on the rise in Europe, with France now putting it as their
top issue with 38% concerned ·
After President Trump’s
inauguration, the proportion of Americans saying their “country is heading in
the right direction” is up eight points (41%) to a near four-year high. ·
Germany’s right direction score
is at a ten-year low of 17%, while those saying the economy is “good” hit its
fifth consecutive all-time low (25%). ·
South Korea reached their
all-time high for those expressing worry about the rise of extremism, up nine
points to a quarter (24%). ·
Crime & violence In February, crime emerged as the dominant concern across all
LATAM countries on our list, highlighting a pervasive sense of insecurity
throughout the continent. This shared anxiety reflects the region's growing
struggles with safety and lawlessness. In particular, Argentina has seen a
notable rise in concern, with the proportion of citizens worried about crime
jumping by ten percentage points to 49%, the highest level since October
2023, when it stood at 50%. This increase is part of a broader trend across
Latin America, where crime has become the central issue for many. Similarly, Peru’s has reached a five-year high after the share
citing it increased 6pp to 66%. March 2020 (71%) was the last time levels
were this high. Likewise, parts of Europe are experiencing heightened worry.
It has now become France’s main worry after increasing six points to 38%,
while Germany (36%) and Great Britain (29%) are up seven and Italy (31%) by
five points. Inflation Following President Trump’s announcement of tariffs on Canada,
concern over rising prices among Canadians has surged, with the proportion
expressing worry climbing five percentage points to 49%. However, this uptick
is not unprecedented — February 2024 recorded an even higher peak, marking
the highest level of concern that year, five points above the current figure.
Unemployment Spain’s level of worry this month has dropped to a record low.
The proportion of Spaniards specifying jobs fell 10pp to 28%. Not only is
this 7pp lower than February 2024, it is the lowest level we have recorded
for the country since they were added to the survey back in March 2014. Meanwhile, South Korea’s score is up 5pp to 40% who are
worried about jobs. However, this time last year was only marginally higher. Health care The proportion of Polish citizens identifying health care as a
key national concern has risen by four percentage points to 39%, placing it
just behind inflation (40%) as the country’s most pressing issue. This marks
a six-point increase compared to February 2024, highlighting growing public
anxiety over the state of healthcare. Likewise, Belgium’s score has risen 4pp to 25% expressing
worry. This is 9pp higher than this time last year and is also the highest
score for the country since June 2020 (when it was 26%). It is joint third
highest along with crime & violence for Belgians. Immigration control This issue is acutely felt in Germany. The country has
experienced the biggest change in concern after climbing 9pp since January to
44% expressing worry. This is also 9pp higher than February 2024’s
level. This is the joint highest score, with November 2024 and
October 2023 recording the same. The next highest was in March 2018, when 49%
of Germans said they were worried.
Across 29 countries, 37% of people describe their country’s
current economic situation as “good”. Asia-pacific countries crowd the top of the rankings, led by
Singapore (80% good economy score), followed by India (77%) and Malaysia
(69%). The Netherlands (58%) is the only non-Asian country where a majority
describe the current economic situation as good. Up most from this time last year continues to be Argentina
(+28pp to 34%). In contrast, Brazil’s good economy score has fallen 14 points
since February 2024. Germany also sees another bad month, down slightly to record
its fifth consecutive all-time low good economy score of 25%. (Ipsos Global) 20 February, 2025 Source: https://www.ipsos.com/en/what-worries-world |